
World Bank Documentdocuments.worldbank.org/curated/en/487371517411910801/pdf/119682... ·...
100
Pilot Model 2 implementation manual Public Disclosure Authorized Public Disclosure Authorized Public Disclosure Authorized Public Disclosure Authorized
Transcript of World Bank Documentdocuments.worldbank.org/curated/en/487371517411910801/pdf/119682... ·...
PilotModel 2 implementation manual
Pub
lic D
iscl
osur
e A
utho
rized
Pub
lic D
iscl
osur
e A
utho
rized
Pub
lic D
iscl
osur
e A
utho
rized
Pub
lic D
iscl
osur
e A
utho
rized

©2017 International Bank for Reconstruction and Development / The World Bank 1818 H Street NW, Washington DC 20433 Telephone: 202-473-1000; Internet: www.worldbank.org Some rights reserved
1 2 3 4 15 14 13 12
This work is the product of the staff of the World Bank with external contributions. The findings, interpretations, and conclusions expressed in this work do not necessarily reflect the views of The World Bank, its Board of Executive Directors, or the governments they represent. The World Bank does not guarantee the accuracy of the data included in this work. The boundaries, colors, denominations, and other information shown on any map in this work do not imply any judgement on the part of The World Bank concerning the legal status of any territory or the endorsement or acceptance of such boundaries.
Nothing herein shall constitute or be considered to be a limitation upon or waiver of the privileges and immunities of The World Bank, all of which are specifically reserved.
Rights and PermissionsThis work is available under the Creative Commons Attribution 3.0 IGO license (CC BY 3.0 IGO) https://creativecommons.org/licenses/by/3.0/igo/. Under the Creative Commons Attribution license, you are free to copy, distribute, transmit, and adapt this work, including for commercial purposes, under the following conditions:Translations – If you create a translation of this work, please add the following disclaimer along with the attribution: This translation is an adaptation of an original work by The World Bank and should not be considered an official World Bank translation. The World Bank shall not be liable for any content or error in this translation.Adaptation – If you create an adaptation of this work, please add the following disclaimer along with the attribution: This is an adaptation of an original work by The World Bank. Views and opinions expressed in the adaptation are the sole responsibility of the authors of the adaptation and are not endorsed by The World Bank.
Images used under the Creative Commons License from the Internet Archive Book Images.
3 PILOT MODEL 2. IMPLEMENTATION MANUAL
Table of contents
Spis treści 3
Spis rysunków 5
Spis schematów 7
Spis tabel 8
Wstęp 12
Oczekiwane wyniki 13
Tło 14
Problemy ambulatoryjnej opieki specjalistycznej w kontekście polskim 16
Uzasadnienie 19
Model udzielania świadczeń 29
Zakres Modelu 2 29
Profilaktyka 32
Ścieżki diagnostyczne i terapeutyczne 37
Planowanie i koordynacja opieki 38
Pacjenci/zarejestrowani 38
Świadczeniodawcy 39
Zawieranie umów 41
Finansowanie 44
Główne założenia finansowania Modelu 2 46
Środki budżetowe 48
Raportowanie 68
Budowanie potencjału 70
Zarządzanie i rozwój kompetencji płatnika 71
Narzędzia stratyfikacji 71
Zarządzanie projektem i monitorowanie 74
Monitorowanie i ewaluacja 77

4 PILOT MODEL 2. IMPLEMENTATION MANUAL TABLE OF CONTENTS
Wskaźniki do ewaluacji pilotażu 79
Wymogi sprawozdawcze 90
Technologie informatyczne 92
Bibliografia 98
5 PILOT MODEL 2. IMPLEMENTATION MANUAL
Table of figures
Figure 1: Indicators of OSC providers and consultations in Poland – rural areas 15
Figure 2: Indicators of OSC providers and consultations in Poland – urban areas 15
Figure 3: Number of doctors’ consultation per capita in 2014 OECD Countries 16
Figure 4: Opinion on healthcare system comparing 9 countries and EU 17
Figure 5: Average Waiting time for Outpatient Specialist Care (OSC) consultation (in months) in Poland 17
Figure 6: Number of people waiting and median of average real waiting time (2013–2015) 18
Figure 7: Projected Estimates of the number of specialist doctors and specialist dentists in Poland 18
Figure 8: Share of deaths attributable to non-communicable diseases in Poland 19
Figure 9: Average spending per patient at the OSC level: 26 diseases 2013–2015 (in PLN) 21
Figure 10: Average spending per patient at the OSC level by Region of 26 diseases in 2015 21
Figure 11: Percent of patients, services, and costs relating to the 26 diseases at the PHC, OSC and hospital level as a share of all patients, services and costs at the respective level of care 22
Figure 12: Average spending associated with peripheral artery disease (PAD) per person by age in OSC in 2015 22
Figure 13: Average spending associated with chronic inflammatory bowel diseases and Irritable Bowel Syndrome (IBS) per person by age in OSC in 2015 23
Figure 14: Number of patients and services reported at the PHC – 26 diseases in 2015 24
Figure 15: Number of patients and services at the OSC level associated with the 26 diseases in 2015 25
Figure 16: NFZ spending on patients treated within the selected 26 categories in Poland in 2015 by age (in PLN) 26
6 PILOT MODEL 2. IMPLEMENTATION MANUAL TABLE OF FIGURES
Figure 17: Combined number of patients and services for all three levels of care for the 26 diseases in 2015 27
Figure 18: Number of patients and costs associated with the 26 diseases in OSC and hospitals in 2015 28
Figure 19: Indicators of total cost associated with the 26 diseases, per 10,000 patients and services at the OSC and hospital level – 2015 28
Figure 20: Share of population covered for health check-ups throughout the pilot by age group 36
Figure 21: The total costs of the model 2 budget divided by cost type 47
Figure 22: Expenditures of Model 2 divided to categories over 4 years 47
Figure 23: Total costs of Model 2 as a proportion of NFZ expenditures 48
Figure 24: PHC capitation by the age of patients 49
Figure 25: Nurse and midwife capitation by the age of patients 49
Figure 26: Respective cost shares of nurse and midwife capitation 50
Figure 27: PHC capitation costs per patient by age group 50
Figure 28: Estimated population covered by the health check-ups program in 2020 by age group 52
Figure 29: Prophylaxis and prevention as a share of the NFZ budget 52
Figure 30: OSC capitation per OSC clinics 54
Figure 31: Average cost of OSC capitation per patient in 2020 55
Figure 32: OSC diagnostics budget 56
Figure 33: Average cost of OSC diagnostics per patient in 2020 56
Figure 34: OSC cost as a share of the NFZ budget 57
Figure 35: OSC diagnostics and capitation costs as a share of the NFZ budget 57
Figure 36: Cost of disease management by age 58
Figure 37: Estimated disease management by age as a share of the pilot population in 2020 – assumptions 60
Figure 38: Cost of the DMP scheme by age and type of consultations 61
Figure 39: Disease management costs structure as a share of NFZ budget 62
Figure 40: Share of pilot population receiving rehabilitation services in the Model 2 63
7 PILOT MODEL 2. IMPLEMENTATION MANUAL
Figure 41: Costs of rehabilitation services by patient age 64
Figure 42: Rehabilitation as a share of the NFZ budget 65
Figure 43: Costs of rehabilitation by patient age 65
List of tables
Table 1: Comparison of present healthcare model with Model 2 13
Table 2: Disease and risk factors for age group by gender 35
Table 3: Interventions in the assessment of the patient’s general health 36
Table 4: Selection criteria for the sample providers 39
Table 5: Summary of the Model 2 budget (in PLN) 44
Table 6: Capitation for OSC by specialization 53
Table 7: Prevalence of chronic diseases among the population – epidemiological data 59
Table 8: Patients with chronic diseases covered with the DMP 60
Table 9: Consultations, frequency, and rate 61
Table 10: Reduction indicator of complex consultations 62
Table 11: Preparation of providers for service delivery 76
Table 12: Integrated care evaluation domains 83
Table 13: Model 2 outcome indicators 83
Table 14: Pilot Model 2 output indicators 84
Table 15: Indicators of quality of care 84
Table 16: Indicators of coordination 86
Table 17: HIS modules pertinent to the pilot 90
Table 18: Reporting requirements 91

8 PILOT MODEL 2. IMPLEMENTATION MANUAL
List of diagrams
Diagram 1: M&E framework 79
Diagram 2: Outcome indicators 81
9 PILOT MODEL 2. IMPLEMENTATION MANUAL
List of abbreviations
CHUK – Prevention Program for Cardiovascular Diseases
COPD – Chronic obstructive pulmonary disease
DEKL – XML message for declarations in PHC and OSC
DMP - Disease Management Program
DTP – Diagnostic and Therapeutic Path
EDM – Electronic Medical Records (Elektroniczna Dokumentacja Medyczna)
FFS – Fee-for-Service
GDP – Gross Domestic Product
GP – General Practitioner
GUS – Central Statistical Office (Główny Urząd Statystyczny)
HIS – Health Information System
IC – Integrated Care
IPOM – Individual Medical Care Plan (Indywidualny Plan Opieki Medycznej)
ISO – International Organization for Standardization
IT – Information Technology
M&E – Monitoring and Evaluation
MoH – Ministry of Health
NFZ – National Health Fund (Narodowy Fundusz Zdrowia)
NHS – National Health System
NIK – Supreme Audit Office (Najwyższa Izba Kontroli)
NIPH-NIH – National Institute of Public Health– National Institute of Hygiene
NOCH – Night and Holiday Healthcare
OECD – Organization for Economic Co-operation and Development
OMC – Outpatient Managed Care
OSC – Outpatient Specialists Care
PIU – Project Implementation Unit
PLN – Polish Zloty
POM – Pilot Operational Manual
LIST OF ABBREVIATIONS

10 PILOT MODEL 2. IMPLEMENTATION MANUAL
PHC – Primary Healthcare
SIMP – System of Information Monitoring in Prophylaxis (System Informatyczny Monitorowania Profilaktyki)
SOR – Hospital Emergency Care (Szpitalny Oddział Ratunkowy)
SWIAD – XML message for services at the OSC and hospital level
TOR – Terms of Reference
WHO – World Health Organization
ZBPOZ – XML message for consolidated data on services granted under PHC
ZIP – Integrated Patient Information System (Zintegrowany Informator Pacjenta)
LIST OF ABBREVIATIONS

11 PILOT MODEL 2. IMPLEMENTATION MANUAL
Acknowledgments The integrated care models contained in this report were prepared under a RAS (Reimbursable Advisory Services) agreement, signed in November 2015 between the World Bank and the National Health Fund. The work was led by Anna Koziel and Mukesh Chawla (both World Bank), who were assisted by a broad team of subject matter experts, including Adam Kozierkiewicz, Agnieszka Gaczkowska, Zbigniew Król, Artur Prusaczyk, Andrzej Zapaśnik, Aleksandra Kononiuk and Rocio Schmunis. Adrienne Kate Mcmanus and Gabrielle Lynn Williams, both World Bank, edited the final product and assisted with the writing. Gabriel Francis, Zinaida Korableva and Maya Razat provided key support at different stages of the preparation of this product. The authors would like to extend special thanks to Aparnaa Somanathan, Donald Edward Shriber, Mickey Chopra and Shuo Zhang, all World Bank, for their valuable comments and suggestions, which improved the quality of the final deliverable.
The report was prepared under strategic guidance and direction of Arup Banerji (Country Director), Enis Baris (Practice Manager), Carlos Piñerúa (Country Manager) and Marina Wes (Country Manager) from the World Bank.
The authors would like to take this occasion to record a deep sense of gratitude for Konstanty Radziwiłł (Minister of Health) and Piotr Gryza (Undersecretary of State, Ministry of Health), Andrzej Jacyna (President) and Maciej Miłkowski (Deputy President) of the National Health Fund, for their invaluable advice and support throughout the preparation of these models. This work would not have been possible without their active involvement and strategic oversight.
A large number Ministry of Health and National Health Fund staff gave generously of their time and advice, and we are grateful to all of them. In particular, we would like to recognize Dariusz Dziełak, Krzysztof Górski, Damian Jakubik, Katarzyna Wiktorzak, Sabina Karczmarz, Katarzyna Ilowiecka, Dariusz Jarnutowski, Katarzyna Klonowska, Rafał Kiepuszewski, Rafał Kozłowski, Katarzyna Kulaga, Iwona Poznerowicz, Agata Szymczak, Milena Sześciórka-Rybak, and Andrzej Śliwczyński for always being available.
The models were designed in a process of consultation and discussion with a community of experts as well as medical and patient communities. We would like to thank the following for their active participation, comments and ideas: Ewa Bandurska, Mariusz Bidziński, Michał Brzeziński, Jarosław Buczyński, Czesław Ceberek, Aneta Cebulak, Damian Chaciak, Ewa Dmoch-Gajzlerska, Przemysław Dybciak, Adam Dziki, Dawid Faltynowski, Dariusz Gilewski, Grzegorz Gierelak, Piotr Głuchowski , Jacek Gronwald, Barbara Grudek, Marika Guzek, Bartosz Idziak, Marek Jankowski, Monika Jastrzębska, Małgorzata Kalisz, Piotr Kulesza, Tomasz Kobus, Anna Kordowska, Donata Kurpas, Anna Miecznikowska, Jeremi Mizerski, Jolanta Michałowska, Włodzimierz Olszewski, Tadeusz Orłowski, Iwona Orkiszewska, Ewa Orlewska, Bartłomiej Ostręga, Michał Pękała Bartosz Pędziński, Jarosław Reguła, Jarosław Skłucki, Agnieszka Sowa, Andrzej Strug, Sylwia Szafraniec-Buryło, Joanna Szeląg, Roman Topór-Mądry, Jan Tumasz, Piotr Tyszko, Adam Windak, Andrzej Witek, Wiesław Witek, Mikołaj Wiśniewski, Tomasz Włodarczyk, Joanna Zabielska-Cieciuch, Marzena Zarzeczna-Baran, Tomasz Zieliński, and Paweł Żuk.
Finally, we would like to recognize participants of numerous meetings and conferences during which solutions proposed within the framework of the models were openly discussed. We have learned a lot throughout this process, and have hopefully done justice to all the suggestions that we have received during the preparation of this report.
12 PILOT MODEL 2. IMPLEMENTATION MANUAL
IntroductionOutpatient Managed Care (OMC) is a model of enhanced Primary Health Care (PHC), which includes the existing scope of PHC, a wide variety of services from Outpatient Specialized Care (OSC), extended prevention interventions, and ambulatory rehabilitation (REH), offered by one facility or a group of medical facilities in cooperation with one another.
The purpose of Model 2 is to improve the extent to which population health needs are satisfied in outpatient care through the implementation of comprehensive, scheduled, continuous and integrated care, and ensuring optimum utilization of resources allocated to health services. OMC represents comprehensive, continuous and integrated care for the sick and those to be covered by prophylaxis innervations.
This active approach by providers to the offered care and strong engagement of patients and their families in the care process is crucial.
At the same time, OMC is based on the principle of open access for the patient, which means that the patient reserves the right to choose the facility for service provision (treatment), and the patient is also autonomous in choosing the way the therapeutic process is arranged, based on the assumption that OMC treatment is offered in parallel to the model of outpatient services currently in existence or just after modifications put forward by the Ministry of Health (MoH).
Model 2 is built on rational and planned cooperation between health service providers (medical personnel, medical facilities), mutual freedom in making clinical decisions, and the expedient transfer of data that aimed to increasing the effectiveness of clinical or organizational actions.
Monitoring and evaluation, with underlying measurements, are important pillars of OMC model. Both the payer and other stakeholders (providers included) are expected to monitor quality and cost-efficiency of care, using the indicators developed at the pilot stage. Data, analyses and knowledge accumulated as part of M&E will be disseminated in public domain. Such an approach will not only support intervention transparency, but it will also contribute to effectiveness thanks to widespread dissemination of evaluation findings and lessons learnt.
The financial and organizational responsibility is transferred from the payer to the managing entity for providing access to health services included in OMC package and ensuring supervision of service quality and efficiency.
INTRODUCTION13 PILOT MODEL 2. IMPLEMENTATION MANUAL
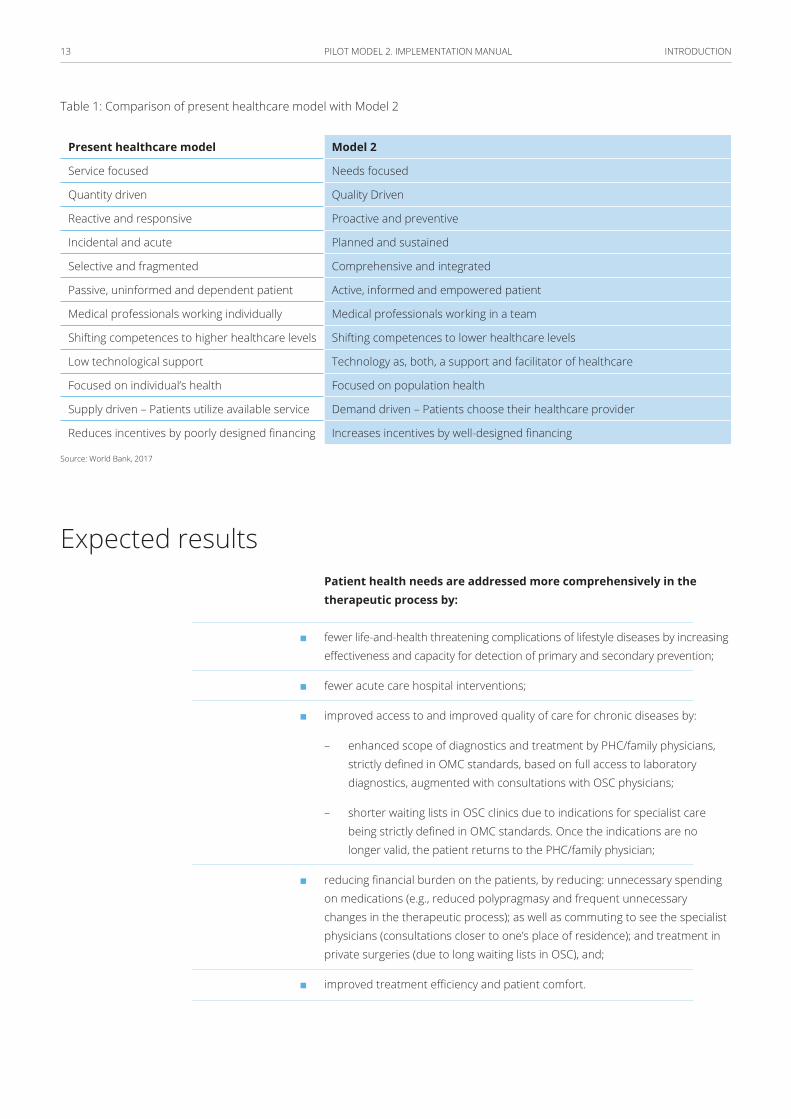
Table 1: Comparison of present healthcare model with Model 2
Present healthcare model Model 2
Service focused Needs focused
Quantity driven Quality Driven
Reactive and responsive Proactive and preventive
Incidental and acute Planned and sustained
Selective and fragmented Comprehensive and integrated
Passive, uninformed and dependent patient Active, informed and empowered patient
Medical professionals working individually Medical professionals working in a team
Shifting competences to higher healthcare levels Shifting competences to lower healthcare levels
Low technological support Technology as, both, a support and facilitator of healthcare
Focused on individual’s health Focused on population health
Supply driven – Patients utilize available service Demand driven – Patients choose their healthcare provider
Reduces incentives by poorly designed financing Increases incentives by well-designed financing
Source: World Bank, 2017
Expected resultsPatient health needs are addressed more comprehensively in the therapeutic process by:
■ fewer life-and-health threatening complications of lifestyle diseases by increasing effectiveness and capacity for detection of primary and secondary prevention;
■ fewer acute care hospital interventions;
■ improved access to and improved quality of care for chronic diseases by:
– enhanced scope of diagnostics and treatment by PHC/family physicians, strictly defined in OMC standards, based on full access to laboratory diagnostics, augmented with consultations with OSC physicians;
– shorter waiting lists in OSC clinics due to indications for specialist care being strictly defined in OMC standards. Once the indications are no longer valid, the patient returns to the PHC/family physician;
■ reducing financial burden on the patients, by reducing: unnecessary spending on medications (e.g., reduced polypragmasy and frequent unnecessary changes in the therapeutic process); as well as commuting to see the specialist physicians (consultations closer to one’s place of residence); and treatment in private surgeries (due to long waiting lists in OSC), and;
■ improved treatment efficiency and patient comfort.

INTRODUCTION14 PILOT MODEL 2. IMPLEMENTATION MANUAL
Over the first year to two years, it is possible to present a detailed evaluation of health outcomes, economic impacts and patient satisfaction. The potential recommendation would be to have that system of care implemented throughout the country. Preliminary analyses and conclusions can be drawn after the first year of Model 2 operational mode implementation.
BackgroundIn 2015, 20,412 outpatient specialists care clinics and 1,087 individual specialist practices were recorded in Poland. For every 10,000 patients, there was an average of 6.8 OSC clinics or practices. An average Pole attended 8.3 OSC consultations in 2015, the number of OSC consultations per person has been steadily increasing in the last years, recorded at 7.7 consultation per person in 2011. (1) Moreover, there was a significant disparity between rural and urban areas in the number of practices and consultations per person, with consultations per person almost 4 times higher in urban areas.
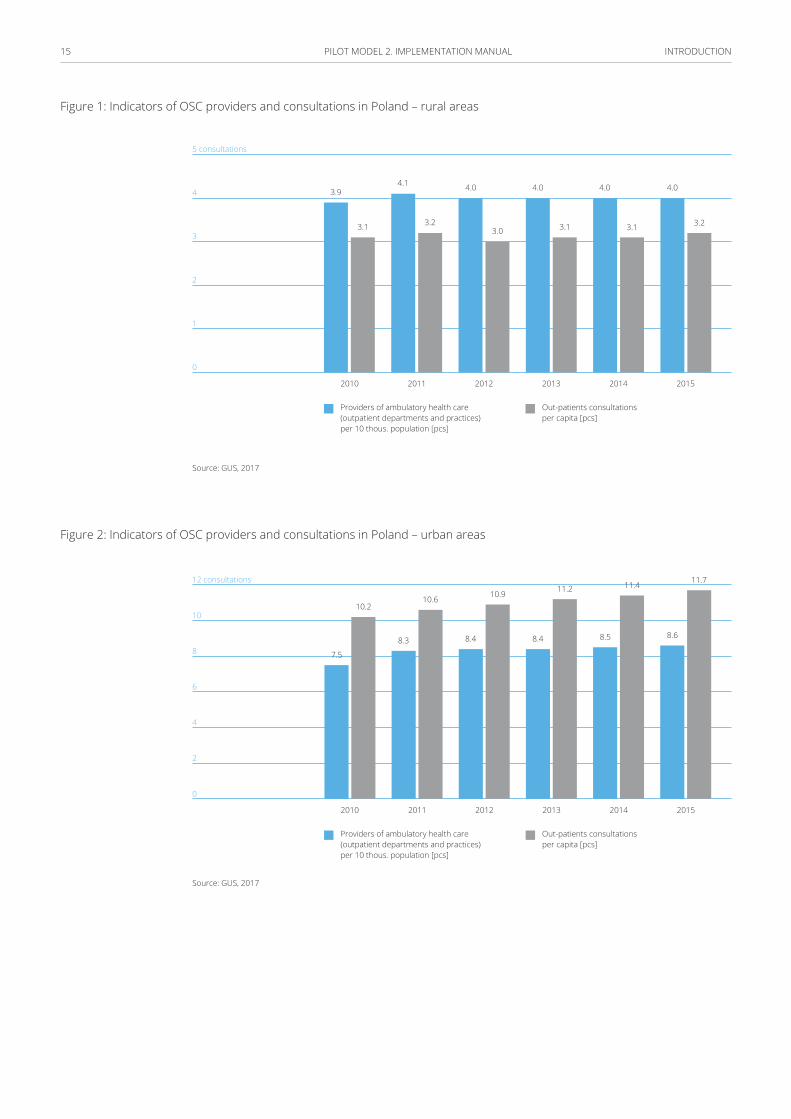
INTRODUCTION15 PILOT MODEL 2. IMPLEMENTATION MANUAL
Figure 1: Indicators of OSC providers and consultations in Poland – rural areas
5 consultations
4
3
2
1
0
2010
3.9
3.1 3.23.0 3.1 3.1 3.2
4.1 4.0 4.0 4.0 4.0
2012 20142011 2013 2015
Providers of ambulatory health care (outpatient departments and practices) per 10 thous. population [pcs]
Out-patients consultations per capita [pcs]
Source: GUS, 2017
Figure 2: Indicators of OSC providers and consultations in Poland – urban areas
12 consultations
10
8
6
4
2
0
7.5
10.2
8.3
10.6
8.4
10.9
8.4
11.2
8.5
11.4
8.6
11.7
2010 2011 2012 2013 2014 2015
Providers of ambulatory health care (outpatient departments and practices) per 10 thous. population [pcs]
Out-patients consultations per capita [pcs]
Source: GUS, 2017
INTRODUCTION16 PILOT MODEL 2. IMPLEMENTATION MANUAL
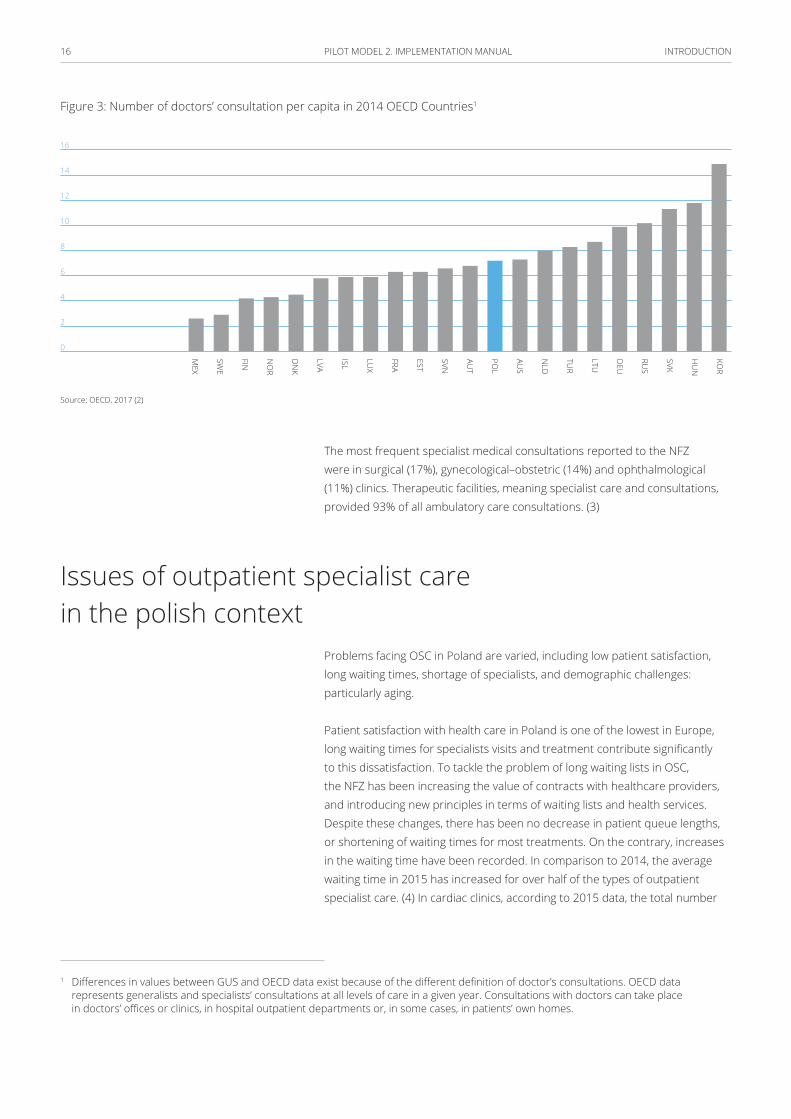
Figure 3: Number of doctors’ consultation per capita in 2014 OECD Countries1
16
14
12
10
8
6
4
2
0
KOR
HU
N
SVK
RUS
DEU
LTU
TUR
NLD
AUS
POL
AUT
SVN
EST
FRA
LUX
ISL
LVA
DN
K
NO
R
FIN
SWE
MEX
Source: OECD, 2017 (2)
The most frequent specialist medical consultations reported to the NFZ were in surgical (17%), gynecological–obstetric (14%) and ophthalmological (11%) clinics. Therapeutic facilities, meaning specialist care and consultations, provided 93% of all ambulatory care consultations. (3)
Issues of outpatient specialist care in the polish context
Problems facing OSC in Poland are varied, including low patient satisfaction, long waiting times, shortage of specialists, and demographic challenges: particularly aging.
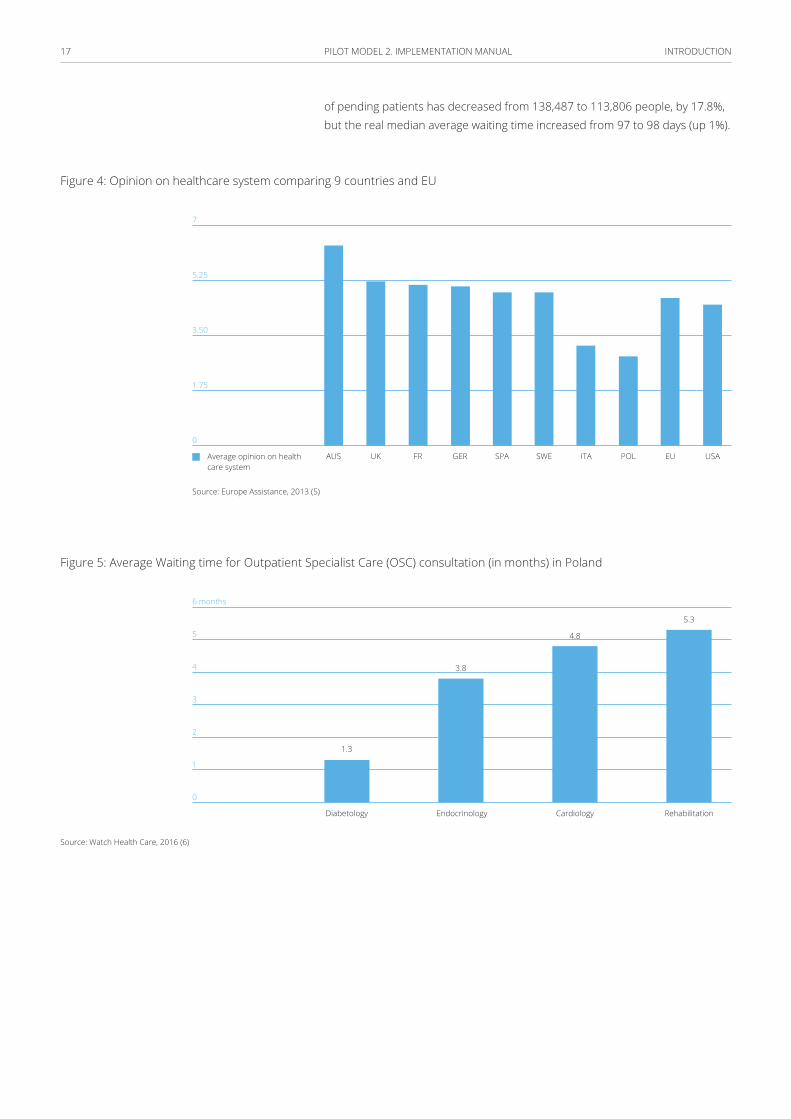
Patient satisfaction with health care in Poland is one of the lowest in Europe, long waiting times for specialists visits and treatment contribute significantly to this dissatisfaction. To tackle the problem of long waiting lists in OSC, the NFZ has been increasing the value of contracts with healthcare providers, and introducing new principles in terms of waiting lists and health services. Despite these changes, there has been no decrease in patient queue lengths, or shortening of waiting times for most treatments. On the contrary, increases in the waiting time have been recorded. In comparison to 2014, the average waiting time in 2015 has increased for over half of the types of outpatient specialist care. (4) In cardiac clinics, according to 2015 data, the total number
1 Differences in values between GUS and OECD data exist because of the different definition of doctor’s consultations. OECD data represents generalists and specialists’ consultations at all levels of care in a given year. Consultations with doctors can take place in doctors’ offices or clinics, in hospital outpatient departments or, in some cases, in patients’ own homes.
INTRODUCTION17 PILOT MODEL 2. IMPLEMENTATION MANUAL
of pending patients has decreased from 138,487 to 113,806 people, by 17.8%, but the real median average waiting time increased from 97 to 98 days (up 1%).
Figure 4: Opinion on healthcare system comparing 9 countries and EU
7
5.25
3.50
1.75
0
USASWE POLGERUK EUSPA ITAFRAUSAverage opinion on health care system
Source: Europe Assistance, 2013 (5)
Figure 5: Average Waiting time for Outpatient Specialist Care (OSC) consultation (in months) in Poland
6 months
5
4
3
2
1
0
Diabetology
1.3
3.8
4.8
5.3
Endocrinology Cardiology Rehabilitation
Source: Watch Health Care, 2016 (6)
INTRODUCTION18 PILOT MODEL 2. IMPLEMENTATION MANUAL
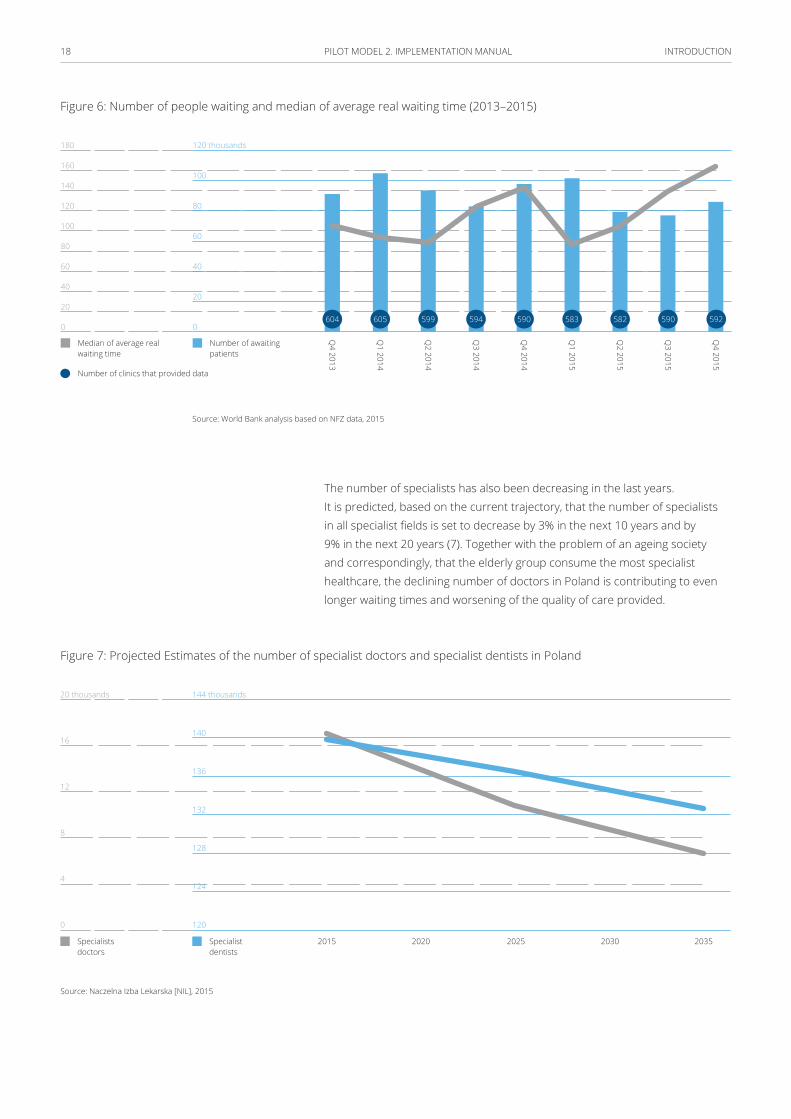
Figure 6: Number of people waiting and median of average real waiting time (2013–2015)
120 thousands
100
80
60
40
20
0
180
160
140
120
100
80
60
40
20
0
Q4 2015
Q3 2015
Q2 2015
Q1 2015
Q4 2014
Q3 2014
Q2 2014
Q1 2014
Q4 2013
Median of average real waiting time
Number of awaiting patients
Number of clinics that provided data
599 590 582605 594 583 590 592604
Source: World Bank analysis based on NFZ data, 2015
The number of specialists has also been decreasing in the last years. It is predicted, based on the current trajectory, that the number of specialists in all specialist fields is set to decrease by 3% in the next 10 years and by 9% in the next 20 years (7). Together with the problem of an ageing society and correspondingly, that the elderly group consume the most specialist healthcare, the declining number of doctors in Poland is contributing to even longer waiting times and worsening of the quality of care provided.
Figure 7: Projected Estimates of the number of specialist doctors and specialist dentists in Poland
144 thousands
140
136
132
128
124
120
20 thousands
16
12
8
4
0
Specialists doctors
Specialist dentists
2015 20252020 2030 2035
Source: Naczelna Izba Lekarska [NIL], 2015
INTRODUCTION19 PILOT MODEL 2. IMPLEMENTATION MANUAL
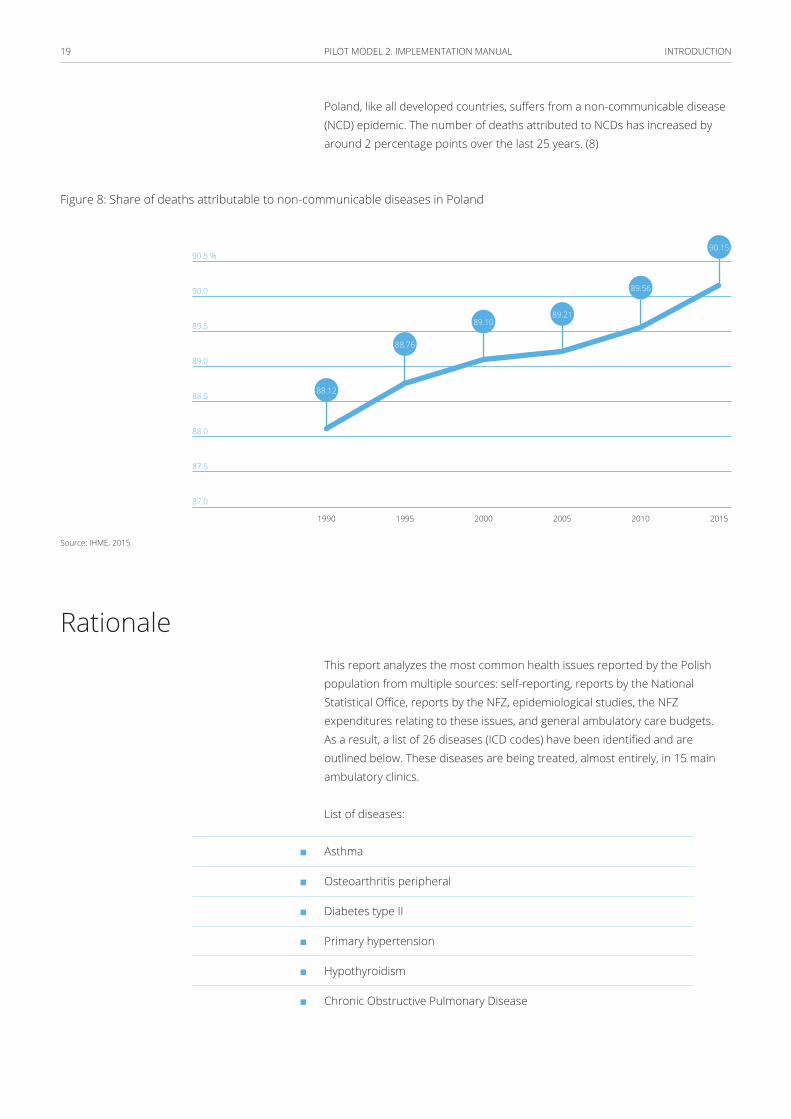
Poland, like all developed countries, suffers from a non-communicable disease (NCD) epidemic. The number of deaths attributed to NCDs has increased by around 2 percentage points over the last 25 years. (8)
Figure 8: Share of deaths attributable to non-communicable diseases in Poland
90.5 %
90.0
89.5
89.0
88.5
88.0
87.5
87.0
88.12
88.76
89.1089.21
89.56
90.15
1990 2000 20101995 2005 2015
Source: IHME, 2015
RationaleThis report analyzes the most common health issues reported by the Polish population from multiple sources: self-reporting, reports by the National Statistical Office, reports by the NFZ, epidemiological studies, the NFZ expenditures relating to these issues, and general ambulatory care budgets. As a result, a list of 26 diseases (ICD codes) have been identified and are outlined below. These diseases are being treated, almost entirely, in 15 main ambulatory clinics.
List of diseases:
■ Asthma
■ Osteoarthritis peripheral
■ Diabetes type II
■ Primary hypertension
■ Hypothyroidism
■ Chronic Obstructive Pulmonary Disease
INTRODUCTION20 PILOT MODEL 2. IMPLEMENTATION MANUAL
■ Chronic ischemic heart disease
■ Chronic heart failure
■ Persistent atrial fibrillation
■ Parenchymal and nodular thyroid
■ Spinal pain Syndrome
■ Allergic rhinitis
■ Reflux disease
■ Calculus of lower urinary tract
■ Peripheral artery disease (PAD)
■ Nutritional anemia
■ Acute and otitis media with effusion
■ Obesity and metabolic disorders (syndrome)
■ Hyperplasia of prostate (enlargement of the prostate)
■ Chronic kidney disease (CKD)
■ Chronic venous insufficiency (CVI)
■ Chronic inflammatory bowel diseases and Irritable Bowel Syndrome (IBS)
■ Faulty posture and Congenital deformities of limbs
■ Joint inflammation (Arthroplasties)
■ Soft-tissue pain of the musculoskeletal system, including limb injury without a fracture.
■ Venous thromboembolism
In 2015, patients with the selected diseases represented 71.2% of PHC patients, 61.68% of all OSC patients, and 24% hospital patients. In the same year, 28.3% of all PHC services related to the 26 diseases, in OSC the share was 28.5% and in hospital 19.2% of all services.
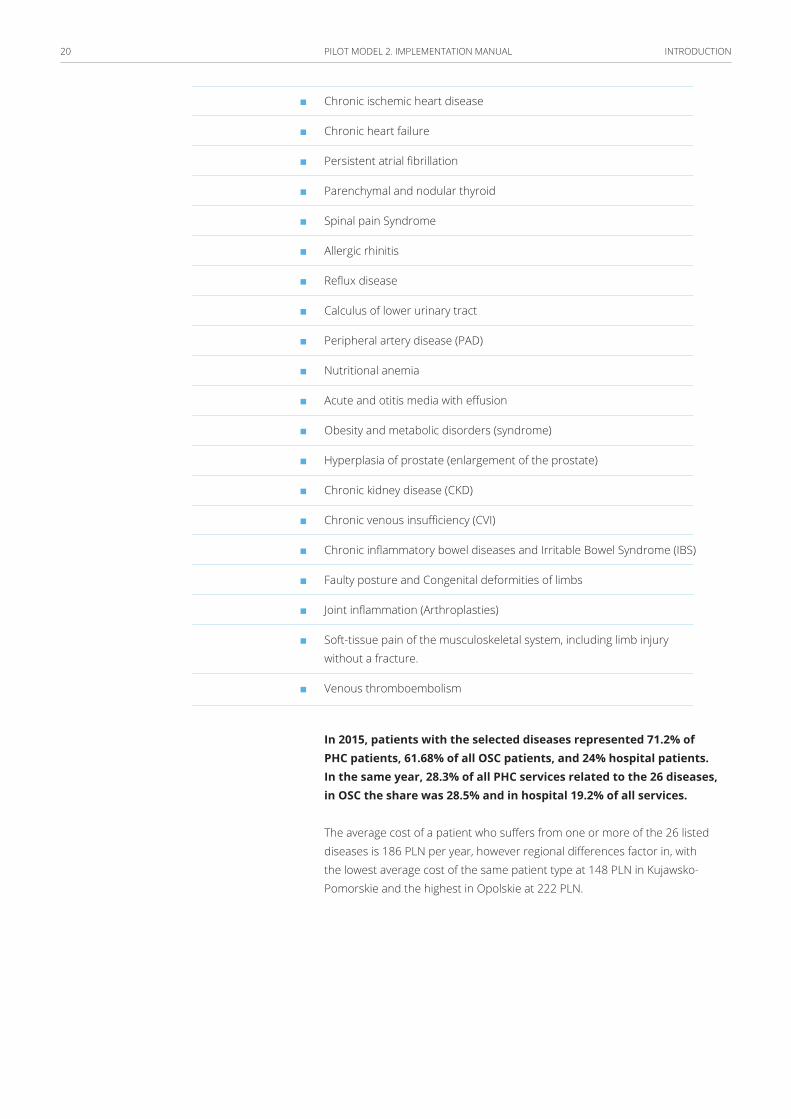
The average cost of a patient who suffers from one or more of the 26 listed diseases is 186 PLN per year, however regional differences factor in, with the lowest average cost of the same patient type at 148 PLN in Kujawsko-Pomorskie and the highest in Opolskie at 222 PLN.
INTRODUCTION21 PILOT MODEL 2. IMPLEMENTATION MANUAL
Figure 9: Average spending per patient at the OSC level: 26 diseases 2013–2015 (in PLN)
Opolskie
Mazow
ieckie
Świętokrzyskie
Podkarpackie
Małopolskie
Wielkopolskie
Poland
Lubelskie
Śląskie
Lubuskie
Zachodniopomorskie
Łódzkie
Warm
ińsko-Mazurskie
Podlaskie
Pomorskie
Kujawsko-Pom
orskie146145148
148156155
161157162
163163169
168167172
168168173
183182182
175175184
177174184
184180186
185177186
199189191
199197199
199195207
212202208
223217222
2015
2014
2013
250 PLN
200
150
100
50
0
Source: World Bank analysis based on NFZ data
Figure 10: Average spending per patient at the OSC level by Region of 26 diseases in 2015
Opolskie
Mazow
ieckie
Świętokrzyskie
Podkarpackie
Małopolskie
Wielkopolskie
Poland
Lubelskie
Śląskie
Lubuskie
Zachodniopomorskie
Łódzkie
Warm
ińsko-Mazurskie
Podlaskie
Pomorskie
Kujawsko-Pom
orskie
250 PLN
200
150
100
50
0
222
208
207
199
191
186
186
184
184
182
173
172
169
162
155
148
Source: World Bank analysis based on NFZ data
INTRODUCTION22 PILOT MODEL 2. IMPLEMENTATION MANUAL
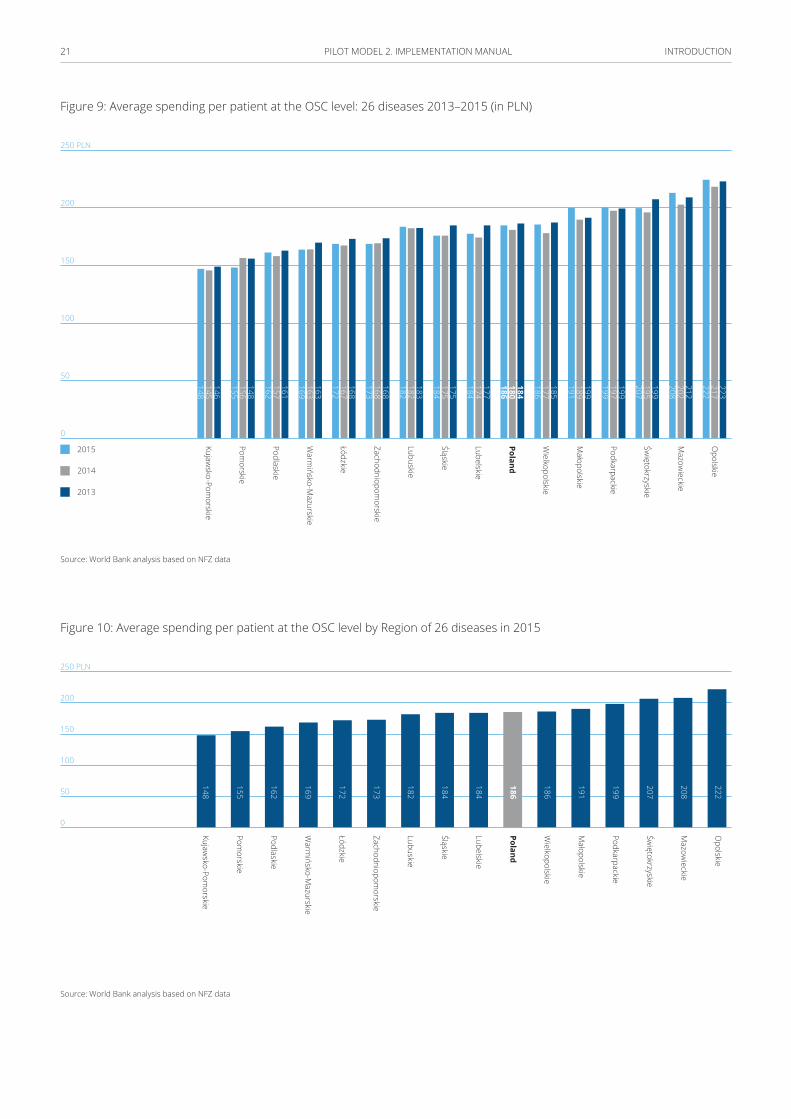
Figure 11: Percent of patients, services, and costs relating to the 26 diseases at the PHC, OSC and hospital level as a share of all patients, services and costs at the respective level of care2
80%
70
60
50
40
30
20
10
0
PHC OSC Hospital
71.20
28.30
61.70
28.50
26.08
24.00
19.20
20.52
Share of patients
Share of services
Share of costs (PLN)
Source: World Bank analysis based on NFZ data
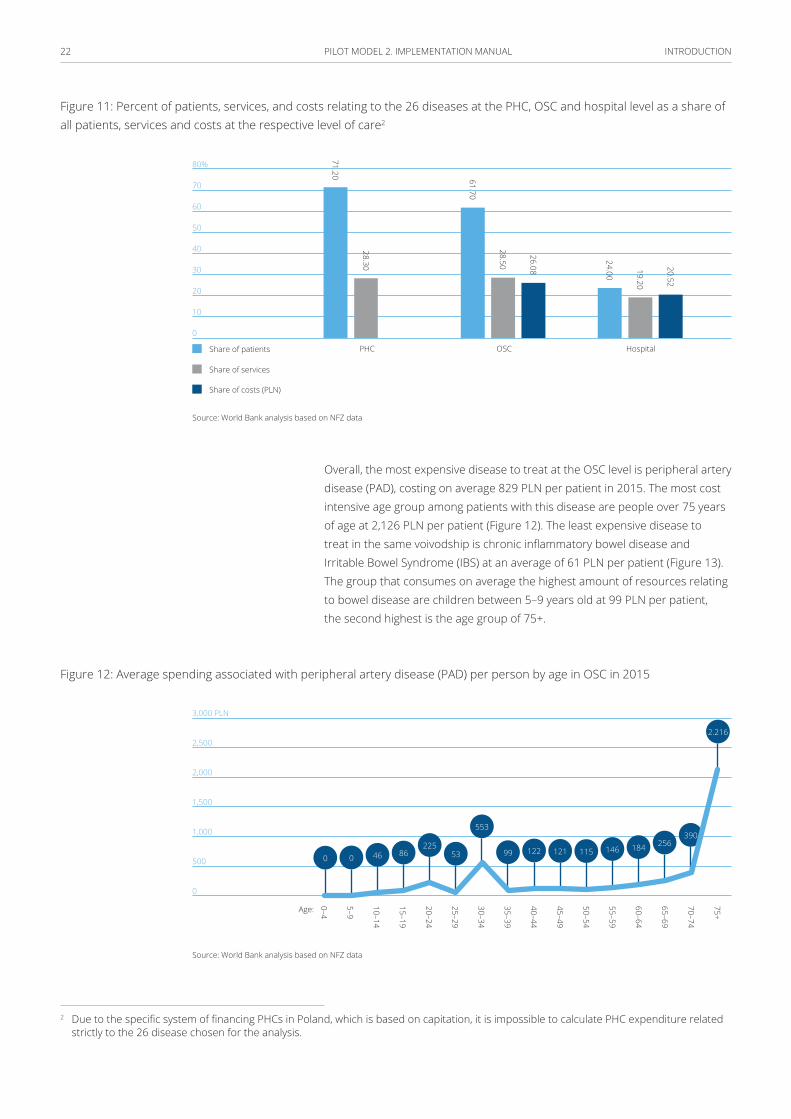
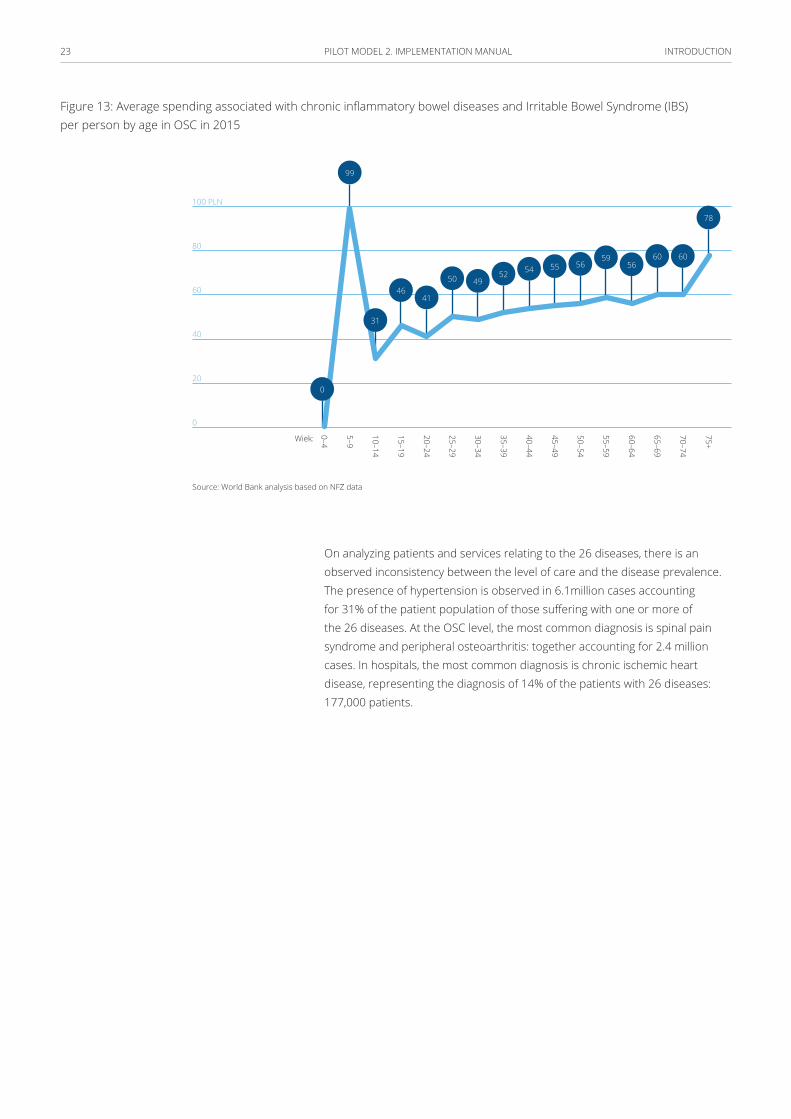
Overall, the most expensive disease to treat at the OSC level is peripheral artery disease (PAD), costing on average 829 PLN per patient in 2015. The most cost intensive age group among patients with this disease are people over 75 years of age at 2,126 PLN per patient (Figure 12). The least expensive disease to treat in the same voivodship is chronic inflammatory bowel disease and Irritable Bowel Syndrome (IBS) at an average of 61 PLN per patient (Figure 13). The group that consumes on average the highest amount of resources relating to bowel disease are children between 5–9 years old at 99 PLN per patient, the second highest is the age group of 75+.
Figure 12: Average spending associated with peripheral artery disease (PAD) per person by age in OSC in 2015
Age:
3,000 PLN
2,500
2,000
1,500
1,000
500
0
75+
70–74
65–69
60–64
55–59
50–54
45–49
40–44
35–39
30–34
25–29
20–24
15–19
10–14
5–9
0–4
0 86
553
121256
0225
99 115
390
46 53 122 184146
2.216
Source: World Bank analysis based on NFZ data
2 Due to the specific system of financing PHCs in Poland, which is based on capitation, it is impossible to calculate PHC expenditure related strictly to the 26 disease chosen for the analysis.
INTRODUCTION23 PILOT MODEL 2. IMPLEMENTATION MANUAL
Figure 13: Average spending associated with chronic inflammatory bowel diseases and Irritable Bowel Syndrome (IBS) per person by age in OSC in 2015
100 PLN
80
60
40
20
0
75+
70–74
65–69
60–64
55–59
50–54
45–49
40–44
35–39
30–34
25–29
20–24
15–19
10–14
5–9
0–4Wiek:
41
54 56
49
5660
99
5055
60
46
52
59
78
0
31
Source: World Bank analysis based on NFZ data
On analyzing patients and services relating to the 26 diseases, there is an observed inconsistency between the level of care and the disease prevalence. The presence of hypertension is observed in 6.1million cases accounting for 31% of the patient population of those suffering with one or more of the 26 diseases. At the OSC level, the most common diagnosis is spinal pain syndrome and peripheral osteoarthritis: together accounting for 2.4 million cases. In hospitals, the most common diagnosis is chronic ischemic heart disease, representing the diagnosis of 14% of the patients with 26 diseases: 177,000 patients.
INTRODUCTION24 PILOT MODEL 2. IMPLEMENTATION MANUAL
Figure 14: Number of patients and services reported at the PHC – 26 diseases in 2015
25 mln
20
15
10
5
0
8 mln
7
6
5
4
3
2
1
0
Chronic venous insufficiency (CVI)
Soft-tissue pain of the musculoskeletal system
, including limb injury w
ithout a fracture
Atherosclerosis
Obesity and m
etabolic disorders (syndrome)
Parenchymal and nodular thyroid
Chronic kidney disease (CKD)
Faulty posture and Congenital deformities of lim
bs
Calculus of lower urinary tract
Chronic inflamm
atory bowel diseases and Irritable Bow
el Syndrome (IBS)
Hyperplasia of prostate (enlargem
ent of the prostate)
Chronic Obstructive Pulm
onary Disease (CO
PD)
Persistent atrial fibrillation
Nutritional anem
ia
Venous thromboem
bolism
Chronic heart failure
Joint inflamm
ation (Arthroplasties)
Acute and otitis media w
ith effusion
Reflux disease
Asthma
Hypothyroidism
Allergic rhinitis
Chronic ischemic heart disease
Diabetes type II
Osteoarthritis peripheral
Spinal pain Syndrome
Primary hypertension
No. of services No. of patients
Source: World Bank analysis based on NFZ data

INTRODUCTION25 PILOT MODEL 2. IMPLEMENTATION MANUAL
Figure 15: Number of patients and services at the OSC level associated with the 26 diseases in 2015
250 mln PLN
200
150
100
50
0
3.0 mln
2.5
2.0
1.5
1.0
0.5
0.0
Chronic venous insufficiency (CVI)
Nutritional anem
ia
Soft-tissue pain of the musculoskeletal system
, including limb injury w
ithout a fracture
Obesity and m
etabolic disorders (syndrome)
Parenchymal and nodular thyroid
Atherosclerosis
Chronic heart failure
Faulty posture and Congenital deformities of lim
bs
Calculus of lower urinary tract
Chronic kidney disease (CKD)
Chronic inflamm
atory bowel diseases and Irritable Bow
el Syndrome (IBS)
Reflux disease
Persistent atrial fibrillation
Acute and otitis media w
ith effusion
Joint inflamm
ation (Arthroplasties)
Chronic Obstructive Pulm
onary Disease (CO
PD)
Venous thromboem
bolism
Chronic ischemic heart disease
Hyperplasia of prostate (enlargem
ent of the prostate)
Asthma
Diabetes type II
Primary hypertension
Hypothyroidism
Allergic rhinitis
Osteoarthritis peripheral
Spinal pain Syndrome
No. of patients
No. of services Costs
Source: World Bank analysis based on NFZ data
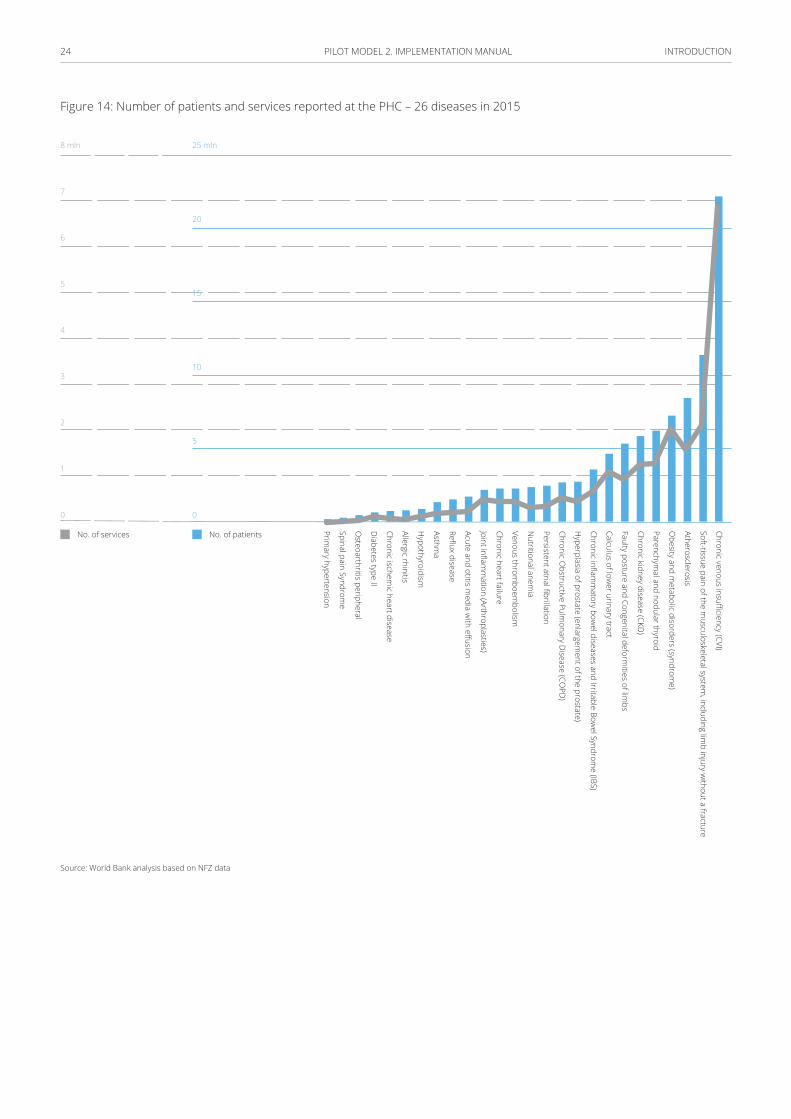
Primary hypertension requires 19.5 million services provided at the PHC level at 43.4% of all services for the 26 diseases; at the OSC level the highest amount of services, at 2.8 million, is due to allergic rhinitis; and at the hospital level the most utilized services are related to chronic ischemic heart diseases at 224,000.
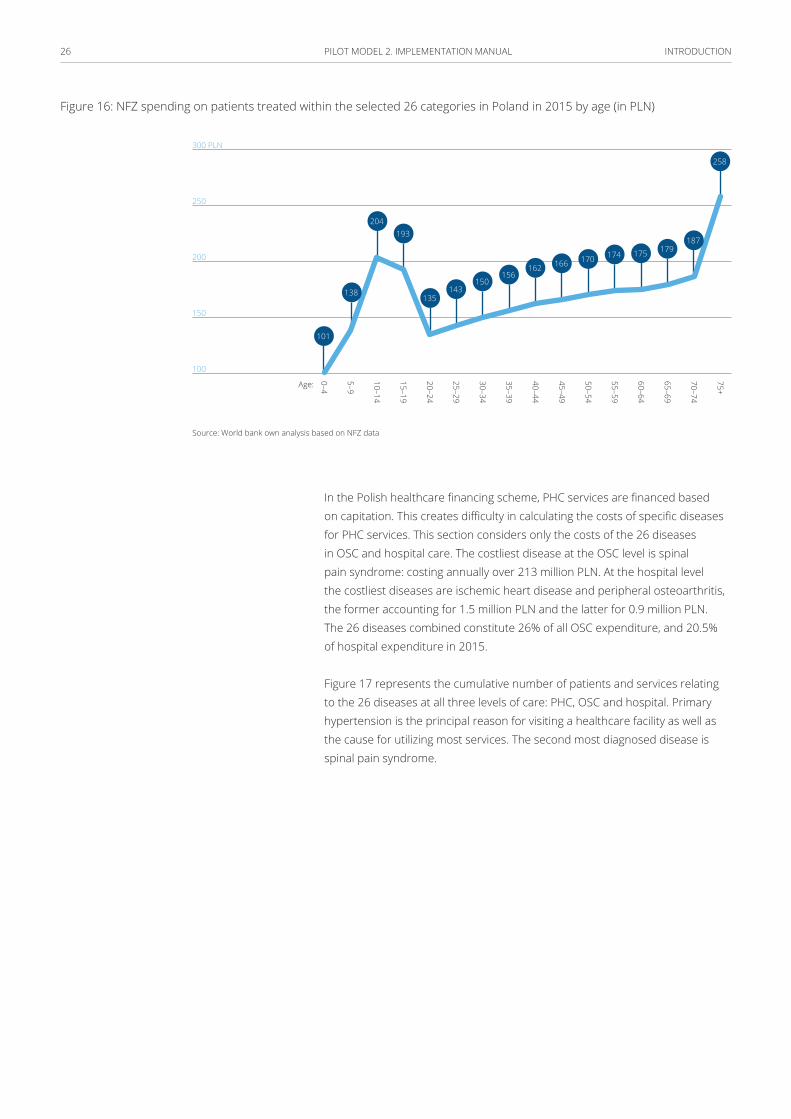
The cost of care at the ambulatory level is positively correlated with the age of the patient – there are some exceptions like asthma, for example, where the cost of care is also high for children.
INTRODUCTION26 PILOT MODEL 2. IMPLEMENTATION MANUAL
Figure 16: NFZ spending on patients treated within the selected 26 categories in Poland in 2015 by age (in PLN)
Age:
300 PLN
250
200
150
100
75+
70–74
65–69
60–64
55–59
50–54
45–49
40–44
35–39
30–34
25–29
20–24
15–19
10–14
5–9
0–4
101
204193
135143
166156
174
150
170179
162
175
258
138
187
Source: World bank own analysis based on NFZ data
In the Polish healthcare financing scheme, PHC services are financed based on capitation. This creates difficulty in calculating the costs of specific diseases for PHC services. This section considers only the costs of the 26 diseases in OSC and hospital care. The costliest disease at the OSC level is spinal pain syndrome: costing annually over 213 million PLN. At the hospital level the costliest diseases are ischemic heart disease and peripheral osteoarthritis, the former accounting for 1.5 million PLN and the latter for 0.9 million PLN. The 26 diseases combined constitute 26% of all OSC expenditure, and 20.5% of hospital expenditure in 2015.
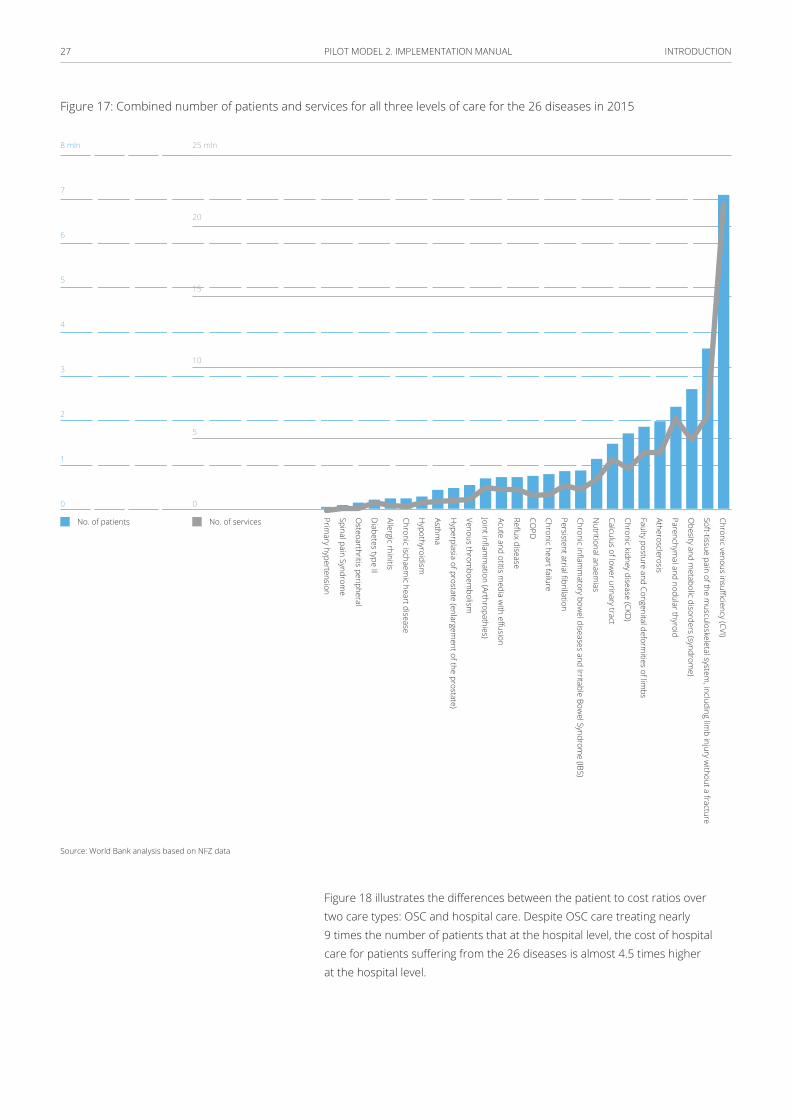
Figure 17 represents the cumulative number of patients and services relating to the 26 diseases at all three levels of care: PHC, OSC and hospital. Primary hypertension is the principal reason for visiting a healthcare facility as well as the cause for utilizing most services. The second most diagnosed disease is spinal pain syndrome.
INTRODUCTION27 PILOT MODEL 2. IMPLEMENTATION MANUAL
Figure 17: Combined number of patients and services for all three levels of care for the 26 diseases in 2015
Chronic venous insufficiency (CVI)
Soft-tissue pain of the musculoskeletal system
, including limb injury w
ithout a fracture
Obesity and m
etabolic disorders (syndrome)
Parenchymal and nodular thyroid
Atherosclerosis
Faulty posture and Congenital deformities of lim
bs
Chronic kidney disease (CKD)
Calculus of lower urinary tract
Nutritional anaem
ias
Chronic inflamm
atory bowel diseases and Irritable Bow
el Syndrome (IBS)
Persistent atrial fibrillation
Chronic heart failure
COPD
Reflux disease
Acute and otitis media w
ith effusion
Joint inflamm
ation (Arthropathies)
Venous thromboem
bolism
Hyperplasia of prostate (enlargem
ent of the prostate)
Asthma
Hypothyroidism
Chronic ischaemic heart disease
Allergic rhinitis
Diabetes type II
Osteoarthritis peripheral
Spinal pain Syndrome
Primary hypertension
No. of patients No. of services
25 mln
20
15
10
5
0
8 mln
7
6
5
4
3
2
1
0
Source: World Bank analysis based on NFZ data
Figure 18 illustrates the differences between the patient to cost ratios over two care types: OSC and hospital care. Despite OSC care treating nearly 9 times the number of patients that at the hospital level, the cost of hospital care for patients suffering from the 26 diseases is almost 4.5 times higher at the hospital level.
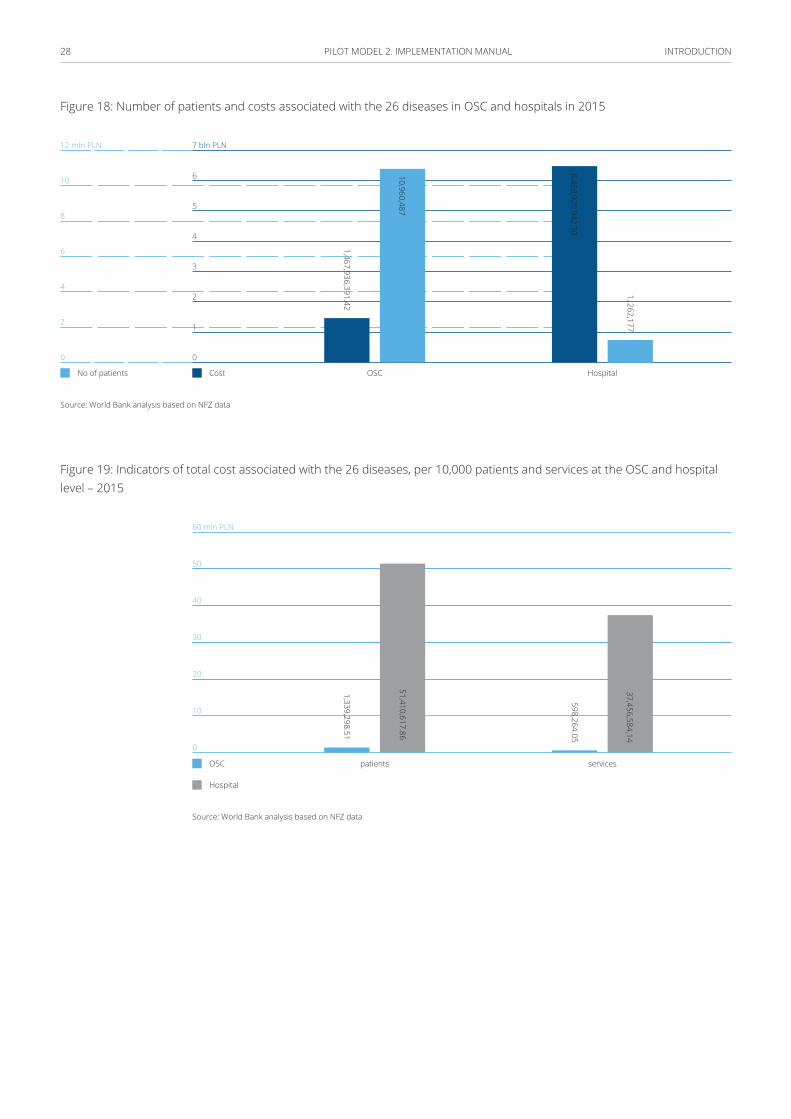
INTRODUCTION28 PILOT MODEL 2. IMPLEMENTATION MANUAL
Figure 18: Number of patients and costs associated with the 26 diseases in OSC and hospitals in 2015
1,467,936,391.42
7 bln PLN
6
5
4
3
2
1
0
12 mln PLN
10
8
6
4
2
0
No of patients Cost OSC Hospital
10,960,487
6,488,929,942.30
1,.262,177
Source: World Bank analysis based on NFZ data
Figure 19: Indicators of total cost associated with the 26 diseases, per 10,000 patients and services at the OSC and hospital level – 2015
patients services
1,339,298.51
598,264.05
51,410,617.86
37,456,584.14
OSC
Hospital
60 mln PLN
50
40
30
20
10
0
Source: World Bank analysis based on NFZ data
29 PILOT MODEL 2. IMPLEMENTATION MANUAL
Service delivery organization model
Scope
Outpatient Managed Care is composed of the following services at the PHC and ambulatory levels:
■ Diabetology
■ Endocrinology
■ Cardiology
■ Neurology
■ Pulmonology
■ Orthopedics-trauma
■ Allergology
■ General surgery
■ Dermatology
■ Otolaryngology
■ Gastroenterology
■ Vascular surgery
■ Obstetrics and-gynecology
■ Rheumatology
■ Urology
SERVICE DELIVERy ORGANIZATION MODEL30 PILOT MODEL 2. IMPLEMENTATION MANUAL
The scope of Model 2 includes:
1 Primary Health Care with enhanced mandate of
PHC/family physician (OMC-PHC)
2 OMC Outpatient Specialized Care (OMC-OSC)
3 Enhanced OMC health prevention and education (OMC-PREV)
4 OMC Medical Rehabilitation (OMC-REH)
Primary Health Care with enhanced mandate of PHC/family physician (OMC-PHC)
Apart from routine activities associated enrolled patient care, this enhanced mandate PHC includes in-depth diagnostic and therapeutic procedures for symptom complexes and chronic diseases listed in the catalogue presented in the Annex 2, in circumstances where a patient’s condition does not require direct involvement of an OSC physician. Within that mandate, the PHC/family physician orders diagnostic tests and specialist consultations in OMC-OSC clinics.
Where possible, the family/PHC physician performs certain services and diagnostic tests prescribed in diagnostic and therapeutic paths exclusively for OMC-OSC clinic physicians, unless competencies are out of the range of practitioner’s capacity.
OMC/PHC services are related to diagnostic procedures applicable to patients with selected syndrome complexes and care over patients with chronic conditions. At present, patients who suffer from syndrome complexes or chronic conditions receive care at OSC, but OMC/PHC services are now equipped to carry out diagnostic procedures for these patients.
These services can be performed by a PHC/family physician authorized to accept patient declarations or by another physician who cooperates with the abovementioned PHC/family physician, has appropriate qualifications (e.g., family medicine, general medicine or internal medicine specialist and long tenure in PHC as the basis for accepting the declarations), an extended scope of diagnostic tests under model 2, and can consult patients from the Model 2 disease category.
When a patient is diagnosed with a chronic condition, the physician agrees and develops a medical care plan (active counselling plan) with the patient
SERVICE DELIVERy ORGANIZATION MODEL31 PILOT MODEL 2. IMPLEMENTATION MANUAL
in line with diagnostic and therapeutic paths. Features of these plans included the following steps: necessary tests and specialist consultations are ordered by the physician as appropriate, the medical care plan is coordinated by PHC/family physician team, the treatment plan is determined by the physician in consultation with the patient, and its implementation is supervised by the physician. Visits prescribed in the medical care plan are scheduled by the staff of the service provider or a partner entity, e.g. the contact center, provided that a relevant confidentiality agreement regarding patient’s health data is submitted. Monitoring of compliance in line with the recommendations can be carried out by a PHC nurse.
OMC Outpatient Specialized Care (OMC-OSC)
Responsibilities assigned to OMC-OSC physicians:
■ consulting patients treated by a PHC/family physician and determining whether the patient requires permanent specialized care, and
■ treating patients assigned to OSC.
In line with the prescriptions of the diagnostic and therapeutic paths, medical consultations are divided into the following categories:
■ Diagnostic consultations – resulting from the need for differential diagnosis in selected symptomatic complexes for which diagnostic paths are defined.
■ Comprehensive consultations – provided during the period of diagnosis of a chronic disease, and post diagnosis: annually or biennially. These are required to make substantial diagnostic and therapeutic decisions and are implemented in line with protocols of evidence based medicine guidelines.
■ Follow-up consultations – relating to follow-up and monitoring of the therapeutic process. Some visits, e.g. those associated with drug prescription, can be performed by medical personnel other than physicians such as nurses and midwives.
■ Educational consultations – in the event of the patient and the family requiring more information on the condition and management of the condition. These consultations can be performed by medical personnel other than physicians such as nurses, midwives and health educators.
OMC-OSC physicians should be authorized to order cost-intensive diagnostic tests, contracted by the NFZ on a separate basis. There is also potential for authorizing PHC physicians to order tests whose referrals would be actioned only when the indication for the test has been agreed with the OMC-OSC physician.
The number of consultations in specialized clinics may decrease due to patients treated under PHC/family physician care. This can decrease care
SERVICE DELIVERy ORGANIZATION MODEL32 PILOT MODEL 2. IMPLEMENTATION MANUAL
burden in specialized care and free up resources: potentially improving access and quality of specialized care to patients who require specialized treatment.
To contain excessive ‘outflow’ of patients from OSC clinics, it is recommended to introduce regulatory measures on a temporary basis – e.g. a minimum percentage of services provided in those clinics vs. the baseline number of consultations (for instance, 50%).
Enhanced OMC prevention and education
Screening and prevention programs, which are tailored to specific characteristics, should be available to patients based on age and sex groups or pre-defined lifestyle disease risk groups.
Health education applies to behavioral medicine programs as well as chronic condition management programs.
More in the service delivery model below.
OMC Medical Rehabilitation (OMC-REH)
Outpatient and home-based physiotherapy and specialist consultations will be available under the new model. Rehabilitation services will be provided upon referral from PHC/family physicians and OSC physicians included in OMC.
Prevention (Details in annex 1):
OMC is intended to improve the efficiency of prevention programs implemented-to-date, achieved by changing the approach to recruitment, organization and financing.
The bulk of work related to prevention and education should be performed by adequately trained nurses and midwives, supported by non-medical personnel; in subject-matter aspects, supported by health educator, dietician, and; in logistics, supported by registration clerk, medical assistant, contact center. Primary prevention programs for lifestyle diseases should be targeting pre-defined patient groups according to age and the level of risk for lifestyle diseases.
Regarding patients with elevated health risks, relevant health monitoring procedures are launched in line with evidence-based medicine guidelines, including health education.
SERVICE DELIVERy ORGANIZATION MODEL33 PILOT MODEL 2. IMPLEMENTATION MANUAL
Ultimately, each patient diagnosed with a chronic condition ought to participate in educational programs relevant to their condition management through e-learning tools and if necessary, self-monitoring of their health status (e.g., blood pressure measurements, blood glucose measurements), potentially making use of the Individual Health Record.
The pilot facilities lead an active role in education, prevention and prophylaxis. These activities are supported financially and organizationally. Given that the planned actions can impact individuals without symptoms, they should be put in place for each proposed action that does not pose a threat to safety, does not create health inequalities, and is effective with respect to the expected costs and identification of obstacles to their implementation.
Tools are adapted to the different levels of prophylaxis:
■ Early prophylaxis – variation of normal patterns of healthy lifestyles and prevention of the spread of negative patterns of behavior in relation to healthy people. Tools used in the framework of early prophylaxis are: overall assessment of the health, health education, support health-promoting activities.
■ Primary prevention – preventing the disease by controlling risk factors in respect of persons exposed to risk factors. Tools used in primary prevention: an overall assessment of the state of health, health education, support health-related activities within the identified risk factors.
■ Secondary prevention – prevention of the consequences of the disease by the early detection and treatment, for example screening tests to detect illnesses. Tools used in secondary prevention: screening of the general population PHC.
■ Tertiary prevention – stopping the progress of the disease and reduce complications. Tools used in the framework of tertiary prevention: treatment plan determined between the patient and the PHC doctor.
One of the constant elements for carrying out prevention and prophylaxis is child health check-ups, in line with the existing scheme. In order to create robust reporting systems, it is proposed to record data more comprehensively from the child health check-ups in the IT system, which allows analyses and operations using these data.
The second key element of prevention and prophylaxis is adult check-ups. The extensiveness of check-up tests and further intervention depends on age and risk factors.

SERVICE DELIVERy ORGANIZATION MODEL34 PILOT MODEL 2. IMPLEMENTATION MANUAL
The following Pro-Health activities are covered for all patients in the Model 2:
1 prevention and education activities (including assessment of general health status
and in-depth interviews),
2 screening actions (screenings of proven effectiveness), and
3 further care based on the health conditions and on the preventive and prophylaxis
actions that are undertaken. Care may involve the designation of further prophylaxis
steps as well as creation of the health and treatment plan if diseases are detected
during screening.
Preventive activities concern the identification of risk factors in the general population through in-depth interviews, general assessment of health, and screenings. Prophylaxis activities (including screenings) are indicated in the study based on scientific guidelines of the main risk factors and lifestyle diseases. These apply to different age groups, from 0 to 65+ for the following health issues, risk factors or diseases:
■ Tobacco use
■ Overweight / eating disorder
■ Alcohol abuse
■ Low physical activity
■ High blood pressure
■ Elevated levels of cholesterol and other lipids
■ Excessive consumption of salt
■ Family history
■ Diabetes
■ Cardiovascular disease
■ Chronic lung disease
■ Depression, dementia
■ Seeing, hearing
■ Vertigo
■ Oncological diseases

SERVICE DELIVERy ORGANIZATION MODEL35 PILOT MODEL 2. IMPLEMENTATION MANUAL
■ Anemia
■ TB
■ Osteoporosis
■ Poor posture
All the risk factors are listed and outlined with respective interventions in PHC for different patient age groups.
Table 2: Disease and risk factors for age group by gender
Disease/risk factor Age
0–2
2–4
5–9
10–1
4
15–1
9
20–2
4
25–2
9
30–3
4
35–3
9
40–4
4
45–4
9
50–5
4
55–5
9
60–6
4
body mass ♀♂ ♀♂ ♀♂ ♀♂ ♀♂ ♀♂ ♀♂ ♀♂ ♀♂ ♀♂ ♀♂ ♀♂ ♀♂ ♀♂
diabetes ♀♂ ♀♂ ♀♂ ♀♂ ♀♂ ♀♂ ♀♂ ♀♂ ♀♂
cholesterol ♀♂ ♀♂ ♀♂ ♂ ♂ ♀♂ ♀♂ ♀♂
blood pressure ♀♂ ♀♂ ♀♂ ♀♂ ♀♂ ♀♂ ♀♂ ♀♂ ♀♂ ♀♂ ♀♂ ♀♂ ♀♂
general cardiovascular diseases risk
♀♂ ♂ ♀♂ ♀♂ ♀♂ ♀♂
nutrition ♀♂ ♀♂ ♀♂ ♀♂ ♀♂ ♀♂ ♀♂ ♀♂ ♀♂ ♀♂
physical activity ♀♂ ♀♂ ♀♂ ♀♂ ♀♂ ♀♂ ♀♂ ♀♂ ♀♂ ♀♂
tobacco usage ♀♂ ♀♂ ♀♂ ♀♂ ♀♂ ♀♂ ♀♂ ♀♂ ♀♂ ♀♂ ♀♂
alcohol intake ♀♂ ♀♂ ♀♂ ♀♂ ♀♂ ♀♂ ♀♂ ♀♂ ♀♂ ♀♂
depression ♀♂ ♀♂ ♀♂ ♀♂ ♀♂ ♀♂ ♀♂ ♀♂ ♀♂
cervical cancer ♀♂ ♀♂ ♀♂ ♀ ♀ ♀ ♀ ♀ ♀ ♀ ♀ ♀
breast cancer ♀ ♀ ♀ ♀
colorectal cancer ♀♂ ♀♂ ♀♂
respiratory disease ♀♂ ♀♂ ♀♂ ♀♂
osteoporosis ♀♂ ♀♂ ♀♂ ♀♂ ♀♂
anaemia ♀♂
vision ♀♂ ♀♂ ♀♂ ♀♂ ♀♂
hearing ♀♂ ♀♂ ♀♂ ♀♂ ♀♂
Source: PTPZ (Polskie Towarzystwo Programów Zdrowotnych) for the World Bank, 2017

SERVICE DELIVERy ORGANIZATION MODEL36 PILOT MODEL 2. IMPLEMENTATION MANUAL
Activities to be undertaken by a nurse, doctor or other health specialist can be summarized as below:
Table 3: Interventions in the assessment of the patient’s general health are:
Overall health rating: basic research laboratory – glucose, serum, or urine
Funded within the capitation PHC (NFZ funds)
Screening cytology, mammography colonoscopy / occult blood
Research funded separately (FFS) (EU funds)
In-depth nurses interviews, a preliminary assessment of health, measuring BMI, health education
Advice separately funded (FFS) (EU funds)
An in-depth medical interview (by doctor), overall health assessment, further treatment / path proceedings, health referral to educational visit
Advice separately funded (FFS) (EU funds)
Prophylaxis interventions, strengthening tobacco control intervention, psychological support, purchase products to help stop smoking, exercise with a trainer, nutritionist, etc.
Funding under the grant awarded for preventive interventions. Grant to be determined and awarded on the basis of individual proposals PHC team. The purpose of the grant is to provide support tools for implementing the activities screening, prevention and education. (EU funds)
The detailed list of screening tests and possible interventions to be conducted under Model 2 can be found in Annex 1.
It is expected that coverage with the health check-ups for the adults increases over the course of the pilot project as shown in Figure 20.
Figure 20: Share of population covered for health check-ups throughout the pilot by age group
70%
60%
50%
40%
30%
2017
35%
40%
45%
50%
55%
60%
65%
2019
37%
42%
47%
52%
57%
62%
67%
2018
36%
41%
46%
51%
56%
61%
66%
38%
2020
43%
48%
53%
58%
63%
68%65–69 years
60–64 years
55–59 years
35–39 years
45–49 years
40–44 years
50–54 years
Source: World Bank analysis, 2017

SERVICE DELIVERy ORGANIZATION MODEL37 PILOT MODEL 2. IMPLEMENTATION MANUAL
Diagnostic and therapeutic paths In defining the range of responsibilities allocated to PHC and OSC physicians in connection to the diagnostic and therapeutic process for selected symptom complexes and chronic diseases, recommendations for diagnostic and therapeutic procedures are developed during the pilot preparatory stage, based on EBM guidelines.
The intention is that the paths are not mandatory, rather, that they are perceived as supporting clinical decision making for physicians, while respecting the principle of physician discretion: that the final decision is always between the patient and physician. The paths should also prove helpful in the planning of care by the PHC/family physician, especially regarding the division of roles and responsibilities between PHC/family physicians and other specialist physicians and medical professionals regarding the scope and frequency of diagnostic tests, visits with PHC/family physician, and consultations with OSC physician.
The paths should support continuous post-graduate education and help streamline decision-making processes in day-to-day practice.
The diagnostic paths are currently being developed by the National Health Fund.
Transfer of Tasks to PHC Nurses and Health Educators
Personnel, excluding physicians, are engaged as much as possible in the following tasks:
■ implementation of prevention programs,
■ health education,
■ follow-up visits and education of patients with chronic conditions from OMC category, and
■ preliminary health status assessment in the case of health problems reported, e.g. by way of counselling (including on the phone and via the Internet), conducted in line with a pre-defined script, identifying where medical consultation is indispensable, for instance, a helpline.
SERVICE DELIVERy ORGANIZATION MODEL38 PILOT MODEL 2. IMPLEMENTATION MANUAL
Planning and coordination of care Within the scope of pre-agreed prevention for specific age groups, prevention tests are carried out. The patient is effectively invited to participate in those tests and at the same time, registered by ancillary personnel.
When a chronic disease is diagnosed, it is the patient’s responsibility to ensure that the treatment plan developed by the physician and agreed with the patient is indeed implemented. The patient is supported in the process by the care coordinator who actively schedules patient’s appointments in connection with outpatient services provided in the plan. The OMC coordinator’s job can be done by the service provider’s medical staff or the staff of a partner entity, e.g. a call center, in accordance with the requirements of the Personal Data Protection Law.
Patients/enrolleesModel 2 is designed as an extended package of healthcare services for 300,000 patients throughout the country. The final number of patients depends on the number of contracts signed by the NFZ. Patients are automatically enrolled in the pilot once their provider participates unless the patient opts out: patient participation in the pilot is voluntary. Patients continue to have the option to change providers three times a year without incurring a charge.
Patient resignation from Model 2 services
The Model 2 covers all patients enrolled with the PHC/family physician through patient declarations. The patient has the right to de-enroll from this model of care and to choose to be treated for one of the Model 2 diseases by an outpatient service clinical physician. In the case of de-enrollment, the patient should communicate his/her intention to opt-out in writing, which the recipient faculty is required to record in the patient’s medical history and in the Model 2 IT system provided by the NFZ. Funding for the patient who resigned from Model 2 services is adjusted accordingly. The facility holding a Model 2 contract is required to provide the contracted patients with the full scope of PHC services as appropriate.

SERVICE DELIVERy ORGANIZATION MODEL39 PILOT MODEL 2. IMPLEMENTATION MANUAL
ProvidersThe extended package of healthcare services is provided to patients through contracted providers. A total of 25 providers are to be included in this pilot. To ensure that the sample of providers adequately represent the providers in Poland, the sample is determined using the criteria presented in Table 4.
Table 4: Selection criteria for the sample providers
Criteria Options Remarks
Region Urban Rural All regions recommended for inclusion
Type of practice Primary care doctor + family practice nurse + midwife
Primary care doctor + family practice nurse
All kinds of practices recommended for inclusion
Size of population per practice
Large (>10,000) Medium (2,500–10,000) Small (<2,500) All sizes recommended for inclusion
Ownership Private Public All kinds of ownership recommended for inclusion
Size of the population
The population density is greatest in the areas surrounding the main medical administrative centers, and correspondingly these centers process the largest amounts of contracts. The number of patients per doctor varies considerably depending on the organizational and legal structure. The highest number of patients per provider is in Mazovia, this is because of the proportion of larger facilities in this region to cater to the large population, although there is more staff employed, the patient to practitioner ratio is still higher than, for example, in Lubuskie. Independent practices are operating mainly in smaller towns (9) and official recommendations from National Health Fund suggest that there should be 2750 patients per one family doctor. In regions where there is a smaller number of facilities and a smaller population, there is a higher number of patients treated by group practices. To determine the size of the practice that should be included in the pilot, practices were divided into Small (around 2,500 patients per 1 doctor), Medium (2500–10,000 patients per 1 doctor) and Large (more than 10,000 patients per 1 doctor). However, to determine if the size of the population impacts the program and what kind of practice, individual or group, would be the most effective in a coordinated care pilot, all populations should be included.

SERVICE DELIVERy ORGANIZATION MODEL40 PILOT MODEL 2. IMPLEMENTATION MANUAL
Type of ownership
In 2015, the National Health Fund had agreements with 6,226 providers, 83.3% of whom are self-employed. Most of these types of agreements are made in the province Silesia, Mazovia, Wielkopolska, the least were made in the province of Świętokrzyskie. (9) All types of ownerships should be represented in the pilot to create an encompassing scenario of the provider dynamics and to represent free market laws.
■ Provider participation is voluntary and governed by legal agreements between the NFZ and the provider. Contracted providers are responsible for providing patients with preventive, primary services and case management of non-communicable diseases, as determined by the 11 selected diseases covered in the Model 1 extended package.
■ Testing that requires additional capabilities and advanced technology is referred to pre-selected subcontracted providers in their catchment area. As such, providers play a gate-keeping role referring patients to appropriate facilities for diagnostic procedures and to specialists.
■ Providers are responsible for contracting with specialists and diagnostic services not available in their facility to ensure that the full range of services included in the new package are available to the patient.
■ Quality of Providers Care under this pilot is the responsibility of the NFZ and is monitored and maintained through the M&E system using indicators listed in the M&E chapter.

SERVICE DELIVERy ORGANIZATION MODEL41 PILOT MODEL 2. IMPLEMENTATION MANUAL
ContractingContracts are signed by enrollment, similarly to PHC contracts. It is also possible to specify bidding terms and conditions in accordance with applicable law for certain types of services.
A party to the contract can be a service provider or a group of service providers representing a consortium, provided they have a register of PHC enrollment declarations, declare intention to join, and meet the requirements of OMC service provision.
During the conceptual work on OMC pilot program, it is necessary to specify the legal basis and rules for the operation of a group of service providers, where the contract is signed by one facility only, rather than separately by each service provider.
For the contract to be signed with a group of service providers, they must have a binding cooperation agreement regarding the OMC contract based on joint personnel and equipment resources, alongside joint quality management and monitoring of compliance with OMC standards and objectives, and joint execution of certain tasks, e.g., implementation of coordinated prevention and educational programs.
For OMC contracts to be signed, a service provider or a group of service providers that signed the cooperation agreement, or are part of a consortium, must have an NFZ contract encompassing all 15 OMC packages.
The service provider or it’s representative (the coordinator/consortium leader, a unit appointed by a group of service providers) is responsible for oversight and management of care.
The requirements to be met by service providers applying for a contract include:
■ the minimum number of PHC/family physician enrollment declarations per one locality of the service provider, the consortium, or the group of providers – in the territory of a county or adjacent counties in total, no less than 20,000 patients in the cities (more than 300,000 residents) and 10,000 in smaller counties;
■ in the case of a consortium or a group of service providers, cooperation agreement regarding OMC service provision;
■ organizational standards, including the chart and the by-laws for OMC service provision, developed in accordance with the template provided by pilot program organizer;
■ the resources (personnel, premises, equipment) to enable contract execution – held by the facility itself and by its subcontractors, in line with the wording of relevant regulations issued by the Minister of Health and ordinances issued
SERVICE DELIVERy ORGANIZATION MODEL42 PILOT MODEL 2. IMPLEMENTATION MANUAL
by the President of the National Health Fund regarding the OMC package of services and the requirements set by pilot program organizer;
■ capacity to exchange information about health events and electronic medical records between OMC service providers (a transition period is allowed to develop the system for electronic data sharing in the first year of operation);
■ a system for patient communication on OMC consultations, particularly identification of patient health needs and feedback information (e.g., e-health platform, tele-medicine solutions to monitor selected health parameters). A transition period is allowed to develop this system in the first year of operation, and;
■ training for physicians and other medical personnel in connection with OMC medical and organizational standards (A transition period accompanied with the training schedule is allowed in the first year of operation).
In addition to the requirements at the contracting phase, the provider or consortium needs to develop a new organizational scheme, upgrade IT systems and provide quality assurance measures. In practical terms:
The OMC involves the following tasks:
■ providing medical care to patients in the scope of services referred to in the contract, including prevention and education in health, in line with developed organizational standards and implemented, encompassing, roles and responsibilities of health personnel (PHC/family physicians and OSC physicians, nurses, midwives, health educators, medical assistants, physiotherapists, etc.), and the terms of their cooperation – including the coordination of care;
■ identifying risk factors and chronic conditions, resulting from check-up consultations, and assigning patients to active counselling groups;
■ developing, implementing and coordinating individual plans of medical care for patients from active counselling groups, based on diagnostic and therapeutic paths developed for each condition in line with the EBM guidelines of Polish and European medical associations;
■ providing doctor and nurse consultations in PHC and OSC clinics, including operative interventions, in line with PHC and OSC mandates and their terms of cooperation, and in accordance with pre-defined organizational standards;
■ ordering diagnostic tests included in the common pool for PHC and OSC clinics (OMC-dgn), in accordance with the competences specified in diagnostic and therapeutic paths. Tests resulting from the scope of prevention activities and the plan of care determined by the physician can be based on a referral issued by medical personnel other than physicians;
■ communicating between individuals who provide care, including exchanging of information about health events and medical records, to be based on
SERVICE DELIVERy ORGANIZATION MODEL43 PILOT MODEL 2. IMPLEMENTATION MANUAL
a robust IT system for the exchange of information about medical events and electronic medical records (EMR). All and any health information pertaining to the patient should be available to the PHC/family physician;
■ collaborating with the facilities that provide health care services (outpatient and inpatient) outside of the OMC, including the exchange of health-related information. In the event of health issues falling outside the OMC mandate, the patient is referred to another provider in accordance with generally applicable principles;
■ updating all the patients on OMC operations, in the case of patients with chronic conditions such information includes contact information on the person (facility) responsible for coordination of care, and a list of locations where the patient can receive services within the framework of managed care model;
■ monitoring and supervision of service quality and efficiency, in line with the procedures laid out in the organizational chart, and;
■ organizing and conducting extensive prevention and education activities.
44 PILOT MODEL 2. IMPLEMENTATION MANUAL
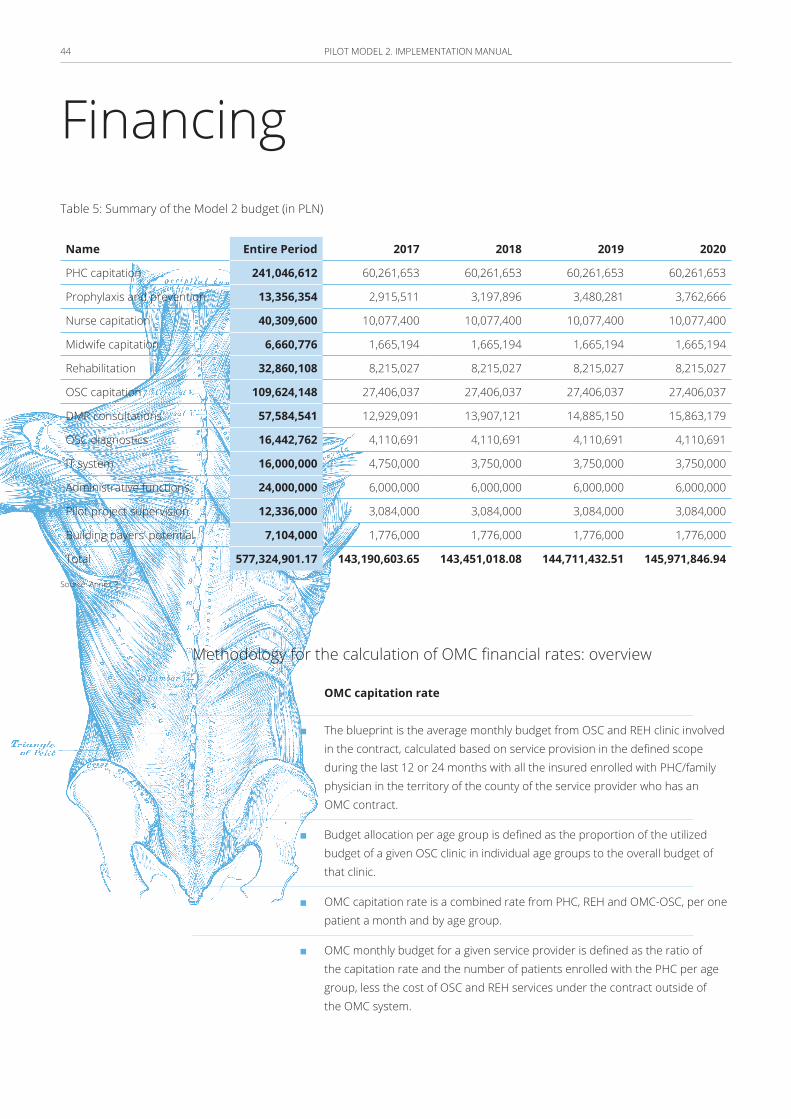
Financing Table 5: Summary of the Model 2 budget (in PLN)
Name Entire Period 2017 2018 2019 2020
PHC capitation 241,046,612 60,261,653 60,261,653 60,261,653 60,261,653
Prophylaxis and prevention 13,356,354 2,915,511 3,197,896 3,480,281 3,762,666
Nurse capitation 40,309,600 10,077,400 10,077,400 10,077,400 10,077,400
Midwife capitation 6,660,776 1,665,194 1,665,194 1,665,194 1,665,194
Rehabilitation 32,860,108 8,215,027 8,215,027 8,215,027 8,215,027
OSC capitation 109,624,148 27,406,037 27,406,037 27,406,037 27,406,037
DMP consultations 57,584,541 12,929,091 13,907,121 14,885,150 15,863,179
OSC diagnostics 16,442,762 4,110,691 4,110,691 4,110,691 4,110,691
IT system 16,000,000 4,750,000 3,750,000 3,750,000 3,750,000
Administrative functions 24,000,000 6,000,000 6,000,000 6,000,000 6,000,000
Pilot project supervision 12,336,000 3,084,000 3,084,000 3,084,000 3,084,000
Building payers’ potential 7,104,000 1,776,000 1,776,000 1,776,000 1,776,000
Total 577,324,901.17 143,190,603.65 143,451,018.08 144,711,432.51 145,971,846.94
Source: Annex 2
Methodology for the calculation of OMC financial rates: overview
OMC capitation rate
■ The blueprint is the average monthly budget from OSC and REH clinic involved in the contract, calculated based on service provision in the defined scope during the last 12 or 24 months with all the insured enrolled with PHC/family physician in the territory of the county of the service provider who has an OMC contract.
■ Budget allocation per age group is defined as the proportion of the utilized budget of a given OSC clinic in individual age groups to the overall budget of that clinic.
■ OMC capitation rate is a combined rate from PHC, REH and OMC-OSC, per one patient a month and by age group.
■ OMC monthly budget for a given service provider is defined as the ratio of the capitation rate and the number of patients enrolled with the PHC per age group, less the cost of OSC and REH services under the contract outside of the OMC system.

FINANCING 45 PILOT MODEL 2. IMPLEMENTATION MANUAL
■ Under no circumstances can OMC budget be exceeded. The cost of OMC budget as a share of all the costs allocated to health care from public funds, accounting the resources allocated to performance-based budget, is adjusted in proportion to the increase in NFZ budget resources in a certain period and area.
■ Over the first 6 months, OMC budget is calculated as 65% of the overall budget resulting from the number of enrollment declarations with the PHC/family physician in each age group (rather than from the number of OMC enrollment declarations).
OMC diagnostic budget (OMC-dgn)
OMC-dgn financing is carried out outside of the base OMC capitation rate, from three sources, as follows:
■ additional capitation rate tailored to age groups and their average morbidity managed in the PHC;
■ additional diagnostic rate in respect of tests carried out in connection with check-up consultation (payable per event), in accordance with the standard set for each such check-up by age group 35–39, 40–44, 45–49, 50–54, 55–59, 65–69, and extended pediatric check-ups (scope of services falling under check-up consultations for each age group in presented Annex 1), and;
■ additional diagnostic rate regarding tests carried out for OMC patients (payable per event) up to the limit of 15% of OMC budget value, according to pricing rules identical to those for the PHC. When that budget is exceeded, diagnostics are financed from the remaining OMC revenues, and the NFZ is free from any financial liability for those activities.

FINANCING 46 PILOT MODEL 2. IMPLEMENTATION MANUAL
Main assumptions adopted in calculating the model 2 budget
The pilot program is carried out in a specific number of voivodships. The range of voivodships included is not yet defined. The final number depends on the number of PHC clients covered by the pilot scheme and the recruitment of health care units. However, the assumption is that the pilot scheme encompasses all 16 voivodships.
Important parameters of the pilot program include the number of PHC physicians as well as the number of patients under the care of a single PHC physician. These reflect the number of people included in the pilot program. For planning purposes, it is assumed that 150 PHC physicians are included, with 2,000 persons as the average number under the care of a single PHC physician. With time, as the number of responsibilities increases along with progress from servicing the population of clients, the overall number of clients per physician should decline.
Health care units operating within PHC and OSC may take part in the Model 2 pilot program, with the option of subcontracting missing competencies (e.g. individual OSC specializations) in other units. The responsibilities of the Model 2 managing authority can also be carried out by a group of units associated with each other by a consortium agreement. In this situation, there would be a head of the consortium, accountable for the whole of activities of the consortium. The number of facilities implementing the Model 2 pilot scheme is estimated at 25 units in 16 voivodships.
The total number of clients of Model 2 units taking part in the pilot scheme is estimated at 300,000 persons. However, the ultimate number is defined at the stage of submitting the project application. There should be flexibility with the final number of clients of the pilot units, because, in part, it depends on the structure of the client population of the project. It should not be assumed, for example, that the number of clients of the pilot units reduces in conjunction with implementation of the project.
In the Model 2, next to PHC services, all services within the selected areas (specializations) of outpatient specialist care are offered. Within the pilot project, 15 specialist outpatient clinics are chosen along with the resulting number of specialist physicians estimated for 375 persons (ratio of the estimated number of units and the number of specializations).
FINANCING 47 PILOT MODEL 2. IMPLEMENTATION MANUAL
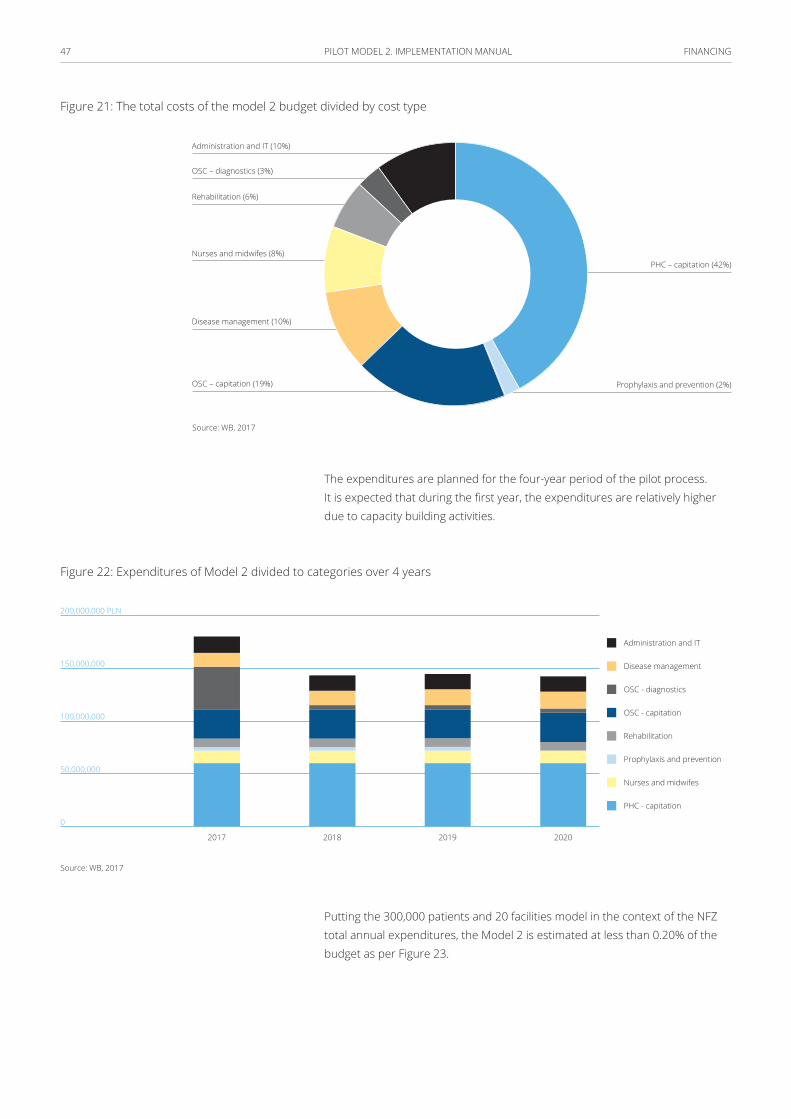
Figure 21: The total costs of the model 2 budget divided by cost type
Administration and IT (10%)
PHC – capitation (42%)
Prophylaxis and prevention (2%)
OSC – diagnostics (3%)
Rehabilitation (6%)
Nurses and midwifes (8%)
Disease management (10%)
OSC – capitation (19%)
Source: WB, 2017
The expenditures are planned for the four-year period of the pilot process. It is expected that during the first year, the expenditures are relatively higher due to capacity building activities.
Figure 22: Expenditures of Model 2 divided to categories over 4 years
200,000,000 PLN
150,000,000
100,000,000
50,000,000
0
2017 2018 2019 2020
Disease management
Administration and IT
OSC - diagnostics
OSC - capitation
PHC - capitation
Prophylaxis and prevention
Nurses and midwifes
Rehabilitation
Source: WB, 2017
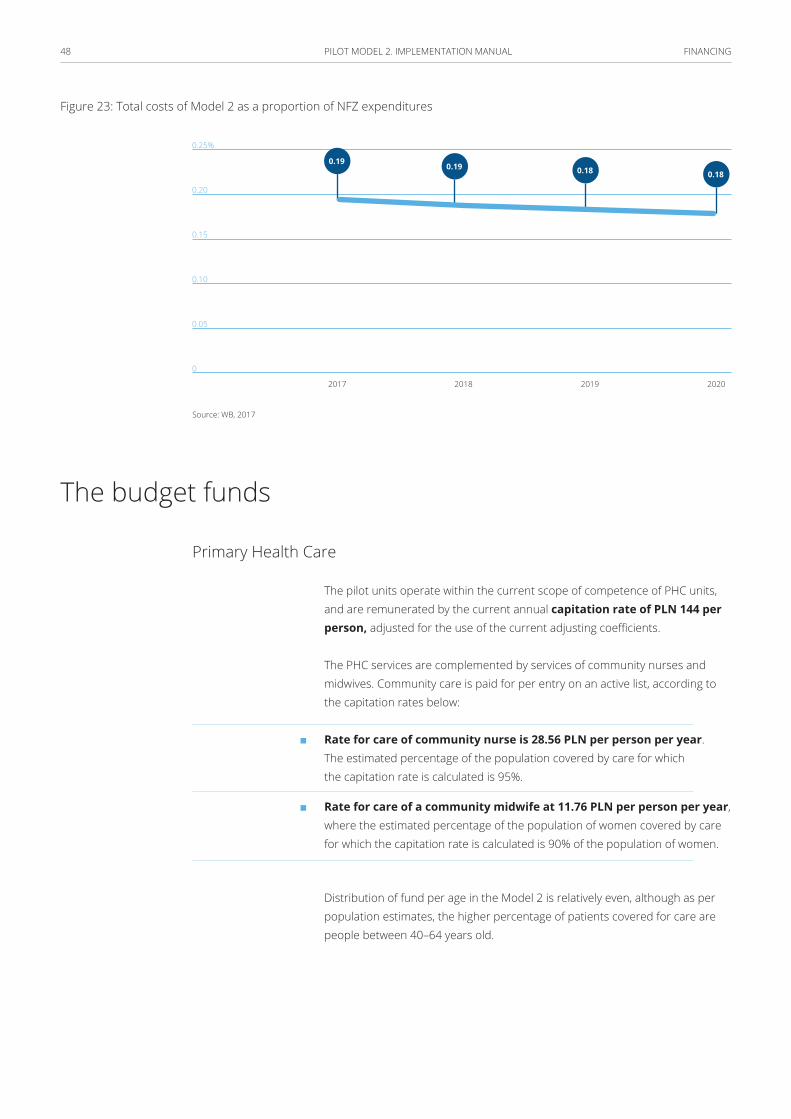
Putting the 300,000 patients and 20 facilities model in the context of the NFZ total annual expenditures, the Model 2 is estimated at less than 0.20% of the budget as per Figure 23.
FINANCING 48 PILOT MODEL 2. IMPLEMENTATION MANUAL
Figure 23: Total costs of Model 2 as a proportion of NFZ expenditures
0.25%
0.20
0.15
0.10
0.05
0
2017 20192018 2020
0.19 0.19 0.18 0.18
Source: WB, 2017
The budget funds
Primary Health Care
The pilot units operate within the current scope of competence of PHC units, and are remunerated by the current annual capitation rate of PLN 144 per person, adjusted for the use of the current adjusting coefficients.
The PHC services are complemented by services of community nurses and midwives. Community care is paid for per entry on an active list, according to the capitation rates below:
■ Rate for care of community nurse is 28.56 PLN per person per year. The estimated percentage of the population covered by care for which the capitation rate is calculated is 95%.
■ Rate for care of a community midwife at 11.76 PLN per person per year, where the estimated percentage of the population of women covered by care for which the capitation rate is calculated is 90% of the population of women.
Distribution of fund per age in the Model 2 is relatively even, although as per population estimates, the higher percentage of patients covered for care are people between 40–64 years old.
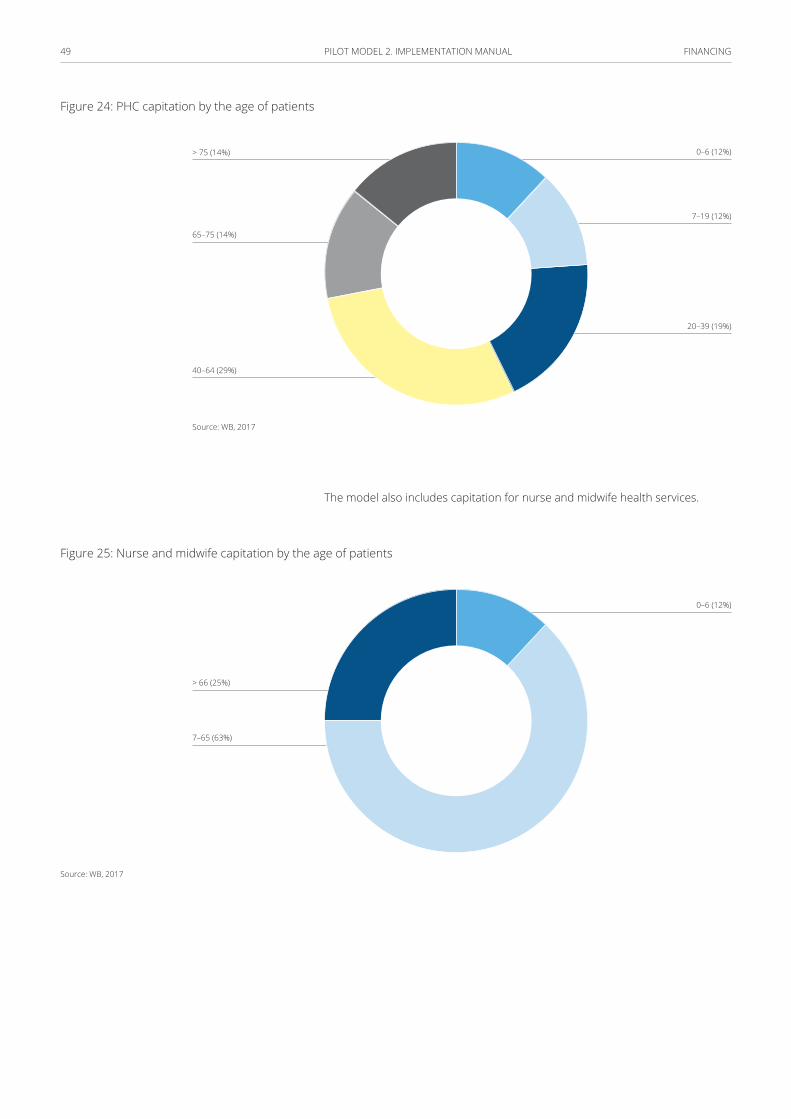
FINANCING 49 PILOT MODEL 2. IMPLEMENTATION MANUAL
Figure 24: PHC capitation by the age of patients
> 75 (14%)
65–75 (14%)
40–64 (29%)
20–39 (19%)
7–19 (12%)
0–6 (12%)
Source: WB, 2017
The model also includes capitation for nurse and midwife health services.
Figure 25: Nurse and midwife capitation by the age of patients
7–65 (63%)
> 66 (25%)
0–6 (12%)
Source: WB, 2017
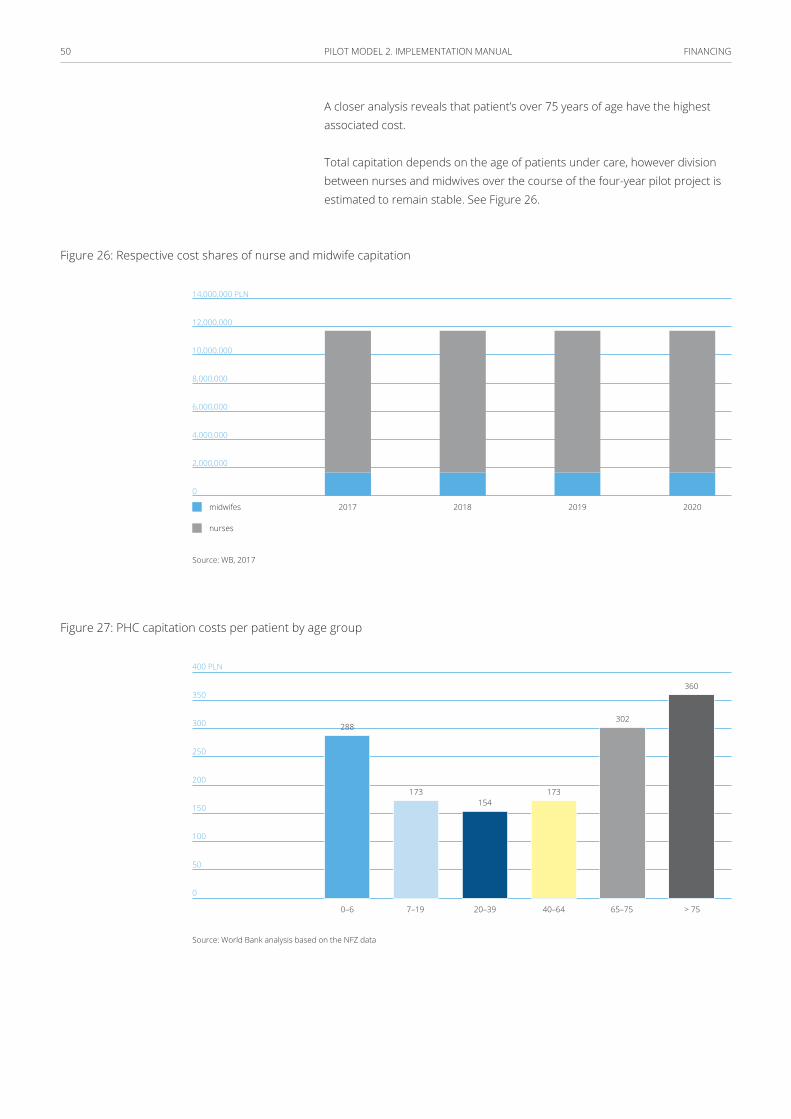
FINANCING 50 PILOT MODEL 2. IMPLEMENTATION MANUAL
A closer analysis reveals that patient’s over 75 years of age have the highest associated cost.
Total capitation depends on the age of patients under care, however division between nurses and midwives over the course of the four-year pilot project is estimated to remain stable. See Figure 26.
Figure 26: Respective cost shares of nurse and midwife capitation
14,000,000 PLN
12,000,000
10,000,000
8,000,000
6,000,000
4,000,000
2,000,000
0
2017 2018 2019 2020midwifes
nurses
Source: WB, 2017
Figure 27: PHC capitation costs per patient by age group
400 PLN
350
300
250
200
150
100
50
0
0–6
288
173154
173
302
360
7–19 20–39 40–64 65–75 > 75
Source: World Bank analysis based on the NFZ data
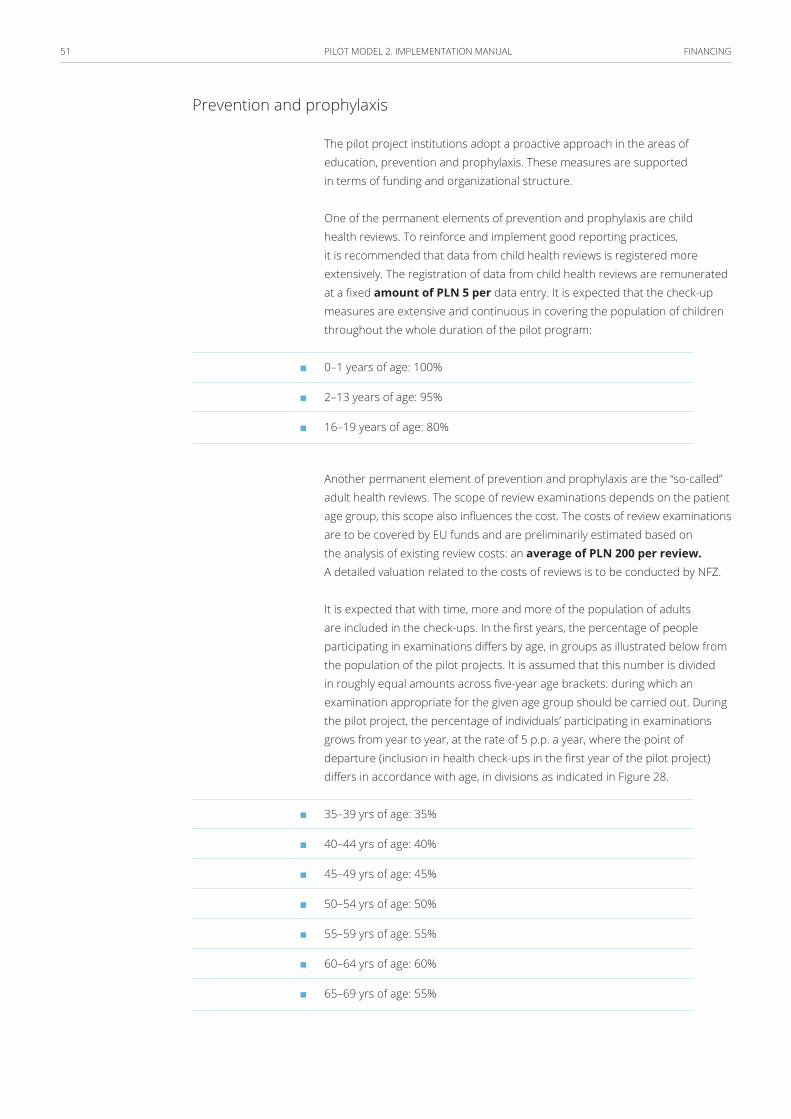
FINANCING 51 PILOT MODEL 2. IMPLEMENTATION MANUAL
Prevention and prophylaxis
The pilot project institutions adopt a proactive approach in the areas of education, prevention and prophylaxis. These measures are supported in terms of funding and organizational structure.
One of the permanent elements of prevention and prophylaxis are child health reviews. To reinforce and implement good reporting practices, it is recommended that data from child health reviews is registered more extensively. The registration of data from child health reviews are remunerated at a fixed amount of PLN 5 per data entry. It is expected that the check-up measures are extensive and continuous in covering the population of children throughout the whole duration of the pilot program:
■ 0–1 years of age: 100%
■ 2–13 years of age: 95%
■ 16–19 years of age: 80%
Another permanent element of prevention and prophylaxis are the “so-called” adult health reviews. The scope of review examinations depends on the patient age group, this scope also influences the cost. The costs of review examinations are to be covered by EU funds and are preliminarily estimated based on the analysis of existing review costs: an average of PLN 200 per review. A detailed valuation related to the costs of reviews is to be conducted by NFZ.
It is expected that with time, more and more of the population of adults are included in the check-ups. In the first years, the percentage of people participating in examinations differs by age, in groups as illustrated below from the population of the pilot projects. It is assumed that this number is divided in roughly equal amounts across five-year age brackets: during which an examination appropriate for the given age group should be carried out. During the pilot project, the percentage of individuals’ participating in examinations grows from year to year, at the rate of 5 p.p. a year, where the point of departure (inclusion in health check-ups in the first year of the pilot project) differs in accordance with age, in divisions as indicated in Figure 28.
■ 35–39 yrs of age: 35%
■ 40–44 yrs of age: 40%
■ 45–49 yrs of age: 45%
■ 50–54 yrs of age: 50%
■ 55–59 yrs of age: 55%
■ 60–64 yrs of age: 60%
■ 65–69 yrs of age: 55%
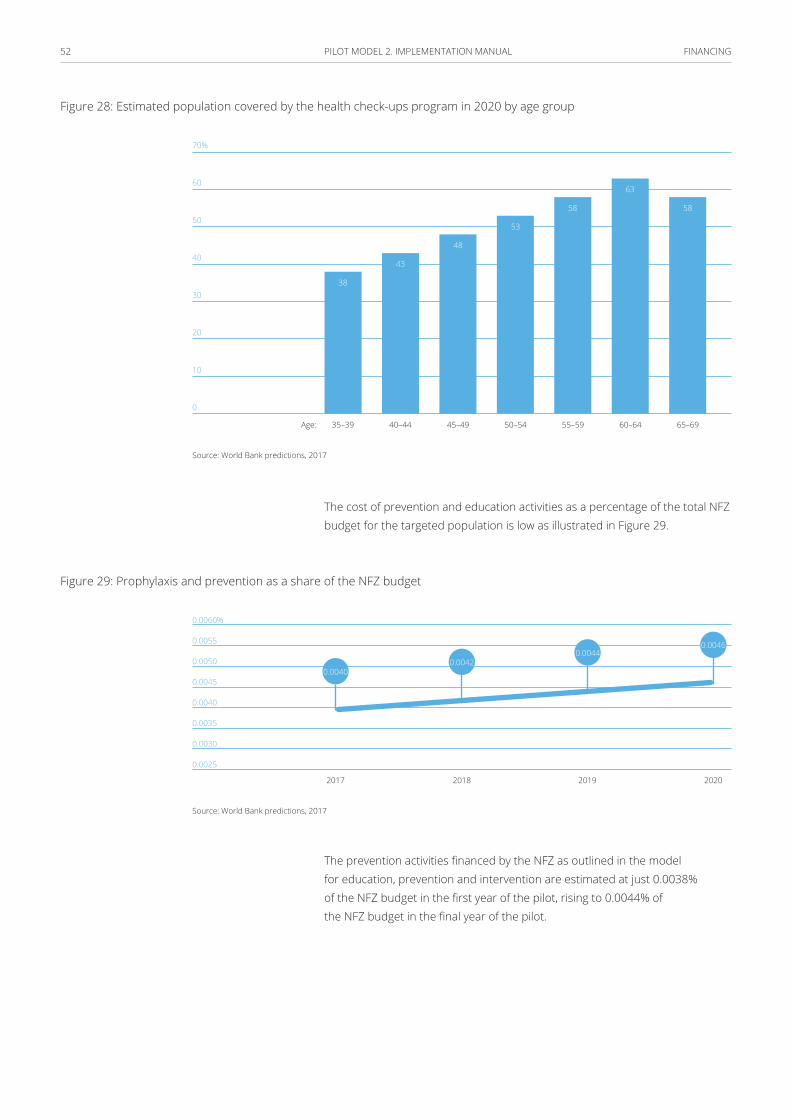
FINANCING 52 PILOT MODEL 2. IMPLEMENTATION MANUAL
Figure 28: Estimated population covered by the health check-ups program in 2020 by age group
70%
60
50
40
30
20
10
0
35–39 45–49 55–5940–44 50–54 60–64 65–69
38
43
48
53
58
63
58
Age:
Source: World Bank predictions, 2017
The cost of prevention and education activities as a percentage of the total NFZ budget for the targeted population is low as illustrated in Figure 29.
Figure 29: Prophylaxis and prevention as a share of the NFZ budget
0.0060%
0.0055
0.0050
0.0045
0.0040
0.0035
0.0030
0.0025
2017 20192018 2020
0.00400.0042
0.00440.0046
Source: World Bank predictions, 2017
The prevention activities financed by the NFZ as outlined in the model for education, prevention and intervention are estimated at just 0.0038% of the NFZ budget in the first year of the pilot, rising to 0.0044% of the NFZ budget in the final year of the pilot.
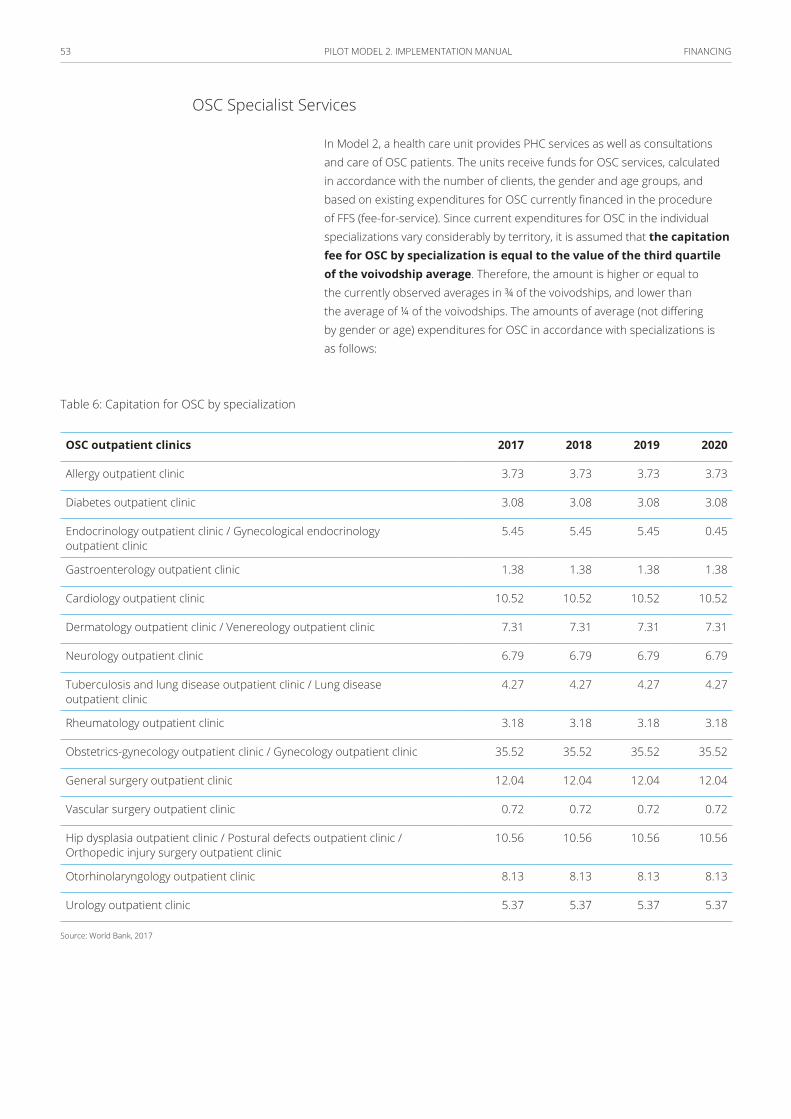
FINANCING 53 PILOT MODEL 2. IMPLEMENTATION MANUAL
OSC Specialist Services
In Model 2, a health care unit provides PHC services as well as consultations and care of OSC patients. The units receive funds for OSC services, calculated in accordance with the number of clients, the gender and age groups, and based on existing expenditures for OSC currently financed in the procedure of FFS (fee-for-service). Since current expenditures for OSC in the individual specializations vary considerably by territory, it is assumed that the capitation fee for OSC by specialization is equal to the value of the third quartile of the voivodship average. Therefore, the amount is higher or equal to the currently observed averages in ¾ of the voivodships, and lower than the average of ¼ of the voivodships. The amounts of average (not differing by gender or age) expenditures for OSC in accordance with specializations is as follows:
Table 6: Capitation for OSC by specialization
OSC outpatient clinics 2017 2018 2019 2020
Allergy outpatient clinic 3.73 3.73 3.73 3.73
Diabetes outpatient clinic 3.08 3.08 3.08 3.08
Endocrinology outpatient clinic / Gynecological endocrinology outpatient clinic
5.45 5.45 5.45 0.45
Gastroenterology outpatient clinic 1.38 1.38 1.38 1.38
Cardiology outpatient clinic 10.52 10.52 10.52 10.52
Dermatology outpatient clinic / Venereology outpatient clinic 7.31 7.31 7.31 7.31
Neurology outpatient clinic 6.79 6.79 6.79 6.79
Tuberculosis and lung disease outpatient clinic / Lung disease outpatient clinic
4.27 4.27 4.27 4.27
Rheumatology outpatient clinic 3.18 3.18 3.18 3.18
Obstetrics-gynecology outpatient clinic / Gynecology outpatient clinic 35.52 35.52 35.52 35.52
General surgery outpatient clinic 12.04 12.04 12.04 12.04
Vascular surgery outpatient clinic 0.72 0.72 0.72 0.72
Hip dysplasia outpatient clinic / Postural defects outpatient clinic / Orthopedic injury surgery outpatient clinic
10.56 10.56 10.56 10.56
Otorhinolaryngology outpatient clinic 8.13 8.13 8.13 8.13
Urology outpatient clinic 5.37 5.37 5.37 5.37
Source: World Bank, 2017
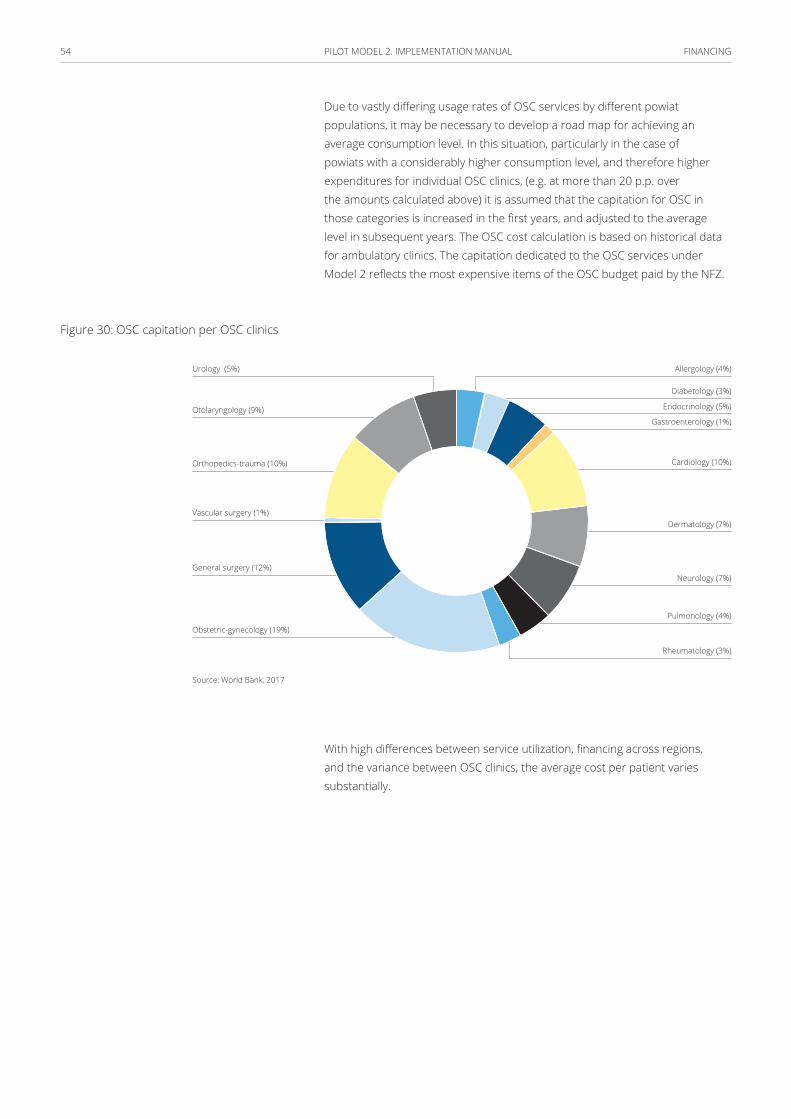
FINANCING 54 PILOT MODEL 2. IMPLEMENTATION MANUAL
Due to vastly differing usage rates of OSC services by different powiat populations, it may be necessary to develop a road map for achieving an average consumption level. In this situation, particularly in the case of powiats with a considerably higher consumption level, and therefore higher expenditures for individual OSC clinics, (e.g. at more than 20 p.p. over the amounts calculated above) it is assumed that the capitation for OSC in those categories is increased in the first years, and adjusted to the average level in subsequent years. The OSC cost calculation is based on historical data for ambulatory clinics. The capitation dedicated to the OSC services under Model 2 reflects the most expensive items of the OSC budget paid by the NFZ.
Figure 30: OSC capitation per OSC clinics
Urology (5%)
Otolaryngology (9%)
Orthopedics-trauma (10%)
Vascular surgery (1%)
General surgery (12%)
Obstetric-gynecology (19%)
Rheumatology (3%)
Pulmonology (4%)
Neurology (7%)
Dermatology (7%)
Cardiology (10%)
Endocrinology (5%)
Gastroenterology (1%)
Diabetology (3%)
Allergology (4%)
Source: World Bank, 2017
With high differences between service utilization, financing across regions, and the variance between OSC clinics, the average cost per patient varies substantially.
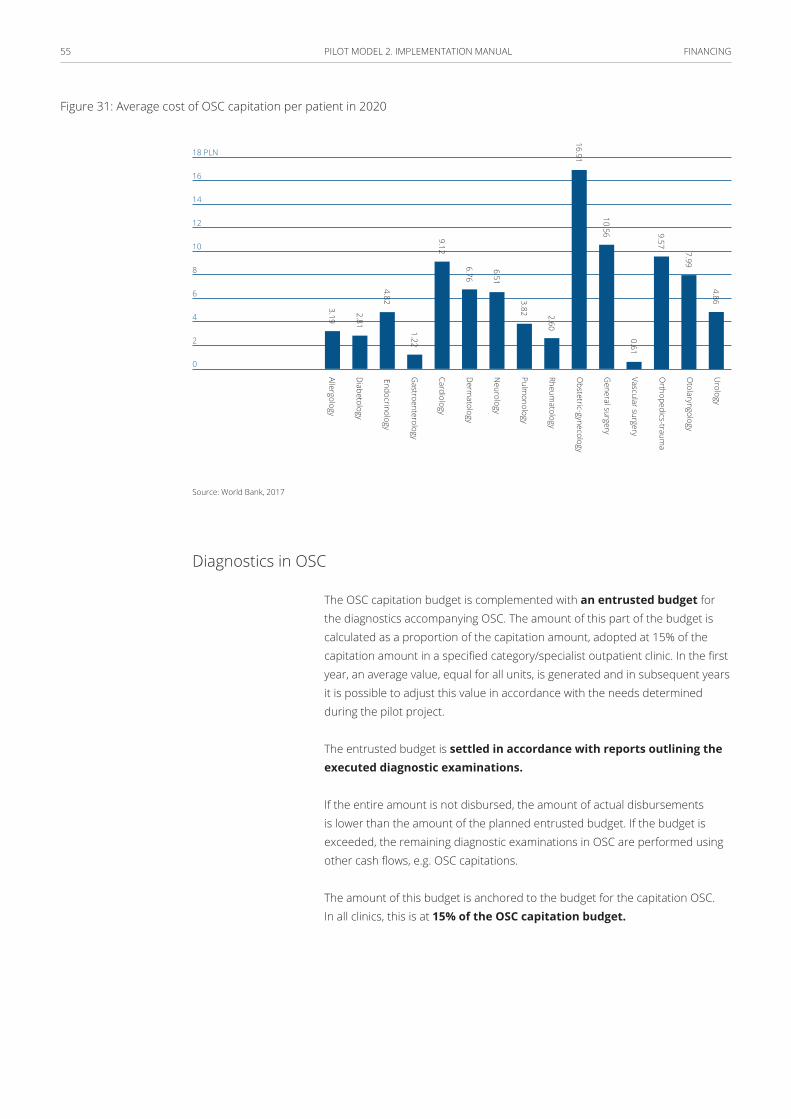
FINANCING 55 PILOT MODEL 2. IMPLEMENTATION MANUAL
Figure 31: Average cost of OSC capitation per patient in 2020
18 PLN
16
14
12
10
8
6
4
2
0
Urology
Otolaryngology
Orthopedics-traum
a
Vascular surgery
General surgery
Obstetric-gynecology
Rheumatology
Pulmonology
Neurology
Derm
atology
Cardiology
Gastroenterology
Endocrinology
Diabetology
Allergology3.19
2.81
4.82
1.22
9.12
6.76
6.51
3.82 2.60
10.56
0.61
9.57
7.99
4.86
16.91
Source: World Bank, 2017
Diagnostics in OSC
The OSC capitation budget is complemented with an entrusted budget for the diagnostics accompanying OSC. The amount of this part of the budget is calculated as a proportion of the capitation amount, adopted at 15% of the capitation amount in a specified category/specialist outpatient clinic. In the first year, an average value, equal for all units, is generated and in subsequent years it is possible to adjust this value in accordance with the needs determined during the pilot project.
The entrusted budget is settled in accordance with reports outlining the executed diagnostic examinations.
If the entire amount is not disbursed, the amount of actual disbursements is lower than the amount of the planned entrusted budget. If the budget is exceeded, the remaining diagnostic examinations in OSC are performed using other cash flows, e.g. OSC capitations.
The amount of this budget is anchored to the budget for the capitation OSC. In all clinics, this is at 15% of the OSC capitation budget.
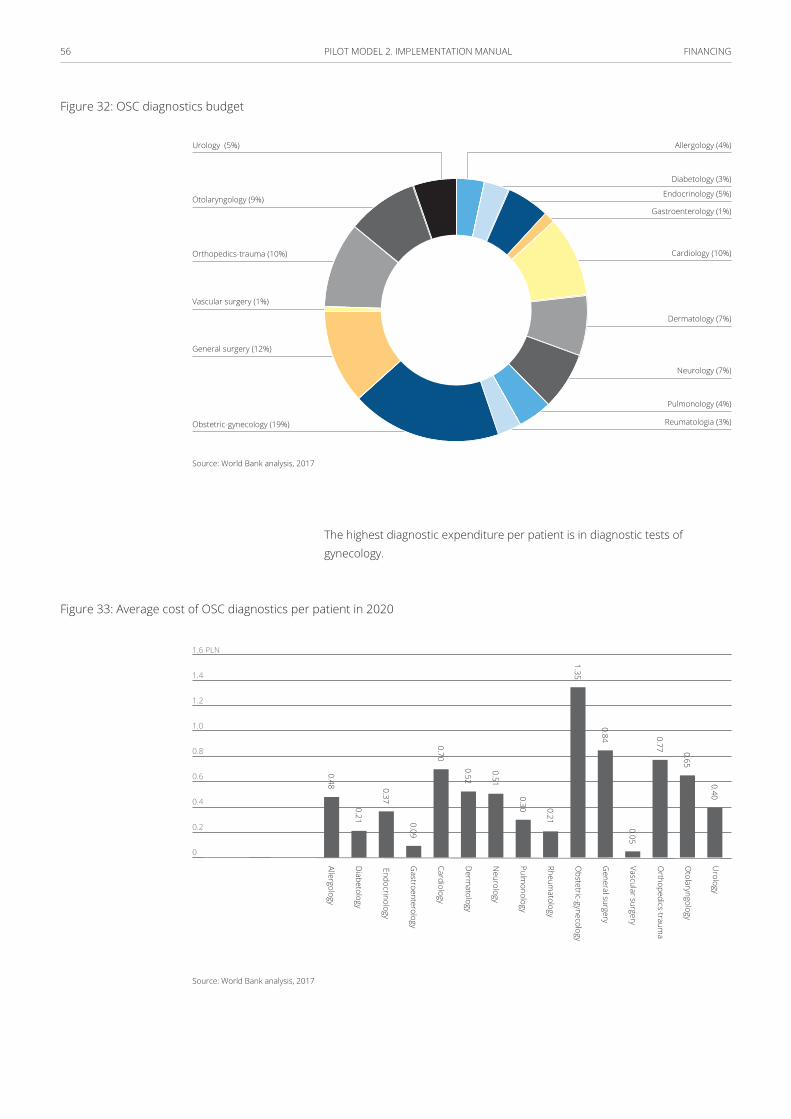
FINANCING 56 PILOT MODEL 2. IMPLEMENTATION MANUAL
Figure 32: OSC diagnostics budget
Urology (5%)
Otolaryngology (9%)
Orthopedics-trauma (10%)
Vascular surgery (1%)
General surgery (12%)
Obstetric-gynecology (19%) Reumatologia (3%)
Pulmonology (4%)
Neurology (7%)
Dermatology (7%)
Cardiology (10%)
Gastroenterology (1%)
Endocrinology (5%)
Diabetology (3%)
Allergology (4%)
Source: World Bank analysis, 2017
The highest diagnostic expenditure per patient is in diagnostic tests of gynecology.
Figure 33: Average cost of OSC diagnostics per patient in 2020
1.6 PLN
1.4
1.2
1.0
0.8
0.6
0.4
0.2
0
Urology
Otolaryngology
Orthopedics-traum
a
Vascular surgery
General surgery
Obstetric-gynecology
Rheumatology
Pulmonology
Neurology
Derm
atology
Cardiology
Gastroenterology
Endocrinology
Diabetology
Allergology0.48
0.21
0.37
0.09
0.70
0.52
0.51
0.30 0.21
1.35
0.84
0.05
0.77 0.65
0.40
Source: World Bank analysis, 2017
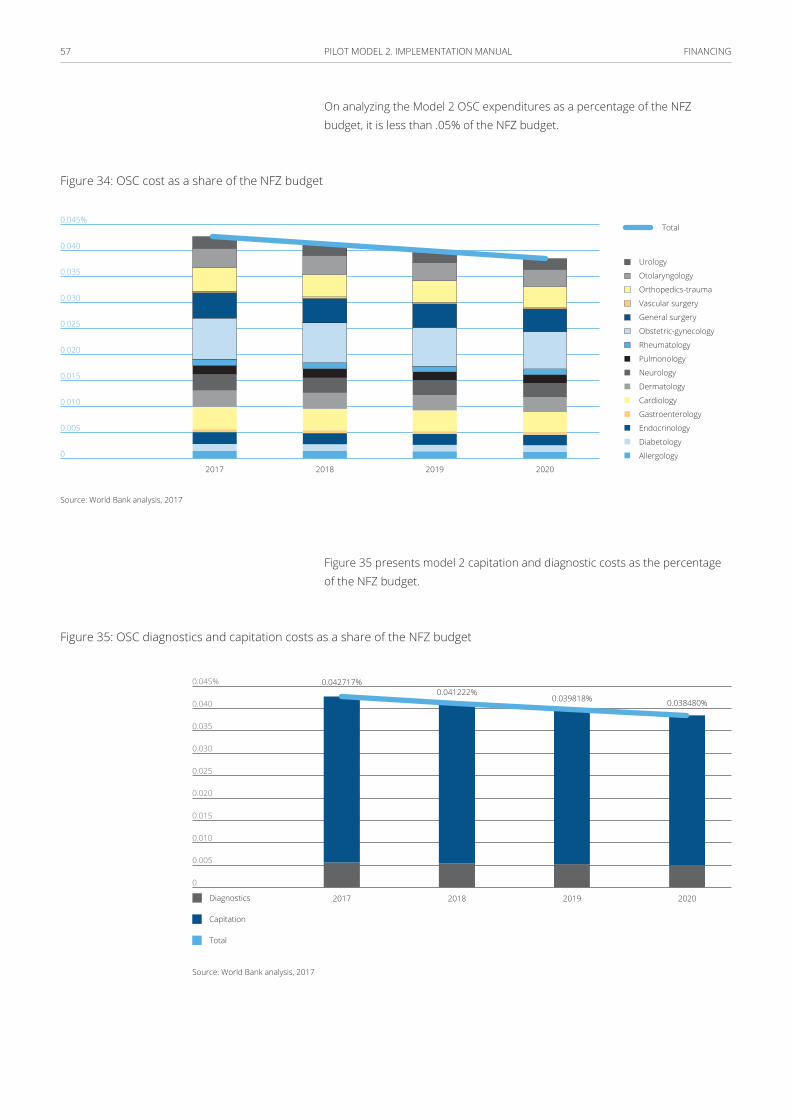
FINANCING 57 PILOT MODEL 2. IMPLEMENTATION MANUAL
On analyzing the Model 2 OSC expenditures as a percentage of the NFZ budget, it is less than .05% of the NFZ budget.
Figure 34: OSC cost as a share of the NFZ budget
0.045%
0.040
0.035
0.030
0.025
0.020
0.015
0.010
0.005
0
2017 20192018 2020
Urology
Otolaryngology
Orthopedics-trauma
Vascular surgery
General surgery
Obstetric-gynecology
Rheumatology
Pulmonology
Neurology
Dermatology
Cardiology
Gastroenterology
Endocrinology
Diabetology
Allergology
Total
Source: World Bank analysis, 2017
Figure 35 presents model 2 capitation and diagnostic costs as the percentage of the NFZ budget.
Figure 35: OSC diagnostics and capitation costs as a share of the NFZ budget
0.045%
0.040
0.035
0.030
0.025
0.020
0.015
0.010
0.005
0
2017
0.042717%0.041222%
0.039818% 0.038480%
2018 2019 2020
Capitation
Total
Diagnostics
Source: World Bank analysis, 2017

FINANCING 58 PILOT MODEL 2. IMPLEMENTATION MANUAL
Disease Management Program (DMP)
The units in the pilot project launch a disease management scheme for selected chronic diseases. For participating in a DMP there is the possibility of settling certain types of services in the FFS (fee-for-service) model.
In the first period, the list of diseases where DMP can be applied is limited to 26 disease entities/conditions. Below is a list of these conditions, along with the estimated percentage of sick persons in the population.
The cost structure by age is estimated in the Figure 36 below:
Figure 36: Cost of disease management by age
0–9 (8%)
10–19 (6%)
20–29 (5%)
30–39 (7%)
40–49 (6%)
50–59 (20%)60–69 (20%)
70–79 (17%)
80–89 (10%)
90–100 (1%)
Source: World Bank analysis, 2017
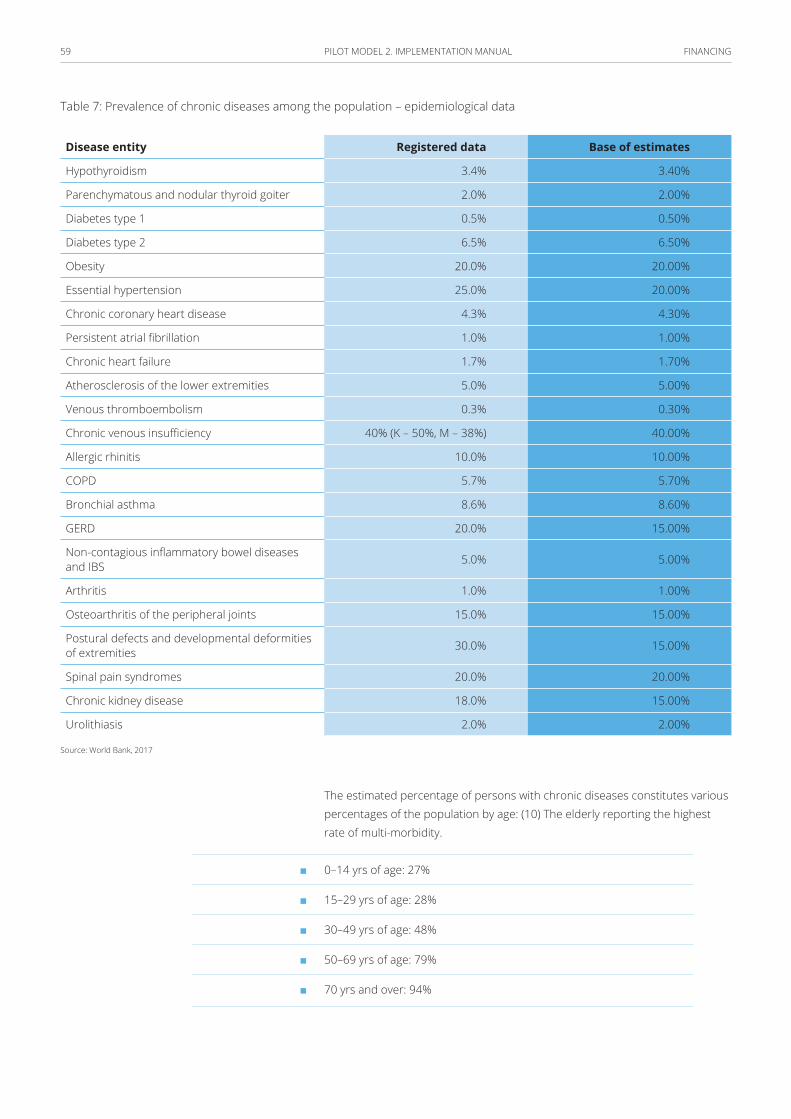
FINANCING 59 PILOT MODEL 2. IMPLEMENTATION MANUAL
Table 7: Prevalence of chronic diseases among the population – epidemiological data
Disease entity Registered data Base of estimates
Hypothyroidism 3.4% 3.40%
Parenchymatous and nodular thyroid goiter 2.0% 2.00%
Diabetes type 1 0.5% 0.50%
Diabetes type 2 6.5% 6.50%
Obesity 20.0% 20.00%
Essential hypertension 25.0% 20.00%
Chronic coronary heart disease 4.3% 4.30%
Persistent atrial fibrillation 1.0% 1.00%
Chronic heart failure 1.7% 1.70%
Atherosclerosis of the lower extremities 5.0% 5.00%
Venous thromboembolism 0.3% 0.30%
Chronic venous insufficiency 40% (K – 50%, M – 38%) 40.00%
Allergic rhinitis 10.0% 10.00%
COPD 5.7% 5.70%
Bronchial asthma 8.6% 8.60%
GERD 20.0% 15.00%
Non-contagious inflammatory bowel diseases and IBS 5.0% 5.00%
Arthritis 1.0% 1.00%
Osteoarthritis of the peripheral joints 15.0% 15.00%
Postural defects and developmental deformities of extremities 30.0% 15.00%
Spinal pain syndromes 20.0% 20.00%
Chronic kidney disease 18.0% 15.00%
Urolithiasis 2.0% 2.00%
Source: World Bank, 2017
The estimated percentage of persons with chronic diseases constitutes various percentages of the population by age: (10) The elderly reporting the highest rate of multi-morbidity.
■ 0–14 yrs of age: 27%
■ 15–29 yrs of age: 28%
■ 30–49 yrs of age: 48%
■ 50–69 yrs of age: 79%
■ 70 yrs and over: 94%
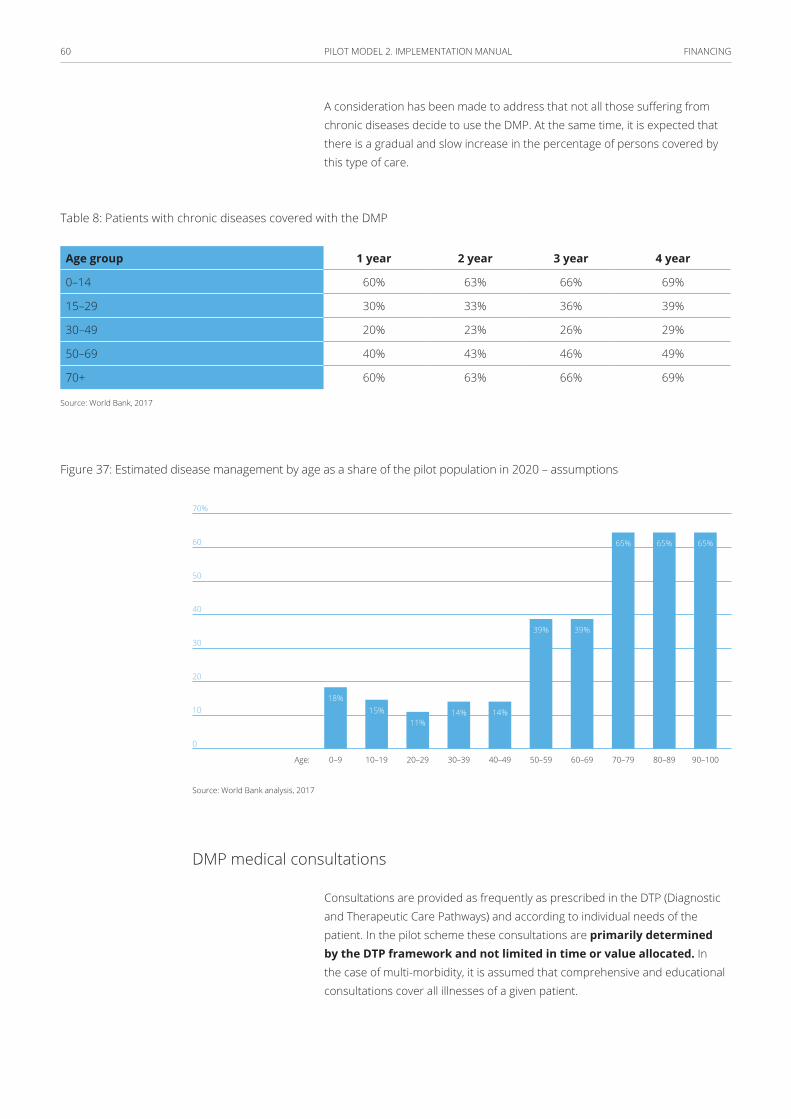
FINANCING 60 PILOT MODEL 2. IMPLEMENTATION MANUAL
A consideration has been made to address that not all those suffering from chronic diseases decide to use the DMP. At the same time, it is expected that there is a gradual and slow increase in the percentage of persons covered by this type of care.
Table 8: Patients with chronic diseases covered with the DMP
Age group 1 year 2 year 3 year 4 year
0–14 60% 63% 66% 69%
15–29 30% 33% 36% 39%
30–49 20% 23% 26% 29%
50–69 40% 43% 46% 49%
70+ 60% 63% 66% 69%
Source: World Bank, 2017
Figure 37: Estimated disease management by age as a share of the pilot population in 2020 – assumptions
70%
60
50
40
30
20
10
0
0–9
18%15%
11%14% 14%
39% 39%
65% 65% 65%
40–4920–29 60–69 80–8910–19 50–5930–39 70–79 90–100Age:
Source: World Bank analysis, 2017
DMP medical consultations
Consultations are provided as frequently as prescribed in the DTP (Diagnostic and Therapeutic Care Pathways) and according to individual needs of the patient. In the pilot scheme these consultations are primarily determined by the DTP framework and not limited in time or value allocated. In the case of multi-morbidity, it is assumed that comprehensive and educational consultations cover all illnesses of a given patient.

FINANCING 61 PILOT MODEL 2. IMPLEMENTATION MANUAL
The cost associated with the DMP differ substantially by age: people age 60 and above would constitute the highest costs.
Figure 38: Cost of the DMP scheme by age and type of consultations
3,500,000 PLN
3,000,000
2,500,000
2,000,000
1,500,000
1,000,000
500,000
0
0–9 40–4920–29 60–69 80–8910–19Age: 50–5930–39 70–79 90–100
Complex medical consultationsEducational consultations (dealing with disease, dietary, etc.)
Source: World Bank analysis, 2017
In the pilot project the optimal frequencies of these consultations should be defined, along with other actions not covered by the FFS method. The types of consultations and the rates for these are presented below. Diagnostic tests following a complex consultation are financed from the entrusted budget for OSC diagnostics.
Table 9: Consultations, frequency, and rate
Unit pricePLN
Estimated frequencyperson/year
Comprehensive medical consultations 120 1
Educational consultations (coping with disease, dietary advice etc.)
40 2
Source: World Bank, 2017
In the case of multi-morbidity, comprehensive and educational consultations are performed for a given patient collectively, in association with all his/her ailments and separately. A complex consultation is provided no more than once a year, the projected reduction indicator of the frequencies of consultations appears as below. The indicator has been applied in the model by reducing accordingly the number of the individual types of consultations.

FINANCING 62 PILOT MODEL 2. IMPLEMENTATION MANUAL
Table 10: Reduction indicator of complex consultations
Reduction indicator Number of consultations following reduction
Complex medical consultations 0.75 0.75
Educational consultations (coping with disease, dietary advice etc.)
0.75 1.50
Source: World Bank, 2017
The DMP as a percentage of total expenditure of the NFZ in Model 2 is below 0.020% of the NFZ estimated budget.
Figure 39: Disease management costs structure as a share of NFZ budget
0.025%
0.020
0.015
0.010
0.005
0
2017
0.011%
0.007% 0.007% 0.008% 0.008%
0.011% 0.011% 0.011%
2018 2019 2020
TotalComplex medical consultations
Educational consultations (dealing with disease, dietary etc.)
0.018%0.018% 0.019% 0.019%
Source: World Bank, 2017
Rehabilitation
The pilot project institutions can avail of funds to be used for specific rehabilitation services. Although initially, the specified scope of care only covers rehabilitation in spinal pain syndromes and osteoarthritis of the peripheral joints. The criteria of inclusion and the scope of services is determined in a separate document.
The organization and coordination of rehabilitation services is the responsibility of pilot project institutions. The maximum budget for acquiring these services is fixed and calculated based on the current level of use of physiotherapy services by age groups, as below:
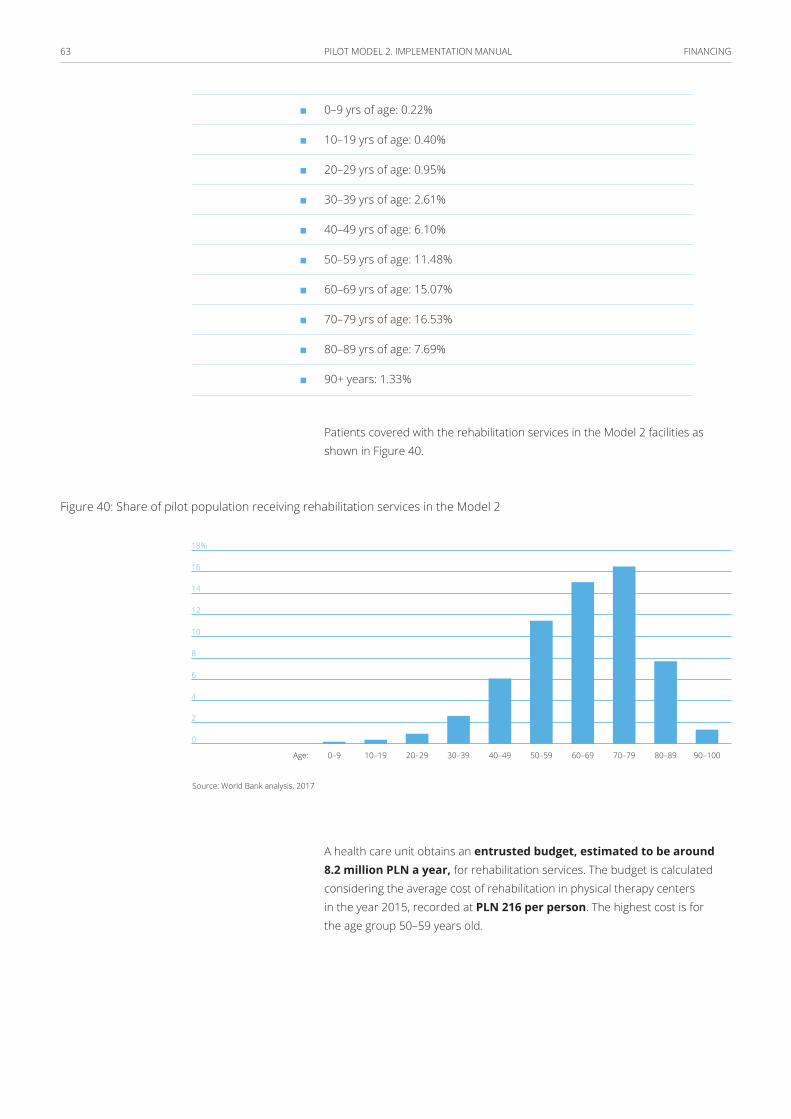
FINANCING 63 PILOT MODEL 2. IMPLEMENTATION MANUAL
■ 0–9 yrs of age: 0.22%
■ 10–19 yrs of age: 0.40%
■ 20–29 yrs of age: 0.95%
■ 30–39 yrs of age: 2.61%
■ 40–49 yrs of age: 6.10%
■ 50–59 yrs of age: 11.48%
■ 60–69 yrs of age: 15.07%
■ 70–79 yrs of age: 16.53%
■ 80–89 yrs of age: 7.69%
■ 90+ years: 1.33%
Patients covered with the rehabilitation services in the Model 2 facilities as shown in Figure 40.
Figure 40: Share of pilot population receiving rehabilitation services in the Model 2
18%
16
14
12
10
8
6
4
2
0
0–9 40–4920–29 60–69 80–8910–19 50–5930–39 70–79 90–100Age:
Source: World Bank analysis, 2017
A health care unit obtains an entrusted budget, estimated to be around 8.2 million PLN a year, for rehabilitation services. The budget is calculated considering the average cost of rehabilitation in physical therapy centers in the year 2015, recorded at PLN 216 per person. The highest cost is for the age group 50–59 years old.
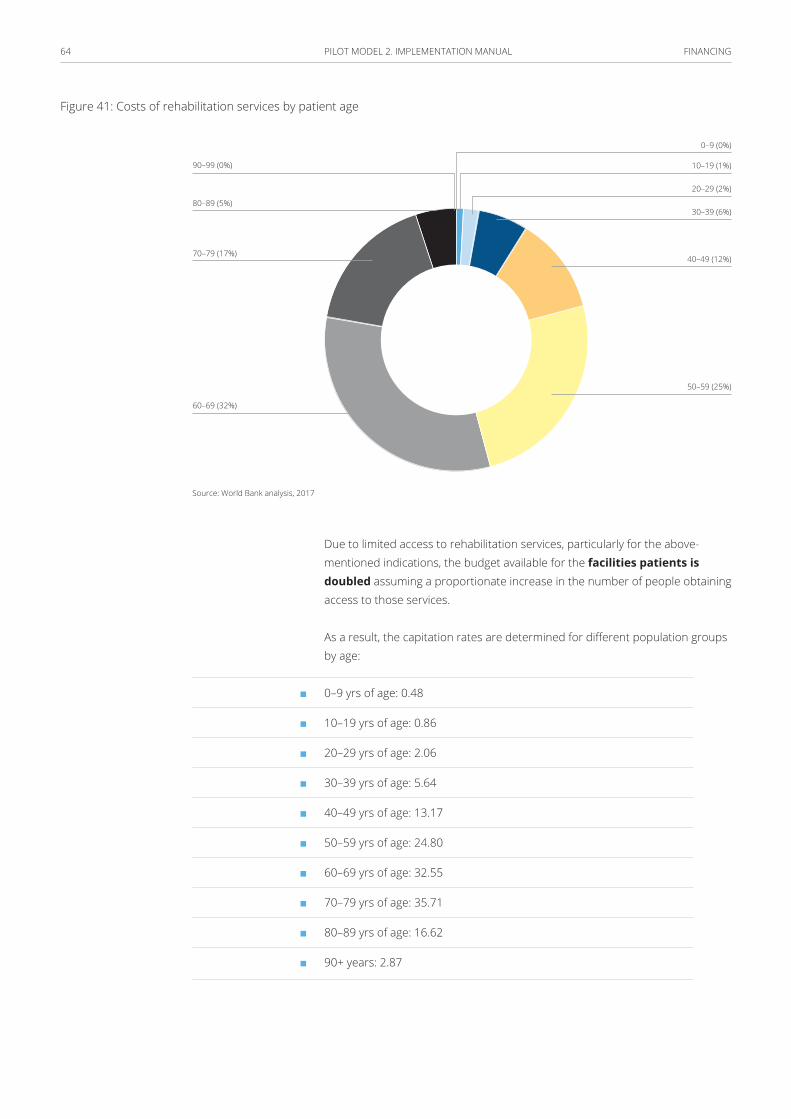
FINANCING 64 PILOT MODEL 2. IMPLEMENTATION MANUAL
Figure 41: Costs of rehabilitation services by patient age
30–39 (6%)
20–29 (2%)
10–19 (1%)
0–9 (0%)
40–49 (12%)
50–59 (25%)
60–69 (32%)
70–79 (17%)
80–89 (5%)
90–99 (0%)
Source: World Bank analysis, 2017
Due to limited access to rehabilitation services, particularly for the above-mentioned indications, the budget available for the facilities patients is doubled assuming a proportionate increase in the number of people obtaining access to those services.
As a result, the capitation rates are determined for different population groups by age:
■ 0–9 yrs of age: 0.48
■ 10–19 yrs of age: 0.86
■ 20–29 yrs of age: 2.06
■ 30–39 yrs of age: 5.64
■ 40–49 yrs of age: 13.17
■ 50–59 yrs of age: 24.80
■ 60–69 yrs of age: 32.55
■ 70–79 yrs of age: 35.71
■ 80–89 yrs of age: 16.62
■ 90+ years: 2.87
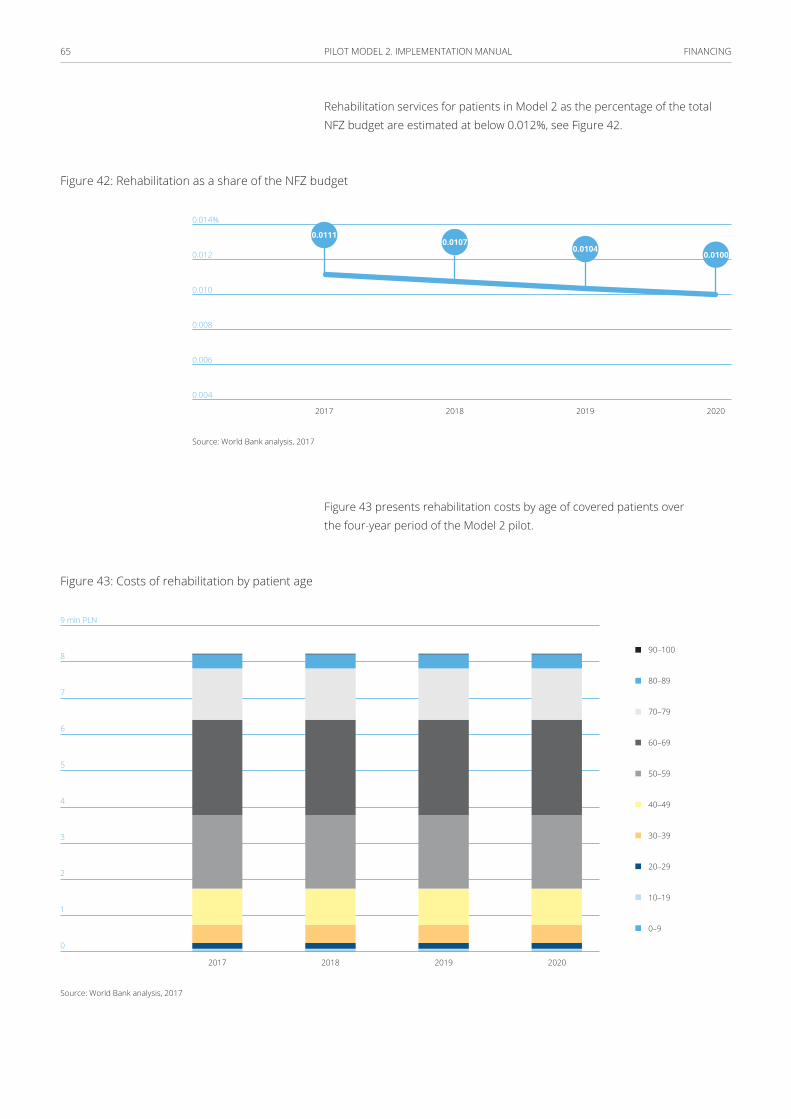
FINANCING 65 PILOT MODEL 2. IMPLEMENTATION MANUAL
Rehabilitation services for patients in Model 2 as the percentage of the total NFZ budget are estimated at below 0.012%, see Figure 42.
Figure 42: Rehabilitation as a share of the NFZ budget
0.014%
0.012
0.010
0.008
0.006
0.004
2017 2018 2019 2020
0.01110.0107
0.01040.0100
Source: World Bank analysis, 2017
Figure 43 presents rehabilitation costs by age of covered patients over the four-year period of the Model 2 pilot.
Figure 43: Costs of rehabilitation by patient age
9 mln PLN
8
7
6
5
4
3
2
1
0
0–9
10–19
20–29
30–39
40–49
50–59
60–69
70–79
80–89
90–100
2017 2018 2019 2020
Source: World Bank analysis, 2017

FINANCING 66 PILOT MODEL 2. IMPLEMENTATION MANUAL
The Technological and Administrative Subsidy
Units participating in the pilot scheme are obligated to implement and use IT systems to register PHC data, and to exchange electronic information with other institutions and with the payer. It is necessary to carry out investment to transition to these enhanced IT systems (an assumption is that basic IT infrastructure already exists). The development of IT systems, including tele-consultation desks, is compensated with a technological allowance of 50,000 PLN paid out incrementally throughout the pilot period.
The value of the technological allowance is anchored to market prices of hardware and software per doctor and supporting personnel (nurse, receptionist, coordinator) work stations. The value of the allowance for a given institution depends on the number of PHC patients (2,000 on average). The allowance is paid in quarters over a four-year period.
OSC specialist physicians participating in the pilot program are obligated to work with electronic medical documentation and receive a technological subsidy. The amount for investment in the development of the IT system at an OSC specialist’s workplace is established at PLN 20,000 disbursed throughout the pilot period.
Institutions participating in the pilot project must carry out some additional administrative and coordination functions, especially related to recruitment for prophylactic tests, organizing services for patients in DM programs, etc. To cover some of these measures, the institutions receive funds calculated per person in care, estimating the necessity to employ one person per approximately 1,500 patients. The gross remuneration for one individual performing administrative supervision and coordination is estimated at PLN 5 000 per month.
Disbursement of funds
To correctly set incentives for providers, the per-capita payment should be in line with current contractual arrangements between the NFZ and providers. Additional capitation and performance based payments are divided into four payments, paid on a quarterly basis and structured as follows:
When a patient with a chronic condition from the Model 2 selected diseases uses specialized care payable under separate OSC contracts, a portion of the additional amount in the capitation rate corresponding to the cost of care for that patient under Model 2 is to be withheld for a 6-month period, counting from each billed OSC consultation. The withholding comes into effect on the date on which the service provider is informed by the payer about accrued situation. During that period, the patient is not eligible for Model 2 category services.

FINANCING 67 PILOT MODEL 2. IMPLEMENTATION MANUAL
Performance-based budget
A performance-based budget should be allocated to unit-based billing of the following services:
■ coordinated preventive and educational programs (see annex 1);
■ selected services in chronic conditions from DM category:
– comprehensive consultations, and
– specialist consultations: doctor-doctor, doctor-patient, including tele-consultations;
■ physiotherapy consultations.
Performance-based budgeting
A separate performance-based budget should be allocated to unit-based settlement of services for preventive and educational programs as well as physiotherapy programs. The provider may refrain from implementing the physiotherapy programs in the first year of the pilot due to organizational reasons.
Additional OSC Scope
Flexibility is encouraged when considering the addition of successive scopes of OSC services, as well as more outpatient clinics than the above-mentioned 15. Payment for successive scopes is determined by capitation, possibly with additional funds apportioned for diagnostics. Below is a preliminary list of such scopes of services
■ Psychiatry
■ TC Diagnostics
■ MRI Diagnostics
■ Dental care for children and young people (including school dental care)
Implementation of integrated care incentives
For implementing integrated care, different incentives can be introduced for the following stakeholders: (i) for healthcare professionals: professional ethics, organizational cultures or financial incentives; (ii) for patients: to maximize health or financial incentives, and; (iii) for NFZ: social codes, social responsibility and financial incentives.
FINANCING 68 PILOT MODEL 2. IMPLEMENTATION MANUAL
Based on the initial development and evaluation of the model’s implementation, it is possible to incorporate patient incentives into integrated care models. Patient incentives can be: personalized health care plans, health self-management applications, discounted gym memberships, and reductions to some out-of-pocket expenditures.
Bonus for results
It is possible for the pilot to introduce and develop measures that assess the quality of care and outcomes that can potentially be analyzed by the NFZ to trigger an additional bonus, e.g. in the form of an increased capitation rate coefficient. Some potential parameters include:
■ percentage of selected screening tests performed,
■ percentage of patients with chronic conditions from the Model 1 category who had a comprehensive consultation during the last year, and
■ patient satisfaction survey results.
These indicators can be used as the basis for a bonus calculation, improvement vs. previous results, or in comparison to other service providers involved in the pilot program (the benchmark).
These tools may additionally be used as benchmarks for quality and result generation across facilities, and therefore incentivize facilities to improve their performance and share lessons learnt during the initial period of the pilot scheme.
ReportingService performance reports are submitted to the NFZ once a month, via robust software of the payer (e.g., an appropriate modification of the Service Provider Portal). Reports are submitted in a personalized mode, per patient and per medical professional, including information on the locality that provided the service.
Scope of reporting requirements:
■ Patients covered by the standard PHC contract;
■ OMC patients:
– data required to determine the capitation rate;
– services provided in each area (PHC, OSC, REH), including those payable separately under performance budgeting, and;
– diagnostic tests from the OMC package.
FINANCING 69 PILOT MODEL 2. IMPLEMENTATION MANUAL
Based on monthly reports drafted and submitted by the service provider, the NFZ sends back the reports encompassing the following numbers and volumes, inter alia:
■ patients with confirmed OMC declarations,
■ confirmed services financed separately under performance budgeting, and
■ OSC services provided to the ‘enrolled’ patients (with declarations) outside of the OMC system – with the information where the service was provided, by whom, when, and for how much.
To be considered: application of the ICPC (International Classification for Primary Care) for OMC reporting purposes.
70 PILOT MODEL 2. IMPLEMENTATION MANUAL
Readiness and capacity building of providers
Implementation support
There is a need to create a set of implementation tools that support the integrated care pilots. The tools can vary in their stages of development with those currently under development by the NFZ such as clinical paths, communication tools between provider and patient, prevention and intervention tools, management tools, as well as newly conceptualized tools for rules and control systems, gathering of data and monitoring and evaluation of the models. This is considered a separate activity, one of the very first to be undertaken throughout the pilot model implementation and continued over the course of the pilot’s implementation. The Polish working version of the implementation manual for the providers can be found in Annex 4.
This component finances providers’ readiness, technical assistance and capacity building in implementing the new package of services. This component finances the following:
■ improvements in the basic capacity of providers and areas where shortages of supply are hindering the delivery of the extended package, primarily through: the hiring of additional health workers, providing new and upgraded medical equipment supporting the delivery of the package, but excluding investments in infrastructure or complex equipment;
■ short-term refresher courses for training healthcare professionals in: diagnosing and delivering of newly introduced expanded packages, clinical protocols, technical on the job training, and use of equipment. Special emphasis is given to training staff on shifting the service delivery model from its current focus on curative care to prevention and education;
■ technical assistance and personnel training that support program management such as contract management, monitoring and reporting requirements, and;
■ upgrading and expanding the health information system and training of staff in the use of software.
The capacity building activities can be implemented as separate trainings and support finances under EU funded projects.
The capacity building activities should be designed and implemented by the PIU.
READINESS AND CAPACITy BUILDING OF PROVIDERS 71 PILOT MODEL 2. IMPLEMENTATION MANUAL
Management and Development of Competence of the Payer
The payer, who is a beneficiary of the project, conducts activities related to project management as part of the project implementation unit (PIU), and develops competencies in terms of acquiring, controlling and managing care in the system of coordinated health care.
Employing committed individuals aids the development of the beneficiary’s competencies, before the employed individuals then become core elements of the payer’s structure in the future. The payer develops the model of coordinated care on a national level, and is equipped with new IT tools for serving the pilot project as well as new functions not implemented at present e.g. documentation exchange, recording medical data.
Patient Stratification Tools:
Case finding – an approach that identifies the population for a specific purpose or
treatment e.g. smokers for prevention purposes, the elderly for flu vaccination, etc. (11)
Population segmentation – Population segmentations is the action of grouping the
cohort population based on, both, the kind and the frequency of care required. (12)
Most physicians segment their population intuitively to deliver better care and prevention, e.g. patients over 75 years old, patients with diabetes. There are many reasons for which grouping the population this way is important, including to understand the needs of different population groups, to define the combination of care people need, to enable prioritization, and to allow new models of incentives for the providers. It also allows for better monitoring and redesigning of the approach. There are four approaches to population segmentation:
■ Risk stratification (Utilization risk)
■ Age and condition
■ Social and demographic factors
■ Behavior
The first and the second approach are the most common.

READINESS AND CAPACITy BUILDING OF PROVIDERS 72 PILOT MODEL 2. IMPLEMENTATION MANUAL
A core rule of population segmentation is that the combined set of unique segments must include the entire cohort population: meaning that at every stage of an individual’s lifecycle, the person should be represented in just one segment. People in the same segment must have similar health needs, type and frequency of care, and healthcare priorities. At the same time, each segment should have distinct characteristics that differ from the other segments. If these two criteria are not met in the segmentation, it proves to be impractical or misleading for the provider. (13)
Healthcare managers and care coordinators must ensure that all the services and care provided to the segmented clusters reasonably meets the needs of every individual in that grouping. (14)
Stratification
Risk stratification is defined as “a statistical process to determine detectable characteristics associated with an increased chance of experiencing unwanted outcomes” (14)
For better management of patients, some elements of risk stratification and disease management should be introduced. A separate risk management model needs to be designed.
Risk Stratification is a systematic tool that predicts how the population (or a subgroup of the population) is going to utilize the services and who is most at risk of deterioration or needing higher levels of care.
There are several methods used for risk stratification, however, they are all based to some extent on a co-morbidity assessment: comorbidity being the presence of one or more conditions in a patient. Comorbidities can cause increases in risks and costs of care. It is estimated that a patient with comorbid chronic conditions can cost up to seven times more than a patient with a single chronic condition. It is useful for the health care coordinator/manager to know which patients suffer from multiple chronic diseases. A key benefit of risk stratification, apart from identifying care recipients from a cohort, is creating a communication platform and setting mutual goals between the patients and providers as well as facilitating coordination between the different healthcare providers.
Although risk stratification is widely used, it holds a disadvantage of focusing on acute care. Therefore, the risk groupings may not be stable on yearly basis. Moreover, risk prediction tools alone have no impact on health outcomes of the population, they require combination with the proper interventions and behavioral change stemming from the risk assessment. (15)
READINESS AND CAPACITy BUILDING OF PROVIDERS 73 PILOT MODEL 2. IMPLEMENTATION MANUAL
Age and condition segmentation
In this approach, the population is first divided into age groups, and then into subgroups relating to their conditions. This approach is preferred by many integrated care providers as it is easy to define and understand, and remains moderately constant throughout time. Despite many advantages, the downsides of this approach include potential for disagreement on the “right” boundaries used for creating the segments. This may cloud the effectiveness of the segments in determining the right care for the grouped individuals.
To perform a valid and reliable age-and-condition segmentation, it is important to include the following in the analysis: (16)
■ judgement of multiple professionals, e.g. medical, social, public health, and other stakeholders;
■ an in-depth analysis of the integrated care and social care dataset, and;
■ a review of internationally applied grouping models.
Disease management
According to Epstein et al. (1996), disease management refers to “the use of an explicit systematic population-based approach to identify persons at risk, intervene with specific programs of care, and measure clinical outcomes.” (17)
Dellby (1996) identifies three parts of disease management:
■ “a knowledge base that quantifies the economic structure of a disease and includes guidelines covering the care to be provided, by whom, and in what setting for each part of the process;
■ a care delivery system without traditional boundaries between medical specialties and institutions, and;
■ a continuous improvement process which develops and refines the knowledge base, guidelines and delivery system.” (18)
More recently in 2004, Faxon et al. defined the concept as “a multidisciplinary effort to improve the quality and cost-effectiveness of care for selected patients suffering from chronic conditions”. (19)
In 2006, The Disease Management Association of America included in their definition the aspect of self-care efforts, and defined DM as “a system of coordinated health care interventions and communications for populations with conditions in which patient self-care efforts are significant”.
READINESS AND CAPACITy BUILDING OF PROVIDERS 74 PILOT MODEL 2. IMPLEMENTATION MANUAL
Disease Management is part of the Model 2 package. Detailed risk stratification tools should be developed for strengthening and implementing integrated care models.
Project management and monitoring The objective of this component is to ensure an effective and efficient regulation, administration and implementation of the pilot through under the NFZ. This component also improves the effectiveness of the NFZ in contracting with providers. To achieve its objectives, this component finances:
■ the establishment of a Project Implementation Unit (PIU) operation, including the hiring of personnel, arranging of equipment, establishing operating costs, and provider payment processing. A detailed description of the roles and responsibilities of the PIU is provided in the next section;
■ program monitoring, the strengthening of the PIU’s ability to monitor providers’ performance including M&E and Health Information Systems (HIS) design, software and equipment, and reporting;
■ capacity building and technical assistance to the PIU, and;
■ satisfaction surveys, the potential for contracting an external firm to evaluate the satisfaction of patients and providers with the new model.
The NFZ is responsible for overall pilot coordination and management in close collaboration with multiple strategic and implementing partners including PHC providers, ambulatory centers, hospitals, and the MoH.
The formation of a Steering Committee is recommended to review and address both strategic and policy level issues arising during the project period. The committee is headed by the NFZ and includes key stakeholders.
It is recommended that the PIU is established at the NFZ which is responsible for the day-to-day management of the pilot and acts as both the coordinating unit for the technical implementation of the components and the business office for the pilot. IT is responsible for overseeing the following: (i) planning, execution and oversight of the pilot activities, (ii) financial management of pilot funds including data validation and payments to providers, and (iii) monitoring and reporting on pilot activities and outcomes.
The formation of the PIU includes NFZ employees (civil servants), full consultants to the NFZ, and full-time committed employees, hired under the fund of this pilot. The PIU staff have the opportunity, through the pilot, to receive training relevant to their assignments on different processes, such as monitoring and evaluation or financial planning.
READINESS AND CAPACITy BUILDING OF PROVIDERS 75 PILOT MODEL 2. IMPLEMENTATION MANUAL
The Project Implementation Unit (PIU) team may be comprised of the following members:
■ Pilot Coordinator
■ Part Time-Finance and Accounting Officer
■ IT Chief officer
■ HIS Officers
■ M&E Specialists
■ Field Coordinators
■ Administrative Assistants
■ Data Validation Officer
Summary of PIU implementation responsibilities
1 advisory role in contracting and reimbursing providers
for health services provided;
2 supporting and ensuring implementation of pilot activities as per the agreed
implementation plan and timeline;
3 ensuring the active monitoring of pilot implementation in terms of performance
and quality;
4 developing and operating a Health Information System (HIS) to monitor pilot
implementation and achievement of pilot objectives;
5 organizing the evaluation of the pilot using monitoring indicators, analyses and
other appropriate methodologies;
6 organizing and delivering the training activities for providers
in the pilot, and;
7 communication facilitation between the NFZ and providers, as well as support to
the providers in communication with the patients.
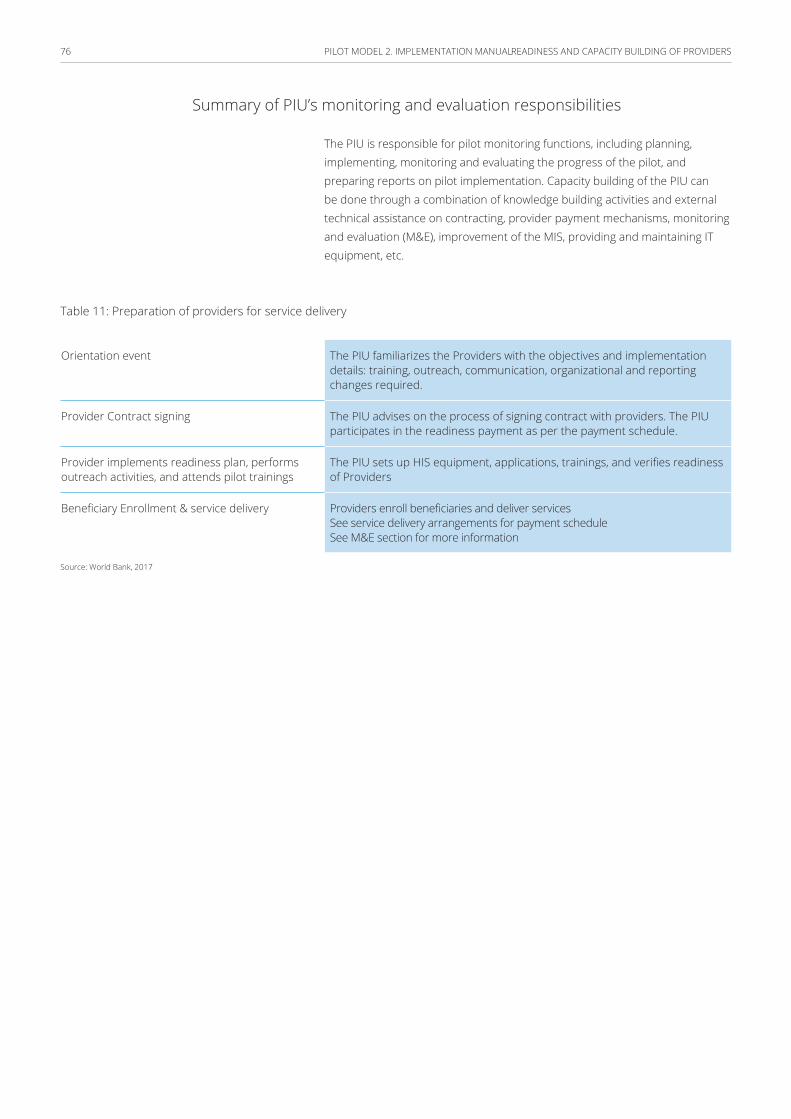
READINESS AND CAPACITy BUILDING OF PROVIDERS 76 PILOT MODEL 2. IMPLEMENTATION MANUAL
Summary of PIU’s monitoring and evaluation responsibilities
The PIU is responsible for pilot monitoring functions, including planning, implementing, monitoring and evaluating the progress of the pilot, and preparing reports on pilot implementation. Capacity building of the PIU can be done through a combination of knowledge building activities and external technical assistance on contracting, provider payment mechanisms, monitoring and evaluation (M&E), improvement of the MIS, providing and maintaining IT equipment, etc.
Table 11: Preparation of providers for service delivery
Orientation event The PIU familiarizes the Providers with the objectives and implementation details: training, outreach, communication, organizational and reporting changes required.
Provider Contract signing The PIU advises on the process of signing contract with providers. The PIU participates in the readiness payment as per the payment schedule.
Provider implements readiness plan, performs outreach activities, and attends pilot trainings
The PIU sets up HIS equipment, applications, trainings, and verifies readiness of Providers
Beneficiary Enrollment & service delivery Providers enroll beneficiaries and deliver servicesSee service delivery arrangements for payment scheduleSee M&E section for more information
Source: World Bank, 2017
77 PILOT MODEL 2. IMPLEMENTATION MANUAL
Monitoring and evaluationMonitoring pilot implementation is essential for the following reasons: (i) allows for early identification of implementation challenges and for timely, appropriate corrective actions to be taken; (ii) to regularly inform the NFZ, MoH, providers and other stakeholders of progress towards the achievement of the pilot objectives; and (iii) to help explain the findings of the evaluation by providing contextual information on how and why the project was or was not successful.
Quality indicators are clearly defined and measurable items referring to the structures, such as the care environment; processes, such as the care received by patient; or outcomes of care, such as mortality. (20) (21) Desirable characteristics of quality indicators include unambiguity and easy measurability; explicit definition of the population to be included and the context to which they apply; and clear linkages between process measures and health outcomes. (22) Targets monitored by these indicators should be specific, measurable, achievable, relevant and time-specific. (23)
Monitoring Functions of the Pilot
■ Establishing a monitoring system, as part of health information system (HIS), which includes: (i) annual work plans, targets, outputs, indicators, and outcomes for each component; (ii) baseline data, if available, for each outcome indicator; and (iii) user friendly data entry format and built in methodology that automatically updates the targets, outputs, and signal the achievement gap to alert the implementing agencies. The focus is on systematic data collection on specified indicators and related deliverables providing management and the main stakeholders the extent of progress and achievement of results and the use of allocated funds. The data is collected and reconciled with the provider databases with a specific focus on service delivery under the extended packages. This enables informed management decisions regarding progress towards achieving project objectives. The program monitoring system relies on regular and accurate data collection and analyses to identify the timely implementation of activities, the achievement of intended results, and positive and negative unintended effects.
■ Strategic (Outcome level): (i) setting benchmarks and targets to measure pilot success, and consolidating expected outputs/outcomes of all the pilot components into a unified plan to serve as a reference for monitoring performance against these benchmarks and targets; (ii) establishing a central monitoring and evaluation system for consolidated monitoring, measuring and reporting of pilot outcomes; (iii) overseeing the pilot implementation process while serving as a key liaison between pilot development and establishing

MONITORING AND EVALUATION78 PILOT MODEL 2. IMPLEMENTATION MANUAL
of monitoring and evaluation system, as well as coordinating internally and externally with all the various stakeholders.
■ Program Level (Output and Input level): (i) facilitating the development and implementation of specific pilot related monitoring arrangements and setting benchmarks, performance and outcome indicators for measuring success at both the strategic and programmatic level; (ii) developing terms of references (TORs) for external evaluation, contracting and coordinating with the external evaluator and overseeing the evaluation process; (iii) overseeing implementation performance of major monitoring initiatives and linking them to pilot outcomes, helping to recruit relevant experts and personnel, and recommending improvements to raise performance of these initiatives; (iv) ensuring the active monitoring of pilot progress in terms of performance and quality; (v) collecting, compiling, and tracking data needed for the results framework; and (vi) ensuring the verification and validation of healthcare services at the level of providers and external health facilities.
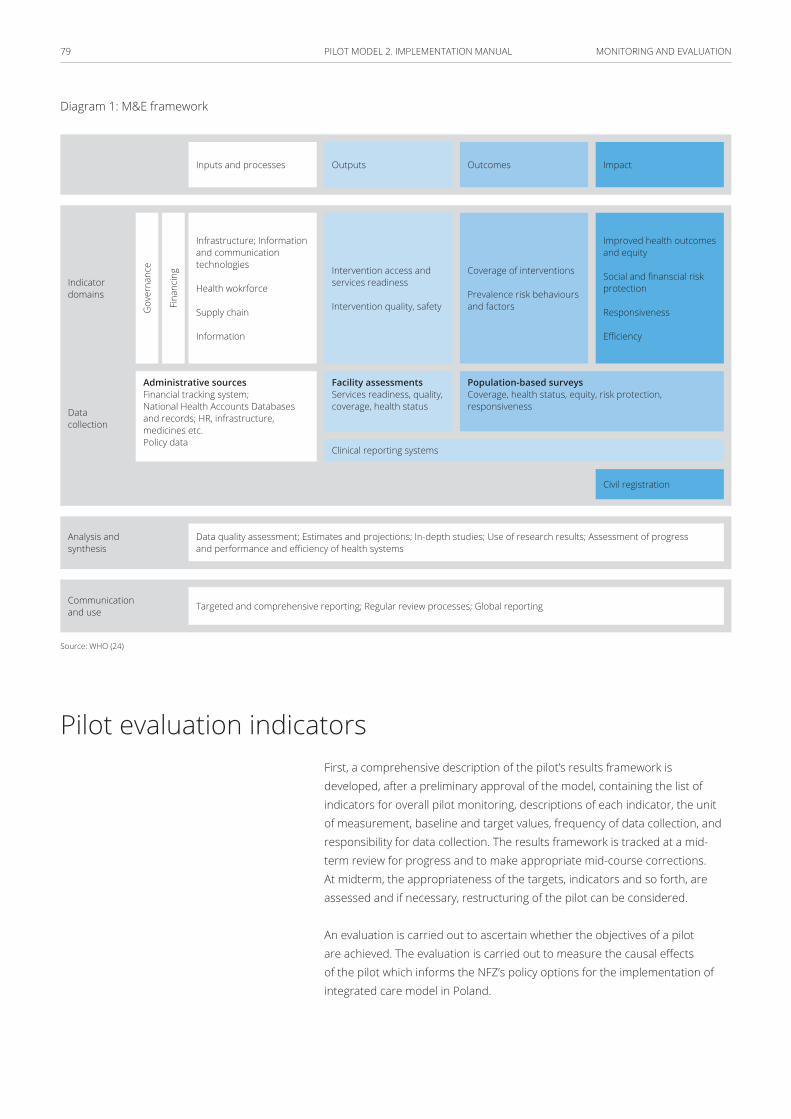
MONITORING AND EVALUATION79 PILOT MODEL 2. IMPLEMENTATION MANUAL
Diagram 1: M&E framework
Inputs and processes Outputs Outcomes Impact
Infrastructure; Information and communication technologies
Health wokrforce
Supply chain
Information
Intervention access and services readiness
Intervention quality, safety
Coverage of interventions
Prevalence risk behaviours and factors
Improved health outcomes and equity
Social and finanscial risk protection
Responsiveness
Efficiency
Administrative sourcesFinancial tracking system;National Health Accounts Databases and records; HR, infrastructure, medicines etc. Policy data
Facility assessments Services readiness, quality, coverage, health status
Population-based surveys Coverage, health status, equity, risk protection, responsiveness
Clinical reporting systems
Data quality assessment; Estimates and projections; In-depth studies; Use of research results; Assessment of progress and performance and efficiency of health systems
Targeted and comprehensive reporting; Regular review processes; Global reporting
Civil registration
Analysis and synthesis
Indicator domains
Data collection
Communication and use
Fina
ncin
g
Gov
erna
nce
Source: WHO (24)
Pilot evaluation indicatorsFirst, a comprehensive description of the pilot’s results framework is developed, after a preliminary approval of the model, containing the list of indicators for overall pilot monitoring, descriptions of each indicator, the unit of measurement, baseline and target values, frequency of data collection, and responsibility for data collection. The results framework is tracked at a mid-term review for progress and to make appropriate mid-course corrections. At midterm, the appropriateness of the targets, indicators and so forth, are assessed and if necessary, restructuring of the pilot can be considered.
An evaluation is carried out to ascertain whether the objectives of a pilot are achieved. The evaluation is carried out to measure the causal effects of the pilot which informs the NFZ’s policy options for the implementation of integrated care model in Poland.
MONITORING AND EVALUATION80 PILOT MODEL 2. IMPLEMENTATION MANUAL
Consultancy for technical evaluation
As part of the evaluation, the evaluator (i) verifies pilot progress towards the project development objectives; (ii) conducts an independent user-satisfaction survey to inform the results framework; (iii) verifies services received by beneficiaries through independently auditing a sample of health facilities for enrollment registers, volume, quality of services and reporting, and a sample of beneficiary households for verification of enrollment and receipt of services; (iv) determines the effect of the pilot on the household service utilization and (v) evaluates the capacity of providers to deliver quality services.
The PIU provides the evaluator with the necessary baseline data to conduct the end line evaluation. Data sources include the following:
■ data routinely collected from the providers through the HIS for the selected indicators
■ routinely collected data on primary health care service utilization, gathered from the PHC department;
■ available data on quality of services including completed quality checklists and quality indicators collected through the HIS;
■ available data verifying both the quantity of care and patient satisfaction, including completed patient satisfaction questionnaires, and;
■ results of any past evaluations carried out by the PIU.
To ensure effective monitoring of the above parameters, pilot program organizers must develop an appropriate IT tool to enable up to data collection and analysis of the facilities. A control group is comprised of the patients not participating in the Model 2, those enrolled with other providers, and patients enrolled with Model 2 providers who opted for the traditional model of care. It is also desirable to evaluate the quality of care in the facilities before and after the introduction of model 2 to better identify potential impacts.
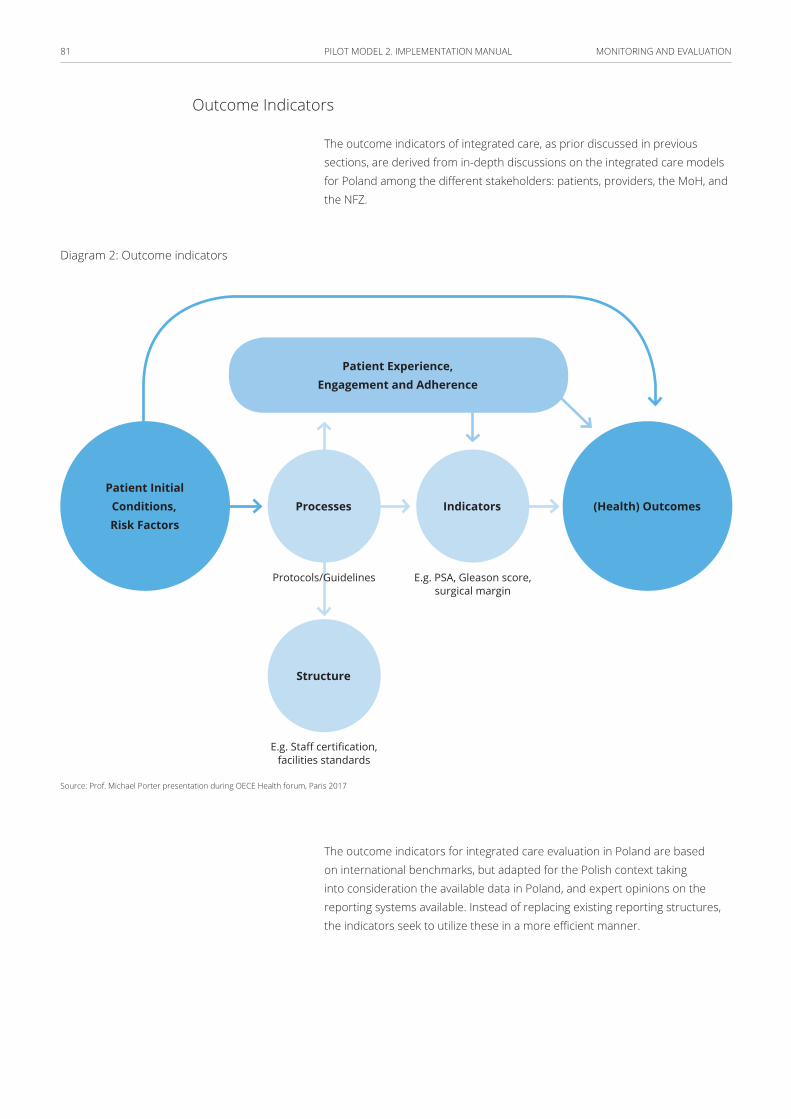
MONITORING AND EVALUATION81 PILOT MODEL 2. IMPLEMENTATION MANUAL
Outcome Indicators
The outcome indicators of integrated care, as prior discussed in previous sections, are derived from in-depth discussions on the integrated care models for Poland among the different stakeholders: patients, providers, the MoH, and the NFZ.
Diagram 2: Outcome indicators
(Health) OutcomesIndicators
Structure
Protocols/Guidelines E.g. PSA, Gleason score,surgical margin
E.g. Staff certification,facilities standards
Patient Initial Conditions,Risk Factors
Processes
Patient Experience,Engagement and Adherence
Source: Prof. Michael Porter presentation during OECE Health forum, Paris 2017
The outcome indicators for integrated care evaluation in Poland are based on international benchmarks, but adapted for the Polish context taking into consideration the available data in Poland, and expert opinions on the reporting systems available. Instead of replacing existing reporting structures, the indicators seek to utilize these in a more efficient manner.
MONITORING AND EVALUATION82 PILOT MODEL 2. IMPLEMENTATION MANUAL
The characteristics of the selected indicators are as follows:
■ Feasible – already collected by more than one country
■ Scientifically sound – indicators are valid and reliable
■ Interpretable – allowing a clear conclusion for policy-makers
■ Actionable – can be directly implemented by the health care system
■ Relevant – Reflect important health conditions in terms of burden of disease, cost of care or priorities of health policy
Outcome indicators are key for macro-level analyses carried out by the MoH, and can contain important information on a range of factors, both at the national and system level. However, the importance of these indicators should encourage careful assessment and time allocation for their analysis.
From the Model 1 evaluation, process measures and outputs could be more useful as they refer to the organizational or individual level.
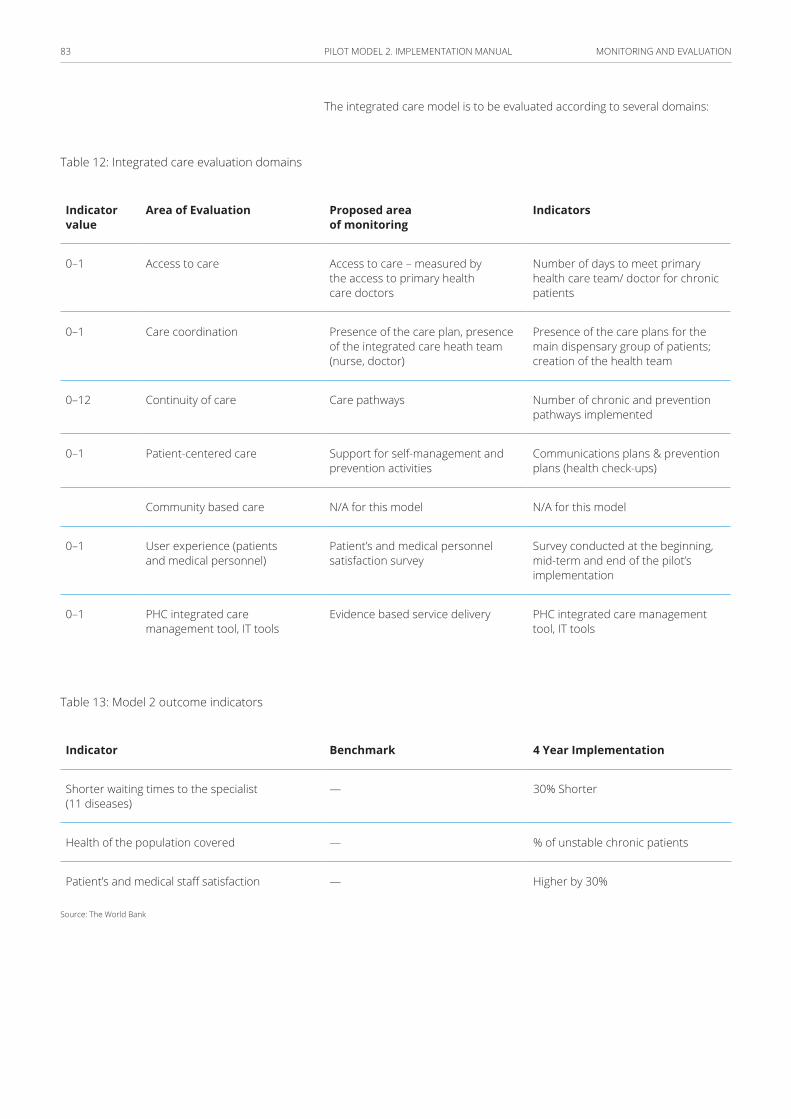
MONITORING AND EVALUATION83 PILOT MODEL 2. IMPLEMENTATION MANUAL
The integrated care model is to be evaluated according to several domains:
Table 12: Integrated care evaluation domains
Indicator value
Area of Evaluation Proposed area of monitoring
Indicators
0–1 Access to care Access to care – measured by the access to primary health care doctors
Number of days to meet primary health care team/ doctor for chronic patients
0–1 Care coordination Presence of the care plan, presence of the integrated care heath team (nurse, doctor)
Presence of the care plans for the main dispensary group of patients; creation of the health team
0–12 Continuity of care Care pathways Number of chronic and prevention pathways implemented
0–1 Patient-centered care Support for self-management and prevention activities
Communications plans & prevention plans (health check-ups)
Community based care N/A for this model N/A for this model
0–1 User experience (patients and medical personnel)
Patient’s and medical personnel satisfaction survey
Survey conducted at the beginning, mid-term and end of the pilot’s implementation
0–1 PHC integrated care management tool, IT tools
Evidence based service delivery PHC integrated care management tool, IT tools
Table 13: Model 2 outcome indicators
Indicator Benchmark 4 Year Implementation
Shorter waiting times to the specialist (11 diseases)
— 30% Shorter
Health of the population covered — % of unstable chronic patients
Patient’s and medical staff satisfaction — Higher by 30%
Source: The World Bank
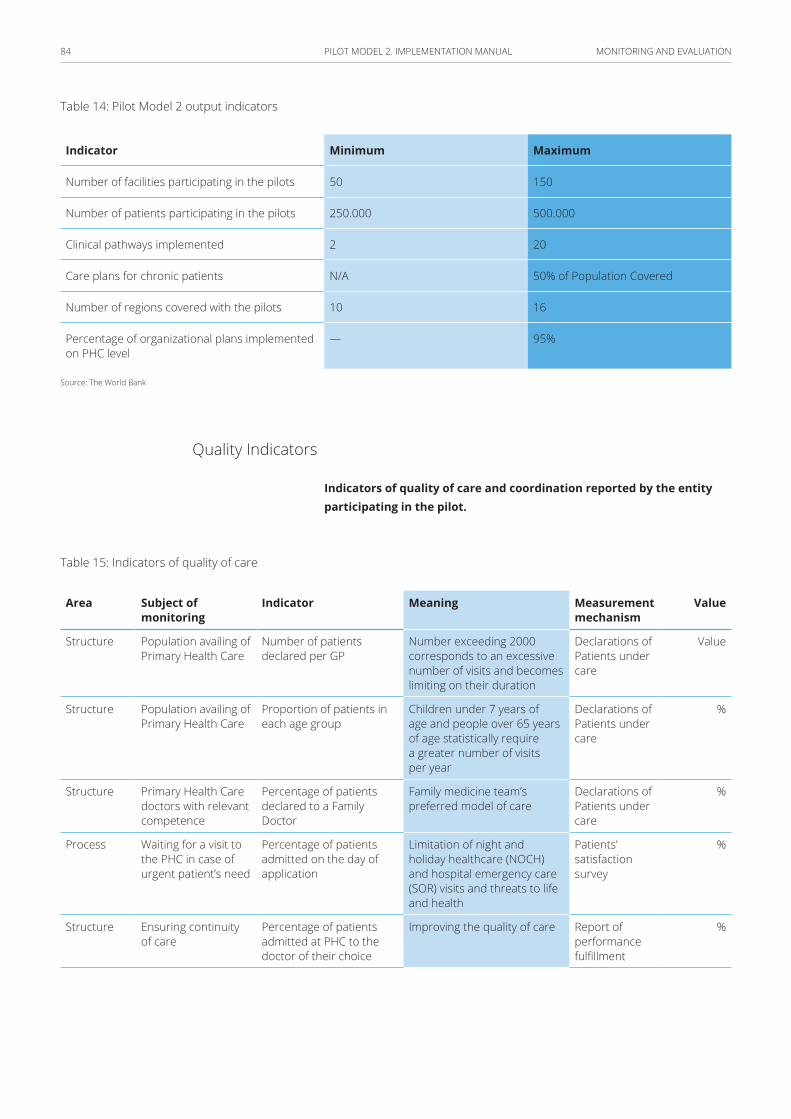
MONITORING AND EVALUATION84 PILOT MODEL 2. IMPLEMENTATION MANUAL
Table 14: Pilot Model 2 output indicators
Indicator Minimum Maximum
Number of facilities participating in the pilots 50 150
Number of patients participating in the pilots 250.000 500.000
Clinical pathways implemented 2 20
Care plans for chronic patients N/A 50% of Population Covered
Number of regions covered with the pilots 10 16
Percentage of organizational plans implemented on PHC level
— 95%
Source: The World Bank
Quality Indicators
Indicators of quality of care and coordination reported by the entity participating in the pilot.
Table 15: Indicators of quality of care
Area Subject of monitoring
Indicator Meaning Measurement mechanism
Value
Structure Population availing of Primary Health Care
Number of patients declared per GP
Number exceeding 2000 corresponds to an excessive number of visits and becomes limiting on their duration
Declarations of Patients under care
Value
Structure Population availing of Primary Health Care
Proportion of patients in each age group
Children under 7 years of age and people over 65 years of age statistically require a greater number of visits per year
Declarations of Patients under care
%
Structure Primary Health Care doctors with relevant competence
Percentage of patients declared to a Family Doctor
Family medicine team’s preferred model of care
Declarations of Patients under care
%
Process Waiting for a visit to the PHC in case of urgent patient’s need
Percentage of patients admitted on the day of application
Limitation of night and holiday healthcare (NOCH) and hospital emergency care (SOR) visits and threats to life and health
Patients’ satisfaction survey
%
Structure Ensuring continuity of care
Percentage of patients admitted at PHC to the doctor of their choice
Improving the quality of care Report of performance fulfillment
%
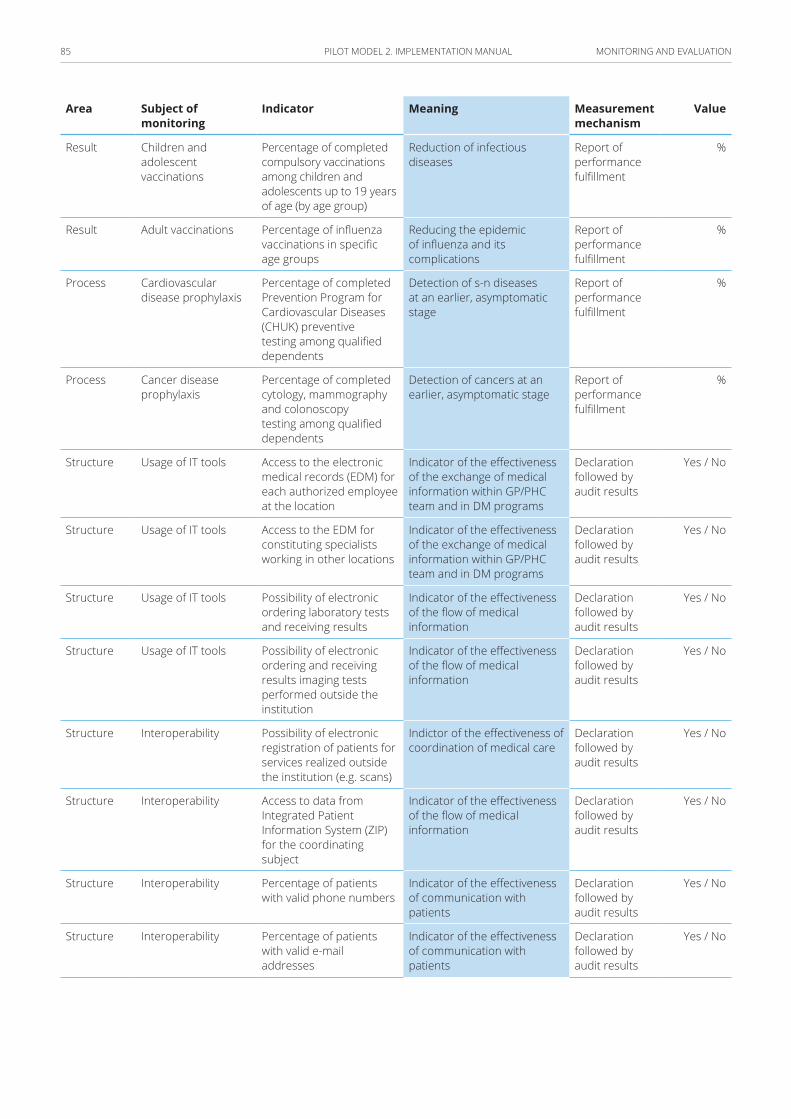
MONITORING AND EVALUATION85 PILOT MODEL 2. IMPLEMENTATION MANUAL
Area Subject of monitoring
Indicator Meaning Measurement mechanism
Value
Result Children and adolescent vaccinations
Percentage of completed compulsory vaccinations among children and adolescents up to 19 years of age (by age group)
Reduction of infectious diseases
Report of performance fulfillment
%
Result Adult vaccinations Percentage of influenza vaccinations in specific age groups
Reducing the epidemic of influenza and its complications
Report of performance fulfillment
%
Process Cardiovascular disease prophylaxis
Percentage of completed Prevention Program for Cardiovascular Diseases (CHUK) preventive testing among qualified dependents
Detection of s-n diseases at an earlier, asymptomatic stage
Report of performance fulfillment
%
Process Cancer disease prophylaxis
Percentage of completed cytology, mammography and colonoscopy testing among qualified dependents
Detection of cancers at an earlier, asymptomatic stage
Report of performance fulfillment
%
Structure Usage of IT tools Access to the electronic medical records (EDM) for each authorized employee at the location
Indicator of the effectiveness of the exchange of medical information within GP/PHC team and in DM programs
Declaration followed by audit results
Yes / No
Structure Usage of IT tools Access to the EDM for constituting specialists working in other locations
Indicator of the effectiveness of the exchange of medical information within GP/PHC team and in DM programs
Declaration followed by audit results
Yes / No
Structure Usage of IT tools Possibility of electronic ordering laboratory tests and receiving results
Indicator of the effectiveness of the flow of medical information
Declaration followed by audit results
Yes / No
Structure Usage of IT tools Possibility of electronic ordering and receiving results imaging tests performed outside the institution
Indicator of the effectiveness of the flow of medical information
Declaration followed by audit results
Yes / No
Structure Interoperability Possibility of electronic registration of patients for services realized outside the institution (e.g. scans)
Indictor of the effectiveness of coordination of medical care
Declaration followed by audit results
Yes / No
Structure Interoperability Access to data from Integrated Patient Information System (ZIP) for the coordinating subject
Indicator of the effectiveness of the flow of medical information
Declaration followed by audit results
Yes / No
Structure Interoperability Percentage of patients with valid phone numbers
Indicator of the effectiveness of communication with patients
Declaration followed by audit results
Yes / No
Structure Interoperability Percentage of patients with valid e-mail addresses
Indicator of the effectiveness of communication with patients
Declaration followed by audit results
Yes / No
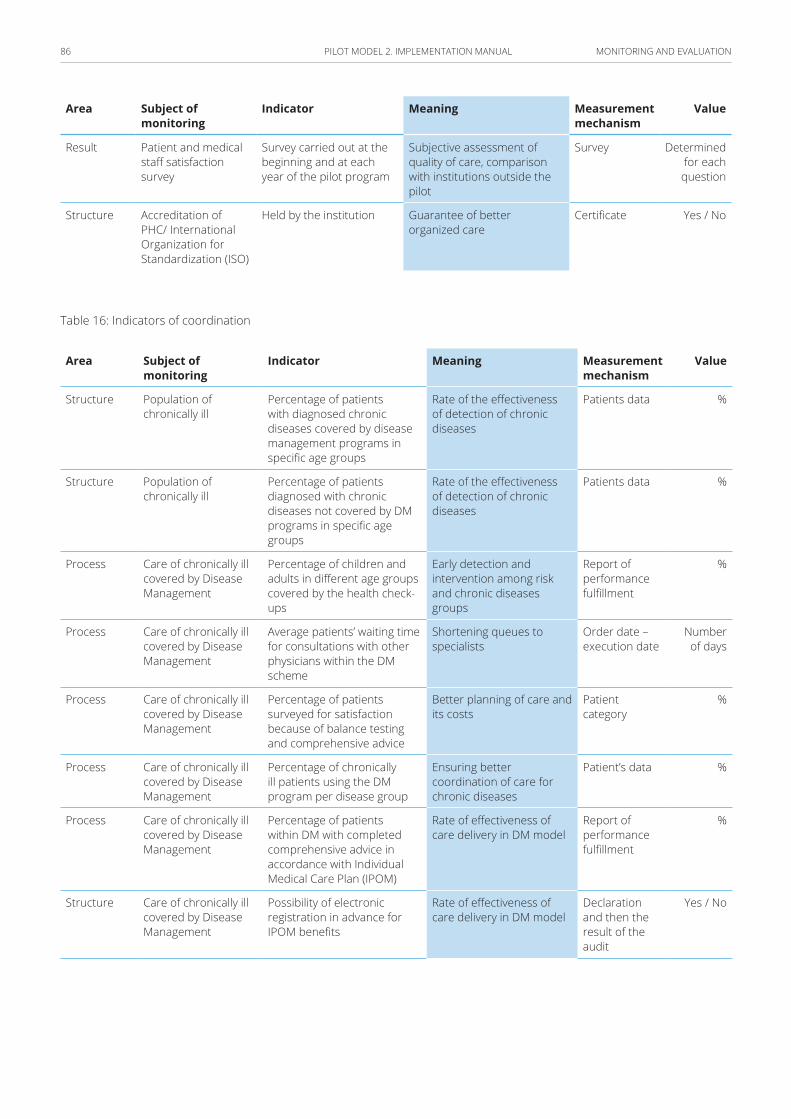
MONITORING AND EVALUATION86 PILOT MODEL 2. IMPLEMENTATION MANUAL
Area Subject of monitoring
Indicator Meaning Measurement mechanism
Value
Result Patient and medical staff satisfaction survey
Survey carried out at the beginning and at each year of the pilot program
Subjective assessment of quality of care, comparison with institutions outside the pilot
Survey Determined for each question
Structure Accreditation of PHC/ International Organization for Standardization (ISO)
Held by the institution Guarantee of better organized care
Certificate Yes / No
Table 16: Indicators of coordination
Area Subject of monitoring
Indicator Meaning Measurement mechanism
Value
Structure Population of chronically ill
Percentage of patients with diagnosed chronic diseases covered by disease management programs in specific age groups
Rate of the effectiveness of detection of chronic diseases
Patients data %
Structure Population of chronically ill
Percentage of patients diagnosed with chronic diseases not covered by DM programs in specific age groups
Rate of the effectiveness of detection of chronic diseases
Patients data %
Process Care of chronically ill covered by Disease Management
Percentage of children and adults in different age groups covered by the health check-ups
Early detection and intervention among risk and chronic diseases groups
Report of performance fulfillment
%
Process Care of chronically ill covered by Disease Management
Average patients’ waiting time for consultations with other physicians within the DM scheme
Shortening queues to specialists
Order date – execution date
Number of days
Process Care of chronically ill covered by Disease Management
Percentage of patients surveyed for satisfaction because of balance testing and comprehensive advice
Better planning of care and its costs
Patient category
%
Process Care of chronically ill covered by Disease Management
Percentage of chronically ill patients using the DM program per disease group
Ensuring better coordination of care for chronic diseases
Patient’s data %
Process Care of chronically ill covered by Disease Management
Percentage of patients within DM with completed comprehensive advice in accordance with Individual Medical Care Plan (IPOM)
Rate of effectiveness of care delivery in DM model
Report of performance fulfillment
%
Structure Care of chronically ill covered by Disease Management
Possibility of electronic registration in advance for IPOM benefits
Rate of effectiveness of care delivery in DM model
Declaration and then the result of the audit
Yes / No
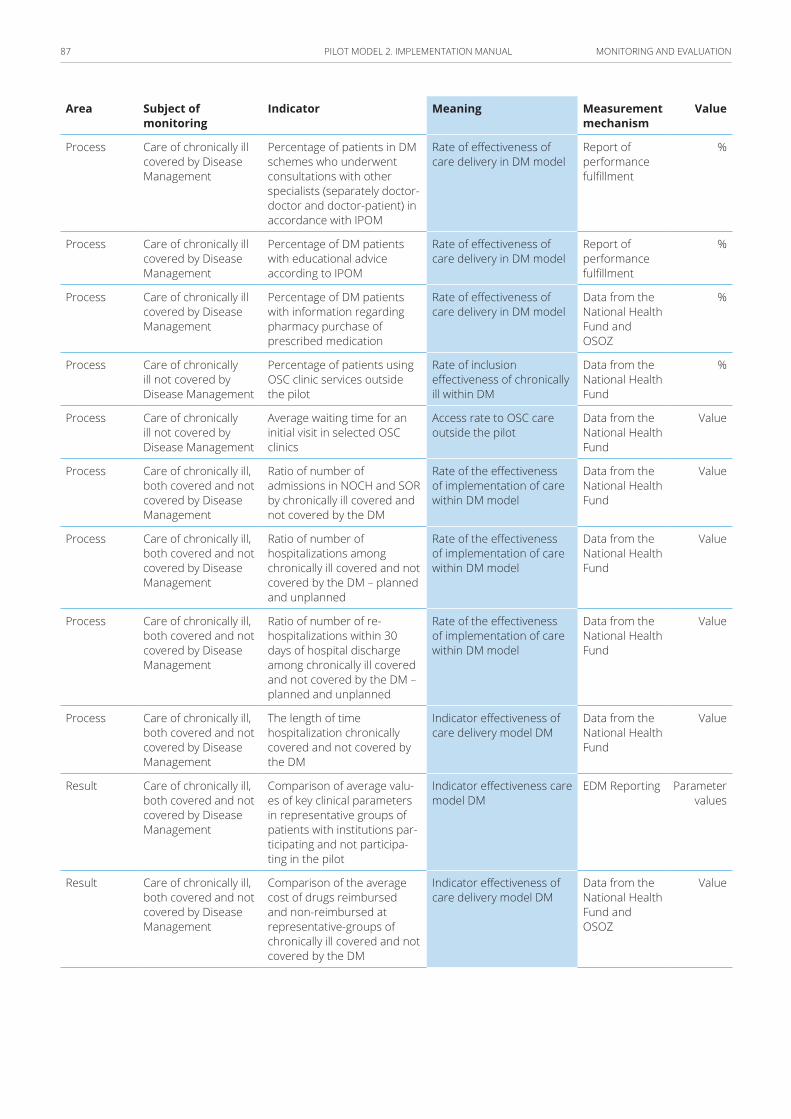
MONITORING AND EVALUATION87 PILOT MODEL 2. IMPLEMENTATION MANUAL
Area Subject of monitoring
Indicator Meaning Measurement mechanism
Value
Process Care of chronically ill covered by Disease Management
Percentage of patients in DM schemes who underwent consultations with other specialists (separately doctor-doctor and doctor-patient) in accordance with IPOM
Rate of effectiveness of care delivery in DM model
Report of performance fulfillment
%
Process Care of chronically ill covered by Disease Management
Percentage of DM patients with educational advice according to IPOM
Rate of effectiveness of care delivery in DM model
Report of performance fulfillment
%
Process Care of chronically ill covered by Disease Management
Percentage of DM patients with information regarding pharmacy purchase of prescribed medication
Rate of effectiveness of care delivery in DM model
Data from the National Health Fund and OSOZ
%
Process Care of chronically ill not covered by Disease Management
Percentage of patients using OSC clinic services outside the pilot
Rate of inclusion effectiveness of chronically ill within DM
Data from the National Health Fund
%
Process Care of chronically ill not covered by Disease Management
Average waiting time for an initial visit in selected OSC clinics
Access rate to OSC care outside the pilot
Data from the National Health Fund
Value
Process Care of chronically ill, both covered and not covered by Disease Management
Ratio of number of admissions in NOCH and SOR by chronically ill covered and not covered by the DM
Rate of the effectiveness of implementation of care within DM model
Data from the National Health Fund
Value
Process Care of chronically ill, both covered and not covered by Disease Management
Ratio of number of hospitalizations among chronically ill covered and not covered by the DM – planned and unplanned
Rate of the effectiveness of implementation of care within DM model
Data from the National Health Fund
Value
Process Care of chronically ill, both covered and not covered by Disease Management
Ratio of number of re-hospitalizations within 30 days of hospital discharge among chronically ill covered and not covered by the DM – planned and unplanned
Rate of the effectiveness of implementation of care within DM model
Data from the National Health Fund
Value
Process Care of chronically ill, both covered and not covered by Disease Management
The length of time hospitalization chronically covered and not covered by the DM
Indicator effectiveness of care delivery model DM
Data from the National Health Fund
Value
Result Care of chronically ill, both covered and not covered by Disease Management
Comparison of average valu-es of key clinical parameters in representative groups of patients with institutions par-ticipating and not participa-ting in the pilot
Indicator effectiveness care model DM
EDM Reporting Parameter values
Result Care of chronically ill, both covered and not covered by Disease Management
Comparison of the average cost of drugs reimbursed and non-reimbursed at representative-groups of chronically ill covered and not covered by the DM
Indicator effectiveness of care delivery model DM
Data from the National Health Fund and OSOZ
Value
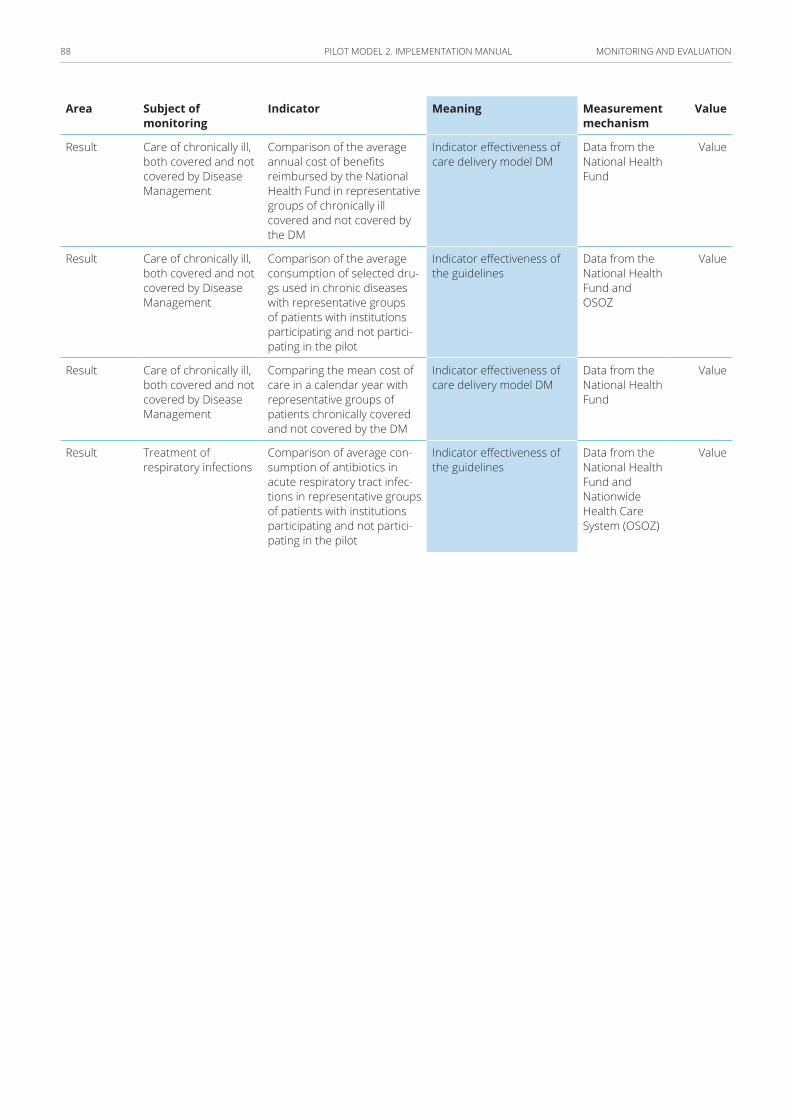
MONITORING AND EVALUATION88 PILOT MODEL 2. IMPLEMENTATION MANUAL
Area Subject of monitoring
Indicator Meaning Measurement mechanism
Value
Result Care of chronically ill, both covered and not covered by Disease Management
Comparison of the average annual cost of benefits reimbursed by the National Health Fund in representative groups of chronically ill covered and not covered by the DM
Indicator effectiveness of care delivery model DM
Data from the National Health Fund
Value
Result Care of chronically ill, both covered and not covered by Disease Management
Comparison of the average consumption of selected dru-gs used in chronic diseases with representative groups of patients with institutions participating and not partici-pating in the pilot
Indicator effectiveness of the guidelines
Data from the National Health Fund and OSOZ
Value
Result Care of chronically ill, both covered and not covered by Disease Management
Comparing the mean cost of care in a calendar year with representative groups of patients chronically covered and not covered by the DM
Indicator effectiveness of care delivery model DM
Data from the National Health Fund
Value
Result Treatment of respiratory infections
Comparison of average con-sumption of antibiotics in acute respiratory tract infec-tions in representative groups of patients with institutions participating and not partici-pating in the pilot
Indicator effectiveness of the guidelines
Data from the National Health Fund and Nationwide Health Care System (OSOZ)
Value
MONITORING AND EVALUATION89 PILOT MODEL 2. IMPLEMENTATION MANUAL
Developing reporting mechanisms
Reporting mechanisms are enhanced and include:
■ monthly reports from providers to the PIU;
■ quarterly reports from the PIU to the MoH;
■ quarterly reports from the PIU to the steering committee; and
■ an Annual Pilot Implementation Report, consolidating progress of the pilot implementation by each of the institutions involved, based on administrative data, survey data, beneficiary assessments and independent evaluations.
Monitoring is a continuous function carried out by the PIU, with support from the NFZ HIS team. Specifically, it comprises of two parts:
■ results monitoring of the pilot using the results framework with the specified indicators, and
■ evaluation of the pilot.
Health Information System Modules
The Health Information System (HIS) is an integral part of the M&E system. HIS is a comprehensive system composed of different modules (shown in Table 17) that allow providers to track the patients throughout the different phases of the pilot i.e. from outreach, through enrollment, to service delivery at the PHC level and referral services received in the other facilities.
Providers are expected to input all beneficiary related data into the HIS modules. Accordingly, the service delivery data entered by the provider in the system is the source of enrollment, baseline, administrative, utilization, medical history, and referral and indicator data for monitoring.
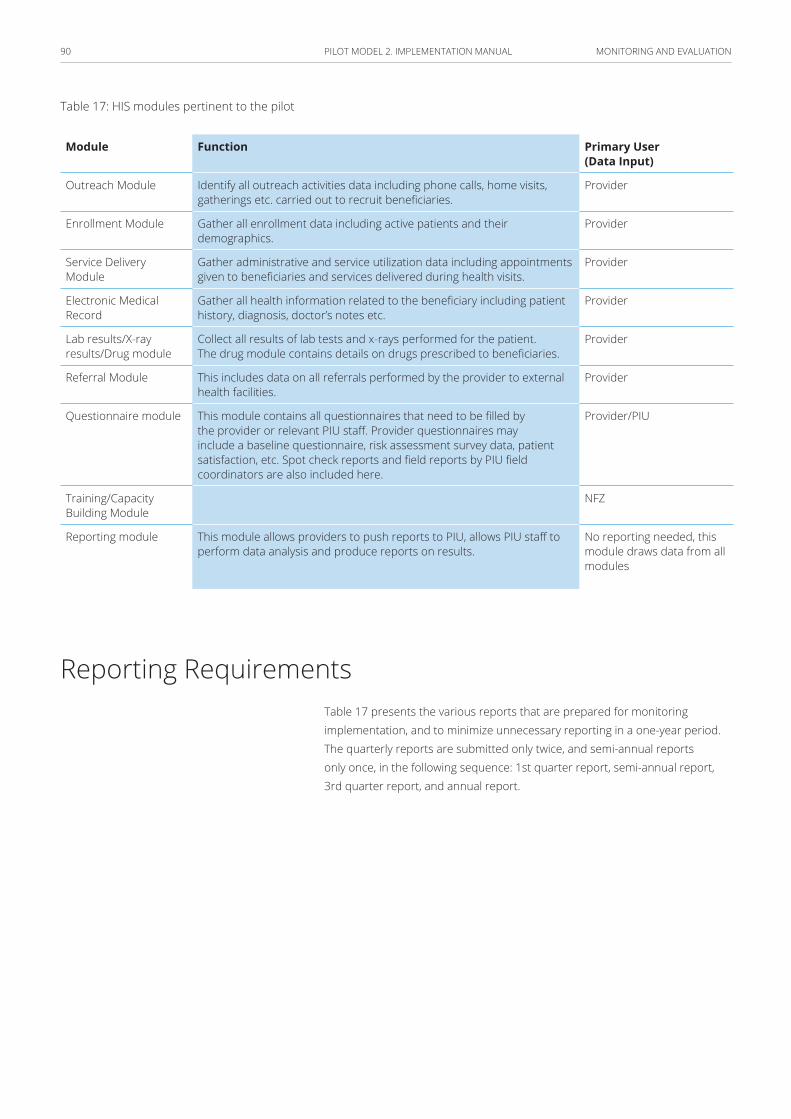
MONITORING AND EVALUATION90 PILOT MODEL 2. IMPLEMENTATION MANUAL
Table 17: HIS modules pertinent to the pilot
Primary User (Data Input)
FunctionModule
ProviderIdentify all outreach activities data including phone calls, home visits, gatherings etc. carried out to recruit beneficiaries.
Outreach Module
ProviderGather all enrollment data including active patients and their demographics.
Enrollment Module
ProviderGather administrative and service utilization data including appointments given to beneficiaries and services delivered during health visits.
Service Delivery Module
ProviderGather all health information related to the beneficiary including patient history, diagnosis, doctor’s notes etc.
Electronic Medical Record
ProviderCollect all results of lab tests and x-rays performed for the patient. The drug module contains details on drugs prescribed to beneficiaries.
Lab results/X-ray results/Drug module
ProviderThis includes data on all referrals performed by the provider to external health facilities.
Referral Module
Provider/PIU This module contains all questionnaires that need to be filled by the provider or relevant PIU staff. Provider questionnaires may include a baseline questionnaire, risk assessment survey data, patient satisfaction, etc. Spot check reports and field reports by PIU field coordinators are also included here.
Questionnaire module
NFZTraining/Capacity Building Module
No reporting needed, this module draws data from all modules
This module allows providers to push reports to PIU, allows PIU staff to perform data analysis and produce reports on results.
Reporting module
Reporting Requirements Table 17 presents the various reports that are prepared for monitoring implementation, and to minimize unnecessary reporting in a one-year period. The quarterly reports are submitted only twice, and semi-annual reports only once, in the following sequence: 1st quarter report, semi-annual report, 3rd quarter report, and annual report.

MONITORING AND EVALUATION91 PILOT MODEL 2. IMPLEMENTATION MANUAL
Table 18: Reporting requirements
ComponentsRecipientResponsibility Type of Report
– Services in prevention and education in health financed on a fee for service basis; data required to determine the capitation rate;
– services provided under Model 2, including those payable on a FFS basis, and;
– other services payable on a FFS basis under the model (e.g., diagnostic consultations).
NFZ/PIUProviderMonthly (financial)
– Approved services financed on a separate basis under performance-based budget;
– patients with diagnosed chronic conditions from Model 2 category included in the model;
– patients who received services in OSC clinics and are diagnosed with a chronic condition from Model 2 category included in the model, with an itinerary of information on the timeframe, location, and provider of service, and;
– specification of patients on waiting lists for the first visit in OSC clinic, diagnosed with a chronic condition from Model 2 category (together with the waiting time).
NFZ/PIUProviderMonthly (clinical)
Patient satisfaction survey results. PIUProviderAnnual report
Source: The World Bank, 2017
Sources of Data
Sources of data include:
■ routine data collected through the claims processing system;
■ data routinely collected at health facility level;
■ additional data collected by providers and NFZ, such as from enrollment registers, spot checks and ad-hoc surveys;
■ information collected during the verification processes; and
■ data from the PIU rapid facility assessment.

92 PILOT MODEL 2. IMPLEMENTATION MANUAL
Information technology(Deatils in Annex 3)
Minimum requirements for IT systems on the provider level:
■ access to patient’s electronic medical records (EMR) for all authorized employees;
■ electronic registration of services in line with the plan of care over, at the minimum, a one-year period;
■ reports sent to the NFZ and return reports received at least once per month, and;
■ to set the goal of communicating with the patients via the use of ICT technology, including self-care devices (e.g., blood glucose, blood pressure, weight measurements recorded electronically).
IT role in providing Coordinated Healthcare:
■ ensures effective financial settlements with the Payer,
■ provides the Payer (Supervisory Body) with information about the effectiveness of Integrated Care (IC),
■ provides patient’s coordinator with access to health data in the fullest possible scope,
■ provides for data exchange between clinics cooperating under IC,
■ works as a tool that ensures efficient organization of IC, and
■ works as a tool for contacting and cooperation with patients covered by IC.
INFORMATION TECHNOLOGY93 PILOT MODEL 2. IMPLEMENTATION MANUAL
Addressing needs through IT solutions:
■ Improving the Payer’s reporting system through:
– financial settlements, and
– reporting on medical and epidemiological data.
■ Expanding functionality of the Payer’s Integrated Patient Information System (Zintegrowany Informator Pacjenta-ZIP), through:
– speedy acquisition of data about events regarding patient, and
– absence of other sources of such data.
■ Expanding local IT systems at healthcare coordinators’, by
– managing population covered by IC,
– data exchange between participants of IC consortium, and
– tightening relationships with patients through 2.0 portal (with feedback).
Settlements with the Payer – analytic conclusions: The adopted solutions shall not disturb settlements with service providers outside of IC pilot.
■ All financial needs may be satisfied using slightly modified DEKL (XML code for declarations) and SWIAD (XML code for services provided) messages:
– DEKL data refer to population covered by healthcare, and
– SWIAD data specify service details.
■ Instead of periodical transfer of DEKL data – implementation of on-line network service for immediate data update;
■ Medical data constraints need to be considered: the law restricts the scope of data processed by NFZ, therefore
– relevant analyses may be implemented through pilot, and
– some data can be transferred through consolidated ZBPOZ (XML code for consolidated PHC services) message, without assignment to specific patient.

INFORMATION TECHNOLOGY94 PILOT MODEL 2. IMPLEMENTATION MANUAL
Settlements with the Payer – further actions:
■ Prior to launching the pilot, the following operational areas should be addressed:
– Expand DEKL message or implement network service?
– How the Coordinated Healthcare consortium structure should be defined in terms of IT?
– What new types of services should be registered in SWIAD message?
– Which medical data should be transferred to SWIAD (assigned to patient) and which to ZBPOZ (consolidated)?
■ Revision of relevant regulations by the Minister of Health and President of the NFZ, and
■ preparation of NFZ IT Systems.
Monitoring the patient’s health status
■ data collected in IC facility or consortium:
– originating from coordinator’s system.
■ Data regarding services provided outside of IC facility or consortium, such as
– hospital stays;
– appointments with specialist physicians outside of IC consortium;
– issued and realized prescriptions on refunded medications, and;
– commissioned and purchased / refunded medical products.
■ Where should data come from?
– From ZIP system, and in the future also from regional systems, i.e. P1.
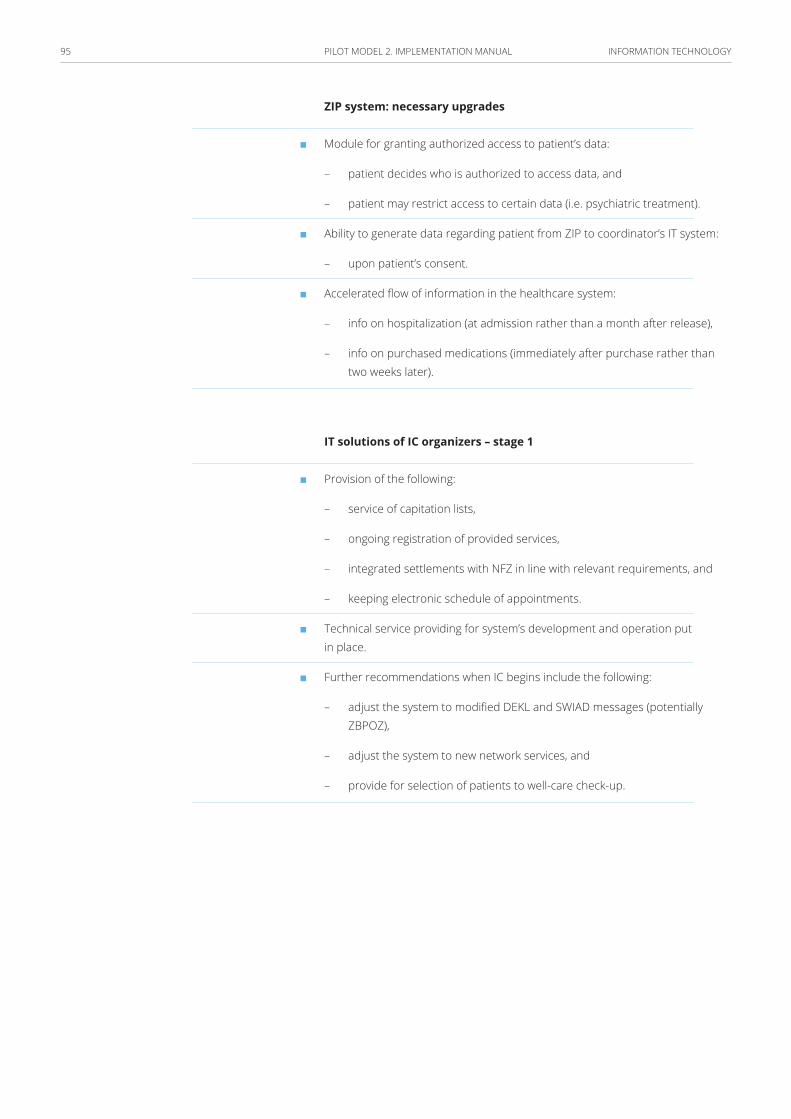
INFORMATION TECHNOLOGY95 PILOT MODEL 2. IMPLEMENTATION MANUAL
ZIP system: necessary upgrades
■ Module for granting authorized access to patient’s data:
– patient decides who is authorized to access data, and
– patient may restrict access to certain data (i.e. psychiatric treatment).
■ Ability to generate data regarding patient from ZIP to coordinator’s IT system:
– upon patient’s consent.
■ Accelerated flow of information in the healthcare system:
– info on hospitalization (at admission rather than a month after release),
– info on purchased medications (immediately after purchase rather than two weeks later).
IT solutions of IC organizers – stage 1
■ Provision of the following:
– service of capitation lists,
– ongoing registration of provided services,
– integrated settlements with NFZ in line with relevant requirements, and
– keeping electronic schedule of appointments.
■ Technical service providing for system’s development and operation put in place.
■ Further recommendations when IC begins include the following:
– adjust the system to modified DEKL and SWIAD messages (potentially ZBPOZ),
– adjust the system to new network services, and
– provide for selection of patients to well-care check-up.
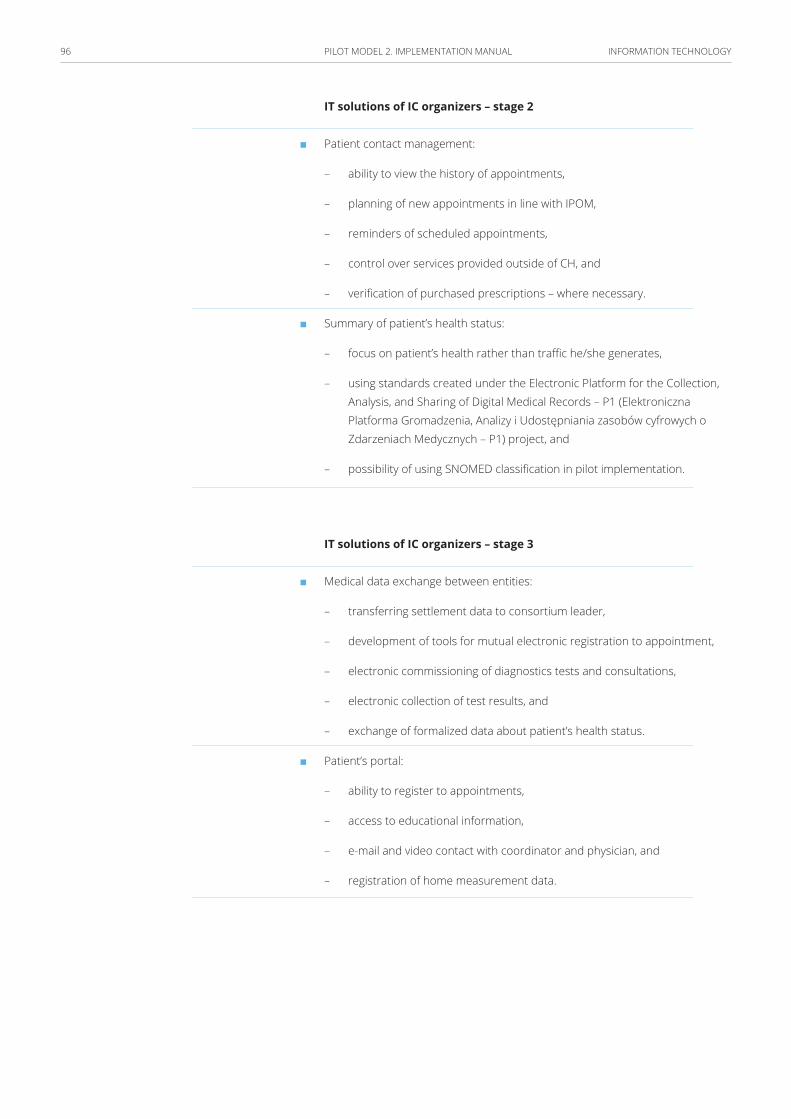
INFORMATION TECHNOLOGY96 PILOT MODEL 2. IMPLEMENTATION MANUAL
IT solutions of IC organizers – stage 2
■ Patient contact management:
– ability to view the history of appointments,
– planning of new appointments in line with IPOM,
– reminders of scheduled appointments,
– control over services provided outside of CH, and
– verification of purchased prescriptions – where necessary.
■ Summary of patient’s health status:
– focus on patient’s health rather than traffic he/she generates,
– using standards created under the Electronic Platform for the Collection, Analysis, and Sharing of Digital Medical Records – P1 (Elektroniczna Platforma Gromadzenia, Analizy i Udostępniania zasobów cyfrowych o Zdarzeniach Medycznych – P1) project, and
– possibility of using SNOMED classification in pilot implementation.
IT solutions of IC organizers – stage 3
■ Medical data exchange between entities:
– transferring settlement data to consortium leader,
– development of tools for mutual electronic registration to appointment,
– electronic commissioning of diagnostics tests and consultations,
– electronic collection of test results, and
– exchange of formalized data about patient’s health status.
■ Patient’s portal:
– ability to register to appointments,
– access to educational information,
– e-mail and video contact with coordinator and physician, and
– registration of home measurement data.

INFORMATION TECHNOLOGY97 PILOT MODEL 2. IMPLEMENTATION MANUAL
Future strategic changes in IT system organization
■ acceleration of reporting duties to share the most recent patients’ data: data on beginning of hospitalization, purchased prescriptions;
■ introduction of capitation-based settlements via network services: only information about changes, settlement available immediately;
■ collecting greater quantity of medical data affecting optimal treatment regimen: medical registers, monitoring treatment results, and;
■ initiation of cooperation between healthcare and social welfare systems: demographic and epidemiologic changes, synergistic cooperation.

98 PILOT MODEL 2. IMPLEMENTATION MANUAL
Bibliography1. Główny Urząd Statystyczny. Dane Statystyczne – Zdrowie o Ochrona
Zdrowia w Polsce. [Online]. [cited 2017. Available from: http://swaid.stat.gov.pl/EN/ZdrowieOchronaZdrowia_dashboards/Raporty_predefiniowane/RAP_DBD_ZDR_1.aspx.
2. The Organisation for Economic Co-operation and Development [OECD]. Doctor’s consultations. [Online].; 2016 [cited 2017 March 9. Available from: https://data.oecd.org/healthcare/doctors-consultations.htm.
3. Główny Urząd Statystyczny. Zdrowie i Ochrona Zdrowia w 2010 roku. Warsaw:; 2010.
4. Główny Urząd Statystyczny [GUS]. Zdrowie i Ochrona Zdrowia Statystyki. [Online]. [cited 2017. Available from: http://swaid.stat.gov.pl/SitePagesDBW/ZdrowieOchronaZdrowia.aspx.
5. Europ Assistance/CSA. Health and Society Barometer 2013.; 2013.
6. Fundacja Watch Health Care. Barometr Fundacji Watch Health Care.; 2016. Report No.: nr 14/2/08/2016.
7. Naczelna Izba Lekarska (NIL). Informacje Statystyczne. [Online].; 2015 [cited 2017. Available from: http://www.nil.org.pl/rejestry/centralny-rejestr-lekarzy/informacje-statystyczne.
8. Institute for Health Metrics and Evaluation. Global Burden of Disease Study 2015 – Results. Seattle:; 2016.
9. Narodowy Fundusz Zdrowia [NFZ]. Podstawowa Opieka Zdrowotna--Potencjał i jego wykorzystanie (zarys analizy). Warszawa:, Centrala w Warszawie; 2016.
10. Główny Urząd Statystyczny [GUS]. Zdrowie i zachowanie zdrowotne mieszkańców. Warszawa:; 2015.
11. NHS England. Using case finding and risk stratification: A key service component for personalized care and support planning. NHS England; 2015.
12. National Health Fund England. How to guide: the BCF technical toolkit. [Online].; 2014. Available from: https://www.england.nhs.uk/ourwork/part-rel/transformation-fund/bcf-plan/bcf-archive/tech-toolkit/.
13. Lynn J, Straube B, Bell K, Jencks S, Kambic R. Using Population Segmentation to Provide Better Health Care for All: The “Bridges to Health” Model. MilbankQ. 2007; 85(2).
BIBLIOGRAPHY99 PILOT MODEL 2. IMPLEMENTATION MANUAL
14. Miller C. Risk Stratification: A Practical Guide for Clinicians: Cambridge University Press; 2001.
15. Agency for Clinical Innovations. Risk Stratification – discussion paper for NSW Health’s approach to Risk Stratification. ; 2014.
16. DMAA: The Care Continuum Alliance. DMAA Definition of Disease Management..
17. Epstein R, Sherwood L. From outcomes research to disease management: a guide for the perplexed. Annals of Internal Medicine. 1996; 124(9).
18. Dellby U. Drastically improving health care with focus on managing the patient with a disease: the macro and micro perspective. International Journal of Health Care Quality Assurance. 1996; 9(2).
19. Faxon , Schwamm , Pasternak , McNeil , Bufalina. Improving quality of care through disease management: principles and recommendations from the American Heart Association’s Expert Panel on Disease Management. 2004.
20. Campbell S, Braspenning J, Hutchinson A, Marshal M. Improving the quality of health care: Research methods used in developing and applying quality indicators in primary care. BMJ. 2003; 326(7393).
21. Brook. R, McGlynn E, Cleary P. Measuring quality of care – part two of six. N Engl J Med. 1996; 335(13).
22. Hearnshaw H, Harker R, Cheater F, Baker B, Grmishaw G. Expert consensus on the desirable characteristics of review criteria for improvement of health care quality. Qual Saf Health Care. 2001; 10(3).
23. Arah O, Klazinga N, Delnoij D, Asbroek C. Conceptual frameworks for health systems performance: A quest for effectiveness, quality, and improvement. Int J Qual Health Care. 2003; 15(5).
24. WHO. Global reference List of 100 Core Health Indicators. Luxembourg: World Health Organization; 2015.