Określenie optymalnych parametrów obróbki hartowania z ...
14
133 Streszczenie W pracy przeprowadzono kompleksową procedurę okre- ślenia optymalnych parametrów obróbki cieplnej żeliwa sferoidalnego z dodatkiem Ni, Cu, Mo i Mn poddanego hartowaniu z przemianą izotermiczną w celu uzyskania żeliwa ADI. Na podstawie skonstruowanych wykresów CTPc i CTPi wyznaczono podstawowe parametry obrób- ki – temperaturę i czas austenityzacji, krytyczną szybkość studzenia do temperatury przemiany izotermicznej oraz dla dowolnych, wybranych wartości temperatury ausferrytyza- cji – czas ausferrytyzacji. Stwierdzono, że dla temperatury przemiany izotermicznej powyżej 400°C okno procesu jest zamknięte. Analiza wykresu CTPi stwarza możliwość doboru czasu przemiany izotermicznej w złożonych i cyklicznych warian- tach obróbki cieplnej ADI. Słowa kluczowe: ADI, ausferryt, wykres CTPc, wykres CTPi 1. Wstęp ADI (Austempered Ductile Iron), żeliwo sferoidalne poddane hartowaniu z przemianą izotermiczną, charak- teryzuje się dobrymi właściwościami wytrzymałościo- wymi i plastycznymi, a obecność w strukturze grafitu kulkowego zapewnia: zdolność tłumienia drgań, skra- walność, odporność na ścieranie i korzystny stosunek wytrzymałości do masy. Mikrostruktura żeliwa ADI składa się z grafitu kulko- wego oraz osnowy ausferrytycznej, będącej mieszaniną © 2016 Instytut Odlewnictwa. All rights reserved. DOI: 10.7356/iod.2016.11 Określenie optymalnych parametrów obróbki hartowania z przemianą izotermiczną żeliwa sferoidalnego Ni-Cu (Mo,Mn) na podstawie wykresów CTPc i CTPi Determination of the optimal austempering parameters of Ni-Cu (Mo,Mn) ductile iron based on CCT and TTT diagrams Andrzej Gazda 1 1 Instytut Odlewnictwa, Centrum Badań Wysokotemperaturowych, ul. Zakopiańska 73, 30-418 Kraków 1 Foundry Research Institute, Centre for High-Temperature Studies, ul. Zakopiańska 73, 30-418 Kraków, Poland E-mail: [email protected] Received: 31.03.2016. Accepted in revised form: 30.06.2016. Abstract In the research, a complex procedure was performed to determine the optimal parameters of thermal treatment of ductile iron with Ni, Cu, Mo and Mn additions which un- derwent austempering in order to obtain the ADI cast iron. Based on the constructed CCT and TTT diagrams, the basic heat treatment parameters were determined, i.e. the aus- tenitizing temperature and time, the critical rate of cooling down to the isothermal transformation temperature and – for the selected values of the austempering temperature – the austempering times. It was established that, for the isother- mal transformation temperature above 400°C, the process- ing window is closed. The analysis of the TTT diagram makes it possible to se- lect the time of the isothermal transformation in complex cy- clic variants of the ADI thermal treatment. Keywords: ADI, ausferrite, CCT diagram, TTT diagram 1. Introduction ADI, i.e. Austempered Ductile Iron, is characterized by good strength and plastic properties, and the presence of nodular graphite in the structure ensures: damping capacity, machinability, abrasive resistance and an ad- vantageous strength/mass ratio. The microstructure of the ADI cast iron consists of nodular graphite and an ausferritic matrix, which is a mixture of acicular ferrite and carbon-saturated aus- tenite. Acicular ferrite is formed during the isothermal
Transcript of Określenie optymalnych parametrów obróbki hartowania z ...

133
Streszczenie
W pracy przeprowadzono kompleksową procedurę okre-ślenia optymalnych parametrów obróbki cieplnej żeliwa sferoidalnego z dodatkiem Ni, Cu, Mo i Mn poddanego hartowaniu z przemianą izotermiczną w celu uzyskania żeliwa ADI. Na podstawie skonstruowanych wykresów CTPc i CTPi wyznaczono podstawowe parametry obrób-ki – temperaturę i czas austenityzacji, krytyczną szybkość studzenia do temperatury przemiany izotermicznej oraz dla dowolnych, wybranych wartości temperatury ausferrytyza-cji – czas ausferrytyzacji. Stwierdzono, że dla temperatury przemiany izotermicznej powyżej 400°C okno procesu jest zamknięte.
Analiza wykresu CTPi stwarza możliwość doboru czasu przemiany izotermicznej w złożonych i cyklicznych warian-tach obróbki cieplnej ADI.
Słowa kluczowe: ADI, ausferryt, wykres CTPc, wykres CTPi
1. Wstęp
ADI (Austempered Ductile Iron), żeliwo sferoidalne poddane hartowaniu z przemianą izotermiczną, charak-teryzuje się dobrymi właściwościami wytrzymałościo-wymi i plastycznymi, a obecność w strukturze grafitu kulkowego zapewnia: zdolność tłumienia drgań, skra-walność, odporność na ścieranie i korzystny stosunek wytrzymałości do masy.
Mikrostruktura żeliwa ADI składa się z grafitu kulko-wego oraz osnowy ausferrytycznej, będącej mieszaniną
© 2016 Instytut Odlewnictwa. All rights reserved.
DOI: 10.7356/iod.2016.11
Określenie optymalnych parametrów obróbki hartowania z przemianą izotermiczną żeliwa sferoidalnego Ni-Cu (Mo,Mn) na podstawie wykresów CTPc i CTPi
Determination of the optimal austempering parameters of Ni-Cu (Mo,Mn) ductile iron based on CCT and TTT diagrams
Andrzej Gazda1
1 Instytut Odlewnictwa, Centrum Badań Wysokotemperaturowych, ul. Zakopiańska 73, 30-418 Kraków1 Foundry Research Institute, Centre for High-Temperature Studies, ul. Zakopiańska 73, 30-418 Kraków, Poland
E-mail: [email protected]
Received: 31.03.2016. Accepted in revised form: 30.06.2016.
Abstract
In the research, a complex procedure was performed to determine the optimal parameters of thermal treatment of ductile iron with Ni, Cu, Mo and Mn additions which un-derwent austempering in order to obtain the ADI cast iron. Based on the constructed CCT and TTT diagrams, the basic heat treatment parameters were determined, i.e. the aus-tenitizing temperature and time, the critical rate of cooling down to the isothermal transformation temperature and – for the selected values of the austempering temperature – the austempering times. It was established that, for the isother-mal transformation temperature above 400°C, the process-ing window is closed.
The analysis of the TTT diagram makes it possible to se-lect the time of the isothermal transformation in complex cy-clic variants of the ADI thermal treatment.
Keywords: ADI, ausferrite, CCT diagram, TTT diagram
1. Introduction
ADI, i.e. Austempered Ductile Iron, is characterized by good strength and plastic properties, and the presence of nodular graphite in the structure ensures: damping capacity, machinability, abrasive resistance and an ad-vantageous strength/mass ratio.
The microstructure of the ADI cast iron consists of nodular graphite and an ausferritic matrix, which is a mixture of acicular ferrite and carbon-saturated aus-tenite. Acicular ferrite is formed during the isothermal
134 Prace IOd 2/2016
A. Gazda: Określenie optymalnych parametrów obróbki hartowania z przemianą izotermiczną żeliwa sferoidalnego …
ferrytu iglastego i austenitu nasyconego węglem. Ferryt iglasty powstaje podczas przemiany izotermicznej au-stenitu w temperaturowym zakresie tworzenia bainitu. Przemiana ta w żeliwie sferoidalnym zachodzi wolniej niż w stalach, a wysoka zawartość krzemu zapobiega tworzeniu się węglików.
W pierwszym stadium przemiany prowadzącej do powstania struktury ausferrytycznej, austenit rozkłada się na ferryt iglasty α i austenit γs(C), który w miarę zachodzenia przemiany wzbogaca się w węgiel aż do zahamowania procesu powstawania ferrytu iglastego. Rośnie stabilność nasyconego węglem austenitu wzglę-dem powstawania martenzytu podczas ochłodzenia do temperatury otoczenia. Po określonym czasie stabilno-ści struktury α + γs(C) (okno procesu) następuje drugie stadium procesu – rozkład austenitu wzbogaconego w węgiel na ferryt i fazy węglikowe Fe3C (lub ε).
Żeliwo ADI jest przedmiotem wielu badań i publikacji ze względu na swoje atrakcyjne właściwości użytkowe oraz możliwość analizy mechanizmu i kinetyki przemian fazowych prowadzących do powstania struktury ausfer-rytycznej, np. [1−6].
Dodatek pierwiastków stopowych polepsza har-towność żeliwa i ma znaczenie jedynie w odlewach grubościennych. Ponieważ przemiana ausferrytyczna rozpoczyna się w pobliżu wydzieleń węgla (obniżona zawartość węgla w austenicie), a w obszarach mię-dzydendrytycznych o podwyższonej zawartości węgla, inicjowana jest później, mogą pojawić się w strukturze stopu dwa rodzaje austenitu – wchodzący w skład aus-ferrytu (podwyższona zawartość Ni, Si) i niskowęglo-wy, niestabilny, skłonny do utworzenia martenzytu po ochłodzeniu do temperatury otoczenia. Mangan wpływa znacząco na hartowność żeliwa, lecz ponieważ w czasie krzepnięcia segreguje na granicy kolonii eutektycznych gdzie tworzy węgliki, jego zawartość nie powinna prze-kroczyć 0,3% wag. Z podobnych względów zawartość molibdenu ogranicza się do 0,2% wag. Nikiel i miedź zwiększają hartowność i plastyczność w temperaturze przemiany izotermicznej poniżej 350°C.
Podstawowymi parametrami obróbki cieplnej są: temperatura i czas austenityzacji (Ta, ta) oraz tempe-ratura i czas przemiany izotermicznej (Tpi, tpi). Wzrost temperatury austenityzacji zwiększa zawartość węgla w austenicie, zwiększając jego hartowność, ale wpływa to niekorzystnie na przebieg przemiany izotermicznej, wydłużając jej czas. Obniżenie temperatury austeni-tyzacji zwiększa siłę pędną przemiany w pierwszym stadium, lecz nie wpływa na procesy wydzielania węglików w drugim etapie przemiany. Temperatura austenityzacji powinna być zatem minimalna i wystar-czająca do nasycenia austenitu węglem do poziomu 1,1−1,3% wag.
Temperatura przemiany izotermicznej wpływa na mi-krostrukturę (właściwości mechaniczne) oraz na kinety-kę przemiany. Przemiana ausferrytyczna zachodząca w niskiej temperaturze prowadzi do wytworzenia mate-
transformation of austenite in the temperature range of bainite formation. This transformation in the ductile cast iron proceeds slower than in steels, and the high content of silicon prevents the formation of carbides.
In the first stage of the transformation leading to the formation of an ausferritic structure, austenite decom-poses into a fine acicular ferrite α and austenite γs(C), which, as the transformation proceeds, is enriched with carbon until the formation of ferrite is inhibited. There is an increase in the stability of carbon-saturated austenite in respect to martensite formation during cooling down to ambient temperature. After a certain time of structure stability α + γs(C) (processing window), the second stage of the process begins, i.e. decomposition of austenite enriched with carbon into ferrite and carbide phases Fe3C (or ε).
The ADI cast iron is the subject of many investiga-tions and publications, due to its attractive functional properties and the possibility to analyze the mechanism and kinetics of the phase transformations leading to the formation of an ausferritic structure, e.g. [1−6].
The addition of alloy elements improves the harden-ability of the cast iron and is important only in thick-walled castings. Because the ausferritic transformation begins in the vicinity of the carbon spheroids (it lowers the carbon content in the austenite), and, in the inter-dendritic areas of a higher carbon content, it is initiated later, two types of austenite can appear in the alloy structure, i.e. austenite being part of ausferrite (higher Ni and Si content) and low-carbon, unstable, austenite with a tendency to form martensite after cooling down to ambient temperature. Manganese significantly af-fects the hardenability of cast iron; however, because it segregates at the eutectic colonies boundary during solidification, where it forms carbides, its content should not exceed 0.3 wt. %. For similar reasons, the content of molybdenum is limited to 0.2 wt. %. Nickel and copper increase hardenability and plasticity at the isothermal transformation temperature below 350°C.
The basic heat treatment parameters are: the aus-tenitizing temperature and time (Ta, ta) and the iso-thermal transformation temperature and time (Tpi, tpi). An increase in the austenitizing temperature increases the carbon content in the austenite, thus increasing its hardenability, but this has a negative effect on the course of the isothermal transformation, as it prolongs its time. Lowering Ta increases the transformation driving force in the first stage, but it does not affect the process of carbide precipitation in the second stage of transforma-tion. And so, the austenitizing temperature should be minimal and sufficient for austenite saturation to the level of 1.1−1.3 wt. % of carbon.
The isothermal transformation temperature affects the microstructure (mechanical properties) and the kinet-ics of the transformation. The ausferritic transformation taking place at low temperature leads to the formation of a material with a high amount of fine acicular ferrite.
135Transactions of FRI 2/2016
A. Gazda: Determination of the optimal austempering parameters of Ni-Cu (Mo,Mn) ductile iron based on CCT and TTT …
riału o dużej ilości drobnego ferrytu iglastego. Struktura gwarantuje wysoką wytrzymałość na rozciąganie (Rm) przy niskich właściwościach plastycznych (mała ilość austenitu nasyconego węglem). Możliwe jest również powstawanie martenzytu w osnowie metalowej. W mia-rę podwyższania temperatury przemiany izotermicznej uzyskuje się pogorszenie właściwości wytrzymałościo-wych i wzrost wydłużenia (A5) [7−9].
Przedmiotem wielu publikacji, np. [10−15], jest ustale-nie optymalnych parametrów przemiany ausferrytycznej, które zazwyczaj ogranicza się do wyboru temperatury ausferrytyzacji z przedziału 230−400°C i arbitralnego, opartego na doświadczeniu doboru czasu przemiany izotermicznej oraz weryfikacji za pomocą pomiaru wła-ściwości mechanicznych.
Celem, który podjęto w niniejszej pracy, jest próba kompleksowego rozwiązania zagadnienia doboru pa-rametrów przemian za pomocą konstrukcji wykresów CTPc i CTPi, które umożliwiają dużą elastyczność w projektowaniu standardowej obróbki ADI, ale przede wszystkim są punktem wyjścia do racjonalnego projekto-wania złożonych wariantów obróbki (np. dwustopniowej, cyklicznej) przewidzianych w dalszych badaniach autora.
2. Materiał do badań
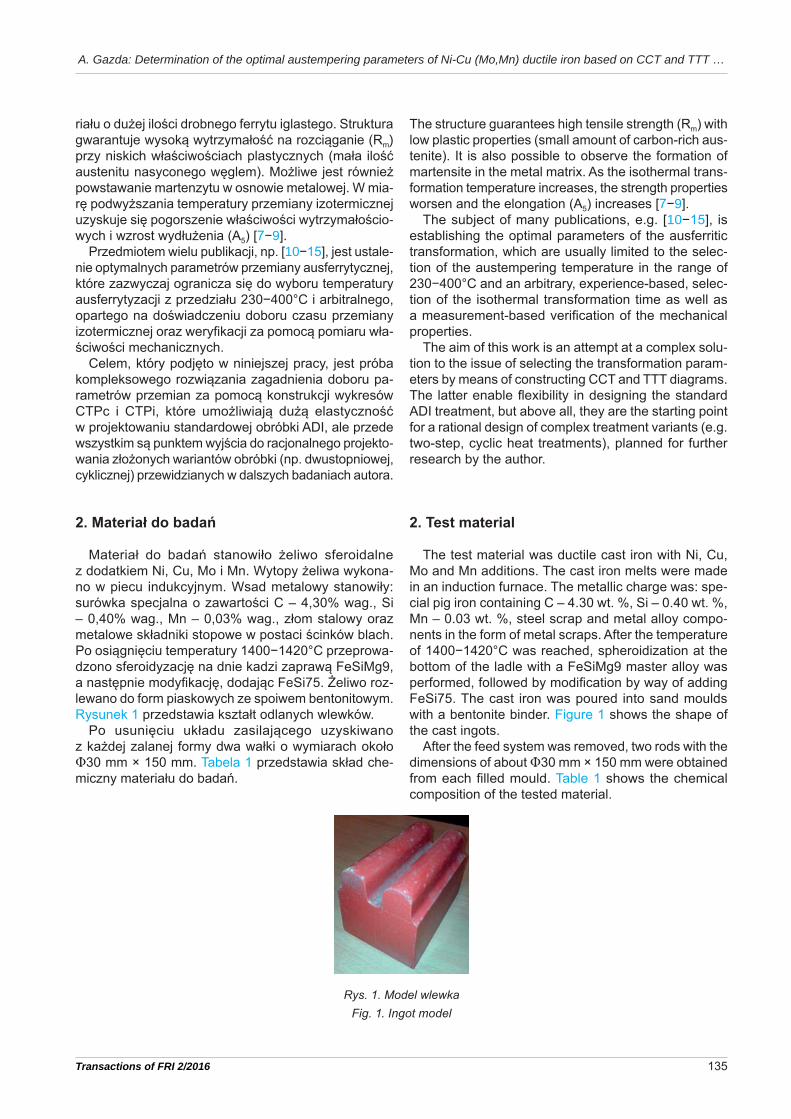
Materiał do badań stanowiło żeliwo sferoidalne z dodatkiem Ni, Cu, Mo i Mn. Wytopy żeliwa wykona-no w piecu indukcyjnym. Wsad metalowy stanowiły: surówka specjalna o zawartości C – 4,30% wag., Si – 0,40% wag., Mn – 0,03% wag., złom stalowy oraz metalowe składniki stopowe w postaci ścinków blach. Po osiągnięciu temperatury 1400−1420°C przeprowa-dzono sferoidyzację na dnie kadzi zaprawą FeSiMg9, a następnie modyfikację, dodając FeSi75. Żeliwo roz-lewano do form piaskowych ze spoiwem bentonitowym. Rysunek 1 przedstawia kształt odlanych wlewków.
Po usunięciu układu zasilającego uzyskiwano z każdej zalanej formy dwa wałki o wymiarach około Φ30 mm × 150 mm. Tabela 1 przedstawia skład che-miczny materiału do badań.
The structure guarantees high tensile strength (Rm) with low plastic properties (small amount of carbon-rich aus-tenite). It is also possible to observe the formation of martensite in the metal matrix. As the isothermal trans-formation temperature increases, the strength properties worsen and the elongation (A5) increases [7−9].
The subject of many publications, e.g. [10−15], is establishing the optimal parameters of the ausferritic transformation, which are usually limited to the selec-tion of the austempering temperature in the range of 230−400°C and an arbitrary, experience-based, selec-tion of the isothermal transformation time as well as a measurement-based verification of the mechanical properties.
The aim of this work is an attempt at a complex solu-tion to the issue of selecting the transformation param-eters by means of constructing CCT and TTT diagrams. The latter enable flexibility in designing the standard ADI treatment, but above all, they are the starting point for a rational design of complex treatment variants (e.g. two-step, cyclic heat treatments), planned for further research by the author.
2. Test material
The test material was ductile cast iron with Ni, Cu, Mo and Mn additions. The cast iron melts were made in an induction furnace. The metallic charge was: spe-cial pig iron containing C – 4.30 wt. %, Si – 0.40 wt. %, Mn – 0.03 wt. %, steel scrap and metal alloy compo-nents in the form of metal scraps. After the temperature of 1400−1420°C was reached, spheroidization at the bottom of the ladle with a FeSiMg9 master alloy was performed, followed by modification by way of adding FeSi75. The cast iron was poured into sand moulds with a bentonite binder. Figure 1 shows the shape of the cast ingots.
After the feed system was removed, two rods with the dimensions of about Φ30 mm × 150 mm were obtained from each filled mould. Table 1 shows the chemical composition of the tested material.
Rys. 1. Model wlewkaFig. 1. Ingot model
136 Prace IOd 2/2016
A. Gazda: Określenie optymalnych parametrów obróbki hartowania z przemianą izotermiczną żeliwa sferoidalnego …
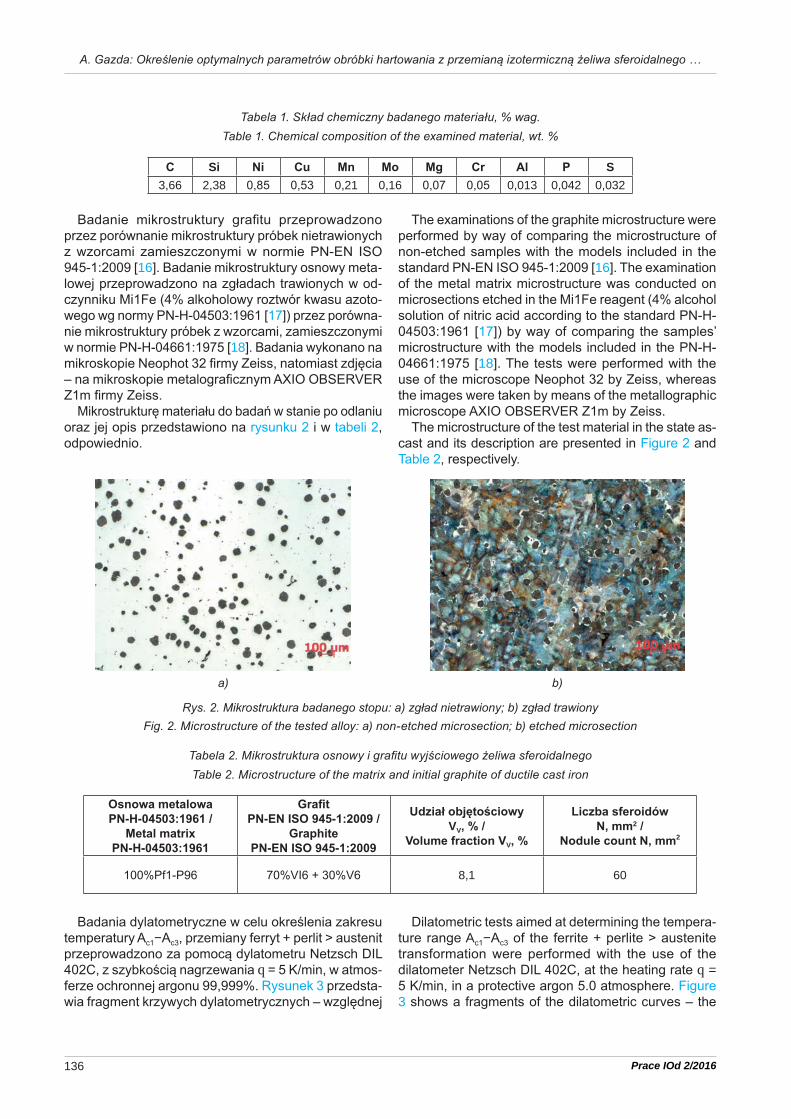
Badanie mikrostruktury grafitu przeprowadzono przez porównanie mikrostruktury próbek nietrawionych z wzorcami zamieszczonymi w normie PN-EN ISO 945-1:2009 [16]. Badanie mikrostruktury osnowy meta-lowej przeprowadzono na zgładach trawionych w od-czynniku Mi1Fe (4% alkoholowy roztwór kwasu azoto-wego wg normy PN-H-04503:1961 [17]) przez porówna-nie mikrostruktury próbek z wzorcami, zamieszczonymi w normie PN-H-04661:1975 [18]. Badania wykonano na mikroskopie Neophot 32 firmy Zeiss, natomiast zdjęcia – na mikroskopie metalograficznym AXIO OBSERVER Z1m firmy Zeiss.
Mikrostrukturę materiału do badań w stanie po odlaniu oraz jej opis przedstawiono na rysunku 2 i w tabeli 2, odpowiednio.
Badania dylatometryczne w celu określenia zakresu temperatury Ac1−Ac3, przemiany ferryt + perlit > austenit przeprowadzono za pomocą dylatometru Netzsch DIL 402C, z szybkością nagrzewania q = 5 K/min, w atmos-ferze ochronnej argonu 99,999%. Rysunek 3 przedsta-wia fragment krzywych dylatometrycznych – względnej
The examinations of the graphite microstructure were performed by way of comparing the microstructure of non-etched samples with the models included in the standard PN-EN ISO 945-1:2009 [16]. The examination of the metal matrix microstructure was conducted on microsections etched in the Mi1Fe reagent (4% alcohol solution of nitric acid according to the standard PN-H-04503:1961 [17]) by way of comparing the samples’ microstructure with the models included in the PN-H-04661:1975 [18]. The tests were performed with the use of the microscope Neophot 32 by Zeiss, whereas the images were taken by means of the metallographic microscope AXIO OBSERVER Z1m by Zeiss.
The microstructure of the test material in the state as-cast and its description are presented in Figure 2 and Table 2, respectively.
Dilatometric tests aimed at determining the tempera-ture range Ac1−Ac3 of the ferrite + perlite > austenite transformation were performed with the use of the dilatometer Netzsch DIL 402C, at the heating rate q = 5 K/min, in a protective argon 5.0 atmosphere. Figure 3 shows a fragments of the dilatometric curves – the
Tabela 1. Skład chemiczny badanego materiału, % wag.Table 1. Chemical composition of the examined material, wt. %
C Si Ni Cu Mn Mo Mg Cr Al P S3,66 2,38 0,85 0,53 0,21 0,16 0,07 0,05 0,013 0,042 0,032
Rys. 2. Mikrostruktura badanego stopu: a) zgład nietrawiony; b) zgład trawionyFig. 2. Microstructure of the tested alloy: a) non-etched microsection; b) etched microsection
a) b)
Tabela 2. Mikrostruktura osnowy i grafitu wyjściowego żeliwa sferoidalnegoTable 2. Microstructure of the matrix and initial graphite of ductile cast iron
Osnowa metalowa PN-H-04503:1961 /
Metal matrix PN-H-04503:1961
Grafit PN-EN ISO 945-1:2009 /
Graphite PN-EN ISO 945-1:2009
Udział objętościowy VV, % /
Volume fraction VV, %
Liczba sferoidów N, mm2 /
Nodule count N, mm2
100%Pf1-P96 70%VI6 + 30%V6 8,1 60
137Transactions of FRI 2/2016
A. Gazda: Determination of the optimal austempering parameters of Ni-Cu (Mo,Mn) ductile iron based on CCT and TTT …
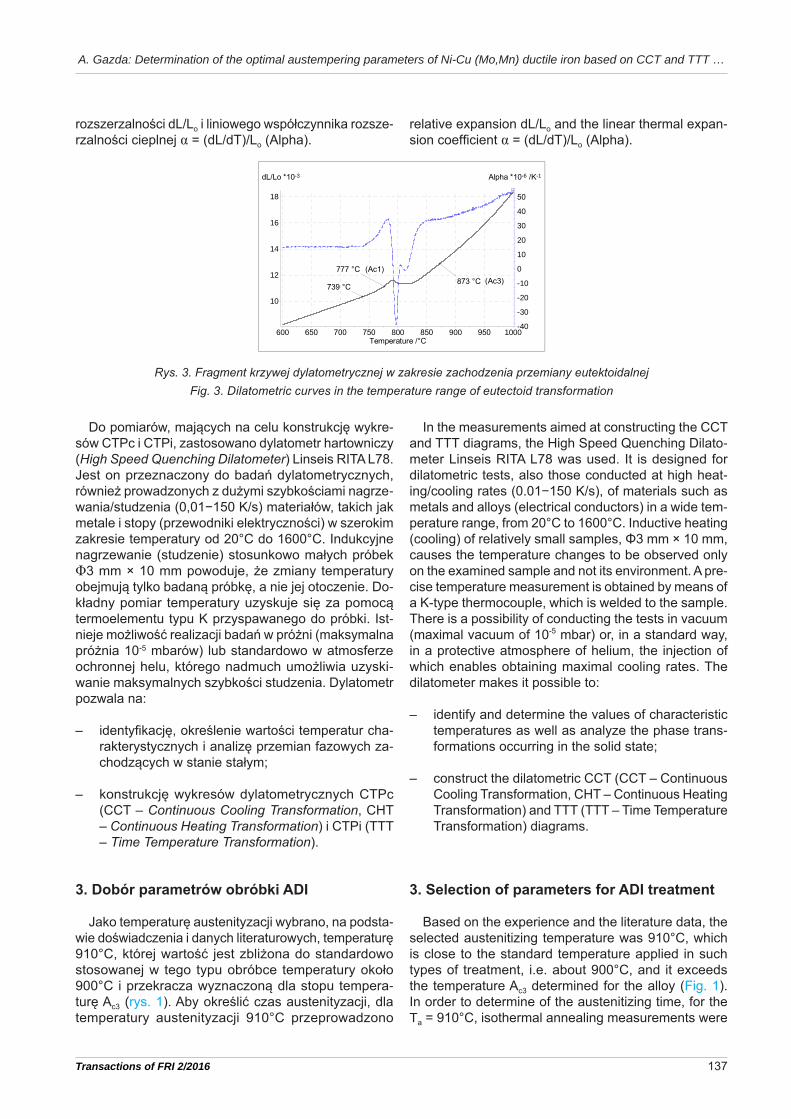
rozszerzalności dL/Lo i liniowego współczynnika rozsze-rzalności cieplnej α = (dL/dT)/Lo (Alpha).
Do pomiarów, mających na celu konstrukcję wykre-sów CTPc i CTPi, zastosowano dylatometr hartowniczy (High Speed Quenching Dilatometer) Linseis RITA L78. Jest on przeznaczony do badań dylatometrycznych, również prowadzonych z dużymi szybkościami nagrze-wania/studzenia (0,01−150 K/s) materiałów, takich jak metale i stopy (przewodniki elektryczności) w szerokim zakresie temperatury od 20°C do 1600°C. Indukcyjne nagrzewanie (studzenie) stosunkowo małych próbek Φ3 mm × 10 mm powoduje, że zmiany temperatury obejmują tylko badaną próbkę, a nie jej otoczenie. Do-kładny pomiar temperatury uzyskuje się za pomocą termoelementu typu K przyspawanego do próbki. Ist-nieje możliwość realizacji badań w próżni (maksymalna próżnia 10-5 mbarów) lub standardowo w atmosferze ochronnej helu, którego nadmuch umożliwia uzyski-wanie maksymalnych szybkości studzenia. Dylatometr pozwala na:
– identyfikację, określenie wartości temperatur cha-rakterystycznych i analizę przemian fazowych za-chodzących w stanie stałym;
– konstrukcję wykresów dylatometrycznych CTPc (CCT – Continuous Cooling Transformation, CHT – Continuous Heating Transformation) i CTPi (TTT – Time Temperature Transformation).
3. Dobór parametrów obróbki ADI
Jako temperaturę austenityzacji wybrano, na podsta-wie doświadczenia i danych literaturowych, temperaturę 910°C, której wartość jest zbliżona do standardowo stosowanej w tego typu obróbce temperatury około 900°C i przekracza wyznaczoną dla stopu tempera-turę Ac3 (rys. 1). Aby określić czas austenityzacji, dla temperatury austenityzacji 910°C przeprowadzono
relative expansion dL/Lo and the linear thermal expan-sion coefficient α = (dL/dT)/Lo (Alpha).
In the measurements aimed at constructing the CCT and TTT diagrams, the High Speed Quenching Dilato-meter Linseis RITA L78 was used. It is designed for dilatometric tests, also those conducted at high heat-ing/cooling rates (0.01−150 K/s), of materials such as metals and alloys (electrical conductors) in a wide tem-perature range, from 20°C to 1600°C. Inductive heating (cooling) of relatively small samples, Φ3 mm × 10 mm, causes the temperature changes to be observed only on the examined sample and not its environment. A pre-cise temperature measurement is obtained by means of a K-type thermocouple, which is welded to the sample. There is a possibility of conducting the tests in vacuum (maximal vacuum of 10-5 mbar) or, in a standard way, in a protective atmosphere of helium, the injection of which enables obtaining maximal cooling rates. The dilatometer makes it possible to:
– identify and determine the values of characteristic temperatures as well as analyze the phase trans-formations occurring in the solid state;
– construct the dilatometric CCT (CCT – Continuous Cooling Transformation, CHT – Continuous Heating Transformation) and TTT (TTT – Time Temperature Transformation) diagrams.
3. Selection of parameters for ADI treatment
Based on the experience and the literature data, the selected austenitizing temperature was 910°C, which is close to the standard temperature applied in such types of treatment, i.e. about 900°C, and it exceeds the temperature Ac3 determined for the alloy (Fig. 1). In order to determine of the austenitizing time, for the Ta = 910°C, isothermal annealing measurements were
5
Rys. 3. Fragment krzywej dylatometrycznej w zakresie zachodzenia przemiany eutektoidalnej
Do pomiarów, mających na celu konstrukcję wykresów CTPc i CTPi, zastosowano dylatometr
hartowniczy (High Speed Quenching Dilatometer) Linseis RITA L78. Jest on przeznaczony do badań
dylatometrycznych, również prowadzonych z dużymi szybkościami nagrzewania/studzenia (0,01–
150 K/s) materiałów, takich jak metale i stopy (przewodniki elektryczności) w szerokim zakresie tem‐
peratury od 20°C do 1600°C. Indukcyjne nagrzewanie (studzenie) stosunkowo małych próbek
3 mm × 10 mm powoduje, że zmiany temperatury obejmują tylko badaną próbkę, a nie jej otocze‐
nie. Dokładny pomiar temperatury uzyskuje się za pomocą termoelementu typu K przyspawanego do
próbki. Istnieje możliwość realizacji badań w próżni (maksymalna próżnia 10‐5 mbarów) lub standar‐
dowo w atmosferze ochronnej helu, którego nadmuch umożliwia uzyskiwanie maksymalnych szybko‐
ści studzenia. Dylatometr pozwala na:
identyfikację, określenie wartości temperatur charakterystycznych i analizę przemian fazo‐
wych zachodzących w stanie stałym;
konstrukcję wykresów dylatometrycznych CTPc (CCT – Continuous Cooling Transformation,
CHT – Continuous Heating Transformation) i CTPi (TTT – Time Temperature Transformation).
3. Dobór parametrów obróbki ADI
Jako temperaturę austenityzacji wybrano, na podstawie doświadczenia i danych literaturo‐
wych, temperaturę 910°C, której wartość jest zbliżona do standardowo stosowanej w tego typu ob‐
róbce temperatury około 900°C i przekracza wyznaczoną dla stopu temperaturę Ac3 (rys. 1). Aby
określić czas austenityzacji, dla temperatury austenityzacji 910°C przeprowadzono w dylatometrze
Linseis RITA L78 pomiary izotermicznego wygrzewania (rys. 4) i stwierdzono wyrównanie krzywej,
czyli zakończenie przemiany tworzenia austenitu po około 35–40 min.
600 650 700 750 800 850 900 950 1000Temperature /°C
10
12
14
16
18
dL/Lo *10-3
-40
-30
-20
-10
0
10
20
30
40
50
Alpha *10-6 /K-1
(Ac3)(Ac1)
739 °C
777 °C873 °C
[1][1]
Rys. 3. Fragment krzywej dylatometrycznej w zakresie zachodzenia przemiany eutektoidalnejFig. 3. Dilatometric curves in the temperature range of eutectoid transformation
138 Prace IOd 2/2016
A. Gazda: Określenie optymalnych parametrów obróbki hartowania z przemianą izotermiczną żeliwa sferoidalnego …
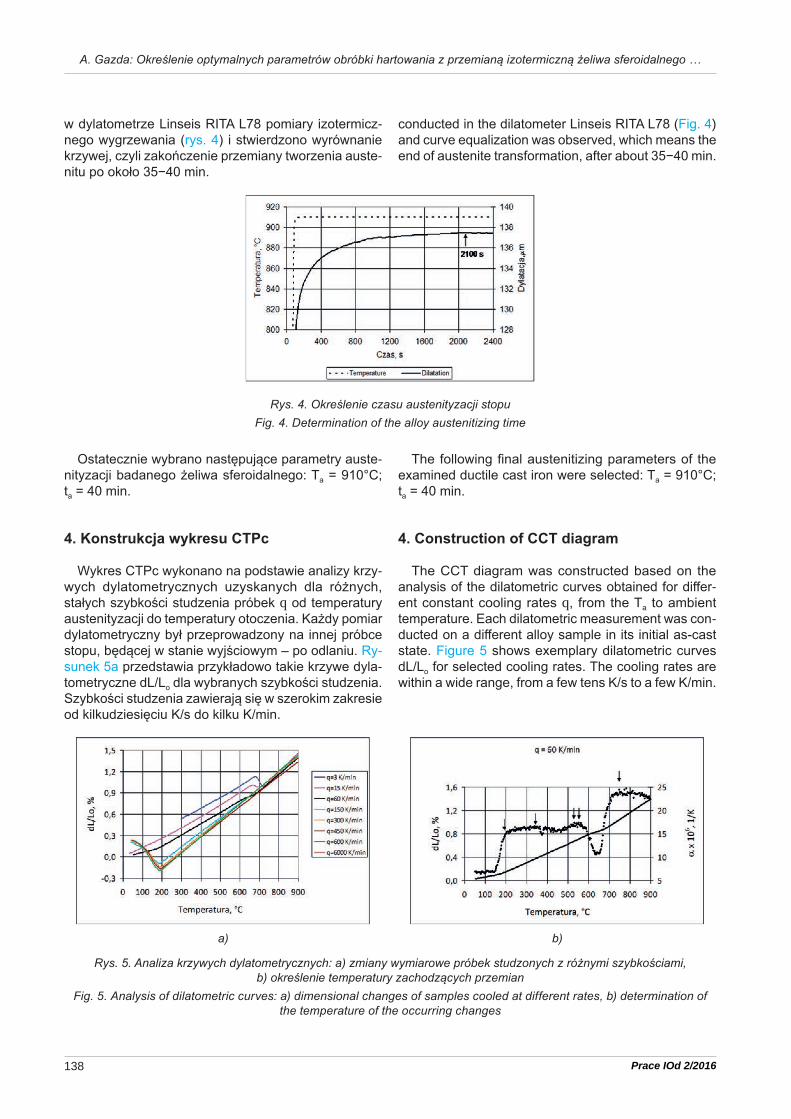
w dylatometrze Linseis RITA L78 pomiary izotermicz-nego wygrzewania (rys. 4) i stwierdzono wyrównanie krzywej, czyli zakończenie przemiany tworzenia auste-nitu po około 35−40 min.
Ostatecznie wybrano następujące parametry auste-nityzacji badanego żeliwa sferoidalnego: Ta = 910°C; ta = 40 min.
4. Konstrukcja wykresu CTPc
Wykres CTPc wykonano na podstawie analizy krzy-wych dylatometrycznych uzyskanych dla różnych, stałych szybkości studzenia próbek q od temperatury austenityzacji do temperatury otoczenia. Każdy pomiar dylatometryczny był przeprowadzony na innej próbce stopu, będącej w stanie wyjściowym – po odlaniu. Ry-sunek 5a przedstawia przykładowo takie krzywe dyla-tometryczne dL/Lo dla wybranych szybkości studzenia. Szybkości studzenia zawierają się w szerokim zakresie od kilkudziesięciu K/s do kilku K/min.
conducted in the dilatometer Linseis RITA L78 (Fig. 4) and curve equalization was observed, which means the end of austenite transformation, after about 35−40 min.
The following final austenitizing parameters of the examined ductile cast iron were selected: Ta = 910°C; ta = 40 min.
4. Construction of CCT diagram
The CCT diagram was constructed based on the analysis of the dilatometric curves obtained for differ-ent constant cooling rates q, from the Ta to ambient temperature. Each dilatometric measurement was con-ducted on a different alloy sample in its initial as-cast state. Figure 5 shows exemplary dilatometric curves dL/Lo for selected cooling rates. The cooling rates are within a wide range, from a few tens K/s to a few K/min.
Rys. 4. Określenie czasu austenityzacji stopuFig. 4. Determination of the alloy austenitizing time
Rys. 5. Analiza krzywych dylatometrycznych: a) zmiany wymiarowe próbek studzonych z różnymi szybkościami, b) określenie temperatury zachodzących przemian
Fig. 5. Analysis of dilatometric curves: a) dimensional changes of samples cooled at different rates, b) determination of the temperature of the occurring changes
a) b)

139Transactions of FRI 2/2016
A. Gazda: Determination of the optimal austempering parameters of Ni-Cu (Mo,Mn) ductile iron based on CCT and TTT …
Analiza opiera się na określeniu temperaturowych punktów początku i końca zachodzących w wyniku roz-padu austenitu przemian fazowych. Rysunek 5b przed-stawia przykładowe krzywe dylatometryczne – dylatację (dL/Lo) i fizyczny współczynnik rozszerzalności liniowej α, dla szybkości studzenia q = 60 K/min, będące pod-stawą do analizy i określenia jednego punktu wykresu CTPc. Wykorzystanie zależności współczynnika rozsze-rzalności liniowej α od temperatury ułatwia identyfikację temperatury początku i końca zachodzących przemian fazowych.
Po zakończeniu pomiaru na każdej próbce wyko-nywano dwa pomiary twardości HV30/15, na obu pła-skich powierzchniach próbek dylatometrycznych; wyniki przedstawia rysunek 6.
Wybrane próbki, po badaniach dylatometrycznych, poddano również obserwacjom metalograficznym w celu jakościowej oceny osnowy, co przedstawiają rysunki 7a−h.
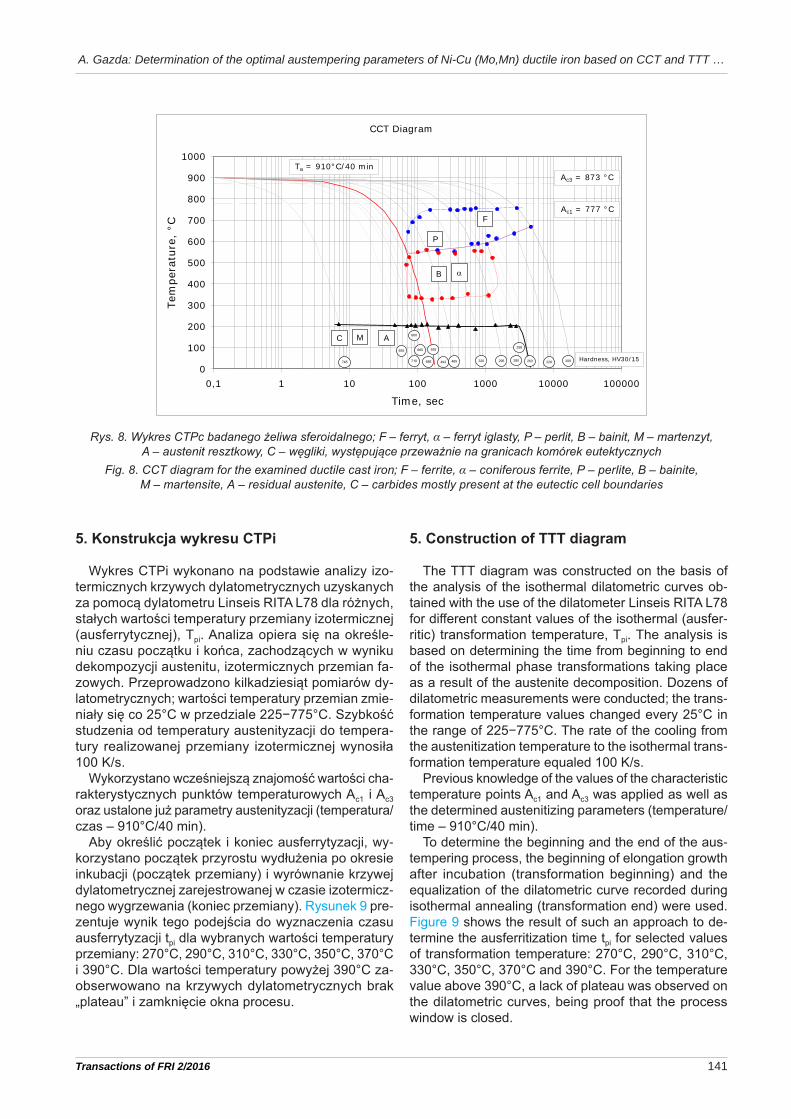
Rysunek 8 przedstawia skonstruowany na podsta-wie zebranych danych wykres CTPc badanego żeliwa sferoidalnego.
Na podstawie wykresu CTPc określono krytyczną szybkość studzenia qc, czyli minimalną szybkość stu-dzenia od temperatury austenityzacji do temperatury przemiany izotermicznej, która gwarantuje niewystę-powanie perlitu i ferrytu w strukturze; wynosi ona 5 K/s.
The analysis is based on determining the temperature points from beginning to end of the phase transformations proceeding as a result of the austenite decomposition. Figure 5b shows exemplary dilatometric curves – dilata-tion (dL/Lo) and the physical, linear coefficient of thermal expansion α, for the cooling rate q = 60 K/min, being the basis for the analysis and determination of one point in the CCT diagram. The application of the dependence of the linear expansion coefficient α on temperature facili-tates the identification of the initial and final temperature of the occurring phase transformations.
After the measurement, each sample was measured in respect of HV30/15 hardness, on both flat surfaces of the dilatometric samples. The results are presented in Figure 6.
Selected samples, after the dilatometric tests, also underwent metallographic observations for a qualitative matrix evaluation, presented in Figures 7a−h.
Figure 8 shows the CCT diagram for the examined ductile cast iron, constructed on the basis of the col-lected data.
On the basis of the CCT diagram, the critical cooling rate qc was determined, that is the minimal cooling rate from the austenitization temperature to the isothermal transformation temperature which guarantees the non-existence of pearlite and ferrite in the structure; it equals about 5 K/s.
Rys. 6. Wartości twardości HV30/15 uzyskane dla próbek studzonych z różnymi szybkościamiFig. 6. Values of HV30/15 hardness obtained for samples cooled at different rates

140 Prace IOd 2/2016
A. Gazda: Określenie optymalnych parametrów obróbki hartowania z przemianą izotermiczną żeliwa sferoidalnego …
c) d)
e) f)
g) h)
Rys. 7. Mikrostruktura próbek studzonych z szybkościami: a) 3 K/min, b) 15 K/min, c) 60 K/min, d) 150 K/min, e) 300 K/min, f) 450 K/min, g) 600 K/min i h) 6000 K/min; trawiono w Mi1Fe
Fig. 7. Microstructure of samples cooled at different rates: a) 3 K/min, b) 15 K/min, c) 60 K/min, d) 150 K/min, e) 300 K/min, f) 450 K/min, g) 600 K/min and h) 6000 K/min; etched in Mi1Fe
a) b)
141Transactions of FRI 2/2016
A. Gazda: Determination of the optimal austempering parameters of Ni-Cu (Mo,Mn) ductile iron based on CCT and TTT …
5. Konstrukcja wykresu CTPi
Wykres CTPi wykonano na podstawie analizy izo-termicznych krzywych dylatometrycznych uzyskanych za pomocą dylatometru Linseis RITA L78 dla różnych, stałych wartości temperatury przemiany izotermicznej (ausferrytycznej), Tpi. Analiza opiera się na określe-niu czasu początku i końca, zachodzących w wyniku dekompozycji austenitu, izotermicznych przemian fa-zowych. Przeprowadzono kilkadziesiąt pomiarów dy-latometrycznych; wartości temperatury przemian zmie-niały się co 25°C w przedziale 225−775°C. Szybkość studzenia od temperatury austenityzacji do tempera-tury realizowanej przemiany izotermicznej wynosiła 100 K/s.
Wykorzystano wcześniejszą znajomość wartości cha-rakterystycznych punktów temperaturowych Ac1 i Ac3 oraz ustalone już parametry austenityzacji (temperatura/czas – 910°C/40 min).
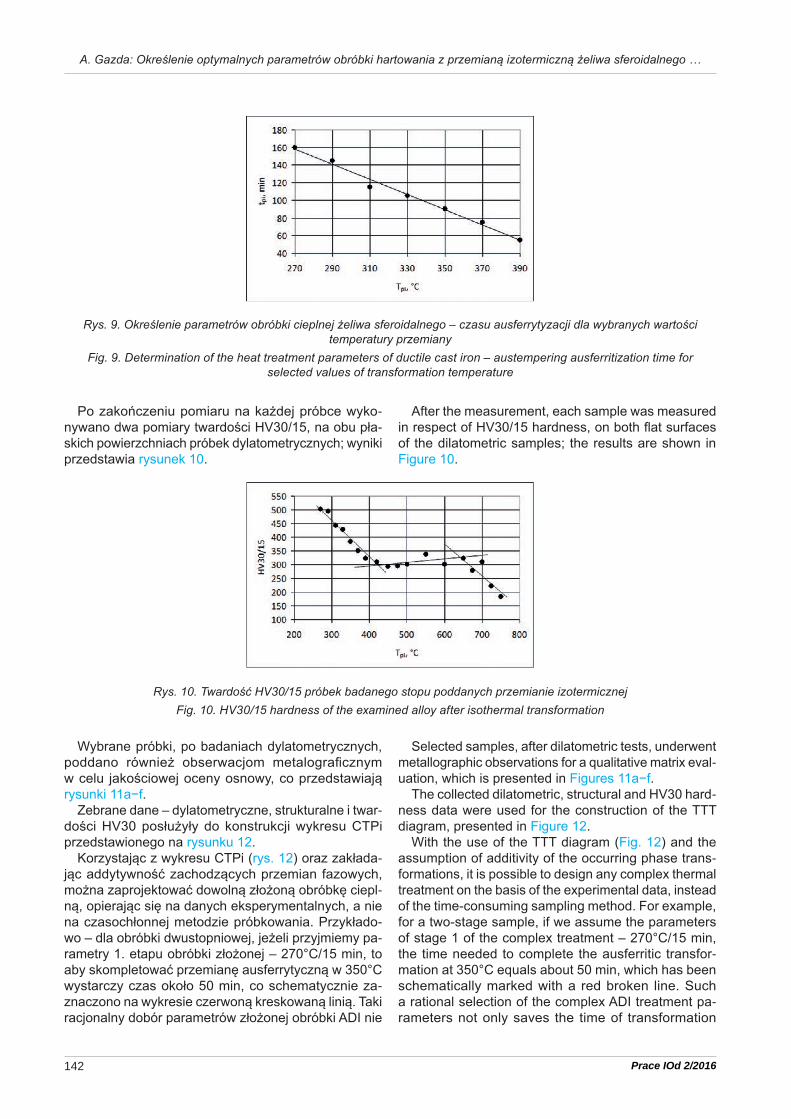
Aby określić początek i koniec ausferrytyzacji, wy-korzystano początek przyrostu wydłużenia po okresie inkubacji (początek przemiany) i wyrównanie krzywej dylatometrycznej zarejestrowanej w czasie izotermicz-nego wygrzewania (koniec przemiany). Rysunek 9 pre-zentuje wynik tego podejścia do wyznaczenia czasu ausferrytyzacji tpi dla wybranych wartości temperatury przemiany: 270°C, 290°C, 310°C, 330°C, 350°C, 370°C i 390°C. Dla wartości temperatury powyżej 390°C za-obserwowano na krzywych dylatometrycznych brak „plateau” i zamknięcie okna procesu.
5. Construction of TTT diagram
The TTT diagram was constructed on the basis of the analysis of the isothermal dilatometric curves ob-tained with the use of the dilatometer Linseis RITA L78 for different constant values of the isothermal (ausfer-ritic) transformation temperature, Tpi. The analysis is based on determining the time from beginning to end of the isothermal phase transformations taking place as a result of the austenite decomposition. Dozens of dilatometric measurements were conducted; the trans-formation temperature values changed every 25°C in the range of 225−775°C. The rate of the cooling from the austenitization temperature to the isothermal trans-formation temperature equaled 100 K/s.
Previous knowledge of the values of the characteristic temperature points Ac1 and Ac3 was applied as well as the determined austenitizing parameters (temperature/time – 910°C/40 min).
To determine the beginning and the end of the aus-tempering process, the beginning of elongation growth after incubation (transformation beginning) and the equalization of the dilatometric curve recorded during isothermal annealing (transformation end) were used. Figure 9 shows the result of such an approach to de-termine the ausferritization time tpi for selected values of transformation temperature: 270°C, 290°C, 310°C, 330°C, 350°C, 370°C and 390°C. For the temperature value above 390°C, a lack of plateau was observed on the dilatometric curves, being proof that the process window is closed.
9
Rys. 8. Wykres CTPc badanego żeliwa sferoidalnego; F – ferryt, – ferryt iglasty, P – perlit, B – bainit, M – martenzyt,
A – austenit resztkowy, C – węgliki, występujące przeważnie na granicach komórek eutektycznych
CCT Diagram
0
100
200
300
400
500
600
700
800
900
1000
0,1 1 10 100 1000 10000 100000
Time, sec
Tem
pera
ture
, °C
Ac1 = 777 °C
Ac3 = 873 °C
AM
P
F
Hardness, HV30/15745 320
660
228 209493
535
465
665
685
655
280710 295
258
B
Ta = 910°C/40 min
C
263
Rys. 8. Wykres CTPc badanego żeliwa sferoidalnego; F – ferryt, α – ferryt iglasty, P – perlit, B – bainit, M – martenzyt, A – austenit resztkowy, C – węgliki, występujące przeważnie na granicach komórek eutektycznych
Fig. 8. CCT diagram for the examined ductile cast iron; F – ferrite, α – coniferous ferrite, P – perlite, B – bainite, M – martensite, A – residual austenite, C – carbides mostly present at the eutectic cell boundaries
142 Prace IOd 2/2016
A. Gazda: Określenie optymalnych parametrów obróbki hartowania z przemianą izotermiczną żeliwa sferoidalnego …
After the measurement, each sample was measured in respect of HV30/15 hardness, on both flat surfaces of the dilatometric samples; the results are shown in Figure 10.
Selected samples, after dilatometric tests, underwent metallographic observations for a qualitative matrix eval-uation, which is presented in Figures 11a−f.
The collected dilatometric, structural and HV30 hard-ness data were used for the construction of the TTT diagram, presented in Figure 12.
With the use of the TTT diagram (Fig. 12) and the assumption of additivity of the occurring phase trans-formations, it is possible to design any complex thermal treatment on the basis of the experimental data, instead of the time-consuming sampling method. For example, for a two-stage sample, if we assume the parameters of stage 1 of the complex treatment – 270°C/15 min, the time needed to complete the ausferritic transfor-mation at 350°C equals about 50 min, which has been schematically marked with a red broken line. Such a rational selection of the complex ADI treatment pa-rameters not only saves the time of transformation
Po zakończeniu pomiaru na każdej próbce wyko-nywano dwa pomiary twardości HV30/15, na obu pła-skich powierzchniach próbek dylatometrycznych; wyniki przedstawia rysunek 10.
Wybrane próbki, po badaniach dylatometrycznych, poddano również obserwacjom metalograficznym w celu jakościowej oceny osnowy, co przedstawiają rysunki 11a−f.
Zebrane dane – dylatometryczne, strukturalne i twar-dości HV30 posłużyły do konstrukcji wykresu CTPi przedstawionego na rysunku 12.
Korzystając z wykresu CTPi (rys. 12) oraz zakłada-jąc addytywność zachodzących przemian fazowych, można zaprojektować dowolną złożoną obróbkę ciepl-ną, opierając się na danych eksperymentalnych, a nie na czasochłonnej metodzie próbkowania. Przykłado-wo – dla obróbki dwustopniowej, jeżeli przyjmiemy pa-rametry 1. etapu obróbki złożonej – 270°C/15 min, to aby skompletować przemianę ausferrytyczną w 350°C wystarczy czas około 50 min, co schematycznie za-znaczono na wykresie czerwoną kreskowaną linią. Taki racjonalny dobór parametrów złożonej obróbki ADI nie
Rys. 9. Określenie parametrów obróbki cieplnej żeliwa sferoidalnego – czasu ausferrytyzacji dla wybranych wartości temperatury przemiany
Fig. 9. Determination of the heat treatment parameters of ductile cast iron – austempering ausferritization time for selected values of transformation temperature
Rys. 10. Twardość HV30/15 próbek badanego stopu poddanych przemianie izotermicznejFig. 10. HV30/15 hardness of the examined alloy after isothermal transformation

143Transactions of FRI 2/2016
A. Gazda: Determination of the optimal austempering parameters of Ni-Cu (Mo,Mn) ductile iron based on CCT and TTT …
tylko oszczędza czas realizacji 2. etapu przemiany, ale przede wszystkim eliminuje ryzyko przekroczenia okna procesu, czyli niepożądanego rozpadu austenitu wzbo-gaconego w węgiel na ferryt i fazy węglikowe.
stage 2 but, above all, eliminates the risk of exceeding the processing window, which is the undesired decom-position of the austenite enriched with carbon into ferrite and carbide phases.
c) d)
e) f)
Rys. 11. Mikrostruktura próbek po przemianie izotermicznej w temperaturze: a) 270°C, b) 310°C, c) 350°C, d) 390°C, e) 450°C i f) 500°C; trawiono w Mi1Fe
Fig. 11. Microstructure of samples after isothermal transformation at selected temperatures: a) 270°C, b) 310°C, c) 350°C, d) 390°C, e) 450°C and f) 500°C; etched in Mi1Fe
a) b)

144 Prace IOd 2/2016
A. Gazda: Określenie optymalnych parametrów obróbki hartowania z przemianą izotermiczną żeliwa sferoidalnego …
12
(e) (f)
Rys.11. Mikrostruktura próbek po przemianie izotermicznej w temperaturze: 270°C (a), 310°C (b), 350°C (c), 390°C (d),
450°C (e) I 500°C (f); trawiono w Mi1Fe
Zebrane dane – dylatometryczne, strukturalne i twardości HV30 posłużyły do konstrukcji
wykresu CTPi przedstawionego na rysunku 12.
Rys. 12. Wykres CTPi badanego żeliwa sferoidalnego; AF – ausferryt, F – ferryt, P – perlit, M – martenzyt, A – austenit reszt‐
kowy
Korzystając z wykresu CTPi (rys.24) oraz zakładając addytywność zachodzących przemian
fazowych, można zaprojektować dowolną złożoną obróbkę cieplną, opierając się na danych ekspery‐
Rys. 12. Wykres CTPi badanego żeliwa sferoidalnego; AF – ausferryt, F – ferryt, P – perlit, M – martenzyt, A – austenit resztkowy
Fig. 12. TTT diagram of ductile cast iron; AF – ausferrite, F – ferrite, P – perlite, M – martensite, A – residual austenite
6. Wnioski
Stosując metodę dylatometryczną i dylatometr har-towniczy Linseis RITA L78, skonstruowano wykresy CTPc i CTPi dla badanego gatunku stopowego żeliwa sferoidalnego CuNiMoMn.
W wyniku analizy wykresów CTPc i CTPi uzupełnionej badaniami metalograficznymi i pomiarami twardości HV30/15 ustalono następujące wartości parametrów obróbki cieplnej ADI badanego stopu:
– austenityzacja: Ta = 910°C; ta = 40 min,
– ausferrytyzacja: Tpi = 270°C; tpi = 150 min, Tpi = 310°C; tpi = 120 min, Tpi = 350°C; tpi = 90 min, Tpi = 390°C; tpi = 60 min,
– szybkość krytyczna: qc = 5 K/s.
Stwierdzono, że dla temperatury przemiany izoter-micznej powyżej 400°C okno procesu dla stopu o ba-danym składzie chemicznym jest zamknięte.
Wykres CTPi umożliwia racjonalny dobór parame-trów złożonej (np. dwustopniowej) obróbki cieplnej ADI, skracając czas końcowego etapu i minimalizując ryzyko przekroczenia granicy okna procesu ausferry-tyzacji.
6. Conclusions
By means of the dilatometric method and the quench-ing dilatometer Linseis RITA L78, the CCT and TTT dia-grams were constructed for the selected type of ductile alloy cast iron, CuNiMoMn.
As a result of the analysis of the CCT and TTT di-agrams, complemented by metallographic tests and HV30/15 hardness measurements, the following values of the ADI heat treatment parameters for the examined alloy were determined:
– austenitizing: Ta = 910°C; ta = 40 min,
– austempering: Tpi = 270°C; tpi = 150 min, Tpi = 310°C; tpi = 120 min, Tpi = 350°C; tpi = 90 min, Tpi = 390°C; tpi = 60 min,
– critical cooling rate: qc = 5 K/s.
It was established that, for the isothermal transforma-tion temperature above 400°C, the processing window for an alloy of the examined chemical composition is closed.
The TTT diagram enables a rational selection of the parameters of the complex (two-step) ADI thermal treat-ment, thus shortening the time of the final stage and minimizing the risk of crossing the boundary of the aus-tempering processing window.
145Transactions of FRI 2/2016
A. Gazda: Determination of the optimal austempering parameters of Ni-Cu (Mo,Mn) ductile iron based on CCT and TTT …
Podziękowanie
Pracę wykonano w ramach finansowanego przez Na-rodowe Centrum Nauki projektu Nr UMO-2013/09/B/ST8/02061.
Acknowledgements
This work was financially supported by Polish National Science Center; grant No. UMO-2013/09/B/ST8/02061.
Literatura/References
1. Chang C. H., T. S. Shih. 1994. „Ausferrite transformation in austempered alloyed ductile irons”. Transactions of the Japan Foundrymen's Society 13 : 56−63.
2. Delia M., M. Alaalam, M. Grech. 1998. „Effect of austenitizing conditions on the impact properties of an alloyed austem-pered ductile iron of initially ferritic matrix structure”. Journal of Materials Engineering and Performance 7 (2) : 265−272.
3. Bayati H., R. Elliott. 1999. „The concept of an austempered heat treatment processing window”. International Journal of Cast Metals Research 11 (5) : 413−417.
4. Hafiz M. 2003. „Influence of heat treatment parameters in variable austempering temperature process on mechanical properties and fracture of SG-iron”. AFS Transactions 111 : 03−035.
5. Liu S.-F., Z.-F. Wang. 2005. „Mechanical Property Stability of Cu-Mo-Ni Alloyed Austempered Ductile Iron”. Journal of Iron and Steel Research, International 12 (5) : 34−38.
6. Nofal A. A. 2013. „Advances in Metallurgy and Applications of ADI”. Journal of Metallurgical Engineering 2 (1) : 1−18.7. Kovacs B. V. 1994. On the Terminology and Structure of ADI. W Ninety-Eighth Annual Meeting of the American
Foundrymen's Society, 417−420.8. Yescas M. A., H. K. D. H. Bhadeshia, 2002. „Model for the maximum fraction of retained austenite in austempered
ductile cast iron”. Materials Science and Engineering: A 333 (1−2) : 60−66.9. Batra U., S. Ray, S. R. Prabhakar. 2004. „The influence of nickel and copper on the austempering of ductile iron”.
Journal of Materials Engineering and Performance 13 (1) : 64−68.10. Grech M., J. M. Young. 1990. „Influence of Austempering Temperature on the Characteristics of Austempered Ductile
Iron Alloyed with Copper and Nickel”. Transactions of the American Foundrymen's Society 98 : 345−352.11. Shih T.-S., L.-R. Hwang. 1995. „Determination of critical cooling rates for the ausferrite transformation in ADIs”.
Transactions of the Japan Foundrymen's Society 14 : 48−58.12. Zimba J., D. J. Simbi, T. Chandra, E. Navara. 2000. „A Dilatometry Study of the Austenitization and Cooling Behavior
of Ductile Iron Meant for the Production of Austempered Ductile Iron (ADI)”. Materials and Manufacturing Processes 19 (5) : 907−920.
13. Batra U., S. Ray, S. R. Prabhakar. 2003. „Effect of Austenitization on Austempering of Copper Alloyed Ductile Iron”. Journal of Materials Engineering and Performance 12 (5) : 597−601.
14. Krzyńska A., M. Kaczorowski. 2010. „The studies of mechanical properties and structure of ADI as function of aus-tempering parameters”. Archives of Foundry Engineering 10 (4) : 41−44.
15. Vaško A. 2011. „Influence of Transformation Temperature on Structure and Mechanical Properties of Austempered Ductile Iron”. Acta Metallurgica Slovaca 17 (1) : 45−50.
16. PN-EN ISO 945-1:2009 Mikrostruktura żeliwa – Część 1: Klasyfikacja wydzieleń grafitu na podstawie analizy wizualnej.17. PN-H-04503:1961 Odczynniki do badania mikrostruktury stopów żelaza.18. PN-H-04661:1975 Żeliwo szare sferoidalne i ciągliwe – Badania metalograficzne – Określenie mikrostruktury.