OFICYNA WYDAWNICZA - Administracjaadministracja.sgh.waw.pl/pl/OW/publikacje/Documents...Polska i...
406
Transcript of OFICYNA WYDAWNICZA - Administracjaadministracja.sgh.waw.pl/pl/OW/publikacje/Documents...Polska i...


OFICYNA WYDAWNICZASZKOŁA GŁÓWNA HANDLOWA W WARSZAWIE
WARSZAWA 2016
RecenzentIlona Romiszewska
Redakcja tekstów w języku polskimViktoryia Sidar
© Copyright by Szkoła Główna Handlowa w Warszawie, Warszawa 2016Wszelkie prawa zastrzeżone. Kopiowanie, przedrukowywanie i rozpowszechnianie całości lub fragmentów niniejszej publikacji bez zgody wydawcy zabronione.
Wydanie I
ISBN 978-83-8030-042-2
Szkoła Główna Handlowa w Warszawie – Oficyna Wydawnicza 02-554 Warszawa, al. Niepodległości 162tel. +48 22 564 94 77, 22 564 95 46www.wydawnictwo.sgh.waw.ple-mail: [email protected]
Projekt i wykonanie okładki Monika Trypuz
Skład i łamanieDM Quadro
Druk i oprawaQUICK-DRUK s.c. e-mail: [email protected]
Zamówienie 92/V/16

SPIS TREŚCI
HerausgeberPrzedmowa – Vorwort . . . . . . . . . . . . . . . . . . . . . . . . . . . . . . . . . . . . . . . . . . . 7
Jürgen Wandel„Europa 2020” – eine Vision einer europäischen sozialen Marktwirtschaft? . . . . . . . . . . . . . . . . . . . . . . . . . . . . . . . . . . . . . . . . . . . . . . . 11
Józef OlszyńskiPolityka europejska Niemiec w latach 2012–2013 . . . . . . . . . . . . . . . . . . . . . 43
Józef OlszyńskiZmiany w polityce europejskiej Niemiec w latach 2014–2015 . . . . . . . . . . . . 61
Thomas ApolteStabilitätspolitik und Geldpolitik in Europa vor dem Hintergrund der Griechenland-Krise . . . . . . . . . . . . . . . . . . . . . . . . . . . . . . . . . . . . . . . . . . 81
Hubertus BardtBarriers for more investments in Germany . . . . . . . . . . . . . . . . . . . . . . . . . . 99
Witold MałachowskiRola przemysłu w gospodarce Niemiec i Polski po rozszerzeniu UE na Wschód . . . . . . . . . . . . . . . . . . . . . . . . . . . . . . . . . . . . . . . . . . . . . . . . . . . . 111
Andreas BieligInnovation, competition and competitiveness of the German economy and the role of intellectual property protection . First evidence of a new approach . . . . . . . . . . . . . . . . . . . . . . . . . . . . . . . . . . . . . . . . . . . . . . . . . . . . . 127
Elżbieta Czarny, Katarzyna ŚledziewskaHandel produktami o różnym zaawansowaniu technologicznym między Polską a Niemcami i UE15 . . . . . . . . . . . . . . . . . . . . . . . . . . . . . . . . . . . . . . . 173
Krystyna PoznańskaWspieranie innowacyjności w gospodarce niemieckiej . . . . . . . . . . . . . . . . . 193
Andreas BieligBetween Lisbon Agenda and Europe 2020 . Status quo and problems of innovation policy in the German economy . . . . . . . . . . . . . . . . . . . . . . . . . 221
Spistreści6
Ewa Sońta-DrączkowskaStrategie kreowania i wdrażania innowacji na przykładzie wybranych przedsiębiorstw niemieckich . . . . . . . . . . . . . . . . . . . . . . . . . . . . . . . . . . . . . . 251
Piotr KalkaRealizacja przez Polskę strategii „Europa 2020” w zakresie prac badawczych i rozwojowych . . . . . . . . . . . . . . . . . . . . . . . . . . . . . . . . . . . . . . . 279
Jürgen WandelThe political economy of energy policy in Germany in the context of Europe 2020 and its implications for Poland . . . . . . . . . . . . . . . . . . . . . . . 293
Grażyna Wojtkowska-ŁodejW kierunku poprawy efektywności energetycznej – przedsięwzięcia Unii Europejskiej i ich implikacje dla Polski i Niemiec . . . . . . . . . . . . . . . . . . 337
Tomasz BakońRepowering jako metoda poprawy efektywności energetycznej odnawialnych źródeł energii w Niemczech i Polsce . . . . . . . . . . . . . . . . . . . . 357
Ewa Sońta-DrączkowskaInnovation strategies in the telecommunications industry: Organizational challenges based on a case study of Deutsche Telekom in Germany and Poland . . . . . . . . . . . . . . . . . . . . . . . . . . . . . . . . . . . . . . . . . . . . . . . . . . . . 373
Bartosz DeszczyńskiDie Kooperation zwischen Volkswagen Group und Kulczyk Tradex in dem CRM Implementierungsprozess . . . . . . . . . . . . . . . . . . . . . . . . . . . . . 393

PRZEDMOWA
W roku 2010 państwa członkowskie Unii Europejskiej, przyjmując strategię „Europa 2020”, uchwaliły kolejną strategię po strategii lizbońskiej. Nowa stra-tegia dla wspólnej polityki gospodarczej i społecznej już w nazwie przekazuje swoje najważniejsze cele: poprzez zobowiązanie państw europejskich do zgod-nego wspólnego działania w istotnych politycznie obszarach powinien zostać osiągnięty inteligentny, zrównoważony i sprzyjający włączeniu społecznemu wzrost gospodarczy w Europie. Aby urzeczywistnić te trzy priorytetowe cele nadrzędne, ustanowiono wymierne cele przewodnie na szczeblu Unii Europej-skiej odnoszące się do zatrudnienia, badań naukowych i innowacji, ochrony klimatu, energii, edukacji i walki z ubóstwem. Na podstawie realizacji tych celów powinien zostać oceniony sukces zarówno każdej polityki krajowej, jak i polityki europejskiej. Polska i Niemcy w roku 2015 znajdują się w połowie drogi do zakończenia tej obszernej i ambitnej strategii. Niniejszej publikacji przyświeca cel opisania starań oraz sukcesów obydwu państw sąsiedzkich podczas pracy nad wdrażaniem strategii „Europa 2020”. Czternastu autorów z Polski i Niemiec w siedemnastu artykułach naukowych bada aktualny rozwój gospodarczy w ramach realizacji najnowszej strategii w Polsce i w Niemczech, w polsko-niemieckich stosunkach gospodarczych oraz na poziomie europej-skim wraz ze skutkami dla obydwu sąsiadujących ze sobą krajów. Teksty napi-sane w języku polskim, niemieckim i angielskim traktują o ważnych aspektach polityki gospodarczej, polityki europejskiej oraz gospodarczo-politycznych ten-dencjach rozwojowych w różnych sektorach. Spektrum tematów poddanych badaniom w niniejszej publikacji jest szerokie. Istotnymi hasłami są tutaj: socjalna gospodarka rynkowa, Europa, polityka stabilizacyjna i pieniężna, han-del zagraniczny, inwestycje i stosunki gospodarcze, konkurencyjność, badania naukowe i rozwój, innowacje, efektywność energetyczna i odnawialne źródła energii. To samo dotyczy poziomu badań oraz wybranej przez autorów formy analizy. W ten sposób Czytelnik otrzymuje nie tylko obszerny, lecz także róż-norodny obraz aktualnej sytuacji, w której znajdują się Polska i Niemcy oraz polsko-niemieckie stosunki gospodarcze, w odniesieniu do procesu integracji europejskiej, a w szczególności dotyczącej stanu, który został osiągnięty dotąd

Przedmowa8
w ramach strategii „Europa 2010”. Zapraszamy Czytelnika nie tylko do lek-tury bogatego w informacje tomu, lecz także zachęcamy Go, aby za pomocą zawartych w niniejszej książce obszernych dokumentacji ukształtował własny pogląd na temat: gdzie obecnie znajdują się Polska i Niemcy na ich wspólnej drodze do Europy? Życzymy, aby sprawiło to Państwu wiele przyjemności.
Józef Olszyński, Andreas Bielig i Jürgen Wandel
VORWORT
Im Jahr 2010 verabschiedeten die Mitgliedstaaten der Europäischen Union mit der „Strategie Europa 2020” eine Nachfolgestrategie der Lissabon Stra-tegie. Die neue Strategie für eine gemeinsame Wirtschafts- und Sozialpolitik in Europa trägt ihre wesentlichen Ziele bereits im Namen: Über die Verpflich-tung der europäischen Länder auf ein abgestimmtes und gemeinsames Han-deln in wichtigen politischen Aktionsfeldern soll ein intelligentes, nachhaltiges und integratives Wachstum in Europa erreicht werden. Für die Verwirklichung dieser drei prioritären Oberziele wurden messbare Leitziele für die EU-Ebene verankert, welche sich auf die Bereiche der Beschäftigung, von Forschung und Innovation, Klimaschutz und Energie sowie Bildung und Armutsbekämpfung beziehen. An der Erfüllung dieser Ziele sollte der Erfolg sowohl der nationalen Politiken als auch derjenige der europäischen Politik gemessen werden. Polen und Deutschland befinden sich im Jahr 2015 auf dem halbem Weg zum Ablauf des komplexen und ambitionierten Strategiepakets. Diese Publikation dient dem Ziel, die Bemühungen und Erfolge beider Nachbarstaaten während der Arbeit der Umsetzung der Strategie nachzuzeichnen. Vierzehn Autoren aus Polen und Deutschland untersuchen in siebzehn Beiträgen aktuelle wirtschaftliche Ent-wicklungen im Rahmen der Strategieerfüllung in Polen und in Deutschland, in den polnisch-deutschen Wirtschaftsbeziehungen sowie auf der europäischen Ebene mit ihren Implikationen für die beiden benachbarten Partnerländer. Die in polnischer, deutscher und in englischer Sprache verfassten Beiträge befas-sen sich mit wichtigen Aspekten der allgemeinen Wirtschaftpolitik, der Europa-politik sowie sektoralen industriepolitischen Entwicklungen. Die Bandbreite der in dieser Publikation untersuchten Thematiken ist weit gestaltet. Wesentli-che Stichworte hierfür sind Soziale Marktwirtschaft, Europa, Stabilitäts- und Geldpolitik, Außenhandel, Investitionen und Wirtschaftskooperationen, Wettbe-werbsfähigkeit, Forschung und Entwicklung, Innovation, Energieeffizienz und erneuerbare Energien. Gleiches gilt auch für die Untersuchungsebene sowie die durch die Autoren gewählte Form der Analyse. Dadurch soll dem Leser nicht nur ein umfassendes, sondern auch facettenreiches Bild der gegenwär-tigen Situation verschafft werden, in der sich Polen und Deutschland sowie
Vorwort10
die polnisch-deutschen Wirtschaftsbeziehungen befinden, im Hinblick auf den europäischen Integrationsprozess und insbesondere bezogen auf den Ergebnis-stand, welcher im Rahmen der „Strategie Europa 2020“ bisher erreicht wurde. Wir möchten den Leser nicht nur zur Lektüre des informativen und fachkun-digen Bands einladen, sondern ihn gleichzeitig dazu ermuntern, sich anhand der umfangreichen Dokumentationen selbst eine eigene Auffassung zu bilden, wo Polen und Deutschland auf ihrem gemeinsamen Weg zu Europa gegenwär-tig stehen. Hierbei wünschen wir ihnen gern viel Vergnügen!
Jozef Olszynski, Andreas Bielig & Jürgen Wandel

Jürgen WANDEL*
„EUROPA 2020” – EINE VISION EINER EUROPÄISCHEN SOZIALEN
MARKTWIRTSCHAFT?
„Es gibt eben keine andere Wahl als die: entweder von isolierten Eingriffen in das Spiel des Marktes abzusehen oder aber die gesamte Leitung der Produk-tion und der Verteilung an die Obrigkeit zu übertragen. Entweder Kapitalismus
oder Sozialismus; ein Mittelding gibt es nicht (L. v. Mises, 1929/1976, S. 11).
Wenn man glaubt, daß das Wirtschaftsleben eines riesigen Gebietes, das viele verschiedene Völker umfaßt, auf Grund eines demokratischen Verfahrens
gelenkt und geplant werden könne, so verrät man völlige Unkenntnis der Pro-bleme… Noch mehr als die nationale würde die internationale Planwirtschaft
nichts anderes als eine nackte Gewaltherrschaft sein, in der eine kleine Gruppe allen übrigen Lebensstandard und Arbeit so vorschreibt, wie sie es für richtig
hält (F. A. v. Hayek 1944/2011, S. 275).
1. Einleitung
Die europäischen Staats- und Regierungschefs haben am 17. Juni 2010 eine neue Wachstumsstrategie für die nächsten 10 Jahre unter dem Titel „Europa 2020 – eine Strategie für intelligentes, nachhaltiges und integratives Wachs-tum” verabschiedet. Sie ist das Nachfolgeprogramm der Lissabon-Strategie des Jahres 2000. Die erklärten Ziele sind die Überwindung der Euro-Krise und die Vorbereitung der Wirtschaft der Europäischen Union (EU) auf das nächste Jahrzehnt durch die Förderung eines intelligenten, nachhaltigen und integ-rativen wirtschaftlichen Wachstums mit einem hohen Beschäftigungs- und
* Research Centre for the German Economy, World Economy Research Institute, SGH Warsaw School of Economics, * e-mail: [email protected]

Jürgen Wandel 12
Produktivitätsniveau sowie mit sozialer Kohäsion und ökologischer Nachhal-tigkeit. Der damalige Kommissionspräsident der EU, José Manuel Barroso, sprach in dem Zusammenhang davon, dass mit der neuen Agenda auch eine „Vision der europäischen sozialen Marktwirtschaft für das 21. Jahrhunderts” formuliert und umgesetzt werden soll.
Der vorliegende Beitrag diskutiert diesen Anspruch. Dazu wird analysiert welche Vision europäischer sozialer Marktwirtschaft in „Europa 2020” ange-legt ist und ob diese geeignet ist, der EU und ihren Mitgliedsländern neue wirtschaftlichen Perspektive zu eröffnen. Dazu wird wird vorrangig auf theo-retische Einsichten der Ordnungsökonomik, der Österreichischen Schule, der Institutionenökonomik und Public Choice Theorie zurückgegriffen, da diese Ansätze sich besonders intensiv mit Wirtschaftsordnungen sowie der damit verbunden Frage nach der Rolle und Beziehung von Staat, Wettbewerb und wirtschaftlichem Wachstum beschäftigen.
Im Folgenden werden in Abschnitt 2 zunächst kurz die Hintergründe und Hauptzielsetzungen der Wachstumsstrategie „Europa 2020” dargestellt. Dann diskutiert Abschnitt 3 die Frage, was denn eigentlich eine soziale Marktwirt-schaft ist und was das für die europäische Integration impliziert. Da der Begriff der sozialen Marktwirtschaft seinen Ursprung im Deutschland der Nachkriegs-zeit hat, dient dabei als Referenzmodell die Wirtschaftsordnung, wie sie kon-zeptionell von Alfred Müller-Armack (1901–1978) entwickelt und politisch von Ludwig Erhard (1897–1977) nach 1949 in der Bundesrepublik Deutschland zum Durchbruch verholfen wurde. Anschließend versucht Abschnitt 4 mithilfe dieses Referenzmodells die Vision von sozialer Marktwirtschaft einzuordnen, wie es sich aus dem Dokument der EU Kommission zu „Europa 2020” heraus-lesen lässt. Abschnitt 5 enthält dann Überlegungen zu den Erfolgsaussuchten dieser Vision. Der Beitrag endet mit einem Fazit und Ausblick (Abschnitt 6).
2. Hintergrund und Zielsetzungen von „Europa 2020”
Den Hintergrund für die Verabschiedung von „Europa 2020” bilden die anhaltenden wirtschaftlichen Probleme der EU. Wie Abb. 1 zeigt, weist die EU nicht erst seit der globalen Finanz- sowie Euro- und Staatsschuldenkrise ein relativ geringes Wirtschaftswachstum auf. Auch schon davor lag das Wachstum in der Regel hinter den USA zurück, aber auch gegenüber neu aufstrebenden Volkswirtschaften aus den sogenannten BRIC–Ländern.

„Europa 2020” – eine Vision einer europäischen sozialen Marktwirtschaft 13
Auch im internationalen Wettbewerb um Investitionen (Abb. 2) und Inno-vationen (Tabelle 1) liegt die EU zurück.
Ohne die durch Investitionen und Innovationen einhergehende Kapitalin-tensivierung bleibt eine nachhaltige Steigerung der Produktivität aus. Kaum verwunderlich, dass dann auch die Arbeitslosigkeit im EU-Raum höher liegt als in den USA, aber auch den beiden größten BRIC–Ländern (Abb. 3).
Ein weiteres ernsthaftes Problem der EU ist die sehr hohe Staatsverschul-dung mit mittlerweile fast 90% des BIP insbesondere in den Kernländern der EU sowie der Eurozone – ein Wert der allgemein als bedenklich für das Wirt-schaftswachstum gilt.1 Und schließlich bedürfen in einigen Kernländern der EU nicht zuletzt vor dem Hintergrund des demographischen Wandels die Sys-teme der sozialen Sicherung eine grundlegende Sanierung und ordnungspo-litischen Neuorientierung.
Abbildung 1: Wachstumsraten des realen BIP in der EU sowie ausgewählten OECD- und BRIC–Ländern, 1997–2014 (Veränderung gegenüber dem Vorjahr in %)
Quelle: Eurostat, OECD & Weltbank Statistiken (verschiedene Aufrufe).
1 Vgl. Reinhart und Rogoff (2009).

Jürgen Wandel 14
Abbildung 2: Bruttoanlageinvestitionen in der EU, den USA und Japan in % des BIP, 2000–2014
Quelle: Eurostat, OECD & Weltbank Statistiken (verschiedene Aufrufe).
Tabelle 1: Innovationsleistung der EU im Vergleich zu den wichtigsten globalen Wettbewerbern, 2014
Land Innovation Perfomance-Index
Südkorea 0,759
USA 0,746
Japan 0,702
EU 0,613
Kanada 0,457
Australien 0,405
China 0,301
Brasilien 0,194
Russland 0,190
Indien 0,176
Südafrika 0,077
Quelle: European Commission (2015).
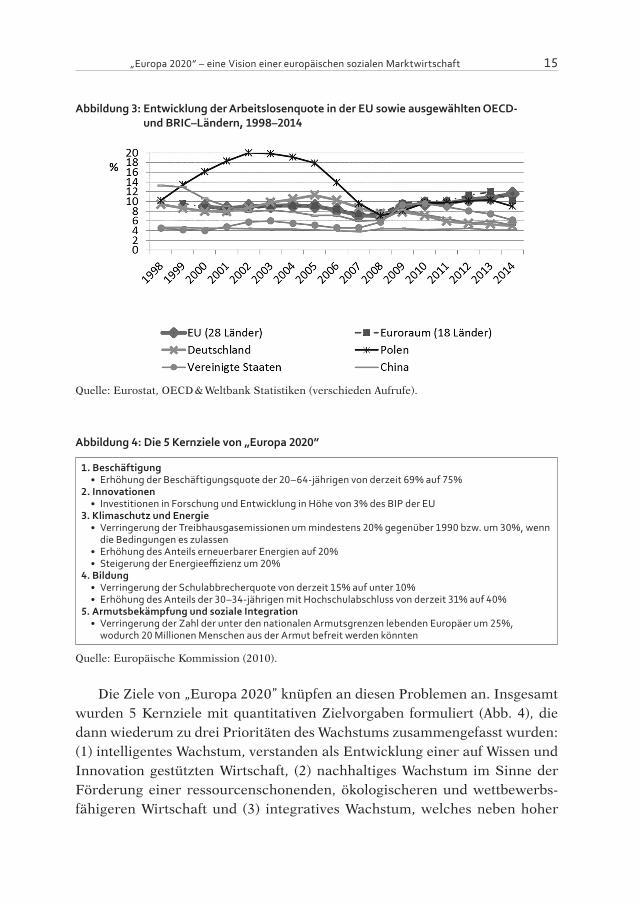
„Europa 2020” – eine Vision einer europäischen sozialen Marktwirtschaft 15
Abbildung 3: Entwicklung der Arbeitslosenquote in der EU sowie ausgewählten OECD- und BRIC–Ländern, 1998–2014
Quelle: Eurostat, OECD & Weltbank Statistiken (verschieden Aufrufe).
Abbildung 4: Die 5 Kernziele von „Europa 2020”
1. Beschäftigung• Erhöhung der Beschäftigungsquote der 20–64-jährigen von derzeit 69% auf 75%
2. Innovationen• Investitionen in Forschung und Entwicklung in Höhe von 3% des BIP der EU
3. Klimaschutz und Energie• Verringerung der Treibhausgasemissionen um mindestens 20% gegenüber 1990 bzw. um 30%, wenn die Bedingungen es zulassen
• Erhöhung des Anteils erneuerbarer Energien auf 20%• Steigerung der Energieeffizienz um 20%
4. Bildung• Verringerung der Schulabbrecherquote von derzeit 15% auf unter 10%• Erhöhung des Anteils der 30–34-jährigen mit Hochschulabschluss von derzeit 31% auf 40%
5. Armutsbekämpfung und soziale Integration• Verringerung der Zahl der unter den nationalen Armutsgrenzen lebenden Europäer um 25%, wodurch 20 Millionen Menschen aus der Armut befreit werden könnten
Quelle: Europäische Kommission (2010).
Die Ziele von „Europa 2020” knüpfen an diesen Problemen an. Insgesamt wurden 5 Kernziele mit quantitativen Zielvorgaben formuliert (Abb. 4), die dann wiederum zu drei Prioritäten des Wachstums zusammengefasst wurden: (1) intelligentes Wachstum, verstanden als Entwicklung einer auf Wissen und Innovation gestützten Wirtschaft, (2) nachhaltiges Wachstum im Sinne der Förderung einer ressourcenschonenden, ökologischeren und wettbewerbs-fähigeren Wirtschaft und (3) integratives Wachstum, welches neben hoher

Jürgen Wandel 16
Beschäftigung Wert auf ausgeprägten sozialen und territorialen Zusammen-halt legt. Diese sollen mithilfe von sieben sog. EU-Leitinitiativen (d.h. spezifi-schen Aktionsplänen) umgesetzt werden.
Wie schon in der Lissabon-Strategie soll also mit „Europa 2020” Wirt-schaftswachstum mit sozialen und ökologischen Zielen in Einklang gebracht werden. Da die Attribute integrativ und nachhaltig sogar in den Untertitel der neuen Wachstumsagenda aufgenommen wurden, wird diesen Aspekten offen-bar noch eine viel stärkere Bedeutung beigemessen. Während die Vorgänger-strategie mit dem ambitionierten Ziel einer jährlichen Wachstumsrate von 3% sehr stark auf ein quantitatives Wachstum setzte, hat sich mit „Europa 2020” augenscheinlich der Akzent auf ein qualitatives Wachstum verschoben. Gleich-zeitig sollen die drei Prioritäten des Wachstums die Eckpfeiler der Vision einer europäischen sozialen Marktwirtschaft des 21. Jahrhunderts bilden.
3. Was ist eine soziale Marktwirtschaft?
Der Begriff soziale Marktwirtschaft wurde 1947 vom Kölner Ökonomen und späteren Staatssekretar im Bundeswirtschaftsministerium Alfred Müller-Ar-mack (1901-1978) eingeführt. Sein Hauptanliegen war es wirtschaftliche und soziale Ziele miteinander in Einklang zu bringen, wörtlich: „das Prinzip der Freiheit auf dem Markte mit dem des sozialen Ausgleichs zu verbinden”2 und dabei auch eine Aussöhnung unterschiedlicher Weltanschauungen zu errei-chen. Der Begriff der sozialen Marktwirtschaft ist deshalb eine „irenische”, d.h. friedensstiftende Formel. Gleichzeitig hatte und hat er auch eine Werbe-wirksamkeit. In der unmittelbaren Nachkriegszeit herrschte in Deutschland in der Bevölkerung und den politischen Parteien eine starke antikapitalistische Stimmung. Das galt auch für weite Teile der neu gegründeten christlichen Par-teien, CDU und CSU, und selbst bei den Freien Demokarten (FDP), der Par-tei, die der Wirtschaft am engsten verbunden war, gab es skeptische Stimmen gegenüber einer völlig freien Marktwirtschaft. In dieser Situation konnte mit dem Begriff der sozialen Marktwirtschaft die Akzeptanz einer markwirtschaft-lichen Grundordnung erhöht werden.3
Die geistigen Grundlagen der sozialen Marktwirtschaft sind der Ordo-liberalismus der Freiburger Schule um Walter Eucken und die christliche
2 Zitiert in Horn (2010), S. 104.3 Vgl. Mierzejewski (2006).

„Europa 2020” – eine Vision einer europäischen sozialen Marktwirtschaft 17
Soziallehre (Schüller, 2002, S. 156). Politisch in die Praxis umgesetzt wurde die soziale Marktwirtschaft in der Bundesrepublik Deutschland in der Nach-kriegszeit von Ludwig Erhardt (1897–1977), der von 1949–1963 Bundeswirt-schaftsminister war und anschließend von 1963–1966 Bundeskanzler. In der deutschen Verfassung (Grundgesetz) findet sich der Begriff nicht, obwohl es 1949 die notwendigen Weichen dafür gestellt hat. Erst im Staatsvertrag von 1990 zur Wirtschafts- und Wahrungsunion von Bundesrepublik und DDR wurde die soziale Marktwirtschaft dann ausdrücklich kodifiziert.4
Das Grundproblem bei dieser Form der Wirtschaftsordnung ist Bedeu-tung des Eigenschaftswortes „sozial” und seine Beziehung zum Hauptwort „Marktwirtschaft”. Müller-Armack hat schon in seiner Konzeption das Adjek-tiv mit großen Anfangslettern geschrieben, so wie es heute in vielen Veröf-fentlichung verbreitet ist, und damit hervorgehoben, dass er diese „Soziale Marktwirtschaft” nicht mit einer sich selbst überlassenen liberalen Marktwirt-schaft gleichsetzt, sondern sie als eine bewusst gesteuerte, und zwar sozial gesteuerte Marktwirtschaft versteht.5 Dabei bildet freilich die Wettbewerbs-wirtschaft die unumstrittene Basis, denn nur sie ermöglicht die Entfaltung der freien, privaten Initiative und damit die Freisetzung der produktiven dyna-mischen Kräfte der Wirtschaft, ohne die kein Wohlstand generiert werden kann. Auf dieser Grundlage befürwortete er auch eine aktive Sozialpolitik, also die Umverteilung von Einkommen und Vermögen, um für die Wechsel-fälle des Lebens wie Krankheit, Unfall, Alter und Arbeitslosigkeit ein Sicher-heitsnetz zu spannen. Gleichzeitig bestand die Erwartung, dass durch ein solches Sicherheitsnetz, das den Sturz ins Bodenlose verhindert, die Wirt-schaftssubjekte noch mutiger, engagierter und unternehmerischer werden.6 Allerdings ließ Müller-Armack offen, wie weit eine aktive Sozialpolitik gehen soll. Dies macht das Konzept und den Begriff vage und dehnbar, wodurch das Tor zum Interventionismus geöffnet wird. Gerade darin liegt die große Schwäche und Gefahr des Begriffes.
Ludwig Erhard hatte das früh erkannt. Zwar suchte auch er individuelle Freiheit und soziale Gerechtigkeit zu verbinden. Aber für ihn bestand zwischen beiden Ziele kein Widerspruch. Im Gegenteil, er war davon überzeugt: „Je freier die Wirtschaft, umso sozialer ist sie auch”.7 Die Lösung sozialer Probleme sah
4 Vgl. Horn (2010).5 Vgl. Horn (2010).6 Vgl. Horn (2010).7 Erhard (1966), S. 320.
Jürgen Wandel 18
er nicht „in der Division, sondern in der Multiplikation des Sozialproduktes”.8 Bedürftigkeit werde durch Wachstum beseitigt und ebenso Ungleich durch Wachstum irrelevant. Daher war für ihn soziale Marktwirtschaft eindeutig eine Marktwirtschaft, die eigentlich auch keines Beiwortes bedarf. Dies kommt durch die folgende überlieferte Äußerung Erhards gegenüber Friedrich August von Hayek sehr deutlich zum Ausdruck: „Ich hoffe, Sie mißverstehen mich nicht, wenn ich von der sozialen Marktwirtschaft spreche. Ich meine, daß der Markt an sich sozial ist, nicht daß er erst sozial gemacht werden muß”.9
Hayek stand sehr kritisch dem Adjektiv „sozial” im Zusammenhang wirt-schafts- und gesellschaftspolitischer Fragen gegenüber. Er bezeichnete es als Wiesel-Wort. Darunter verstand er Wörter „die, wenn man sie einem Wort hin-zufügt, dieses Wort jedes Inhalts und jeder Bedeutung berauben.” Das Wie-sel-Wort par excellence war für ihn das Wort sozial. „Was es eigentlich heißt, weiß niemand. Wahr ist nur, daß eine soziale Marktwirtschaft keine Markt-wirtschaft, ein sozialer Rechtsstaat kein Rechtsstaat, ein soziales Gewissen kein Gewissen, soziale Gerechtigkeit keine Gerechtigkeit – und ich fürchte auch, soziale Demokratie keine Demokratie ist.”10 Ähnlich verhält es sich mit den neu hinzugekommenen Beiwörtern ökologisch und nachhaltig. Sie tragen weiter zur Dehnbarkeit des Begriffs der sozialen Marktwirtschaft und damit zur Rechtfertigung weiterer staatlicher Eingriffe bei. Dies läßt sich an der weiteren Entwicklung der realen Wirtschaftsordnung in der Bundesrepublik Deutschland seit den 1960er Jahre sehr gut demonstrieren.11 Wieviel Markt und wieviel Soziales und, neuerdings auch Ökologisches letztlich eine soziale Marktwirtschaft ausmachen, war und ist nach wie vor umstritten. Deshalb ist nicht klar, ob jemand, der sich auf die soziale Marktwirtschaft beruft, von der gegebenen, gelebten Wirtschaftsordnung Deutschlands spricht, so, wie sie sich heute darstellt, oder von einem etwas ferneren Ideal, dem ursprünglichen Kon-zept von Erhard und Müller-Armack, bei dem die freien Marktkräfte eindeutig im Vordergrund standen.
Wenn selbst innerhalb Deutschlands das Verständnis von sozialer Markt-wirtschaft von jeher unterschiedlich gewesen ist, so ist kaum anzunehmen, dass dies unter den Mitgliedsländern der Europäischen Union anders sein wird. Tatsächlich haben die einzelnen europäischen Länder unterschiedli-che Traditionen und Spielarten der Marktwirtschaft entwickelt. Diese lassen
8 Erhard (1957/64), S. 216.9 zitiert in Ebenstein (2001), S. 242; siehe auch Hayek (1991), S. 117.10 Hayek (1979/2004), S. 61f.11 Vgl. hierzu z.B. Schüller (2002) und Bökenkamp (2010).

„Europa 2020” – eine Vision einer europäischen sozialen Marktwirtschaft 19
sich je nach Autor unterschiedlich klassifizieren. Beispielsweise unterschei-den Hall und Soskice (2001) in ihrem Varieties of Capitalism-Ansatz zwischen liberalen Marktwirtschaften, denen sie die meisten angelsächsisch geprägten Volkswirtschaften zuordnen, und koordinierten Marktwirtschaften, zu denen sie kontinentaleuropäische und ostasiatische Länder zählen. Vivien Schmidt (2002) und Bruno Amable (2003) differenzieren bei den koordinierten Markt-wirtschaften noch genauer weiter zwischen etatistischen und sozialdemokra-tischen Marktwirtschaften.
Tabelle 2: Grundsätzliche Strategien wirtschaftspolitischer Integration
Kriterium Wettbewerblich-markwirtschaftlich
dirigistisch-bürokratisch Dritter Weg
Ökonomisches Menschenbild
methodologischer Individualismus
methodologischer Kollektivismus
Mischung aus Individualismus und Kollektivismus
Treibende Kraft Handlungen der Bürger Politiker und Bürokraten
Politiker und Bürokraten geben Entwicklungspfad vor
Integrationsmedium Wettbewerb als Entdeckungsverfahren
Konstruktivistischer Interventionismus
interventionistischer Punktualismus
Aufgabe der Wirtschaftspolitik
Förderung des Systemwettbewerbs (Ursprungslandprinzip)
vertikale Branchenplanung
(indikative) Lenkung der Wirtschaft nach übergeordneten Zielen; Harmonisierung nationaler Regeln
Zentralisierung gering sehr hoch hoch (Wirtschaftsregierung);
Favorisiert von Großbritannien, Deutschland (unterErhard, Röpke)
Frankreich Frankreich, Deutschland (seit 1998)?
Quelle: Eigene Darstellung in Anlehnung an Schüller (2006).
Entsprechend ergeben sich auch unterschiedliche Präferenzen für die Stra-tegien zur Verwirklichung der weiteren wirtschaftlichen Integration und damit einer europäischen Wirtschaftsordnung. Tabelle 2 zeigt drei grundsätzliche Möglichkeiten. Während von Haus aus liberalere Marktwirtschaften auch für die Integration verschiedener Volkswirtschaften Wettbewerb in seiner Funk-tion als Entdeckungsverfahren als Integrationsmethode bevorzugen, favor-isieren koordinierte Marktwirtschaften mit starkem Staatseinfluß eher eine dirigistisch-bürokratische Integrationsmethode, bei der Politiker und Büro-kraten die Integration von oben nach übergeordneten Zielen planen und steu-ern wollen. Traditionell war die europäische wirtschaftliche Integration von dieser klassischen Dualität zwischen dem wettbewerblichen und dirigistischen Modell geprägt. Für das erstere steht herkömmlicherweise Großbritannien,
Jürgen Wandel 20
aber auch Deutschland unter Erhard12 sowie seinen Nachfolgern zumindest bis zum Vertrag von Maastricht, während Frankreich die dirigistisch-bürokra-tische Strategie favorisiert. Die Ergebnisse im Verlauf des europäischen Eini-gungsprozeß waren naturgemäß immer Kompromisse. Mit Blick auf „Europa 2020” stellt sich nun die Frage, wie sich das dort anvisierte Modell einer euro-päischen sozialen Marktwirtschaft diesbezüglich einordnen lässt. Tendiert es zu einem der beiden Grundmodelle oder wird nun dezidiert und explizit ein dritter Weg dazwischen angestrebt wie er in der letzten Spalte von Tabelle 2 charakterisiert ist, weil eine einstimmige Zustimmung aller 28 Mitgliedstaaten zu einen der beiden Grundmodelle kaum zu erwarten ist. Dann bliebe aller-dings noch die Frage, welche Elemente aus den Grundmodellen in der euro-päischen Vision überwiegen.
4. Einordnung des Verständnis von sozialer Marktwirtschaft in Europa 2020
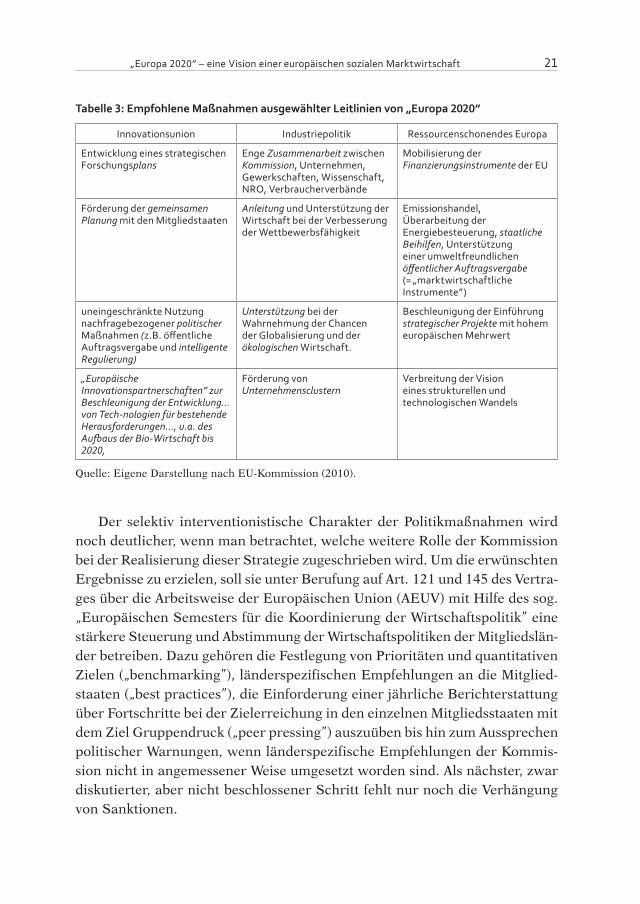
Das Dokument „Europa 2020”13 selbst enthält keine explizit ausformulierte Beschreibung des Modells einer europäischen sozialen Marktwirtschaft. Jedoch lassen sich dazu Anhaltspunkte gewinnen, wenn man die Maßnahmen, die in den sogenannten „Leitlinien” zur Umsetzung der Ziele der Wachstumsstrategie von der EU-Kommission vorgeschlagen werden, analysiert. Besonders aufschluss-reich sind dabei die Leitlinien „Innovationsunion” und „Industriepolitik für das Zeitalter der Globalisierung (Wettbewerbsfähigkeit)” sowie „ressourcenschonen-des Europa”. Tabelle 3 zeigt die jeweils wichtigsten empfohlenen Maßnahmen. Wie man leicht sieht und an den kursiv gedruckten Schlüsselwörtern kenntlich gemacht ist, spielen offenbar strategische Planung, Lenkung und Regulierung des Wirtschaftsprozesses von oben durch die EU-Kommission und die Regie-rung der Mitgliedsstaaten zur Erreichung der vorgegebenen Oberziele eine große Rolle, ebenso wie kollektive Abstimmungsverfahren zwischen Kommis-sion und Verbänden. Selbst bei den in der Leitinitiative „ressourcenschonendes Europa” als „marktwirtschaftlich” bezeichneten Maßnahmen handelt es sich häufig um klassische Instrumente selektiver Investitionslenkung (z.B. staatli-che Beihilfen, Besteuerung, öffentliche Auftragsvergabe).
12 Vgl. hierzu auch Erhard (1957), Kapitel. 14.13 Vgl. EU-Kommission (2010).
„Europa 2020” – eine Vision einer europäischen sozialen Marktwirtschaft 21
Tabelle 3: Empfohlene Maßnahmen ausgewählter Leitlinien von „Europa 2020”
Innovationsunion Industriepolitik Ressourcenschonendes Europa
Entwicklung eines strategischen Forschungsplans
Enge Zusammenarbeit zwischen Kommission, Unternehmen, Gewerkschaften, Wissenschaft, NRO, Verbraucherverbände
Mobilisierung der Finanzierungsinstrumente der EU
Förderung der gemeinsamen Planung mit den Mitgliedstaaten
Anleitung und Unterstützung der Wirtschaft bei der Verbesserung der Wettbewerbsfähigkeit
Emissionshandel, Überarbeitung der Energiebesteuerung, staatliche Beihilfen, Unterstützung einer umweltfreundlichen öffentlicher Auftragsvergabe (= „marktwirtschaftliche Instrumente”)
uneingeschränkte Nutzung nachfragebezogener politischer Maßnahmen (z.B. öffentliche Auftragsvergabe und intelligente Regulierung)
Unterstützung bei der Wahrnehmung der Chancen der Globalisierung und der ökologischen Wirtschaft.
Beschleunigung der Einführung strategischer Projekte mit hohem europäischen Mehrwert
„Europäische Innovationspartnerschaften” zur Beschleunigung der Entwicklung… von Tech-nologien für bestehende Herausforderungen…, u.a. des Aufbaus der Bio-Wirtschaft bis 2020,
Förderung von Unternehmensclustern
Verbreitung der Vision eines strukturellen und technologischen Wandels
Quelle: Eigene Darstellung nach EU-Kommission (2010).
Der selektiv interventionistische Charakter der Politikmaßnahmen wird noch deutlicher, wenn man betrachtet, welche weitere Rolle der Kommission bei der Realisierung dieser Strategie zugeschrieben wird. Um die erwünschten Ergebnisse zu erzielen, soll sie unter Berufung auf Art. 121 und 145 des Vertra-ges über die Arbeitsweise der Europäischen Union (AEUV) mit Hilfe des sog. „Europäischen Semesters für die Koordinierung der Wirtschaftspolitik” eine stärkere Steuerung und Abstimmung der Wirtschaftspolitiken der Mitgliedslän-der betreiben. Dazu gehören die Festlegung von Prioritäten und quantitativen Zielen („benchmarking”), länderspezifischen Empfehlungen an die Mitglied-staaten („best practices”), die Einforderung einer jährliche Berichterstattung über Fortschritte bei der Zielerreichung in den einzelnen Mitgliedsstaaten mit dem Ziel Gruppendruck („peer pressing”) auszuüben bis hin zum Aussprechen politischer Warnungen, wenn länderspezifische Empfehlungen der Kommis-sion nicht in angemessener Weise umgesetzt worden sind. Als nächster, zwar diskutierter, aber nicht beschlossener Schritt fehlt nur noch die Verhängung von Sanktionen.
Jürgen Wandel 22
Mit sozialer Marktwirtschaft im Sinne Ludwig Erhards, in deren Zent-rum unzweideutig der Wettbewerb frei entscheidender Individuen stand, und zwar sowohl in seiner Funktion als Entmachtungsinstrument im Sinne Franz Böhms (1933/2010) als auch als Entdeckungsverfahren im Verständnis von Hayek (1968/94), hat diese Vorgehensweise nicht viel gemeinsam. Stattdessen zeigen sich Anklänge einer zentralisierten, europäischen Wirtschaftsregierung mit weitgehenden wirtschaftlichen Lenkungsbefugnissen bis hinein auf Ebene der Mitgliedsstaaten, so wie es diejenigen befürworten, die im Zuge der Euro-Krise „mehr Europa” fordern.14
Ähnlich war auch schon die Lissabon-Strategie ausgelegt.15 Danach sollen die Märkte offenbar so reguliert werden, damit der mikroökonomische Unter-bau der Wirtschaft in den Dienst übergeordneter technologischer, sozialer und ökologischer Ziele gestellt wird. Politiker und Bürokraten geben. Dabei werden einzelne Branchen zwar nicht minutiös vertikal durchgeplant wie im dirigistisch-bürokratischen Wirtschaftsmodell. Stattdessen geben Politiker und Bürokraten einen strategischen Entwicklungsplan vor, zu deren Erfüllung die privaten Wirtschaftssubjekte mithilfe selektiver staatlicher Anreize gebracht werden sollen. Dazu gehört neben der Vorgabe von technischen, sozialen und ökologischen Mindeststandards vornehmlich der Einsatz selektiver finanz-wirksamer Instrumente.
In dieses Bild passt auch der Investitionsplan der Europäischen Kommission vom 26.11.2014, der unter dem neuen Kommissionspräsidenten Jean-Claude Juncker aufgelegt wurde, um 300 Milliarden Euro an Investitionen über die kommenden drei Jahren zu generieren. Hierzu wird ein neuer Europäischer Fonds für strategische Investitionen (EFSI) gegründet und mit 21 Milliarden Euro EU-Mitteln ausgestattet, der dazu dienen soll Investitionen der Privatwirt-schaft in strategische Projekte abzusichern. Erwartet wird, dass durch diese Verlusthaftung 15-mal so viel Privatkapital in den nächsten drei Jahren ange-lockt wird und so die Ursprungssumme des Fonds auf 315 Milliarden Euro „gehebelt” wird. Die EU-Kommission will damit insbesondere Projekte in den Bereichen Verkehr, Internet, Energie, Klimaschutz, Bildung und Forschung fördern. Ein Teil der Mittel soll an kleine und mittlere Firmen fließen, mit der Begründung, dass sie anders als Großunternehmen oft Schwierigkeiten hät-ten, am freien Markt Kredite zu bekommen.
14 Vgl. hierzu z.B. die jüngste Äußerung des im Juli 2014 neu gewählten EU-Kommissi-onspräsidenten Jean-Claude Junkers (FAZ, 15.07.2014).
15 Vgl. hierzu Schüller (2006).
„Europa 2020” – eine Vision einer europäischen sozialen Marktwirtschaft 23
Verantwortlich für die Akquirierung privater Gelder und Verwaltung der Mittel ist die Europäische Investitionsbank (EIB).16 Die Auswahl der Projekte obliegt jedoch der EIB nicht allein, sondern einem unabhängigen Investiti-onsausschuss, dessen Mitglieder allerdings von der Kommission, der EIB mit den Mitgliedstaaten bestimmt werden. Damit sind zwei Probleme verbunden. Zum einen kann nicht ausgeschlossen werden, dass am Ende nationale Par-tikularinteressen bei der Auswahl der Projekte die Oberhand gewinnen. Zum anderen ist fraglich, ob eine Auswahl der effizientesten Projekte überhaupt gelingen kann, da der Fonds in erster Linie darauf abzielt, Investitionen in sol-che Projekte zu fördern, in die Investoren ohne öffentliche Förderung aus eigenen Risiko-Rendite-Erwägungen nicht investieren würden.17 Zudem zeigt der Investitionsplan, dass die EU-Kommission offenbar an fehlenden finan-ziellen Mitteln das Hauptproblem der wirtschaftlichen Stagnation in der EU sieht, nicht aber in einer zu starken Zurückdrängungen und Regulierung des Marktmechanismus.
Insgesamt scheint somit das Modell der europäischen sozialen Marktwirt-schaft, wie es „Europa 2020” und im Investitionsplan von November 2014 zum Ausdruck, eher auf eine Art dritter Weg hinzudeuten, so wie er in der dritten Spalte von Tabelle 3 dargestellt ist und als selektiver Interventionismus bzw. mit Schüller (2006) als interventionistischer Punktualismus bezeichnet wer-den kann. Zwar mag es sich dabei um eine sanftere Form des Interventionis-mus zu handeln. Denn wie die Wirtschaftssubjekte die fünf Kernziele innerhalb des von der EU-Kommission vorgegebenen Rahmens im Einzelnen erreichen, soll ihnen freistehen. In dieser engen Umgrenzung besteht also noch Raum für den Wettbewerb in seiner Entdeckungsfunktion. Gleiches gilt auf europäischer Ebene für die Wirtschaftspolitiken einzelnen Mitgliedsländern. Auch sie kön-nen innerhalb des von der EU-Kommission gesetzten Rahmens die wirtschafts-politischen Maßnahmen ergriffen, die sie zur vorgegebenen Zielerreichung für richtig erachten. Insofern ist in dem so begrenzten Umfang auch System-wettbewerb möglich. Aber gerade weil dem Wettbewerb Grenzen gesetzt und Ziele vorgegeben sind, offenbart „Europa 2020” ein beachtliches Misstrauen bzw. Unverständnis gegenüber den Selbststeuerungs- und Selbstheilungs-kräfte des Marktsystems und stattdessen ein großes Vertrauen in die zentrale Lenkbarkeit einer komplexen, arbeitsteiligen Volkswirtschaft zur Erreichung vorgegebener Marktergebnisse. Damit hat diese Form von Markwirtschaft
16 Vgl. Wiwo (2014).17 Vgl. DB Research (2014).

Jürgen Wandel 24
jedoch wenig Gemeinsamkeiten mit dem Erhard‘schen Verständnis von sozi-aler Marktwirtschaft. Vielmehr zeigen sich doch stark Züge des französischen Saint-Simonismus.18
5. Erfolgsaussichten eines europäischen Modells sozialer Marktwirtschaft
Bei der Bewertung der Erfolgsaussichten des in Europa 2020 angelegten Wirtschaftsmodells wird auf zwei Aspekte abgestellt, erstens auf die Eignung die wirtschaftliche Stagnation nachhaltig zu überwinden und zweitens auf die Durchsetzbarkeit einer einheitlichen europäischen Wirtschaftsordnung.
5.1. Eignung zur Überwindung der wirtschaftlichen Stagnation
Wie in Abschnitt 3 schon erwähnt besteht das Grundproblem einer markt-wirtschaftlichen Wirtschaftsordnung, die mit verschiedenen Adjektiven verse-hen ist, wie sozial und ökologisch oder im Fall von „Europa 2020” intelligent, nachhaltig und integrativ, darin, dass gerade diese Eigenschaftswörter das Tor für interventionistische Maßnahmen öffnen. Noch mehr öffnet sich dieses Tor, wenn diese Attribute mit quantitativen Zielvorgaben konkretisiert und damit Marktergebnisse festgelegt werden. Denn dies bedeutet für die angestrebte Wirtschaftsverfassung, dass eine funktionsorientierte Mindestausstattung wie im Falle einer interventionsfreien Marktwirtschaft nicht ausreicht.19 Eine ziel-konforme Beeinflussung der Wirtschaftsprozesse setzt aber entsprechendes wirtschaftspolitisches Lenkungswissen voraus. Es stellt sich die Frage, ob die politischen Entscheidungsträger auf EU- und nationaler Ebene dieses Wissen tatsächlich haben können.
Mangelndes Interventionswissen
Anhänger eines wie immer gearteten dritten Weges zwischen freier Wett-bewerbswirtschaft und dirigistisch-bürokratischem Wirtschaftsmodell glau-ben, dass das für den wirtschaftlichen, sozialen und ökologischen Fortschritt relevante Wissen vorzüglich Wissenschaftlern und Technokraten bekannt ist.
18 Vgl. auch Schüller (2011).19 Vgl. Streit (2005).

„Europa 2020” – eine Vision einer europäischen sozialen Marktwirtschaft 25
Es bedarf der planmäßigen Erfassung und Lenkung, um es in konzentrierter Form nach Ingenieurmanier vom Reißbrett aus effektiver nutzen zu können.20
Nach Hayek ist das gerade ein verhängnisvoller Irrweg.21 Er zeigt, dass das wirtschaftsrelevante Wissen, also das Wissen darüber, was, wieviel, wie, wann und von wem produziert werden soll, vielmehr zerstreut unter den vie-len Individuen der Gesellschaft ist. Jedermann weiß nur einigermaßen über sich selbst Bescheid, über das, was er will, und das, was er kann, aber nicht über das seiner vielen Mitmenschen. Das ist das Problem der Wissensteilung.22 Wegen der begrenzten kognitiven Fähigkeiten des Menschen ist dieses Wissen nicht zentralisierbar, und es kann daher keiner einzigen Einzelperson insge-samt durch noch so umfassende Forschungsanstrengungen bekannt sein, auch nicht einem Ökonomen, Politiker oder einer zentralen Planungsbehörde. Hayek (1967/94) bezeichnet diesen Umstand als konstitutionelle Unwissenheit. Statt-dessen kann dieses Wissen nur mithilfe von Wettbewerb auf Märkten aktiviert und so genutzt werden, so dass es hohen Wohlstand schafft. Deshalb bezeich-net Hayek (1968/94) Wettbewerb auch als Entdeckungsverfahren. Denn nur Wettbewerb liefert über den Gewinn- und Verlustmechanismus den einzelnen Wirtschaftssubjekten die notwendigen Anreize, immer wieder neues Wissen aufzuspüren und das damit Entdeckte mit persönlichem Geschick zum eigenen Vorteil zu nutzen. Tun sie das erfolgreich, werden sie mit Gewinnen belohnt, wenn nicht erleiden sie Verluste, was sie zur Korrektur ihrer Fehlentscheidun-gen anhält. Mit den Transaktionen, die im Zuge dieses Entdeckungsverfahrens ausgelöst werden, wird gleichzeitig Wissen verbreitet, und zwar „in kodierter Form”23 durch die Änderung der relativen Preise.
Natürlich werden bei diesem Trial-und Error-Prozesses des Entdeckens Fehler gemacht. Aber da die vielen einzelnen Wirtschaftssubjekte nach vielen unterschiedlichen Dingen suchen, machen nie alle die gleichen Fehler. Die Feh-ler werden in der Regel rasch korrigiert etwa durch den Konkurs oder die Über-nahme von Unternehmen. Bei kollektiven Such- und Entscheidungsprozessen und entsprechend ausgelegten Fördermaßnahmen, so wie sie in „Europa 2020” empfohlen werden, führen Fehlentscheidungen dagegen dazu, dass die gesamte Volkswirtschaft davon betroffen ist, weil viele Unternehmen auf die falsche Fährte gelockt worden sind, wofür dann meistens die Steuerzahler aufkommen
20 Vgl. Schüller (2006).21 Vgl. Hayek (1937/76, 1945, 1968/94, 1974/96).22 Vgl. Hayek (1945).23 Vgl. Hayek (1976), S. 117.
Jürgen Wandel 26
müssen.24 Das gleiche gilt für die mit „Europa 2020” anvisierte Koordination nationaler Wirtschaftspolitiken. In einem interventionsfreien marktwirtschaft-lichen Politikansatz wäre eine zentrale Kontrolle der Wirtschaftspolitiken der einzelnen Mitgliedsstaaten, wie sie über die jährliche Berichterstattung, das Aussprechen von Empfehlungen und Verwarnung angestrebt wird, völlig über-flüssig, denn diese würde viel effizienter über den Systemwettbewerb erreicht. Zwar deutet der Begriff der „best practice” darauf hin, dass man diese über Systemwettbewerb ermitteln möchte. Gleichzeitig werden aber den Mitglieds-ländern von der Brüsseler Zentrale unter Androhung von Sanktionen „Emp-fehlungen” gemacht, welche best practice sie anzuwenden haben. Damit wird aber die Intensität des Systemwettbewerbs stark eingeschränkt, wenn nicht gar im Endeffekt ausgehebelt. Im Extremfall wird damit eine Harmonisierung der Wirtschaftspolitiken von oben erzwungen. In die gleiche Richtung wirkt die Harmonisierung von Steuern sowie Beschäftigungs-, Umwelt- und techni-schen Standards, da sie Abwanderungsmöglichkeit mobiler Produktionsfak-toren als Sanktionsmechanismus für staatliche Politiken stark beschneiden.
Wie Israel Kirzner herausgearbeitet hat, ist in einer Marktwirtschaft ohne Adjektive der findige Unternehmer die treibende und alles entscheidende Kraft des wettbewerblichen Entdeckungsverfahrens.25 Unter Aufwendung von Trans-aktionskosten versucht er Gewinngelegenheiten aufzuspüren und zu nutzen. Ob er dabei erfolgreich ist, zeigt sich nur durch ständiges Testen im Wettbewerb auf den Märkten. Er ist es, der im Sinne Schumpeters neue wohlfahrtsstei-gernde Faktorkombinationen durchsetzt. Deshalb bezeichnet Kirzner Wettbe-werb auch als „unternehmerisches Entdeckungsverfahren”.26 Nur damit und mit keinem anderen Verfahren lassen sich auf die effizienteste Art und Weise innovative Produktionsverfahren, Produkte und Organisationsformen entdeckt, die den Wünschen der Konsumenten entsprechen, dem eigentlichen Souverän in einer marktwirtschaftlichen Ordnung. Aus diesem Grund ist der freie Unter-nehmer und Wettbewerb für die Überwindung des stagnierenden Wirtschafts-wachstums von zentraler und unverzichtbarer Bedeutung.
Die konkreten Ergebnisse dieses unternehmerischen Entdeckungsverfah-rens sind nicht voraussehbar und planbar. Dies ergibt sich aus der Komple-xität und Offenheit von Marktprozessen in Verbindung mit den beschränkten kognitiven Fähigkeiten des Menschen. Wären sie das, bräuchte man überhaupt
24 Vgl. auch Pennington (2011).25 Vgl. Kirzner (1978, 1982, 1997).26 Kirzner (1982).
„Europa 2020” – eine Vision einer europäischen sozialen Marktwirtschaft 27
keinen Wettbewerb. Deshalb ist die Festlegung bestimmter Marktergebnisse im Voraus in „Europa 2020”, wie etwa der Ausbau einer bestimmten Branche (Bio-Wirtschaft), die Verwendung bestimmter Schlüssel-Technologien, Unter-nehmensformen (Cluster) oder bestimmter Ressourcen wie bei den Energie- und Klimazielen, und die entsprechende Lenkung des Wirtschaftsprozesses zur Erzielung dieser Ergebnisse nach Hayek nichts anderes als Anmaßung von Wissen27 und letztlich auch „der Gipfel an Überheblichkeit”, denn gelenk-ter Fortschritt ist tatsächlich kein Fortschritt.28
Aus der Komplexität und Offenheit von Marktprozessen und den beschränk-ten kognitiven Fähigkeiten folgt, dass einzelne Entscheidungsträger kein umfas-sendes Lenkungswissen haben können, das für selektive Interventionen in die Märkte notwendig ist, um gewünschte übergeordnete Ziele herbeizuführen. Denn im Unterschied zu einfachen Systemen können offene und komplexe Systeme, so wie es eine moderne, arbeitsteilige Volkswirtschaft darstellt, nicht vollständig in Form von Kausalitäten abgebildet werden. Meistens kommt es bei diesen Versuchen zu unerwarteten Neben- und Folgewirkungen, für die Horst Siebert den Begriff der „Kobra-Effekte”29 eingeführt hat. So führt z. B. die Förderung von Biotreibstoffen zur abnehmenden Verwendung von Agrarroh-stoffen zur Nahrungsmittelproduktion und damit zu Preissteigerung wie etwa im Zuge der sogenannten Nahrungsmittelpreiskrise von 2008 und 2012.30 Wie Ludwig von Mises (1929/76) gezeigt hat, versuchen Politiker meistens diese Kobra-Effekte nicht einfach durch die Aufgabe falscher Politikmaßnahmen zu beseitigen. Vielmehr neigen sie dazu diese mit weiteren Interventionen zu kor-rigieren, so dass eine Interventionsspirale in Gang kommt. Dies belegen zahl-reiche empirische Beispiele aus der EU-Wirtschaftspolitik der Vergangenheit und Gegenwart, allen voran die Gemeinsame Agrarpolitik. Für die Neigung zu einer Interventionsspirale gibt es im wesentlichen drei Gründe: (1) die Über-zeugung, dass die bisherigen Interventionen nicht weit genug gingen31, (2) die
27 Hayek (1974/96).28 Vgl. Hayek (2003), S. 476. Schon früher an anderer Stelle erläuterte Hayek (1944/2011,
S. 208) diesbezüglich: „Den geistigen Wachstumsprozeß oder auch den Fortschritt im allge-meinen Sinne zu „planen” oder zu „organisieren”, ist ein Widerspruch in sich selbst. Die Vorstellung, daß der menschliche Geist „bewußt” seine eigene Entwicklung überwachen solle, verwechselt die individuelle Vernunft, die allein irgendetwas „bewußt” überwachen kann, mit dem interpersonellen Prozeß, dem ihr Wachstum zu verdanken ist.”
29 Siebert (2001).30 Vgl. z. B. Erlei (2012).31 Vgl. Mises (1929/76), S. 13f., der dies wie folgt erläutert: „Daß das System schlecht
funktioniert, schreibt er [der Befürworter des Interventionismus, Anm. Verf.] ausschließlich dem Umstande zu, daß die Gesetze nicht weit genug gehen und daß ihre Durchführung
Jürgen Wandel 28
Angst politischer Entscheidungsträger, das Gesicht zu verlieren und (3) die Rücksicht auf politisch einflussreiche Interessengruppen zum Zwecke des Machterhalts. Letzteres gilt allgemein als die wichtigste Ursache.32
Die naheliegende wirtschaftspolitische Konsequenz aus dem Wissenspro-blem ist, dass der Staat nicht in den Marktprozess eingreifen sollte, um kon-krete wünschenswerte Ergebnisse zu erzielen. Stattdessen sollte er sich auf die Schaffung und Einhaltung von Institutionen (Spielregeln) konzentrieren, die freies Unternehmertum und Wettbewerb fördern. Damit die Entdeckungs-leistung des Marktwettbewerbs möglichst produktiv ausfällt, sollten die Ins-titutionen nach Hayek dem Prinzip der Universalisierbarkeit genügen. Dazu müssen sie abstrakt (nur Verbote, keine Handlungsgebote), allgemein (keine Ausnahmen bei der Anwendung) und gewiss (langfristige Gültigkeit) sein.33 Als entscheidende Institutionen, die die Entdeckungsleistung des Wettbewerbs schützen und fördern, gelten Handels- und Vertragsfreiheit, freier Markt-zutritt, eindeutig definierte und sichere Verfügungsrechte, ein simples und nicht-konfiskatorisches Steuersystem sowie die unparteiische Durchsetzung von Verträgen und nicht zuletzt des Haftungsprinzips, nach dem Motto „Wer den Nutzen hat, muss auch den Schaden tragen.” Besteht dieses Haftungsprinzip nicht werden die Wirtschaftssubjekte zu übertrieben risikoreichen Geschäften und häufigeren Fehlinvestitionen verleitet, weil im Falle von Fehlschlägen die Verluste ja sozialisiert werden. Die Finanzkrise ist gerade das Musterbeispiel für die Verletzung des Haftungsprinzips, das Walter Eucken zu den zentralen „konstituierenden Prinzipien” einer marktwirtschaftlichen Ordnung rechnet. Vor diesem Hintergrund ist Verlusthaftung im Investitionsplan von 2014 ver-wunderlich. Eine Reihe namhafter Ökonomen, insbesondere Douglass North (1990), Mancur Olson (2002), Hernando de Soto (2000) oder Acemoglu und Robinson (2012) die sich mit der Frage auseinandergesetzt haben, warum die einen Länder wohlhabender sind als andere, haben in historischen Vergleichs- und Länderstudien die Bedeutung dieser institutioneller Rahmenbedingungen für Wirtschaftswachstum überzeugend belegt.
durch Korruption behindert wird. Gerade der Mißerfolg der Interventions-politik bestärkt ihn in der Überzeugung, daß das Sondereigentum [Privateigentum, Anm. Verf.] durch strenge Gesetze kontrolliert werden müsse. Die Korruption der mit der Ausführung der Sta-atsaufsicht betrauten Organe erschüttert nicht sein blindes Vertrauen in die Unfehlbarkeit und Makellosigkeit des Staates; sie erfüllt ihn nur mit moralischem Abscheu gegenüber den Unternehmern und Kapitalisten.”
32 Vgl. Baumol et al. (2007).33 Vgl. Hayek (1991, 2003).
„Europa 2020” – eine Vision einer europäischen sozialen Marktwirtschaft 29
Veränderung der Denk- und Verhaltensweisen
Jegliche Art von gezielten Interventionen in den Marktprozess rufen über-dies mittel- und langfristig Veränderungen in den Verhaltens- und Denkweisen der Wirtschaftssubjekte hervor, die einem Wirtschaftswachstum entgegenste-hen, das notwendig wäre, um soziale und ökologische Fragen angemessen lösen zu können. Befördert wird insbesondere die Suche nach Renten auf dem poli-tischen Markt anstatt nach Einkommen auf wirtschaftlichen Märkten durch Wettbewerbsleistungen, ebenso wie das Streben nach Besitzstandswahrung, Moral Hazard-Verhalten und eine zunehmende Anspruchshaltung an staatli-che bzw. supranationale Instanzen bei gleichzeitig abnehmenden eigenverant-wortlichen Präventivverhalten.34
Immer wenn politische Entscheidungsträger selektive interventionistische Maßnahmen anbieten (z.B. Subvention, Steuererleichterungen, Handelsbe-schränkungen), um private Investitionen in eine politisch gewünschte Rich-tung zu lenken, schaffen sie damit Anreize für die privaten Wirtschaftssubjekte auf die Politiker einzuwirken, damit sie in den Genuss der damit verbundenen Renten kommen und diese so lange wie möglich beibehalten können.35 Solche selektiven Interventionen sind aufgrund ihres diskriminierenden Charakters attraktiv, denn sie verschaffen in aller Regel denjenigen Unternehmen einen Sondervorteil gegenüber ihren Konkurrenten, die nicht in den Genuss kom-men. Gleichzeitig besteht ein Anreiz, aktiv auf die Politik einzuwirken, damit diese die Maßnahmen so ausgestalten, dass sie ihren eigenen wirtschaftlichen Interessen am meisten nutzen36 und/oder um sie von der Notwendigkeit zu überzeugen, noch weitere Gelegenheiten zum Abgreifen von Renten durch punktuelle Interventionen zu schaffen. Dies bezeichnen Laffont und Tirole als „regulatory capture”.37 Dabei wird stets auf das Allgemeinwohl im Sinne sozi-aler oder ökologischer Belange als Begründung abgestellt, obwohl es um das eigene Interessen geht. Gleichzeitig kommt es zu einem systematischen infor-mationsstrategischen Opportunismus der staatlicherseits berufenen Wissensträ-ger (Wissenschaftler, Branchenverbände, Bürokraten) und einer kartellartige Einflussnahme der Wirtschaft auf die Planung der Projekte.38
34 Vgl. auch Erlei (2014).35 Vgl. Buchanan (1987).36 Vgl. Buchanan (1987).37 Laffont und Tirole (1991).38 Vgl. Schüller (2006).
Jürgen Wandel 30
Umgekehrt haben Politiker ebenfalls ein Eigeninteresse an staatlichen Interventionen in den Wirtschaftsprozess um ihre Macht zu sichern. Mit Hilfe von spezifischen Subventionen und Marktzugangsregulierungen zugunsten bestimmter Unternehmen oder zur Förderung von vermeintlich zukunftsträch-tigen Hochtechnologiebereichen lassen sich Wählerstimmen gewinnen und Spenden mobilisieren. Der Anreiz dazu wird umso größer sein, je mehr die Politiker überzeugt sind, dass die begünstigte Gruppe, sie im politischen Wett-bewerb wirksam unterstützt.39 Dem Rent-Seeking und Regulatory Capture liegt somit ein politisches Tauschgeschäft zugrunde. Getauscht wird die Zusicherung einer wahlwirksamen Unterstützung gegen rentenschaffende Interventionen und Regulierungen zugunsten organisierter Gruppen.40
Wie Mancur Olson gezeigt hat, führt die Rentenschaffung durch selekti-ven Interventionismus mit wettbewerbshemmender Wirkung im Endeffekt zu einer „institutionellen Sklerose”, die die Produktivität und Flexibilität von Wirtschaft, Politik und Gesellschaft hemmt und langfristig zum wirtschaftli-chen Niedergang führt.41 Denn in der Folge werden produktive, wohlfahrts-steigernde unternehmerische Aktivitäten zunehmend durch unproduktive bzw. destruktive Handlungen ersetzt, die darauf abzielen, bestehenden Wohlstand umzuverteilen anstatt neuen zu schaffen.42
Einher kann damit eine zunehmende Anspruchshaltung an den Staat gehen bei gleichzeitiger Aushöhlung der individuellen Freiheit und Selbstent-faltung. Dies hängt mit der Sehnsucht des Menschen nach sozialer Sicherheit, verstanden als Sicherheit eines bestimmten Lebensstandards und staatlicher Fürsorge sowie in den letzten Jahren auch nach ökologischer Sicherheit im Sinne des Erhalts oder der Herstellung eines bestimmten wünschenswerten Zustandes der natürlichen Umwelt. Wie Hayek zeigt, sind solche Sicherheiten jedoch nur bei Beherrschung und Abschaffung des Marktes erreichbar.43 Dies zieht aber unweigerlich nach und nach die Einschränkung und Beseitigung der individuellen Freiheit nach sich, denn wenn immer mehr staatliche Ge- und Verbote das Wirtschaftsgeschehen reglementieren, verengen sie dadurch gleichzeitig die Handlungsfreiheiten der Bürger insgesamt. Wie Hayek erläu-tert, ist „wirtschaftliches Kommando ist nicht nur Kommando über einen Sek-
39 Vgl. Streit (2005).40 Vgl. Streit (2010).41 Vgl. Olson (1991).42 Vgl. Baumol (1990).43 Vgl. Hayek (1944/2011).

„Europa 2020” – eine Vision einer europäischen sozialen Marktwirtschaft 31
tor des menschlichen Lebens, der von den übrigen getrennt werden kann; es ist die Herrschaft über die Mittel für alle unsere Ziele.”44
An die Stelle der Tugenden die auch zentral für die soziale Marktwirtschaft im ursprünglichen Erhard’schen Sinne waren, nämlich die Bereitschaft, Risiko zu übernehmen, Selbsthilfe, Unabhängigkeitssinn aber auch seine Überzeu-gung gegen eine Mehrheit zu vertreten, wie dies Erhard häufig tat45 und der Wille zur Zusammenarbeit mit den anderen, tritt durch die Übertragung von immer mehr Verantwortung an eine übergeordnete Instanz ein Vakuum, das nur durch die Forderung des Gehorsams und die Pflicht des Individuums, das zu tun, was von der Kollektivität für gut gehalten wird, ausgefüllt wird.46 Dies ist nach Hayek auch ethisch und moralisch fragwürdig, denn es besteht „weder das Recht, auf Kosten anderer großzügig zu sein, noch liegt im Altruis-mus irgendein Verdienst, wenn er erzwungen ist... Es sind zwei grundverschie-dene Dinge, wenn man fordert, dass die Obrigkeit wünschenswerte Zustände herstellt …, oder wenn man willens ist, das zu tun, was man für recht hält, selbst unter Opferung der eigenen Wünsche und vielleicht gegen die feind-selige öffentliche Meinung.”47 In Deutschland zeigt sich die erstere Tendenz immer deutlicher in der gegenwärtigen wirtschaftspolitischen Diskussionen. Der Fokus liegt zunehmend auf Politikmaßnahmen, die in die Taschen ande-rer greifen, also auf der Umverteilung von Einkommen und Vermögen, wäh-rend die Voraussetzungen für die Erzeugung von Einkommen und Vermögen ausgeblendet werden.48
5.2. Durchsetzbarkeit einer einheitlichen europäischen Wirtschaftsordnung
Für die Durchsetzbarkeit einer Art einheitlichen Modells sozialer Markt-wirtschaft für 28 unterschiedliche Mitgliedsstaaten der EU gibt es langfristig nur zwei denkbare Möglichkeiten: Erstens die Mitgliedsstaaten stimmen einem einheitlichen Wirtschaftsmodell freiwillig zu, weil in den zurückliegenden sechs Jahrzehnten europäischer Einigung sowieso eine Konvergenz der Wirtschafts-systeme und wirtschafts- und europapolitischen Vorstellungen in Gang gekom-men ist. Zweitens die europäischen Institutionen die Etablierung einer solchen
44 Hayek (1944/2011), S. 123.45 Vgl. Mierzejewski (2006).46 Vgl. Hayek (1944/2011).47 Hayek (1994/2011), S. 262f.48 Vgl. Erlei (2014).
Jürgen Wandel 32
Wirtschaftsordnung kraft ihrer Autorität von oben über die Einwirkungsmög-lichkeiten im Rahmen des „Europäischen Semesters für die Koordinierung der Wirtschaftspolitik.” Dabei würde dann eine einzige „best practice”für alle Mitgliedsstaaten unter Sanktionsandrohungen „empfohlen.”
Was die Frage der „freiwilligen” Konvergenz anbelangt, so gibt es hierfür unterschiedliche Anzeichen. Wie die kritische Rede von David Cameron vom Januar 2013, sein Widerstand gegen die Berufung des neuen EU-Kommissi-onspräsidenten Jean-Claude Juncker nach den Europawahlen vom Mai 2014 sowie das für 2017 anberaumte Referendum über den Verbleib in der EU zei-gen, steht Großbritannien einer Konvergenz und einer weiteren interventio-nistischen Zentralisierung der Wirtschaftspolitik klar ablehnend gegenüber. Wie gezeigt, scheint sich demgegenüber Deutschland zunehmend vom Erbe Erhards entfernt und immer stärker französischen Vorstellungen mit einer Prä-ferenz für supranationale Kollektivaktionen und für die Herrschaft der Politik angenähert zu haben.49 Mit der Einführung von Mindestlöhnen und der Miet-preisbremse sowie dem Festhalten an der planwirtschaftlichen Energiepolitik scheint die Bundesregierung aus CDU und SPD mit Bundeskanzlerin Merkel unbeirrt den Weg in Richtung Neo-Interventionismus zu beschreiten.50
Das scheint durchaus den Präferenzen der Bevölkerung und der veröf-fentlichten Meinung entgegenzukommen, wo immer öfter die wirtschaftli-chen Probleme auf die Unzulänglichkeit der marktwirtschaftlichen Ordnung schlechthin und der ihr entsprechenden Integrationsmethode zurückgeführt werden, nicht aber auf einen übermäßigen Interventionismus. Mit der Finanz- und Wirtschafts- sowie Eurokrise hat sich diese Tendenz noch weiter verstärkt. Das zeigt etwa eine Umfrage aus dem Jahr 2013, die das Allenbach-Institut im Auftrag der FAZ durchgeführt hat. Danach befürworten große Teile der deut-schen Bevölkerung sogar ein noch stärkeres Eingreifen des Staates. Ganz so wie in Fußnote 3 durch Ludwig von Mises (1929/76) beschrieben wurde, werden negative Folgen staatlichen Eingreifens darauf zurückgeführt, dass der Staat zu wenig eingreift.51
Denkbar wäre auch, dass die „freiwillige” Angleichung über den institutionel-len bzw. Systemwettbewerb bewirkt wird. Ausgangspunkt dieser auf Hirschman (1970) zurückgehenden Konzeption ist die Überlegung, dass unterschiedliche institutionelle und wirtschaftspolitische Arrangements die Allokation mobiler
49 Vgl. Schüller (2011).50 Vgl. auch Erlei (2014).51 Vgl.Deutsche Wirtschafts Nachrichten (2013).
„Europa 2020” – eine Vision einer europäischen sozialen Marktwirtschaft 33
Produktionsfaktoren beeinflussen. Die Eigentümer mobiler Faktoren reagie-ren auf negativ bewertete Regelungen mit Abwanderung und lösen dort eine Debatte über die Qualität der bestehenden institutionellen Lösungen aus, die letztliche zu einer entsprechenden Korrektur führt. Die drohende bzw. sich vollziehende Abwanderung wirkt somit als Sanktionsmechanismus für die politischen Entscheidungsträger. Voraussetzung ist natürlich, dass Abwande-rungsmöglichkeiten überhaupt bestehen und nicht durch Harmonisierungsbe-strebungen und staatliche Mobilitätsbeschränkungen oder gar –verbote beseitigt werden. Ist eine solche Abstimmung mit den Füßen möglich, dann muss es nicht notwendigerweise zu einer vollständigen Konvergenz von Politiken und institutionellen Arrangements zwischen den einzelnen Mitgliedsstaaten kom-men noch zu einem „race to the bottom”, wie Wohlgemuth und Adamovich (1999) am Beispiel der Schweiz demonstriert haben. So spielt neben dem Fak-tor „exit” (Abwanderung) und „voice” (Widerspruch) auch der Faktor Loyalität eine Rolle beim Systemwettbewerb.52 Dieser schafft Hemmschwellen für die ökonomische und politische Abwanderung zur konkurrierenden Alternative. Wie im Falle des ökonomischen Wettbewerbs ist natürlich auch beim institu-tionellen Wettbewerb das Ergebnis nicht vorhersehbar. Zu vermuten ist aber, dass sich dann eher wettbewerbsfördernde institutionelle Arrangements lang-fristig durchsetzen werden, weil interventionistische Praktiken tendenziell zu spürbaren Reibungsverlusten in Form von Wachstums- und Beschäftigungs-einbußen führen und dies Abwanderung und/oder Widerspruch in der betrof-fenen Volkswirtschaft hervorrufen dürfte.
Die Herbeiführung einer Konvergenz der Wirtschaftspolitiken per Anord-nung von supranationalen Institutionen würde voraussetzen, dass diese auch über glaubwürdige und wirkungsvolle Sanktionen verfügen, sie also gelben Karten auch eine rote Karte folgen lassen können. Folglich ginge damit die Notwendigkeit einher, eine immer größere Machtfülle über die Menschen bei supranationalen Behörden zu konzentrieren, nicht zuletzt auch deshalb, weil mit zunehmender Größe eines Gemeinwesens sich die Übereinstimmung über die Reihenfolge der Ziele verringert.53 Würde aber dieser Weg immer weiter beschritten, dann könnte dies letztendlich die friedvolle Kooperation in Europa zerstören. Denn es fraglich, dass die Mitgliedsstaaten solch weiter-gehenden wirtschaftspolitischen Eingriffsrechte zustimmen würden. Hierfür gibt es deutliche Anzeichen. Neben dem angekündigten Referendum über den
52 Vgl. Hirschman (1970).53 Vgl. Hayek (1944/2011).
Jürgen Wandel 34
Verbleib Großbritanniens in der EU gehört dazu insbesondere das Erstarken europakritischer Parteien, allen voran des Front National in Frankreich.54 Im Endeffekt würde eine solche zunehmende interventionistische Zentralisierung und Vereinheitlichung der Wirtschaftspolitiken und Wirtschaftsverfassungen zu einem, wie Wilhelm Röpke es bezeichnete, „Sprengmittel und Instrument der Desintegration ”55 werden. Vor diesem Hintergrund scheint die Durchsetz-barkeit eines einheitlichen Modells sozialer Marktwirtschaft nicht realistisch.
7. Fazit und Ausblick
Der Begriff der sozialen Marktwirtschaft hat seit seiner Einführung im Nachkriegsdeutschland durch Alfred Müller-Armack konzeptionell und poli-tisch unter Ludwig Erhard im Laufe seiner Geschichte eine große Dehnbarkeit erfahren, so wie sich viele auf diesen Begriff berufen, obwohl ihre ordnungspo-litischen Vorstellungen mitunter weit auseinander liegen56. Würde der Begriff der europäischen sozialen Marktwirtschaft in diesem elastischen Sinne ver-wendet, ließen sich darunter in der Tat verschiedene Wirtschaftsstile mit einem unterschiedlichen Ausmaß und unterschiedlicher Intensität staatlichen Handels subsumieren und fast jedes Mitgliedsland könnte sich dann darin wiederfin-den. Freilich wäre dann der Anspruch Barrosos mit „Europa 2020” eine Vision einer europäischen sozialen Marktwirtschaft inhaltslos. Wie die öffentliche Dis-kussion in Deutschland im Zuge der globalen Finanz- und Eurokrise gezeigt hat, wird das Konzept der „Soziale Marktwirtschaft” aber heutzutage in Wirk-lichkeit von den meisten als Gegenentwurf zur freien, „puren”, „ungezügelten” Marktwirtschaft verwendet, dem alle ökonomischen und gesellschaftspoliti-schen Probleme angelastet werden, obwohl es wie in der Realität nirgendwo gibt.57 Der Verweis auf die soziale Marktwirtschaft dient dann dazu weitge-hende staatliche Interventionen ins Wirtschaftsgeschehen zu rechtfertigen.58
Entsprechend enthält auch die Vision von sozialer Marktwirtschaft, die in „Europa 2020” angelegt ist, tatsächlich starke Züge einer administrativ
54 Vgl. auch Issing (2015).55 Röpke (1959), S. 96.56 Vgl. Horn (2010). Ein Beispiel hierfür ist z.B. Sahra Wagenknecht von der Partei „Die
Linke”, die sich bei ihren dirigistischen wirtschaftspolitischen Vorstellungen eines "kreati-ven Sozialismus" in jüngster Zeit auch auf Ludwig Erhard beruft (vgl. Spiegel, 2013).
57 Vgl. auch Erlei (2013).58 Vgl. auch Horn (2010).
„Europa 2020” – eine Vision einer europäischen sozialen Marktwirtschaft 35
gesteuerten, zentralisierten Koordinierung des Wirtschaftsgeschehens. Sie ver-sucht eine Art dritten Weg zwischen bürokratisch-dirigistischen und wettbe-werblich-marktwirtschaftlichen Modell zu beschreiten. Damit hat sie ebenso aber wenig gemeinsam mit dem Verständnis von sozialer Marktwirtschaft der Gründungsväter dieser Wirtschaftsordnung in Deutschland, wie die in der Öffentlichkeit weit verbreitete, falsche Vorstellung, was dieses Konzept aus-mache. In völligem Gegensatz zu Erhard zeigt die in „Europa 2020” skizzierte Vision ein allzu großes Vertrauen in die zentrale Steuerbarkeit des Wirtschafts-geschehens und ein allzu großes Misstrauen gegenüber den Selbststeuerungs- und Selbstheilungskräfte des Marktsystems. Damit kommt sie zwar offenbar den Präferenzen und Vorbehalten in weiten Teilen der Bevölkerung entgegen gegenüber einem „ungezügelten Kapitalismus” oder einer Marktwirtschaft ohne Adjektive entgegen, nicht zuletzt in Deutschland. Allerdings werden dabei zentrale Schwächen jeder auch noch so indirekter bzw. leichter Form zentra-lisierten, selektiven Interventionismus übersehen, der mit vorgeblichen oder tatsächlichen sozialen und ökologischen Zielen gerechtfertigt wird. Das sind das fehlende Lenkungswissen der wirtschaftspolitisch Verantwortlichen mit der Folge unbeabsichtigter Ressourcenverschwendungen und der Ingangsetzung von Interventionsspiralen sowie die Herausbildung einer wachstumshemmenden Rent-Seeking-Mentalität bis hin zur politischen Korrumpierung eines demo-kratischen Systems. Aus ordnungsökonomischer Sicht ist aber gerade in der mit der damit einhergehenden Zurückdrängung des Wettbewerbs in seiner für wirtschaftlichen Fortschritt so unverzichtbaren Funktion als Entdeckungsver-fahren die Hauptursache für die wirtschaftliche Stagnation der EU zu sehen.
In die gleiche Richtung wie „Europa 2020” geht der Bericht der fünf Prä-sidenten vom 22. Juni 2015 „Die Wirtschafts- und Währungsunion Europas vollenden”.59 Vorgelegt wurde er von Jean-Claude Juncker in enger Zusam-menarbeit mit Donald Tusk, Jeroen Dijsselbloem, Mario Draghi und Martin Schulz (EU-Kommission, Euro-Gipfel, Euro-Gruppe, EZB, Europäisches Par-lament). Der Bericht gibt das Ziel aus, die Wirtschafts- und Währungsunion (WWU) bis 2025 in drei Stufen ”vertieft, echt und fair” zu machen und fordert dabei die Vertiefung an vier Fronten: ”Wirtschaftsunion”, ”Finanzunion”, ”Fis-kalunion”, ”Politische Union”. Eine ganze Reihe der gemachten Vorschläge bedingen Übertragungen staatlicher Kompetenzen von der nationalen auf die europäische Ebene. Unter anderem soll dabei auch der Konvergenzprozess
59 Vgl. Juncker et al. (2015).
Jürgen Wandel 36
„durch gemeinsame strenge Standards, die in EU-Vorschriften festgelegt wer-den würden” befördert werden.
Dabei wird verkannt, dass Europa über die Jahrhunderte seine Stärke und Attraktivität dem Wettbewerb verschiedener nationaler Einheiten und Sys-teme zu verdanken hat. Daher sollte der Stärkung des Wettbewerbs auf der Systemebene durch Rückbesinnung auf das Subsidiaritätsprinzip der Vor-rang gegeben werden. Dies beinhaltet nicht zuletzt auch eine Rückkehr zum Prinzip des no-bail-out. Es ist ein weitverbreiteter Fehlschluss, der aus globa-ler Finanz- und Eurokrise gezogen wurde, dass die politische Kontrolle des Wirtschaftsgeschehens effektiver sei als die Kontrolle über den Marktmecha-nismus. Weder gibt es dafür überzeugende theoretische Begründungen noch stichhaltige empirische Belege. Im Gegenteil: Vielmehr wurden beide Krisen maßgeblich durch Handlungen staatlicher Akteure ausgelöst, nämlich durch Ausschluss des Haftungsprinzips, einer fehlgeleitete Geldpolitik über 20 Jahre und Konstruktionsmängeln des Euros.60 Zu letzteren gehört insbesondere die Verletzung vertraglicher Vereinbarungen durch die politischen Akteure. Damit fehlt es an ausreichender Glaubwürdigkeit, dass neue politische Kontrollme-chanismus, etwa im Rahmen der Bankenunion oder einer Fiskalunion besser funktionieren soll.
Auf diese Probleme einer sozial wie ökologisch motivierten zentralisierten selektiv intervenierenden Wirtschaftspolitik im europäischen Einigungspro-zeß hat Ludwig Erhard bereits Ende der 1950er Jahre hingewiesen und mit der Warnung versehen: „Das Organisieren- und Harmonisierungswollen führt in den fast sicheren Abgrund!”61 Stattdessen konstatierte er: „Die beste Integ-ration Europas, …., beruht nicht auf der Schaffung neuer Ämter und Verwal-tungsformen oder wachsender Bürokratien, sondern sie beruht in erster Linie auf der Wiederherstellung einer freizügigen internationalen Ordnung”.62 Daher hat auch mit Blick auf „Europa 2020” die Forderung von Ludwig Erhard aus dem Jahre 1962 nichts von ihrer Aktualität eingebüßt: „Wir brauchen kein Pla-nungsprogramm, sondern ein Ordnungsprogramm in Europa.”63
Wie Hayek schlussfolgerte, kann dabei eine supranationale Instanz wie die EU-Organe durchaus von Nutzen sein und „viel zur wirtschaftlichen Prosperität beitragen, wenn sie sich darauf beschränkt, die Ordnung aufrechtzuerhalten und die Bedingungen zu schaffen, unter denen die Menschen sich ihr eigenes
60 Vgl. auch Erlei (2014).61 Erhard (1959).62 Erhard (1957), S. 283.63 Erhard (1962/1988).
„Europa 2020” – eine Vision einer europäischen sozialen Marktwirtschaft 37
Leben zurechtzimmern können.”64 Dies bedeutet Handlungsfreiheiten für pri-vate Wirtschaftssubjekte und Mitgliedsstaaten erweitern und nicht durch neue Vorgaben und Kontrollapparate weiter einengen. Tatsächlich haben EU-Organe in der Vergangenheit wichtige liberale Initiativen wie den EU-Binnenmarkt vorangetrieben und auch in den Mitgliedsländern viele wichtige wettbewerbs-fördernde Liberalisierungen erwirkt, nicht zuletzt in Deutschland.65 Nur wenn sich Europa auf diese Tradition zurückbesinnt und konzentriert, könnte die EU in der Tat zu einem der wettbewerbsfähigsten Wirtschaftsräume avancieren.
ABSTRACT
The article discusses the claim of European Union’s current ten year strategy ”Europe 2020” to set out a vision of a European social market economy for the 21st century and to what extent this concept is suitable to enhance growth in the European Union. It is argued that a crucial weakness of the concept of a social market economy is its elasticity and fuzziness that opens the door for targeted government interven-tions that stifle economic growth. It is shown that the economic policy concept pro-posed in ”Europe 2020” has many centralistic and interventionist main features and so sharply deviates from Ludwig Erhard’s understanding of a social market econ-omy. For him the crucial element of this concept was market competition driven by free individuals. Furthermore, it is contended that EU’s new economic policy con-cept suffers from two major shortcomings: it underestimates the difficulties of gath-ering and analyzing the relevant information necessary for steering the economy in the desired direction, and it encourages rent-seeking rather than productive entre-preneurship. In addition, growing centralized control over national policies might endanger the peaceful cooperation among member states and become an instru-ment of disintegration.
Keywords: European Union, Germany, social market economy, economic develop-ment, institutional economics
64 Hayek (1944/2011), S. 281.65 Vgl. Wohlgemuth (2007). Beispiele sind das Aufbrechen von Staatsmonopolen in Ver-
kehr, Versorgung und Kommunikation oder das Auslaufen der Gewährträgerhaftung für deutsche Sparkassen.
Jürgen Wandel 38
Literatur
Acemoglu, D. & Robinson, J. (2012): Why Nations Fail: The Origins of Power, Prospe-rity, and Poverty, New York: Crown Business.
Amable, Bruno (2003): The Diversity of Modern Capitalism, Oxford: Oxford Univer-sity Press.
Bökenkamp, G. (2010): Das Ende des Wirtschaftswunder: Geschichte der Sozial-, Wirtschafts- und Finanzpolitik in der Bundesrepublik 1969–1998, Stuttgart: Lucius & Lucius.
Baumol, W. J. (1990): Entrepreneurship: Productive, Unproductive, and Destructive. The Journal of Political Economy, Vol. 98, 5, S. 893–921.
Baumol, W. J., Litan, R. E. & Schramm, C. J. (2007): Good capitalism, bad capitalism, and the economics of growth and prosperity, Yale Univ. Press, New Haven, Conn.
Böhm, F. (1933/2010): Wettbewerb und Monopolkampf: Eine Untersuchung zur Frage des wirtschaftlichen Kampfrechts und zur Frage der rechtlichen Struktur der gel-tenden Wirtschaftsordnung, Neuausgabe 2010, Baden-Baden: Nomos-Verlag.
Buchanan, J. (1987): The Constitution of Economic Policy, in: The American Econo-mic Review, Vol. 77, 3, S. 243–250.
De Soto, H. (2000), The Mystery of Capital: Why Capitalism Triumphs in the West and Fails Everywhere Else, Now York: Random House.
Deutsche Bank – DB Research (2014): Investitionen im Euroraum: Initiativen, Hand-lungsfelder, Erfolgsfaktoren. EU-Monitor, 18. Dezember 2014, https://www.dbre-search.de-/PROD/DBR_INTER-NET_DE-PROD/PROD0000000000348027/Inves-titionen_im_-Euroraum%3A_Initiativen,_Handlungsf.PDF.
Deutsche Wirtschafts Nachrichten (2013): Mehr Staat: Deutsche rufen nach Ein-führung der Planwirtschaft, 28.11.13, http://deutsche-wirtschafts-nachrichten.de/2013/11/28/mehr-staat-deutsche-rufen-nach-einfuehrung-der-planwirtschaft/.
Ebenstein, A. O. (2001): Friedrich Hayek: A Biography, New York and Basingstoke: Palgrave Trade.
Eucken, Walter (1952): Grundsätze der Wirtschaftspolitik. Neuausgabe 1990, Tübin-gen: Mohr Siebeck.
Eurostat Statistiken, http://epp.eurostat.ec.europa.eu/portal/page/portal/stati-stics/search_-database, verschiedene Abrufe.
Erhard, L. (1957/64): Wohlstand für alle, Düsseldorf: Econ-Verlag, hier: 8. Auflage, bearbeitet von Wolfram Langer (1964), Ludwig-Erhard-Stiftung e.V., Bonn.
Erhard, L. (1959): Harmonie durch Harmonisierung?, in Frankfurter Allgemeinen Zeitung, 31. Dezember 1959.
Erhard, L. (1962/1988): Planification – kein Modell für Europa. In Hohmann, Karl (ed.): Ludwig Erhard. Gedanken aus fünf Jahrzehnten. Düsseldorf: ECON Ver-lag, S. 770–780.

„Europa 2020” – eine Vision einer europäischen sozialen Marktwirtschaft 39
Erhard, L. (1966): Wirken und Reden. Ludwigsburg: Verlag Hoch.Erlei, M. (2012): E 10. Wirtschaftliche Freiheit, 12. September 2012 http://wirtschaft-
lichefreiheit.de/wordpress/?p=10166&print=1.Erlei, M. (2013): Gefährdet die Marktwirtschaft das Wohlergehen der Men-
schen? Wirtschaftliche Freiheit, 17. April 2013, http://wirtschaftlichefreiheit.de/wordpress-/?p=12149&print=1.
Erlei, M. (2014): Die Institutionen der Sozialen Marktwirtschaft erodieren mit steigen-der Geschwindigkeit. Wirtschaftliche Freiheit, 24. Juni 2014, http://wirtschaftli-chefreiheit.de-/wordpress/?p=15101.
European Commission (2015): Innovation performance: EU Member States and international competitors compared, http://europa.eu/rapid/press-release_ MEMO-15-4928_de.htm.
Europäische Kommission (2010): Europa 2020 – Eine Strategie für intelligentes, nachhaltiges und integratives Wachstum, COM (2010) 2020. Brüssel, 3. März 2010. http://eur-lex.europa.eu/LexUriServ/LexUriServ.do?uri=COM:2010:2020: FIN:DE:PDF.
FAZ – Frankfurter Allgemeine Zeitung (2014): EU-Parlament wählt mit großer Mehrheit Juncker, 15.07.2014, http://www.faz.net/aktuell/politik/europaei-sche-union/wahl-zum-kommissions-praesidenten-juncker-will-starken-eu-aus-senbeauftragten-13046611.html.
Hall, P. & Soskice, D. (2001): Varieties of Capitalism: The Institutional Foundations of Comparative Advantage, Oxford: Oxford University Press.
Hayek, F. A. von (1937/76): Wirtschaftstheorie und Wissen, in: Hayek, F. A. von.: Indi-vidualismus und wirtschaftliche Ordnung, 2. Aufl., Salzburg, S. 49–77.
Hayek, F. A. von (1944/2011): Der Weg zur Knechtschaft, München: Olzog Verlag.Hayek, F. A. von (1945): The Use of Knowledge in Society, reprinted in: Hayek, F. A.
von (1980): Individualism and Economic Order, Chicago, London: University of Chicago Press, S. 77–91.
Hayek, F. A. von (1967/94): Rechtsordnung und Handelnsordnung, in: Hayek, F. A. von: Freiburger Studien, 2. Aufl., Tübingen, 1994, S. 161–198.
Hayek, F. A. von (1968/94): Der Wettbewerb als Entdeckungsverfahren, in: Hayek, F. A. von.: Freiburger Studien, 2. Aufl., Tübingen: Mohr Siebeck, 1994, S. 249–265.
Hayek, F. A. von (1974/96): Die Anmaßung von Wissen, in: Kerber, W. (Hg.): Die Anmaßung von Wissen. Neue Freiburger Studien, Tübingen: Mohr Siebeck. 1996, S. 3–15.
Hayek, F. A. von (1976): Law, Legislation and Liberty, vol. 2: The Mirage of Social Justice, Chicago.
Hayek, F. A. (1979/2004): Wissenschaft und Sozialismus, in: Hayek, F. A. (ed.): Wis-senschaft und Sozialismus. Aufsätze zur Sozialismuskritik, Tübingen: Mohr Sie-beck, S. 52–62.
Hayek, F. A. von (1991): Die Verfassung der Freiheit, 7. Aufl., Tübingen: Mohr Siebeck.
Jürgen Wandel 40
Hayek, F. A. von (2003): Gesammelte Schriften in deutscher Sprache, Abt. B Band 4: Recht, Gesetz und Freiheit. Eine Neufassung der liberalen Grundsätze der Gerechtigkeit und der politischen Ökonomie. Hrsg. v. Viktor Vanberg 2003, Tübingen: Mohr Siebeck.
Hirschman, A. O. (1970): Exit, Voice and Loyality – Responses to Decline in Firms, Organizations and States, Cambridge, Mass: Harvard University Press.
Horn, K. I. (2010): Die Soziale Marktwirtschaft: Alles, was Sie über den Neoliberalis-mus wissen sollten, Frankfurt: Frankfurter Allgemeine Buch.
Issing, Otmar (2015): Completing the unfinished house: Towards a genuine economic and monetary union?, CFS Working Paper Series, No. 521, http://hdl.handle.net-/10419/121487.
Juncker, J.-C. et al. (2015): Die Wirtschafts- und Währungsunion Europas vollen-den. Report, Europäische Kommission. http://www.ludwig-erhard-stiftung.de/wp-content/uploads/5-presidents-report_de.pdf.
Kirzner, I. M. (1978): Wettbewerb und Unternehmertum, Tübingen: Mohr Siebeck.Kirzner, I. M. (1982): Competition, Regulation, and the Market Process: An "Aus-
trian" Perspective. Cato Policy Analysis No. 18. www.cato.org/pub_display.php?pub_id=884.
Kirzner, I. M. (1997): Entrepreneurial Discovery and the Competitive Market Process: An Austrian Approach, in: Journal of Economic Literature, Vol. XXV (March), S. 60–85.
Laffont, J.-J., Tirole, J. (1991): The Politics of Government Decision-Making: A The-ory of Regulatory Capture, in: Quarterly Journal of Economics, Vol. 106, 4, S. 1089–127.
Mierzejewski, A. C. (2006): Ludwig Erhard. Der Wegbereiter der Sozialen Marktwirt-schaft, München: Siedler.
Mises, L. von (1929/1976): Kritik des Interventionismus: Untersuchengen zur Wirt-schaftspolitik und Wirtschaftsideologie der Gegenwart, Stuttgart: Gustav Fischer.
North, D. C. (1990): Institutions, Institutional Change and Economic Performance, Cambridge: Cambridge University Press.
OECD Statistics, http://epp.eurostat.ec.europa.eu/portal/page/portal/statistics/search_database, verschiedene Abrufe.
Olson, M. (1991): Aufstieg und Niedergang von Nationen: Ökonomisches Wachstum, Stagflation und soziale Starrheit, 2., durchges. Aufl., Tübingen: Mohr Siebeck.
Olson, M. (2002): Macht und Wohlstand: kommunistischen und kapitalistischen Dik-taturen entwachsen, Tübingen: Mohr Siebeck.
Pennington, M. (2011): Robust Political Economy, Cato’s Letter. A Quarterly Message on Liberty, Spring, Vol, 9, 2; http://www.cato.org/sites/cato.org/files/pubs/pdf/ catosletter-v9n2.pdf.
Reinhart, C. & Rogoff, K. (2009): This Time is Different: Eight Centuries of Financial Folly, Princeton: Princeton University Press.

„Europa 2020” – eine Vision einer europäischen sozialen Marktwirtschaft 41
Röpke, W. (1959): Zwischenbilanz der europäischen Wirtschaftsintegration. Kritische Nachlese, in Ordo, Jahrbuch für die Ordnung in Wirtschaft und Gesellschaft, Vol. 11., S. 69–94.
Schmidt, V. A. (2002): The Futures of European Capitalism. Oxford: Oxford Univer-sity Press.
Schüller, A. (2002): Soziale Marktwirtschaft, in: Schüller, A.; Krüsselberg, H.-G. (Hrsg.): Grundbegriffe der Ordnungstheorie und Politischen Ökonomik. Arbeits-berichte zu Ordnungsfrage der Wirtschaft, Nr. 7, 5. durchgesehene und ergänzte Auflage, Marburg: Marburger Gesellschaft für Ordnungsfragen der Wirtschaft [MGOW], S. 156–163.
Schüller, A. (2006): Wettbewerbs- und Industriepolitik -EU-Integration als Dritter Weg?, in: Wentzel, D. (Hrsg.): Ordnungspolitische Aspekte der europäische Integration, Schriften zu Ordnungsfragen der Wirtschaft, Bd.. 82. Stuttgart: Lucius & Lucius, S. 127–168.
Schüller, A. (2011): Europäische Union: Das fatale Einheitsdenken. FAZ – Frankfur-ter Allgemeine Zeitung, 03.09.2011, http://www.faz.net/aktuell/wirtschaft/wirt-schaftspolitik-/europaeische-union-das-fatale-einheitsdenken-11130888-p5.html.
Siebert, H. (2001): Der Kobra-Effekt. Wie man Irrwege der Wirtschaftspolitik vermei-det, Stuttgart: DVA.
Spiegel (2013): Spiegel-Gespräch: Wir brauchen Märkte, 1/2013, S. 30–32, http://www.spiegel.de/spiegel/print/d-90334817.html.
Streit, M. (2005): Theorie der Wirtschaftspolitik, 6. Aufl. Stuttgart: UTB.Streit, M. (2010): Interdisziplinäre Aspekte der Ordnungsökonomik, in: ORDO, Jahr-
buch für die Ordnung von Wirtschaft und Gesellschaft, Bd. 61, S. 115–125.Wirtschaftswoche (2014): EU-Gipfel winkt Investitionspaket durch: Europa will prassen,
19.12.2014, http://www.wiwo.de/politik/europa/eu-gipfel-winkt-investitionspaket- durch-europa-w.
Wohlgemuth, M. (2007): Einheit in Vielfalt: Fünfzig Jahre europäische Ordnungs-politik, FAZ, 17.03.2007, S. 11, http://www.eucken.de/fileadmin/bilder/Doku-mente/Wohlge-muth-Politikreform.pdf.
Wohlgemuth, M.; Adamovich, I. B. (1999): Systemwettbewerb in der Schweiz: Ein Test-fall für das Zusammenspiel von „Exit”, „Voice” und „Loyality”. Diskussionsbeitrag 09–99, Max-Planck-Institut zur Erforschung von Wirtschaftssystemen, Jena.
World Bank Database, http://data.worldbank.org/german, verschiedene Abrufe.


Józef OLSZYŃSKI*
POLITYKA EUROPEJSKA NIEMIEC W LATACH 2012–2013
Wprowadzenie
Badanie status quo na drodze Niemiec do osiągania celów strategii Unii Europejskiej „Europa 2020” wymaga również szukania odpowiedzi na pytanie o kierunek i charakter zmian w zasadniczych elementach niemieckiej polityki europejskiej1. W szczególności chodzi o to, czy w polityce europejskiej Niemiec mamy do czynienia z przewagą kontynuacji, tzn. zachodniego zakotwiczenia (Westbindung), realizowanego przez kilka powojennych dziesięcioleci w ramach tzw. republiki bońskiej oraz czy zaszły już istotne zmiany o charakterze prze-łomowym, prowadzące do uwidocznienia się nowego paradygmatu w kwe-stiach europejskich w obecnej „republice berlińskiej”. Odpowiedź na powyższe pytanie powinna umożliwić ocenę tego, czy RFN pozostaje motorem integra-cji europejskiej z nową, silniejszą funkcją przywódczą, czy też wykorzystuje Unię Europejska jako instrument własnych interesów w „globalnym koncer-cie mocarstw”2.Zmiany w polityce europejskiej Niemiec mają charakter cią-gły i sięgają korzeniami wcześniejszych okresów historycznych. Przedmiotem analizy natomiast jest, obok krótkiego nawiązania do okresów wcześniejszych, proces zmian w ostatnim czasie, tzn. w latach 2012–2014. W tym czasie nastą-piło samookreślenie celów i zasad niemieckiej polityki europejskiej w związku
* Instytut Gospodarki Światowej, Szkoła Główna Handlowa w Warszawie, * e-mail: [email protected]
1 Termin ‘polityka europejska’ używany jest w szerszym i węższym znaczeniu. W pierw-szym przypadku chodzi o część polityki zagranicznej dotyczącej Europy. W węższym zna-czeniu – używanym w krajach Unii Europejskiej znacznie częściej – polityka europejska to polityka danego kraju członkowskiego wobec i w ramach procesów integracyjnych w UE. W niniejszym opracowaniu ten termin jest używany w drugim znaczeniu.
2 Por. K. Rak (2014): Niemcy przestają być Zachodem, „Rzeczpospolita”, 12 maja; http://prawo.rp.pl/artykul/1109144.html
Józef Olszyński 44
z wyborami do Parlamentu (Bundestagu) w 2013 roku i tworzeniem nowej koalicji rządowej CDU/CSU – SPD. Przyśpieszenie zmian związane było z kata-litycznym oddziaływaniem światowego kryzysu ekonomiczno-finansowego i wydarzeń na Ukrainie.
1. Historyczne uwarunkowania aktualnego procesu zmian w polityce europejskiej Niemiec – zasadnicze etapy ewolucji do 2013 roku
Niemcy, ze względu na swój potencjał ludnościowy i gospodarczy oraz doświadczenia historyczne, zajmowały i zajmują istotną, niekiedy wiodącą i szczególną pozycję w Europie, w Europejskiej Wspólnocie Gospodarczej/Unii Europejskiej. Są mocarstwem regionalnym z ambicjami odgrywania ważnej roli w układzie globalnym3. Utrzymanie takiej pozycji jest ich niezmiennym celem podstawowym; zmianom natomiast podlegają cele cząstkowe i okresowe oraz metody działania, dostosowywane do zmieniających się uwarunkowań zewnętrznych i wewnętrznych.
Często przywoływanym punktem odniesienia do ostatnich zmian w euro-pejskiej polityce Niemiec jest długi okres po II wojnie światowej, w trakcie którego Niemcy najpierw były podzielone, a potem – jeszcze do końca epoki Helmuta Kohla (1998) – funkcjonowały w ramach tzw. republiki bońskiej. Ich politykę europejską charakteryzowała niemal nieograniczona skłonność do wspierania (w tym finansowego) procesów integracji i powściągliwość w pre-zentowaniu własnych interesów w imię podstawowej racji stanu, tj. powrotu Niemiec do rodziny demokratycznych krajów zachodnich i zjednoczenia pań-stwa. Takie nastawienie w europejskiej polityce Niemiec dominowało jeszcze w trakcie tworzenia unii walutowo-monetarnej (rezygnacja z marki), ale wów-czas rozpoczął się już proces określania na nowo interesów narodowych zjed-noczonego państwa niemieckiego4.
3 Por. A. Wróbel (2014): Specyfika mocarstwowości ekonomicznej Niemiec, w: Nowe zjawi-ska w gospodarce Niemiec i w polsko-niemieckich stosunkach gospodarczych, red. J. Olszyński, A. Bielig, Oficyna Wydawnicza SGH, Warszawa, s. 249–267; Kolos na glinianych nogach, http://biznes.pl/wiadomosci/unia-europejska/ (12.10.2014).
4 Szerzej na ten temat: J. Olszyński (2004): Niemieckie koncepcje integracji Europy/Deut-sche Ideen der Europa-Integration, w: Polska – Niemcy a rozszerzenie Unii Europejskiej, t. I, red. W. Małachowski, Oficyna Wydawnicza SGH, Warszawa; J. Olszyński (2008): Nowe ele-menty w polityce europejskiej Niemiec, w: Dokąd zmierzają Niemcy, red. B. Brocka-Palacz, Oficyna Wydawnicza SGH, Warszawa.
Polityka europejska Niemiec w latach 2012–2013 45
W republice berlińskiej, po przejęciu władzy z rąk kanclerza H. Kohla przez socjaldemokratę Gerharda Schrödera (koalicja rządowa SPD – Zie-loni) w 1998 roku, nastąpił pierwszy w okresie powojennym wyraźny przełom w polityce europejskiej Niemiec. W sferze strategiczno-koncepcyjnej oznaczał on aktywizację Niemiec w zgłaszaniu i promowaniu kwestii przyszłego kształtu Unii Europejskiej, zwłaszcza jej konstytucjonalizowania w formie federacji5. W warstwie realizacji polityki europejskiej nowy rząd SPD – Zieloni zerwał z polityką samoograniczania i skłonnością do kompromisów. Używając zupeł-nie nowego twardego języka, zgłaszał i forsował narodowe interesy Niemiec6. Równocześnie rząd G. Schrödera kontynuował duże zaangażowanie Niemiec w polityce europejskiej i w realizacji postępu procesów integracyjnych, roz-wiewając tym samym wątpliwości polityków i analityków co do zachowania się zjednoczonego państwa niemieckiego w tym zakresie. W okresie rządów G. Schrödera zrealizowano również reorientację europejskiej polityki Niemiec na obszar Europy Środkowej i Południowo-Wschodniej. Do tego tradycyjnego obszaru swojego zainteresowania Niemcy powróciły w kontekście rozszerze-nia Unii Europejskiej, którego to procesu były wyraźnym promotorem, oraz w związku z aktywnym zaangażowaniem w konflikt bałkański.
Przejęcie władzy w Berlinie w 2005 roku przez koalicję CDU/CSU – SPD z Angelą Merkel jako kanclerzem zaowocowało w niemieckiej polityce europej-skiej z jednej strony, zmianami w kierunku złagodzenia używanego języka i spo-sobu prezentowania niemieckich interesów, a z drugiej – wsparciem, zgodnie z zasadą pacta sunt servanda, schröderowskiej zmiany w podejściu oraz dalszej ewolucji (według polityki małych kroków) na drodze do przywództwa Niemiec.
Od 2007 roku procesy zdobywania przez Niemcy ważnej pozycji w skali globalnej w ramach wielobiegunowości świata oraz kształtowania przywódz-twa w Unii Europejskiej zostały przedstawione światowej opinii publicznej7.
5 Szerzej na ten temat: J. Kłys (2012): Niemieckie wizje kształtu Unii Europejskiej w okre-sie rządów Gerharda Schrödera, „Rocznik Integracji Europejskiej”, nr 6.
6 Wśród wielu przykładów takich działań można wymienić m.in. przeforsowanie gra-nicy (1% DNB) finansowania budżetu Unii, ustalenie zmniejszonych dopłat dla rolników z nowych krajów UE, ograniczenie dostępu do niemieckiego rynku pracy dla pracobior-ców z nowych krajów członkowskich (siedmioletni okres przejściowy), zmiany kierunku wydatków na fundusze strukturalne, blokowanie dyrektyw sektorowych niekorzystnych dla gospodarki Niemiec. Por. J. Olszyński (2008), Nowe elementy…, op.cit., s. 25–26.
7 W 2007 roku Niemcy przejęły roczne przewodnictwo w grupie najbardziej uprzemy-słowionych państw świata G-8 i okresową prezydencję w Unii Europejskiej. Poprzez pozy-tywne i sprawne przeprowadzenia obu tych przewodnictw rząd Niemiec i osobiście kanclerz Angela Merkel dali znak związku sterowania polityką globalną i sukcesami na forum UE oraz zaprezentowali własne zdolności do przewodzenia w obu tych wymiarach.
Józef Olszyński 46
Spośród różnych dyskutowanych w wielu krajach scenariuszy zachowania się RFN w kwestiach integracji europejskiej od czasu rządów Angeli Merkel reali-zuje się scenariusz przywództwa. Niewątpliwym katalizatorem w wykonywaniu przywódczej roli Niemiec w Unii Europejskiej stał się globalny kryzys finan-sowy lat 2008–2009 oraz kryzys strefy euro od 2010 roku. Niemcy, które szybko i skutecznie oraz w niedoktrynalny sposób przezwyciężyły kryzys finansowo--gospodarczy lat 2008–2009, nie tylko zachowały mocarstwowy status w Euro-pie i istotne miejsce w układzie globalnym, ale też poprawiły swoją relatywną pozycję na skutek słabości innych aktorów na scenie europejskiej i światowej8.
Zjawisko to – zwłaszcza w kontekście dominującej roli odegranej przez Niemcy w przezwyciężeniu kryzysu krajów strefy euro, w trakcie którego, ze względu na tzw. dyktat oszczędnościowy kanclerz Angeli Merkel RFN nadało tytuł „żandarma Europy”9 – ponownie ożywiło dyskusję w Europie, a zwłasz-cza w Niemczech i w Polsce o dylemacie „Niemcy europejskie versus niemiecka Europa”10.
Przejęcie roli przywódczej nastąpiło w okresie apogeum kryzysu, niejako z konieczności, ale za wiedzą, przyzwoleniem, a czasem – ze wspierającą suge-stią – innych krajów członkowskich UE11. Spośród potencjalnych współlide-rów z grona krajów członkowskich UE Wielka Brytania odpadła ze względu na swój eurosceptycyzm i brak zainteresowania, Francja – ze względu na kło-
8 Slogany o Niemczech jako „chorym ogniwie” Unii Europejskiej zostały zastąpione nowymi: o „nowym cudzie gospodarczym” w RFN.
9 G. Müller-Brandeck-Bocquet (2014): Nowa polityka europejska Niemiec, „Sprawy Mię-dzynarodowe”, nr 2, s. 9.
10 Dla przykładu: pierwszy numer „Nowej Europy – Przegląd Natoliński” z 2012 roku w całości poświęcono niemieckiej polityce w Europie, publikując przemówienie kanc-lerz Angeli Merkel wygłoszone podczas uroczystości inauguracji 61. roku akademickiego w Kolegium Europejskim w Brugii w dniu 2 listopada 2010 r. oraz artykuły, m.in.: Ch. Hacke (2012): Niemcy i świat: mocarstwo cywilne bez odwagi cywilnej?, „Nowa Europa Przegląd Natoliński”, nr 1; W. Abelshauser (2012): Niemcy, Europa i świat, „Nowa Europa Przegląd Natoliński”, nr 1; A. Kwiatkowska-Drożdż (2012): Mocarstwo pragmatyczne; „Nowa Europa Przegląd Natoliński”, nr 1; M. A. Cichocki (2012): Zmiana niemieckiego paradygmatu w Euro-pie, „Nowa Europa Przegląd Natoliński”, nr 1.
W 2013 roku został wydany specjalny numer (34) „Krytyki Politycznej” pt. Co dalej z nie-miecką Europą? z tekstami m.in.: U. Beck (2013): Kosmopolityczny naród i nowa architektura Europy?, „Krytyka Polityczna”, nr 34 (wydanie specjalne pt. Co dalej z niemiecką Europą?); J. Habermas (2013): Demokracja, solidarność i kryzys Europy, „Krytyka Polityczna”, nr 34 (wydanie specjalne pt. Co dalej z niemiecką Europą?); M. A. Cichocki (2013): Niemcy duszą się na kontynencie, P. Buras, Inna niemiecka Europa?, „Krytyka Polityczna”, nr 34 (wydanie specjalne pt. Co dalej z niemiecką Europą?).
11 Najczęściej wskazywanymi przykładami są opinie Romano Prodi i Radosława Sikorskiego.

Polityka europejska Niemiec w latach 2012–2013 47
poty z konkurencyjnością gospodarki i problemy finansowe, Hiszpania i Włochy – w związku z ich degradacją do roli państw potrzebujących pomocy. Polska poprzez wypowiedź ministra R. Sikorskiego postulowała przywódczą aktywność Niemiec12. W zaistniałej sytuacji, zwłaszcza wobec faktycznego przewodzenia w procesie budowy Europejskiego Mechanizmu Stabilizacyjnego (ESM), spo-rządzenia i podpisania paktu fiskalnego i unii bankowej oraz przygotowania pakietu pomocowego dla Grecji zadawano – już wyłącznie retoryczne – pyta-nie: „Kto, jeżeli nie Niemcy?”13.
Okres przejęcia przywódczej roli „z konieczności”, w warunkach kryzy-sowych, kończy się w 2013 roku. Przed wyborami parlamentarnymi w Niem-czech we wrześniu 2013 apogeum kryzysu minęło. Najbardziej zagrożone kraje strefy euro, łącznie z Grecją, uporządkowały swoje finanse publiczne na tyle, że sprzedają swoje papiery dłużne na wolnym rynku, a całkowity deficyt budże-towy strefy spadł z 4,1% w 2011 roku do 3,7% w roku 201314.
Charakter przywództwa Niemiec w Unii Europejskiej od 2013 roku zaczyna się zmieniać. Nowy rząd koalicyjny, tzw. wielkiej koalicji, złożony z przedstawi-cieli CDU/CSU i SPD, ponownie z kanclerz Angelą Merkel na czele, uwzględ-niając pierwsze doświadczenia w pełnieniu roli przywódczej, decyduje się na formalną jej akceptację.
2. Autodeklaracja przywódczej roli Niemiec w integracji europejskiej
Po wyborach do Bundestagu we wrześniu 2013, w których problematyka europejska i problematyka charakteru pozycji Niemiec w procesie integracji odgrywała o wiele większą rolę niż zazwyczaj, zmiany niemieckiej polityki europejskiej sformalizowano w ramach ustaleń umowy koalicyjnej CDU/CSU i SPD z 27 listopada 2013 roku. W obszernej umowie koalicyjnej (185 stron) pt. Ukształtować przyszłość Niemiec (Deuschlands Zukunft gestalten) problema-tyce europejskiej poświęcono rozdział VI (12 stron) pt. Silna Europa (Starkes
12 R. Sikorski, Polska a przyszłość Unii Europejskiej, http://m.wiadomosci.gazeta.pl13 Por. A. Hagelüken (2011): Wer, wenn nicht Deutschland?, „Süddeutsche Zeitung”, 5 grud-
nia; G. Müller-Brandeck-Bocquet (2012): Deutschland – Europas einzige Führungsmacht?, „Aus Politik und Zeitgeschichte”, 5 marca, www.bpb.de/apuz/75788/deutschland-europas- einzige-fuehrungsmacht
14 Deutschland in Zahlen (2014): Ausgabe 2014, Institut der Deutschen Wirtschaft, Köln, s. 138.

Józef Olszyński 48
Europa). Uzupełniające elementy, pośrednio związane ze sprawami integracji UE, zawarte są również w rozdziale VII, dotyczącym odpowiedzialności Nie-miec w świecie.
Obok tradycyjnego potwierdzenia chęci uczestnictwa Niemiec w procesie integracji w postaci zapisu, że „integracja europejska pozostaje najważniej-szym zadaniem Niemiec”15, pojawiło się nowe sformułowanie o charakterze kluczowym, że „Niemcy jako silne gospodarczo państwo członkowskie i gwa-rant stabilizacji zaakceptowały swoją odpowiedzialność i szczególne oczeki-wania swoich partnerów”16. Konkretyzację misji przywódczej sformułowano w dalszej części, w której Niemcy zobowiązują się do „wyprowadzenia wzmoc-nionej Europy z obecnego kryzysu” oraz „stworzenia nowego przełomu dla Europy silnej politycznie, gospodarczo i sprawiedliwej społecznie”17. Metodą do osiągnięcia tych celów ma być, w perspektywie ogólnej, „wzmocnienie i roz-budowanie zaufania do integracji europejskiej”18, w perspektywie zaś bardziej konkretnych celów cząstkowych, projektów i przedsięwzięć m.in.:• zwiększenie demokratycznej legitymizacji organów Unii Europejskiej19;• ścisłe przestrzeganie zasady subsydiarności i kompetencji szczebli euro-
pejskiego, narodowego, regionalnego i lokalnego;• reformy strukturalne dla zwiększenia konkurencyjności i konsolidacji finan-
sów publicznych. Rząd koalicyjny CDU/CSU – SPD podtrzymał dotychczasową działalność Niemiec w kwestiach konieczności oszczędzania i narodowej odpowiedzialności za stan budżetów („zasada, wedle której każde państwo członkowskie musi odpowiadać samodzielnie za swoje zobowiązania, musi być zachowana”, a „narodowa realizacja budżetu i ponadnarodowa odpo-wiedzialność za jego zobowiązania są nie do pogodzenia”)20;
• dopilnowanie realizacji paktu dla wzrostu i zatrudnienia z lata 2012 roku o wartości około 120 mld euro, który dzięki inwestycjom w innowacje i kapi-tał ludzki oraz szersze wykorzystanie partnerstwa publiczno-prywatnego ma stworzyć szanse na szybszy wzrost gospodarczy i przyrost zatrudnienia;
15 Deutschlands Zukunft gestalten, Koalitionsvertrag zwischen CDU, CSU und SPD, 18. Legislaturperiode, http://www.bundesregierung.de/content/DE-Anlagen/2013/2013–12-17- Koalitionsvertrag,Pdf
16 Ibidem, s. 109.17 Ibidem, s. 109.18 Ibidem, s. 110.19 Por. F. Decker (2014): Die Europäische Union auf dem Weg zur parlamentarischen
Demokratie?, „Aus Politik- und Zeitgeschichte”, nr. 38–39, 15 września.20 Deutschlands Zukunft…., op.cit., s. 110.

Polityka europejska Niemiec w latach 2012–2013 49
• ogólnounijne rozprzestrzenienie zasad społecznej gospodarki rynkowej, w ramach której wymiar społeczny ma prowadzić poprzez większą spo-łeczną sprawiedliwość do szerszej akceptacji obywatelskiej procesu inte-gracji europejskiej;
• zgłaszanie przez rząd RFN nowych inicjatyw zmierzających do wzmocnie-nia i pogłębienia wspólnej polityki bezpieczeństwa i obrony Unii Europej-skiej oraz doprowadzenie do strategicznej dyskusji na temat tego, co Unia Europejska może i chce osiągać przede wszystkim przez środki cywilne, a co – w skrajnym przypadku – za pomocą interwencji wojskowej21.Nowe podejście Niemiec do przejmowania odpowiedzialności zostało zapre-
zentowane również w ujęciu szerszym, w odniesieniu do polityki światowej. Stało się to zarówno we wspomnianym rozdziale VII umowy koalicyjnej, jak i znacznie dobitniej, w wystąpieniach przedstawicieli RFN na corocznej kon-ferencji bezpieczeństwa w Monachium w styczniu 2014 roku.
Prezydent RFN Joachim Gauck w przemówieniu pt. Rola Niemiec w świe-cie: uwagi w sprawie odpowiedzialności, norm i sojuszy w zdecydowany sposób stwierdzał, że „Republika Federalna Niemiec, jako dobry partner, winna anga-żować się wcześniej, bardziej zdecydowanie i w większym stopniu”22, a w sto-sunku do krytyków, zirytowanych zwiększaniem odpowiedzialności państwa niemieckiego, skierował argument, że „także ten, kto nie działa, przejmuje odpowiedzialność”23.
Podobne stanowisko na tejże konferencji wyraziła minister obrony Ursula von der Leyen, stwierdzając, że „przeczekanie nie jest żadną opcją”; „dla Nie-miec nie może być taką opcją również obojętność”24.
Minister spraw zagranicznych w nowym rządzie RFN Frank-Walter Stein-meier w Monachium potwierdził poparcie wspólnej polityki bezpieczeństwa i obrony, podkreślając, że „Niemcy muszą być gotowe na wcześniejsze, bar-dziej zdecydowane i konkretne zaangażowanie w politykę bezpieczeństwa” oraz że „Niemcy są zbyt duże, aby komentować politykę światową z pozycji zewnętrznego obserwatora”25.
21 Ibidem, s. 114.22 Deutschlandsrolle in der Welt: Anmerkungen zur Verantwortung, Normen und Bündnis-
sen, http://www.bundespraesident.de/SharedDocs/Reden/DE/Joachim-Gauck/Reden/201423 Ibidem.24 Rede der Bundesministerin der Verteidigung Dr. Ursula von der Leyen anlässlich der
50. Münchner Sicherheitskonferenz, München, 31. Januar 2014, http://www.bmvg.de/portal/ a/bmvg/
25 Rede von Aussenminister Frank-Walter Steinmeier anlässlich der 50. Münchner Sicher-heitskonferenz, München, 31. Januar 2014, http://www.auswaertiges-amt.de/DE/Infoservice/

Józef Olszyński 50
Warto zwrócić uwagę na to, że powołanie na stanowisko ministra spraw zagranicznych F-W. Steinmeiera – najbliższego i najbardziej zaufanego współ-pracownika SPD-owskiego kanclerza G. Schrödera, piastującego w jego rządzie to samo stanowisko, skutkuje w kontekście jakości niemieckiego przywództwa różnokierunkowymi efektami. Z jednej strony, osobowość Steinmeiera, jego doświadczenie i zdecydowanie oraz wola faktycznego zarządzania polityką europejską26 są w stanie zwiększyć sprawność i skuteczność niemieckiego przy-wództwa, z drugiej – jego pozycja w SPD, bliskość z byłym kanclerzem i wcze-śniejsze relacje międzynarodowe mogą stworzyć ryzyko braku neutralności, zwłaszcza w kwestiach polityki wschodniej UE. W pierwszej perspektywie „efekt Steinmeiera” pojawił się w postaci szybkiej zapowiedzi redefinicji niemieckiej polityki zagranicznej, nowego początku we współpracy niemiecko-francuskiej w kwestiach polityki europejskiej i zagranicznej, podjęcia wspólnych podróży do stref napięć i konfliktów na Wschodzie z francuskim ministrem spraw zagra-nicznych i – w ramach Trójkąta Weimarskiego – również z polskim ministrem spraw zagranicznych27. W drugiej perspektywie Steinmeier, zgodnie z zadekla-rowaną i realizowaną koncepcją partnerstwa strategicznego z Rosją, apeluje na forum międzynarodowym, aby „nie rozważać przyszłości Europy bez Rosji albo przeciwko niej”28. F-W. Steinmeier mówi i działa w tym zakresie w pełni zgodnie z linią swojej partii (SPD), której przewodniczący i zarazem wicekanc-lerz rządu RFN Sigmar Gabriel w wywiadzie dla telewizji ARD wypowiedział się przeciwko „wymachiwaniu szabelką przez NATO na wschodnich rubieżach Sojuszu” oraz przeciwko zaostrzaniu sankcji wobec Rosji29.
3. Model niemieckiego przywództwa i pierwsze doświadczenia z jego realizacji w strefie euro i w Unii Europejskiej
Istnieje dość daleko posunięta zgodność w świecie polityków i analityków co do charakteru (modelu) przywództwa Niemiec w Unii Europejskiej. Określa się go najczęściej jako „przywództwo bez hegemonii”, „przywództwo kolektywne”,
Presse/Reden/201426 Poprzednika Steinmeiera, Guido Westerwellego z FDP, ostro krytykowano za przeka-
zanie kompetencji w polityce europejskiej do Urzędu Kanclerskiego i Ministerstwa Finan-sów. Szerzej: G. Müller-Brandeck-Bocquet, Nowa polityka…, op.cit., s. 12–14.
27 S. Braun (2014): Steinmeiers rasanter Neustart, „Süddeutsche Zeitung” 21 stycznia.28 Rede von Aussenminister…., op.cit.29 http://wiadomosti.onet.pl/swiat/vicekanclerz-niemiec-nato-nie-moze-wymachiwac
(17.11.2014).
Polityka europejska Niemiec w latach 2012–2013 51
„przywództwo kooperatywne”. Sens autodeklaracji polityki niemieckiej i ocen obserwatorów życia międzynarodowego oddaje teza Sebastiana Harnischa, że „zjednoczone Niemcy nie są hegemonem ani w Europie, ani w świecie, ale w różnych instytucjach, podczas kryzysów czy w konfliktach międzynarodowych odgrywały (odgrywają) przywódczą rolę w rozmaitych kwestiach merytorycz-nych czy technicznych”30. W argumentacji na rzecz tezy o niewystępowaniu hegemonii podkreśla się, że RFN, z jednej strony, nie dysponuje wystarczają-cymi zasobami militarnymi, politycznymi i finansowymi, aby trwale i insty-tucjonalnie zająć nadrzędną pozycję opartą na sile, a z drugiej – wewnętrzne uwarunkowania (porządek konstytucyjny, spektrum partyjne, wartości spo-łeczne) nie zapewniają prowadzenia polityki hegemonialnej31.
U podstaw szeroko rozpowszechnionej tezy o braku hegemonii leży rozróż-nienie między hegemonią a przywództwem. Hegemonia to przywództwo jed-nego aktora nad innymi na podstawie przewagi militarnej czy ekonomicznej. Przywództwo zakłada występowanie stronników (partnerów) i jest rolą spo-łeczną, związaną z występowaniem komplementarnej roli stronnika32. Ponadto, rola przywódcza jest zawsze funkcjonalnie i czasowo ograniczona ze względu na ustalony cel grupowy. Międzynarodowa rola przywódcza jest intersubiek-tywna, zakłada aktywność stronników (partnerów), którym się przewodzi, i uznanie atrybutów podmiotu takiej roli przez podmioty trzecie33.
Przywództwo powiązane z teorią ról społecznych zawiera wiele pojedyn-czych ról. Przywódcy podejmują zazwyczaj rolę ustanawiającego agendę, rolę reprezentacji stronników oraz rolę maklera. W każdej z tych ról występuje problem legitymizacji, związany z identyfikacją członków grupy i skuteczno-ścią w osiąganiu celów, w tym np. sprawiedliwego podziału dóbr34. Ten ostatni aspekt przesądza o potencjale przywódczym. Jest on determinowany zarówno przez czynniki wewnętrzne (sytuacja w gospodarce kraju), jak i zewnętrzne
30 S. Harnisch (2014): Przywództwo bez hegemonii. Rola Niemiec w czasie kryzysu euro, „Sprawy Międzynarodowe”, nr 2, s. 27. Autor przytacza przykłady przywódczej roli Niemiec w Europie: pogłębienie i rozszerzenie Unii, europejska polityka bezpieczeństwa i obrony, pakt stabilności, dyplomatyczne zakończenie konfliktu w Kosowie, wspólne stanowisko unijne w sprawie redukcji emisji dwutlenku węgla, przezwyciężanie kryzysu euro. Ibidem, s. 28.
31 Por. H. Triepel (1938): Die Hegemonie. Ein Buch von führenden Staaten, Stuttgart; I. Clark (2011): Hegemony in International Society, New York; W. Link (2012): Integratives Gleichgewicht und gemeinsame Führung. Das Europäische System und Deutschland, „Mer-kur”, nr 762, s. 1025–1034.
32 S. Harnisch (2014), Przywództwo…, op.cit., s. 29.33 Ibidem, s. 30.34 Ibidem, s. 31–32.
Józef Olszyński 52
(zewnętrzne oceny wiarygodności i wypłacalności kraju). Od 2012 roku Euro-pejska Rada Spraw Zagranicznych mierzy przywódczy potencjał państw człon-kowskich Unii Europejskiej. Dane z 2013 roku informują, że pierwszą pozycję w tym rankingu zajmowały Niemcy, angażując się w 13 z około 40 sfer polityki. Kolejne miejsca przypadły Francji, Wielkiej Brytanii i Szwecji35.
Przywódcza rola Niemiec, np. w kryzysie euro, ma swoje źródło nie tylko w niskim stanie deficytu budżetowego, ale również w dobrej ocenie agencji ratingowych i aktorów rynków finansowych co do wypłacalności. To z kolei pozwoliło rządowi RFN wpływać przywódczo (wagą swojego wkładu) na powsta-nie i wypłacalność Europejskiego Instrumentu Stabilności Finansowej (EFSF) i Europejskiego Mechanizmu Stabilności (ESM).
W podejściu opartym na teorii ról można uznać, że źródłem niemieckiej polityki przywództwa jest koncepcja roli w interakcji z innymi znaczącymi pod-miotami, w tym przede wszystkim z aktorami polityki wobec rynków finanso-wych, jak Europejski Bank Centralny (EBC).
Cele polityki niemieckiego przywództwa w tym obszarze były niezmienne: zachowanie strefy euro oraz kontynuowanie polityki stabilności fiskalnej i pie-niężnej z ukierunkowaniem na wzmocnienie konkurencyjności gospodarczej. Charakter przywództwa podlegał wyraźnej ewolucji.
W fazie pierwszej (do jesieni 2010 roku) dominowały inicjatywy narodowe i podejmowanie europejskich środków ad hoc. Niemcy, opierając się na swoim przywiązaniu do polityki stabilności, realizowały zasadę ścisłej warunkowo-ści (pomoc za środki naprawcze, niemiecka solidarność za solidność polityki fiskalnej). Tym samym, rząd niemiecki przyjął silną, ale narodową rolę ustana-wiania agendy. Jednakże oczekiwania europejskich krajów sąsiedzkich w tym czasie były wyraźnie ukierunkowane na przyjęcie przywódczej roli Niemiec. Odczyt tych intencji tak dla siebie, jak i dla obywateli swojego kraju sformuło-wała kanclerz Merkel w oświadczeniu przed Bundestagiem 5 maja 2010 roku: „Europa patrzy dziś na Niemcy. Bez nas, przeciwko nam nie może być i nie będzie podjęta żadna decyzja. Bez nas, przeciwko nam nie może być podjęta żadna decyzja, która ekonomicznie nie będzie nośna i nie będzie odpowiadać wymogom zarówno prawa europejskiego, jak i krajowego”36.
35 J. Vaisse, S. Denisson (2013): European Foreign Policy Score Card, Brussels.36 Regierungserklärung von Bundeskanzlerin Angela Merkel zu den Massnahmen zum
Erhalt der Stabilität der Währungsunion und zum bevorstehenden Sondergipfel der Eurolän-der am 7. Mai in Brüssel vor dem Deutschen Bundestag am 5. Mai in Berlin, www.bundes-regierung.de/Content/ (DE/Bulletin/2010/05/Anlagen/48–1-bk.pdf

Polityka europejska Niemiec w latach 2012–2013 53
W fazie drugiej (jesień 2010 – jesień 2011) niemiecka rola przywódcza wyraźniej nabrała charakteru kolektywnego. Niemcy jako lider wystąpiły z ini-cjatywą zeuropeizowania niemieckiego hamulca zadłużenia oraz podjęły koor-dynację działań w tandemie niemiecko-francuskim. Duet niemiecko-francuski zmierzał do tego, aby poprzez reformy strukturalne uzyskać trwały efekt. Rów-nocześnie przywódcza rola Niemiec została wzmocniona poprzez aktywność Federalnego Trybunału Konstytucyjnego, który formułował określone zobowią-zania dla rządu niemieckiego, m.in. wykluczając prawnie emisję euro obligacji.
Faza trzecia (od jesieni 2011) przyniosła utrzymanie kolektywnego przywódz-twa Niemiec w połączeniu ze sterowaniem ponadnarodowym37. Przywódcza rola Niemiec była skutecznie realizowana we współpracy z Francją o charak-terze międzyrządowym. Jednocześnie Europejski Bank Centralny prowadził coraz bardziej zasadnicze ingerencje na rynku finansowym, które były różnie oceniane przez rząd Niemiec i Bank Federalny, ale ostatecznie – tolerowane. Pod wyraźną presją Niemiec uzgodniono w styczniu 2012 roku pakt fiskalny i Europejski Mechanizm Stabilności (ESM). Przez to niemieckie zobowiązania w zakresie poręczeń zostały powiązane z niemieckimi wyobrażeniami o poli-tyce finansowej i budżetowej38. Osadzenie instytucjonalne zasady warunkowo-ści zostało uzupełnione sformułowaniem jednoznacznego stanowiska rządu RFN wobec odpowiedzialności poszczególnych aktorów na rynku finansowym. Minister Finansów Wolfgang Schäuble w oświadczeniu rządowym stwierdził: „Chcę raz jeszcze podkreślić i powtórzyć, (…) w przypadku wystąpienia trud-ności, musi być jasna kolejność odpowiedzialności, tj. właściciele, dostawcy kapitału, deponenci – przy zachowaniu gwarantowanych depozytów, następ-nie państwo, w którym bank ma siedzibę, a na końcu, w razie konieczności, wspólnota państw. To jest kolejność odpowiedzialności i co do tego nic się nie zmieni także przy budowie unii bankowej”39.
Na średniookresowym horyzoncie czasowym (2009-2014) przywódcza rola Niemiec w kwestii przezwyciężania kryzysu strefy euro przyniosła względny sukces. Kulminacja kryzysu minęła. Cele pierwotne zostały osiągnięte. Przy-szłość euro została zapewniona, choć wiele problemów ciągle pozostaje do rozwiązania40. Przywództwo Niemiec częściowo zostało uznane za legitymi-zowane, choć oceny jego realizacji są zróżnicowane.
37 S. Harnisch (2014): Przywództwo…, op.cit., s. 45.38 Tylko Niemcy i Francja dysponują w ESM blokującą mniejszością, pozwalającą zapo-
biec podjęciu decyzji wbrew ich woli.39 Regierungserklärung und Aussprache, BT-PlPr 17/234, ss. 29156 A, 29156 B.40 Por. P. J.J. Welfens (2012): Die Zukunft des Euro, Nicolai-Verlag, Berlin.

Józef Olszyński 54
Znacznie większe problemy i trudności napotyka realizacja przywództwa Niemiec w obszarze kryzysu rosyjsko-ukraińskiego. W tym przypadku dekla-rowane przejmowanie przez nowy rząd koalicyjny CDU/CSU – SPD większej odpowiedzialności międzynarodowej miało bardzo utrudniony początek. Skala kryzysu, aneksja terytorialna i walki zbrojne w najbliższym sąsiedztwie UE i NATO przerosły w pierwszym okresie możliwości „cywilnego mocarstwa”, nastawionego głównie na dialog, deeskalację, negocjacje i kooperację. Ponadto przywództwo Niemiec w tym zakresie realizuje się w specyficznych warun-kach. Niemcy są związane z Rosją siecią interesów gospodarczych i układem o strategicznym partnerstwie. Rządowy partner koalicyjny SPD traktuje sto-sunki z Rosją jako przeciwwagę dla nie najlepszych stosunków z USA. Z dru-giej strony, Niemcy, przywiązane do idei prawa i praworządności, krytycznie postrzegały sytuację na Ukrainie przed wydarzeniami na Majdanie oraz później.
W takiej sytuacji, wobec bardzo zróżnicowanego podejścia krajów człon-kowskich UE do kryzysu na terytorium Ukrainy, podjęcie się przez Niemcy roli przywódczej było niezwykle trudne. Niemcy tę rolę podjęły, i tym samym – przełamały syndrom bierności europejskiej polityki zagranicznej. F.-W. Ste-inmeier we współpracy z polskim ministrem spraw zagranicznych R. Sikor-skim i francuskim ministrem Fabiusem podjął zdecydowaną realizację polityki wschodniej UE. Podróże, rozmowy, negocjacje uruchomiły proces, w ramach którego Niemcy chciały doprowadzić do deeskalacji konfliktu, utrzymując otwarte kanały kontaktowe z Rosją. Poprzez swoją działalność stwarzają ciągle szanse dla rozmów rosyjsko-ukraińskich i liczą na stopniową poprawę sytu-acji, aby móc ograniczyć bariery we współpracy z Rosją. Niektórzy partne-rzy/ sojusznicy Niemiec, w tym Polska, krytykują zbyt ostrożne podchodzenie do konfliktu ukraińskiego, postulując bardziej zdecydowane działania, m.in. powołanie unii energetycznej, uniemożliwiającej szantaż gazowy ze strony Rosji. Polska krytykuje też to, że została wyłączona z wielostronnego dialogu, mającego doprowadzić do uregulowania sytuacji na granicy Rosji i Ukrainy.
W odniesieniu do kryzysu rosyjsko-ukraińskiego aktywne przywództwo Nie-miec jest uzasadnione. Ze względu jednak na obiektywnie trudny przedmiot oddziaływania pojawiają się przeszkody w realizacji przywódczej roli. Ponadto partnerzy (stronnicy) mają problemy z akceptacją sposobu działania lidera.
Zupełnie inne doświadczenia z przywódczej roli Niemiec mają miejsce w sferze przygotowania umowy Unii Europejskiej ze Stanami Zjednoczo-nymi o transatlantyckim partnerstwie w dziedzinie handlu i inwestycji (TTIP). Ogromne znaczenie gospodarcze i polityczne (nowe spoiwo Zachodu) tego projektu czyni przywództwo w trakcie jego koncypowania i negocjowania nie

Polityka europejska Niemiec w latach 2012–2013 55
tylko istotnym, ale i utrudnionym obiektywnymi uwarunkowaniami. Po pierw-sze, Niemcy mogą w tym przypadku przewodzić tylko pośrednio. Bezpośred-nie kompetencje zlokalizowane są w Komisji Europejskiej. Po drugie, Niemcy, jako najważniejszy aktor z największą gospodarką, o własnym specyficznym systemie gospodarczym, traktują TTIP jako ogromną szansę i zagrożenie jedno-cześnie. Aktualnie krytyczne nastawienie Niemców do partnerstwa jest bardzo silne. „W żadnym innym kraju UE opinia publiczna i organizacje pozarządowe nie mają tyle uwag do TTIP, co w Niemczech”41. Zgoda na zawarcie umowy ze strony Niemiec uwarunkowana jest dwiema istotnymi kwestiami: dopuszczal-nością ochrony lokalnego mechanizmu konkurencji (utrzymanie silnej pozycji firm małych i średnich) i możliwością zachowania prawa określania własnych standardów socjalnych, ekologicznych i bezpieczeństwa konsumpcji42.
Ogólnie rzecz ujmując, różnice w podejściu USA i Unii Europejskiej, w tym zwłaszcza Niemiec, mają bardzo zasadniczy charakter. W negocjacjach nastę-puje zderzenie neoliberalnego i nieliberalnego modelu kapitalizmu. Orienta-cja w Niemczech i w dużej części Europy na społeczną gospodarkę rynkową może utrudnić znalezienie kompromisu z sprawie TTIP. Przywództwo Niemiec w UE stoi przed wielkim wyzwaniem, ale nie jest ze strony innych aktorów posądzane o brak legitymizacji.
Podsumowanie
Podstawę dzisiejszych zmian w europejskiej polityce Niemiec stanowi, z jed-nej strony, strategiczna decyzja zjednoczonego państwa niemieckiego o konty-nuowaniu silnego zaangażowania w procesy integracji europejskiej (początek lat 90. XX wieku), a z drugiej – istotny przełom w tym zakresie po przejęciu władzy przez koalicję SPD – Zieloni w 1998 roku z G. Schröderem w roli kanc-lerza. W ramach tego przełomu nowa młodsza elita polityczna RFN, używając nowego języka, rozpoczęła proces odchodzenia od powściągliwości i samoogra-niczenia czasów republiki bońskiej, prezentując otwarcie i realizując na rzecz republiki berlińskiej interesy narodowe na forum Unii Europejskiej.
41 C. Wergin (2014): Deutschland torpediert Verhandlungen mit den USA, „Die Welt Online”, 14 marca, www.welt.d/wiertschaft/article125825314/Deutschland-torpediert-Ver-handlungen-mit-den-USA.html
42 Por. S. Płóciennik (2014): Niemcy wobec Transatlantyckiego Partnerstwa w dziedzinie Handlu i Inwestycji, „Sprawy Międzynarodowe”, nr 2, s. 108–109.

Józef Olszyński 56
Realizacja najnowszych zmian przebiegała w dwóch fazach. W fazie pierw-szej – od początku kryzysu w krajach strefy euro – nastąpiło podjęcie się przez Niemcy roli przywódczej „z konieczności”. Niemcy, ze swoją dużą i znajdującą się w dobrym stanie gospodarką, były jedynym krajem, który rolę przywódczą miał szanse odegrać skutecznie. Inne państwa członkowskie UE rolę tę akcep-towały i usiłowały, w trakcie trwania kryzysu, przywództwo Niemiec „euro-peizować” (kolektywizować). Osiągnięcie podstawowych celów przywództwa Niemiec, tj. utrzymanie strefy euro oraz kontynuowanie polityki stabilności fiskalnej i pieniężnej z ukierunkowaniem na umocnienie konkurencyjności gospodarczej, doprowadziło do wtórnej akceptacji ze strony partnerów przy legitymizacji poprzez skuteczność i właściwy podział efektów.
W fazie drugiej przywództwo Niemiec „z konieczności” zostało zmienione na przywództwo formalnie zadeklarowane. W umowie koalicyjnej nowego rządu Angeli Merkel z grudnia 2013 roku nastąpiło explicite potwierdzenie przeję-cia przez Niemcy ich roli przywódczej w Unii Europejskiej. Potwierdzając to, że „Niemcy zaakceptowały swoją odpowiedzialność i szczególne oczekiwa-nia swoich partnerów”, jako przywódca podjęły też polityczne zobowiązanie do „stworzenia nowego przełomu dla Europy silnej politycznie, gospodarczo i sprawiedliwej społecznie”. Autodeklaracja z umowy koalicyjnej została uzu-pełniona wypowiedziami ważnych niemieckich polityków (prezydenta, ministra spraw zagranicznych, minister obrony) o przejęciu przez Niemcy zwiększonej odpowiedzialności w polityce europejskiej i światowej.
Z rozważań analityczno-teoretycznych oraz po pierwszych doświadcze-niach z przywództwa Niemiec w trakcie kryzysu strefy euro, w odniesieniu do kryzysu rosyjsko-ukraińskiego oraz podczas przygotowania i negocjowa-nia umowy o Transatlantyckim Partnerstwie w dziedzinie Handlu i Inwestycji powstał wstępny obraz przywództwa Niemiec w Unii Europejskiej jako odgry-wającego rolę przewodniczącą bez hegemonii, o charakterze kolektywnym i kooperatywnym. Ewolucja tego modelu przywództwa w przyszłości będzie uzależniona zarówno od czynników wewnątrzniemieckich, jak i od zmian w otoczeniu zewnętrznym. Partnerzy w przywództwie Niemiec powinni sami aktywnie współkształtować rolę przywódcy.
Polska polityka europejska, relatywnie nowy przejaw aktywności państwa, także podlega ewolucyjnym zmianom. Mają one doprowadzić do określenia celów i sposobów działania w tym ważnym dla kraju i gospodarki obszarze. Określenie miejsca Polski w procesie integracji europejskiej wymaga m.in. uwzględnienia przywódczej roli Niemiec oraz zmian w architekturze grupy większych państw Unii Europejskiej (autoizolacja Wielkiej Brytanii, kłopoty

Polityka europejska Niemiec w latach 2012–2013 57
gospodarcze Francji, degradacja ekonomiczna Włoch i Hiszpanii). Obecne sta-nowisko Polski, akceptujące przywództwo Niemiec w UE i wiążące nasze miej-sce w procesie integracji z bliską kooperacją z RFN („partnerstwo dla Europy”), wydaje się racjonalne i uzasadnione. Imperatywem dla polskiej racji stanu jest takie układanie stosunków wzajemnych z liderami w UE, w tym z Niemcami, aby współtworzyć warunki dla dalszej integracji i równocześnie realizować interesy gospodarki i społeczeństwa Polski.
STRESZCZENIE
Aktualne zmiany w polityce europejskiej Niemiec są wyrazem kontynuacji trady-cyjnego aktywnego zaangażowania w procesy integracji kontynentu oraz artykula-cji nowej jakości w prezentowaniu i realizacji własnych interesów na forum Unii Europejskiej. Kontynuując odchodzenie od powściągliwości i samoograniczania, Niemcy zaczęły przejmować rolę przywódczą w UE. Na pierwszym etapie, w sytu-acji kryzysu strefy euro, następowało to „z konieczności”; w drugim – zostało for-malnie zadeklarowane w umowie koalicyjnej rządu CDU/CSU – SPD z 2013 roku. Pierwsze doświadczenia z realizacji niemieckiego przywództwa wskazują na jego kolektywny, kooperatywny charakter bez cech hegemonii.
Słowa kluczowe: Niemcy, polityka europejska, przywództwo, kryzys euro, konflikt rosyjsko-ukraiński, umowa TTIP, polska polityka europejska
SUMMARY
Current changes in the Germany’s European policy are consequences of the traditional active engagement in the integration processes on the continent and manifestation of a new quality in presentation and realization of own interests on the European Union forum. Today Germany is trying do retreat from the course of self-restraint and willing to take a leading role in the EU. In the first stage of this development – in the situation of the crisis in the euro zone, it was necessity, in the second stage – it was formally declared in the CDU/ CSU government coalition contract signed in 2013. First experiences in the realization of the German leadership show its col-lective, cooperative character without any traits of hegemony.
Key words: Germany, European Policy, leadership, Euro crisis, Russian-Ukrainian conflict, TIPP contract, Polish European policy

Józef Olszyński 58
Bibliografia
Abelshauser W. (2012): Niemcy, Europa i świat, „Nowa Europa Przegląd Natoliń-ski”, nr 1.
Beck U. (2013): Kosmopolityczny naród i nowa architektura Europy?, „Krytyka Poli-tyczna”, nr 34 (wydanie specjalne pt. Co dalej z niemiecką Europą?).
Braun S. (2014): Steinmeiers rasanter Neustart, „Süddeutsche Zeitung”, 21 stycznia.Buras P. (2013): Inna niemiecka Europa?, „Krytyka Polityczna”, nr 34 (wydanie spe-
cjalne Co dalej z niemiecką Europą?).Cichocki M.-A. (2012): Zmiana niemieckiego paradygmatu w Europie, „Nowa Europa
Przegląd Natoliński”, nr 1.Cichocki M-A. (2013): Niemcy duszą się na kontynencie, „Krytyka Polityczna”, nr 34
(wydanie specjalne pt. Co dalej z niemiecką Europą?).Clark I. (2011): Hegemony in International Society, New York.Decker F. (2014): Die Europäische Union auf dem Weg zur parlamentarischen Demo-
kratie?, „Aus Politik- und Zeitgeschichte”, nr. 38–39, 15 września.Deutschland in Zahlen (2014): Institut der Deutschen Wirtschaft Köln, Ausgabe, Köln.Deutschlands Rolle in der Welt: Anmerkungen zur Verantwortung, Normen und Bünd-
nissen, http://www.bundespraesident.de/SharedDocs/Reden/DE/Joachim-Gauck-/Reden/2014
Deutschlands Zukunft gestalten, Koalitionsvertrag zwischen CDU, CSU und SPD, 18. Legislaturperiode, http://www.bundesregierung.de/content/DE-Anlagen/2013/ 2013–12-17-Koalitionsvertrag,Pdf
Habermas J. (2013): Demokracja, solidarność i kryzys Europy, „Krytyka Polityczna”, nr 34 (wydanie specjalne pt. Co dalej z niemiecką Europą?).
Hacke Ch. (2012): Niemcy i świat: mocarstwo cywilne bez odwagi cywilnej?, „Nowa Europa Przegląd Natoliński”, nr 1.
Hagelüken A. (2011): Wer, wenn nicht Deutschland?, „Süddeutsche Zeitung”, 5 grudnia.
Harnisch S. (2014): Przywództwo bez hegemonii. Rola Niemiec w czasie kryzysu euro, „Sprawy Międzynarodowe”, nr 2.
Kłys J. (2012): Niemieckie wizje kształtu Unii Europejskiej w okresie rządów Gerharda Schrödera, „Rocznik Integracji Europejskiej”, nr 6.
Kolos na glinianych nogach, http://biznes.pl/wiadomosci/unia-europejska/ (12.10.2014).
Kwiatkowska-Drożdż A. (2012): Mocarstwo pragmatyczne; „Nowa Europa Przegląd Natoliński”, nr 1.
Link W. (2012): Integratives Gleichgewicht und gemeinsame Führung. Das Europäi-sche System und Deutschland, „Merkur”, nr. 762.
Polityka europejska Niemiec w latach 2012–2013 59
Müller-Brandeck-Bocquet G. (2012): Deutschland – Europas einzige Führung-smacht?, „Aus Politik und Zeitgeschichte”, 5 marca, www.bpb.de/apuz/75788/ deutschland-europas-einzige-fuehrungsmacht
Müller-Brandeck-Bocquet G. (2014): Nowa polityka europejska Niemiec, „Sprawy Międzynarodowe”, nr 2.
Olszyński J. (2004): Niemieckie koncepcje integracji Europy/Deutsche Ideen der Europa-Integration, w: Polska – Niemcy a rozszerzenie Unii Europejskiej, t. I, red. W. Małachowski, Oficyna Wydawnicza SGH, Warszawa.
Olszyński J. (2008): Nowe elementy w polityce europejskiej Niemiec, w: Dokąd zmie-rzają Niemcy, red. B. Brocka-Palacz, Oficyna Wydawnicza SGH, Warszawa.
Płóciennik S. (2014): Niemcy wobec Transatlantyckiego Partnerstwa w dziedzinie Han-dlu i Inwestycji, „Sprawy Międzynarodowe”, nr 2.
Przemówienie (2012): Przemówienie kanclerz Angeli Merkel wygłoszone podczas uroczystości inauguracji 61. roku akademickiego w Kolegium Europejskim w Brugii w dniu 2 listopada 2010 r., „Nowa Europa Przegląd Natoliński”, nr 1.
Rak K. (2014): Niemcy przestają być Zachodem, „Rzeczpospolita”, 12 maja, http://prawo.rp.pl/artykul/1109144.html
Rede der Bundesministerin für Verteidigung Dr. Ursula von der Leyen anlässlich der 50. Münchner Sicherheitskonferenz, München, 31. Januar 2014, http://www.bmvg.de/portal/a/bmvg/
Rede von Außenminister Frank-Walter Steinmeier anlässlich der 50. Münchner Sicherheitskonferenz, München, 31. Januar 2014, http://www.auswaertiges-amt.de/DE/Infoservice/Presse/Reden/2014
Regierungserklärung und Aussprache, BT-PlPr 17/234, SS. 29156 A, 29156 B.Regierungserklärung von Bundeskanzlerin Angela Merkel zu den Massnahmen zum
Erhalt der Stabilität der Währungsunion und zum bevorstehenden Sondergipfel der Euroländer am 7. Mai in Brüssel vor dem Deutschen Bundestag am 5. Mai in Berlin – www.bundesregierung.de/Content/ (DE/Bulletin/2010/05/Anlagen/48–1-bk.pdf
Sikorski R., Polska a przyszłość Unii Europejskiej, http://m.wiadomosci.gazeta.pl Trie-pel H. (1938): Die Hegemonie. Ein Buch von führenden Staaten, Stuttgart.
Vaisse J., Denisson S. (2013): European Foreign Policy Score Card, Brussels.Welfens P. J. J. (2012): Die Zukunft des Euro, Nicolai-Verlag, Berlin.Wergin C. (2014): Deutschland torpediert Verhandlungen mit den USA, „Die Welt
Online”, 14 marca, www.welt.d/wiertschaft/article125825314/Deutschland-tor-pediert-Verhandlungen-mit-den-USA.html
Wicekanclerz Niemiec: NATO nie może wymachiwać szabelką na Wschodzie, http://wiadomosti.onet.pl/swiat/vicekanclerz-niemiec-nato-nie-moze-wymachiwac (17.11.2014).
Wróbel A. (2014): Specyfika mocarstwowości ekonomicznej Niemiec, w: Nowe zja-wiska w gospodarce Niemiec i w polsko-niemieckich stosunkach gospodarczych, red. J. Olszyński, A. Bielig, Oficyna Wydawnicza SGH, Warszawa.

Józef OLSZYŃSKI*
ZMIANY W POLITYCE EUROPEJSKIEJ NIEMIEC W LATACH 2014–2015
Wprowadzenie
Zapoczątkowane w okresie wcześniejszym zmiany w europejskiej polityce Niemiec były kontynuowane i poszerzane w latach 2014–2015. W szczególno-ści widoczna była ciągła walka dawnej „bońskiej” skromności i wrażliwości w kwestiach interesu narodowego z uzewnętrznianiem woli i mocy przywódz-twa Niemiec w Unii Europejskiej.
Charakter i sposób sprawowania przez Niemcy roli przywódczej kształto-wał się i ulegał pierwszym korektom w latach 2009–2013. Wtedy to, w warun-kach zaskoczenia kryzysem, nastąpiło podjęcie przez Niemcy przywództwa niejako z konieczności, które po kilku latach zostało z pełną świadomością i odpowiedzialnością politycznie zadeklarowane w porozumieniu koalicyjnym CDU/CSU – SPD.
W latach 2014–2015 europejska polityka Niemiec i pełniona przez nie funk-cja przywódcza podlegały w UE weryfikacji w bardzo niekorzystnie zmienia-jących się warunkach.
Poszukiwanie odpowiedzi na pytanie, jak proces ten przebiegał w wybra-nych obszarach aktywności UE, w Europie i w świecie, jest przedmiotem roz-ważań niniejszego opracowania.
* Instytut Gospodarki Światowej, Szkoła Główna Handlowa w Warszawie, * e-mail: [email protected]
Józef Olszyński 62
1. Realizacja przywództwa Niemiec w Unii Europejskiej w wybranych obszarach
1.1. Polityka wschodnia UE; konflikt rosyjsko-ukraiński
Przejęcie i realizacja roli przywódczej w UE stały się bardzo trudne w obszarze polityki sąsiedztwa, szczególnie w kierunku wschodnim w warun-kach konfliktu rosyjsko-ukraińskiego. Okazało się bowiem, że przygotowana w warunkach względnego spokoju i bezpieczeństwa polityka sąsiedztwa Unii Europejskiej przestała być adekwatna w sytuacji aneksji terytorialnej i walk zbrojnych w najbliższym sąsiedztwie państw członkowskich UE. Według nie-mieckich ocen Unia Europejska w swojej polityce sąsiedztwa nie doceniała w dostatecznym stopniu elementów bezpieczeństwa i układów geopolitycz-nych1. Niemieccy eksperci i politycy sugerowali potrzebę pilnej reformy poli-tyki sąsiedztwa UE.
W sferze koncepcyjnej chodzi o korektę podstawowych założeń tej polityki, które w warunkach polityki wschodniej w sposób niespójny łączyły kwestię charakteru państwowości krajów, partnerstwa wschodniego, ich międzyna-rodowego umiejscowienia i uwikłania oraz perspektywy członkostwa w UE2. W sposób szczególny krytykuje się założenie o wspólnych wartościach oraz sku-teczność polityki warunkowania określonych działań i świadczeń, zwłaszcza wobec krajów, w których zainteresowanie członkostwem w UE i w jej obsza-rze gospodarczym nie jest wystarczająco silne. Ponadto – według niemieckich opinii – programy partnerstwa wschodniego są zbyt obszerne, skompliko-wane, nietransparentne dla społeczeństwa oraz nazbyt ambitne w kwestiach oczekiwań postępów w transformacji. Najbardziej istotną z punktu widze-nia realizacji przywództwa jest opinia Niemiec, że interesy i potrzeby krajów sąsiedzkich oraz rola sąsiadów krajów sąsiedzkich i liderów regionalnych (Rosja, Iran, kraje Zatoki Perskiej) muszą być wystarczająco (odpowiednio) uwzględnione. Kraje sąsiedzkie nie mające perspektywy członkostwa w UE powinny uzyskać odpowiednio pozytywną ofertę współpracy z Unią Europej-
1 K. Göldner, F. Tekin (2015): Aktuelle Herausforderungen fuer die deutsche Euro-papolitik: Vertiefung, Erweiterrung, Nachbarschaft, http://iep-berlin.de/wp-con-tent/uploads/2015/01/Tagungsbericht, 15.09.2015.
2 T. Beichelt (2014): Die Politik der oestlichen Partnerschaft – inkompatibile Grundan-nahmen und antagonistische Herausforderung, „Integration”, nr 4, s. 357–364.
Zmiany w polityce europejskiej Niemiec w latach 2014–2015 63
ską. Potrzebny jest klarowny i realistyczny podział na kraje z grupy „rodziny” i kraje z grupy „przyjaciół”3.
Rozbieżności wśród krajów członkowskich UE w zakresie polityki wschod-niej po wybuchu konfliktu rosyjsko-ukraińskiego i doświadczenia z przebiegu procesu stowarzyszania Ukrainy z Unią Europejską uzupełniły postulaty Nie-miec o polityce sąsiedztwa imperatywem wewnątrzunijnego uzgodnienia wspólnych interesów i celów, które powinny być zorientowane na wolę wspól-notowego inwestowania w przyszłość oraz przeniesienia sfery realizacyjnej polityki sąsiedztwa z poziomu urzędniczego (biurokratycznego) do poziomu politycznego. Podstawową zasadą niemieckiego podejścia pozostaje powiązanie pokojowych elementów polityki sąsiedztwa oraz polityki zagranicznej z bez-pieczeństwem przy równoczesnym różnicowaniu polityki wobec poszczegól-nych krajów oraz silniejszą regionalizacją strategii (włączenie sąsiadów krajów sąsiedzkich UE do wspólnej strategii)4.
W warstwie realizacyjnej przywództwo Niemiec w obszarze polityki sąsiedz-twa wschodniego było i pozostaje bardzo skomplikowane. Lata 2014–2015 przyniosły, z jednej strony, powolny proces poprawy sytuacji bieżącej, związany z konsekwentnym i kolektywnym (głównie z Francją) przywództwem Niemiec, z drugiej zaś – były kontynuacją uwikłań, konfliktów i krytycznych problemów oraz różnych, często sprzecznych, ocen działań polityków niemieckich.
W pierwszym rzędzie należy wskazać na to, że w kontekście aneksji Krymu i wybuchu konfliktu we wschodniej części Ukrainy, wobec największej zmiany strategicznej w sytuacji Europy od czasu rozpadu Związku Radzieckiego, Niemcy objęły wyraźne geopolityczne przywództwo w Europie. Tym samym polityczna moc sprawcza przesunęła się z instytucji unijnych do krajów człon-kowskich z Berlinem na czele. Uwidoczniła się równocześnie zbieżność stano-wisk Niemiec i kanclerz Angeli Merkel oraz Stanów Zjednoczonych i prezydenta Baracka Obamy. Znalazło to wyraz w oświadczeniu A. Merkel (podobnie jak B. Obamy), że działania Rosji ”są nieakceptowalne, a rosyjskiej agresji należy przeciwdziałać”5.
Merkel podjęła się negocjowania z prezydentem Rosji Władimirem Puti-nem, biorąc całą odpowiedzialność za ten proces na siebie.6 Kanclerz Niemiec
3 K. Göldner, F. Tekin (2015): Aktuelle Herausforderungen…, op.cit., s. 5–6.4 Ibidem.5 „Foreign Affairs”: prawdziwa rola Niemiec w konflikcie ukraińskim, http://wiadomosci.
onet.pl/ (12.04.2015).6 Wyłączność odpowiedzialności Merkel związana była ze skupieniem się Obamy
na innych światowych problemach. Równocześnie B. Obama uznał, że A. Merkel jest jedyną
Józef Olszyński 64
stała się przy tym jedynym przywódcą zachodnim, którego chciał słuchać pre-zydent Rosji7.
Od 2014 roku mechanizmem międzynarodowych rozmów o kryzysie ukra-ińskim stał się tzw. format normandzki, tj. spotkania przedstawicieli Francji, Niemiec, Rosji i Ukrainy. Przywództwo Niemiec w tym obszarze zostało wzmoc-nione udziałem Francji. Pomimo wszelkich rozbieżności stanowisk, interesów i sceptycyzmu opinii światowej Niemcom, odgrywającym w procesie funkcjono-wania formatu normandzkiego rolę podstawową, udało się osiągnąć pozytywne efekty typową dla Angeli Merkel metodą małych kroków. W lutym 2015 roku grupa normandzka zatwierdziła tzw. porozumienia mińskie przedstawicieli Rosji, Ukrainy, OBWE i prorosyjskich separatystów o „niezwłocznym i cał-kowitym przerwaniu ognia, wycofaniu ciężkiego uzbrojenia, dostępie obser-watorów OBWE oraz przywróceniu kontroli Ukrainy nad granicą państwową w sferze konfliktu”8. Dwukrotnie: w sierpniu 2015 w Berlinie i w paździer-niku 2015 w Paryżu – potwierdzono wyłączność (Berlin) i skuteczność (Paryż) funkcjonowania mechanizmu działania w ramach formatu normandzkiego.
Pozytywnie podchodząc do osiągania celów własnej polityki przywództwa w obszarze polityki wschodniej, kanclerz A. Merkel zwracała uwagę na to, że porozumienia mińskie stanowią fundament procesu pokojowego na Ukrainie, że należy je „wdrażać, a nie kwestionować”9.
Najnowsze wydarzenie w tym zakresie, tj. spotkanie przywódców formatu normandzkiego (Merkel, Hollande, Poroszenko, Putin) drugiego października 2015 roku w Paryżu, potwierdziło zapewnienie, że „format normandzki się sprawdził i będzie nadal działał na rzecz pokoju w Donbasie”10.
Ogólnie rzecz ujmując, przywództwo Niemiec przy wsparciu Francji przy-nosi w deeskalacji konfliktu na Ukrainie pozytywne efekty. Nie nastąpił wpraw-dzie ciągle oczekiwany przełom w konflikcie, ale na froncie panuje względny
decyzyjną osobą w Europie, a myśl o „jednym numerze do Europy” z czasów A. Kissingera została urzeczywistniona. Według opinii T. Nuttala z „The Economist”: „Obama wie z kim konsultować się w sprawie polityki wobec Rosji – nie jest to bynajmniej ktoś z Brukseli”.Ibidem, s. 3.
7 Za przyczyny tego uznaje się wzajemną znajomość języka partnera oraz strategiczne i przyjacielskie zarazem relacje między Niemcami a Rosją.
8 Format normandzki – mechanizm rozmów w sprawie Donbasu, http://wiadomo-sci/onet/pl. (9.11.2015).
9 Merkel: format normandzki jest wystarczający, http://wiadomosci/onet/pl. (24.08.2015).10 J. Wilczak (2015): Format normandzki się trzyma, „Polityka.pl” http://www.polityka.
pl/tygodnik/polityka/swiat/ (2.10.2015).

Zmiany w polityce europejskiej Niemiec w latach 2014–2015 65
spokój, broń jest wycofywana, a wybory samorządowe mają być przygotowane przez władze w Kijowie11.
Powolny postęp w procesie poprawy relacji rosyjsko-ukraińskich, sterowany zasadniczo przez politykę niemiecką, ma miejsce pomimo wewnątrzniemiec-kich napięć i sprzeczności o charakterze politycznym i ekonomicznym oraz zewnętrznych kłopotów na tle braku możliwości pełnego uwspólnotowienia realizacji obecnej fazy polityki wschodniego sąsiedztwa z udziałem Ukrainy.
Na forum politycznym wewnątrz kraju kanclerz A. Merkel musiała prze-konać do swoich racji partnera koalicyjnego – SPD i skłonić do osobistego zaangażowania według rządowych reguł wicekanclerza i ministra spraw zagranicznych. Wicekanclerz RFN, przewodniczący SPD, jest w rządzie koali-cyjnym ministrem gospodarki. Ministerstwo to w Niemczech zdecydowanie reprezentuje interesy niemieckiego biznesu. Niemieckie lobby biznesowe reprezentuje około 6 tys. firm, zatrudniających w sumie ponad 300 tys. osób. Argumentem za niesankcyjnym ułożeniem relacji z Rosją jest eksponowanie faktu 26-procentowego spadku eksportu z Niemiec na rynek rosyjski na prze-łomie lat 2013–2014. Rząd rosyjski próbuje poprzez ten kanał oddziaływania wywierać presję na łagodzenie realizacji polityki wschodniej UE pod prze-wodnictwem niemieckim. Przykładem na to może być zamknięte spotkanie przedstawicieli niemieckiego biznesu z władzami rosyjskimi, zorganizowane w Moskwie 6 listopada 2014 roku. Organizatorem spotkania był Wschodni Komitet Gospodarczy Niemiec (Ostausschuss der Deutschen Wirtschaft), a uczestnikami ze strony niemieckiej – 15 najważniejszych biznesmenów z firm działających w Rosji (m.in. Daimler, Siemens, Metro, Winterhall). Ze strony rosyjskiej obecni byli m.in. wicepremier rządu i minister spraw zagra-nicznych. Według ogólnikowego komunikatu końcowego doszło do wymiany poglądów na temat stanu i perspektyw współpracy dwustronnej w sferze han-dlu i inwestycji, minister Ławrow zaś przedstawił rosyjską ocenę stosunków z Ukrainą, Niemcami, Unią i NATO12.
Działania kanclerz Merkel doprowadziły w 2014 roku do tego, że SPD poparła w pełni jej linię polityczną, a minister spraw zagranicznych podjął zdecydowane kroki na rzecz wprowadzenia ustaleń UE dotyczących sankcji i zwierzchnictwa formatu normandzkiego nad porozumieniami mińskimi, lobby biznesowe zaś wykazało solidarność z polityką rządu, uznając, że bezpieczeństwo
11 Ibidem.12 Tajne spotkanie Niemców na Kremlu, http://www.ekonomia.rp.pl/artykul/ (7.11.2014).

Józef Olszyński 66
Europy jest ważniejsze od bieżących zysków a w przyszłości przyniesie wszyst-kim odpowiednio wysokie korzyści13.
Najbardziej wyrazistym przykładem utrudnień w realizacji niemieckiego przywództwa w UE w kwestiach polityki wschodniej były rozbieżności stano-wisk z niektórymi krajami Europy Środkowo-Wschodniej, w tym w szczegól-ności – z Polską. Kryzys na Ukrainie ujawnił w tym względzie istotne różnice w jego postrzeganiu, diagnozie i preferencjach co do środków zaradczych.
W Polsce doszło wraz z kryzysem ukraińskim do upowszechnienia się poczu-cia zagrożenia i przekonania o braku stabilności na Wschodzie, połączonego z możliwością zakłóceń dostaw ropy naftowej oraz gazu. W tych warunkach rząd Polski uznał wiodącą rolę Niemiec, przyjmując, że są one najważniejszym aktorem w rozwiązywaniu konfliktu rosyjsko-ukraińskiego oraz jedynym waż-nym partnerem, który przynajmniej wysłuchuje polskiej argumentacji14. Rząd niemiecki i rząd polski podzielały pogląd, że początki realizacji partnerstwa wschodniego i stowarzyszania Ukrainy z UE były niewłaściwe. Zbyt optymi-stycznie oceniano siłę przyciągania UE, a przygotowanie i realizacja procesu stowarzyszania miały charakter technokratyczny, a nie polityczny. Strona nie-miecka konsekwentnie krytycznie podkreśla kwestię niewłaściwej komunika-cji procesu zbliżenia Ukrainy z UE wobec Rosji. Tezą podstawową, rzutującą na bieżącą politykę wschodnią Niemiec, jest teza o konieczności znalezienia odpowiedniego modus vivendi z Rosją wobec europejskiej integracji Ukrainy.
Dalsze kontrowersje polsko-niemieckie w tym obszarze mają swoje źródło w sferze polityki bezpieczeństwa. Polska wnioskuje o pełne zastosowanie arty-kułu 5 z porozumienia o NATO. Niemcy zdecydowanie sprzeciwiają się takiej radykalnej interpretacji i zwiększaniu obecności militarnej NATO na Wscho-dzie. A więc istnieje zagrożenie, że zamiast okresowej europeizacji polskiej polityki bezpieczeństwa i obrony nastąpi dalsza jej atlantyzacja i zbliżenie do strategicznych celów USA. Różne podejścia reprezentują rządy Polski i Nie-miec również w kwestiach budowy unii energetycznej UE, relacji z Gazpro-mem i budowy nowego gazociągu Nord Stream II.
13 „Foreign Affairs”: prawdziwa rola Niemiec…, op.cit.14 P. Buras (2014): Partnerschaft auf dem Pruefstand. Deutschland, Poland und die Zukunft
der europaeischen Ostpolitik, „Internationale Politik”, nr 4, s. 41–47, https://zeitschrift-ip.dgap.org/de/article (28.08.2015).

Zmiany w polityce europejskiej Niemiec w latach 2014–2015 67
1.2. Inne obszary zaangażowania Unii Europejskiej
Najbardziej spektakularną i symboliczną egzemplifikacją problemu prze-wodnictwa Niemiec w Unii Europejskiej stało się rozwiązywanie kryzysu grec-kiego. W tym obszarze, trochę inaczej niż w układzie geopolitycznym, istnieje bezpośredni związek ważącego potencjału gospodarczego Niemiec z wiodącą ich rolą w utrzymaniu i stabilizacji projektu unii walutowo-gospodarczej. W przypadku kryzysu greckiego zaistniały trzy krytyczne elementy: uzewnętrz-nienie presji na zmianę zasad unii walutowo-gospodarczej, kontrowersyjność sposobu prowadzenia negocjacji oraz otwartość ekspozycji, krytyki i stereoty-powego postrzegania w odniesieniu do Niemiec15.
W przypadku uzgodnień pierwszego (2010) i drugiego (2011) pakietu pomocowego dla Grecji wiodąca funkcja Niemiec była pełniona w przewa-żającej części w kontekście wypracowywania wielostronnego uzgadniania mechanizmów ochrony i stabilizacji całej grupy, a więc mocno legitymizowana oraz akceptowana. Jednak determinowanie działań kanclerz Niemiec przez wewnętrzną sytuację polityczną, tj. pogarszanie się nastrojów co do efektów koalicji CDU/CSU-FDP, zwłaszcza w kontekście wyborów do parlamentu Pół-nocnej Nadrenii-Westfalii osłabiało wiarygodność kolektywnego przywódz-twa i wydłużało proces decyzyjny, niepotrzebnie pogłębiając kryzys w Grecji. Wyrazem krytycznej opinii wobec polityki Niemiec były zarówno wymuszona w ostatniej chwili zgoda prezydenta Francji na warunki wsparcia Grecji, jak i brak zgody krajów członkowskich strefy Euro na niemiecki postulat zagro-żenia wykluczeniem ze strefy Euro wszystkich notorycznie łamiących kryteria funkcjonowania grupy16.
W ostatnich latach (2014–2015) z powodu pogłębiania się kryzysu grec-kiego oraz konieczności przygotowania kolejnego, trzeciego, pakietu pomoco-wego, pogorszyły się warunki dla przywództwa Niemiec na forum strefy Euro w kwestii ratowania jej składu i zasad funkcjonowania.
Radykalizacja nastrojów społeczno-politycznych i niespójna, niekiedy para-doksalna polityka rządu greckiego pod przewodnictwem premiera Aleksisa Ciprasa stworzyły dodatkową trudność zarówno w uzyskaniu pozytywnego porozumienia wierzycieli oraz dłużnika, jak i uzgodnienia wsparcia procesu rozwojowego w Grecji.
15 Por. J. Janning (2015): Zeit fuer grosse Gesten, „Internationale Politik”, nr 5, s. 8–16, https://zeitschrift-ip.dgap.org.article/ (28.08.2015).
16 Por. E. Cziomer (2013): Rola Niemiec w kryzysie strefy euro po 2009,Oficyna Wydaw-nicza AFM, Kraków.
Józef Olszyński 68
Ulubiona przez kanclerz Angelę Merkel metoda stopniowego, krok po kroku, osiągania celów poprzez cierpliwe, konstruktywne negocjacje została radykal-nie zakwestionowana przez premiera Grecji, który nie tyle negocjował naj-lepsze warunki dla swego kraju, ile chciał zaatakować fundamenty polityki kanclerz Niemiec17.
Atmosfera poszukiwania rozwiązania greckiego kryzysu oraz wielostron-nych i bilateralnych rozmów stała się gorąca, dodatkowo zatruwana nacjona-listycznymi oskarżeniami i żądaniami18.
Różnice w ocenach eksperckich dotyczących podejścia do kryzysu są bardzo duże. Paul Krugman, laureat Nagrody Nobla w dziedzinie ekonomii, bardzo ostro skrytykował postawę rządu niemieckiego w trakcie negocjacji porozumie-nia z Grecją. Określił on unijną propozycję jako „nieakceptowalną, a wręcz sza-leńczą i zabijającą europejski projekt” oraz jako „groteskowe odejście od tego, co Unia Europejska miała sobą reprezentować”19. Były polski minister finan-sów Grzegorz Kołodko ocenił, że o ile w początkowej fazie kryzysu winni byli żyjący ponad stan i źle rządzący się Grecy, o tyle za ostatnią eksplozję i kumu-lację kryzysu zdecydowanie w większym stopniu odpowiadają wierzyciele Grecji i stojący za ich interesami politycy20. Niemieccy ekonomiści krytycznie wskazywali na fakt, że relacja wartości konsumpcji do dochodu narodowego wynosi w Grecji ciągle ponad 113%, podczas gdy w Niemczech stanowi ona 88% oraz że potencjalne straty Niemiec w warunkach upadłości Grecji i jej ban-ków mogą sięgnąć nawet 90 mld euro21. Jednak Instytut Badania Gospodarki (IWH) z Halle informował o tym, że Niemcy są wielkim beneficjentem kryzysu w Grecji, gdyż od roku 2010 do lata 2015 niemiecki budżet zaoszczędził około 100 mld euro na redukcji odsetek od długu publicznego na podstawie reguły: „złe informacje z Grecji powodowały trwały spadek oprocentowania obliga-cji niemieckich”22. Zgodnie z tymi szacunkami przy zaangażowaniu Niemiec w pomoc Grecji na poziomie 90 mld euro „niemiecki budżet skorzysta finan-sowo na kryzysie nawet, jeśli Grecja nie spłaci ani centa”23.
17 J. Janning (2015): The ultimate test for Merkel's "muddle trough" model http://www.ecfr.eu/article/commentary (10.07.2015).
18 Były to np. pytania niemieckiego dziennikarza o wyprzedaż greckich wysp oraz postu-lat greckiego wicepremiera o wypłaty przez Niemcy na rzecz Grecji odszkodowań wojen-nych. Por. E. Cziomer (2013): Rola Niemiec…, op.cit., s. 10.
19 http://wiadomosci.onet.pl/swiat/paul-krugman (14.07.2015).20 G. W. Kołodko (2015): Afrykanizacja Grecji, „Rzeczpospolita”, 3 lipca, s. A6–A7.21 H. W. Sinn (2015): Die griechische Tragoedie, IfO, Muenchen.22 Raport: Budżet Niemiec skorzystał na kryzysie w Grecji, http://www.pb.pl/ (10.08.2015).23 Ibidem.

Zmiany w polityce europejskiej Niemiec w latach 2014–2015 69
Takie oceny fachowców nie są jednak w stanie zmienić powszechnego kry-tycznego nastawienia niemieckiej opinii publicznej. Ponad połowa Niemców (56%) uznaje porozumienie z Grecją o nowym programie pomocowym za złe i wielu (48%) wolałoby raczej wyjście tego kraju ze strefy Euro24.
Polityka Niemiec, a w szczególności kanclerz Angeli Merkel, z zasady nie jest populistyczna. „Niemcy zachowują cierpliwość, czekając na to, aby Grecja dostrzegła sens reform ekonomicznych”25. Niemieckie przywództwo w tym obszarze, niezależnie od słusznie krytykowanej wcześniej opieszałości, metodą negocjacji doprowadziło do tego, że przywódcy UE zawarli porozu-mienie z greckim rządem. Grecy zaakceptowali przyjęcie pakietu restrykcyj-nych reform gospodarczych.
Ten umiarkowany sukces przywódczej roli Niemiec w strefie Euro wyni-kał zarówno z dobrej pozycji gospodarczej Niemiec, jak i z bardzo mocnego przekonania wszystkich uczestników procesu negocjowania, że chodzi w tym przypadku o coś znacznie ważniejszego niż przyszłość Grecji w grupie krajów Euro, a mianowicie o wskrzeszenie wiary w system gospodarczy, w funkcjonal-ność zasad działania wspólnej waluty i w sens racjonalizacji (reformowania) w Grecji i w innych krajach członkowskich26. Pomocną w jego uzyskaniu była nie tylko cierpliwość, lecz także umiejętność kolektywizacji roli przywódczej, zarówno we współdziałaniu z Komisją Europejską, Międzynarodowym Fun-duszem Walutowym, jak i w bezpośrednim dołączeniu Francji.
W innych obszarach funkcjonowania UE bilans przywództwa niemieckiego nie jest pozytywny.
W kwestii utrzymania Wielkiej Brytanii w Unii Europejskiej lub modyfika-cji zasad jej uczestnictwa Niemcy nie zajmują postawy aktywnej. Dotychczas trwa wyczekiwanie na rozwiązanie brytyjskich problemów wewnętrznych.
W sprawie porozumienia o Transatlantyckim Partnerstwie UE ze Stanami Zjednoczonymi Ameryki (TTIP) nie ma oznak postępu.
W obszarze budowy unii energetycznej w UE jest zastój. Rząd niemiecki nie forsuje postępu w dywersyfikacji zaopatrzenia w surowce energetyczne i uni-fikacji zasad funkcjonowania rynku energii; odwrotnie – dopuszcza i promuje np. budowę nowej nitki gazociągu bałtyckiego Nord Stream II27.
24 Merkel ma problem. Niemcom nie podoba się układ z Grecją, http://www.tvn24.pl/wia-domosci-ze-swiata (19.07.2015).
25 „The Economist”: w cieniu Niemiec, http://wiadomosci.onet.pl (22.08.2015).26 Por. J. Janning (2015): Zeit fuer grosse…, op.cit.27 Niemcy popierają Nord Stream II, http://tvn24bis.pl/surowce,78/wicekanclerz-niemiec-
-poparl-projekt (22.11.2015).

Józef Olszyński 70
Kryzys migracyjny, powodujący lawinowy napływ uchodźców z krajów Bli-skiego Wschodu i Północnej Afryki do krajów UE stworzył niezwykle trudne okoliczności dla realizacji niemieckiego przywództwa. Racjonalność własnych i wspólnotowych działań została od początku ograniczona poprzez skalę, cha-rakter i dynamikę tego zjawiska. Dominowały emocje – poczucie zagrożenia, a nawet przerażenie. Wicekanclerz Niemiec diagnozował, że „Unia Europejska znalazła się w niebezpieczeństwie, a zagrożenie jest większe niż w czasie świa-towego kryzysu finansowego i kryzysu w Grecji”28, a Niemcy nie są w stanie sprostać wyzwaniom i okazać pomoc potrzebującym. W tym kontekście znane stało się jego stwierdzenie: „Niemcy pomagają, ale kto pomoże Niemcom?”29.
W kwestii trwającego kryzysu imigracyjnego realizacja przywództwa Nie-miec w UE ma dwie perspektywy: wewnętrzną, w której dobre wewnątrznie-mieckie rozwiązania miałyby dawać pozytywny efekt demonstracji dla Unii, oraz unijną, w której pod niemieckim przywództwem można wdrożyć rozwią-zania o charakterze systemowym w skali regionalnej. Obie perspektywy nie odniosły dotychczas sukcesu. Raczej można diagnozować porażkę.
W perspektywie wewnątrzniemieckiej mamy do czynienia z deklaracjami i działaniami rządu, które okazały się nieprzemyślane, nieskonsultowane z part-nerami z UE i zaskakujące gwałtownością i głębokością zmian. Nawet osobi-sty styl działania kanclerz A. Merkel uległ załamaniu.
Do września 2015 roku w warunkach „letniej wędrówki ludów” wydawało się, że pełną odpowiedzialność za rozwiązanie kryzysu imigracyjnego wezmą na siebie Niemcy. Kanclerz A. Merkel zapowiedziała bowiem, że uciekinierzy będą przyjmowani bez ograniczeń30. Taka deklaracja była całkowitym zaskocze-niem dla partnerów z UE, zwłaszcza dla tych, borykających się z problemem zapewnienia tranzytu dla uchodźców, a równocześnie jednoznacznie rozumianą zachętą do emigracji dla migrantów. Po około 10 dniach obowiązywania jed-nostronnej deklaracji Niemiec okazało się, że poszczególne kraje związkowe, miasta i państwo jako całość, nie są w stanie sprostać rosnącej fali uchodź-stwa31. 20 września b.r. nastąpił nagły i radykalny zwrot niemieckiej polityki w sprawie uchodźców. W nocy z 20 na 21 września „tymczasowo” przywrócono
28 Ostre słowa niemieckiego polityka. Niemcy pomagają, ale kto pomoże Niemcom?, http://onet.wiadomosci/onet/pl/swiat (19.09.2015).
29 Ibidem.30 Kluczowym hasłem było stwierdzenie: „Wir schaffen es” (damy radę). Por. Jarosław
Kaczyński wygra dzięki Angeli Merkel, http://wiadomosci.onet.pl/kraj/ (20.09.2015).31 W ciągu 2 tygodni tylko do Monachium przybyło ponad 60 tys. uchodźców; wnio-
sek o azyl złożyło 250 tys. osób; prognozy napływu wahały się od 800 tys. do 1,5 mln osób. Ibidem.
Zmiany w polityce europejskiej Niemiec w latach 2014–2015 71
kontrole graniczne na granicy z Austrią i zaplanowano wyrywkowe kontrole w pobliżu granic z Czechami i Polską32. Proces swobodnego napływu migran-tów został zatrzymany. Ma się on odbywać w sposób kontrolowany i uporząd-kowany. To zaś oznacza całkowity zwrot w praktycznej realizacji niemieckiej polityki azylowej. Tak więc, zamiast pozytywnego efektu demonstracji dla part-nerów z UE, pojawiła się irytacja z gwałtownych i radykalnych zmian, Niemcy zaś muszą stawić czoło „najtrudniejszemu pod względem etycznym pytaniu o granice prawa do azylu”33.
W perspektywie unijnej przewodnictwo niemieckie w obszarze kryzysu migracyjnego również znalazło się w trudnej sytuacji. Wobec wysokiej dyna-miki zdarzeń i emocjonalności zachowań w UE, w tym również osiągnięcia granic możliwości we własnym państwie, Niemcy chciały szybko i skutecznie skierować grupy uchodźców do poszczególnych krajów Unii34. Niemieckie postulaty dotyczące liczby uchodźców, przypadającej na poszczególne kraje, i automatyzmu ich późniejszego pozdziału natrafiły na zdecydowany opór krajów członkowskich, w tym w szczególności Polski i innych krajów Europy Środkowo-Wschodniej.
W atmosferze irytacji spowodowanej wielkodusznym „zaproszeniem wszyst-kich uchodźców do Niemiec”, w sytuacji braku zabezpieczeń na granicach zewnętrznych Unii nie zgodzono się na propozycje niemieckie, zwłaszcza doty-czące automatycznego przydziału liczby osób. Liczby, proponowane do relokacji do poszczególnych krajów członkowskich, budziły również duże kontrowersje.
Rząd niemiecki, inaczej niż w wielu innych sprawach, zaczął stosować metodę otwartej presji na członków UE. Nawoływaniu do solidarności towa-rzyszyło grożenie ograniczeniem środków z unijnych funduszy strukturalnych. Takie sugestie pojawiły się w wypowiedziach ministra spraw wewnętrznych i ministra gospodarki Niemiec, jak również przewodniczącego Komisji UE J. C. Junckera35.
Wzmacniająca się presja ze strony niemieckiej we wrześniu i paździer-niku 2015 roku, zwłaszcza na państwa Europy Wschodniej, miała u podłoża m.in. obawy kanclerz A. Merkel o swój własny polityczny los. Po raz pierwszy
32 Zwrot w niemieckiej polityce w sprawie uchodźców, http://wiadomosci.onet.pl/swiat/ (19.09.2015).
33 Ibidem.34 Niemiecka prasa: „Kontrole graniczne to sygnał alarmowy dla Europy”, http://www.
dw.com/pl/ (19.09.2015).35 Por. Niemcy: szef MSW za obcięciem funduszy dla państw niechętnych uchodźcom,
http://wiadomosci.onet.pl/swiat/ (20.09.2015); Ostre słowa…, op.cit.
Józef Olszyński 72
od wielu lat spotkała się z ostrą krytyką we własnym kraju i we własnej par-tii, a opanowanie narastającego kryzysu stało się dla niej testem rzetelności i skuteczności.
Osiągnięty w październiku br. kompromis, w ramach którego przyjęto ilo-ściową strukturę dyslokacji 120 tys. obecnych w UE uchodźców do poszcze-gólnych krajów członkowskich, a odrzucono automatyczmy pozdział kwot na przyszłość. Ponadto ograniczenie napływu imigrantów do Europy oraz upływ czasu doprowadziły do zmiany sposobu niemieckiego przywództwa w obszarze kryzysu imigracyjnego. Rząd niemiecki postanowił zaniechać otwartej presji, a powrócił do cierpliwego, nastawionego na dłuższy horyzont czasowy procesu negocjacji. Kanclerz A. Merkel zwerbalizowała to stwierdzeniem, że „wspólne stanowisko w sprawie pomocy dla uchodźców należy wypracować na drodze negocjacji, a nie przymusu”36.
Negocjacje zarówno na szczeblach techniczno-urzędniczych, jak i naj-wyższych politycznych (ostatni szczyt przywódców na Malcie – 12 listopada 2015 roku) ciągle trwają. Istnieje duża szansa na to, że rozwiązanie kryzysu migracyjnego w UE niedługo nastąpi.
2. Oceny polityki europejskiej Niemiec i uwagi końcowe
Polityka europejska Niemiec, w tym sposób realizacji przywództwa w Unii Europejskiej, podlega stałej recenzji i ocenom zarówno wewnątrz kraju, jak i w otoczeniu zewnętrznym, w krajach członkowskich Unii.
Na płaszczyźnie wewnątrzniemieckiej panuje zaskakująco daleko posu-nięta jednomyślność co do pozytywnej oceny polityki europejskiej Niemiec. Obserwatorzy podkreślają, że kierunek działań A. Merkel w kwestiach euro-pejskich, w tym zwłaszcza w sprawie utrzymania strefy Euro, jest w dużym stopniu bezkrytycznie akceptowany, popierany przez polityków, media oraz społeczeństwo37. To ogólne prawdziwe stwierdzenie nie oznacza braku dysku-sji i głosów krytycznych. Występują one zarówno na płaszczyźnie generalnej, odnoszącej się do polityki europejskiej Niemiec w całości, jak i w odniesieniu do konkretnych kwestii.
36 Ostre słowa…, op.cit.37 Th. Kirchner (2015): Einzelkaempfer gegen den Kurs der Kanzlerin, http://www.sued-
deutsche.de/politik/ (14.06.2015).
Zmiany w polityce europejskiej Niemiec w latach 2014–2015 73
Na płaszczyźnie generalnej istnieją opinie, np. wśród polityków partii Alter-natywa dla Niemiec (AfD), o tym, że Niemcy nie powinny ratować strefy Euro, lecz doprowadzić do jej likwidacji oraz powrotu walut narodowych. Niektórzy eksperci, jak np. F. Scharpf – były dyrektor Instytutu Maxa Plancka w Kolo-nii, który w latach 80. przeprowadził bardzo trafne analizy – ostrzegają przed „niemieckim imperializmem gospodarczym” wynikającym z braku równowagi między bardziej konkurencyjną gospodarką Niemiec a krajami z Południa Unii. Równocześnie podkreśla się, że polityka kanclerz Merkel wzmacniająca domi-nację interesów Niemców działających według hasła „my robimy wszystko poprawnie, inni – popełnili błędy i muszą się zmienić” musi ulec urealnieniu. Postulat dotyczy zwiększenia transferów z Niemiec i z Północy Unii do krajów Południa oraz równoczesnej silnej wewnętrznej dewaluacji, wspierającej kon-kurencyjność słabszych gospodarek38.
Ze strony radykalnej zwolenniczki budowy unitarnej w pełni zintegrowanej Unii Europejskiej Ulrike Guerot, szefowej Europejskiego Laboratorium Demo-kracji (EDL), pojawiła się krytyka europejskiej polityki Niemiec ze względu na jej „zbyt małą europejskość”. Zdaniem Guerot, gdyby Europa była w pełni zintegrowana, rozwiązałaby wszelkie kryzysowe problemy. Według tej opi-nii kanclerz Merkel werbalnie chce więcej Europy, ale jej polityka europejska prowadzi do renacjonalizacji decyzji i procesów oraz dezintegracji. Ponadto, według Guerot, tak naprawdę dewizą rządu niemieckiego jest „niemiecka Europa albo żadna”39.
Krańcowo odmiennym zarzutem wobec niemieckiej polityki europejskiej jest zarzut o jej pasywność i niechęć do podjęcia odpowiedzialności i roli przywód-czej. Analityk i naukowiec Ulrich Speck w publikacji w „Sueddeutsche Zeitung” krytykuje samozadowolenie niemieckich elit politycznych, brak odpowied-nich koncepcji strategicznych dla zmian w kraju, w Europie i w świecie. Jeśli kryzys w strefie Euro i kryzys migracyjny nie zostaną rozwiązane, a Niemcy nie podejmą aktywnego przywództwa i nie pozbędą się partykularnego skon-centrowania wyłącznie na własnych interesach, cała architektura powojenna w Europie i jej pokój będą zagrożone40.
W ostatnim czasie liczba krytycznych opinii na temat europejskiej poli-tyki Niemiec zwiększyła się z powodu kryzysu imigracyjnego. Krytykuje się pierwotną spontaniczność i brak zdolności przewidywania przy promowaniu
38 Ibidem.39 Ibidem.40 Ibidem.

Józef Olszyński 74
otwartych drzwi dla uchodźców, nagłe zmiany oraz brak wyrazistości i jedno-znaczności ze strony rządu41.
W opiniach spoza Niemiec wspólnym elementem jest to, że wszystkie kraje członkowskie UE de facto uznają przywódczą rolę RFN, a jej „image jest lepszy niż można by potocznie sądzić”42. Poza tym postrzeganie roli Niemiec i spo-sobu realizacji ich przywództwa jest w UE mocno zróżnicowane.
Grupa krajów Europy Północnej i Wschodniej ocenia niemiecką politykę antykryzysową raczej pozytywnie. Te kraje są z Niemcami mocno powiązane gospodarczo, posiadają wspólne standardy kulturowe oraz historyczne zobowią-zania, np. z czasów wstępowania do UE. Kraje Europy Południowej postrzegają europejską politykę Niemiec wyraźnie krytycznie, traktując często Niemcy jako symbol zła i uznając je za niesolidarne i odpowiedzialne za „grecką tragedię”43.
Poszczególne kraje postrzegają rolę Niemiec głównie przez pryzmat wła-snej historii, doświadczeń i aktualnej sytuacji gospodarczej. Francuzi potwier-dzają wagę tandemu niemiecko-francuskiego dla Europy, ale dostrzegają w nim zaburzenie równowagi. Według nich Niemcy zajmują coraz bardziej dominu-jącą pozycję w stosunku do osłabionej przez negatywne skutki kryzysu Francji. Brytyjczycy pozytywnie postrzegają rolę Niemiec, ale krytykują politykę „auste-rity”. Czechy i inne kraje Europy Środkowo-Wschodniej akceptują politykę oszczędności i sposób jej prowadzenia przez rząd niemiecki. Włosi negatyw-nie patrzą na dominującą rolę Niemiec w kształtowaniu europejskiej polityki gospodarczej i chcą niezależności oraz koalicji na rzecz sprzeciwu wobec poli-tyki oszczędności reprezentowanej przez rząd niemiecki44.
Bardziej skonkretyzowane opinie zostały wyrażone w ankiecie różnych euro-pejskich gazet („The Guardian”, „El Pais”, „La Stampa”, „Le Monde”), w któ-rej wzięło udział ponad 7 tys. czytelników. Na podstawie ankiet można ogólnie potwierdzić wyżej sformułowaną tezę, że „im dalej na Południe Europy, tym opinie na temat polityki Niemiec są bardziej krytyczne”. Szczególnie krytyczne były opinie ze strony Greków, Hiszpanów i Portugalczyków. Włosi po części krytykowali politykę Niemiec, ale demonstrowali również podejście pozytywne. Czytelnicy z krajów Północy wyrażali na ogół opinie pozytywne45.
41 Por. Niemiecka prasa…, op.cit.42 A. Moeller, R. Parkes (2015): Die neue deutsche Frage. Deutschlands Europapolitik aus
der Sicht anderer EU-Laender, https://dgap.org/de/article/ (28.08.2015).43 Ibidem.44 Por. M. Majkowska (2015): Niemiecka polityka europejska w ocenie brytyjczyków, cze-
chów, francuzów i włochów, Instytut Spraw Publicznych, Warszawa.45 M. Rice-Oxley (2015), Arrogant, dominant, autoritaer – Online-Umfrage zu Deutsch-
lands Rolle in Europa, http://www.sueddeutsche.de/politik/ (14.06.2015).
Zmiany w polityce europejskiej Niemiec w latach 2014–2015 75
Polska opinia w sprawie niemieckiej polityki europejskiej ma specyficzne znaczenie. Polska jest szóstym ze względu na wielkość powierzchni krajem UE, mającym dobre wyniki gospodarcze, mocną chęć odgrywania istotnej roli w sprawach unijnych, bardzo dobre polsko-niemieckie relacje polityczne i roz-budowane stosunki gospodarcze z biznesem niemieckim. Stanowisko polskie w sprawie europejskiej polityki Niemiec uległo zmianie – od dawniejszych obaw o niemiecką dominację do aktualnego wspierania roli przywódczej Niemiec w Unii Europejskiej. Wsparcie jednak Polacy warunkują postulatem wspólnego, kolektywnego podejmowania decyzji w sprawach UE46. W badaniach opinii publicznej w Polsce widać pozytywną ocenę (69%) tego, że Niemcy przyczy-niają się do poprawy współpracy w Europie. 54% Polaków uważa, że Niemcy realizują własne interesy w Europie z szacunkiem do interesów innych kra-jów; 65% Polaków są zdania, że Niemcy wspierają pogłębienie integracji UE47. Przedstawiciele nowego rządu polskiego, utworzonego przez partię Prawo i Sprawiedliwość, zwracają uwagę na chęć bliskiej współpracy z rządem Nie-miec na forum UE i oferują współodpowiedzialność Polski48.
W międzynarodowej dyskusji o roli Niemiec w świecie, a zwłaszcza w Euro-pie, częściej powtarzana jest teza o „konieczności wzmocnienia niemieckiego przywództwa w Europie”49. Równocześnie zgłaszany jest postulat (warunek), że nie powinno to być motywowane dążeniem do hegemonii, lecz potrzebą dostosowywania się do zmian w systemie globalnym. Obecnie doszło już do zrozumienia, że Niemcy posiadają i realizują swoje własne interesy narodowe, które nie zawsze, jak w deklaracjach do lat 90., muszą być identyczne z inte-resami Unii Europejskiej50.
Niewątpliwa wspólnota niemieckich i unijnych interesów ma swoje źró-dło w potrzebie zmniejszenia wrażliwości na negatywne szoki zewnętrzne, które są związane z wysokim stopniem umiędzynarodowienia tak gospodarki
46 Por. A. Łada (2012): Wenn Sie uns in die Entscheidungsfindung einbeziehen, wird Polen Sie unterstuetzen. Deutsche Europapolitik aus der Sicht Polens, DGAP-analyse kompakt, nr 10, Berlin.
47 Ibidem, s. 5.48 „Obecnie Berlin – chcąc nie chcąc – zostaje sam, zbiera coraz więcej instrumentów
i zaczyna ich używać. A również dla Berlina byłoby bardziej wygodne, gdyby Niemcy mieli poczucie, że za projekt unijny odpowiedzialność ponosi więcej państw” – Konrad Szymański, nowy minister ds. europejskich w wywiadzie udzielonym dla portalu wPolityce.pl 10 listo-pada 2015 roku.
49 A. Bendiek (2014): Abschied von der Juniorpartnerschaft. Fuer mehr deutsche Fueh-rung in und durch Europa, „Internationale Politik”, nr 5, s. 60–66, https://zeitschrift-ip.dgap.org/de/article/ (14.06.2015).
50 Ibidem, s. 2.
Józef Olszyński 76
Niemiec, jak i UE (zaopatrzenie w surowce energetyczne i podostawy dla roz-kooperowanego przemysłu). Ze skupienia się niemieckiej polityki europejskiej na sprawach ekonomicznych wywodzi się także jej międzynarodowa krytyka. Wymienia się w niej koncentrację Niemiec na własnych interesach narodowych oraz krótkowzroczność i brak woli kształtowania długofalowych strategii dla Europy51. Stwierdza się również, że bez RFN integracja europejska jest nie-możliwa, a dynamika i charakter tej integracji zależą od tego, na ile Niemcy ukształtują swoje przywództwo w tandemie z Francją, w ramach Trójkąta Weimarskiego lub w ad hoc tworzonych grupach pionierskich.
W tym kontekście zwraca się uwagę na paradoks niemieckiej pozycji w Euro-pie: „Niemcy są mocni i słabi jednocześnie”52. Najczęstszą interpretacją tego stwierdzenia jest objaśnienie, że Niemcy są zbyt słabi, aby Europę zdominować, a zbyt mocni, aby być jednym z równorzędnych członków Unii Europejskiej53.
W radykalnym podejściu do oceny miejsca RFN w Europie pojawiają się porównania do izolacji Niemiec w Europie sprzed 100 lat i tzw. nowego wil-helminizmu54. Podkreśla się przy tym, że chodzi, jak wcześniej w historii, o samoizolację i powodowaną przekonaniem o własnej nieomylności rezygna-cję z europeizacji polityki55. W rzeczywistości, niezależnie od tzw. naturalnej samotności lidera, sukces Niemiec w dłuższej perspektywie zależy jednoznacznie od sukcesu integracji europejskiej. Wynika to z przesłanek ekonomiczno-finan-sowych, położenia geopolitycznego oraz nastawienia społeczeństwa. Potwier-dzają to doświadczenia historyczne. „Dla Niemiec pogłębiona integracja nie jest jedną z wielu możliwości, lecz alternatywą dla fiaska”56. W przekonaniu ekspertów, to właśnie dlatego Niemcy muszą częściej i bardziej zdecydowa-nie przewodzić. Drogą do przodu, czyli jedyną dopuszczalną drogą w obecnej kryzysowej sytuacji, jest pogłębienie procesu integracji, zachowanie opcji roz-szerzenia Unii Europejskiej oraz jej demokratyzacja57.
51 Najczęściej formułowaną opinią jest teza, że „krótkoterminowe interesy niemiec-kich przedsiębiorstw dominują ciągle nad długofalowymi wspólnymi interesami Europy”. Por. A. Bendiek (2011): Abschied…, op.cit., s. 2.
52 Por. H. Kundani (2014): The Paradox of German Power, Hurst, London.53 Por. M. Huether (2014): Die junge Nation. Deutschlands neue Rolle in Europa, Mur-
mann, Hamburg.54 H. Muenkler (2015): Macht der Mitte. Die neuen Aufgaben Deutschlands in Europa,
Koerber Stiftung, Hamburg.55 B. Ziesemer (2014): Auftrumpfend und abkanzelnd. Deutschland sollte dringend ueber
seinen aussenpolitischen Stil nachdenken, „Internationale Politik”, nr 2, s. 53–59.56 Mehr Integration, mehr Demokratie. Deutschlands Europapolitik hat zwei Modelle zur
Auswahl, „Internationale Politik”, nr 1, styczeń/luty 2014, s. 40–47.57 Ibidem, s. 1.
Zmiany w polityce europejskiej Niemiec w latach 2014–2015 77
Samokrytyczni niemieccy politycy i eksperci przyznają, że w realizacji nie-mieckiego przywództwa w Unii Europejskiej powinno znaleźć się więcej miej-sca na empatię i jej skutki w postaci wspaniałomyślności i wielkoduszności58. Oznacza to unikanie roli nauczyciela i pedantycznego sędziego, który żąda zachowania reguł i bezlitośnie karze przewinienia, a przyjęcie postawy koope-ratywnej, równości partnerów i tworzenia emocjonalnej bazy dla atmosfery zaufania. Mocną kartą na drodze do tak traktowanego przywództwa Niemiec jest sprawowanie funkcji kanclerza przez A. Merkel, która całą swoją biogra-fią i stylem polityki potwierdza chęć do kolektywnego, skutecznego i przyja-znego przewodnictwa59.
Polska polityka europejska uwzględnia przywódczą rolę Niemiec w Unii Europejskiej i próbuje budować z RFN „partnerstwo dla Europy”. Budowa-niu takiego partnerstwa sprzyjają zmiany w architekturze grupy większych krajów UE, poprawiająca się pozycja gospodarcza Polski, dobra jakość pol-sko-niemieckich relacji, zwłaszcza gospodarczych, oraz okazywana wola poli-tyków niemieckich do poszerzania bazy przewodzenia. Przeszkodę stanowią różnice zdań, stanowisk i interesów w poszczególnych sprawach geopolitycz-nych. Dotyczy to zwłaszcza interpretacji polityki bezpieczeństwa i instrumen-tacji działań przeciw zagrożeniom, polityki wschodniego sąsiedztwa i metod rozwiązywania konfliktu rosyjsko-ukraińskiego, relacji strefy Euro do UE jako całości, budowania unii energetycznej oraz niektórych aspektów polityki imi-gracyjnej i azylowej.
Imperatywem dla polskiej polityki europejskiej pozostaje w tych warun-kach takie kształtowanie polsko-niemieckich stosunków bilateralnych, aby ich zakres i jakość pozwoliły na zbudowanie prawdziwego partnerstwa na forum UE – niezależnie od naturalnych utrudnień i bieżących kłopotów.
STRESZCZENIE
W obszarze wschodniej polityki sąsiedztwa konsekwentna i wyważona polityka Nie-miec (z Francją) prowadzi do stopniowej poprawy sytuacji na Ukrainie. Sterowanie kryzysem w strefie Euro i „tragedią grecką” zapewnia powolną stabilizację. Bra-kuje zadawalających rozwiązań w procesie budowy unii energetycznej, postępów
58 H. W. Maull (2015): Uebermaechtig und verwundbar. Deutschlands Rolle in Europa: Drei Neuvermessungen, „Internationale Politik”, nr 5, s. 132–136.
59 Por. A. Stempin (2014): Angela Merkel. Cesarzowa Europy, Agora SA, Warszawa.

Józef Olszyński 78
w porozumieniu TTIP i opanowaniu kryzysu imigracyjnego. Według większości ocen w przewodnictwie Niemiec pragnienie kolektywności i współdziałania przeważa nad zagrożeniami dominacją i hegemonią.
Słowa kluczowe: Integracja europejska, niemiecka polityka europejska, przywództwo Niemiec w UE, kryzys rosyjsko-ukraiński, kryzys grecki, polska polityka europejska
SUMMARY
In the eastern neighbood policy, the consistent and balanced policy of Germany [with France] leads to a gradual improvement of the situation in Ukraine. The crisis management in the Euro zone and “Greek tragedy” provides a slow stabilization. However there is no satisfactory solutions in the process of energy union creation, progress in the area of TTIP agreement as well as mastering the immigration crisis. According to most assessments, the German leadership in the EU is mostly character-ized by cooperation and collective problem solving than domination and hegemony.
Key-words: European integration, German European policy, the German leader-ship in the EU, Russian-Ukrainian crisis, the Greek crisis, Poland’s European policy
Bibliografia
Beichelt T. (2014): Die Politik der östlichen Partnerschaft – inkompatibile Grundan-nahmen und antagonistische Herausforderung, „Integration”, nr4.
Bendiek A. (2011): Abschied von der Juniorpartnerschaft. Für mehr deutsche Führung in und durch Europa, „Internationale Politik”, nr 5.
Buras P. (2014): Partnerschaft auf dem Prüfstand. Deutschland, Polen und die Zukunft der europäischen Ostpolitik, „Internationale Politik”, nr 4,.
Cziomer E. (2013): Rola Niemiec w kryzysie strefy euro po 2009, Oficyna Wydawni-cza AFM, Kraków.
„The Economist”: w cieniu Niemiec, http://wiadomosci.onet.pl (22.08.2015).„Foreign Affairs”: prawdziwa rola Niemiec w konflikcie ukraińskim, http://wiadomo-
sci.onet.pl/ (12.04.2015).Format normandzki – mechanizm rozmów w sprawie Donbasu, http://wiadomo-
sci/onet/pl. (9.11.2015).Göldner K., Tekin F. (2015): Aktuelle Herausforderungen für die deutsche Europapoli-
tik: Vertiefung, Erweiterung, Nachbarschaft, http://iep-berlin.de/wp-content/uplo-ads/2015/01/Tagungsbericht (15.09.2015).
Zmiany w polityce europejskiej Niemiec w latach 2014–2015 79
http://wiadomosci.onet.pl/swiat/paul-krugman (14.07.2015).Hüther M. (2014): Die junge Nation. Deutschlands neue Rolle in Europa, Murmann,
Hamburg.Janning J. (2015): The ultimate test for Merkel's “muddle trough” model, http://www.
ecfr.eu/article/commentary (10.07.2015).Janning J. (2015): Zeit für große Gesten, „Internationale Politik”, nr 5.Jarosław Kaczyński wygra dzięki Angeli Merkel, http://wiadomosci.onet.pl/kraj/
(20.09.2015).Kirchner Th. (2015): Einzelkämpfer gegen den Kurs der Kanzlerin, http://www.sued-
deutsche.de/politik/ (14.06.2015).Kołodko G. W. (2015): Afrykanizacja Grecji, „Rzeczpospolita”, 3 lipca.Kundani H. (2014): The Paradox of German Power, Hurst, London.Łada A. (2012): Wenn Sie uns in die Entscheidungsfindung einbeziehen, wird Polen Sie
unterstützen. Deutsche Europapolitik aus der Sicht Polens, DGAP-Analyse kom-pakt, nr 10, Berlin.
Majkowska M. (2015): Niemiecka polityka europejska w ocenie Brytyjczyków, Czechów, Francuzów i Włochów, Instytut Spraw Publicznych, Warszawa.
Maull H. W. (2015): Übermächtig und verwundbar. Deutschlands Rolle in Europa: Drei Neuvermessungen, „Internationale Politik”, nr 5.
Mehr Integration, mehr Demokratie. Deutschlands Europapolitik hat zwei Modelle zur Auswahl, „Internationale Politik”, nr 1, styczeń/luty 2014.
Merkel: format normandzki jest wystarczający, http://wiadomosci/onet/pl. (24.08.2015).Merkel ma problem. Niemcom nie podoba się układ z Grecją, http://www.tvn24.pl/wia-
domosci-ze-swiata (19.07.2015).Möller A., Parkes R. (2015): Die neue deutsche Frage. Deutschlands Europapolitik aus
der Sicht anderer EU-Länder, https://dgap.org/de/article/ (28.08.2015).Münkler H. (2015): Macht der Mitte. Die neuen Aufgaben Deutschlands in Europa,
Koerber Stiftung, Hamburg.Niemcy popierają Nord Stream II, http://tvn24bis.pl/surowce,78/wicekanclerz-nie-
miec-poparl-projekt (22.11.2015).Niemcy: szef MSW za obcięciem funduszy dla państw niechętnych uchodźcom, http://
wiadomosci.onet.pl/swiat/ (20.09.2015).Niemiecka prasa: „Kontrole graniczne to sygnał alarmowy dla Europy”, http://www.
dw.com/pl/ (19.09.2015).Ostre słowa niemieckiego polityka. Niemcy pomagają, ale kto pomoże Niemcom?, http://
onet.wiadomosci/onet/pl/swiat (19.09.2015).Raport: Budżet Niemiec skorzystał na kryzysie w Grecji, http://www.pb.pl/ (10.08.2015).Rice-Oxley M. (2015): Arrogant, dominant, autoritär – Online-Umfrage zu Deutsch-
lands Rolle in Europa, http://www.sueddeutsche.de/politik/ (14.06.2015).Sinn H. W. (2015): Die griechische Tragödie, ifo, München.Stempin A. (2014): Angela Merkel. Cesarzowa Europy, Agora SA, Warszawa.

Józef Olszyński 80
Tajne spotkanie Niemców na Kremlu, http://www.ekonomia.rp.pl/artykul/ (7.11.2014).Wilczak J. (2015): Format normandzki się trzyma, „Polityka.pl” http://www.polityka.
pl/tygodnik/polityka/swiat/ (2.10.2015).Ziesemer B. (2014): Auftrumpfend und abkanzelnd. Deutschland sollte dringend über
seinen außenpolitischen Stil nachdenken, „Internationale Politik”, nr 2.Zwrot w niemieckiej polityce w sprawie uchodźców, http://wiadomosci.onet.pl/swiat/
(19.09.2015).
Thomas APOLTE*
STABILITÄTSPOLITIK UND GELDPOLITIK IN EUROPA VOR DEM HINTERGRUND DER
GRIECHENLAND-KRISE
1. Einleitung: Griechenland-Krise und kein Ende
Die Schlagzeilen der ersten Hälfte des Jahres 2015 waren dominiert von der Krise in Griechenland, welche im Anschluss an die Wahl des Ministerprä-sidenten Tsipras und seines Finanzministers Varoufakis erneut ausgebrochen war. Im Zuge der Subprime-Krise fiel das Wachstum Griechenlands ab 2008 so stark, dass der Schuldenstand in Prozent des Bruttoinlandsprodukts gera-dezu explodierte. Seit dem Beitritt Griechenlands in die Eurozone wies das Land praktisch ausschließlich Defizitquoten von mehr als die gerade noch zuläs-sigen drei Prozent des Bruttoinlandsprodukts auf. Da der damit verbundene Zuwachs der griechischen Schulden aber bis 2007 mit hohen Wachstumsraten des BIP verbunden war, verharrte die Schuldenquote bei knapp 100 Prozent und damit auf einem zwar hohen, aber stabilen Niveau. Das änderte sich abrupt mit der Subprime-Krise. Sie legte offen, dass Griechenland längst über seine Verhältnisse lebte, weil das BIP künstlich aufgebläht war und nicht mehr die tatsächlichen Gegebenheiten widerspiegelte. Bereits vor der Subprime-Krise hatte sich das Konsumniveau kontinuierlich der Marke von 100 Prozent des Nettoinlandsprodukts genähert und damit angezeigt, dass Griechenland längst dabei war, seine inländische Verwendung überzustrapazieren. Mit der Krise schnellte das Konsumniveau rasch bis auf fast 115 Prozent des Nettoinland-sprodukts,1 so dass eine strukturelle Verschuldungsproblematik offenbar wurde.
* Universität Münster, * e-mail: [email protected] Sinn (2015).
Thomas Apolte 82
In der Reaktion wurden zwei fiskalische „Rettungspakete” auf den Weg gebracht, welche Griechenland harten fiskalischen Anpassungsprogrammen unterwarfen. Hinzu kam, dass sich die Europäische Zentralbank stark durch den Kauf von griechischen ebenso wie anderen staatlichen Wertpapieren enga-gierte. Inzwischen ist der weit überwiegende Teil der griechischen Staatsschuld in öffentlicher Hand, womit sich die europäische Wirtschafts- und Finanzpolitik in eine Zwangslage gebracht hat: Einerseits musste man spätestens im Frühjahr 2015 erkennen, dass die griechische Staatsschuld nicht mehr tragfähig und damit ein Schuldenschnitt grundsätzlich nicht mehr zu umgehen war.2 Daher forderte der Internationale Währungsfonds im Sommer 2015 denn auch eine Schuldenerleichterung als Voraussetzung für ein fortgesetztes Engagement des Fonds. Andererseits aber verbietet es der Art. 125 des Vertrages über die Arbeitsweise der Europäischen Union (AEUV), die so genannte No-bail-out-Klausel, dass sich Staaten der EU gegenseitigen fiskalischen Beistand leisten. Da diese Klausel nur für öffentliche Schuldner gilt, wäre ein Schuldenerlass seitens privater Schuldner durchaus möglich gewesen. Ein öffentlicher Schul-denerlass hingegen wird vom IWF einerseits gefordert, durch den AEUV ande-rerseits aber verboten.
Nachdem die Tsipras-Regierung den Zahlungstermin vom 13. Juli 2015 hatte verstreichen lassen, sah alles nach einem Zahlungsausfall mit der wahr-scheinlichen Konsequenz eines Austritts Griechenlands aus der Europäischen Währungsunion (EWU) aus. Das anschließende Referendum in Griechenland unterstützte diesen Eindruck, doch vollzog Tsipras unmittelbar nach dem Refe-rendum eine überraschend radikale Kehrtwende und ignorierte damit das Votum des von ihm selbst initiierten Referendums. Er entließ Finanzminister Varoufakis und ebnete damit den Weg zu einer weiteren vorläufigen Einigung mit den drei beteiligten Institutionen, die einst die Troika bildeten. Seither werden die Schlagzeilen von einem ganz anderen Thema dominiert, doch die Probleme Griechenlands sind damit keineswegs gelöst.
Im Rückblick muss festgehalten werden, dass es zweifellos ein Fehler war, Griechenland im Jahre 2001 trotz offenkundiger Verletzung der Maastricht-Kri-terien in die Währungsunion aufzunehmen. Dabei gereicht dieser Fehler vor allem Griechenland selbst zum Nachteil, weil es heute sein bei weitem zu hohes Konsumniveau durch eine Reduktion der nominalen Einkommen und Löhne anpassen muss, statt mit Hilfe des Wechselkursmechanismus eine allein reale Einkommensanpassung erreichen zu können. Weiterhin besteht aus heutiger
2 Scheuering (2015).
Stabilitätspolitik und Geldpolitik in Europa vor dem Hintergrund der Griechenland-Krise 83
Sicht kein Zweifel mehr daran, dass Griechenland zahlungsunfähig ist und dass die fortgesetzten Rettungsaktionen – gemessen an privatwirtschaftlichen Kriterien – eher einer Konkursverschleppung als einer Lösung des Problems gleichkommen.3 In diesem Zusammenhang ist es schließlich auch nicht mehr von der Hand zu weisen, dass die ehemalige Troika die zunächst vorwiegend private Schuld des griechischen Staates nicht hätte übernehmen dürfen. Dass sie es dennoch tat, weist auf ein tiefer liegendes Problem der Finanzmärkte hin, welches bis heute ungelöst ist. Die Banken haben es geschafft, ihre Risi-ken strukturell dem Steuerzahler anzulasten, indem sie in einer Mischung aus schierer Größe und geringen Eigenkapitalquoten einen Teufelskreis in Gang gesetzt haben: Die niedrigen Eigenkapitalquoten erlauben den Banken einer-seits einen hohen Leverage mit entsprechend hoher Eigenkapitalrentabilität in guten Zeiten. Andererseits ist eben dieser Leverage mit hohen Verlusten in schlechten Zeiten verbunden, doch werden diese Verluste unter Hinweis auf das „Too-big-to-fail-Argument” und die „Systemrelevanz” großer Banken dem Staat angelastet. Die Erwartung einer Schuldübernahme durch den Staat schließlich erlaubt den Banken die niedrigen Eigenkapitalquoten, womit sich der Teufelskreis schließt.4
Diesen Teufelskreis durch eine entsprechende Ordnungspolitik zu durchbre-chen, dürfte zu den vordringlichsten Aufgaben der Wirtschafts- und Finanzpolitik in mittelfristiger Perspektive gehören. Denn die Ursachen von Überschuldung sind immer auf beiden Seiten des Kapitalmarktes zu suchen: auf der Angebots- wie auf der Nachfrageseite. Da die Angebots- ebenso wie die Nachfrageseite im Falle staatlicher Schuld unter einem strukturellen Haftungsproblem leidet, wird man nicht umhin kommen, stärker greifende Restriktionen zu installie-ren, um das marktwirtschaftliche Gebot der Einheit von Handlung und Haf-tung wieder stärker zur Geltung zu bringen.
2. Die anhaltende Konjunkturschwäche in Europa
Nun leidet nicht allein Griechenland unter einer anhaltenden Krise. Die Subprime-Krise hat in verschiedenen Ländern der Eurozone nachhaltige struk-turelle Verschuldungsprobleme offengelegt. Diesen wurde mit den bekannten Konsolidierungsprogrammen in Verbindung mit einer radikal veränderten
3 Fiedler/Kooths (2015).4 Admati/Hellwig (2013).
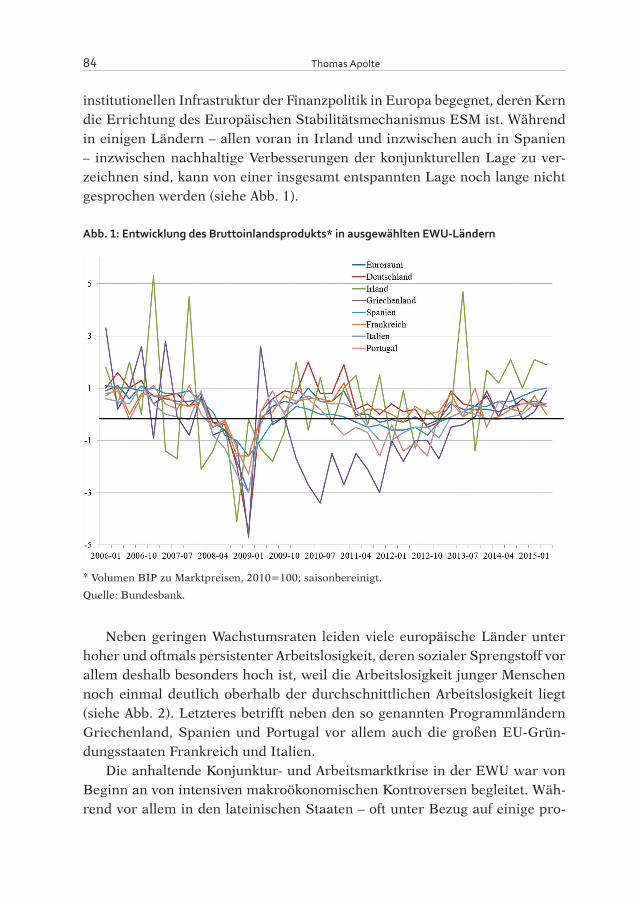
Thomas Apolte 84
institutionellen Infrastruktur der Finanzpolitik in Europa begegnet, deren Kern die Errichtung des Europäischen Stabilitätsmechanismus ESM ist. Während in einigen Ländern – allen voran in Irland und inzwischen auch in Spanien – inzwischen nachhaltige Verbesserungen der konjunkturellen Lage zu ver-zeichnen sind, kann von einer insgesamt entspannten Lage noch lange nicht gesprochen werden (siehe Abb. 1).
Abb. 1: Entwicklung des Bruttoinlandsprodukts* in ausgewählten EWU-Ländern
* Volumen BIP zu Marktpreisen, 2010=100; saisonbereinigt.
Quelle: Bundesbank.
Neben geringen Wachstumsraten leiden viele europäische Länder unter hoher und oftmals persistenter Arbeitslosigkeit, deren sozialer Sprengstoff vor allem deshalb besonders hoch ist, weil die Arbeitslosigkeit junger Menschen noch einmal deutlich oberhalb der durchschnittlichen Arbeitslosigkeit liegt (siehe Abb. 2). Letzteres betrifft neben den so genannten Programmländern Griechenland, Spanien und Portugal vor allem auch die großen EU-Grün-dungsstaaten Frankreich und Italien.
Die anhaltende Konjunktur- und Arbeitsmarktkrise in der EWU war von Beginn an von intensiven makroökonomischen Kontroversen begleitet. Wäh-rend vor allem in den lateinischen Staaten – oft unter Bezug auf einige pro-

Stabilitätspolitik und Geldpolitik in Europa vor dem Hintergrund der Griechenland-Krise 85
minente US-amerikanische Starökonomen wie Paul Krugman, Joseph Stiglitz oder Stanley Fisher – eine expansivere Fiskal- und Geldpolitik gefordert wird, setzt man in den Nord- und Nordwesteuropäischen Staaten eher auf eine fis-kalische Konsolidierung in Verbindung mit der Forderung nach einer antiin-flationären Geldpolitik.
Abb. 2: Arbeitslosenquoten* in ausgewählten EWU-Ländern
* Harmonisierte Arbeitslosenquoten insgesamt (ALQ) und spezifische harmonisierte Arbeitslosenqu-oten von Personen zwischen 15 und 25 Jahren (ALQ_Jugend).
Quelle: Eurostat.
Während sich in fiskalpolitischer Hinsicht die Konsolidierungsbefürworter bisher durchgesetzt haben, vollzog die Europäische Zentralbank unter Präsi-dent Mario Draghi eine grundsätzliche Abkehr von der bisher relativ restrik-tiv ausgerichteten antiinflationären Geldpolitik. Dies betrifft nicht allein das unmittelbare Management der Eurokrise, dessen Höhepunkt im Herbst 2012 erreicht war, als Draghi in seiner berühmten Rede versprach, im Zweifel unbe-grenzt Wertpapiere aufzukaufen, um die Krise zu meistern und die Eurozone zusammenzuhalten. Es betrifft auch die mittelfristig ausgerichtete Geldpolitik, welche sich seither auf eine bewusste Stabilisierung der Inflationserwartungen auf einem Niveau von etwa zwei Prozent richtet, und zwar auch und gerade
Thomas Apolte 86
für den Fall, dass dies eine massive Geldinfusion in den Wirtschaftskreislauf erfordern würde. Diese Politik wird damit begründet, dass nur so ein siche-rer Abstand des markträumenden Nominalzinsniveaus von der Null-Prozent-Grenze zu gewährleisten sei.
Seit März 2015 leitete die EZB mit seinem Wertpapieraufkaufprogramm schließlich eine Politik der monetären Lockerung ein, welche im Kern der ab 2009 von der amerikanischen und der britischen und ab 2011 von der japani-schen Notenbank verfolgten Politik des quantitative easing entspricht. Konkret beinhaltet die monetäre Lockerung im Euroraum, dass die EZB monatlich Wert-papiere im Umfang von 60 Mrd. € über einen Zeitraum von zunächst 18 Mona-ten erwirbt, wobei eine Verlängerung ausdrücklich nicht ausgeschlossen wurde.
Wie Abb. 3 zeigt, ist die Geldbasis im Zuge der Subprime-Krise zwar mit etwa 50 Prozent zwischen 2007 und 2011 deutlich angestiegen, doch blieb die EZB damit weit hinter den Zentralbanken der USA und Großbritanniens zurück. Die ab 2011 einsetzende Eurokrise hat dann zu einem erneuten und diesmal sehr viel deutlicheren Anstieg der Liquiditätsversorgung geführt, doch bildete sich die Geldbasis im Verlaufe der Krise bis 2014 praktisch vollstän-dig wieder zurück, was auf eine Geldpolitik zurückzuführen ist, welche unter angelsächsischen Ökonomen vor dem Hintergrund der sehr viel expansiveren Geldpolitik in den USA und in Großbritannien heftig kritisiert wurde.5 Offenbar unter diesem Eindruck beschloss das EZB Präsidium schließlich, die endgül-tige geldpolitische Kehrtwende zu vollziehen und ab März 2015 die monetäre Lockerung einzuleiten, welche sich gegen Ende 2015 bereits in einem neuer-lich starken Anstieg der Geldbasis niederschlägt.
Während alles dies im angelsächsischen Raum ebenso wie in den latei-nischen EWU-Ländern mit Genugtuung beobachtet wird, ist es vor allem in Deutschland von vielen kritischen Stimmen begleitet gewesen.6 Kern dieser Kritik ist, dass das seit Jahren fallende Zinsniveau weniger als ein längerfris-tig-realwirtschaftlich bedingtes Phänomen gedeutet wird, sondern der EZB selbst angelastet wird. Demnach treibt die EZB mit ihrer lockeren Geldpolitik das nominale wie reale Zinsniveau immer weiter nach unten, verhindert damit eine Ausdifferenzierung nach Risiken und setzt so die Lenkungsfähigkeit der Kapitalmarktzinsen herab. Im Ergebnis, so lautet die Befürchtung, wird dies die Konjunktur nicht verbessern, weil die Ursache der Konjunkturschwäche
5 vor allem: Krugman (2013).6 SVR (2015), S. 178 ff.
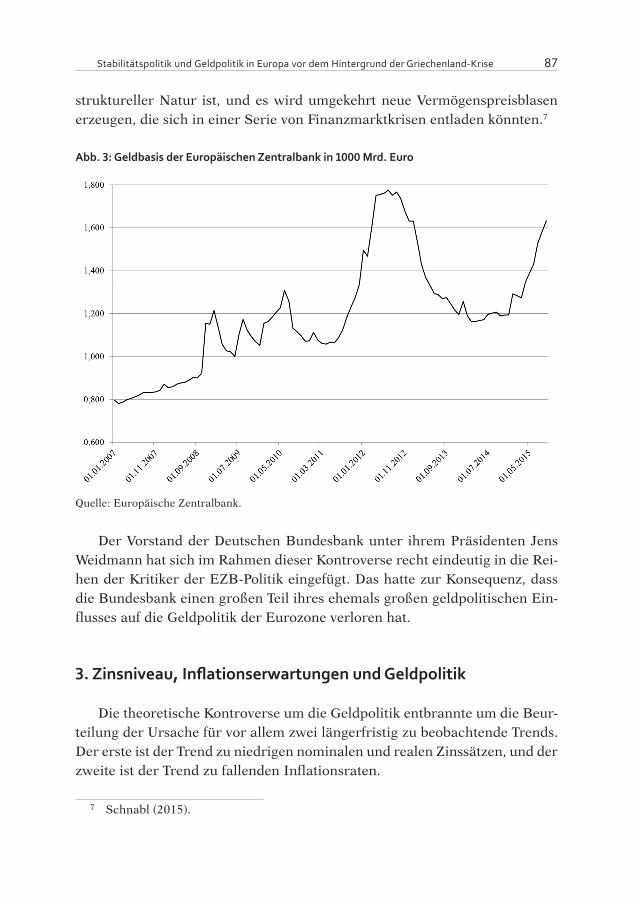
Stabilitätspolitik und Geldpolitik in Europa vor dem Hintergrund der Griechenland-Krise 87
struktureller Natur ist, und es wird umgekehrt neue Vermögenspreisblasen erzeugen, die sich in einer Serie von Finanzmarktkrisen entladen könnten.7
Abb. 3: Geldbasis der Europäischen Zentralbank in 1000 Mrd. Euro
Quelle: Europäische Zentralbank.
Der Vorstand der Deutschen Bundesbank unter ihrem Präsidenten Jens Weidmann hat sich im Rahmen dieser Kontroverse recht eindeutig in die Rei-hen der Kritiker der EZB-Politik eingefügt. Das hatte zur Konsequenz, dass die Bundesbank einen großen Teil ihres ehemals großen geldpolitischen Ein-flusses auf die Geldpolitik der Eurozone verloren hat.
3. Zinsniveau, Inflationserwartungen und Geldpolitik
Die theoretische Kontroverse um die Geldpolitik entbrannte um die Beur-teilung der Ursache für vor allem zwei längerfristig zu beobachtende Trends. Der erste ist der Trend zu niedrigen nominalen und realen Zinssätzen, und der zweite ist der Trend zu fallenden Inflationsraten.
7 Schnabl (2015).
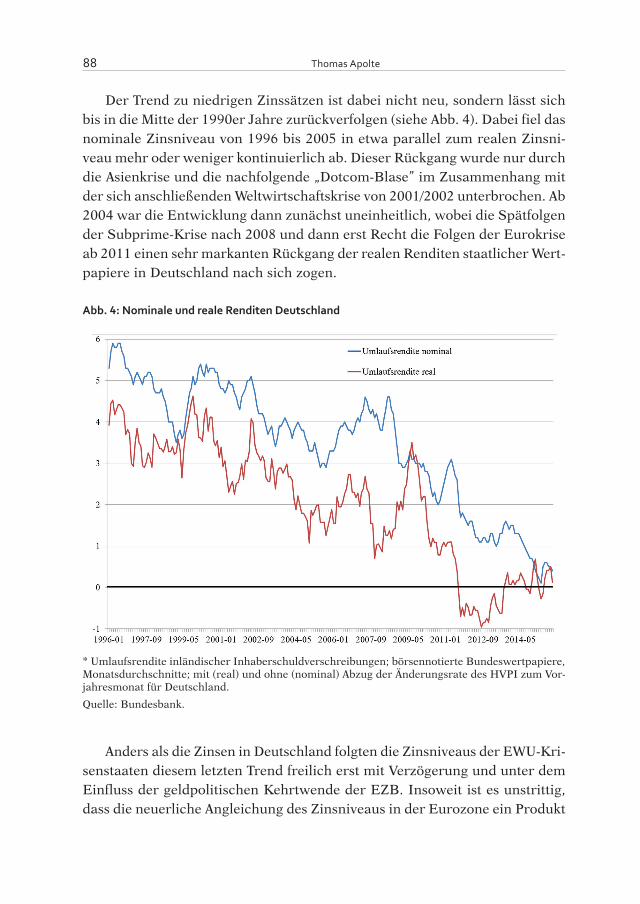
Thomas Apolte 88
Der Trend zu niedrigen Zinssätzen ist dabei nicht neu, sondern lässt sich bis in die Mitte der 1990er Jahre zurückverfolgen (siehe Abb. 4). Dabei fiel das nominale Zinsniveau von 1996 bis 2005 in etwa parallel zum realen Zinsni-veau mehr oder weniger kontinuierlich ab. Dieser Rückgang wurde nur durch die Asienkrise und die nachfolgende „Dotcom-Blase” im Zusammenhang mit der sich anschließenden Weltwirtschaftskrise von 2001/2002 unterbrochen. Ab 2004 war die Entwicklung dann zunächst uneinheitlich, wobei die Spätfolgen der Subprime-Krise nach 2008 und dann erst Recht die Folgen der Eurokrise ab 2011 einen sehr markanten Rückgang der realen Renditen staatlicher Wert-papiere in Deutschland nach sich zogen.
Abb. 4: Nominale und reale Renditen Deutschland
* Umlaufsrendite inländischer Inhaberschuldverschreibungen; börsennotierte Bundeswertpapiere, Monatsdurchschnitte; mit (real) und ohne (nominal) Abzug der Änderungsrate des HVPI zum Vor-jahresmonat für Deutschland.
Quelle: Bundesbank.
Anders als die Zinsen in Deutschland folgten die Zinsniveaus der EWU-Kri-senstaaten diesem letzten Trend freilich erst mit Verzögerung und unter dem Einfluss der geldpolitischen Kehrtwende der EZB. Insoweit ist es unstrittig, dass die neuerliche Angleichung des Zinsniveaus in der Eurozone ein Produkt

Stabilitätspolitik und Geldpolitik in Europa vor dem Hintergrund der Griechenland-Krise 89
der EZB-Geldpolitik und vor allem des Versprechens von Mario Draghi vom Herbst 2012 ist.
Der Trend zu sinkenden Inflationsraten (siehe Abb. 5) ist erst seit Beginn der Eurokrise unzweideutig absehbar. Nachdem die Inflationsraten nach Grün-dung der EWU zunächst über einen Zeitraum von fast neun Jahren erstaunlich stabil um die zwei Prozent schwankten, begannen sie – nachdem sie im Zuge der Subprime-Krise zunächst heftige Ausschläge gezeitigt hatten – ab 2012 mehr oder weniger kontinuierlich zu sinken. Der Rückgang seit 2012 ist dabei nur zum Teil den fallenden Energiepreisen zuzurechnen, wenngleich deren Einfluss erheblich ist, wie Abb. 5 zeigt. Aber auch die Kerninflationsrate liegt inzwischen unter zwei Prozent.
Insgesamt folgten die Nominalzinsen seit Ende der 1990er Jahre in der Tat den sinkenden Realzinsen, während seit etwa 2011 mit den sinkenden Infla-tionsraten noch ein zweiter Treiber hinzukam. Erstaunlicherweise fielen die Realzinsen aber gerade seither noch schneller als die Nominalzinsen, wie in Abb. 4 deutlich zu erkennen ist.
Abb. 5: Inflationsrate und Kerninflationsrate in der EWU
* Inflationsrate: Änderungsrate des HVPI im Vergleich zum Vorjahresmonat. Kerninflation-srate: Änderung des HVPI ohne unverarbeitete Nahrungsmittel und Energie im Vergleich zum Vorjahresmonat.
Quelle: Europäische Zentralbank.
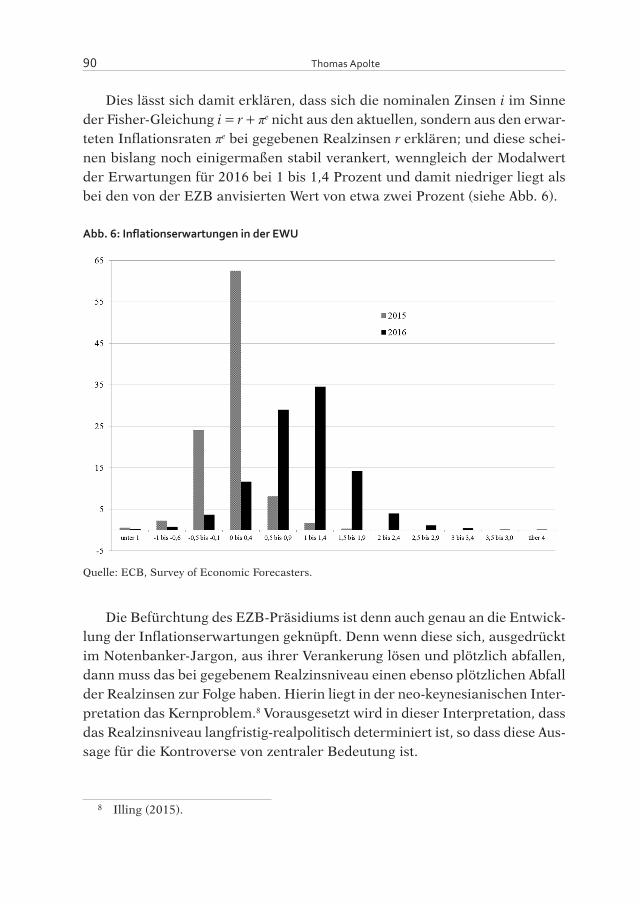
Thomas Apolte 90
Dies lässt sich damit erklären, dass sich die nominalen Zinsen i im Sinne der Fisher-Gleichung i = r + πe nicht aus den aktuellen, sondern aus den erwar-teten Inflationsraten πe bei gegebenen Realzinsen r erklären; und diese schei-nen bislang noch einigermaßen stabil verankert, wenngleich der Modalwert der Erwartungen für 2016 bei 1 bis 1,4 Prozent und damit niedriger liegt als bei den von der EZB anvisierten Wert von etwa zwei Prozent (siehe Abb. 6).
Abb. 6: Inflationserwartungen in der EWU
Quelle: ECB, Survey of Economic Forecasters.
Die Befürchtung des EZB-Präsidiums ist denn auch genau an die Entwick-lung der Inflationserwartungen geknüpft. Denn wenn diese sich, ausgedrückt im Notenbanker-Jargon, aus ihrer Verankerung lösen und plötzlich abfallen, dann muss das bei gegebenem Realzinsniveau einen ebenso plötzlichen Abfall der Realzinsen zur Folge haben. Hierin liegt in der neo-keynesianischen Inter-pretation das Kernproblem.8 Vorausgesetzt wird in dieser Interpretation, dass das Realzinsniveau langfristig-realpolitisch determiniert ist, so dass diese Aus-sage für die Kontroverse von zentraler Bedeutung ist.
8 Illing (2015).

Stabilitätspolitik und Geldpolitik in Europa vor dem Hintergrund der Griechenland-Krise 91
Setzt man ein derart gegebenes Realzinsniveau voraus, so können zu nied-rige Inflationsraten dauerhafte Angebotsüberschüsse am Kapitalmarkt zur Folge haben. Die Logik des Arguments wird in Abb. 7 illustriert. Im linken Teil der Graphik sind Angebot Ks und Nachfrage Kd am Kapitalmarkt abgebildet, und zwar in den durchgezogenen Linien in Abhängigkeit vom Realzinssatz r und in den gestrichelten Linien in Abhängigkeit vom Nominalzinssatz i. Damit kann die erwartete Inflationsrate πe als die vertikale Differenz zwischen den beiden gleichgewichtigen Zinssätzen i0 und r0 abgetragen werden.
Sofern der gleichgewichtige Realzinssatz oberhalb von null liegt, kann zu jeder Inflationsrate oberhalb von –r0 ohne weiteres ein Kapitalmarktgleichge-wicht Ks = Kd realisiert werden. Sorgen exogene realwirtschaftlichen Faktoren indes für eine Verschiebung der Angebotskurse Ks(r) und/oder der Nachfra-gekurve Kd(r) in der Art, dass der Realzins unter die Nulllinie fällt, so ändert sich diese Diagnose. Dies illustriert die rechte Seite der Graphik, bei der der markträumende Realzinssatz r1 deutlich unterhalb von null liegt. Solange die erwartete Inflationsrate hinreichend hoch bleibt, zum Beispiel auf dem Niveau πe
0, kann ein Nominalzinssatz oberhalb von null – im Beispiel also i1 – weiter-hin zur Markträumung führen.
Sinkt indes die Inflationserwartung gleichzeitig mit dem Realzinssatz ab, so kann der markträumende Nominalzinssatz i unter null fallen. Wenn im Beispiel des rechten Teils von Abb. 7 die Inflationserwartung auf null fällt, so fällt auch der markträumende Nominalzins unter null, bis er bei i2 = r1 liegt. Das aber ist nicht möglich, weil nominale Zinssätze eine natürliche Unter-grenze haben, die bestenfalls geringfügig unter null liegt; da nämlich, wo sie die Opportunitätskosten der Bargeldhaltung widerspiegeln. Man würde dann ökonomisch betrachtet eine Art Gebühr für die Verwahrung des Geldvermö-gens bei einer Bank zahlen.
Nehmen wir der Einfachheit halber die Untergrenze des Nominalzinses bei null an, so muss ein negativer Realzins in Verbindung mit einer Inflations-rate von null stets mit einem nicht-markträumenden Nominalzins verbunden sein. Wenn wir das Kapitalangebot mit den Ersparnissen S gleichsetzen und die Kapitalnachfrage mit den Investitionen I, so ergibt sich im Beispiel des rechten Teils von Abb. 7 ein Überhang der Ersparnisse über die Investitionen von S1 = I1. Dieser Überhang führt zu einem gleichhohen Nachfrageausfall am Gütermarkt und zu damit korrespondierender Arbeitslosigkeit, wenn er nicht durch staatliche Verschuldung abgeschöpft und in staatliche Ausgaben umgesetzt wird.
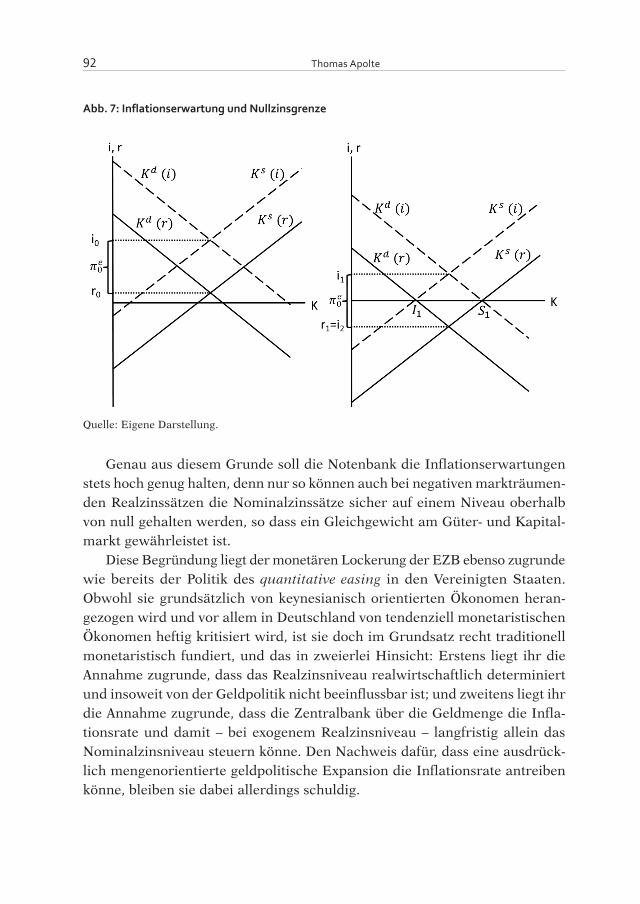
Thomas Apolte 92
Abb. 7: Inflationserwartung und Nullzinsgrenze
Quelle: Eigene Darstellung.
Genau aus diesem Grunde soll die Notenbank die Inflationserwartungen stets hoch genug halten, denn nur so können auch bei negativen markträumen-den Realzinssätzen die Nominalzinssätze sicher auf einem Niveau oberhalb von null gehalten werden, so dass ein Gleichgewicht am Güter- und Kapital-markt gewährleistet ist.
Diese Begründung liegt der monetären Lockerung der EZB ebenso zugrunde wie bereits der Politik des quantitative easing in den Vereinigten Staaten. Obwohl sie grundsätzlich von keynesianisch orientierten Ökonomen heran-gezogen wird und vor allem in Deutschland von tendenziell monetaristischen Ökonomen heftig kritisiert wird, ist sie doch im Grundsatz recht traditionell monetaristisch fundiert, und das in zweierlei Hinsicht: Erstens liegt ihr die Annahme zugrunde, dass das Realzinsniveau realwirtschaftlich determiniert und insoweit von der Geldpolitik nicht beeinflussbar ist; und zweitens liegt ihr die Annahme zugrunde, dass die Zentralbank über die Geldmenge die Infla-tionsrate und damit – bei exogenem Realzinsniveau – langfristig allein das Nominalzinsniveau steuern könne. Den Nachweis dafür, dass eine ausdrück-lich mengenorientierte geldpolitische Expansion die Inflationsrate antreiben könne, bleiben sie dabei allerdings schuldig.
Stabilitätspolitik und Geldpolitik in Europa vor dem Hintergrund der Griechenland-Krise 93
Umgekehrt verlassen die Kritiker des quantitative easing ihre meist mone-taristisch fundierten Analysen, wenn sie der Notenbank die Verantwortung für das anhaltend niedrige Realzinsniveau anlasten. Damit bleiben sie weiterhin auch eine Begründung dafür schuldig, warum eine Zentralbank in der Lage sein sollte, langfristig reale Zinsniveaus beeinflussen zu können, ohne dass dies durch kompensatorische Preisniveausteigerungen konterkariert würde. Geheilt wird diese Widersprüchlichkeit neben dem Verweis auf preisdämpfende Effekte der jüngsten Globalisierungswelle meist durch einen Verweis auf Ver-mögenspreissteigerungen, welche an die Stelle der traditionellen Verbraucher-preisinflation getreten sei.9 Allerdings ist auch diese Sicht nicht unstrittig.10
Im Kern der Debatte steht demnach die Erklärung der niedrigen Realzin-sen, in Verbindung mit der niedrigen Inflationsrate bei expansiver Geldpolitik. In diesem Sinne können wir hier eine „Vermögenspreisthese” von einer „Real-wirtschaftsthese” unterscheiden:• Die Vermögenspreisthese erklärt die Symptomatik sinkender Realzinsen
damit, dass eine expansive Geldpolitik hinter den niedrigen Realzinsen steckt, dass die damit in Umlauf gelangten exzessiven Geldmengen aber auf Ver-mögensmärkten absorbiert und dort zu serienhaften Vermögenspreisblasen statt zu Verbraucherpreisanstiegen führen, so dass die Verbraucherpreisin-flation ausbleibt und damit das Realzinsniveau in der Folge der expansiven Geldpolitik niedrig bleibt. Die geldpolitische Empfehlung ist daher aus der Perspektive der Vermögenspreisthese ganz traditionell in der Rückkehr zu einer langfristig orientierten Politik des knappen Geldes zu sehen.
• Die Realwirtschaftsthese erklärt die Symptomatik sinkender Realzinsen hingegen mit exogenen realwirtschaftlichen Faktoren, welchen die Zen-tralbank passiv zu folgen gezwungen ist, wenn sie keine Depression aus-lösen will. Ihre Empfehlung ist daher eine expansive Geldpolitik mit dem Ziel, mit Hilfe hinreichend hoher Inflationsraten positive markträumende Nominalzinsniveaus und damit eine hinreichend hohe gesamtwirtschaft-liche Nachfrage zu garantieren.Wenn die Realwirtschaftsthese indes zutreffen sollte, dann müssten sich
Faktoren isolieren lassen, welche das fallende Realzinsniveau realwirtschaftlich erklären. Die traditionelle Theorie internationaler Faktormobilität würde ange-sichts der hohen weltweiten Einkommensdisparitäten und des zum Teil rasan-ten Aufholens einiger Schwellenländer für die Industrieländer eher steigende
9 Schnabl (2015).10 Illing (2015).
Thomas Apolte 94
als fallende Realzinsen prognostizieren, weil der Aufholprozess der Schwellen- und Entwicklungsländer eine anhaltende Kapitalnachfrage induzieren müsste, welcher von dortigen inländischen Sparern nicht gedeckt werden kann und von daher zu den Industrieländern hinüberschwappt. Merkwürdigerweise sind aber viele Schwellenländern eher Kapitalexporteure, was typischerweise durch überregulierte und noch wenig entwickelte Kapitalmärkte erklärt wird. Dass dieser nicht neue Tatbestand indes die realen Zinssätze in den Industri-eländern nachhaltig drücken sollte, ist wenig plausibel.
Eine weiter verbreitete Hypothese ist daher eine andere. Sie setzt an der demographischen Entwicklung der Industrieländer an und läuft im Prinzip immer darauf hinaus, dass sich die meisten Industrieländer in einer demogra-phischen Übergangsphase befinden, welche sich durch einen hohen Überhang der heute zwischen 50 und 60-jährigen Personen auszeichnet. Dieser Bevöl-kerungsteil legt zurzeit große Menge von Ersparnissen mit dem Ziel an, diese in einigen Jahren für den Alterskonsum zu verwenden. Dies könnte grundsätz-lich sowohl den niedrigen Realzinssatz als auch die niedrigen Inflationsraten erklären, wobei letztere der im Zuge der Sparwelle fallenden gesamtwirtschaft-lichen Nachfrage geschuldet wäre. Für das stark alternde Japan wird die Demo-graphiethese in der Tat seit längerem schon unter anderem von Shirakawa (2012) vertreten. Im deutschen Sprachraum ist es vor allem C. C. von Weizsä-cker (2014; 2015), der sich für die Demographiethese stark macht. Er begrün-det seine Sicht in einer Serie von meist theoretischen Papieren, in denen er zu zeigen versucht, dass die demographisch bedingte Ersparniswelle – gemessen an historischen Erfahrungen über den gesamtwirtschaftlichen Kapitalkoeffizi-enten – von den privaten Märkten nicht absorbiert werden kann. Daher müsse sich der Staat hier engagieren und die überschüssigen Ersparnisse per Ver-schuldung in den Kreislauf zurückschleusen, um eine nachhaltige Tendenz zu wirtschaftlicher Depression und Arbeitslosigkeit zu verhindern.
Die Demograpiethese wird allerdings zum Teil vehement kritisiert. So bezweifeln Juselius und Tatáts (2015) in einem Working Paper der Bank für Internationalen Zahlungsausgleich (BIS), dass die Realzinsen angesichts der weltweiten Kapitalknappheit mit Hilfe der demographischen Entwicklung in den Industrieländern erklärt werden kann.11 Aber selbst mit Blick auf die nationa-len Kapitalmärkte argumentiert Homburg (2015), dass der Knappheitseffekt des naturgemäß nicht vermehrbaren Bodens in einer wachsenden Wirtschaft
11 Juselius/Tatáts (2015).
Stabilitätspolitik und Geldpolitik in Europa vor dem Hintergrund der Griechenland-Krise 95
den Nominalwert des Bodens in einer Weise ansteigen lässt, dass die steigen-den nominalen Ersparnisse darüber stets absorbiert werden.
4. Fazit
Die Kontroverse zwischen den beiden Thesen kann und soll hier nicht ent-schieden werden. Anhaltend negative Realzinsen würden jedenfalls eine fehlende weltweite oder doch zumindest regionale Knappheit des Kapitals implizieren, und dies ist aus der Sicht vieler Ökonomen angesichts der Einkommensver-hältnisse weltweit nur schwer vorstellbar, zumindest nicht dauerhaft. Sollte es dennoch so sein, so bleibt die Frage der stabilitätspolitischen Begleitung einer solchen Phase fehlender Kapitalknappheit. Die Befürworter des quantitative easing erhoffen sich aus ihrer Empfehlung hinreichend hohe Inflationsraten, bleiben aber doch die Antwort schuldig, wie eine massive Geldmengenauswei-tung vor dem Hintergrund der jüngeren Erfahrungen und zumal bei niedrigen Zinsen – also potenziell in einer Liquiditätsfalle – die Verbraucherpreisinfla-tion antreiben soll; dazu gehört dann auch die Frage, wie verhindert werden kann, dass die Geldmengenausdehnung daran gehindert werden kann, statt der erwünschten Verbraucherpreisinflation gefährliche Vermögenspreisbla-sen zu erzeugen.
Vor diesem Hintergrund sind denn auch die gelegentlichen Forderungen zur Abschaffung des Bargeldes zu sehen, welche international unter anderem von Kenneth Rogoff (2006) propagiert und in Deutschland von Peter Bofinger in die Öffentlichkeit getragen wurde. Denn mit ihr ließen sich die Opportuni-tätskosten der Geldhaltung im Wege negativer Strafzinsen systematisch in die Höhe treiben, um so den Anreiz zur Rückführung von Geld in den Kreislauf zu erzwingen. Spätestens hier dürften indes massive und nicht zuletzt ordnungs-politische Bedenken relevant werden.12 Hinzu kommt, dass auch mit einer Bargeldabschaffung nicht gewährleistet werden kann, dass das Geld in die Vermögensmärkte statt in die Gütermärkte fließt.
Sollte eine Geldmengenpolitik daher nicht erfolgversprechend sein, so bliebe nur der Weg einer verstärkten Staatsverschuldung, und ebendies fordert in Deutschland von Weizsäcker (2015). Dieser Weg allerdings ist vor dem Hin-tergrund der jüngsten Eurokrise nicht minder problematisch, die ja im Kern
12 Beck/Prinz (2015), Rösl/Seitz (2015).
Thomas Apolte 96
eine Staatsverschuldungskrise ist.13 Weitere Bedenken legen nahe, dass eine überbordende Staatsverschuldung letztlich fast immer und fast überall zu Wachstumseinbußen und zu Finanzierungsproblemen geführt hat.14
Wer sich umgekehrt mit der Aufhebung des Knappheitsprinzips im Geld-sektor oder im Bereich der Staatsverschuldung aus den genannten Gründen nicht anfreunden mag, muss offenbar darauf hoffen, dass die anhaltend nied-rigen Realzinsen keine entsprechenden realwirtschaftlichen Knappheitsbedin-gungen reflektieren, sondern Zeichen einer geldpolitisch erzeugten Verzerrung sind. Dann, aber auch nur dann ließe sich guten Gewissens eine Rückkehr zu einer knappheitsorientieren Geldpolitik in Verbindung mit einer weiteren Konsolidierung der Staatshaushalte empfehlen. Die Diskussion innerhalb der Eurozone ist in dieser Hinsicht also alles andere als beendet, und die Konse-quenzen für die Zukunft sind völlig offen.
STRESZCZENIE
W artykule została przenalizowana stabilnościowa sytuacja Uni Gospodarczej i Walu-towej Unii Europejskiej w świetle ostatniego kryzysu rynku finansowego i kryzysu zadłużenia. W obliczu utrzymującego się osłabienia koniunktury strefy euro powstaje pytanie, czy panujące od dawna niskie stopy procentowe nie są wyrazem woli polityki pieniężnej Banku Centralnego czy na odwrót – nie są skutkiem trendu rozwojowego w ocenie rynkowej kapitału realnego. W pierwszym przypadku EBC stworzyłby nie-ostrożnie nadmierną wypłacalność i podniósłby tym sposobem niebezpieczeństwo spekulacyjnej bańki. W ostatnim zaś przypadku EBC widziałby się zmuszonym do podążania przy dodatkowej wypłcalności za trendem spadających realnych zysków, aby zapobiec spirali deflacyjnej. Na tle tych różnorodnych makroekonomicznych ocen rozważanone zostały możliwości dla polityki pieniężnej i fiskalnej.
Słowa kluczowe: kryzys euro, deflacja, odsetki realne, Quantitative Easying, poli-tyka stabilizacyjna
13 Uhlig (2014).14 Reinhard/Rogoff (2011).
Stabilitätspolitik und Geldpolitik in Europa vor dem Hintergrund der Griechenland-Krise 97
Literatur
Admati, A., Helwig, M. (2013): The Bankers’ New Clothes. What’s Wrong with Banking and What to Do about it, Princeton: Princeton University Press.
Beck, H., Prinz, A. (2015): Mit Bargeld zahlen – ein Auslaufmodell?, in: Wirtschafts-dienst, 95, S. 515–519.
Fiedler, S., Kooths, S. (2015): Griechenland – zwischen Insolvenz und Schuldenerlass, in: Wirtschaftsdienst, 95, S. 60–613.
Homburg, S. (2014): Overaccumulation, Public Debt and the Importance of Land, in: German Economic Review 15, S. 411–435.
Illing, G. (2015): Unkonventionelle Geldpolitik – kein Paradigmenwechsel, in: Perspek-tiven der Wirtschaftspolitik, 16, S. 127–150.
Juselius, M., Takáts, E. (2015): Can Demography Affect Inflation and Monetary Policy?, BIS Working Papers No. 485, Basle.
Krugman, P. (2013): End this Depression Now, New York: W. W. Norton & Company.Reinhart, Carmen M., Rogoff, K. S. (2011): This Time is Different: Eight Centuries of
Financial Folly, Princeton: Princeton University Press.Rogoff, K. (2006): Costs and Benefits to Phasing Out Paper Currency, in: NBER Wor-
king Paper, Nr. 20126, Mai 2014.Rösl, G., Seitz, F. (2015): Warum Bargeld nicht abgeschafft werden sollte. Effi-
zienz-, Praktikabilitäts- und Implementierungsaspekte, in: Wirtschaftsdienst, 95, S. 525–528.
Scheuering, U. (2015): Analyse der Schuldentragfähigkeit Griechenlands, in: Arbeit-spapier 04/2015 des Sachverständigenrates, Wiesbaden.
Shirakawa, M. (2012): Demographic Changes and Macroeconomic Performance: Japa-nese Experiences, Opening Remark at 2012 BOJ-IMES Conference hosted by the Institute for Monetary and Economic Studies, the Bank of Japan, 30. Mai 2012.
Schnabl, G. (2015): Die gefährliche Missachtung der Vermögenspreisinflation. Zur Wirkungslosigkeit von Inflationszielen als geldpolitische Regelmechanismen, in: Leviathan, 43, S. 139–162.
Sinn, H.-W. (2015): Die griechische Tragödie, in: ifo Schnelldienst, 68, Sonderausgabe.SVR (2015): Zukunftsfähigkeit in den Mittelpunkt. Jahresgutachten, Wiesbaden.Uhlig, H. (2014): Sovereign Default Risk and Banks in a Monetary Union, in: German
Economic Review, 15, S. 23–41.Von Weizsäcker, C. C. (2014): Public Debt and Price Stability, in: German Economic
Review, 15, S. 42–61.Von Weizsäcker, C. C. (2015): Kapitalismus in der Krise? Der negative natürliche
Zins und seine Folgen für die Politik, in: Perspektiven der Wirtschaftspolitik, 16, S. 189–212.

Hubertus BARDT*
BARRIERS FOR MORE INVESTMENTS IN GERMANY
1. Motivation
In Germany, gross fixed investment as share of GDP has decreased contin-uously (figure 1). One way to discuss this observation is to focus on the mac-roeconomic perspective and to identify investment gaps. Another approach is to determine supply side conditions that may restrict the companies’ ability or willingness to increase their investments. The focus of this paper is not to ana-lyse macroeconomic investment gaps or public investments, but to identify factors that may help private businesses to increase their market-based invest-ment efforts.
Figure 1: Investment Quota in Germany (gross fixed investment, share of GDP)
15
20
25
30
1991 1993 1995 1997 1999 2001 2003 2005 2007 2009 2011 2013
sources: Statistisches Bundesamt, Cologne Institute for Economic Research.
* Cologne Institute for Economic Research (iw Köln), * e-mail: [email protected]

Hubertus Bardt 100
The reason for this reluctance to invest needs further investigation in order to discuss political investment strategies. An empirical approach to analyse the relevant explanations for this stagnation can be based on various methods. Several papers use an econometric approach based on regression analyses of the investment functions.1 Data from the past and from various countries can be used to identify the relevant factors that explain the level of investments. But the investment function can only provide information on the correlation of variables in the past, which is not necessarily the relevant factor to explain the current low investment performance.
An alternative approach is to conduct a survey. Asking the companies about their motives and reasons not to increase investments has the advantage that cur-rent events can be taken into account and can be integrated in the questionnaire. Twice a year, the Cologne Institute for Economic Research conducts a survey about the business expectations of companies in Germany in order to prepare the economic outlook for the current and the following year. In autumn 2014, in addition to the regular questions, the companies were asked about current obstacles for additional investments in Germany. About 2,900 answers have been analysed.2
2. Reasons for Investment Reluctance
Reasons to invest or not to invest are manifold. The individual decision of each company depends on specific market opportunities, technical conditions and the financial situation. Therefore, there cannot be a simple answer to the question about the reason to invest or not to invest. Each of these decisions is based on a set of reasons and often there is not one particular fact that makes the management decide against a specific investment.
Since there are many factors that influence individual investment decisions, a variety of reasons have to be considered to explain the moderate development of investment in the German economy. The survey data are used to identify the factors that are relevant for a greater share of companies. Figure 2 shows the 13 alternatives presented in the survey and the share of companies that iden-tified these as the reasons for their relatively poor investment performance. Three groups of investment obstacles can be described:
1 DIW/HRI (2014), Alm/Merers (2015).2 Bardt et al. (2015).

Barriers for more investments in Germany 101
2.1. International economic perspectives
For more than half of the companies, the high level of uncertainty regard-ing the global economic development is among the most relevant factors that explain the low level of investment activities in Germany. There is no other factor which is more important. Only 14 per cent of the companies do not see any investment obstacle in the global economic development.
Figure 2: Investment Obstacles in Germany (shares of companies that see the particular aspects as a reason not to increase investments)
49
47
39
48
26
25
16
18
17
12
15
12
14
15
17
19
19
25
32
35
43
45
46
48
50
52
financial resources
investment abroad to incrase sales
infrastrucure deficits 4)
investment abroad to reduce costs
weak domestic demand
missing qualified employees
high taxes
high bureaucracy 3)
weak economic development in Europe
high labour costs
high regulation 2)
high energy costs
uncertain global economic development
important investment obstacle no obstacle
* Survey among 2,900 companies in Germany in October/November 20141) difference to 100: small obstacle for investment; 2) e.g. labour law; 3) e.g. approval procedures; 4) e.g. transport network, broadband network
sources: Bardt et al. (2015); Cologne Institute for Economic Research.
The possible negative effects of the Russian-Ukrainian conflict, the civil war in Syria and other conflicts on the economies in western and central Europe
Hubertus Bardt 102
are one explanation for the huge uncertainty regarding international develop-ments. Uncertainty and moderate global economic perspectives will remain important factors for investment planning. In the last decade, the outlook of the strong and stable growth in the emerging economies has been consensus among most of the experts. But for some time now, the popular growth story of the BRIC countries has become more fragile.3
Several large and economically important emerging countries face the chal-lenge of structural reforms. Growth cannot only be generated by the accumula-tion of production factors anymore. A change towards more innovation-driven growth is necessary in order not to remain in the middle-income trap.4 But often, political institutions in these countries do not support economic reforms. This slows down economic growth and reduces the potential global demand for the exporting industries in Germany – with negative indirect effects on invest-ment perspectives. This is especially true for the investment goods industry. 52 per cent of the companies in this sector believe that global economic and political uncertainty is an important investment obstacle today.
An analysis of the development of investments and political uncertainty shows a fundamental disturbance since the economic crisis in 2009. Normally, a reduced uncertainty comes along with a more positive investment situation. This cannot be observed anymore. The economic crisis still continues to have an effect on low confidence and weak investments. A new business environ-ment for a more dynamic investment performance has not yet emerged.
However, uncertainty is not limited to the global trends. 45 per cent of the companies asked in the survey mentioned the weak economic development in Europe as major investment obstacle. The share is even higher among the producers of investment goods (52 per cent). The ongoing weakness of the most important market for German exporters leads to a very reluctant behaviour of these companies. The hesitation to implement structural reforms in some member countries as well as the risk of a long period of weak growth perspec-tives in Europe reduces the propensity to invest in Germany. Although there has been progress in several countries, the results of the reforms after the eco-nomic crisis are still not certain enough to justify investment decisions.
While uncertainty regarding international economic and political develop-ments remains crucial for investments, only one out of four companies has iden-tified weak domestic demand in Germany as an important reason for reduced
3 Hüther (2014a). 4 Eichengreen et al. (2013), Aiyar et al. (2013).
Barriers for more investments in Germany 103
investment activities. The share of companies, for whom domestic demand is not relevant at all is of similar size. While companies in Western Germany emphasise the relevance of international factors, Eastern German firms focus on negative effects of the domestic economic outlook. This reflects the rela-tively strong domestic focus of the East German economy.
2.2. Economic Policy
Analysing the reasons for the investment situation, the German council of economic advisors focuses on the economic policy of the federal government5 and holds it responsible for structural problems of the German economy. In 2014, several measures of the grand coalition in Germany downgraded the quality of investment conditions. Early retirement, minimum wages and the planned regulation of temporary employment or intended restrictions of con-tracts for services are the most prominent examples. These political projects increase costs for private businesses und reduce the return on investment. 48 per cent of the companies see stricter regulation as important investment obsta-cles. Complex and expensive bureaucracy reduces investments for 43 per cent of the firms. High corporate taxes discourage additional investments.
A specific investment restriction for energy-intensive industries, which play an important role in the integrated value chains in Germany, is the current energy policy. What these companies complain about is the high state burden on energy prices, especially electricity prices, and the lack of security regard-ing the future of existing exceptions from the levies. Without these exceptions, electricity prices could double for some energy-intensive companies. Today, most of these rules are guaranteed for four years or less. Under these condi-tions, long-time investments in energy-intensive production capacities are very difficult to dare and to justify to the respective stakeholders. This is not a new observation as there has hardly been a year with positive net investments of energy-intensive industries since 2000 (figure 3).6 Therefore, the level of lev-ies and uncertainties cannot explain short-term changes in investment behav-iour but it contributes to the reluctance to invest more in Germany. Half of the companies asked in the survey label high energy costs as a strong invest-ment obstacle.
5 Sachverständigenrat (2014).6 Bardt (2014).

Hubertus Bardt 104
Compared to the other explanations for the current investment behaviour, the state of public and private infrastructure is not a dominant obstacle for investments. One out of five companies believes that deficits of transport infra-structure or digital grids obstruct additional investments significantly. Two fifths see infrastructure deficits as minor investment obstacles, for another two fifths they are no barrier at all. The effect is stronger in the service sector and build-ing industries. These results meet the evidence of the IW survey 2013, when companies were asked about their view on infrastructures.7 In the medium term, infrastructure deficits will have a severer effect on economic activities.
Figure 3: Disinvestment of energy-intensive industries (gross investment in per cent of depreciations)
80%
90%
100%
110%
120%
2000 2001 2002 2003 2004 2005 2006 2007 2008 2009 2010 2011 2012
manufacturing sector
energy-intensive industries
non-energy-intensive industries
* energy-intensive industries: chemicals, paper, glass and ceramic, and metal industry
sources: Statistisches Bundesamt (2014), own calculations.
2.3. Costs and Availability of Labour and Capital
Germany is traditionally a country with high labour costs. In the survey, 46 per cent of the companies give this reason to explain limited investments. Only 12 per cent stress that labour costs are not relevant. In the last years, labour costs increased faster in Germany than in other industrialised coun-
7 Bardt et al. (2014).
Barriers for more investments in Germany 105
tries. This development has reduced the competitiveness on the global market in terms of factor und product prices. As a consequence, willingness to invest has been affected as well.
However, only one fifth of the participants in the survey mentioned that investments abroad that had been made in order to reduce total costs had a neg-ative effect on domestic investments. But it must be taken into account that this is no option at all for many small and medium enterprises. Almost 50 per cent of the companies do not see investments abroad as a reason not to invest more in Germany. On the other side, larger companies from Western Germany stress this mechanism of relocating assets and in consequence production capacities from Germany to other countries because of growing cost differen-tials. Substituting domestic investments with international investments is less relevant if the international activities are planned to explore new markets and to increase international sales. Only 17 per cent of all companies say this is a relevant reason to limit investments in Germany.
While labour costs have been an issue for the German competitiveness for many years, availability of qualified personnel will become another challenge due to the demographic development. A knowledge-intensive and highly pro-ductive economy depends on people with adequate qualifications.8 Without skilled personnel, there cannot be additional investments as human resources and physical capital often are not substitutes, but complementary production factors. A third of the companies that took part in the survey agreed that a lack of qualified employees has become a serious obstacle for investments. Only 25 per cent have no problems with this issue. Companies in Eastern Germany and small and medium enterprises are especially affected by a beginning short-age of qualified labour. The service sector and the construction industries have more problems than the manufacturing sector.
Undesirable developments on the financial markets provoked the global financial and economic crisis in 2007. Difficulties in the banking industry aggravated the existing public debt problems, what in turn stressed the finan-cial markets again.9 The effects on the financial ability to invest for companies outside the financial sector are very different in various European countries. In Germany, only 15 per cent mention financing difficulties as an impor-tant reason to limit investments. 50 per cent do not have any problems with
8 Geis/Plünnecke (2012).9 Hüther (2014b).
Hubertus Bardt 106
financing interesting investments. Out of 13 possible explanations, this one is the least relevant.
3. Policy options
The results of the survey show that the most important obstacle for addi-tional investments is the uncertainty regarding the global economic develop-ment in the forthcoming years. The conflict between Russia and the Ukraine has increased this uncertainty in 2014. However, the global economic frame-work faces various structural challenges, especially after the financial and economic crises. This is particularly true for Europe and some emerging econ-omies. Each state must find its own way to meet the challenges. Some of the European countries have implemented structural reforms and are on their way to a more sustainable financial and economic situation.
The unstable and hesitant investment activity in Germany does not only reflect the volatile global environment, but is also a consequence of insuffi-cient and unreliable domestic investment conditions. Instead of drafting huge expenses for governmental investment programmes, supply side conditions for economic activities should be improved. This would increase the competi-tiveness of German companies, incentivise additional investments and create new business opportunities for a variety of companies within the whole value chain – in Germany and in other European countries. Three groups of meas-ures should be addressed to improve investment conditions:
3.1. Controlling Costs
In addition to disappointing prospects on the world markets, companies see high costs in Germany as the most important investment obstacle. This issue deserves a high priority on the political agenda. In addition to Germany’s tradition as a high cost country, the cost level has risen in recent years when compared with competing business locations.
– Energy Costs: Levies on energy and particularly electricity are especially high in Germany. The levy to support renewable energies alone is higher than some electricity prices for the manufacturing sector in the US. Exemp-tions for certain energy-intensive companies are limited to a few years. This makes long-term investment in energy-intensive businesses difficult. For years there was hardly any positive net investment of energy-intensive
Barriers for more investments in Germany 107
industries. Reducing the cost disadvantage is as important as creating reli-ability regarding the investment conditions.
– Labour Costs: For several years, an employment-oriented wage policy has supported a long-lasting increase of employment. But since the financial crisis, labour costs in Germany have risen much faster than productivity. Trade unions and employers’ organisations should take the effects of their agreements on future employment opportunities into account. Reducing income taxes (cold progression) can be political support.
– Taxes and Levies: The successful budget consolidation in Germany is mainly due to the record tax revenues.10 There have hardly been any budget cuts. On the contrary, new social benefits have been introduced. This trend has to be stopped in order to keep public budgets balanced. A reintroduction of degressive depreciation would stimulate equipment investments and would better reflect the real losses in value. This measure would cost the public budgets about 5 billion Euros each year.
3.2. Preserving Flexibility
According to the survey of the Cologne Institute for Economic Research among 2,900 companies, regulation and bureaucracy are confirmed as impor-tant investment obstacles. More and more companies work in a volatile and international environment and depend on a high degree of flexibility in open markets. While the firms have to keep themselves as flexible as possible, politi-cal decision makers should work on reducing the bureaucratic burden wher-ever possible.
– Bureaucracy: Implementing an efficient bureaucracy with minimal costs (savings in money and time) for private companies is an ongoing challenge. The government’s plan to cancel one bureaucratic rule for every one new introduced is a step to keep the level of burden constant. A new reduction target for bureaucracy costs would be an important second step.
– Regulation: The plans of the grand coalition and the federal government imply additional restrictions for companies like new limitations for service contracts, limits for temporary work or new anti-stress rules. Other regula-tions like the minimum wage imply new costly duties for documentation.
– Free Trade: A success of the Transatlantic Trade and Investment Partner-ship (TTIP) would reduce obstacles for export, but also for investments of
10 IW-Forschungsgruppe Konjunktur (2014).

Hubertus Bardt 108
Europeans in the US and Americans in Europe.11 Fair and reliable rules for investment that are protected against discretionary expropriation will improve investment activities in Germany and strengthen the international division of labour.
3.3. Laying the Foundation for Future Growth
Economic growth does not arise at the touch of a button. Investors need the clear perspective that business in Germany is profitable. The future growth perspective of the German economy also depends on the success in keeping and developing its leading position on the way to a digitalised manufacturing sec-tor (Industrie 4.0). Increased complexity of cooperation between companies, further differentiation in the division of labour and growing requirements of synchronised processes contain huge opportunities for industrial production in Germany – with its positive effects on partners in Germany and abroad. To strengthen this perspective, foundations for medium-term growth perspectives must be reinforced.
– Infrastructure: Companies in Germany can base their investments on a well-developed infrastructure. To maintain the high standards, constant and efficient reinvestments in streets and railways are necessary. Political prioritisation is needed to organise adequate budgets. To create the infra-structure for Industrie 4.0, broadband access must be improved. Additional regulation like net neutrality must not obstruct the new business models that depend on secure data connections.
– Qualified personnel: A growing shortage of skilled personnel can become a serious investment and growth limit in the future. Modern equipment can-not produce value added without people with matching qualifications. Voca-tional training and university education, especially in technical and science subjects12 are an essential investment in the future economic development.
– Research: Innovation and research are keys to develop tomorrow’s tech-nologies and production processes like Industrie 4.0. Tax incentives for research and research bonuses can strengthen the innovative capacity of the manufacturing sector and related industries.
11 Hüther (2014b), Kolev (2014).12 Anger et al. (2014).

Barriers for more investments in Germany 109
SUMMARY
Since the beginning of the global economic crisis, investment in capital equipment of German companies has developed rather moderately. The capital stock that con-sists of machinery and equipment has not been growing since 2008. This has been the longest period without capital formation in this field since 1991.A survey among 2,900 private companies conducted by the Cologne Institute for Eco-nomic Research in autumn 2014 provides interesting insights about current obsta-cles for more investments in Germany. The main reason to withhold investments is uncertainty about the future economic development in Europe and on the global level. But the framework for investments in Germany has become less favourable as well: About half of the companies in the survey complained about the high level of energy costs compared to other industrialised countries. Early retirement, mini-mum wage with extensive duties for documentation and the plan to restrict tempo-rary employment lead to additional costs for the companies and reduce the potential return on investment.
Key words: investments, German economy, obstacles, enterprise survey
References
Aiyar, S., Duval, R., Puy, D., Wu, Y., Zhang, L. (2013): Growth Slowdowns and the Middle-Income Trap, IMF Working Paper, WP/13/71, Washington D. C.
Alm, B., Meurers, M. (2015): Wesentliche Fakten zur “Investitionsschwäche” in Deutschland, in: Wirtschaftsdienst, no. 1, p. 24–31.
Anger, C., Koppel, O., Plünnecke, A. (2014): MINT und das Geschäftsmodell Deutsch-land, IW-Positionen, no. 67, Cologne.
Bardt, H. (2014): Erhöhung der EEG-Kosten als Investitionshemmnis für strominten-sive Unternehmen, IW policy paper, no. 3/2014, Cologne.
Bardt, H. et al. (2014): Die Infrastruktur in Deutschland, Zwischen Standortvorteil und Investitionsbedarf, IW-Analysen, no. 95, Cologne.
Bardt, H., Grömling, M., Hüther, M. (2015): Schwache Unternehmensinvestitionen in Deutschland? Diagnose und Therapie, IW policy paper, no. 4/2015, Cologne.
DIW – Deutsches Institut für Wirtschaftsforschung, HRI – Handelsblatt Research Institute (2014): Private Investitionen in Deutschland, Berlin, Düsseldorf.
Eichengreen, B., Park, D., Shin, K. (2013): Growth Slowdowns Redux: New Evidence on the Middle-Income Trap, NBER Working Paper, Nr. 18673, Cambridge MA.
Hubertus Bardt 110
Geis, W., Plünnecke, A. (2012): Bildung stärkt Wachstum und Wohlstand, in: Insti-tut der deutschen Wirtschaft Köln, Wirtschaftswachstum?! Warum wir wachsen sollten und warum wir wachsen können, Cologne, p. 189–203.
Hüther, M. (2014a): Eine Veränderte Kulisse globaler Risiken, in: Wirtschaftsdienst, no. 12, p. 854–858.
Hüther, M. (2014b): Niedrige Zinsen – gesamtwirtschaftliche Ursachen und Folgen, in: Wirtschaftsdienst, no. 9, p. 611–630.
IW-Forschungsgruppe Konjunktur (2014): Die deutsche Wirtschaft im Stop-and--go-Modus – IW-Konjunkturprognose Herbst 2014, in: IW-Trends, Vol. 41, no. 3, p. 21–71.
Kolev, G. (2014): TTIP – Mehr als Handelsliberalisierung, IW policy paper, Nr. 11, Cologne.
Statistisches Bundesamt (2014): Volkswirtschaftliche Gesamtrechnungen, Investitio-nen, Wiesbaden.
Witold MAŁACHOWSKI*
ROLA PRZEMYSŁU W GOSPODARCE NIEMIEC I POLSKI PO ROZSZERZENIU UE NA WSCHÓD
Wprowadzenie
Przemysł nadal wywiera istotny wpływ na całokształt gospodarki. Wynika to z tego, że jest on producentem dóbr inwestycyjnych dla wszystkich działów gospodarki i zaspokaja systematycznie rosnące potrzeby konsumpcji material-nej społeczeństwa. W strukturze wytwarzanego produktu krajowego brutto (PKB) rola przemysłu w państwach wysokorozwiniętych nie jest dominująca, zdecydowanie większą rolę odgrywają usługi. W przemyśle dokonują się jednak istotne zmiany. Przystąpienie Polski do Unii Europejskiej miało istotne znacze-nie dla rozwoju polskiej gospodarki, w tym dla polskiego przemysłu. Niemcy były zwolennikiem rozszerzenia Unii Europejskiej o 10 kolejnych państw, w tym o Polskę. Celem tego opracowanie jest ukazanie roli przemysłu w gospodarce Niemiec i Polski w latach 2004–2014, czyli od chwili uzyskania przez Polskę członkostwa w Unii Europejskiej. Szczególną uwagę zwrócono na strukturę wytwarzanego produktu krajowego. W tej pracy zostanie podjęta próba okre-ślenia wpływu członkostwa w Unii Europejskiej na przemysł w obu państwach. Punktem wyjścia analizy jest stan przemysłu w 2004 roku, następnie tendencje w dynamice produkcji w latach 2004–2014 oraz zmiany w strukturze przemy-słu. Czy członkostwo w Unii Europejskiej przyczyniło się do rozwoju przemy-słu, jego unowocześnienia i poprawy konkurencyjności? Jakie jest znaczenie strategii „Europa 2020”? To pytania badawcze, które powinny być postawione w kontekście wybranego tematu. Wśród stosowanych metod badawczych szcze-gólną rolę odgrywała metoda analizy porównawczej, a poza tym metoda kry-tycznej analizy literatury przedmiotu i analizy danych statystycznych
* emerytowany profesor Szkoły Głównej Handlowej w Warszawie, * e-mail: [email protected]
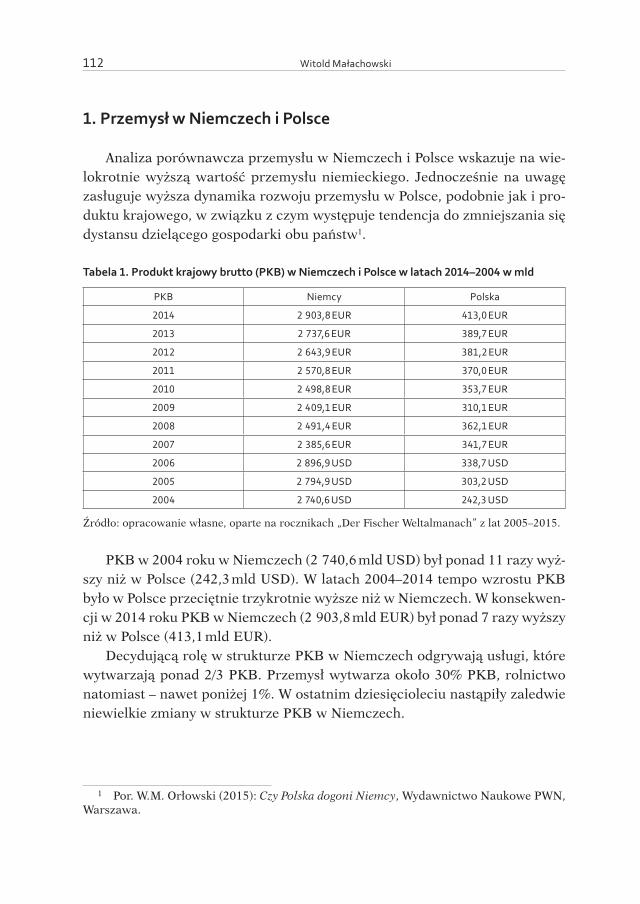
Witold Małachowski 112
1. Przemysł w Niemczech i Polsce
Analiza porównawcza przemysłu w Niemczech i Polsce wskazuje na wie-lokrotnie wyższą wartość przemysłu niemieckiego. Jednocześnie na uwagę zasługuje wyższa dynamika rozwoju przemysłu w Polsce, podobnie jak i pro-duktu krajowego, w związku z czym występuje tendencja do zmniejszania się dystansu dzielącego gospodarki obu państw1.
Tabela 1. Produkt krajowy brutto (PKB) w Niemczech i Polsce w latach 2014–2004 w mld
PKB Niemcy Polska
2014 2 903,8 EUR 413,0 EUR
2013 2 737,6 EUR 389,7 EUR
2012 2 643,9 EUR 381,2 EUR
2011 2 570,8 EUR 370,0 EUR
2010 2 498,8 EUR 353,7 EUR
2009 2 409,1 EUR 310,1 EUR
2008 2 491,4 EUR 362,1 EUR
2007 2 385,6 EUR 341,7 EUR
2006 2 896,9 USD 338,7 USD
2005 2 794,9 USD 303,2 USD
2004 2 740,6 USD 242,3 USD
Źródło: opracowanie własne, oparte na rocznikach „Der Fischer Weltalmanach” z lat 2005–2015.
PKB w 2004 roku w Niemczech (2 740,6 mld USD) był ponad 11 razy wyż-szy niż w Polsce (242,3 mld USD). W latach 2004–2014 tempo wzrostu PKB było w Polsce przeciętnie trzykrotnie wyższe niż w Niemczech. W konsekwen-cji w 2014 roku PKB w Niemczech (2 903,8 mld EUR) był ponad 7 razy wyższy niż w Polsce (413,1 mld EUR).
Decydującą rolę w strukturze PKB w Niemczech odgrywają usługi, które wytwarzają ponad 2/3 PKB. Przemysł wytwarza około 30% PKB, rolnictwo natomiast – nawet poniżej 1%. W ostatnim dziesięcioleciu nastąpiły zaledwie niewielkie zmiany w strukturze PKB w Niemczech.
1 Por. W. M. Orłowski (2015): Czy Polska dogoni Niemcy, Wydawnictwo Naukowe PWN, Warszawa.
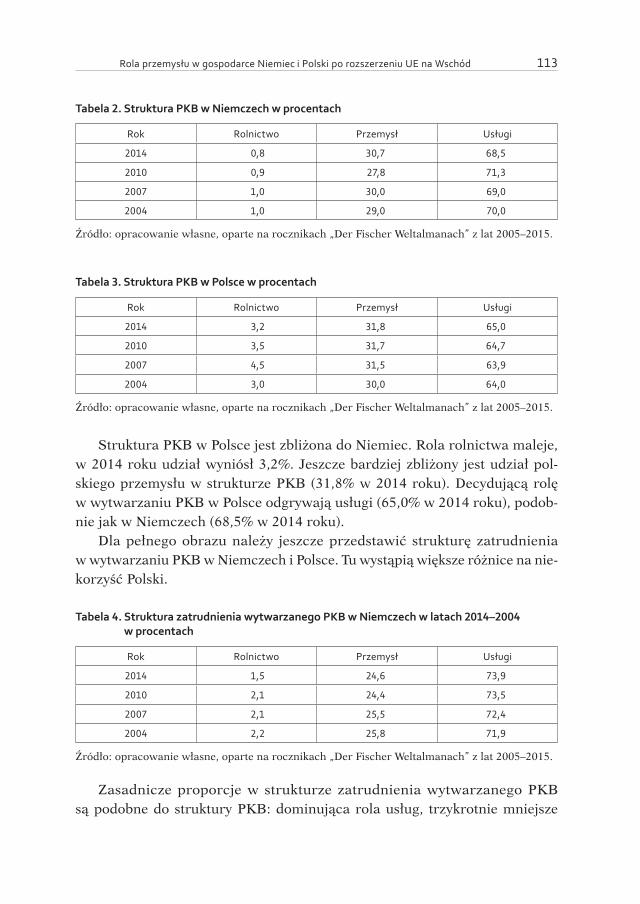
Rola przemysłu w gospodarce Niemiec i Polski po rozszerzeniu UE na Wschód 113
Tabela 2. Struktura PKB w Niemczech w procentach
Rok Rolnictwo Przemysł Usługi
2014 0,8 30,7 68,5
2010 0,9 27,8 71,3
2007 1,0 30,0 69,0
2004 1,0 29,0 70,0
Źródło: opracowanie własne, oparte na rocznikach „Der Fischer Weltalmanach” z lat 2005–2015.
Tabela 3. Struktura PKB w Polsce w procentach
Rok Rolnictwo Przemysł Usługi
2014 3,2 31,8 65,0
2010 3,5 31,7 64,7
2007 4,5 31,5 63,9
2004 3,0 30,0 64,0
Źródło: opracowanie własne, oparte na rocznikach „Der Fischer Weltalmanach” z lat 2005–2015.
Struktura PKB w Polsce jest zbliżona do Niemiec. Rola rolnictwa maleje, w 2014 roku udział wyniósł 3,2%. Jeszcze bardziej zbliżony jest udział pol-skiego przemysłu w strukturze PKB (31,8% w 2014 roku). Decydującą rolę w wytwarzaniu PKB w Polsce odgrywają usługi (65,0% w 2014 roku), podob-nie jak w Niemczech (68,5% w 2014 roku).
Dla pełnego obrazu należy jeszcze przedstawić strukturę zatrudnienia w wytwarzaniu PKB w Niemczech i Polsce. Tu wystąpią większe różnice na nie-korzyść Polski.
Tabela 4. Struktura zatrudnienia wytwarzanego PKB w Niemczech w latach 2014–2004 w procentach
Rok Rolnictwo Przemysł Usługi
2014 1,5 24,6 73,9
2010 2,1 24,4 73,5
2007 2,1 25,5 72,4
2004 2,2 25,8 71,9
Źródło: opracowanie własne, oparte na rocznikach „Der Fischer Weltalmanach” z lat 2005–2015.
Zasadnicze proporcje w strukturze zatrudnienia wytwarzanego PKB są podobne do struktury PKB: dominująca rola usług, trzykrotnie mniejsze

Witold Małachowski 114
w stosunku do usług zatrudnienie w przemyśle oraz zbliżające się do 1% zatrud-nienie w rolnictwie. Jednak najwyższa wydajność pracy jest w przemyśle.
Tabela 5. Struktura zatrudnienia wytwarzanego PKB w Polsce w latach 2014–2004 w procentach
Rok Rolnictwo Przemysł Usługi
2014 12,6 30,1 57,3
2010 10,1 34,3 55,5
2007 14,7 30,6 54,6
2004 18,4 28,6 53,0
Źródło: opracowanie własne, oparte na rocznikach „Der Fischer Weltalmanach” z lat 2005–2015.
Charakterystyczne jest przede wszystkim zatrudnienie w rolnictwie, którego wynik jest dwucyfrowy. Wprawdzie zatrudnienie w rolnictwie zmalało z 18,4% w 2004 roku do 12,6% w 2014 roku, jest jednak czterokrotnie wyższe w sto-sunku do udziału rolnictwa w strukturze PKB w Polsce (3,2% w 2014 roku) i blisko dziesięciokrotnie wyższe w stosunku do zatrudnienia w rolnictwie w Niemczech wytwarzanego PKB (1,5% w 2014 roku). Świadczy to o niskiej wydajności pracy w polskim rolnictwie.
Zatrudnienie w przemyśle w Polsce (30,1% w 2014 roku) jest zbliżone do wytwarzanego przez przemysł PKB (31,8% w 2014 roku).
Bardzo ważnym wskaźnikiem makroekonomicznym w niniejszej analizie porównawczej jest inflacja. Zarówno Niemcy, jak i Polska charakteryzują się niskim, a nawet bardzo niskim wskaźnikiem inflacji, co należy ocenić pozy-tywnie jako czynnik sprzyjający rozwojowi przemysłu, zachęcający do inwe-stowania krajowych i zagranicznych inwestorów.
Tabela 6. Inflacja w Niemczech i Polsce w latach 2014–2004 w procentach
Rok Niemcy Polska
2014 0,9 0,1
2010 1,1 2,7
2007 2,2 2,6
2004 2,0 0,9
Źródło: opracowanie własne, oparte na rocznikach „Der Fischer Weltalmanach” z lat 2005–2015.
Inflacja w Polsce w niektórych latach była nawet niższa niż w Niemczech: w 2004 roku w Polsce – 0,9%, w Niemczech – 2,0%; w 2014 roku w Polsce
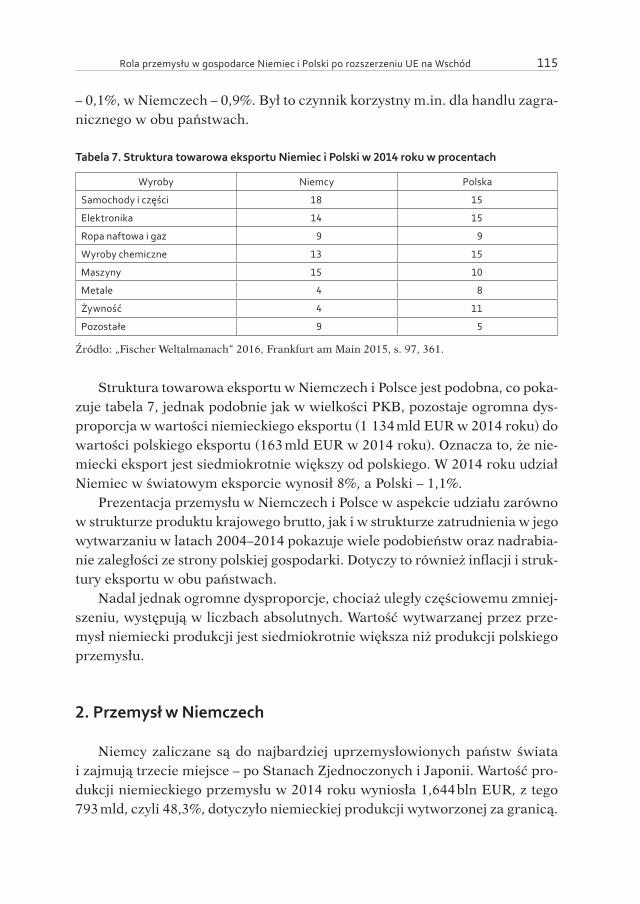
Rola przemysłu w gospodarce Niemiec i Polski po rozszerzeniu UE na Wschód 115
– 0,1%, w Niemczech – 0,9%. Był to czynnik korzystny m.in. dla handlu zagra-nicznego w obu państwach.
Tabela 7. Struktura towarowa eksportu Niemiec i Polski w 2014 roku w procentach
Wyroby Niemcy Polska
Samochody i części 18 15
Elektronika 14 15
Ropa naftowa i gaz 9 9
Wyroby chemiczne 13 15
Maszyny 15 10
Metale 4 8
Żywność 4 11
Pozostałe 9 5
Źródło: „Fischer Weltalmanach“ 2016, Frankfurt am Main 2015, s. 97, 361.
Struktura towarowa eksportu w Niemczech i Polsce jest podobna, co poka-zuje tabela 7, jednak podobnie jak w wielkości PKB, pozostaje ogromna dys-proporcja w wartości niemieckiego eksportu (1 134 mld EUR w 2014 roku) do wartości polskiego eksportu (163 mld EUR w 2014 roku). Oznacza to, że nie-miecki eksport jest siedmiokrotnie większy od polskiego. W 2014 roku udział Niemiec w światowym eksporcie wynosił 8%, a Polski – 1,1%.
Prezentacja przemysłu w Niemczech i Polsce w aspekcie udziału zarówno w strukturze produktu krajowego brutto, jak i w strukturze zatrudnienia w jego wytwarzaniu w latach 2004–2014 pokazuje wiele podobieństw oraz nadrabia-nie zaległości ze strony polskiej gospodarki. Dotyczy to również inflacji i struk-tury eksportu w obu państwach.
Nadal jednak ogromne dysproporcje, chociaż uległy częściowemu zmniej-szeniu, występują w liczbach absolutnych. Wartość wytwarzanej przez prze-mysł niemiecki produkcji jest siedmiokrotnie większa niż produkcji polskiego przemysłu.
2. Przemysł w Niemczech
Niemcy zaliczane są do najbardziej uprzemysłowionych państw świata i zajmują trzecie miejsce – po Stanach Zjednoczonych i Japonii. Wartość pro-dukcji niemieckiego przemysłu w 2014 roku wyniosła 1,644 bln EUR, z tego 793 mld, czyli 48,3%, dotyczyło niemieckiej produkcji wytworzonej za granicą.
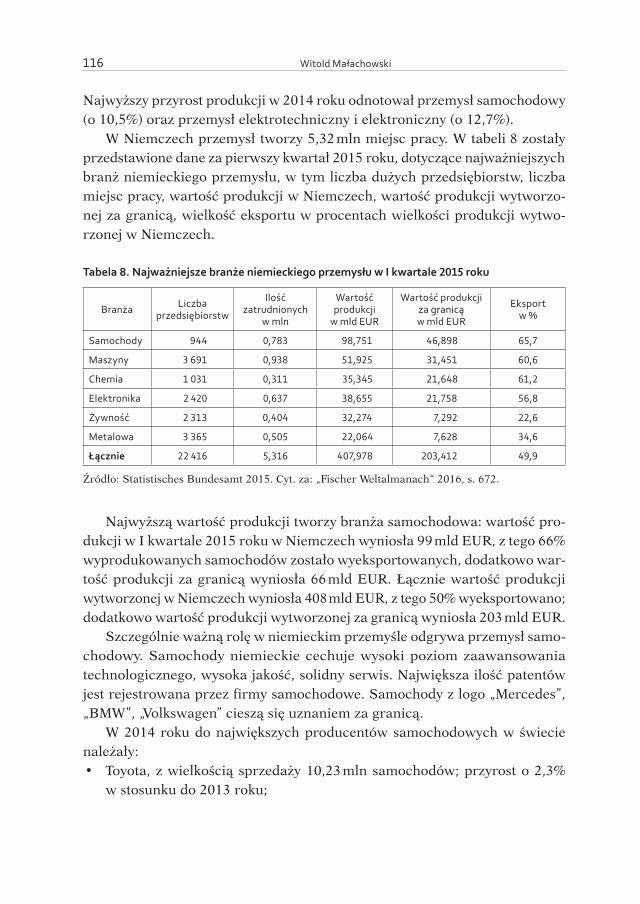
Witold Małachowski 116
Najwyższy przyrost produkcji w 2014 roku odnotował przemysł samochodowy (o 10,5%) oraz przemysł elektrotechniczny i elektroniczny (o 12,7%).
W Niemczech przemysł tworzy 5,32 mln miejsc pracy. W tabeli 8 zostały przedstawione dane za pierwszy kwartał 2015 roku, dotyczące najważniejszych branż niemieckiego przemysłu, w tym liczba dużych przedsiębiorstw, liczba miejsc pracy, wartość produkcji w Niemczech, wartość produkcji wytworzo-nej za granicą, wielkość eksportu w procentach wielkości produkcji wytwo-rzonej w Niemczech.
Tabela 8. Najważniejsze branże niemieckiego przemysłu w I kwartale 2015 roku
Branża Liczbaprzedsiębiorstw
Ilośćzatrudnionych
w mln
Wartośćprodukcji
w mld EUR
Wartość produkcji za granicą w mld EUR
Eksportw %
Samochody 944 0,783 98,751 46,898 65,7
Maszyny 3 691 0,938 51,925 31,451 60,6
Chemia 1 031 0,311 35,345 21,648 61,2
Elektronika 2 420 0,637 38,655 21,758 56,8
Żywność 2 313 0,404 32,274 7,292 22,6
Metalowa 3 365 0,505 22,064 7,628 34,6
Łącznie 22 416 5,316 407,978 203,412 49,9
Źródło: Statistisches Bundesamt 2015. Cyt. za: „Fischer Weltalmanach“ 2016, s. 672.
Najwyższą wartość produkcji tworzy branża samochodowa: wartość pro-dukcji w I kwartale 2015 roku w Niemczech wyniosła 99 mld EUR, z tego 66% wyprodukowanych samochodów zostało wyeksportowanych, dodatkowo war-tość produkcji za granicą wyniosła 66 mld EUR. Łącznie wartość produkcji wytworzonej w Niemczech wyniosła 408 mld EUR, z tego 50% wyeksportowano; dodatkowo wartość produkcji wytworzonej za granicą wyniosła 203 mld EUR.
Szczególnie ważną rolę w niemieckim przemyśle odgrywa przemysł samo-chodowy. Samochody niemieckie cechuje wysoki poziom zaawansowania technologicznego, wysoka jakość, solidny serwis. Największa ilość patentów jest rejestrowana przez firmy samochodowe. Samochody z logo „Mercedes”, „BMW”, „Volkswagen” cieszą się uznaniem za granicą.
W 2014 roku do największych producentów samochodowych w świecie należały:• Toyota, z wielkością sprzedaży 10,23 mln samochodów; przyrost o 2,3%
w stosunku do 2013 roku;
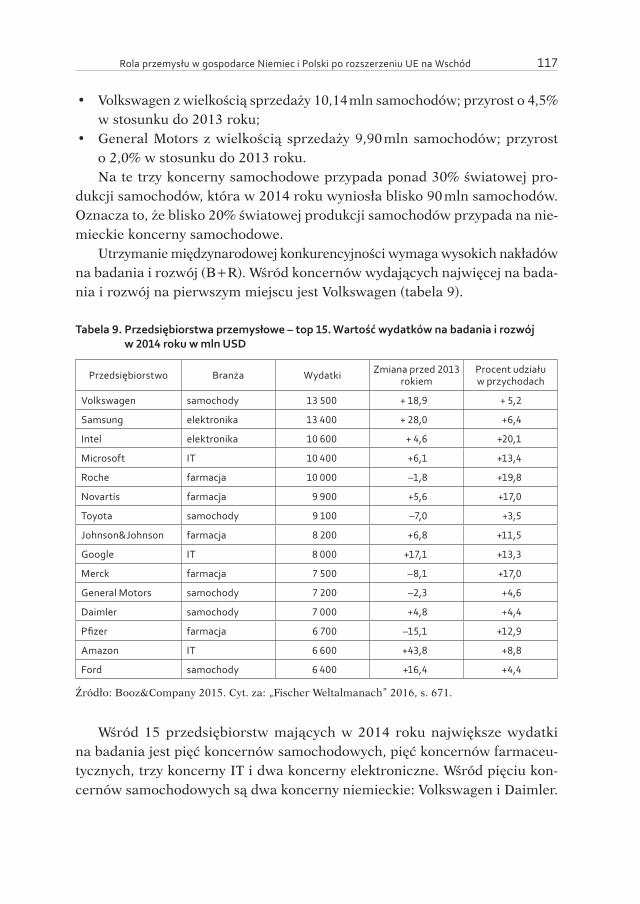
Rola przemysłu w gospodarce Niemiec i Polski po rozszerzeniu UE na Wschód 117
• Volkswagen z wielkością sprzedaży 10,14 mln samochodów; przyrost o 4,5% w stosunku do 2013 roku;
• General Motors z wielkością sprzedaży 9,90 mln samochodów; przyrost o 2,0% w stosunku do 2013 roku.Na te trzy koncerny samochodowe przypada ponad 30% światowej pro-
dukcji samochodów, która w 2014 roku wyniosła blisko 90 mln samochodów. Oznacza to, że blisko 20% światowej produkcji samochodów przypada na nie-mieckie koncerny samochodowe.
Utrzymanie międzynarodowej konkurencyjności wymaga wysokich nakładów na badania i rozwój (B+R). Wśród koncernów wydających najwięcej na bada-nia i rozwój na pierwszym miejscu jest Volkswagen (tabela 9).
Tabela 9. Przedsiębiorstwa przemysłowe – top 15. Wartość wydatków na badania i rozwój w 2014 roku w mln USD
Przedsiębiorstwo Branża Wydatki Zmiana przed 2013 rokiem
Procent udziałuw przychodach
Volkswagen samochody 13 500 + 18,9 + 5,2
Samsung elektronika 13 400 + 28,0 +6,4
Intel elektronika 10 600 + 4,6 +20,1
Microsoft IT 10 400 +6,1 +13,4
Roche farmacja 10 000 –1,8 +19,8
Novartis farmacja 9 900 +5,6 +17,0
Toyota samochody 9 100 –7,0 +3,5
Johnson&Johnson farmacja 8 200 +6,8 +11,5
Google IT 8 000 +17,1 +13,3
Merck farmacja 7 500 –8,1 +17,0
General Motors samochody 7 200 –2,3 +4,6
Daimler samochody 7 000 +4,8 +4,4
Pfizer farmacja 6 700 –15,1 +12,9
Amazon IT 6 600 +43,8 +8,8
Ford samochody 6 400 +16,4 +4,4
Źródło: Booz&Company 2015. Cyt. za: „Fischer Weltalmanach” 2016, s. 671.
Wśród 15 przedsiębiorstw mających w 2014 roku największe wydatki na badania jest pięć koncernów samochodowych, pięć koncernów farmaceu-tycznych, trzy koncerny IT i dwa koncerny elektroniczne. Wśród pięciu kon-cernów samochodowych są dwa koncerny niemieckie: Volkswagen i Daimler.

Witold Małachowski 118
Warto zwrócić uwagę nie tylko na wartość wydatków na badania i rozwój, ale również na udział procentowy tych wydatków w uzyskanych przychodach, gdzie osiągają one nawet poziom 20%.
Wysoki poziom nakładów i rozwój zarówno budżetu państwa, jak i przed-siębiorstw jest istotnym czynnikiem wspierającym innowacyjność przemysłu niemieckiego i jego wysokiej międzynarodowej konkurencyjności
3. Przemysł w Polsce
Przystąpienie Polski do Unii Europejskiej przyniosło pozytywne zmiany w sytuacji gospodarczej państwa, w tym w polskim przemyśle. Najszybciej roz-wijały się te działy przemysłu, w których dominowała sprzedaż wyrobów kon-trahentom zagranicznym. Wzrost produkcji osiągnięto w warunkach znacznej poprawy wydajności pracy. Z punktu widzenia konkurencyjności istotne były przede wszystkim przemiany w strukturze produkcji przemysłowej oceniane przez pryzmat wzrostu produkcji wyrobów nowych i zmodernizowanych. Stało się to m.in. dzięki zwiększeniu nakładów na działalność innowacyjną2.
W stosunku do przemian w strukturze produkcji sprzedanej przemysłu nastą-piły korzystne zmiany w strukturze obrotów handlu zagranicznego. W struktu-rze eksportu zwiększył się udział wyrobów wysoko przetworzonych, będących nośnikami postępu technicznego i spełniających wymagania odbiorców na ryn-kach państw rozwiniętych. Korzystne zmiany wystąpiły również w strukturze importu. Zwiększył się udział wyrobów wysoko przetworzonych, w tym głów-nie maszyn i urządzeń3.
Przystąpienie Polski do Unii Europejskiej przyczyniło się do poprawy poli-tycznego i gospodarczego wizerunku, podniesienia tempa wzrostu gospodar-czego, ożywienia polskiego eksportu. Konsumenci odczuli z pewnością wzrost cen towarów, przedsiębiorcy jednak mogli docenić ułatwienia w wymianie towarowej z innymi państwami oraz poprawę wyników ekonomicznych swoich firm. Doświadczyli również silnego impulsu modernizacyjnego oraz obniżenia kosztów prowadzenia działalności gospodarczej, szczególnie w przedsiębior-stwach eksportowych i branży transportowej.
2 GUS (2015): Polska w Unii Europejskiej 2015, Warszawa, s. 11.3 Ibidem, s. 12.

Rola przemysłu w gospodarce Niemiec i Polski po rozszerzeniu UE na Wschód 119
Od momentu przystąpienia Polski do Unii Europejskiej w państwie roz-począł się dynamiczny wzrost produkcji4. Poniżej zostanie dokonana szczegó-łowa analiza wzrostu produkcji przemysłowej w Polsce na tle innych państw Unii Europejskiej.
W latach 2004–2014 skumulowany wzrost produkcji przemysłowej w Pol-sce wyniósł 61%. W tym samym okresie w UE produkcja obniżyła się ogółem o 1,2%. Niemcy stanowiły wyjątek wśród dużych gospodarek UE, a wzrost nie-mieckiej produkcji przemysłowej wyniósł ponad 12%5.
Na dynamikę produkcji w Polsce wpływał m.in. ponad dwukrotny wzrost w zakresie produkcji urządzeń elektrycznych, komputerów, wyrobów elektro-nicznych i optycznych, a także wyrobów z metali6.
W gospodarce, w tym także i w przemyśle, dokonywane były w latach 2004–2014 dalsze przekształcenia własnościowe. W ich efekcie następowały sukcesywne zmiany zarówno w liczebności podmiotów gospodarczych, jak i w ich strukturze własnościowej. W 2014 roku działało w przemyśle 398,7 tys. podmiotów gospodarczych. Oznacza to, że liczba podmiotów gospodarczych w stosunku do 2013 roku uległa zwiększeniu o blisko 6 tysięcy7.
Sektor prywatny w polskim przemyśle zdecydowanie dominował już w 2004 roku. Przypadało na niego 82% produkcji sprzedanej. W 2014 roku rola sektora prywatnego nadal się zwiększała. Przypadało na niego 88,6% produk-cji sprzedanej. Pozostało zatem jedynie 11,4% produkcji sprzedanej w sektorze publicznym, m.in. znaczna część przemysłu energetycznego.
Zdecydowana większość podmiotów przemysłowych funkcjonowała w sek-cji przemysłu przetwórczego (98,6%), a wśród nich najwięcej jednostek spe-cjalizowało się w produkcji metalowych wyrobów gotowych (ponad 52 tys.). Nieco mniej podmiotów działało w produkcji odzieży i futrzarstwie, produkcji mebli i pozostałej działalności produkcyjnej oraz w produkcji drewna i wyro-bów z drewna. Obok działów grupujących po kilkadziesiąt tysięcy jednostek
4 Zgodnie z definicją GUS, dynamika produkcji przemysłowej jest indeksem mierzącym zmiany wartości produkcji sprzedanej w cenach bazowych. Jest to przychód ze sprzedaży własnych wyrobów, robót i usług w cenach realizacji (bez podatku od towarów i usług), pomniejszony o podatek akcyzowy, a powiększony o dotacje, otrzymane do produktu pod-miotów działających w działach: przetwórstwo przemysłowe, górnictwo i kopalnictwo, oraz dotacje o wytwarzaniu i zaopatrywaniu w energię elektryczna, gaz, wodę, zatrudniających co najmniej 10 osób. Jest to jeden z najważniejszych wskaźników gospodarczych ukazują-cych rozwój gospodarki.
5 GUS (2015): Polska w Unii…, op.cit., s. 38.6 Ibidem, s. 40.7 GUS (2015): Rocznik statystyczny Polski 2015, Warszawa, s. 408.

Witold Małachowski 120
w przetwórstwie przemysłowym występują również takie, w ramach których działa kilkadziesiąt lub nawet kilkaset firm, np. produkcja wyrobów tytonio-wych (29). Pod względem liczby pracujących dominują jednostki, w których liczba zatrudnionych nie przekracza 9 osób. Ich udział w ogólnej liczbie pod-miotów gospodarczych stanowił 88,9%. Aż 99,6% takich jednostek funkcjonuje w sektorze prywatnym8.
Zasadniczy wpływ na rozwój polskiego przemysłu po przystąpieniu Polski do Unii Europejskiej miały inwestycje, a zwłaszcza bezpośrednie inwestycje zagra-niczne (BIZ), w tym inwestycje o charakterze innowacyjnym. Nakłady inwe-stycyjne w przemyśle stanowią większą część nakładów ogółem. W 2004 roku ich udział wyniósł 58,7%. Decydują więc w dużej mierze o kształtowaniu się nakładów inwestycyjnych w gospodarce. W ramach przemysłu największą rolę odgrywa sekcja przetwórstwa przemysłowego Dominuje ona m.in. pod względem liczby podmiotów, zatrudnienia, produkcji sprzedanej. W 2004 roku nakłady podmiotów przetwórstwa przemysłowego stanowiły 71,1% ogółu nakładów9.
W latach 2004–2014 szczególne znaczenie miał rozwój technologii infor-macyjno-telekomunikacyjnych, które wpływają na dynamikę i kierunki roz-woju działalności przedsiębiorstw. W 2014 roku w Unii Europejskiej prawie wszystkie przedsiębiorstwa posiadały dostęp do Internetu i w większości z nich wykorzystywano technologię szerokopasmową (90% przedsiębiorstw).
Coraz większą popularnością cieszy się wśród przedsiębiorców wykorzysty-wanie technologii mobilnych, zapewniających swobodny dostęp do sieci glo-balnej. W 2014 roku w Polsce odsetek przedsiębiorstw posiadających mobilny dostęp do Internetu wyniósł 48% (wobec 30% w 2010 roku), podczas gdy prze-ciętna dla Unii Europejskiej to 62%. Pomimo systematycznej poprawy w tym zakresie, nadal obserwuje się istotne zróżnicowanie tego wskaźnika wśród państw członkowskich UE10.
Zasadniczy wpływ na innowacyjny charakter inwestycji w polskim prze-myśle miały zagraniczne inwestycje bezpośrednie, których wartość w latach 2004–2014 zwiększyła się prawie trzykrotnie. Całkowita wartość bezpośred-nich inwestycji zagranicznych na koniec 2014 roku wyniosła 163,6 mld euro.
8 Ministerstwo Gospodarki (2014): Raport o stanie gospodarki. Polska 2014,, Warszawa, s. 52.
9 Według definicji GUS, są to nakłady finansowe lub rzeczowe, celem których jest stworzenie nowych środków trwałych lub ulepszenie (przebudowa, rozbudowa, rekon-strukcja lub modernizacja) już istniejących obiektów majątku trwałego, a także nakłady na tzw. pierwsze wyposażenie inwestycji. Nakłady inwestycyjne dzielą się na nakłady na środki trwałe oraz pozostałe nakłady.
10 Ibidem, s. 120.
Rola przemysłu w gospodarce Niemiec i Polski po rozszerzeniu UE na Wschód 121
Składały się na nie zobowiązania z tytułu udziałów kapitałowych i reinwesto-wanych zysków (126,3 mld euro) oraz zobowiązania z tytułu pozostałego kapi-tału (35,2 mld euro).
Najwyższe wartości zagranicznych inwestycji bezpośrednich napływających do Polski odnotowano od inwestorów pochodzących z Niemiec – 28,5 mld euro, Niderlandów – 26,9 mld euro i Francji – 19,7 mld euro11.
W Polsce liczba podmiotów z udziałem kapitału zagranicznego wyniosła 26547 jednostek. W 2014 roku powstały 1863 podmioty z kapitałem zagranicz-nym wobec 1763 w 2013 roku. Najwyższy udział kapitału zagranicznego tych podmiotów odnotowano w jednostkach prowadzących działalność z zakresu produkcji przemysłowej (58,4). Na koniec 2014 roku w podmiotach z udziałem kapitału zagranicznego pracowało 1,8395 mln osób, o 3,6% więcej w porów-naniu z 2013 rokiem. Najwięcej osób pracowało w podmiotach zajmujących się produkcją przemysłową – 70,6% ogólnej liczby pracujących w podmiotach z kapitałem zagranicznym12.
W 2014 roku łączna wartość obrotów towarowych w Polsce kształtowała się na poziomie 317,9 mld euro (z czego 157,8 mld euro przypadało na eksport, a 160,1 mld euro na import). W 2013 roku było to odpowiednio 152,8 mld euro i 162,0 mld euro, co pozwoliło na zajęcie 8 miejsca wśród państw UE zarówno w eksporcie, jak i w imporcie, podczas gdy czołowe miejsca zajmowały Niemcy, Holandia, Francja oraz Wielka Brytania. W latach 2004–2014 wartość obrotów handlu zagranicznego Polski wzrosła ponad dwukrotnie – eksport w cenach bieżących liczony w euro zwiększył się o 146%, a import o 122%. Wśród państw Unii Europejskiej, których łączna wartość wymiany handlowej należała do naj-wyższych, wysoki wzrost w latach 2004–2012 odnotowano w Niemczech (eks-port zwiększył się o 54%, a import o 59%) oraz w Holandii (wzrost zarówno eksportu, jak i importu wyniósł prawie 80%).
W przeliczeniu na jednego mieszkańca obroty handlowe Polski w 2014 roku osiągnęły 3,7229 mln euro po stronie eksportu i 3,9975 mln euro po stronie importu, co oznacza wzrost ponad dwukrotny w porównaniu z 2004 rokiem, czyli odpowiednio o 138% i 114%. Osiągnięcie takiego wyniku zapewniło Pol-sce 7 i 6 miejsce wśród państw Unii Europejskiej pod względem dynamiki eks-portu i importu per capita.
11 PAIZ (2015): Investment of Poland 2015, s. 1, www.paiz.gov.pl12 GUS (2015): Działalność gospodarcza podmiotów z kapitałem zagranicznym w 2014 roku,
Warszawa.
Witold Małachowski 122
Po przystąpieniu Polski do UE w strukturze geograficznej obrotów głównym partnerem handlowym Polski pozostały państwa Unii Europejskiej, jednak ich udział w obrotach towarowych Polski się zmniejszył (w 2014 roku w porów-naniu z 2004 rokiem w przypadku eksportu z 79,2% do 76,1%, a w przypadku importu z 76,4% do 67,8%). Głównym partnerem handlowym Polski są Niemcy, ale udział obrotów z tym państwem obniżył się w omawianym okresie z 30,1% do 24,4% po stronie eksportu oraz z 29,5% do 26,2% po stronie importu. Spo-śród państw UE, oprócz Niemiec, najważniejszymi konsumentami polskich towarów były Wielka Brytania, Czechy oraz Francja. Do państwz których pochodziła największa część polskiego importu, należały Holandia, Włochy, Czechy oraz Francja.
Podsumowanie
W ciągu 10 lat członkostwa Polski w Unii Europejskiej nastąpił wzrost pro-dukcji przemysłowej o 61% i był to (po Słowacji) drugi najlepszy wynik wśród państw UE. Od czasu wejścia do Unii Europejskiej w polskim przemyśle nastą-piły zmiany, świadczące o postępującej modernizacji i unowocześnianiu jego struktury oraz dynamicznym rozwoju w ujęciu ilościowym i wartościowym. W okresie 2004–2014 zmniejszył się w polskim PKB udział rolnictwa z 4,8% do 3,4%, wzrósł natomiast udział usług z 64% do 65,2%. Udział przemysłu w wytwarzanym PKB pozostawał na tym samym poziomie (31%). Podobnie jest w innych państwach gospodarczo rozwiniętych. Przemysł, z jednej strony, stara się dostosowywać do zmieniających się materialnych potrzeb konsump-cyjnych społeczeństwa i dąży do ich zaspokajania. Z drugiej strony,bardzo istotna jest jego wzrastająca rola w polskim eksporcie. Dokonujące się w pol-skiej gospodarce procesy internacjonalizacji znajdują wyraz m.in. w napływie bezpośrednich inwestycji zagranicznych i ich wzrastającej roli w polskim prze-myśle również w aspekcie innowacyjnym.
Perspektywy rozwoju polskiego przemysłu uwzględniają strategię „Europa 2020”13. Strategia ta, ze względu na czas jej tworzenia, stanowi odpowiedź na kryzys gospodarczy, uwzględniając równocześnie stojące przed Europą długofalowe wyzwania związane z globalizacją, starzeniem się społeczeństw
13 Szerzej strategia „Europa 2020” została przedstawiona w: GUS (2014): Polska w Unii Europejskiej 2004–2014, Warszawa, s. 69–83. Pełny tekst strategii „Europa 2020”: Komisja Europejska (2013): Strategia „Europa 2020”, Bruksela. Polska uczestniczyła w przygotowy-waniu strategii.
Rola przemysłu w gospodarce Niemiec i Polski po rozszerzeniu UE na Wschód 123
oraz rosnącą potrzebą racjonalnego wykorzystywania zasobów. Podobnie jak w poprzednio obowiązującej strategii lizbońskiej, głównym celem nadal jest wzrost gospodarczy, jednak szczególną uwagę zwrócono na kwestie dotyczące zrównoważenia rozwoju. Efektem realizacji strategii „Europa 2020” ma być gospodarka bazująca na wiedzy, niskoemisyjna, promująca technologie przy-jazne środowisku, oszczędnie gospodarująca zasobami, kreująca nowe „zie-lone” miejsca pracy, a zarazem zachowująca dbałość o spójność społeczną.
W celu utrzymania wysokiej pozycji gospodarczej Unii Europejskiej realiza-cja strategii „Europa 2020” zakłada wzmocnienie innowacyjności oraz poprawę konkurencyjności poprzez wzrost nakładów na działalność badawczo-rozwo-jową do 3% PKB. Powinno to służyć dalszej modernizacji, podnoszeniu poziomu technologicznego i wzmacnianiu konkurencyjności polskiego przemysłu.
Na podkreślenie zasługuje zmniejszanie się dystansu między Niemcami i Pol-ską w podstawowych wskaźnikach makroekonomicznych. Szczególna uwaga została zwrócona na zmniejszenie się dystansu polskiego przemysłu w stosunku do pozycji przemysłu niemieckiego, coraz większe podobieństwo struktury przemysłów obu państw i wpływu przemysłu na rozwój handlu zagranicznego, a zwłaszcza eksportu, oraz podobieństwo struktur w grupach towarowych.
Polska, podobnie jak Niemcy, zwraca uwagę na poprawę innowacyjności i tym samym utrzymanie, a nawet zwiększenie międzynarodowej konkuren-cyjności. Z jednej strony, Niemcy pozostają największym partnerem gospo-darczym Polski, a z drugiej – Polska odgrywa coraz bardziej istotną rolę jako partner ekonomiczny Niemiec.
STRESZCZENIE
Celem niniejszego opracowania jest zaprezentowanie zmian jakie dokonały się w przemyśle Niemiec i Polski z uwzględnieniem sfery produkcji oraz wymiany mię-dzynarodowej w latach 2004–2014, czyli od chwili przystąpienia Polski do Unii Europejskiej. Doceniając znaczenie właściwego prowadzenia polityki prorozwojo-wej w Niemczech i Polsce, jeden z punktów poświęcono analizie tendencji dotyczą-cych podstawowych wskaźników rozwoju przemysłu w Niemczech i Polsce na tle innych danych makroekonomicznych, a szczególnie struktury wytwarzanego pro-duktu krajowego brutto, czyli porównywaniu zmian w usługach, przemyśle i rol-nictwie. Opis analityczny został uzupełniony zestawem danych ujętych w tablicach ilustrujących rozwój przemysłu Niemczech i Polsce. Strategia rozwoju ekonomicz-nego Niemiec i Polski dąży do zrównoważonego wzrostu ekonomicznego, którego
Witold Małachowski 124
efektem ma być gospodarka bazująca na wiedzy, promująca technologie przyjazne środowisku, oszczędnie gospodarująca zasobami, a zarazem zachowująca dbałość o spójność społeczną.
Słowa kluczowe: Przemysł w Niemczech i Polsce, produkt krajowy brutto, Unia Europe-jska, bezpośrednie inwestycje zagraniczne, eksport, innowacyjność, konkurencyjność
ZUSAMMENFASSUNG
Der Beitrag wurde der Rolle der Industrie in der Wirtschaft in Deutschland und Polen nach der Osterweiterung im 2004 gewidmet. Die statistischen Daten aus den verwendeten Quellen in Deutschland, Polen und von Eurostat betreffen die Jahre 2004–2014. Es wurden vor allem Veränderungen der Struktur der Erstellung des Bruttoinlandprodukts zwischen den Sektoren Dienstleistungen, Industrie und Land-wirtschaft vorgestellt. Die Struktur der Erstellung des BIPs in Deutschland und Polen ist im Untersuchungszeitraum ähnlicher geworden. Eine gleiche Tendenz wurde in den Strukturen des Exports von Deutschland und Polen festgestellt. Natürlich bleibt der Abstand zwischen Deutschland und Polen bezüglich wichtiger makroöko-nomischer Indikatoren weiterhin groß. Polen hat aber in den letzten Jahren seit der Mitgliedschaft in der Europäischen Union aufgrund seiner großen Wachstumsraten erheblich aufgeholt. Die polnische Industrie ist in den Jahren 2004–2014 um 61% gewachsen. Sowohl Deutschland als auch Polen wollen ihre Innovationsaktivitäten weiter verbessern und ihre internationale Wettbewerbsfähigkeit erhalten.
Schlüsselbegriffe: Industrie, Deutschland, Polen, Bruttoinlandprodukt, Europäische Union, ausländische Direktinvestitionen, Export, Innovationen, Wettbewerbsfähigkeit
Bibliografia
Eurostat: Roczniki z lat 2005–2015, Bruksela.Fischer Verlag S. (2016): Zahlen – Daten – Fakten, „Fischer Weltalmanach“, Frank-
furt am Main 2015. A także roczniki z lat 2002–2014.GUS (2015): Działalność gospodarcza podmiotów z kapitałem zagranicznym
w 2014 roku, Warszawa.GUS (2015): Polska w Unii Europejskiej 2015, Warszawa.GUS (2014): Polska w Unii Europejskiej 2004–2014, Warszawa.Komisja Europejska (2013): Strategia „Europa 2020”, Bruksela.

Rola przemysłu w gospodarce Niemiec i Polski po rozszerzeniu UE na Wschód 125
Małachowski W. (2013): Kapitalizm współczesnych Niemiec, Wydawnictwo Ekono-miczne CeDeWu, Warszawa.
Ministerstwo Gospodarki (2014): Raport o stanie gospodarki. Polska 2014, Warszawa.Ministerstwo Gospodarki i Pracy (2005): Raport o stanie przemysłu, Warszawa.Orłowski W. M. (2015): Czy Polska dogoni Niemcy, Wydawnictwo Naukowe PWN,
Warszawa.PAIZ (2015): Investment of Poland 2015, www.paiz.gov.pl PAIZ (2015): Raporty roczne
za lata 2004–2015, Warszawa.GUS (2015): Rocznik Statystyczny Polski 2015, Warszawa, www.stat.gov.pl
(01.12.2015)

Andreas BIELIG*
INNOVATION, COMPETITION AND COMPETITIVENESS OF THE GERMAN
ECONOMY AND THE ROLE OF INTELLECTUAL PROPERTY PROTECTION. FIRST EVIDENCE
OF A NEW APPROACH
1. Introduction
The competitiveness of economies in international trade is constituted by various institutions, factors and causal interrelationships. Following the works of Balassa, Trabold and Reiljan et al. the status of international competitiveness of an economy is manifesting itself in four basic abilities which can be inter-preted as signs of pure international competitiveness: 1. the ability to sell prod-ucts and services, 2. the ability to attract mobile production factors, 3. the ability to invent and to introduce innovations and 4. the ability to adjust to internal and eternal shocks.1 With the domestic potential of knowledge accumulation these factors constitute the ability to earn profits in international trade. This stylized introductory perspective on competitiveness is accompanied by the internal ability to self-organize the social structures, leading to the systemic competi-tiveness, thereby examining and shaping institutions and economic processes during time. Theoretical delineations of the concept of international trade com-petitiveness were introduced by Porter,2 emphasizing four endogenous domes-tic key factors of international competitiveness of an economy: 1. factor input conditions, 2. demand conditions, 3. the context for firm strategies and rivalry and 4. conditions of related and supporting industries. The key determinants
* Research Centre for the German Economy, World Economy Research Institute, SGH Warsaw School of Economics, * e-mail: [email protected]
1 Misala (2014), pp. 7 f.2 Porter (1990).

Andreas Bielig 128
are interdependently interrelated and supplemented by two exogenous fac-tors, affecting those positively: the supportive adjustment activity of the state policy and the internal or external opportunities which firms meet on markets. This “diamond concept” was complemented by Dunning,1 who considered the role of international activities of transnational corporations (TNC’s), influenc-ing main driving factors of international competitiveness by their decisions on global trade, investment and licences. From the interaction of the four key determinants derives the competition environment for enterprises, motivating them to compete on markets, explore new solutions and consumer preferences and innovate with products and services. Innovation is thereby for industrial-ized economies commonly regarded as the major determinant of competitive development. In the concept of Porter economies can experience four stages of their development, representing sources of competitiveness: 1. based on nat-ural resources, 2. on investments, 3. on innovation and 4. on wealth.2 While lower developed or emerging countries base their international competitive-ness mainly on the exploitation of natural resources or on encouraging for-eign respective to a lower degree also domestic investments, the majority of industrial economies seek to implement strategies to foster innovation activ-ity to achieve or secure competitiveness. This perspective is reflected by the classification of economies used in the Global Competitiveness Report of the World Economic Forum with respect to the national sources of competitive-ness.3 According this the competitiveness of economies can be attributed as: 1. factor-driven, 2. efficiency-driven or 3. innovation-driven, with transitional stages of development between those categories. Weresa et al. combine in their comparative analysis national factor sets of competitiveness with indicators for national innovation systems for clustering and analysing industrialized and less developed economies.4 They distinguish developed and developing innova-tion systems, each with three subcategories to allow for a specific analysis of factors, supposed to be relevant for competitiveness. In the analysis Germany is analysed as economy with a developed and performing innovation system (clustered e.g. with USA, Japan, Great Britain or South Korea) considering intellectual property as one of the output indicators of innovation processes and factor of competitiveness. To gain knowledge about the causalities which drive this interrelationship the research approach outlined in the following intends
1 Dunning (1992).2 Porter (1990), p. 546.3 World Economic Forum (2013).4 Weresa (2014), pp. 100–102.

Innovation, competition and competitiveness of the German economy and the role... 129
to analyse the specific role of intellectual property in the process of achieving international trade competitiveness for the German economy. In this contri-bution therefore the methodological framework of the new research approach is introduced together with the presentation of first preliminary results of evi-dence of research for this comprehensive topic of future research.
2. The research area at a short glance: innovation processes, trade competitiveness and intellectual property protection in Germany
According the results of the above mentioned case study about the inter-relationships between innovation, human capital and trade competitiveness, the German economy achieves its strong competitive position from close inter-relationships between the specific structures of the German national innova-tion system with the economic sector. In particular traditionally developed strengths of the education system and human capital accumulation contrib-ute together with intensive R&D activity of the private sector to the innovation processes.5 The R&D intensity of the German economy, measured as a share of R&D expenditures on GDP, increased from 1995 to 2012 by 0.79 percentage points to 2.98 percent, surpassed only by the leading OECD-countries South Korea, Sweden and Japan.6 In depth analysis however reveals that efforts and results of the innovation processes and their effects on the competitive posi-tion of industrial sectors in the German economy are unevenly distributed. The competitive position is mainly based on R&D intensive products, in particular on products of high-value technology level, where German enterprises have strong comparative advantages. In 2011 the global exports in R&D intensive products of the leading German economy amounted to 759.3 billion $, with 607.9 billion from products of high-value technology (represented by the sec-tors cars, engines & equipment; machinery or electrotechnical equipment).7 The exports of high technology products covered only 151.4 billion $ (repre-sented by air and spacecraft technology or pharmaceuticals). Also concerning the trade balance a specialisation of the German industry in product fields of high-value technology is visible, with 274.9 billion $ in R&D intensive products
5 Bielig and Olszynski (2014), pp. 250 f.6 EFI (2014), p. 150.7 Schiersch and Gehrke (2013).
Andreas Bielig 130
and 273 billion $ in high-value technology goods. The trade balance in high technology goods amounted to 1.9 billion $. This shows a unique specialisa-tion structure in foreign trade, which is comparable only with the Japanese economy. Visible specific pattern of innovation processes and trade specialisa-tion of the German industry are reflected also by the protection of R&D out-put and explicitly specified knowledge goods. Measured by the relative patent activity of enterprises, the German economy reveals strong competitive advan-tages in patenting technical solutions of high-value technology, which were stable between 1995 and 2010.8 The German industry holds in the innovation processes in this area of technology a strong position, which is only surpassed by the Japanese economy. However in high technology products the patent activity of German enterprises shows clear disadvantages, remaining stable over the time, whereas other leading OECD-economies either could hold their existing advantages (e.g. USA or Japan) or were able to convert disadvantages into advantages (e.g. China). Following the perspective to regard intellectual property as an output of innovation processes the revealed specific patent pat-tern is not only supporting the trade competitiveness of the German economy, protecting innovative solutions against domestic piracy and counterfeiters and from abroad. Its effects are supposed also to reinforce traditional path depend-ences in innovation activity by strengthening the existing comparative advan-tages. Revealed strong advantages in intellectual property protection in fields of high-value technologies enable German enterprises through market power to compete more successfully on these international markets in comparison with those markets without existing advantages. They indicate also substantial core competences in these fields of explicit knowledge accumulation, which can be regarded as lead-advantages against competitors. And they signalize also extensive potentials to secure the space to operate in future R&D activi-ties for the right holders. In result national economies show specific patterns of intellectual property protection and exploitation, reflecting the conditions of innovation processes and knowledge good production and utilization.9 These intellectual property profiles with strong empirical relevance for economic development and growth vary among countries, in the temporal perspective and also between categories of intellectual property rights. For the develop-ment of the German economy measured by the gross domestic product 1999–2009 showed in particular stocks of trademarks and patents strong positive
8 Neuhäusler, Rothengatter, Frietsch (2013).9 Bielig (2013), pp. 304 f.
Innovation, competition and competitiveness of the German economy and the role... 131
impacts, followed by design rights.10 With signs of evidence for an impact of patent protection also for international trade flows provided by some eco-nomic analyses, a hypothesis of supporting and stabilizing effects of intellec-tual property protection on the trade competitiveness of the German economy can be formulated, if we assume that also trademarks, design rights and utility model rights provide substantial protection of specific product characteristics for right holders in international trade relations. With respect to differing inno-vation and protection pattern in the German industry sectors the quality and quantity of the impacts is supposed to be varying among sectors. The research is aiming on the analysis of economic impacts of intellectual property protec-tion on foreign trade competitiveness of the German economy with a specific focus on selected industrial sectors.
3. Review of intellectual property and foreign trade in economic analysis
Works of theoretical economic analysis of intellectual property impacts on international trade focus mainly on the net benefit of protection by intellectual property for national economies, leading to an increase or detriment of eco-nomic welfare, measured by resulting effects on consumer or producer sur-plus. Empirical works seek to verify these impacts by measuring their effects on innovation activity, gross domestic product growth rates, total factor pro-ductivity, foreign direct investments or international trade flows.
Following theoretical analyses increasing standards of intellectual prop-erty protection, mostly represented by patent protection only, lead to potential benefits for committing economies (market extension effect), e.g. increasing trade flows, foreign technology transfer, foreign direct investments, inspir-ing local innovation activity and research and development.11 For economies with industrial structures of imitative production pattern increased intel-lectual property standards however cause costs of decreasing earnings by restricting imitation, reduced availability of products and increasing price levels (market power effect). The findings of analysis for the net effect on par-ticular economies in the literature are ambiguous. Chin and Grossman state in a north-south model permanent asymmetries between developed northern
10 Bielig (2012), pp. 7–11.11 Chatterjee et al. (2014).

Andreas Bielig 132
economies with innovative activities and imitating less-developed southern economies.12 Diwan and Rodrik find that less-developed economies have incentives to increase intellectual property protection standards if their rela-tive market sizes increase and if their technological preferences, represented by the domestic demand for specific types of innovation, differ from that of developed economies, allowing them to profit from their innovative activities.13 Helpman finds in a model with exogenous innovation that increasing protec-tion standards shift terms of trade in favour of developed economies, reducing the welfare of less-developed countries.14 The positive effect of strengthening standards on developed economies increases with the existing rate of imita-tion. Negative effects of standard commitment derive from the movement of production factors from less-developed (low income) to developed economies (high income), leading to welfare detriments of both. Also with endogenous innovation rates (depending on increasing protection standards in imitating economies) the overall effect of increased protection is ambiguous, leading to decreasing welfare in less-developed economies whereas the welfare posi-tion of developed countries can be deteriorated in the long run by a restriction of product availability. Considering also foreign direct investments in favour of lower production costs the effect of increased protection standards is only ben-efiting the welfare of developed economies. In constellations of low imitation levels and missing foreign direct investment activities the increase of standards leads even to the detriment of welfare for both groups of countries. Lai differ-entiates in an endogenous innovation model with imitation and foreign direct investments two paths of technology transfer from developed to less-developed economies.15 Under an imitative regime an increase of protection standards induces two opposite effects: increasing returns of innovation by strengthen-ing monopoly power of inventors and decreasing returns by raising innova-tion factor cost, with dominating impacts of the latter. Increasing protection leads in this constellation to decreasing innovation activities. Under regimes with foreign direct investments enterprises take advantage from lower labour production costs in less-developed economies but increase the probability of loosing their monopoly power. Increasing standards of protection reduce the latter effect, leading to higher rates of innovation, which holds true also for mixed regimes with imitation and substantial shares of foreign direct invest-
12 Chin and Grossman (1988).13 Diwan and Rodrik (1989).14 Helpman (1992).15 Lai (1998).

Innovation, competition and competitiveness of the German economy and the role... 133
ments. Markusen analyses welfare effects of protection standard introduction with respect to foreign direct investment decisions of multinational enter-prises as an alternative to the exports of products.16 If improved protection leads to a substitution of exports by direct investments and local production the profits of the enterprise as well as the welfare of the host country increase. The welfare result changes if the direct investment decision was taken prior to the standard introduction. Ex post increases of protection standards cause distribution effects by transferring rents from local employees to multinational enterprises, which use the standards for reducing local knowledge spill-over in the host country. Yang and Maskus consider licensing as an alternative path for acquiring technological knowledge to processes of imitation or foreign direct investments. In a licensing regime an increased protection standard leads to more innovation activities and extended licensing volumes.17 Accord-ing the findings of Glass and Saggi improved property protection remains the relative earning streams between innovating domestic firms and multinational enterprises with foreign direct investments unaltered, not affecting the relative incentives to foreign investments.18 Moreover the increased efforts for imitation processes cause wasting of resources in host economies and a reallocation of production towards developed countries, which occupies resources also nec-essary for innovation activity. Increased protection induces shrinking foreign direct investments in host economies and lower rates of innovation in domes-tic economies. Lai and Qiu analysed the long-term effect of increased protec-tion standards, with prerequisites of innovative capabilities in domestic and host countries.19 Strengthened protection increases economic welfare in the first and leads to losses in the latter economies with a positive global net effect. For efficiency constellation compensations from developed to less developed economies are preserving incentives to higher standard settings. Grossman and Lai find increased protection efficient for economies with large internal markets for protected products and high quality of human capital resources.20 Harmonized protection systems induce therefore ambiguous welfare effects for economies with heterogeneous characteristics.
Also in empirical research work of intellectual property protection impacts on international trade the findings are of ambiguous nature. Most studies are
16 Markusen (1998).17 Yang and Maskus (2001).18 Glass and Saggi (2002).19 Lai and Qiu (2003).20 Grossman and Lai (2004).

Andreas Bielig 134
not focussing on international trade as an object of analysis directly, but con-centrate on verifying the relationship between the strength of intellectual prop-erty protection and foreign direct investments, innovation activity or growth rates for specific sets on economies. For measuring the characteristics of intel-lectual property regimes two indices are used mainly:1) The time-invariat Rapp-Rozek-Index, which measures the strength of pat-
ent protection on a scoring scale from zero (no patent protection availa-ble) to five (patent protection consistent with US patent law available). The index developed by Rapp and RozEk compares the state of national patent laws in 1984 with minimum standard requirements of the United States Chamber of Commerce from 1987, including guidelines for patent exam-inations, terms of protection, terms of compulsory licensing, coverage of inventions, transfer of patent rights or enforcement measures against infringing activities.21
2) The concept of the comparative-static Ginarte-Park-Index developed by paRk and GInaRtE is analogous to that of Rapp-Rozek, measuring the strength of national patent laws on a scoring scale from zero to five, but includes with extent of coverage, membership of international patent agreements, pro-visions for loss of protection, enforcement mechanisms and the duration of the protection period other characteristics of intellectual property pro-tection.22 In the initial form the index covered the patent protection per-formance of a panel of 60 economies from 1960 to 1990, but is updated quinquennially providing now data for 110 economies until the year 2005.23
Both qualitative indices measure selected characteristics of patent laws for evaluating the strength of intellectual property regimes, which allow in the US patent system overall statements of potential evidence for utility patent and design patent rights only, whereas protection instruments for trademarks are not covered by the valuation scope. Abstracting from the systematic inconsisten-cies with continental European protection approaches an additional restriction for analysis results from the level of index aggregation, which not allows dif-ferentiated analyses by comparing effects of individual protection instruments.
Gould and GRubEn use the Rapp-Rozek-Index to verify the effect of intel-lectual property protection on economic growth, thereby finding differing effects in dependence on the regime of international trade openness.24 For
21 Rapp and Rozek (1990).22 Park and Ginarte (1997).23 Park (2008).24 Gould and Gruben (1996).

Innovation, competition and competitiveness of the German economy and the role... 135
opened economies the positive effect of a moderate level of patent protection on growth is found to be bigger than in closed economies. lEE and MansFIEld find in their analysis based on a sample of 94 multinational US firms that for 80 percent the subjective perception of the strength of patent protection is important for decisions about some types of foreign direct investments, but only for 20 percent for foreign sales and distribution outlets.25 This perception impact on managerial decisions is more relevant in chemical industries than in others, like food and transportation equipment. paRk and GInaRtE analyse the impact of patent protection and other national characteristics on growth, R&D activity, investment and education for a set of 60 economies.26 They find a positive impact on investment and R&D activity, but only for the segment of 30 economies at a higher level of economic development. Following their results economies with dominating imitative patterns of innovation are non-responsive to variations of patent protection regimes. The national importance of sufficient protection standards increases with higher development levels and expanding domestic R&D capacity. The study of FERRantIno analyses the effects of adherence to international intellectual property treaties on interna-tional trade and foreign direct investments of US firms.27 It finds no discern-ible impact of adherence on arms-length exports or overseas affiliates sales by US firms. Transfer exports from parent firms to their affiliates are even big-ger in economies without treaty memberships than in those with adherence. The joining to intellectual property treaties is likely to provide incentives for subsidiaries for vertical disintegration processes by sourcing bigger compo-nent shares from domestic than from host countries. But affiliates in econo-mies with membership of the Paris Convention receive higher payments and receipts of royalties and licence fees than those in non-membership countries. In contrast to this Maskus and pEnubaRtI find evidence in their static analysis for a “trade-relation” of intellectual property, in the meaning of an interrela-tionship between the strength of national patent laws and the bilateral imports for OECD countries and a set of 25 developing economies in 1984.28 Exporting firms in the sample discriminate in their sales across countries with the result that economies with stronger patent laws receive more imports than others, which holds true especially for countries with large domestic markets, where the observed effects were stronger. However in the cross-sectoral analysis the
25 Lee and Mansfield (1996).26 Park and Ginarte (1997).27 Ferrantino (1993).28 Maskus and Penubarti (1995).

Andreas Bielig 136
effect of stronger patent laws on bilateral trade flows is stronger in sectors with presumably less patent sensitivity, what supports the hypothesis that the potential of trade reductions through enhanced market power exercise of firms is bigger in patent-sensitive than in non-sensitive sectors. FInk and bRaGa find in their gravitation model of bilateral trade flows positive impacts of stronger intellectual property protection on foreign trade of non-fuel products.29 How-ever in trade relations of high technology products no effect of intellectual property was observable.
Resuming the empirical evidence FalvEy and FostER find that stronger intel-lectual property protection (in the meaning of patent laws) can induce intensi-fications of international trade but this effect occurs probably not in high tech products and presumably patent-sensitive industries.30 Multinational enterprises base their export policies mostly not on intellectual property regimes in less-developed economies with relatively weak threats of imitation and reverse engi-neering. Technological knowledge protection is more relevant for international trade to middle-income and large developing economies with considerable imi-tation capabilities, where strengthening of the intellectual property regime is encouraging foreign enterprises to increase their export volumes to serve the domestic market. The imitation of complex products of high tech industries requires advanced efforts and costs, making international trade flows of these sectors less sensitive to variations of domestic patent protection than aver-age industries. Enterprises in high tech industries may serve foreign markets through foreign direct investments or licences leading to the lower sensitiv-ity of their remaining exports to patent protection in the destination country.
Summarizing economic evidence for the interrelationship between intel-lectual property protection and foreign trade a positive general link between is likely, whereas the impact is varying across countries and industrial sectors substantially. This supports the hypothesis formulated by Maskus and pEnubaRtI that the relationship is at least partially of “empirical nature”,31 what gives much space for a wide interpretation. Given a considerable state of empirical evidence for the US industry32 or cross-country analyses of OECD economies33
29 Fink and Braga (1999).30 Falvey and Foster (2006), p. 29.31 Maskus and Penubarti (1995), p. 231.32 Ferrantino (1993), Lee and Mansfield (1996), Weng et al. (2009).33 Maskus and Penubarti (1995), Park and Ginarte (1997), Falvey and Foster (2006),
Falvey et al. (2009), Liegsalz (2010).
Innovation, competition and competitiveness of the German economy and the role... 137
respective developing economies34, little evidence is available for the German economy and in particular for those industrial sectors with strong dependence of their revenues on exports. The new research approach outlined in the fol-lowing aims to provide empirical evidences of this area. Furthermore available analyses are mainly based on applying indices for the strength of patent laws (in the meaning of formal requirements) as measurement proxies for overall intellectual property protection, which oversimplifies the utilization processes of intellectual property in economies with respect to overall protection demand at the aggregated level, differences among industrial sectors and firms stra-tegic behaviour. The third desideratum is to provide more analytic insights into the link between intellectual property utilization and international trade. Especially factors of the National Innovation System have strong relevance for this interrelationship, therefore an intensive research in this field with respect to the export orientated economy of Germany is required. An essential research question for future innovation policy exceeding traditional perspec-tives on international trade flows focuses on driving factors for international trade competitiveness resulting from the interrelationship between sources of domestic innovation and intellectual property protection.
4. Innovation, competition and competitiveness – a new research approach
4.1. Specification of research topic and research question
The research approach targets on the analysis of factors influencing the impact of intellectual property on international trade competitiveness of the German economy, and selected industrial sectors and enterprises in Germany with relevance for German international trade. International trade exchange is one of the crucial sources of economic welfare of the German society, with its strong dependence of leading industrial sectors from export revenues but also with respect to the increasing integration level of industrial sectors and enterprises in international global trade and value chains. The analysis of inter-relationship between intellectual property and international trade is a quite cur-rent topic of research with some theoretical and empirical evidence for sets of OECD-economies and developing countries, which reveals ambiguous results.
34 Maskus and Penubarti (1995).

Andreas Bielig 138
An evidence for the specific case of the German economy under consideration with its specific industrial structures and its unique sophisticated National Innovation System is actually missing. Additional demand for research is seen in the necessity to extend the focus of research activity beyond the isolated analysis of international trade volumes and export revenues to characterize those relevant economic factors in an in-depth analysis, which drive compe-tition for German firms on international markets and the competitiveness of the German economy and its multinational enterprises in international trade with respect to intellectual property protection. For these interdependences especially sources of domestic innovation activity and their interaction with market decisions of enterprises are regarded to be decisive. The both research questions can be formulated as follows:
1. Which impacts have intellectual property protection instruments and strategies applied on competition and the international trade competi-tiveness of the German economy?
2. Which impacts have IPR on the international trade competitiveness of export-orientated industrial sectors and multinational enterprises?
The aim of the analysis is to characterize and evaluate the relevant fac-tors, which shape the patterns of competition German enterprises are facing on international markets and their competitiveness with respect to their usage of intellectual property protection. It focuses on the integrated analysis of rel-evant determinants influencing this context from four areas: 1. factors of the German National Innovation System, 2. structures of intellectual property protection policies and strategies applied in German industrial sectors and by selected multinational enterprises of German origin, 3. factors of innovation and competition conduct on the domestic German market and international export markets and 4. factors influencing the competitive position of the Ger-man economy, export-orientated industrial sectors and German enterprises in international trade.
The objects of analysis are represented by three levels of economic aggre-gation:1. set of the most relevant export orientated sectors at the aggregated national
level of the German economy, which is representing the German economy in international trade relations
Innovation, competition and competitiveness of the German economy and the role... 139
2. set of leading export-orientated sectors at the disaggregated sectoral level for analysing sectoral-specific structures and tendencies of protection and innovation
3. set of multinational enterprises of German origin for conducting case studies.For covering the most relevant export-orientated industries the sectors and
enterprises in the samples will be selected by the degree of export-dependence of their earnings.
For the purpose of analysis the period between 2004 and 2013 was chosen, after ten middle-eastern-european economies joined the European Union. The accession in 2004 represents the biggest EU-enlargement with its effects on the size of internal market, intensified European production chain integration and enlargement of the labour market, which is of high relevance especially for German enterprises. In the following chapter 5 as an introduction to future in depth analysis some key developments of the analysis area will be presented in the form of preliminary results for the period 1991–2013 to explore impor-tant facets of the analysis.
Following results of previous works about the interrelationship between intellectual property protection and international trade mentioned above and about the role and functions of intellectual property in the innovation pro-cesses of a national economy35 three working hypotheses for the research can be formulated:H 1: The usage of intellectual property instruments in the German economy
has positive impacts on the international trade competitiveness.H 2: The impact of intellectual property protection is influenced by factors of
the National Innovation System.H 3: The impact of intellectual property is depending on the industrial sectors
and the sizes of enterprise with respect to their specific innovation and competition patterns on the domestic and international markets.
4.2. Research framework outline, requirements and methods of analysis
The research is conceived as integrated analysis of the topic through theo-retical and empirical studies of the intellectual property impacts on interna-tional competitiveness, which requires analysis of previous research available in the economic literature to develop in the first step a detailed framework for the analysis and secondly empirical data for analyses of the interrelationship
35 Bielig (2012), Bielig (2013).

Andreas Bielig 140
between both area of economic activity. Four interrelated areas are objects of the analysis:1. Determinants of the National Innovation System (NIS)2. Determinants of intellectual property protection policies and strategies (IPR)3. Determinants of innovation and competition conduct (ICC)4. Determinants of the competitive position in international trade (IT).
The analysis is divided for all four parts contained and their economic interrelations into two methodological stages: 1) A theoretical analysis with descriptive and analytical elements of those factors and processes, which show relevance for the research question is conducted on the basis of the state of previous research work in this area to analyse the economic interrelations, influencing the impact of intellectual property. 2) Based on this an empirical investigation of the interrelationships outlined in the theoretical part of analysis is applied for a verification of the findings and an evaluation of the underlying approaches. For this purpose data sets of indicators of the four areas with rel-evance for intellectual property impacts are selected on the basis of the results of theoretical analysis. The requirements concerning the four areas of research can be described as follows:
Ad 1: Determinants of the National Innovation System (NIS)
The German National Innovation System (NIS) provides with its specific characteristics the potential for innovative activity of enterprises and industrial sectors, which enable them to achieve competitiveness on domestic or interna-tional markets. It is constituted by mainly four groups of components, which shape in their interdependent interactions the structure of the innovation sys-tem.36 To them belong: 1. entities: e.g. enterprises, research units, knowledge transfer organisations, innovation users, public organizations of innovation policy, 2. institutions: e.g. regulations, standards and customs, 3. reciprocal relations and links between entities and institutions and 4. resources of knowl-edge accumulated in the system and transfer and absorption processes. The analysis of those elements and processes from the NIS which are highly inter-related with intellectual property impacts has to consider relevant elements and interrelations of all four groups.
36 Weresa (2014), pp. 82–84.
Innovation, competition and competitiveness of the German economy and the role... 141
For building the national innovation capacity a comprehensive set of inno-vation-linked areas together with their interactions are decisive, from which the most relevant are:1. the national education and human capital accumulation system2. technological infrastructures and capacities3. R&D structures and capacities and with respect to the research question4. the intellectual property system.
For this last area of factors not only national institutions and developments but also international regulations and policies are of increasing relevance. Influencing factors can be derived from policy levels of global governance, world trade regions, national economies or also regional clusters or industrial sectors. Economic analyses observe in this context two current tendencies of opposite direction: a trend of homogenization leading to converging institu-tions of the intellectual property system but also tendencies of increasing dif-ferentiation to adapt existing institutional structures better on the regional and local demand.37 Based on previous works about the measurement of inter-dependencies between innovation, human capital and competitiveness38 the research selects a set of indicators for the four areas of the German National Innovation System. For this theoretical and empirical research data for educa-tion structures and human capital development in Germany, its technological infrastructure and capacity, the R&D structures and dynamics as well as for the intellectual property protection system at the economy and sectoral level are used. Recent research suggests also a growing impact of European innovation ecosystems on innovation activities undertaken by enterprises located in the EU.39 The analysis approach introduced here assumes that differentiated open National Innovation Systems, for instance in Germany, incorporate and reflect in their institutions also relevant factor influences of the interlinked suprana-tional European Innovation System. Nevertheless the focus of this analysis is rather on nationally shaped innovation determinants.
Ad 2: Determinants of intellectual property protection policies and strategies (IPR)
The utilization of intellectual property instruments for an adequate pro-tection of knowledge goods by German enterprises bases on the effects and
37 EPO (2007), pp. 52–63.38 Czajkowski et al. (2014.) 39 Cagnin, Amanatidou, Keenan (2012).
Andreas Bielig 142
economic incentives set by the structures of the National Innovation System. Therefore the analysis of intellectual property protection policies and strategies (IPR) applied by firms intends to verify the links between the innovation system and the observable protection behaviour. Results of economic analyses suggest strong interdependencies of the institutional structures of national innovation systems and the domestic demand for protection of intellectual property,40 which is to verify for the case of the German economy, selected industrial sec-tors with strong relevance for international trade and case studies of multina-tional enterprises from Germany. However the protection activity is supposed to be varying substantially among industrial sectors and enterprises, reflect-ing the differences in their specific demand for protection.41 For the protection activity at the aggregated level of the German economy the analysis intends to develop a national profile of intellectual property protection with a specific focus on sectors with international trade relevance. It is characterising which protection instruments are mainly used by German enterprises, in which object areas of protection, and which trends of regional orientation in international exchange are dominating. At the level of selected industrial sectors and multi-national enterprises analogous profiles are developed. At the sectoral level the profile allows to derive implications about sector-specific protection patterns and competition strategies typically applied under the sectoral conditions of knowledge good production and market competition. At the level of the mul-tinational enterprises the analysis is conducted in the form of case studies at the micro-level to verify current trends of individual decisions for knowledge protection with respect to the three alternatives: international trade, licensing and foreign direct investment. The analysis of this area comprises theoretical study and empirical analysis, requiring literature reviews in this field and data for intellectual property protection development for the economy, sectoral and enterprise levels.
Ad 3: Determinants of innovation and competition conduct (ICC)
With the structures of the German National Innovation System and the intellectual property protection patterns of export related German enterprises is linked the third research area of innovation and competition conduct (ICC). The German industry is showing traditionally very specific innovation behav-
40 Weresa (2014).41 Bielig (2013), pp. 202–207.

Innovation, competition and competitiveness of the German economy and the role... 143
iour, especially with respect to international exchange relations, focussing their innovation efforts mainly on R&D intensive products and here in particu-lar on goods of high-value technology from sectors of automotive, machinery and electrotechnical equipment.42 Sectors of high technology are in compari-son with these core sectors of the German economy less represented in both, innovation activity and international trade competition. This specialisation derives from the specific structures of the German National Innovation Sys-tem, strengthening the existing comparative advantages and channelling the industrial innovation paths, and is supported by the specific protection patterns for intellectual property applied by the enterprises, which build and protect core fields of technological competences. The analysis verifies the interrela-tionships between specialisation patterns of the German industry concerning innovations for new products, services or technologies and its competition con-duct on the domestic and international markets under the consideration of the specific protection behaviour for intellectual property and the impacts of fac-tors from the National Innovation System. The analysis of this area comprises also theoretical study and empirical analysis, requiring literature reviews and data for the innovation activity and conditions of product market competition at the economy, sectoral and enterprise level.
Ad 4: Determinants of the competitive position in international trade (IT)
According economic analyses outlined above in chapter 3 the international trade of an economy can be influenced positively by possibilities to protect intellectual property. This assumption is supported by first descriptive evi-dence also for the German economy from 1995 until 2010, indicating paral-lel developments of substantial comparative advantages in the international trade with products of high-value technology and of a strong relative patent position in this field of technology.43 Also the contrary relation with respect to strong comparative disadvantages of German enterprises in high technol-ogy products accompanied by weak relative patent positions is suggesting an existing causal relationship. However, whether are the interdependencies between international trade and intellectual property protection from the theo-retical analysis unambiguous nor is the causality evidence derived from avail-able empirical studies homogeneous. Especially for patent-sensitive industries
42 Schiersch and Gehrke (2013).43 Bielig (2014), pp. 154–158.

Andreas Bielig 144
available empirical results suggest no or only marginal effects of intellectual property on international trade. The joint analysis of determinants of the com-petitive position of the German economy in international trade (IT) in the last area of the research serves this research demand, based on the results of and the implications derived from the three foregoing parts of research, concerning the National Innovation System in Germany, the intellectual property policies and strategies applied by German enterprises and the innovation and competi-tion conduct of the German industry. In combination of theoretical analysis and empirical research it provides evidence for the intellectual property impacts on trade competitiveness. The performance of the German economy and of its industrial sectors and enterprises in international trade is evidently the multi-factorial result of interdependent processes, which is reflected by the design of the research approach with four stages of analysis. The impact of intellectual property on competitiveness is the result of joint effects of multidimensional determinants from diverse fields, thereby influencing the conditions of innova-tion activity, production processes and competitive interaction. The four parts of research are therefore focussing on those factors and processes with close links to the protection and utilization of intellectual property for investigating and explaining its impacts. In the final part of research work an additional group of important factors, deriving from the sphere of international trade and influencing the status of trade competitiveness, can be considered by the anal-ysis. To this factors belong institutional structures of the international trade, e.g. trade agreements and world trade regions, geopolitical factors of leading trading nations, the kind of traded goods or the form of trade, e.g. inter- vs. intra-industrial trade, or finally the competition on international markets for products and services. The joint analysis of selected indicators from this factor group with indicators from the foregoing parts of analysis verifies the impact of intellectual property on trade competitiveness by theoretical considerations as well as by empirical studies for the German economy, selected industrial sectors and multinational enterprises. For measuring the trade competitive-ness in international relations are used RCA-indicators, applied in economic analyses. Research requirements for this part of research comprise economic literature and data for international trade and institutional trade regulations at the economy, sector and enterprise level.
The empirical research design in the fourth part of research work (IT) contains an analysis of trade flows (Ex) and trade competitiveness (RCA) as explained variables in an extended gravity model with multivariate regression methods using panel data from the sources described above. The analysis of
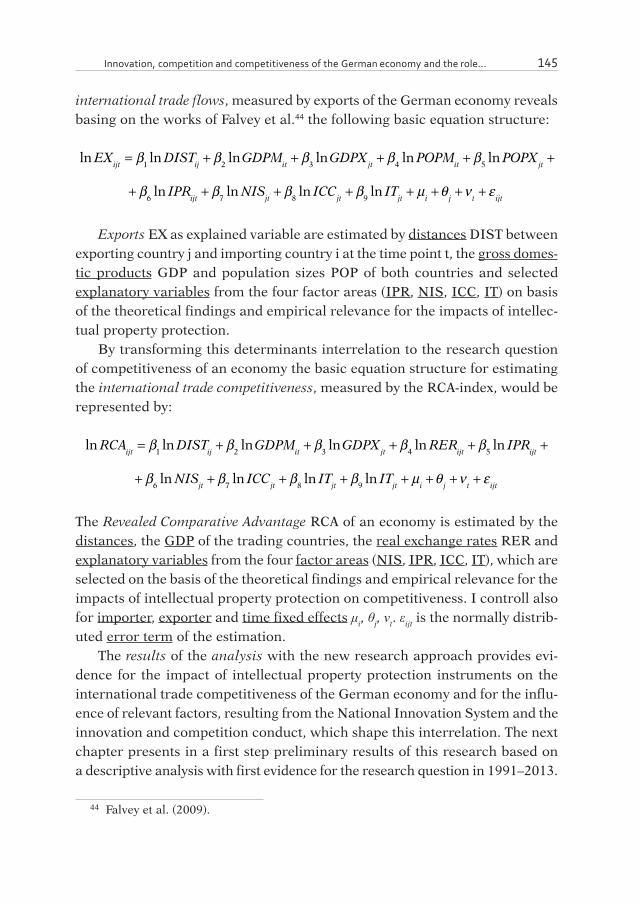
Innovation, competition and competitiveness of the German economy and the role... 145
international trade flows, measured by exports of the German economy reveals basing on the works of Falvey et al.44 the following basic equation structure:
ln EXijt= β
1ln DIST
ij+ β
2lnGDPM
it+ β
3lnGDPX
jt+ β
4ln POPM
it+ β
5ln POPX
jt+ β
6ln IPR
ijt+ β
7ln NIS
jt+ β
8ln ICC
jt+ β
9ln IT
jt+ µ
i+θ
j+ν
t+ ε
ijt
ln EXijt= β
1ln DIST
ij+ β
2lnGDPM
it+ β
3lnGDPX
jt+ β
4ln POPM
it+ β
5ln POPX
jt+ β
6ln IPR
ijt+ β
7ln NIS
jt+ β
8ln ICC
jt+ β
9ln IT
jt+ µ
i+θ
j+ν
t+ ε
ijt
Exports EX as explained variable are estimated by distances DIST between exporting country j and importing country i at the time point t, the gross domes-tic products GDP and population sizes POP of both countries and selected explanatory variables from the four factor areas (IPR, NIS, ICC, IT) on basis of the theoretical findings and empirical relevance for the impacts of intellec-tual property protection.
By transforming this determinants interrelation to the research question of competitiveness of an economy the basic equation structure for estimating the international trade competitiveness, measured by the RCA-index, would be represented by:
ln RCAijt= β
1ln DIST
ij+ β
2lnGDPM
it+ β
3lnGDPX
jt+ β
4ln RER
ijt+ β
5ln IPR
ijt+ β
6ln NIS
jt+ β
7ln ICC
jt+ β
8ln IT
jt+ β
9ln IT
jt+ µ
i+θ
j+ν
t+ ε
ijt
ln RCAijt= β
1ln DIST
ij+ β
2lnGDPM
it+ β
3lnGDPX
jt+ β
4ln RER
ijt+ β
5ln IPR
ijt+ β
6ln NIS
jt+ β
7ln ICC
jt+ β
8ln IT
jt+ β
9ln IT
jt+ µ
i+θ
j+ν
t+ ε
ijt
The Revealed Comparative Advantage RCA of an economy is estimated by the distances, the GDP of the trading countries, the real exchange rates RER and explanatory variables from the four factor areas (NIS, IPR, ICC, IT), which are selected on the basis of the theoretical findings and empirical relevance for the impacts of intellectual property protection on competitiveness. I controll also for importer, exporter and time fixed effects μi, θj, νt. εijt is the normally distrib-uted error term of the estimation.
The results of the analysis with the new research approach provides evi-dence for the impact of intellectual property protection instruments on the international trade competitiveness of the German economy and for the influ-ence of relevant factors, resulting from the National Innovation System and the innovation and competition conduct, which shape this interrelation. The next chapter presents in a first step preliminary results of this research based on a descriptive analysis with first evidence for the research question in 1991– 2013.
44 Falvey et al. (2009).
Andreas Bielig 146
The econometric analysis of the panel data described above will be published in a following research paper.
5. Preliminary results of the analysis
In this part of the contribution follows a presentation of some key facts and developments of the innovation, competition and competitiveness posi-tion of the German economy between 1991 and 2013 as preliminary results of analysis based on the outlined framework of the research approach. For this purpose a descriptive analysis is used. The framework of analysis is divided into four stages of research: the National Innovation System, the intellectual property protection policies and strategies applied by the economic subject, 3. the innovation and competition conduct, and 4. the competitive position in international trade.
Ad 1: Determinants of the National Innovation System (NIS)
Previous studies based on OECD data observe in the German population a long-term aging and shrinking process, leading to a reduction scenario of the population to 74 million inhabitants in 2050 with a median age of 46.8 years45 in comparison with actually 80.72 million inhabitants with an average of 43.9 years of age.46 As a consequence also the stock of labour force will shrink sub-stantially regardless of immigration processes, which were contributing in 2013 with a 20 years peak of net immigration of 437.303 persons on a considerable level to the population stock. Beside of the quantitative stock also the quality of education is one of the main factors of innovation processes. Concerning this input factor of innovation is the German economy only in a less competi-tive position with respect to other EU-countries: The share of employees with tertiary qualification level (ISCED 5B – 6) in 2012 was 29.1%.47 Substantially larger shares of higher education levels had Great Britain with 40%, Finland 39.7%, Sweden and France 35.3% or Netherlands 33.1%, showing that Ger-many is risking to fall behind the competition field concerning the qualifica-tion structures of employment. The EU-27 average of tertiary qualification of
45 Bielig and Olszynski (2014), p. 244.46 Destatis (2014).47 EFI (2014), p. 145.

Innovation, competition and competitiveness of the German economy and the role... 147
employed persons was in 2012 31%.48 If we consider with ISCED 4 qualifica-tions in addition also qualification levels, which are comparable with tertiary education the observable qualification gap is with 37.3% reducing but not suf-ficient to compete with other economies of high qualification standards, like Sweden (42.7), Finland (40.7) or Great Britain (40.1) on an equal level playing field. To the current qualification structure contributes on the tertiary qualifi-cation level the share of student enrolments on the overall population size of equal age structure (student enrolment rate). Its share increased in Germany in 2001–2011 drastically from 32 to 46% but felt back behind concerning inter-national dynamics and quantities. The USA increased student enrolment rates in this period from 42 to 72%, the OECD average of enrolment increased from 48 to 60%.49 In Poland the enrolment rate increased from 68 to 81%. The fur-ther expansion of higher qualifications in Germany in the future to provide sufficient human capital input for innovation activity will meet thereby in the coming years crucial demographic challenges, which can be demonstrated by the numbers of persons with university entrance permissions. The potential for new students reaches its peak with 516.370 persons in 2013 and will decrease according analysis scenarios until 2025 to 431.490 (EFI, 2014, p. 148). Despite of the expected temporal stable development of shares of persons with univer-sity entrance permission on the population of a level below 60% the total num-bers of students at German universities will be expected to reduce by 16.4%.
But for the qualification potential of the German economy is also the dis-tribution of student enrolments respective of that of graduates among the fields of university studies important. The total numbers of first graduations at German universities increased in 2000–2012 by 75.3% to 309.621 persons.50 The fields of mathematics and nature science increased with 48.231 persons in 2012 its share from 12.4 to 15.6%. In contrast to this the field of engineer-ing reduced with 60.259 graduated persons in 2012 its graduation share from 20.2 to 19.5% in 2000–2012 despite of the positive graduation development in the last years, what shows that academic education in engineering could not equally participate in the general trend of tertiary qualifications expansion. In comparison with the 1990’s the share was decreasing even more substan-tially from a level of nearly a quarter of all first graduates from universities, signalling a structural long-term shift in professional qualifications. Also legal,
48 Baethge et al. (2014), p. 8.49 Baethge et al. (2014), p. 23.50 Baethge et al. (2014), p. 31.
Andreas Bielig 148
economic and social sciences reduced with 105.024 graduates in 2012 its share in the period 2000–2012 from 35.5 to 33.9% but could hold in the long run since 1995 its share on the same level. Professional qualifications at tertiary or secondary level contribute as an input factor for innovation processes to the future stock of human capital in the German economy, which reveal its real economic effects and potential only in the long-term development with sub-stantial time-lags. Therefore professional graduations are regarded as future oriented indicators of human capital development which reflect rather factors of future innovation potentials than present conditions of innovation abilities. The latter are from the perspective of professional qualifications as a result of past individual qualification decisions mainly influenced and shaped by histori-cal factors, e.g. the economic crisis phenomena of the German industry in the early 2000's. Together with professional qualifications also the research and development investments (R&D) of private and public institutions are a deci-sive factor for the current innovation development. In the international per-spective the R&D investments but also the R&D intensity of most of the leading OECD economies, measured by the share of R&D expenditures on the Gross Domestic Product (GDP), increased between 1995 and 2012. The German economy achieved in 2012 a R&D intensity of 2.98%, reaching thereby with this 20 years peak level for the first time nearly the 3% target of the German innovation policy formulated earlier in the Lisbon Agenda und actually pro-claimed in the Agenda Europe 2020.51 Germany is since 2011 producing more R&D intensive than the U. S.-economy but is showing smaller R&D intensities in comparison with leading industrial economies, e.g. South Korea, Finland, Sweden or Japan (see table 1).
To the investments of 93.987 million US-$ R&D expenditures in 2011 con-tributed the private industry 67.7%, the universities 17.8% and the governmen-tal institutions 14.5%, which indicates a stable R&D allocation structure over the last ten years comparable with the OECD average in 2011 (67.3%, 18.4% and 11.8% and non-governmental organisations 2.5%).52 In sum the National Innovation System is providing a comprehensive high qualitative potential for the innovation activity of the German industry.
51 Schasse et al. (2014), p. 18.52 Schasse et al. (2014), p. 116.
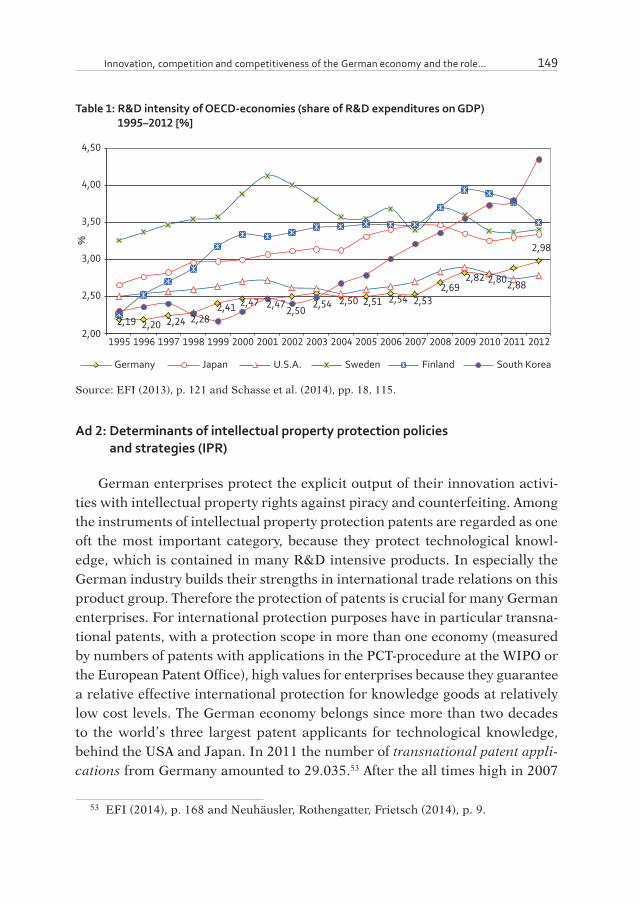
Innovation, competition and competitiveness of the German economy and the role... 149
Table 1: R&D intensity of OECD-economies (share of R&D expenditures on GDP) 1995–2012 [%]
2,19 2,20 2,24 2,282,41 2,47 2,47
2,502,54 2,50 2,51 2,54 2,53
2,692,82 2,802,88
2,98
2,00
2,50
3,00
3,50
4,00
4,50
1995 1996 1997 1998 1999 2000 2001 2002 2003 2004 2005 2006 2007 2008 2009 2010 2011 2012
%
Germany Japan U.S.A. Sweden Finland South Korea
Source: EFI (2013), p. 121 and Schasse et al. (2014), pp. 18, 115.
Ad 2: Determinants of intellectual property protection policies and strategies (IPR)
German enterprises protect the explicit output of their innovation activi-ties with intellectual property rights against piracy and counterfeiting. Among the instruments of intellectual property protection patents are regarded as one oft the most important category, because they protect technological knowl-edge, which is contained in many R&D intensive products. In especially the German industry builds their strengths in international trade relations on this product group. Therefore the protection of patents is crucial for many German enterprises. For international protection purposes have in particular transna-tional patents, with a protection scope in more than one economy (measured by numbers of patents with applications in the PCT-procedure at the WIPO or the European Patent Office), high values for enterprises because they guarantee a relative effective international protection for knowledge goods at relatively low cost levels. The German economy belongs since more than two decades to the world’s three largest patent applicants for technological knowledge, behind the USA and Japan. In 2011 the number of transnational patent appli-cations from Germany amounted to 29.035.53 After the all times high in 2007
53 EFI (2014), p. 168 and Neuhäusler, Rothengatter, Frietsch (2014), p. 9.

Andreas Bielig 150
with 30.627 patent applications the application numbers reduced during the economic crisis by 7.6% and show since 2010 again small increases of patent activity. Numbers of German transnational patent applications increased in the early 1990 s in the relative perspective very fast by 4.7% average p.a. until 1995 (measured by the fixed 5 years average backwards). In the late 90 s the applica-tion dynamics even speeded up to a 12.3% average growth rate p.a. until 2000. Then in the early 2000 s the application dynamics moderated to 2.7% average growth p.a. until 2005 and in the late 2000 s the annual average growth rate reduced, also intensified as a result of the crisis, to small increases by only 0.4% p.a. until 2010 (see table 2).
Table 2: Numbers of transnational patent applications of leading economies 1991–2011
0
10000
20000
30000
40000
50000
60000
70000
91 92 93 94 95 96 97 98 99 00 01 02 03 04 05 06 07 08 09 10 11
USA Japan Germany South Korea China
Source: EFI (2014), p. 168 and Neuhäusler, Rothengatter, Frietsch (2014), p. 9.
These findings show that the most progressive development of international patent applications occurred in the late 1990 s. The current moderation devel-opment in patent dynamics is therefore not mainly a result of crisis phenom-ena but rather a sign for a long-term shift in patenting structures of German enterprises. The German industry followed with these temporal shifts in inter-national patenting a worldwide trend which is observable also in other leading patenting economies. An analogous development showed the US and the Japa-nese economy. They increased their patenting dynamics in the late 1990 s sig-nificantly (USA 12.7% p.a., Japan 14.1% p.a.) with peaks in 1999 (USA 19.1% and Japan 19.6% annual growth rate) and reduced the patenting dynamics

Innovation, competition and competitiveness of the German economy and the role... 151
after the year 2000 (USA 2.8% p.a., Japan 6.5% p.a.) in a volatile but intact downward trend of growth rates. After 2000 increased the South Korean and the Chinese economy their patent efforts on international level to close the existing gap to the leading economies.
If numbers of patent applications are weighted by the population size, the resulting patent intensity (measured as patent applications per million work-ing population) is more adequately reflecting the efforts of economies in tech-nological knowledge output and protection. The German economy achieved in 2011 with an intensity of 731 transnational patents in the international per-spective the fifth rank behind Switzerland (878), Finland (780), Sweden (769) and Japan (758).54 The EU-28 average was 334 patent applications. In the field of high technology products with the leading Swedish economy (with 522 pat-ents) the patent intensity of the German industry was 412 patent applications (rank 5), whereas the EU-28 average was on a level of 190 patent applications.
With a specialisation index for the relative patent activity can be analysed if the patenting activity of an economy is more intensive than the world aver-age. For the area of products of higher value the German economy shows since more than two decades patenting activity above the world average.55 In 2011 the specialisation index showed a value of 10, only surpassed by the Japanese economy with an index value of 14 (see table 3).
The specialisation in patenting of higher value product technologies inten-sified over the time, leading from a moderate average index level of 4 in the early 1990 s to a level of 7 in the late 1990 s and of outstanding 10 index points since the beginning of 2000. A similar time structure of patenting efforts reveals only the Japanese economy, which increased its efforts in this product area late 1990 s and returned to high index levels in the late 2000 years after an intermediate period of moderation between. The Swiss economy showed also a long-term specialisation structure in higher value products with strong pat-enting activities in this area above the world average in the early 1990 s and the late 2000 s. In comparison with this other competing economies showed periodically shifting patenting patterns (e.g. South Korea) or transformed exist-ing specialisations into clear disadvantages (e.g. China). The area of higher value products is belonging to the traditional core competencies in innovation activity of the German industry, which is reflected by the revealed specialisa-tion patterns of the German enterprises with an intensive patenting activity
54 Neuhäusler, Rothengatter, Frietsch (2014), p. 11.55 EFI (2014), p. 169.

Andreas Bielig 152
in this field. But also the patenting behaviour of higher value technologies by the enterprises contributed substantially to the stable strong competitiveness of the German economy in international trade in the last years.
Table 3: Specialisation index of transnational patent applications of leading economies in the area of products of higher value (relative patent activity) [index] 1991–2011
−50
−40
−30
−20
−10
0
10
20
30
40
91 92 93 94 95 96 97 98 99 00 01 02 03 04 05 06 07 08 09 10 11
Japan Germany Switzerland
South Korea China
Source: EFI (2014), p. 169.
In patenting of high technology products the German economy reveals since two decades substantial disadvantages in the international perspective, measured by the index of relative patent activity.56 The index value decreased in 1991–2011 even from –40 to –44, reaching the lowest level in 1994 with –45 and its peak in 2001 with –26, signalling the remarkable gap of German enterprise patenting patterns in high technology to the world average. With this negative specialisation profile of underweighting high technology in the technology portfolio the German industry is revealing similar trends like the Swiss economy, which preserved also a long term disadvantage of compara-ble dimensions in this area (see table 4).
56 EFI (2014), p. 169.

Innovation, competition and competitiveness of the German economy and the role... 153
Table 4: Specialisation index of transnational patent applications of leading economies in the area of high technology products (relative patent activity) [index] 1991–2011
−60
−40
−20
0
20
40
60
91 92 93 94 95 96 97 98 99 00 01 02 03 04 05 06 07 08 09 10 11
USA Japan Germany
Switzerland Sweden China
Source: EFI (2014), p. 169.
The leading international competitors are the Chinese economy, which was able to transform its disadvantages in high technology product patent-ing in the late 1990 s into an internationally outstanding advantage position, the US-economy, which could preserve nearly its patenting position, and the Swedish economy, which transformed also in the late 1990 s existing disadvan-tages into advantage positions, interrupted by an intermediate downward trend between 2001 and 2004. A structural shift in the opposite direction occurred in the patenting patterns of the Japanese economy since 1991, where the exist-ing advantage position with patenting high technology products through Jap-anese enterprises above the world average transformed after a stabilisation period between 2000 and 2008 into a growing disadvantage until 2011. The revealed disadvantage of the German economy in high technology product pat-enting is reflecting the negative aspects of specialisation patterns in innovation, which focus mainly on higher value technologies but thereby only to a smaller degree serving innovation demands in high technology areas. The poor long term performance in high technology patenting in the international perspec-tive is stabilising also the clear disadvantages in international trade competi-tiveness with only small contributions to the protection of new high technology areas for German enterprises in the future. The underutilization of intellec-tual property in this field signalises a prolongation of existing disadvantages in
Andreas Bielig 154
innovation activity into future weaknesses of competitiveness in international trade. The decreasing index value since 2001 is reflecting furthermore a trend with strong negative implications for further future decreases in international competitiveness.
Ad 3: Determinants of innovation and competition conduct (ICC)
Research and development for innovation in the German economy is not concentrated on few industrial sectors. Innovative activity is observable in enterprises through the whole economy but with uneven dispersed level of activity engagements. In 2011 the German industry invested 50.804.210 € as internal R&D expenditures. With internal costs of 43.733.376 € the overwhelming share was spent by the manufacturing sector, the rest of 13.9% was invested by other sectors. Most R&D active industrial sector were automotive and vehicle producers with 18.914.281 €, electrotechnical and electronics producers with 8.165.077 € and the machinery sector with 4.902.500 € followed by the phar-maceutical and chemical industry with 4.069.729 respective 3.296.674 €.57 The German industry reveals according this a specific industrial R&D structure, which is different from that of other industrial economies concerning two deci-sive characteristics with important implications for the innovation position: 1. The automotive sector as a sector of traditional key strengths of the German industry, which covers nearly one third of internal R&D expenditures of the economy, and accompanied by machinery producers with 10% and chemical industry with 7% are sectors with an over average level of innovation activity seen from the international perspective. 2. Sectors of IT-devices, electronics and optical products (13% of internal R&D) are together with the service sector (14%) in the international comparison underrepresented in innovation activi-ties.58 The present allocation of innovation activity is supporting thereby the existing structures of innovation potentials of the German industries, refining the comparative advantages but less compensating the existing disadvantages. But also on the micro-level of enterprises a strong asymmetry in innovation activity engagement measured by firm size is observable. From the whole inter-nal R&D expenditures in 2011 78.3% are covered by large enterprises of firm sizes with 1.000 and more employees and with substantial financial sources. The next ranked enterprise segment of firm sizes between 100 and 499 employ-
57 EFI (2014), p. 153.58 Schasse et al. (2014), p. 42.

Innovation, competition and competitiveness of the German economy and the role... 155
ees contributed only with 10.1% to the innovation activity.59 Concerning the allocation of internal R&D expenditures reveals the innovation activity in the German economy a visible concentration on large enterprises on the factor input side. The 11 most innovation active German enterprises invested in 2012 41.936.2 million € in R&D expenditures in Germany and abroad. Among the five firms of the leading enterprises are four producers of the automotive sec-tor, which underlines the relevance and dominance of this industrial segment for the present innovation processes in the German economy.60 Three firms are producers of pharmaceuticals and biotechnology, each one is producing elec-tronics and electrotechnics, software and computer services, or chemicals (see table 5). Also on the allocation of R&D investments at the firm level a strong concentration on traditional strengths of the German industry, especially on the automotive sector is visible, whereas others, e.g IT-services are underrep-resented in the leading group or missing, e.g. ITC-technologies.
Table 5: World wide R&D expenditures of most innovation active German enterprises in 2012 [million €]
Rank Enterprise Sector R&D expenditures
1 Volkswagen Automotive 9515.0
2 Daimler Automotive 5639.0
3 Robert Bosch Automotive 4924.0
4 Siemens Electronics and electrotechnicals 4572.0
5 BMW Automotive 3952.0
6 Bayer Pharmaceuticals and biotechnology 3182.0
7 Boehringer Ingelheim Pharmaceuticals and biotechnology 2795.0
8 SAP Software and computer services 2253.0
9 Continental Automotive 1826.9
10 BASF Chemicals 1766.0
11 Merck Pharmaceuticals and biotechnology 1511.3
Source: Schasse et al. (2014), p. 42.
But also the allocation of R&D activities among enterprises in specific sec-tors allows important insights into the concentration of innovation activity. The largest share of enterprises with R&D activities in 2011 reveals the sector of IT, electronics and optical devices with around 100% of innovation active
59 EFI (2014), p. 153.60 Schasse et al. (2014), p. 42.
Andreas Bielig 156
enterprises at the aggregated level, the second largest share of R&D active enterprises has the aircraft and space technology sector with 72% and the third rank hold the transportation equipment and chemicals producers with 48 respective 47%.61 Nevertheless is the allocation of R&D activities in some cases varying substantially between the different firm size categories in spe-cific sectors, e.g. in the area of transportation equipment producers between 43 to 100% shares. If the internal R&D expenditures are weighted with earn-ings of the enterprises, the R&D intensity of industrial sectors can be analysed, measured as shares of internal R&D on earnings. In the German economy the pharmaceutical sector has in 2012 with 13.2% the largest R&D intensity, fol-lowed by the IT, electronics and optical device producers with 13.0% and the air and spacecraft producers with 12.3%.62 The average R&D intensity of the German industry in 2012 was 3.2%. Substantial increases of the R&D inten-sity in 2010–2012 revealed only IT, electronics and optical device producers with a growth rate of 2.6%-points, followed by transportation equipment pro-ducers with 0.9 and the pharmaceutical industry with a 0.5%-points increase. Machinery and air and spacecraft producers reduced in contrast to this their R&D intensity in this period by 0.4 and 0.1%-points.
R&D activities of enterprises are not limited to the creation of products and services of the “own” branches. Many enterprises in the German economy conduct their innovation activities across sectors by serving R&D demands in other product groups and sectors or receiving R&D services from other sectors. These sector intertwinings of R&D activities, measured by the share of cross-sector R&D expenditures, is most relevant for typical service sec-tors, e.g. for the specific structure of the scientific R&D sector with 100%, or providers of repair and installations of machines and equipment with 47%.63 But also producers of electrical equipment invest 11% of R&D for products in other industrial sectors, like automotive and automobile parts, IT-technolo-gies, or electronics and optical devices (see table 6). Conversely 25% of R&D for the sector of electrical equipment is conducted by other sectors. Similar R&D intertwining processes are observable between electronics, machinery and metal products manufacturing, where microelectronic technology is func-tioning as interlinking cross-section technology. Especially industrial sectors with higher R&D intensity reveal intensively intertwined R&D process chains
61 Schasse et al. (2014), p. 116.62 EFI (2014), p. 154.63 Schasse et al. (2014), pp. 48–50.
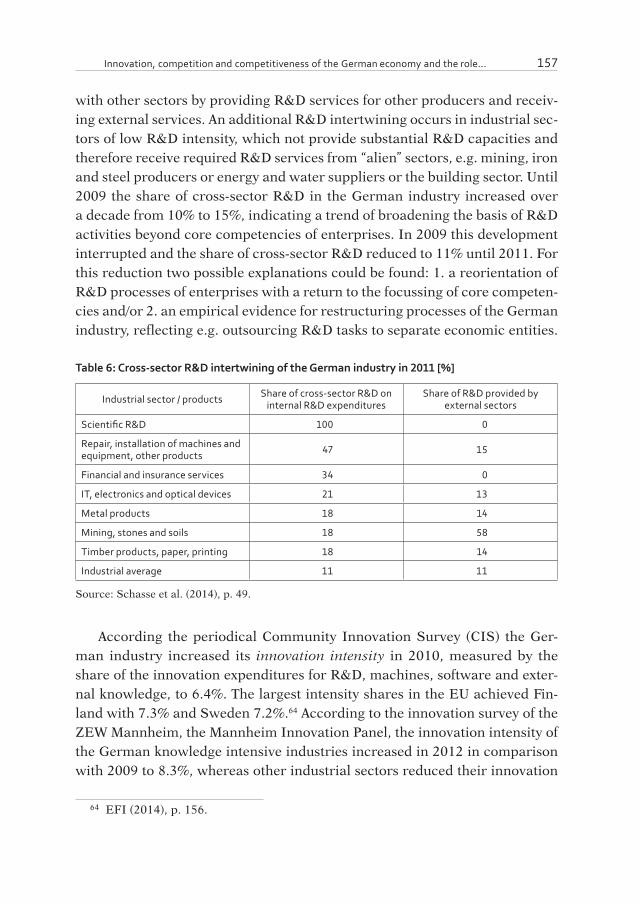
Innovation, competition and competitiveness of the German economy and the role... 157
with other sectors by providing R&D services for other producers and receiv-ing external services. An additional R&D intertwining occurs in industrial sec-tors of low R&D intensity, which not provide substantial R&D capacities and therefore receive required R&D services from “alien” sectors, e.g. mining, iron and steel producers or energy and water suppliers or the building sector. Until 2009 the share of cross-sector R&D in the German industry increased over a decade from 10% to 15%, indicating a trend of broadening the basis of R&D activities beyond core competencies of enterprises. In 2009 this development interrupted and the share of cross-sector R&D reduced to 11% until 2011. For this reduction two possible explanations could be found: 1. a reorientation of R&D processes of enterprises with a return to the focussing of core competen-cies and/or 2. an empirical evidence for restructuring processes of the German industry, reflecting e.g. outsourcing R&D tasks to separate economic entities.
Table 6: Cross-sector R&D intertwining of the German industry in 2011 [%]
Industrial sector / products Share of cross-sector R&D on internal R&D expenditures
Share of R&D provided by external sectors
Scientific R&D 100 0
Repair, installation of machines and equipment, other products 47 15
Financial and insurance services 34 0
IT, electronics and optical devices 21 13
Metal products 18 14
Mining, stones and soils 18 58
Timber products, paper, printing 18 14
Industrial average 11 11
Source: Schasse et al. (2014), p. 49.
According the periodical Community Innovation Survey (CIS) the Ger-man industry increased its innovation intensity in 2010, measured by the share of the innovation expenditures for R&D, machines, software and exter-nal knowledge, to 6.4%. The largest intensity shares in the EU achieved Fin-land with 7.3% and Sweden 7.2%.64 According to the innovation survey of the ZEW Mannheim, the Mannheim Innovation Panel, the innovation intensity of the German knowledge intensive industries increased in 2012 in comparison with 2009 to 8.3%, whereas other industrial sectors reduced their innovation
64 EFI (2014), p. 156.
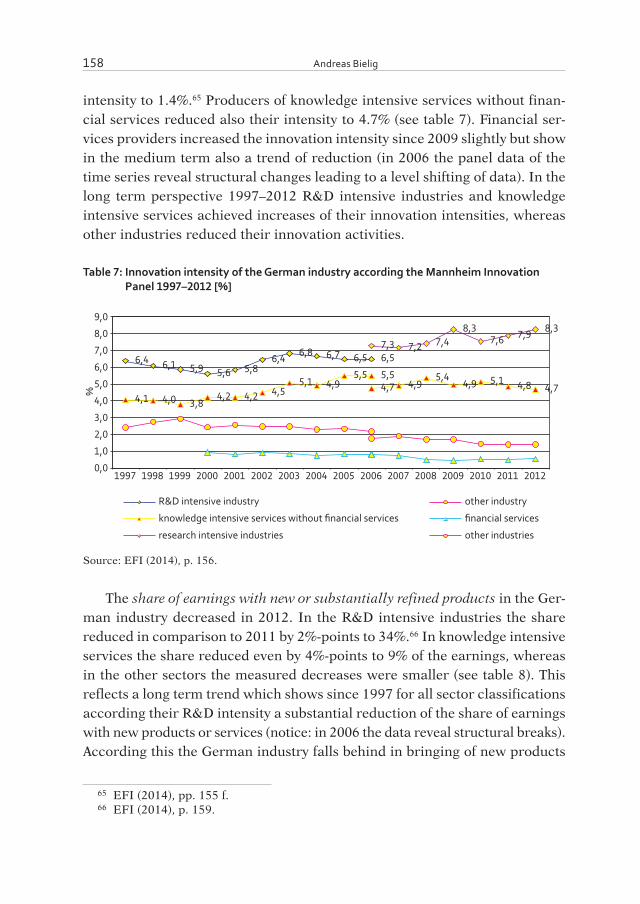
Andreas Bielig 158
intensity to 1.4%.65 Producers of knowledge intensive services without finan-cial services reduced also their intensity to 4.7% (see table 7). Financial ser-vices providers increased the innovation intensity since 2009 slightly but show in the medium term also a trend of reduction (in 2006 the panel data of the time series reveal structural changes leading to a level shifting of data). In the long term perspective 1997–2012 R&D intensive industries and knowledge intensive services achieved increases of their innovation intensities, whereas other industries reduced their innovation activities.
Table 7: Innovation intensity of the German industry according the Mannheim Innovation Panel 1997–2012 [%]
6,4 6,1 5,9 5,6 5,86,4 6,8 6,7 6,5 6,5
4,1 4,0 3,84,2 4,2 4,5
5,1 4,95,5 5,5
7,3 7,2 7,48,3
7,6 7,9 8,3
4,7 4,95,4
4,9 5,1 4,8 4,7
0,0
1,0
2,0
3,0
4,0
5,0
6,0
7,0
8,0
9,0
1997 1998 1999 2000 2001 2002 2003 2004 2005 2006 2007 2008 2009 2010 2011 2012
%
R&D intensive industry other industry
knowledge intensive services without financial services financial services
research intensive industries other industries
Source: EFI (2014), p. 156.
The share of earnings with new or substantially refined products in the Ger-man industry decreased in 2012. In the R&D intensive industries the share reduced in comparison to 2011 by 2%-points to 34%.66 In knowledge intensive services the share reduced even by 4%-points to 9% of the earnings, whereas in the other sectors the measured decreases were smaller (see table 8). This reflects a long term trend which shows since 1997 for all sector classifications according their R&D intensity a substantial reduction of the share of earnings with new products or services (notice: in 2006 the data reveal structural breaks). According this the German industry falls behind in bringing of new products
65 EFI (2014), pp. 155 f.66 EFI (2014), p. 159.
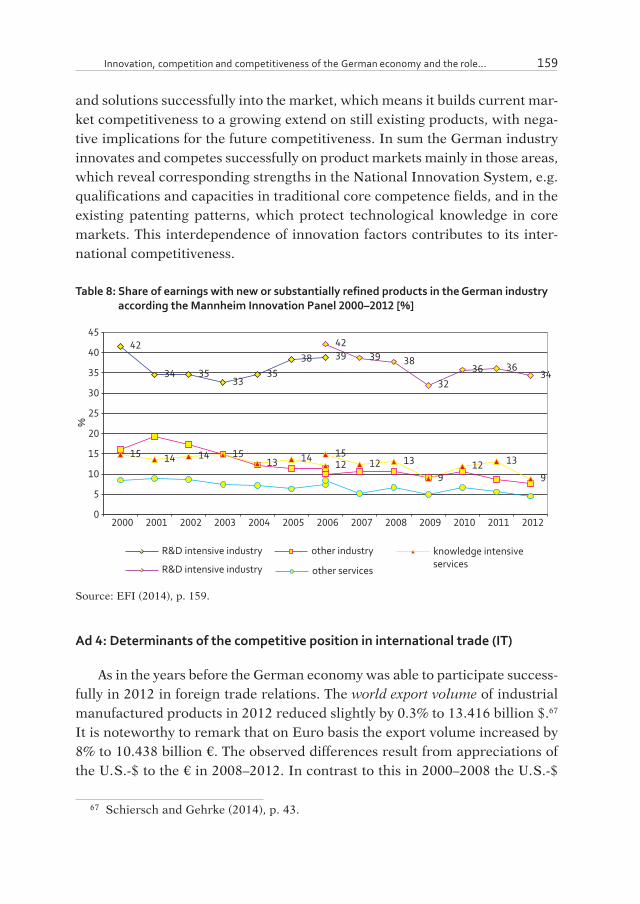
Innovation, competition and competitiveness of the German economy and the role... 159
and solutions successfully into the market, which means it builds current mar-ket competitiveness to a growing extend on still existing products, with nega-tive implications for the future competitiveness. In sum the German industry innovates and competes successfully on product markets mainly in those areas, which reveal corresponding strengths in the National Innovation System, e.g. qualifications and capacities in traditional core competence fields, and in the existing patenting patterns, which protect technological knowledge in core markets. This interdependence of innovation factors contributes to its inter-national competitiveness.
Table 8: Share of earnings with new or substantially refined products in the German industry according the Mannheim Innovation Panel 2000–2012 [%]
42
34 3533
3538 39
15 14 14 1513 14
12
4239 38
3236 36
34
1512 13
912 13
9
0
5
10
15
20
25
30
35
40
45
2000 2001 2002 2003 2004 2005 2006 2007 2008 2009 2010 2011 2012
%
R&D intensive industry other industry knowledge intensiveservices
other servicesR&D intensive industry
Source: EFI (2014), p. 159.
Ad 4: Determinants of the competitive position in international trade (IT)
As in the years before the German economy was able to participate success-fully in 2012 in foreign trade relations. The world export volume of industrial manufactured products in 2012 reduced slightly by 0.3% to 13.416 billion $.67 It is noteworthy to remark that on Euro basis the export volume increased by 8% to 10.438 billion €. The observed differences result from appreciations of the U. S.-$ to the € in 2008–2012. In contrast to this in 2000–2008 the U. S.-$
67 Schiersch and Gehrke (2014), p. 43.

Andreas Bielig 160
depreciated strongly in comparison to the Euro, with the result that increases in world trade were quantified larger if they were priced in Dollar instead of the Euro. On a $-basis the world exports in R&D intensive products amounted to 5.758 billion $, containing trade of higher value products of 3.888 billion $ value and trade of 1.870 billion $ of high technology products. In comparison with 2011 the trade in R&D intensive products increased slightly by 0.3% as an aggregated result of two diverging developments: The trade in high tech-nology products achieved increases by 2.6%, whereas the trade of higher value products decreased by 0.7%. The negative trend in the larger share of the latter product group is dominating the overall effect on the trade with R&D inten-sive goods. These were recording despite of negative influences in sum a pos-itive annual change rate. In contrast to this the world trade with non-R&D intensive products decreased by 0.8%. In this trade surrounding the German economy achieved in 2012 in trade of R&D intensive products a trade balance of 276.8 billion $. The dominating share was covered by higher value prod-ucts with a trade balance of 259.7 billion $. Only a small share of 17.1 billion $ was achieved by the trade of high technology products. Measured in per capita results the German industry was receiving a trade surplus per capita in R&D intensive goods of 3.383.4 $. In products of higher value the German economy achieved a surplus of 3.174.4 $ per capita, in products of high technology the surplus was only 209 $. According these results the German economy could compete successfully in international trade with R&D intensive products, also if the population size is considered (see table 9), but reveals substantial dif-ferences in competitiveness between the areas of higher value products and the field of high technology goods, where the competitiveness is significantly smaller than in the first mentioned.
Table 9: Trade surplus of leading economies in international trade with R&D intensive products in 2012 [$]
Economy Trade balance per capita [$]
R&D intensive products High technology products Higher value products
Switzerland 4.713.6 1.779.5 2.934.1
Germany 3.383.4 209.0 3.174.4
South Korea 2.806.0 1173.6 1632.4
Japan 1758.6 24.9 1.733.7
Netherlands 900.9 53.6 847.3
Source: Schiersch and Gehrke (2014), p. 47.
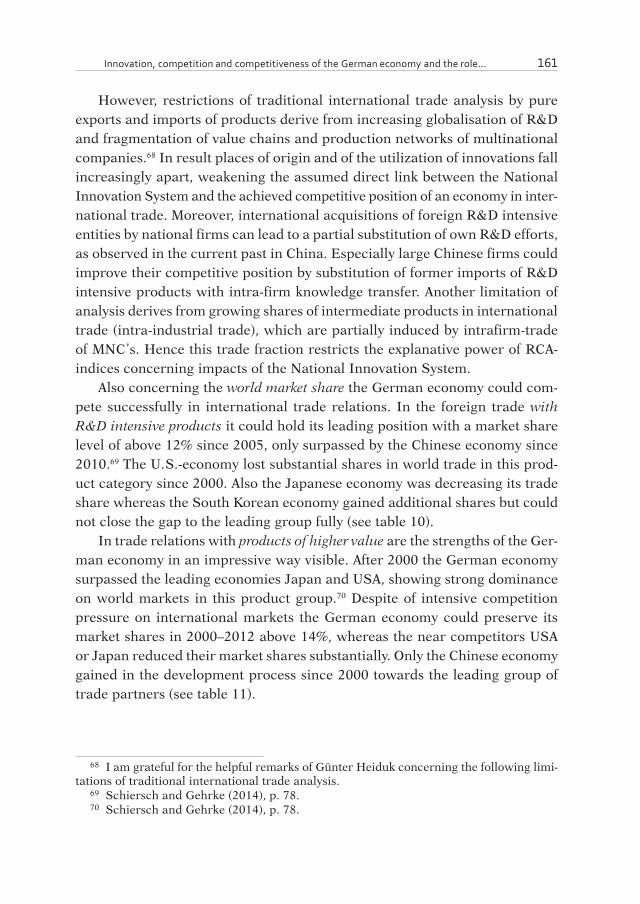
Innovation, competition and competitiveness of the German economy and the role... 161
However, restrictions of traditional international trade analysis by pure exports and imports of products derive from increasing globalisation of R&D and fragmentation of value chains and production networks of multinational companies.68 In result places of origin and of the utilization of innovations fall increasingly apart, weakening the assumed direct link between the National Innovation System and the achieved competitive position of an economy in inter-national trade. Moreover, international acquisitions of foreign R&D intensive entities by national firms can lead to a partial substitution of own R&D efforts, as observed in the current past in China. Especially large Chinese firms could improve their competitive position by substitution of former imports of R&D intensive products with intra-firm knowledge transfer. Another limitation of analysis derives from growing shares of intermediate products in international trade (intra-industrial trade), which are partially induced by intrafirm-trade of MNC’s. Hence this trade fraction restricts the explanative power of RCA-indices concerning impacts of the National Innovation System.
Also concerning the world market share the German economy could com-pete successfully in international trade relations. In the foreign trade with R&D intensive products it could hold its leading position with a market share level of above 12% since 2005, only surpassed by the Chinese economy since 2010.69 The U. S.-economy lost substantial shares in world trade in this prod-uct category since 2000. Also the Japanese economy was decreasing its trade share whereas the South Korean economy gained additional shares but could not close the gap to the leading group fully (see table 10).
In trade relations with products of higher value are the strengths of the Ger-man economy in an impressive way visible. After 2000 the German economy surpassed the leading economies Japan and USA, showing strong dominance on world markets in this product group.70 Despite of intensive competition pressure on international markets the German economy could preserve its market shares in 2000–2012 above 14%, whereas the near competitors USA or Japan reduced their market shares substantially. Only the Chinese economy gained in the development process since 2000 towards the leading group of trade partners (see table 11).
68 I am grateful for the helpful remarks of Günter Heiduk concerning the following limi-tations of traditional international trade analysis.
69 Schiersch and Gehrke (2014), p. 78.70 Schiersch and Gehrke (2014), p. 78.

Andreas Bielig 162
Table 10: World market share of leading economies in international trade with R&D intensive products in 2000–2012 [%]
11,1
13,313,6
12,712,2 12,7
12,2
2,0
4,0
6,0
8,0
10,0
12,0
14,0
16,0
18,0
2000 2005 2008 2009 2010 2011 2012
%
Germany China USA Japan South Korea
Source: Schiersch and Gehrke (2014), p. 78.
Table 11: World market share of leading economies in international trade with products of higher value in 2000–2012 [%]
13,3
15,5 15,614,8
14,3 14,7 14,1
2,0
4,0
6,0
8,0
10,0
12,0
14,0
16,0
18,0
2000 2005 2008 2009 2010 2011 2012
%
Germany China USA Japan South Korea
Source: Schiersch and Gehrke (2014), p. 78.
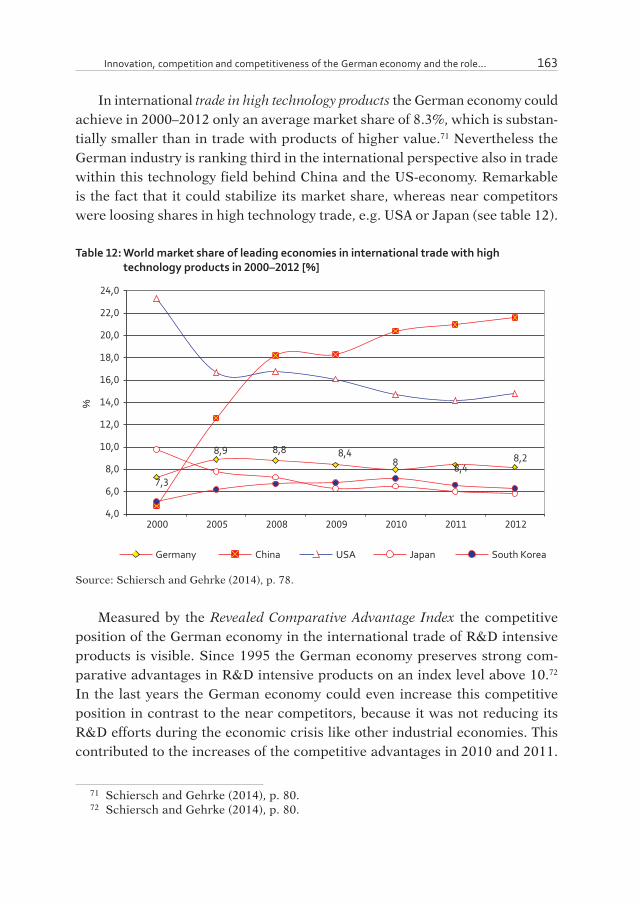
Innovation, competition and competitiveness of the German economy and the role... 163
In international trade in high technology products the German economy could achieve in 2000–2012 only an average market share of 8.3%, which is substan-tially smaller than in trade with products of higher value.71 Nevertheless the German industry is ranking third in the international perspective also in trade within this technology field behind China and the US-economy. Remarkable is the fact that it could stabilize its market share, whereas near competitors were loosing shares in high technology trade, e.g. USA or Japan (see table 12).
Table 12: World market share of leading economies in international trade with high technology products in 2000–2012 [%]
7,3
8,9 8,8 8,48 8,4
8,2
4,0
6,0
8,0
10,0
12,0
14,0
16,0
18,0
20,0
22,0
24,0
2000 2005 2008 2009 2010 2011 2012
%
Germany China USA Japan South Korea
Source: Schiersch and Gehrke (2014), p. 78.
Measured by the Revealed Comparative Advantage Index the competitive position of the German economy in the international trade of R&D intensive products is visible. Since 1995 the German economy preserves strong com-parative advantages in R&D intensive products on an index level above 10.72 In the last years the German economy could even increase this competitive position in contrast to the near competitors, because it was not reducing its R&D efforts during the economic crisis like other industrial economies. This contributed to the increases of the competitive advantages in 2010 and 2011.
71 Schiersch and Gehrke (2014), p. 80.72 Schiersch and Gehrke (2014), p. 80.
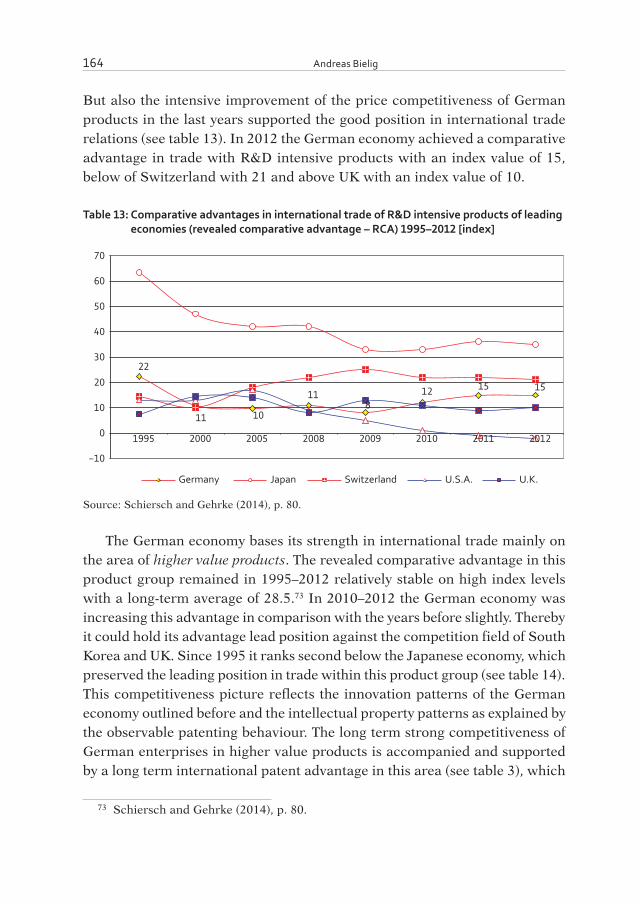
Andreas Bielig 164
But also the intensive improvement of the price competitiveness of German products in the last years supported the good position in international trade relations (see table 13). In 2012 the German economy achieved a comparative advantage in trade with R&D intensive products with an index value of 15, below of Switzerland with 21 and above UK with an index value of 10.
Table 13: Comparative advantages in international trade of R&D intensive products of leading economies (revealed comparative advantage – RCA) 1995–2012 [index]
22
11 10
118
12 15 15
−10
0
10
20
30
40
50
60
70
1995 2000 2005 2008 2009 2010 2011 2012
Germany Japan Switzerland U.S.A. U.K.
Source: Schiersch and Gehrke (2014), p. 80.
The German economy bases its strength in international trade mainly on the area of higher value products. The revealed comparative advantage in this product group remained in 1995–2012 relatively stable on high index levels with a long-term average of 28.5.73 In 2010–2012 the German economy was increasing this advantage in comparison with the years before slightly. Thereby it could hold its advantage lead position against the competition field of South Korea and UK. Since 1995 it ranks second below the Japanese economy, which preserved the leading position in trade within this product group (see table 14). This competitiveness picture reflects the innovation patterns of the German economy outlined before and the intellectual property patterns as explained by the observable patenting behaviour. The long term strong competitiveness of German enterprises in higher value products is accompanied and supported by a long term international patent advantage in this area (see table 3), which
73 Schiersch and Gehrke (2014), p. 80.

Innovation, competition and competitiveness of the German economy and the role... 165
secures and stabilises the competitiveness of enterprises in the core branches of the German industry. Patents are relatively effective instruments to protect technologies inhibited in products and to secure markets against competitors, which make them crucial for German enterprises to achieve outstanding com-petitive positions in the international perspective. In the area of higher value products German enterprises use this instrument relatively adequate and efficient.
Table 14: Comparative advantages in international trade of higher value products of leading economies (revealed comparative advantage – RCA) 1995–2012 [index]
3627 27 25 23
30 31 29
−20
0
20
40
60
80
100
1995 2000 2005 2008 2009 2010 2011 2012
Germany Japan South KoreaU.K U.S.A.
Source: Schiersch and Gehrke (2014), p. 80.
In the international trade with high technology products the German econ-omy reveals in 1995–2012 stable comparative disadvantages. The long-term average RCA index in this product group is –29.6, which shows the structural problems of the German economy in this field of technologies.74 In the last two years the German industry could reduce the disadvantage to a comparable level of 1995 but the existing gap to the leading group of economies is nevertheless remaining stable on a high level (see table 15).
74 Schiersch and Gehrke (2014), p. 80.
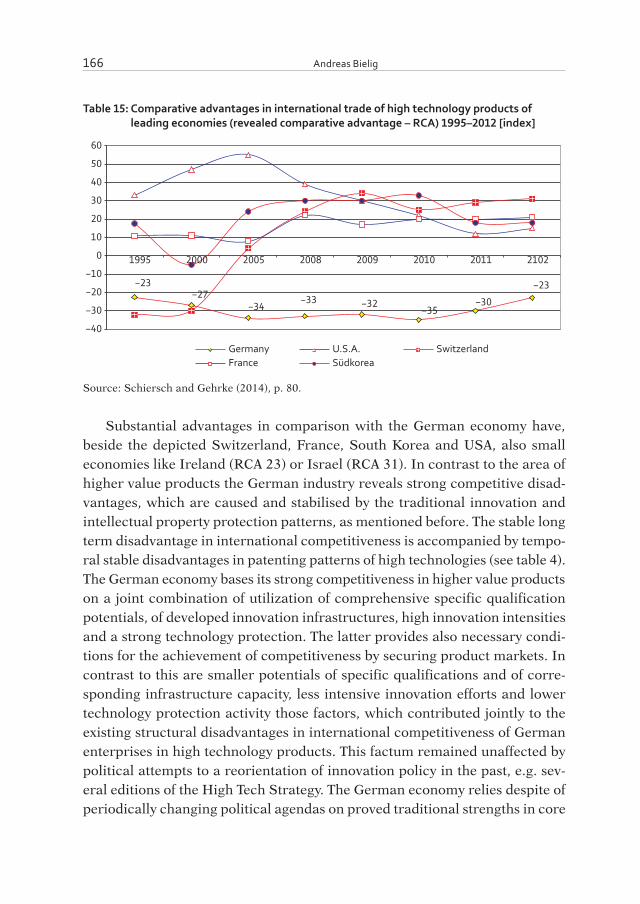
Andreas Bielig 166
Table 15: Comparative advantages in international trade of high technology products of leading economies (revealed comparative advantage – RCA) 1995–2012 [index]
−23−27
−34−33 −32
−35−30
−23
−40
−30
−20
−10
0
10
20
30
40
50
60
1995 2000 2005 2008 2009 2010 2011 2102
Germany U.S.A. SwitzerlandFrance Südkorea
Source: Schiersch and Gehrke (2014), p. 80.
Substantial advantages in comparison with the German economy have, beside the depicted Switzerland, France, South Korea and USA, also small economies like Ireland (RCA 23) or Israel (RCA 31). In contrast to the area of higher value products the German industry reveals strong competitive disad-vantages, which are caused and stabilised by the traditional innovation and intellectual property protection patterns, as mentioned before. The stable long term disadvantage in international competitiveness is accompanied by tempo-ral stable disadvantages in patenting patterns of high technologies (see table 4). The German economy bases its strong competitiveness in higher value products on a joint combination of utilization of comprehensive specific qualification potentials, of developed innovation infrastructures, high innovation intensities and a strong technology protection. The latter provides also necessary condi-tions for the achievement of competitiveness by securing product markets. In contrast to this are smaller potentials of specific qualifications and of corre-sponding infrastructure capacity, less intensive innovation efforts and lower technology protection activity those factors, which contributed jointly to the existing structural disadvantages in international competitiveness of German enterprises in high technology products. This factum remained unaffected by political attempts to a reorientation of innovation policy in the past, e.g. sev-eral editions of the High Tech Strategy. The German economy relies despite of periodically changing political agendas on proved traditional strengths in core

Innovation, competition and competitiveness of the German economy and the role... 167
areas of innovation activity, which build the key for the overall excellent cur-rent economic performance but provide also question tags for future innova-tion processes.
6. Summary
Intellectual property has the functions to foster innovation activity in the economy by setting economic incentives for resource investments and to pro-vide workable competition on markets for knowledge goods in the long run by the steady attraction of creative activity to serve markets with new products and solutions. Both functions of intellectual property are especially for the German economy and society of strong relevance. The specialization patterns of the German industry on R&D intensive products and services require for their resource and knowledge intensive innovation processes adequate protec-tion instruments for accumulated stocks of explicit knowledge. The protection provided by intellectual property systems constitutes an important instrument for this demand. However about the impact of intellectual property on inter-national trade and about its role for competitiveness is only limited evidence with ambiguous results available. In particular for the German economy with its strong dependence on exports results of actual analysis on this issue are missing. This contrasts the intensive recognition of intellectual property issues in the German policy and complains of German enterprises about lacking pro-tection conditions in many regions of international trade. The new research approach serves this research demand for the case of the German economy. For the analysis factors and processes of the German National Innovation Sys-tem, the policies and strategies of intellectual property protection, the innova-tion and competition conduct and of international trade are considered. The research design reflects the dependence of effects of intellectual property on factors of linked innovation and production processes. First preliminary results support the hypothesis of a positive joint influence of patent protection patterns on trade competitiveness of German enterprises with corresponding factors of the national innovation system and innovation and competition conduct.
Andreas Bielig 168
ABSTRACT
International competitiveness of the German economy is mainly based on innova-tion activity. Innovative products require sufficient protection of implicit knowledge, making intellectual property protection to a key issue in innovation activity, especially for the German industry. The work develops in the first step a general framework for evaluating the economic impact of intellectual property on international trade competitiveness with respect to the German industry. Current economic analyses of intellectual property regimes on international trade reveal ambiguous results, sug-gesting a general positive impact on trade flows but with strong dependence on the status of trade openness, national innovation system, qualitative development level of industrial structures or the focussed industrial sectors. The introduced research framework targets on the analysis of factors which influence the impact of intellec-tual property on international trade competitiveness of economies, industrial sectors or enterprises. It focuses on the integrated analysis of relevant determinants in four areas: 1. factors of national innovation system, 2. structures of intellectual property protection policies and strategies applied by economic subjects, 3. factors of innova-tion and competition conduct and 4. factors of competitive position in international trade. Based on this approach the work presents as a second result in chapter 5 first descriptive evidence for the analysis of the German economy in 1991–2013.
Keywords: innovation, intellectual property, international trade, German economy, competitiveness
References
Baethge, M. et al. (2014): Bildung und Qualifikation als Grundlage der technologi-schen Leistungsfähigkeit Deutschlands 2014. Schwerpunkt: Neue Konstellation zwischen Hochschulbildung und Berufsausbildung, Studien zum deutschen Inno-vationssystem Nr. 1–2014, DZHW, NIW, SOFI, Berlin.
Balassa, B. (1962): Recent developments in the competitiveness of American indus-try and prospects for the future. Factors affecting the United States balance of pay-ments, Washington, D. C.
Bielig, A. (2012): Intellectual Property and economic development in Germany. Empiri-cal evidence for 1999–2009, in: European Journal of Law and Economics, vol. 33, DOI: 10.1007/s10657-012-9324–5, http://www.springerlink.com/openurl.asp?genre=article&id=doi:10.1007/s10657-012-9324–5.
Bielig, A. (2013): Die Rolle des Geistigen Eigentums in der Wirtschaft. Theorie und Praxis, Warschau.
Innovation, competition and competitiveness of the German economy and the role... 169
Bielig, A. (2014): Die Entwicklung des deutschen Außenhandels mit forschungs- und entwicklungsintensiven Gütern, in: Bielig, A., Olszynski, J (eds.), Nowe zjawiska w gospodarce Niemiec i polsko-niemieckich stosunkach gospodarczych, eng.: New developments in the German Economy and the German-polish Economic Relations, Warsaw, pp. 135–172.
Bielig, A., Olszynski, J. (2014): International competitiveness of countries with per-forming innovation systems. Case study: Germany, in: Weresa, M. (ed.): Innova-tion, human capital and trade competitiveness. How are they connected and why do they matter? Comparing countries in Europe, North America and Asia, Springer Series Innovation, technology and knowledge management, Cham, Heidelberg, New York, Dordrecht, London, pp. 229–252.
Cagnin, C. Amanatidou, E., Keenan, M. (2012): Orienting European Innovation Sys-tems Towards Grand Challenges and the Roles that FTA Can Play, in: Science and Public Policy, vol. 39, no. 2, pp. 140–152.
Chatterjee, S. et al. (2014): Intellectual property rights in developing nations, in: http://www.mondaq.com/unitedstates/x/57856/Trademark/Intellectual+Property+Rights+In+Developing+Nations (06.06.2014).
Chin, J. C., Grossman, G. M. (1988): Intellectual Property Rights and North – South Trade. NBER Working Paper Series, No. 2769, Cambridge.
Czajkowski, Z. et al. (2014): Human capital and innovation. Basic concepts, meas-ures, and interdependencies, in: Weresa, M. (ed.): Innovation, human capital and trade competitiveness. How are they connected and why do they matter? Com-paring countries in Europe, North America and Asia, Springer Series Innova-tion, technology and knowledge management, Cham, Heidelberg, New York, Dordrecht, London, pp. 53–80.
Destatis (2014): Altersstruktur der Be völker ung auf Grund lage des Zensus nahe zu un ver ändert, Pressemitteilung 10.04.2014, Wiesbaden.
Diwan, I., Rodrik, D. (1989): Patents, appropriate technology, and North-South trade, NBER Working Paper Series, No. 2974, Cambridge.
Dunning, J. H. (1992): The competitive advantage of countries and the activities of transnational corporations, Transnational corporations, no. 2, UNCTC, New York.
European Patent office (EPO) (2007): Scenarios for the future. How might IP regimes evolve by 2025? What global legitimacy might such regimes have?, Munich.
Expertenkommission Forschung und Innovation (EFI) (2013, 2014): Gutachten zu Forschung, Innovation und technologischer Leistungsfähigkeit Deutschlands 2013 und 2014, Berlin.
Falvey, R., Foster, N. (2006): The role of intellectual property rights in technology trans-fer and economic growth. Theory and evidence, United Nations Industrial Devel-opment Organization, Working paper, Vienna.
Falvey, R., Foster, N., Greenaway, D. (2009): Trade, imitative ability and intellec-tual property rights, in: Review of World Economics, 145, pp. 373–404, DOI 10.1007/s10290-009–0028-z.
Andreas Bielig 170
Ferrantino, M. J. (1993): The effect of intellectual property rights on international trade and investment, in: Weltwirtschaftliches Archiv, vol. 129, pp. 300–331.
Fink, C., Braga, C. A. P. (1999): How stronger protection of intellectual property rights affects international trade flows, Policy research working paper, November, World Bank.
Ginarte, J. C., Park, W. G. (1997): Determinants of patent rights. A cross-national study, in: Research Policy, vol. 26, pp. 283–301.
Glass, A. J., Saggi, K. (2002): Intellectual property rights and foreign direct investment, in: Journal of International Economics, vol. 56, pp. 387–410.
Gould, D. M., Gruben, W. C. (1996): The role of intellectual property rights in economic growth, in: Journal of Development Economics, vol. 48, no. 2, pp. 323–350.
Grossman, G., Lai, E. L.-C. (2004): International protection of intellectual property, in: American Economic Review, vol. 94, no. 5, pp. 1635–1653.
Helpman, E. (1992): Innovation, imitation, and intellectual property rights, NBER Working Paper Series, No. 4081, Cambridge.
Lai, E. L.-C. (1998): International intellectual property rights protection and the rate of product innovation, in: Journal of Development Economics, vol. 55, pp. 133–153.
Lai, E., Qui, L. D. (2003): The north’s intellectual property rights standard for the south?, in: Journal of International Economics, vol. 59, no. 1, pp. 183–209.
Lee, J.-Y., Mansfield, E. (1996): Intellectual Property Protection and U. S. Foreign Direct Investment, in: The Review of Economics and Statistics, vol. 78, no. 2, pp. 181–186.
Markusen, J. R. (1998): Contracts, intellectual property rights, and multinational investment in developing countries, NBER Working Paper Series, no. 6448, Cambridge.
Maskus, K. E., Penubarti, M. (1995): How trade-related are intellectual property rights?, in: Journal of International Economics, vol. 39, pp. 227–248.
Misala, J. (2014): Theoretical grounds for the development of long-term competitive advantages in international trade, in: Weresa, M. (ed.): Innovation, human capi-tal and trade competitiveness. How are they connected and why do they mat-ter? Comparing countries in Europe, North America and Asia, Springer Series Innovation, technology and knowledge management, Cham, Heidelberg, New York, Dordrecht, London, pp. 3–51.
Neuhäusler, P., Rothengatter, O., Frietsch, R. (2013): Patent Applications – Struc-tures, Trends and Recent Developments, Studien zum deutschen Innovations-system Nr. 5, Fraunhofer Institute for Systems and Innovation Research ISI, Karlsruhe.
Neuhäusler, P., Rothengatter, O., Frietsch, R. (2014): Patent Applications – Struc-tures, Trends and Recent Developments 2013, Studien zum deutschen Innova-tionssystem Nr. 4, Fraunhofer Institute for Systems and Innovation Research ISI, Karlsruhe.
Innovation, competition and competitiveness of the German economy and the role... 171
Park, W. G. (2008): International patent protection: 1960–2005, in: Research Policy, doi:10.1016/j.respol.2008.01.006.
Porter, M. (1990): The competitive advantage of nations, New York.Rapp, R., Rozek, R. (1990): Benefits and costs of intellectual property protection
in developing countries, in: Journal of World Trade, vol. 24, no. 2, pp. 75–102.Reiljan, J., Hinrikus, M., Ivanov, A. (2000): Key issues in defining and analysing the
competitiveness of a country, Working paper, no. 1, Faculty of Economics and Business Administration, University of Tartu, Tartu.
Schasse, U. et al. (2014): Forschungs- und Entwicklungsaktivitäten der deutschen Wirtschaft, Studien zum deutschen Innovationssystem Nr. 2, DIW Berlin, Nied-ersächsisches Institut für Wirtschaftsforschung e. V. Hannover, Stifterverband für die Deutsche Wissenschaft Essen, Berlin.
Schiersch, A., Gehrke, B. (2013): FuE-intensive Industrien und wissensintensive Dien-stleis-tungen im internationalen Vergleich, Studien zum deutschen Innovations-system Nr. 7, DIW Berlin, Niedersächsisches Institut für Wirtschaftsforschung e. V., Hannover.
Schiersch, A., Gehrke, B. (2013): FuE-intensive Industrien und wissensintensive Dien-stleis-tungen im internationalen Vergleich, Studien zum deutschen Innovations-system Nr. 7, DIW Berlin, Niedersächsisches Institut für Wirtschaftsforschung e. V., Hannover.
Schiersch, A., Gehrke, B. (2014): Die Wissenswirtschaft im internationalen Vergleich. Strukturen, Produktivität, Außenhandel, Studien zum deutschen Innovations-system Nr. 6, DIW Berlin, Niedersächsisches Institut für Wirtschaftsforschung e. V., Hannover.
Trabold, H. (1995): Die internationale Wettbewerbsfähigkeit einer Volkswirtschaft, Nr. 5, Vierteljahreshefte zur Wirtschaftsforschung, DIW, Berlin.
Weng, Y., Yang, C.-H., Huang, Y.-J. (2009): Intellectual property rights and U. S. infor-mation goods exports. The role of imitation threat, in: Journal of Cultural Eco-nomics, 33, pp. 109–134, DOI 10.1007/s10824-009-9095–1.
Weresa, M. (2014): Concept of national innovation system and international competi-tiveness – a theoretical approach, in: Weresa, M. (ed.): Innovation, human capital and trade competitiveness. How are they connected and why do they matter? Comparing countries in Europe, North America and Asia, Springer Series Inno-vation, technology and knowledge management, Cham, Heidelberg, New York, Dordrecht, London, pp. 81–103.
World Economic Forum (WEF) (2013): The Global Competitiveness Report 2013–2014, Cologny, Geneva.
Yang, G., Maskus, K. E. (2001): Intellectual property rights, licensing, and innovation in an endogenous product-cycle model, in: Journal of International Economics, vol. 53, no. 1, pp 169–187.


Elżbieta CZARNY*Katarzyna ŚLEDZIEWSKA**
HANDEL PRODUKTAMI O RÓŻNYM ZAAWANSOWANIU TECHNOLOGICZNYM
MIĘDZY POLSKĄ A NIEMCAMI I UE15
Wprowadzenie
W opracowaniu1 zajmujemy się tematem handlu wewnątrzgałęziowego (IIT, intra-industry trade) Polski z Niemcami. Przedstawiamy go na tle wymiany pro-wadzonej przez Polskę ze „starymi” państwami członkowskimi Unii Europej-skiej (UE15). W ten sposób pokazujemy, na ile intensywnie Polska uczestniczy w takim handlu, rozwijanym zwykle w krajach uprzemysłowionych, z naj-silniejszym państwem członkowskim UE i zarazem największym partnerem handlowym, a także z całą grupą państw UE o najwyższym poziomie rozwoju. Uważamy intensywne prowadzenie IIT za pośredni dowód konkurencyjności polskich towarów na wymagającym rynku, na którym dostępne są podobne dobra pochodzące z UE i spoza niej, zaś zamożnych nabywców trudno jest zadowolić. IIT analizujemy w podziale na handel produktami pochodzącymi z branż przemysłu zagregowanych według stopnia zaawansowania technolo-gicznego, czyli zgodnie z klasyfikacją grup towarowych w modelu GTAP. Wyróż-niamy cztery grupy dóbr: wysoko zaawansowane technologicznie (w dalszej części tekstu oraz na rysunkach HT, high tech), średnio wysoko zaawanso-wane technologicznie (MHT, middle high tech), średnio nisko zaawansowane
* Szkoła Główna Handlowa w Warszawie, * e-mail: [email protected]** Uniwersytet Warszawski, Wydział Nauk Ekonomicznych, * e-mail: k.sledziewska@
uw.edu.pl1 Projekt został sfinansowany ze środków Narodowego Centrum Nauki przyznanych
na podstawie decyzji nr DEC-2013/11/B/HS4/02126.

Elżbieta Czarny, Katarzyna Śledziewska174
technologicznie (MLT, middle low tech) oraz nisko zaawansowane technolo-gicznie (LT, low tech).
Badanie zagregowanych strumieni handlu dotyczy 15-lecia od powstania strefy Euro w 1999 roku do 2013 roku. W tym czasie zawiera się 10 lat człon-kostwa Polski w UE (2004-2013). Analiza dotycząca lat 1999–2013 oraz 2004–2013 pozwala natomiast stwierdzić, jakie zmiany w polskim IIT z Niemcami oraz Piętnastką zaszły jeszcze przed akcesją Polski do UE, jakie zaś dopiero po niej. W analizach zdezagregowanych strumieni handlu wewnątrzgałęzio-wego, gdzie ilość danych przekracza możliwość analizy i prezentacji, ograni-czamy uwagę wyłącznie do okresu członkostwa Polski w UE. Porównujemy więc zmiany zachodzące między rokiem akcesji Polski do UE (2004) a końco-wym rokiem badania (2013). W badaniu wykorzystujemy dane pochodzące z Eurostatu za Comext (http://epp.eurostat.ec.europa.eu/newxtweb/).
Dalsza część opracowania składa się z czterech podrozdziałów. W pierw-szym krótko przypominamy przyczyny prowadzenia handlu wewnątrzgałęzio-wego, jego cechy, formy oraz sposoby mierzenia. W drugim badamy strukturę polskiego eksportu/importu do/z Niemiec oraz UE15. Osobno badamy eks-port oraz import ze względu na nierównowagi handlowe, które Polska w róż-nych latach notowała w wymianie towarowej z tymi partnerami. Traktujemy to badanie jako wstęp do analizy IIT w polskiej wymianie towarowej z Niem-cami i z UE15. W podrozdziale trzecim porównujemy zmiany udziału handlu wewnątrzgałęziowego oraz jego strumieni poziomych i pionowych w wymia-nie towarowej Polski z Niemcami oraz z UE15. Ostatni, czwarty podrozdział zawiera podsumowanie.
1. Przyczyny prowadzenia handlu wewnątrzgałęziowego, jego formy oraz sposoby mierzenia
W przeszłości korzyści z wymiany towarowej wynikały z różnic między państwami. Odmienne wyposażenie w czynniki produkcji, techniki wytwa-rzania, gusty nabywców oraz położenie geograficzne sprawiały, że każde pań-stwo specjalizowało się w produkcji jednych dóbr, pozostawiając wytwarzanie innych partnerom handlowym. Przedmiotem wymiany były towary różniące się cechami fizycznymi i zastosowaniami. Dobra kupowane za granicą i wytwa-rzane w kraju były komplementarne, zaś handel określano mianem międzyga-łęziowego. Ten typ handlu także dziś pozostaje istotnym składnikiem światowej
Handel produktami o różnym zaawansowaniu technologicznym między Polską... 175
wymiany towarowej, zwłaszcza między partnerami o różnym poziomie roz-woju gospodarczego.
Jednak w dzisiejszej gospodarce światowej na znaczeniu zyskał nowy typ handlu. Handluje się bowiem podobnymi produktami pochodzącymi z jednej branży. Taką wymianę określa się mianem wewnątrzgałęziowej lub, inaczej, dwukierunkowej (IIT od intra-industry trade). Ten typ handlu jest domeną państw uprzemysłowionych, które nie różnią się zbytnio ani względnymi zasobami czynników, ani technikami produkcji. Przedmiotem tej wymiany są zazwyczaj dobra przetworzone (a więc ze swej natury zaawansowane technologicznie), w których produkcji wykorzystuje się inne niż tradycyjne czynniki wytwórcze, zwłaszcza kapitał ludzki. Handluje się dobrami podobnymi (substytutami), a zatem przedmiotem IIT są produkty zróżnicowane.
Isnieją różne przyczyny prowadzenia wymiany wewnątrzgałęziowej i każda z nich tłumaczy obecność tylko niektórych jej strumieni. Podstawową przyczyną prowadzenia handlu wewnątrzgałęziowego jest obecność rosnących korzyści skali produkcji i zbytu w firmie. Wynikają one np. z konieczności ponosze-nia dużych kosztów poprzedzających produkcję (np. badania nad produktem, inwestycje początkowe). Otwarcie gospodarki pozwala rozszerzyć produkcję i obniżyć koszt przeciętny. Nabywcy uzyskują odmiany wytwarzane w kraju i za granicą, co w przypadku ich zamiłowania do różnorodności pozwala zwiększyć zadowolenie2. IIT może też być konsekwencją rozwoju technicz-nego gospodarek narodowych (zgodnie z teoriami luki technologicznej Posnera oraz cyklu życia produktu Vernona3). Także odmienna charakterystyka popytu w różnych krajach może być przyczyną specjalizacji i źródłem korzyści z han-dlu wewnątrzgałęziowego4. Kolejnym czynnikiem wspierającym rozwój IIT jest istnienie wspólnej granicy łączącej partnerów handlowych, która stanowi potwierdzenie ich bliskości geograficznej i niskiego kosztu transportu (czy – bardziej ogólnie – niskich kosztów transakcyjnych handlu5). Rozwojowi IIT
2 Szerzej na temat teorii IIT: E. Czarny (2002): Teoria i praktyka handlu wewntrzgaBzio-wego, Oficyna WydawniczaSGH, Warszawa.
3 Por. V. Posner (1961): International Trade and Technical Change, “Oxford Economic Papers”, pazdziernik, s. 323–341; R. Vernon (1966): International Investment and Inter-national Trade in the Product Cycle, “Quarterly Journal of Economics”, vol. 80, no. 2, s. 190–207.
4 Por. S. B. Linder (1961): An Essay on Trade and Transformation, Uppsala.5 Por. C. Culem, L. Lundberg (1986): The Product Pattern of Intra-Industry Trade: Sta-
bility among Countries and over Time, “Weltwirtschaftliches Archiv”, vol. 122, no. 1, s.115–116; B. Eichengreen, D. A. Irwin D. A. (1998): The Role of History in Bilateral Trade Flows w: The Regionalization of the World Economy, red. J. A. Frankel, The University of Chicago Press, Chicago, s. 33.
Elżbieta Czarny, Katarzyna Śledziewska176
sprzyja też mała różnica między PKB handlujących partnerów6 oraz ich PKB pc. Taki handel staje się intensywniejszy w miarę otwierania gospodarek, czyli – w szczególności – wraz z postępami integracji ekonomicznej. Na intensyw-ność prowadzenia IIT wpływają ponadto bezpośrednie inwestycje zagraniczne (BIZ), które umożliwiają dopływ nowoczesnej techniki, pozwalającej zmniej-szyć lukę technologiczną w stosunku do zagranicy7.
Ponieważ różne czynniki decydują o odmiennych strumieniach handlu wewnątrzgałęziowego, zwykle bada się go w podziale na odmiany poziomą oraz pionową, odnoszące się – odpowiednio – do poziomego i pionowego róż-nicowania dóbr.
O poziomym różnicowaniu produktu, z którym wiąże się pozioma wymiana wewnątrzgałęziowa (HIIT, horizontal intra-industry trade), mówi się wówczas, gdy poszczególne odmiany mają taką samą jakość, lecz różnią się pozajako-ściowymi cechami ważnymi z punktu widzenia nabywcy (np. cechy widoczne, jak barwa tkaniny lub odczuwane np. smak wina). Dana odmiana dobra zróż-nicowanego poziomo wykazuje większe natężenie przynajmniej jednej cechy, mając jednocześnie mniejsze natężenie innej cechy8. W przypadku produktów zróżnicowanych poziomo nie da się wskazać odmian, które wszyscy uważają za najlepsze. Wybór kupowanej odmiany zależy od subiektywnego stosunku kon-sumentów do poszczególnych dóbr. Nabywcy albo lubią różnorodność i chcą kupować tak wiele odmian, jak tylko się da, albo chcą mieć dobra o ściśle okre-ślonym, lecz w skali społeczeństwa różnym, natężeniu cech.
Z pionowym różnicowaniem dóbr (i pionowym handlem wewnątrzgałę-ziowym, VIIT, vertical intra-industry trade) mamy do czynienia wówczas, gdy odmiany produktu różnią się jakością9. Jedna odmiana wykazuje zatem w porów-naniu z drugą większą intensywność pewnej cechy (cech) lub posiada dodat-kową właściwość, której nie ma druga10. Każdy nabywca uznaje najlepszy pod względem jakości typ produktu za najbardziej pożądany. Jednak wzrost jako-
6 Por.. E. Helpman (1981): International Trade in the Presence of Product Differentia-tion, Economies of Scale, and Monopolistic Competition: A Chamberlin – Heckscher – Ohlin Approach, “Journal of International Economics”, vol. 11, s. 327.
7 Por. M. Landesmann (1995): The Pattern of East-West European Integration: Catching up or Falling Behind? w: Transforming Economies and European Integration, red. R. Dobrin-sky, M. Landesmann, Edward Elgar Pub, Aldershot.
8 J. Weigand, E. Lehmann (1997): Produktdifferenzierung, „Wirtschaftswissenschaftli-ches Studium WiSt“, bd. 26, nr 9, s. 477.
9 W rzeczywistości gospodarczej różnicowanie poziome i pionowe występuje łącznie. W analizie teoretycznej i empirycznej rozdziela się je, gdyż o prowadzeniu HIIT i VIIT decy-dują odmienne przyczyny (szerzej: por. E. Czarny (2002): Teoria i praktyka, op.cit.).
10 J. Weigand, E. Lehmann (1997): Produktdifferenzierung, op.cit.,, s. 477.

Handel produktami o różnym zaawansowaniu technologicznym między Polską... 177
ści wymaga zazwyczaj poniesienia dodatkowych nakładów i podraża produkt. Konsument decyduje się więc zwykle na najwyższy poziom jakości, na jaki go stać. Wybór wynika zatem z wysokości dochodu nabywcy. Konsumenci zado-walają się odmianą najlepszą jakościowo spośród odmian dostępnych finan-sowo. Ponieważ w przypadku produktów różniących się jakością ważne jest, czy badany kraj eksportuje produkty o wyższej jakości niż importuje, czy raczej jego produkty eksportowe mają jakość niższą niż te z importu, rozróżnia się dwa rodzaje handlu pionowego. W pierwszym przypadku badany kraj eksportuje produkty o wyższej jakości niż te, które importuje. Mówi się wówczas o han-dlu pionowym wysokiej jakości, czyli w skrócie VIIT wysoka jakość. W drugim przypadku produkty eksportowe mają niższą jakość niż importowe, IIT zaś określa się mianem pionowego niskiej jakości (VIIT niska jakość).
Mierzenie handlu wewnątrzgałęziowego polega zwykle na określaniu jego udziału w wymianie towarowej danego kraju. Podstawą pomiaru są obroty dwustronne, co pozwala uniknąć błędnego uznania za wewnątrzgałęziowy równoczesnego eksportu i importu danego dobra w handlu z kilkoma partne-rami należącymi do badanej grupy (agregatu). Sumy i moduły różnic agreguje się następnie do poziomu grup.
W analizie uwzględnia się cztery aspekty: kraj (k), jego partnera handlo-wego (k’), produkt (j) oraz rok (t). Wskaźnik Grubela i Lloyda11, będący najpo-pularniejszą miarą intensywności IIT, przyjmuje następującą postać:
GLk,k ',j ,t
=1−X
kk 'it− M
kk 'iti∈j∑
k '∑
k∑
(Xkk 'it
+ Mkk 'it
)i∈j∑
k '∑
k∑ (1)
W tym badaniu stosujemy miary Fontagné’a i Freudenberga, tak jak to zro-bili Crespo i Fontoura12. Miary poziomego i pionowego handlu wewnątrzga-łęziowego pochodzą od Greenawaya, Hine’a i Milnera13, którzy przyjmują że ilustracją różnic jakości produktów jest odmienna wysokość ich cen, będących
11 Por. H. G. Grubel, P. J. Lloyd (1975): Intra-Industry Trade: the Theory and Measurement of Intra-Industry Trade in Differentiated Products, Macmillan, London.
12 Por. N. Crespo, M. P. Fontoura (2001): Determinants of the pattern of horizontal and vertical intra-industry trade: what can we learn from Portuguese data?, Working Paper ISEG No 9, Lisboa; L. Fontagné, M. Freudenberg (1997): Intra-Industry Trade: Methodological Issues Reconsidered, CEPII Document de Travail 97–01, Pary|.
13 Por. D. Greenaway, R. C. Hine, C. Milner (1999): Vertical and Horizontal Intra-Indus-try Trade: An Analysis of Country- and Industry-specific Determinants, red. M. Brülhart, s. 73; D. Greenaway, R. C. Hine, C. Milner (1994): Country Specific Factors and the Pattern

Elżbieta Czarny, Katarzyna Śledziewska178
przybliżeniem jednostkowych wartości dóbr. Greenaway, Hine i Milner propo-nują rozróżnianie wymiany poziomej i pionowej na podstawie względnych war-tości jednostkowych eksportu i importu mierzonych np. w USD/kg. Jeżeli ceny produktów zróżnicowanych eksportowanych do różnych krajów i importowa-nych z nich są odmienne, to przyjmuje się, że ich odmiany różnią się jakością.
O zakwalifikowaniu handlu danym produktem do poziomej wymiany wewnątrzgałęziowej decyduje spełnienie kryterium podobieństwa, zgodnie z którym różnica między jednostkowymi wartościami eksportu i importu jest niewielka. Kryterium podobieństwa ma następującą postać:
1
1+α≤
UViEx
UViIm
≤1+α , (2)
gdzie α zwyczajowo jest równe 15%.Z handlem pionowym z eksportem danego produktu z kraju k o wyższej
jakości w porównaniu z importem (VIIT wysoka jakość) mamy do czynienia, kiedy jednostkowa wartość eksportu jest znacznie wyższa niż jednostkowa wartość importu:
UV
iEx
UViIm
>1+α . (3)
Z kolei handel jest pionowy z eksportem produktu z kraju k o względnie niskiej jakości w porównaniu z importem VIIT niska jakość wówczas, gdy jednostkowa wartość eksportu jest znacznie niższa niż jednostkowa wartość importu:
UV
iEx
UViIm
< 11+α . (4)
Wyżej cytowani Greenaway, Hine i Milner przekształcają wskaźnik Gru-bela – Lloyda ze wzoru (1), rozróżniając strumienie wymiany poziomej i pio-nowej. Ten wskaźnik obliczamy, dodając do siebie trzy strumienie IIT (HIIT, VIIT wysoka jakość oraz VIIT niska jakość). Jako wagi wykorzystujemy udziały każdego strumienia IIT w wymianie:
GLj=1−
XjH − M
jH + X
jVIITlow − M
jVIITlow + X
jVIIThigh − M
jVIIThigh
Xj+ M
j
⎛
⎝⎜⎜
⎞
⎠⎟⎟ (5)
of Horizontal and Vertical Intra-Industry Trade in the United Kingdom, “Weltwirtschaftliches Archiv”, vol. 130, no. 1, s. 77–100.

Handel produktami o różnym zaawansowaniu technologicznym między Polską... 179
W badaniu empirycznym wskaźniki IIT (oraz HIIT i obu strumieni VIIT) obliczamy w procentach, ich zaś zmiany w punktach procentowych (p.p.).
2. Struktura rzeczowa polskiego handlu z Niemcami oraz z UE15
W tym podrozdziale sprawdzamy, jaką część polskiego handlu z Niemcami stanowią produkty zaawansowane technologicznie. Badamy, na ile ich udział zmienił się jeszcze przed akcesją, czyli w latach 1999–2003, na ile zaś dopiero po niej (2004–2013). Robimy tak, gdyż dostosowania do członkostwa spowodo-wały zmiany istotne z punktu widzenia struktury i wielkości handlu na długo przed akcesją (np. przeprowadzono dostosowania jakościowe, wprowadzono unijne normy i standardy). Objęcie badaniem 5 lat poprzedzających akcesję Polski pozwoli stwierdzić, czy dopiero akcesja uruchomiła mechanizmy intensy-fikacji handlu, w tym wymiany wewnątrzgałęziowej, czy też wystarczyły dosto-sowania przedakcesyjne. Zobaczymy więc, czy moment wejścia Polski do UE spowodował radykalną zmianę struktury handlu z Niemcami oraz UE15, czy też przemiany były rozłożone w czasie.
Co więcej, lata poprzedzające akcesję przypadają na pogłębienie integra-cji „starych” państw członkowskich po powstaniu w 1999 roku europejskiej unii walutowej (strefy euro), czego ważnym skutkiem powinna być – zgodnie z teorią – intensyfikacja ich wzajemnego handlu. Sprawdzimy, czy intensyfi-kacja handlu w toku dostosowań przedakcesyjnych nastąpiła pomimo pozy-tywnych impulsów do szczególnie silnego rozwoju wymiany w tej części UE, która przyjęła wspólną walutę.
Dodatkowym elementem analizy jest porównanie struktury rzeczowej pol-skiego eksportu do Niemiec i do całej UE15. W ten sposób weryfikujemy obie-gową opinię o tym, że Polska w handlu z Niemcami jest dostawcą produktów o względnie niskim stopniu przetworzenia lub niskiej jakości, Niemcy natomiast dostarczają na jej rynek głównie produkty o najwyższym zaawansowaniu tech-nologicznym. Ta analiza jest wstępem do badania rzeczowej struktury i inten-sywności polskiego handlu wewnątrzgałęziowego z Niemcami oraz z UE15 przeprowadzonego w następnym podrozdziale.
Na początek przyglądamy się ogólnym zmianom struktury polskiego eks-portu do Niemiec (rysunek 1). Rzuca się w nim w oczy duży spadek znacze-nia eksportu produktów o niskim zaawansowaniu technologicznym (LT). O ile w 1999 roku były one grupą towarową o największym udziale w polskim eksporcie do Niemiec, o tyle w 2000 roku spadły na pozycję drugą, na której
Elżbieta Czarny, Katarzyna Śledziewska180
pozostały do końca badanego okresu i zanotowały znaczny spadek udziału (prawie 15 p.p. w latach 1999–2013).
Rysunek 1. Udziały produktów o różnym zaawansowaniu technologicznym w polskim eksporcie do Niemiec w latach 1999–2013, w procentach14
0,0
5,0
10,0
15,0
20,0
25,0
30,0
35,0
40,0
45,0
1999 2000 2001 2002 2003 2004 2005 2006 2007 2008 2009 2010 2011 2012 2013
HT MHT MLT LT
Źródło: Eurostat, http://epp.eurostat.ec.europa.eu/newxtweb/ (20.05.2015).
Z kolei najlepszym dowodem pozytywnej zmiany struktury polskiego eks-portu do Niemiec jest to, że liderem zostały produkty średnio wysoko zaawan-sowane technologicznie. A zatem polski eksport zyskał na zaawansowaniu technologicznym. Ten stan znajduje potwierdzenie także w tym, że od 2007 roku udział w eksporcie produktów najbardziej zaawansowanych technologicznie (HT) przekracza 5%. Powodem do zadowolenia jest również to, że w czasie kryzysu udziały polskich produktów typu HT oraz MHT w eksporcie do Nie-miec rosły, co zapewne wynika ze względnie wysokiego stosunku jakości do ceny polskich wyrobów15. Przysłowiową łyżką dziegciu w beczce miodu jest spadek udziału w polskim eksporcie do Niemiec dóbr średnio wysoko zaawan-sowanych technologicznie po 2009 roku z 40% do około 36% i lekki spadek udziału dóbr typu high tech w ostatnich latach.
14 Oznaczenia: HT – wysoko zaawansowane technologicznie, MHT – średnio wysoko zaawansowane technologicznie, MLT – średnio nisko zaawansowane technologicznie, LT – nisko zaawansowane technologicznie.
15 Analiza cen oferowanych przez różne państwa sprzedające towary na rynku niemiec-kim wykracza poza ramy tego opracowania.

Handel produktami o różnym zaawansowaniu technologicznym między Polską... 181
Rysunek 2. Udziały produktów o różnym zaawansowaniu technologicznym w polskim eksporcie do Niemiec i do UE15 w 2013 roku, w procentach, oraz zmiany udziałów w porównaniu z 2004 rokiem w punktach procentowych16
Źródło: Eurostat, http://epp.eurostat.ec.europa.eu/newxtweb/ (20.05.2015).
Jeżeli porównamy strukturę rzeczową polskiego eksportu do Niemiec i UE15 po akcesji zobaczymy przede wszystkim, że UE15 kupuje w Polsce względnie więcej produktów HT niż Niemcy (odpowiednie udziały wynoszą w 2013 roku odpowiednio 9,4% i 6,1%). Produkty średnio wysoko zaawansowane techno-logicznie, będące liderem polskiego eksportu i do Niemiec, i do UE15, mają prawie identyczny udział w eksporcie do obu partnerów (odpowiednio 36% i 35,9%). Podobne są też udziały produktów średnio nisko zaawansowanych technologicznie (23,4% i 23%). Niemcy kupują za to od Polski względnie wię-cej produktów nisko zaawansowanych technologicznie (27,6% w porównaniu z 26,5% w polskim eksporcie do UE15).
Niepokojące jest jednak to, że dobra MHT tracą udziały w polskim eks-porcie do obu partnerów, przy czym o ile straty w handlu z Niemcami były niewielkie (–0,6 p.p. w latach 2004–2013) i zostały z nawiązką zrekompen-sowane wzrostem udziału dóbr HT (3 p.p.), o tyle w wymianie z UE15 strata była duża (–4,3 p.p.) i nie została w pełni zrekompensowana, ponieważ wzrost udziału dóbr HT wyniósł 4,1 p.p. Jednak można stwierdzić, że polski eksport do Niemiec staje się bardziej zaawansowany technologicznie, gdyż obie grupy (HT i MHT) łącznie zyskały 2,4 p.p. Trudniej jest o taką ocenę kondycji pol-skiego eksportu do UE15, gdyż w latach 2004–2013 dwie grupy o największym
16 Oznaczenia, jak pod rysunkiem 1.
Elżbieta Czarny, Katarzyna Śledziewska182
zaawansowaniu technologicznym łącznie zmniejszyły swój udział w eksporcie o 0,2 p.p., podczas gdy grupy o względnie najniższym zaawansowaniu techno-logicznym (MLT i LT) zwiększyły go o 0,7 p.p.
Rysunek 3. Udziały produktów o różnym zaawansowaniu technologicznym w niemieckim eksporcie do Polski w latach 1999–2013, w procentach17
0,0
10,0
20,0
30,0
40,0
50,0
60,0
1999 2000 2001 2002 2003 2004 2005 2006 2007 2008 2009 2010 2011 2012 2013
HT MHT MLT LT
Źródło: Eurostat, http://epp.eurostat.ec.europa.eu/newxtweb/ (20.05.2015).
Jeżeli porównamy strukturę rzeczową polskiego eksportu do Niemiec ze strukturą niemieckiego importu do Polski, zobaczymy, że w imporcie bynaj-mniej nie dominują produkty o najwyższym zaawansowaniu technologicznym, lecz dobra średnio wysoko zaawansowane technologicznie, te same, które od 2000 roku są liderem polskiego eksportu do Niemiec, co dobrze rokuje dla rozwoju IIT w dwustronnym handlu tych państw. Podobnie jak w eksporcie z Polski do Niemiec, spośród badanych grup najmniejszy udział mają produkty najwyżej zaawansowane technologicznie. Jednak udział HT w imporcie z Nie-miec do Polski jest około dwa razy większy niż analogiczny udział w eksporcie z Polski do Niemiec (po 2004 roku nie spada poniżej 10%, choć od 2011 roku wykazuje ogólną tendencję spadkową). To oznacza, że – zgodnie z oczekiwa-niami – niemiecki import do Polski cechuje wyższe zaawansowanie techno-logiczne niż polski eksport do Niemiec. Także udział dóbr średnio wysoko zaawansowanych technologicznie jest w niemieckim imporcie do Polski więk-szy (w 2013 roku prawie 45% wobec 36% w eksporcie z Polski do Niemiec).
17 Oznaczenia, jak pod rysunkiem 1.
Handel produktami o różnym zaawansowaniu technologicznym między Polską... 183
Tym, co dodatkowo różni te strumienie eksportu, jest kolejność dóbr na pozy-cjach 2 i 3 w rankingu ważności eksporterów. O ile w polskim eksporcie do Niemiec wiceliderem są produkty o niskim zaawansowaniu technologicznym (z udziałem 27,6%), o tyle w niemieckim eksporcie do Polski są to dobra o śred-nio niskim zaawansowaniu technologicznym (z udziałem 22%).
Rysunek 4. Udziały produktów o różnym zaawansowaniu technologicznym w polskim imporcie z Niemiec i z UE15 w 2013 roku, w procentach, oraz zmiany udziałów w porównaniu z 2004 roku w punktach procentowych18
Źródło: Eurostat, http://epp.eurostat.ec.europa.eu/newxtweb/ (20.05.2015).
Przekonanie, że Polska kupuje w Niemczech produkty typu high tech nie znajduje potwierdzenia w analizie udziałów różnych grup produktów w polskim imporcie z Niemiec i z UE15 (na przykładzie stanu z 2013 roku oraz zmian w latach 2004–2013). Z danych zawartych na rysunku 4 wynika bowiem, że w imporcie z UE15 do Polski dobra HT mają większy udział niż w imporcie z Niemiec do Polski (odpowiednio 12,7% i 9,7%). Także łączny udział dwóch grup o największym zaawansowaniu technologicznym (HT oraz MHT) jest w imporcie z UE15 wyższy niż w imporcie z Niemiec (54,6% oraz 54%).
18 Oznaczenia, jak pod rysunkiem 1.

Elżbieta Czarny, Katarzyna Śledziewska184
3. Intensywność i struktura polskiego handlu wewnątrzgałęziowego z Niemcami i z UE15
Jak piszemy w podrozdziale 1, handel wewnątrzgałęziowy jest specyficz-nym rodzajem wymiany towarowej. Prowadzą ją głównie państwa uprzemysło-wione, mające względnie zamożnych mieszkańców kupujących dużo produktów zróżnicowanych, a nie podstawowych (jednorodnych). Kraje prowadzące IIT mają rozwinięty przemysł przetwórczy, są więc do siebie podobne pod wzglę-dem charakterystyki nie tylko nabywców, lecz również producentów. Rozwój IIT świadczy nie tylko o względnie wysokim poziomie rozwoju prowadzącego go kraju, lecz także jest dowodem konkurencyjności sprzedawanych przezeń towarów. Jest to szczególnie ważne w przypadku Polski, mającej gospodarkę doganiającą, handlującą z wyżej od siebie rozwiniętymi partnerami z UE, w tym z Niemcami. Właśnie dlatego przyglądamy się uważnie tej wymianie. Bada-nie zaczynamy od analizy zmian całego IIT (zgodnie ze wzorem (1)), po czym przechodzimy do badania dwóch strumieni handlu pionowego (wzory (3) i (4)) oraz poziomego (wynik ze wzoru (1) pomniejszony o sumę (3) i (4)).
Rysunek 5. Udziały handlu wewnątrzgałęziowego w wymianie towarów z sektorów o różnym zaawansowaniu technologicznym między Polską a Niemcami w latach 1999–2013, w procentach19
0,0
5,0
10,0
15,0
20,0
25,0
30,0
35,0
40,0
45,0
50,0
1999 2000 2001 2002 2003 2004 2005 2006 2007 2008 2009 2010 2011 2012 2013
HT MHT MLT LT
Źródło: Eurostat, http://epp.eurostat.ec.europa.eu/newxtweb/ (20.05.2015).
19 Oznaczenia, jak pod rysunkiem 1.
Handel produktami o różnym zaawansowaniu technologicznym między Polską... 185
W latach 1999–2013 polski IIT zarówno z Niemcami, jak i z UE15 (rysunki 5 i 6) wykazuje tendencję wzrostową, przy czym w wymianie z oboma partne-rami największe wahania udziałów wykazuje IIT produktami high tech. To może świadczyć o braku ustabilizowanej pozycji polskich produktów najbar-dziej zaawansowanych technologicznie na trudnych rynkach bogatych i zin-tegrowanych handlowo państw UE15, w tym Niemiec.
W przypadku pozostałych grup towarowych wahania udziałów IIT są znacznie mniejsze. Od 2007 roku zarówno w handlu Polski z Niemcami, jak i w wymia-nie z UE15 udziały IIT MHT i MLT są bardzo zbliżone. Od 2004 roku pierw-sza z wymienionych grup towarów notuje w wymianie z UE15 trwale większy udział niż druga (w handlu z Niemcami wyjątkiem jest początkowy rok ostat-niego kryzysu, czyli 2008 oraz ostatni rok badania (2013)).
Rysunek 6. Udziały handlu wewnątrzgałęziowego w wymianie towarów z sektorów o różnym zaawansowaniu technologicznym między Polską a UE15 w latach 1999–2013, w procentach20
0,0
5,0
10,0
15,0
20,0
25,0
30,0
35,0
40,0
1999 2000 2001 2002 2003 2004 2005 2006 2007 2008 2009 2010 2011 2012 2013
HT MHT MLT LT
Źródło: Eurostat, http://epp.eurostat.ec.europa.eu/newxtweb/ (20.05.2015).
Z porównania udziałów IIT w polskim handlu badanymi grupami pro-duktów z Niemcami i UE15 wynika, że trwale wyższe są te udziały w handlu z Niemcami (rysunek 7). Co więcej, ta różnica rośnie w czasie. W wymianie z Niemcami widoczne są znacznie większe przyrosty udziałów IIT poszczegól-nymi grupami dóbr niż z UE15. Największa różnica przyrostów (8,1 p.p.) doty-
20 Oznaczenia, jak pod rysunkiem 1.
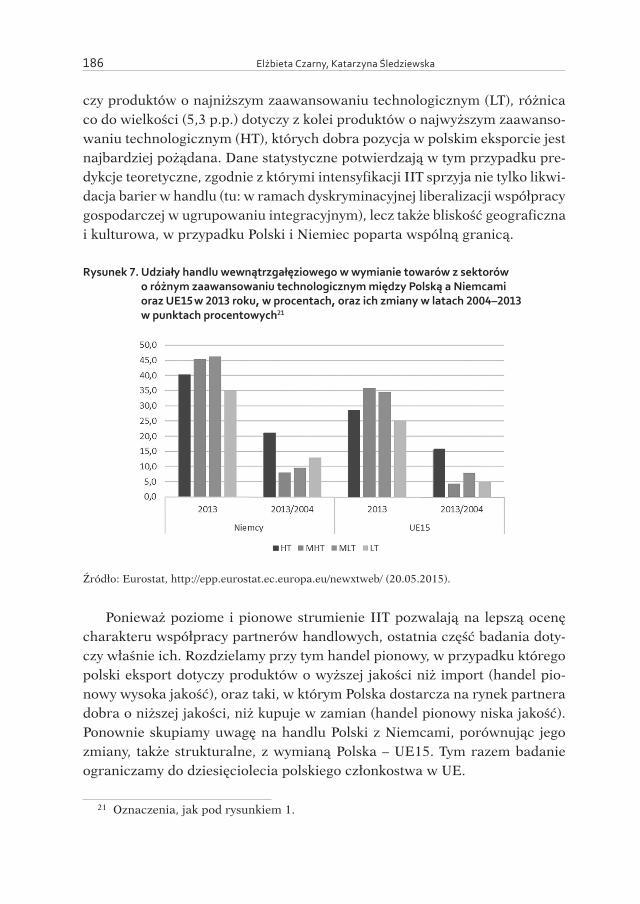
Elżbieta Czarny, Katarzyna Śledziewska186
czy produktów o najniższym zaawansowaniu technologicznym (LT), różnica co do wielkości (5,3 p.p.) dotyczy z kolei produktów o najwyższym zaawanso-waniu technologicznym (HT), których dobra pozycja w polskim eksporcie jest najbardziej pożądana. Dane statystyczne potwierdzają w tym przypadku pre-dykcje teoretyczne, zgodnie z którymi intensyfikacji IIT sprzyja nie tylko likwi-dacja barier w handlu (tu: w ramach dyskryminacyjnej liberalizacji współpracy gospodarczej w ugrupowaniu integracyjnym), lecz także bliskość geograficzna i kulturowa, w przypadku Polski i Niemiec poparta wspólną granicą.
Rysunek 7. Udziały handlu wewnątrzgałęziowego w wymianie towarów z sektorów o różnym zaawansowaniu technologicznym między Polską a Niemcami oraz UE15 w 2013 roku, w procentach, oraz ich zmiany w latach 2004–2013 w punktach procentowych21
Źródło: Eurostat, http://epp.eurostat.ec.europa.eu/newxtweb/ (20.05.2015).
Ponieważ poziome i pionowe strumienie IIT pozwalają na lepszą ocenę charakteru współpracy partnerów handlowych, ostatnia część badania doty-czy właśnie ich. Rozdzielamy przy tym handel pionowy, w przypadku którego polski eksport dotyczy produktów o wyższej jakości niż import (handel pio-nowy wysoka jakość), oraz taki, w którym Polska dostarcza na rynek partnera dobra o niższej jakości, niż kupuje w zamian (handel pionowy niska jakość). Ponownie skupiamy uwagę na handlu Polski z Niemcami, porównując jego zmiany, także strukturalne, z wymianą Polska – UE15. Tym razem badanie ograniczamy do dziesięciolecia polskiego członkostwa w UE.
21 Oznaczenia, jak pod rysunkiem 1.

Handel produktami o różnym zaawansowaniu technologicznym między Polską... 187
Od akcesji Polski do UE udziały dominującej większości odmian handlu wewnątrzgałęziowego w wymianie produktów o różnym zaawansowaniu tech-nologicznym zarówno z Niemcami, jak i z UE15 rosną (rysunki 8 i 9). Wyjątkami są handel poziomy produktami średnio wysoko zaawansowanymi technolo-gicznie i handel pionowy niska jakość produktami średnio nisko zaawansowa-nymi technologicznie z oboma partnerami oraz handel pionowy niska jakość produktami nisko zaawansowanymi technologicznie z Niemcami. Jednak we wszystkich wymienionych przypadkach spadki udziałów strumieni IIT można uznać za poprawę pozycji Polski w tej wymianie. Tak więc spadki udziałów handlu poziomego HMT (w wymianie z Niemcami o 1,1 p.p., a w wymianie z UE15 o 0,7 p.p.) z nawiązką zrekompensowały wzrosty udziałów handlu pio-nowego wysoka jakość (odpowiednio o 1,4 p.p. i o 1,3 p.p.). To oznacza, że pol-skie towary uzyskały w tych segmentach rynku przewagę jakości nad dobrami partnera. Zmniejszające się strumienie wymiany pionowej niska jakość MLT zostały zastąpione strumieniami IIT, w przypadku których Polska zajmuje lepszą pozycję. To oznacza, że przeciwwagę spadku handlu pionowego niska jakość produktami średnio nisko zaawansowanymi technologicznie (w han-dlu z Niemcami o 4,2 p.p., az UE15 o 3,3 p.p.) stanowią duże wzrosty handlu poziomego i pionowego wysoka jakość tymi produktami (z Niemcami: poziomy 9,7 p.p., pionowy wysoka jakość 4 p.p.; z UE15: poziomy 3,9 p.p., pionowy wysoka jakość 2,8 p.p.).
W handlu najbardziej nas interesującymi produktami high tech Polska notuje największy spośród badanych grup towarowych udział handlu piono-wego z eksportem do Niemiec o wyższej jakości niż import z nich (25-pro-centowy udział w 2013 roku). Optymistyczna jest również skala wzrostu tego udziału w porównaniu z 2004 rokiem (14,2 p.p.), co stanowi największy wzrost w badanej próbie. To oznacza, że istnieją segmenty produktów najbar-dziej zaawansowanych technologicznie, w których polskie produkty ekspor-towane na rynek niemiecki mają wyższą jakość niż podobne wyroby stamtąd importowane, chociaż ogólny poziom rozwoju gospodarki polskiej jest niższy niż niemieckiej. Z pewnością znaczna część tych produktów jest wytwarzana w filiach firm zagranicznych ulokowanych w Polsce. Z jednej strony, pokazuje to znaczenie dla rozwoju gospodarczego napływu kapitału (zwłaszcza bezpo-średniego) z zagranicy. Z drugiej strony, taki stan każe patrzeć na te produkty, jak na wyroby „polskie”, tylko umownie.
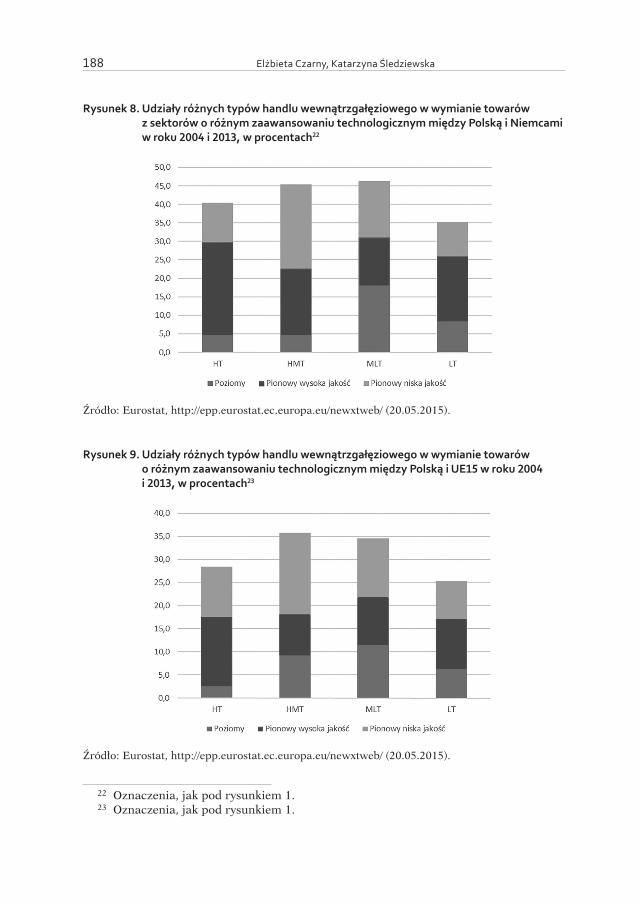
Elżbieta Czarny, Katarzyna Śledziewska188
Rysunek 8. Udziały różnych typów handlu wewnątrzgałęziowego w wymianie towarów z sektorów o różnym zaawansowaniu technologicznym między Polską i Niemcami w roku 2004 i 2013, w procentach22
Źródło: Eurostat, http://epp.eurostat.ec.europa.eu/newxtweb/ (20.05.2015).
Rysunek 9. Udziały różnych typów handlu wewnątrzgałęziowego w wymianie towarów o różnym zaawansowaniu technologicznym między Polską i UE15 w roku 2004 i 2013, w procentach23
Źródło: Eurostat, http://epp.eurostat.ec.europa.eu/newxtweb/ (20.05.2015).
22 Oznaczenia, jak pod rysunkiem 1.23 Oznaczenia, jak pod rysunkiem 1.
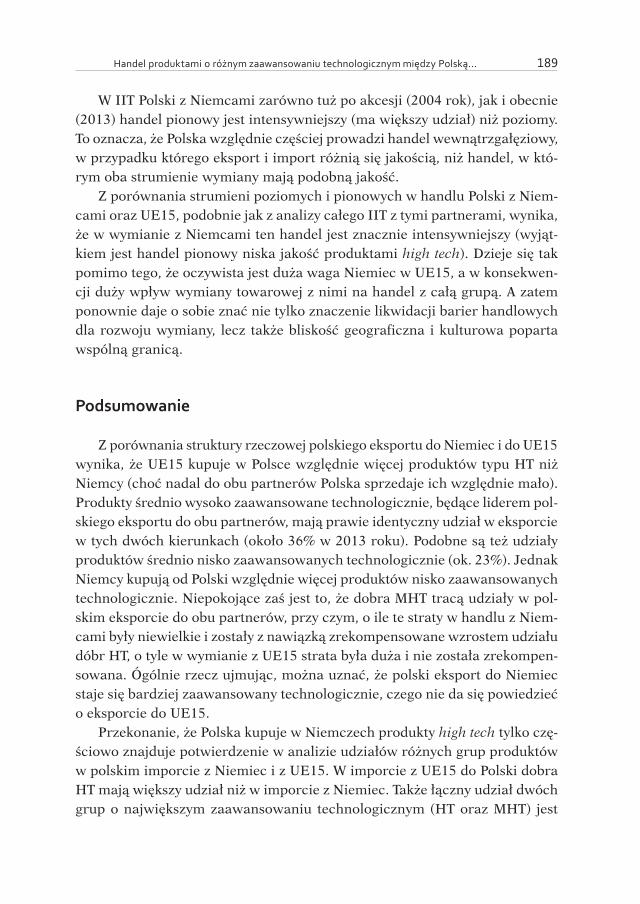
Handel produktami o różnym zaawansowaniu technologicznym między Polską... 189
W IIT Polski z Niemcami zarówno tuż po akcesji (2004 rok), jak i obecnie (2013) handel pionowy jest intensywniejszy (ma większy udział) niż poziomy. To oznacza, że Polska względnie częściej prowadzi handel wewnątrzgałęziowy, w przypadku którego eksport i import różnią się jakością, niż handel, w któ-rym oba strumienie wymiany mają podobną jakość.
Z porównania strumieni poziomych i pionowych w handlu Polski z Niem-cami oraz UE15, podobnie jak z analizy całego IIT z tymi partnerami, wynika, że w wymianie z Niemcami ten handel jest znacznie intensywniejszy (wyjąt-kiem jest handel pionowy niska jakość produktami high tech). Dzieje się tak pomimo tego, że oczywista jest duża waga Niemiec w UE15, a w konsekwen-cji duży wpływ wymiany towarowej z nimi na handel z całą grupą. A zatem ponownie daje o sobie znać nie tylko znaczenie likwidacji barier handlowych dla rozwoju wymiany, lecz także bliskość geograficzna i kulturowa poparta wspólną granicą.
Podsumowanie
Z porównania struktury rzeczowej polskiego eksportu do Niemiec i do UE15 wynika, że UE15 kupuje w Polsce względnie więcej produktów typu HT niż Niemcy (choć nadal do obu partnerów Polska sprzedaje ich względnie mało). Produkty średnio wysoko zaawansowane technologicznie, będące liderem pol-skiego eksportu do obu partnerów, mają prawie identyczny udział w eksporcie w tych dwóch kierunkach (około 36% w 2013 roku). Podobne są też udziały produktów średnio nisko zaawansowanych technologicznie (ok. 23%). Jednak Niemcy kupują od Polski względnie więcej produktów nisko zaawansowanych technologicznie. Niepokojące zaś jest to, że dobra MHT tracą udziały w pol-skim eksporcie do obu partnerów, przy czym, o ile te straty w handlu z Niem-cami były niewielkie i zostały z nawiązką zrekompensowane wzrostem udziału dóbr HT, o tyle w wymianie z UE15 strata była duża i nie została zrekompen-sowana. Ógólnie rzecz ujmując, można uznać, że polski eksport do Niemiec staje się bardziej zaawansowany technologicznie, czego nie da się powiedzieć o eksporcie do UE15.
Przekonanie, że Polska kupuje w Niemczech produkty high tech tylko czę-ściowo znajduje potwierdzenie w analizie udziałów różnych grup produktów w polskim imporcie z Niemiec i z UE15. W imporcie z UE15 do Polski dobra HT mają większy udział niż w imporcie z Niemiec. Także łączny udział dwóch grup o największym zaawansowaniu technologicznym (HT oraz MHT) jest

Elżbieta Czarny, Katarzyna Śledziewska190
w imporcie z UE15 wyższy niż w imporcie z Niemiec. Równocześnie jednak w imporcie z Niemiec do Polski udział dóbr HT i MHT łącznie jest większy niż odpowiednie udziały w polskim eksporcie do Niemiec.
Polski IIT zarówno z Niemcami, jak i z UE15 wykazuje w latach 1999–2013 tendencję wzrostową, przy czym w wymianie z oboma partnerami najwięk-sze wahania udziałów wykazuje IIT produktami high tech. To może świadczyć o braku ustabilizowanej pozycji polskich produktów zaawansowanych techno-logicznie na trudnych rynkach bogatych i zintegrowanych handlowo państw UE15, w tym Niemiec.
Z porównania strumieni poziomych i pionowych w handlu Polski z Niem-cami oraz UE15, podobnie jak z analizy całego IIT z tymi partnerami, wynika, że w wymianie z Niemcami ten handel jest znacznie intensywniejszy (wyjątkiem jest handel pionowy niska jakość produktami high tech). Dzieje się tak, chociaż oczywista jest duża waga Niemiec w UE15, czego konsekwencją jest znaczny wpływ wymiany towarowej z nimi na handel z całą grupą. A zatem ponownie daje o sobie znać nie tylko znaczenie likwidacji barier handlowych dla roz-woju wymiany, lecz także bliskość geograficzna i kulturowa poparta wspólną granicą. Optymistyczna jest też poprawa struktury polskiego IIT z oboma part-nerami. Spadkom udziałów handlu pionowego z polskim eksportem o względ-nie niskiej jakości towarzyszą bowiem wzrosty udziałów wymiany poziomej oraz pionowej w polskim eksporcie o wyższej jakości niż import. Te wzrosty są większe niż bezwzględna wartość spadków.
KURZZUSAMMENFASSUNG
Wir analysieren den polnischen intra-industriellen Aussenhandel (IIT) mit Pro-dukten unterschiedlicher Technologiegrade Im Zentrum unseres Interesses steht Deutschland als wichtigster Handelspartner Polens. Wir vergleichen den IIT zwi-schen Polen und Deutschland mit Polens IIT mit dem am höchsten entwickelten Teil der EU, d.h. mit den „alten” EU-Mitgliedsländern (den sog. „15”). Wir analisieren auch die disaggregierten IIT-Ströme, gegliedert nach horizontalem und vertikalem IIT. Ein besonderes Interesse gilt den technologisch fortgeschrittenen Gütern, die Polen exportiert. Unseres Erachtens geben deren Exporte wichtige Hinweise bezüg-lich der Position des Anbieters auf dem Weltmarkt. Die Analyse umfasst die ersten 10 Jahre der EU-Mitgliedschaft Polens (für den aggregierten Aussenhandel und den aggregierten IIT erweitern wir den Untersuchungszeitraum um 5 Jahre vor dem EU-Beitritt). Auf diese Weise zeigen wir strukturelle Veränderungen auf, die in der analysierten Periode aufgetreten sind.
Handel produktami o różnym zaawansowaniu technologicznym między Polską... 191
Schlüsselwörter: intra-industrieller Handel (IIT), horizontaler IIT, vertikaler IIT, Europäische Union
Bibliografia
Crespo N., Fontoura M. P. (2001): Determinants of the pattern of horizontal and verti-cal intra-industry trade: what can we learn from Portuguese data?, Working Paper ISEG No 9, Lisboa.
Culem C., Lundberg L. (1986): The Product Pattern of Intra-Industry Trade: Stability among Countries and over Time, “Weltwirtschaftliches Archiv”, vol. 122, no. 1.
Czarny E. (2002): Teoria i praktyka handlu wewntrzgaBziowego, Oficyna Wydawni-cza SGH, Warszawa.
Czarny E., Śledziewska K. (2012): Współpraca gospodarcza Polski z zagranicą w warunkach międzynarodowego kryzysu gospodarczego, PWE, Warszawa.
Eichengreen B., Irwin D. A. (1998): The Role of History in Bilateral Trade Flows, w: The Regionalization of the World Economy, red. J. A. Frankel, The University of Chicago Press, Chicago.
Fontagné L., Freudenberg M. (1997): Intra-Industry Trade: Methodological Issues Reconsidered, CEPII Document de Travail 97–01, Pary.
Greenaway D., Hine R. C., Milner C. (1999): Vertical and Horizontal Intra--Industry Trade: An Analysis of Country- and Industry-specific Determinants, w: red. M. Brülhart,.
Greenaway D., Hine R. C., Milner C., (1994): Country Specific Factors and the Pattern of Horizontal and Vertical Intra-Industry Trade in the United Kingdom, “Weltwirt-schaftliches Archiv”, vol. 130, no. 1.
Grubel H. G., Lloyd P. J. (1975): Intra-Industry Trade: the Theory and Measurement of Intra-Industry Trade in Differentiated Products, Macmillan, London.
Helpman E. (1981): International Trade in the Presence of Product Differentiation, Economies of Scale, and Monopolistic Competition: A Chamberlin – Heckscher – Ohlin Approach, “Journal of International Economics”, vol. 11.
Landesmann M. (1995): The Pattern of East-West European Integration: Catching up or Falling Behind? w: Transforming Economies and European Integration, red. R. Dobrinsky, M. Landesmann, Edward Elgar Pub, Aldershot.
Linder S. B. (1961): An Essay on Trade and Transformation, Uppsala.Posner V. (1961):International Trade and Technical Change, “Oxford Economic
Papers”, pazdziernik,.Vernon R. (1966): International Investment and International Trade in the Product
Cycle, “Quarterly Journal of Economics”, vol. 80, no. 2,.
Elżbieta Czarny, Katarzyna Śledziewska192
Weigand J., Lehmann E. (1997): Produktdifferenzierung, „Wirtschaftswissenschaftli-ches Studium WiSt“, bd. 26, nr 9.
Baza danych
Eurostat (Comext, http://epp.eurostat.ec.europa.eu/newxtweb/).

Krystyna POZNAŃSKA*
WSPIERANIE INNOWACYJNOŚCI W GOSPODARCE NIEMIECKIEJ
Wprowadzenie
Celem niniejszego opracowania jest przedstawienie najważniejszych dzia-łań w zakresie wspierania innowacyjności podejmowanych w ramach polityki innowacyjnej w gospodarce niemieckiej. Rankingi innowacyjności pozwalają wprawdzie zaliczyć Niemcy do krajów tworzących grupę liderów innowacyj-ności, jednakże władze federalne podejmują nieustannie wiele działań w celu usprawnienia funkcjonowania Narodowego Systemu Innowacji, by usunąć poja-wiające się zawodności i dopasować system do warunków postępującej globa-lizacji oraz ery wiedzy opartej na informacji. W opracowaniu przedstawiono wybrane wskaźniki obrazujące poziom innowacyjności gospodarki niemiec-kiej, a następnie omówiono „Strategię High -Tech” (High-Tech Strategie)1, która jest uznawana za zasadniczy element całościowej strategii państwa w zakresie wspierania innowacyjności. W ogólnym zarysie zaprezentowano najważniejsze programy i działania wspierania innowacyjności małych i średnich przedsię-biorstw, klastrów oraz wybrane inicjatywy we wschodniej części kraju.
1. Poziom innowacyjności gospodarki niemieckiej
Punktem wyjścia rozważań w niniejszym punkcie opracowania jest analiza wybranych wskaźników odzwierciedlających stan innowacyjności niemieckiej gospodarki. Zwrócono uwagę zarówno na mocne strony gospodarki w zakre-
* Szkoła Główna Handlowa w Warszawie, * e-mail: [email protected] Research in Germany, Die neue Hightech-Strategie – Innovationen für Deutschland,
http://www.research-in-germany.de/de/forschungslandschaft/fue-politik/high-tech-strategie.html (3.03.2016).
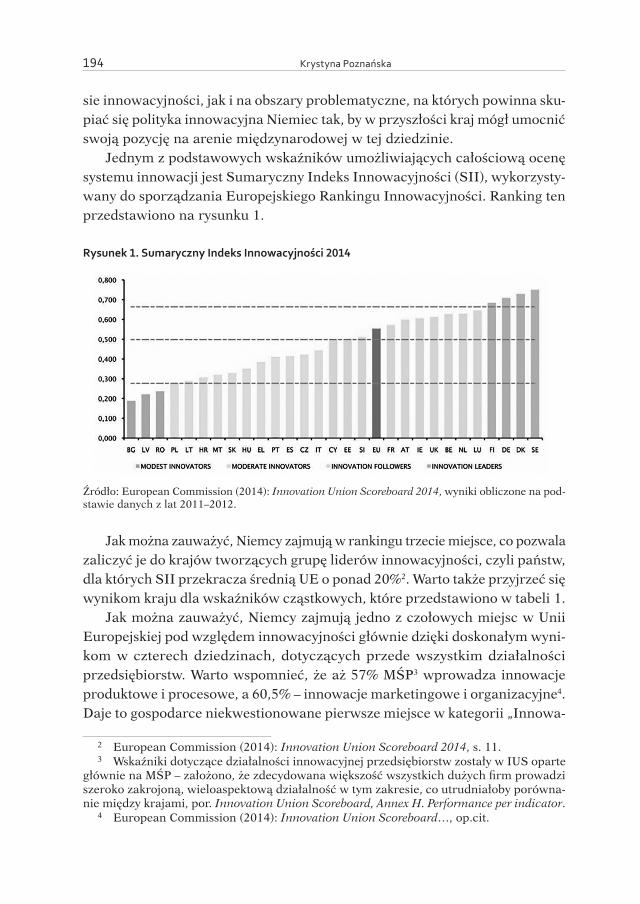
Krystyna Poznańska 194
sie innowacyjności, jak i na obszary problematyczne, na których powinna sku-piać się polityka innowacyjna Niemiec tak, by w przyszłości kraj mógł umocnić swoją pozycję na arenie międzynarodowej w tej dziedzinie.
Jednym z podstawowych wskaźników umożliwiających całościową ocenę systemu innowacji jest Sumaryczny Indeks Innowacyjności (SII), wykorzysty-wany do sporządzania Europejskiego Rankingu Innowacyjności. Ranking ten przedstawiono na rysunku 1.
Rysunek 1. Sumaryczny Indeks Innowacyjności 2014
Źródło: European Commission (2014): Innovation Union Scoreboard 2014, wyniki obliczone na pod-stawie danych z lat 2011–2012.
Jak można zauważyć, Niemcy zajmują w rankingu trzecie miejsce, co pozwala zaliczyć je do krajów tworzących grupę liderów innowacyjności, czyli państw, dla których SII przekracza średnią UE o ponad 20%2. Warto także przyjrzeć się wynikom kraju dla wskaźników cząstkowych, które przedstawiono w tabeli 1.
Jak można zauważyć, Niemcy zajmują jedno z czołowych miejsc w Unii Europejskiej pod względem innowacyjności głównie dzięki doskonałym wyni-kom w czterech dziedzinach, dotyczących przede wszystkim działalności przedsiębiorstw. Warto wspomnieć, że aż 57% MŚP3 wprowadza innowacje produktowe i procesowe, a 60,5% – innowacje marketingowe i organizacyjne4. Daje to gospodarce niekwestionowane pierwsze miejsce w kategorii „Innowa-
2 European Commission (2014): Innovation Union Scoreboard 2014, s. 11.3 Wskaźniki dotyczące działalności innowacyjnej przedsiębiorstw zostały w IUS oparte
głównie na MŚP – założono, że zdecydowana większość wszystkich dużych firm prowadzi szeroko zakrojoną, wieloaspektową działalność w tym zakresie, co utrudniałoby porówna-nie między krajami, por. Innovation Union Scoreboard, Annex H. Performance per indicator.
4 European Commission (2014): Innovation Union Scoreboard…, op.cit.

Wspieranie innowacyjności w gospodarce niemieckiej 195
torzy”. Można również wysnuć wniosek, że dla utrzymania przez kraj pozycji jednego z liderów w UE wciąż konieczna jest poprawa obszarów związanych z aktywnością i wsparciem państwa.
Tabela 1. Pozycja Niemiec wśród krajów UE w rankingach poszczególnych kategorii wskaźników SII
Wskaźnik Pozycja gospodarki niemieckiej wśród krajów UE
Zasoby ludzkie 11
Środki finansowe i wsparcie 9
Systemy badawcze 9
Inwestycje firm 2
Powiązania i przedsiębiorczość 7
Aktywa intelektualne 2
Innowatorzy 1
Efekty ekonomiczne 2
Źródło: Opracowanie własne na podstawie: European Commission (2014): Innovation Union Sco-reboard 2014.
Tabela 2. Wybrane wskaźniki cząstkowe SII dla Niemiec i UE
Wskaźnik Średnia UE Niemcy
Zasoby ludzkie
Nowi absolwenci studiów doktoranckich (na tys. mieszkańców) 1,7 2,8
Odsetek osób w wieku 30–34 lat z wykształceniem wyższym 35,8 31,9
Odsetek osób w wieku 20–24 lat z wykształceniem średnim 80,2 76,2
Otwarty atrakcyjny system badawczy wysokiej jakości
Publikacje naukowe powstałe we współpracy międzynarodowej (na mln mieszkańców) 343,2 745,7
Odsetek krajowych publikacji znajdujących się w 10% najczęściej cytowanych publikacji na świecie 11,0 11,6
Odsetek studentów studiów doktoranckich spoza UE 24,2 11,2
Środki finansowe i wsparcie
Publiczne wydatki na B+R jako % PKB 0,75 0,96
Inwestycje typu venture capital jako procent PKB 0,277 0,223
Powiązania i przedsiębiorczość
Odsetek MŚP prowadzących własną działalność innowacyjną w zakresie innowacji produktowych i procesowych 31,8 45,2
Odsetek MŚP prowadzących działalność innowacyjną we współpracy z innymi podmiotami 11,7 14,0
Publikacje naukowe powstałe we współpracy publiczno-prywatnej (na mln mieszkańców) 7,3 8,7
Źródło: European Commission (2014): Innovation Union Scoreboard 2014, wyniki obliczone na pod-stawie danych z lat 2011–2012.
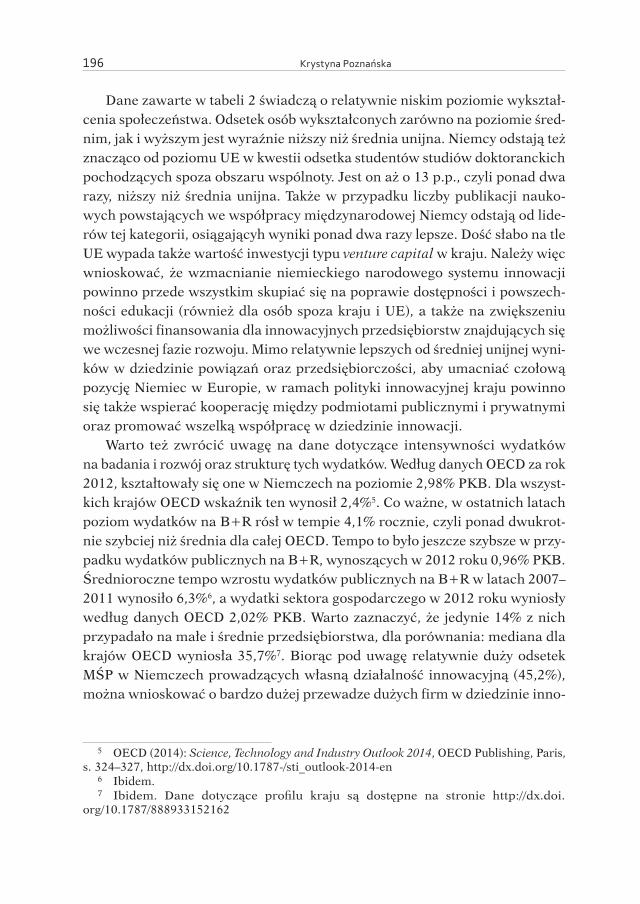
Krystyna Poznańska 196
Dane zawarte w tabeli 2 świadczą o relatywnie niskim poziomie wykształ-cenia społeczeństwa. Odsetek osób wykształconych zarówno na poziomie śred-nim, jak i wyższym jest wyraźnie niższy niż średnia unijna. Niemcy odstają też znacząco od poziomu UE w kwestii odsetka studentów studiów doktoranckich pochodzących spoza obszaru wspólnoty. Jest on aż o 13 p.p., czyli ponad dwa razy, niższy niż średnia unijna. Także w przypadku liczby publikacji nauko-wych powstających we współpracy międzynarodowej Niemcy odstają od lide-rów tej kategorii, osiągającyh wyniki ponad dwa razy lepsze. Dość słabo na tle UE wypada także wartość inwestycji typu venture capital w kraju. Należy więc wnioskować, że wzmacnianie niemieckiego narodowego systemu innowacji powinno przede wszystkim skupiać się na poprawie dostępności i powszech-ności edukacji (również dla osób spoza kraju i UE), a także na zwiększeniu możliwości finansowania dla innowacyjnych przedsiębiorstw znajdujących się we wczesnej fazie rozwoju. Mimo relatywnie lepszych od średniej unijnej wyni-ków w dziedzinie powiązań oraz przedsiębiorczości, aby umacniać czołową pozycję Niemiec w Europie, w ramach polityki innowacyjnej kraju powinno się także wspierać kooperację między podmiotami publicznymi i prywatnymi oraz promować wszelką współpracę w dziedzinie innowacji.
Warto też zwrócić uwagę na dane dotyczące intensywności wydatków na badania i rozwój oraz strukturę tych wydatków. Według danych OECD za rok 2012, kształtowały się one w Niemczech na poziomie 2,98% PKB. Dla wszyst-kich krajów OECD wskaźnik ten wynosił 2,4%5. Co ważne, w ostatnich latach poziom wydatków na B+R rósł w tempie 4,1% rocznie, czyli ponad dwukrot-nie szybciej niż średnia dla całej OECD. Tempo to było jeszcze szybsze w przy-padku wydatków publicznych na B+R, wynoszących w 2012 roku 0,96% PKB. Średnioroczne tempo wzrostu wydatków publicznych na B+R w latach 2007–2011 wynosiło 6,3%6, a wydatki sektora gospodarczego w 2012 roku wyniosły według danych OECD 2,02% PKB. Warto zaznaczyć, że jedynie 14% z nich przypadało na małe i średnie przedsiębiorstwa, dla porównania: mediana dla krajów OECD wyniosła 35,7%7. Biorąc pod uwagę relatywnie duży odsetek MŚP w Niemczech prowadzących własną działalność innowacyjną (45,2%), można wnioskować o bardzo dużej przewadze dużych firm w dziedzinie inno-
5 OECD (2014): Science, Technology and Industry Outlook 2014, OECD Publishing, Paris, s. 324–327, http://dx.doi.org/10.1787-/sti_outlook-2014-en
6 Ibidem.7 Ibidem. Dane dotyczące profilu kraju są dostępne na stronie http://dx.doi.
org/10.1787/888933152162
Wspieranie innowacyjności w gospodarce niemieckiej 197
wacyjności, mimo że są one nieliczne8. Można też zauważyć, że mimo bardzo dobrych wyników w tym zakresie osiąganych przez niemieckie MŚP, wspiera-nie ich przez państwo może wciąż wydawać się konieczne.
Wśród wydatków publicznych na B+R dominują wydatki uczelni wyższych (HERD – Higher Education Intramural Expenditure on R&D), stanowiące 0,51% PKB. Wydatki rządowe (GOVERD – Government Intramural Expenditure on R&D) wyniosły natomiast w 2012 roku 0,41% PKB9. Analizując strukturę wydatków na B+R w Niemczech, należy zwrócić uwagę na to, że znaczący odsetek wydatków rządowych oraz sektora nauki na B+R jest finansowany przez podmioty prywatne – w formie dotacji, grantów czy też umów10. Wyniósł on w 2012 roku 10,35% dla GOVERD i 14,03% dla HERD. Dla porównania, średnie OECD to odpowiednio 3,45% i 5,86%, średnie UE natomiast – 8,46% i 6,44%11. Udział sektora prywatnego w finansowaniu badań prowadzonych przez instytucje publiczne ma niewątpliwie duży wpływ na kształt i cel tych badań, a także sprzyja szybkiej komercjalizacji ich wyników. Świadczy on także o tym, że w niemieckim systemie innowacji praktyczne zastosowanie znajduje otwarty paradygmat innowacji.
Należy podkreślić, że Niemcy są europejskim liderem w dziedzinie klastrów. W całym państwie znajduje się 498 klastrów, przy czym występują one w każ-dym z krajów związkowych12. Największą liczbą klastrów może pochwalić się Badenia-Wirtembergia (144 klastry), na drugim miejscu jest Dolna Saksonia (130 klastrów). Pod względem liczby osób zatrudnionych w klastrach Niemcy zajmują pierwsze miejsce w UE – blisko 12 mln osób (w zajmującej drugie miej-sce Wielkiej Brytanii jest to „jedynie” 9 mln)13. Gospodarka niemiecka wyróż-nia się jednak nie tylko ilością zatrudnionych, lecz także jakością i siłą swoich klastrów. Świadczą o tym wyniki raportu Komisji Europejskiej European Clu-ster Panorama z 2014 roku, oceniającego europejskie klastry regionalne dzia-łające w 10 dziedzinach uznanych za najbardziej perspektywiczne14. W ocenie
8 MŚP stanowią 99,3% wszystkich przedsiębiorstw. Źródło, https://www.destatis.de/DE/ZahlenFakten-/GesamtwirtschaftUmwelt/UnternehmenHandwerk/KleineMittlereUn-ternehmenMittelstand/KleineMittlereUnternehmenMittelstand.html, dostęp 16.03.2016
9 OECD (2014): Main Science and Technology Indicators Database, http://stats.oecd.org/Index.aspx?DataSetCode=MSTI_PUB dostep 16.03.2016
10 OECD (2014): Science, Technology and Industry…, op.cit.11 OECD (2014): Main Science and Technology…, op.cit.12 Lista klastrów dostępna na stronie www.clusterplatform.de13 Dane dla Niemiec za rok 2011, www.clusterobservatory.eu14 Dziedziny te to rynek opakowań, biofarmaceutyka, przemysł morski, sektor kreatywny,
rynek cyfrowy, rynek ochrony środowiska, rynek czasu wolnego, usługi logistyczne, rynek urządzeń medycznych, rynek technologii mobilnych. Cechuje je wysoka produktywność,
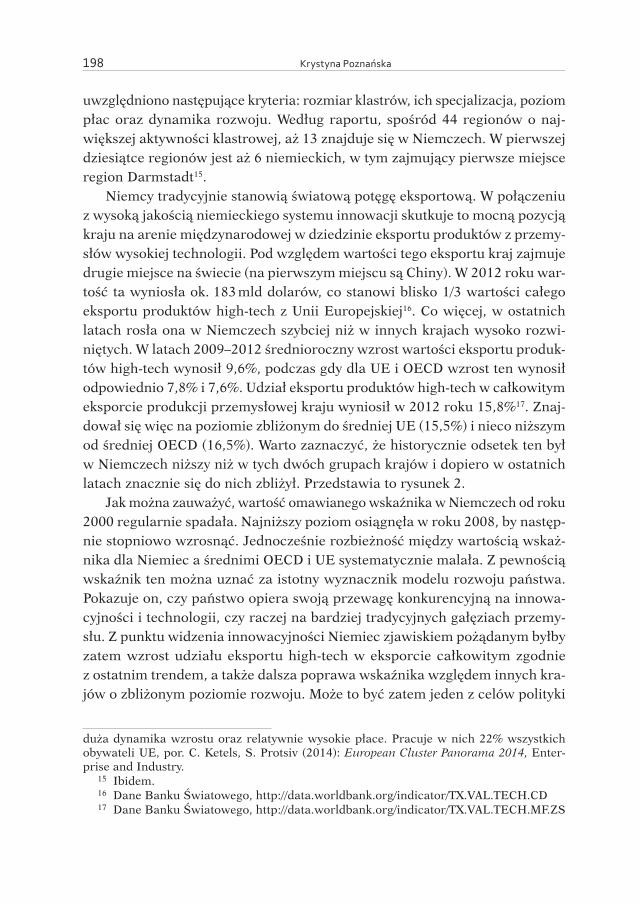
Krystyna Poznańska 198
uwzględniono następujące kryteria: rozmiar klastrów, ich specjalizacja, poziom płac oraz dynamika rozwoju. Według raportu, spośród 44 regionów o naj-większej aktywności klastrowej, aż 13 znajduje się w Niemczech. W pierwszej dziesiątce regionów jest aż 6 niemieckich, w tym zajmujący pierwsze miejsce region Darmstadt15.
Niemcy tradycyjnie stanowią światową potęgę eksportową. W połączeniu z wysoką jakością niemieckiego systemu innowacji skutkuje to mocną pozycją kraju na arenie międzynarodowej w dziedzinie eksportu produktów z przemy-słów wysokiej technologii. Pod względem wartości tego eksportu kraj zajmuje drugie miejsce na świecie (na pierwszym miejscu są Chiny). W 2012 roku war-tość ta wyniosła ok. 183 mld dolarów, co stanowi blisko 1/3 wartości całego eksportu produktów high-tech z Unii Europejskiej16. Co więcej, w ostatnich latach rosła ona w Niemczech szybciej niż w innych krajach wysoko rozwi-niętych. W latach 2009–2012 średnioroczny wzrost wartości eksportu produk-tów high-tech wynosił 9,6%, podczas gdy dla UE i OECD wzrost ten wynosił odpowiednio 7,8% i 7,6%. Udział eksportu produktów high-tech w całkowitym eksporcie produkcji przemysłowej kraju wyniosił w 2012 roku 15,8%17. Znaj-dował się więc na poziomie zbliżonym do średniej UE (15,5%) i nieco niższym od średniej OECD (16,5%). Warto zaznaczyć, że historycznie odsetek ten był w Niemczech niższy niż w tych dwóch grupach krajów i dopiero w ostatnich latach znacznie się do nich zbliżył. Przedstawia to rysunek 2.
Jak można zauważyć, wartość omawianego wskaźnika w Niemczech od roku 2000 regularnie spadała. Najniższy poziom osiągnęła w roku 2008, by następ-nie stopniowo wzrosnąć. Jednocześnie rozbieżność między wartością wskaż-nika dla Niemiec a średnimi OECD i UE systematycznie malała. Z pewnością wskaźnik ten można uznać za istotny wyznacznik modelu rozwoju państwa. Pokazuje on, czy państwo opiera swoją przewagę konkurencyjną na innowa-cyjności i technologii, czy raczej na bardziej tradycyjnych gałęziach przemy-słu. Z punktu widzenia innowacyjności Niemiec zjawiskiem pożądanym byłby zatem wzrost udziału eksportu high-tech w eksporcie całkowitym zgodnie z ostatnim trendem, a także dalsza poprawa wskaźnika względem innych kra-jów o zbliżonym poziomie rozwoju. Może to być zatem jeden z celów polityki
duża dynamika wzrostu oraz relatywnie wysokie płace. Pracuje w nich 22% wszystkich obywateli UE, por. C. Ketels, S. Protsiv (2014): European Cluster Panorama 2014, Enter-prise and Industry.
15 Ibidem.16 Dane Banku Światowego, http://data.worldbank.org/indicator/TX.VAL.TECH.CD17 Dane Banku Światowego, http://data.worldbank.org/indicator/TX.VAL.TECH.MF.ZS
Wspieranie innowacyjności w gospodarce niemieckiej 199
innowacyjnej. Należy ponadto dodać, że w przypadku udziału eksportu usług opartych na wiedzy w całkowitym eksporcie usług Niemcy wypadają znacznie lepiej, mając wynik 55,6% i zajmując piąte miejsce w Unii Europejskiej. Śred-nia UE wynosi natomiast 45,3%18.
Rysunek 2. Udział eksportu produktów high-tech w całkowitym eksporcie produkcji przemysłowej w Niemczech, Unii Europejskiej i OECD w latach 1988–2012
Źródło: opracowanie własne na podstawie danych Banku Światowego, http://data.worldbank.org/indicator/TX.VAL.TECH.MF.ZS
Przytoczone wyżej wskaźniki potwierdzają tezę, że Niemcy są jednym z liderów innowacyjności w Europie. O mocnej pozycji kraju w tej dziedzinie świadczy wiele różnych czynników, w tym przede wszystkim wysokie nakłady na badania i rozwój, otwartość, doskonała jakość klastrów, duże zaangażowa-nie MŚP w działalność innowacyjną oraz wysoka wartość eksportu produk-tów high-tech. Istnieją jednak obszary, w których kraj powinien dążyć do ich usprawnienia. Dotyczą one przede wszystkim wykształcenia społeczeństwa oraz możliwości finansowania innowacyjnych projektów, ale także poprawa struk-tury eksportu. Kluczową w tym zakresie wydaje się być dobrze przygotowana i wdrażana polityka państwa. Ponadto Niemcy wciąż powinny koncentrować się na działaniach wspierających małe i średnie przedsiębiorstwa. Stanowią one bowiem rdzeń niemieckiej gospodarki nawet w większym stopniu, niż ma
18 European Commission (2014): Innovation Union Scoreboard..., op.cit, dane z lat 2011–2012.
Krystyna Poznańska 200
to miejsce w innych krajach europejskich. Należy zatem dążyć do wzmocnie-nia ich znaczenia w dziedzinie innowacyjności poprzez ułatwianie działalności innowacyjnej i wprowadzanie odpowiednich zachęt. W dalszej części opraco-wania podjęta zostanie próba oceny kierunków wspierania innowacyjności w gospodarce niemieckiej.
2. Strategia wspierania innowacyjności w gospodarce niemieckiej
Ze względu na podział administracyjny RFN i szeroki zakres kompeten-cji przyznany krajom związkowym duża część działań wspierających innowa-cyjność odbywa się na poziomie regionalnym. Każdy z krajów związkowych posiada własną strategię i politykę w zakresie innowacyjności. W 2006 roku powstała jednak pierwsza ogólnonarodowa „Strategia High-Tech” (High-Tech Strategie)19. Jest ona głównym, choć nie jedynym, elementem całościowej stra-tegii państwa, dlatego też zostanie scharakteryzowana.
Strategia High-Tech stanowi projekt rządowy, w który ze względu na wielo-aspektowość celów i działań zaangażowane są wszystkie ministerstwa. Zaktu-alizowana jej wersja po raz pierwszy została przyjęta w roku 2009, co wiązało się ze zmianą jej nazwy na „Strategię High-Tech 2020”. Wówczas strategię uzupełniono o konkretny horyzont czasowy realizacji wyznaczonych celów20. W listopadzie 2014 Rząd Federalny Niemiec stworzył kolejną wersję strategii, która obowiązuje obecnie, o nazwie „Nowa Strategia High-Tech” (Die neue High-Tech Strategie)21.
Zakres działań objętych strategią w początkowym okresie jej realizacji był znacznie węższy niż obecnie. Strategia uwzględniała głównie skonkretyzowane programy wsparcia dla określonych technologii innowacyjnych. Przykładowo, w ramach wspierania rozwoju technologii kosmicznych za cel przyjęto utrzy-manie czołowej pozycji Niemiec na świecie w zakresie eksploracji kosmosu i badań nad tymi technologiami, a także zwiększenie konkurencyjności nie-mieckich przedsiębiorstw na nowo powstających rynkach związanych z tym obszarem. Aby to zrealizować, zaplanowano takie inicjatywy, jak opracowa-
19 Research in Germany, Die neue Hightech…, op.cit.20 Ibidem.21 Bundesministerium für Bildung und Forschung (2014): Die neue High-Strategie. Inno-
vationen für Deutschland, Bonn, Berlin, http://www.bmbf.de/pub_hts/HTS_Broschure_Web.pol.php dostęp 16.03

Wspieranie innowacyjności w gospodarce niemieckiej 201
nie europejskiego programu podróży kosmicznych, pracę nad dwoma nowymi misjami w ramach narodowego programu podróży kosmicznych oraz przedsta-wienie projektu ustawy o bezpieczeństwie danych satelitarnych22. Uzupełnienie tych programów stanowiły działania przekrojowe, niezwiązane z konkretnymi technologiami, mające na celu intensyfikację współpracy między sektorem nauki a sektorem przedsiębiorstw, zwiększenie możliwości działalności inno-wacyjnej w MŚP i startupach, przyspieszenie dyfuzji technologii, polepszenie międzynarodowej współpracy w zakresie innowacji, a także systemu eduka-cji23. Miały one jednak relatywnie mniejsze znaczenie. Przeznaczono na nie 2,66 mld euro, w porównaniu do 11,94 mld wydanych na wsparcie łącznie 17 innowacyjnych technologii24.
Od 2010 roku zakres obszarów objętych strategią został znacznie posze-rzony. Obecnie ta strategia kładzie nacisk przede wszystkim na różne aspekty życia społecznego, które dzięki nowym technologiom mogą ulec poprawie, a także na wyzwania, stawiane przed społeczeństwem przez współczesność. Twórcy strategii wskazują, że na jej ogólny zarys mają wpływ przede wszystkim zjawiska gospodarczo-społeczne, takie jak powszechna digitalizacja, zmiana demograficzna oraz dążenie do zrównoważonego rozwoju. Dzięki aktywnemu wykorzystaniu nowych technologii mogą one przyczynić się do powstania nowych rynków zbytu dla niemieckich produktów oraz zwiększyć konkuren-cyjność niemieckiej gospodarki25.
Najnowsza wersja strategii opiera się na pięciu następujących filarach:1. Priorytetowe zadania na przyszłość na rzecz tworzenia wartości dodanej
i poprawy jakości życia, które obejmują:• cyfrową gospodarkę i cyfrowe społeczeństwo. Celem jest wzrost konku-
rencyjności Niemiec poprzez wdrożenie technologii informacyjno-komu-nikacyjnych w jak najszerszym obszarze gospodarki oraz zwiększenie bezpiecznego dostępu do nich dla członków społeczeństwa;
• zrównoważoną gospodarkę i energetykę, czyli zmniejszenie wpływu działalności człowieka na przyrodę i klimat;
• innowacyjny rynek pracy, to jest rynek dynamicznie się dostosowu-jący, elastyczny, o dużym udziale pracowników wykwalifikowanych
22 Bundesministerium für Bildung und Forschung (2006): Die High-Tech Strategie. Inno-vationen für Deutschland,, Referat Öffentlichkeitsarbeit, Bonn, Berlin, s. 68–72.
23 Ibidem, s. 11–23.24 Ibidem, s. 106.25 Bundesministerium für Bildung und Forschung (2014): Bundesbericht Forschung und
Innovation 2014,, Referat Grundsatzfragen der Innovationspolitik, Bonn, Berlin, s. 28.
Krystyna Poznańska 202
i nastawiony na ciągły rozwój kompetencji, zapewniający sprawiedliwą płacę i godziwe warunki pracy;
• zdrowe społeczeństwo dzięki walce z chorobami cywilizacyjnymi, zin-dywidualizowaną opiekę medyczną, ulepszoną prewencję itp. Rozwój technologii w tej dziedzinie umożliwi także powstanie nowych rynków zbytu i zwiększenie konkurencyjności niemieckich przedsiębiorstw w tym zakresie;
• inteligentną mobilność dzięki nowoczesnym technologiom w zakresie komunikacji lądowej, morskiej i powietrznej;
• bezpieczeństwo cywilne, obejmujące m.in. ochronę przed zagrożeniami wynikającymi z katastrof naturalnych, wypadków czy terroryzmu, ale także bezpieczeństwo w sieci i ochronę danych osobowych.
2. Usieciowienie i transfer technologii. Twórcy strategii dostrzegają, że w dzi-siejszych czasach transfer technologii stanowi kluczowe źródło innowacji. Celem strategii jest wzmocnienie potencjału innowacyjnego gospodarki poprzez zintensyfikowanie różnorodnych powiązań między sektorem nauki a sektorem biznesu, zwiększenie orientacji sektora nauki na tworzenie wie-dzy, która nadaje się do zastosowania praktycznego oraz współpracę mię-dzynarodową w dziedzinie transferu technologii.
3. Zwiększenie dynamiki procesów innowacyjnych w gospodarce poprzez pro-mocję zastosowania „kluczowych technologii”, takich jak mikroelektronika czy biotechnologia w jak najszerszym obszarze działalności gospodarczej, wzmocnienie potencjału innowacyjnego MŚP, wsparcie przy powstawa-niu nowych przedsiębiorstw typu start-up oraz wyrównanie różnic struk-turalnych, które mogą hamować procesy innowacyjne, między regionami.
4. Warunki ramowe sprzyjające innowacjom, obejmujące dostęp do wykwa-lifikowanej siły roboczej, finansowanie działalności innowacyjnej, normy i standardy techniczne, ochronę własności intelektualnej, łatwy i darmowy dostęp do publikacji naukowych, popyt państwa na produkty i usługi inno-wacyjne. W ramach tego filaru podkreśla się także znaczenie wspierania otwartego modelu innowacyjności.
5. Przejrzystość działań dotyczących m.in. finansowego wsparcia działalności innowacyjnej oraz dialog społeczny, umożliwiające ogółowi łatwy dostęp do nowych technologii oraz do informacji na temat korzyści i ryzyka z nimi związanych26.
26 Bundesministerium für Bildung und Forschung (2014): Die neue High-Strategie…, op.cit.
Wspieranie innowacyjności w gospodarce niemieckiej 203
Powyższe filary strategii są realizowane poprzez wiele programów o kon-kretnie wyznaczonych celach. Warto zwrócić uwagę, że państwo wspiera przede wszystkim innowacje powstające w wyniku badań naukowych. Logiczną kon-sekwencją jest więc skoncentrowanie tych państwowych programów na takim właśnie rodzaju innowacji, powstającym w sposób dosyć sformalizowany, często przy udziale ośrodków badawczo-naukowych, a nie tylko przedsiębiorstw. Pociąga to za sobą relatywnie niskie możliwości wsparcia dla innowacji niesprzężonych.
Realizacji strategii służą także dziesięć rządowych „projektów przyszłości”, będących kontynuacją inicjatyw rozpoczętych w poprzedniej kadencji. W ich ramach współpracować mają wszyscy członkowie systemu innowacji Niemiec. Przykłady projektów obejmują: „niskoemisyjne, wydajne energetycznie miasto dopasowane do klimatu” (Die CO2-neutrale, energieeffiziente und klimaangepas-ste Stadt), „przemysł 4.0” (Industrie 4.0), „samodzielność w podeszłym wieku” (Auch im Alter ein selbstbestimmtes Leben führen) oraz „usługi internetowe dla biznesu” (Internetbasierte Dienste für die Wirtschaft). Jak można zauważyć, choć wspierane w ramach strategii innowacje powinny opierać się na konkretnych badaniach naukowych, to samo zagadnienie źródeł innowacyjności jest trak-towane bardzo szeroko – poszukuje się ich nie tylko w nowo powstającej kon-kretnej wiedzy, ale także w problemach codziennego życia.
Strategia jest realizowana także poprzez instrumenty wspierające współ-pracę na poziomie regionalnym i europejskim, takich jak Niemiecka Platforma Klastrowa (Clusterplattform Deutschland) lub portale internetowe ułatwiające instytucjom zagranicznym znalezienie możliwości inwestowania w działalność innowacyjną lub współpracy międzynarodowej w tym zakresie. Bardzo istotna dla realizacji strategii jest również ewaluacja wydajności i jakości instrumen-tów wspierających innowacyjność, której regularne dokonywanie w formie publicznie dostępnych raportów jest zadaniem rządu. W celu dalszego kształ-towania strategii planowane jest powołanie specjalnego ciała doradczego zło-żonego z ekspertów z różnych dziedzin.
Jak już wspomniano, rząd Niemiec podejmuje także inne cele i działania strategiczne, które wspierają realizację strategii High-Tech, często częściowo się z nią zazębiając. Niektóre z tych działań stanowią odpowiedź na postępu-jącą globalizację wiążącą się z koniecznością intensyfikacji współpracy mię-dzynarodowej. Od 2008 roku wdrażana jest „Strategia Internacjonalizacji” (Internationalisierungsstrategie)27. Kładzie ona nacisk na współpracę z krajami
27 Bundesministerium für Bildung und Forschung (2014): Bundesbericht Forschun…, op.cit, s. 29–30.

Krystyna Poznańska 204
rozwijającymi się, aktywnymi w dziedzinie innowacji; sztandarowym przykładem takiego kraju są Chiny. Szczegółowe cele „Strategii Internacjonalizacji” to m.in. usieciowienie działalności międzynarodowej niemieckiego sektora nauki, wsparcie zagranicznych studentów w Niemczech oraz promocja Niemiec jako atrakcyjnej lokalizacji dla prowadzenia innowacyjnego biznesu. Instrumenty realizacji strategii Internacjonalizacji częściowo pokrywają się z instrumen-tami strategii High-Tech lub też stanowią ich umiędzynarodowione wersje. Przykładem może być tu wsparcie międzynarodowej współpracy w ramach „projektów przyszłości” lub klastrów wyróżnionych w konkursie „Spitzenclu-ster”28. Ważnym aspektem strategii jest także współpraca polityczna w formie międzyrządowych konsultacji lub na forum organizacji międzynarodowych, takich jak OECD, Unia Europejska czy Uniwersytet Narodów Zjednoczonych.
Kolejny cel strategiczny polega na wspieraniu działalności naukowej w kraju. Aby zachęcić najlepszych naukowców zagranicznych do prowadzenia badań w Niemczech a naukowców niemieckich skłonić do pozostania w kraju lub do powrotu z emigracji29, proponuje się im coraz atrakcyjniejsze formy finanso-wania badań, a także poprzez konsekwentną i długofalową politykę wspierania innowacyjności, stwarza się dla nich pewne i stabilne perspektywy na przy-szłość30. Dla tych celów stworzono trzy pakty na rzecz nauki: Inicjatywę Zna-komitości (Exzellenzinitiative), Pakt na rzecz Szkół Wyższych (Hochschulpakt) oraz Pakt na Rzecz Badań i Innowacji (Pakt für Forschung und Innovation). Stanowią one wspólne inicjatywy rządu federalnego oraz krajów związkowych, w ramach których oferowane są różne możliwości finansowania dla instytucji edukacyjnych i naukowych. Ponadto, postęp naukowy jest także pobudzany przez badania resortowe w zakresie polityki kształtowanej przez poszczególne ministerstwa. Dalsze działania to prowadzenie różnorodnych baz danych oraz rejestrów naukowo-technicznych.
Strategia wspierania innowacyjności w Niemczech obejmuje także dążenie do stałego ulepszania jakości oraz zasięgu kształcenia na wszystkich szczeblach edukacji jako fundamentu systemu innowacji. Nacisk kładziony jest przede wszystkim na stworzenie środowiska, w którym młode talenty będą mogły się
28 Bundesministerium für Bildung und Forschung (2014): Bekanntmachung des Bundes-ministeriums für Bildung und Forschung von Richtlinien zur Förderung der „Internationali-sierung von Spitzenclustern, Zukunftsprojekten und vergleichbaren Netzwerken“, http://www.kooperation_international.de//info/des-bundesministerium-fuer-bildung-und-foerderung-der-lichlinien-zur-foerderung-der-international..html, dostep 16.03.2016
29 Bundesministerium für Bildung und Forschung (2014): Bundesbericht Forschun…, op.cit, s. 35.
30 Ibidem, s. 33–35.
Wspieranie innowacyjności w gospodarce niemieckiej 205
rozwijać, zwłaszcza w naukach ścisłych. Przykładowe działania wspierające ten cel obejmują rozwój programów stypendialnych, różne konkursy dla zdol-nych uczniów i studentów, inicjatywy rozbudzające zainteresowanie naukami ścisłymi oraz pomoc w wyborze ścieżki zawodowej31.
Ważnym elementem strategii wspierania innowacyjności jest doradztwo strategiczne32. Jedną z najważniejszych instytucji, która się nim zajmuje jest Ekspercka Komisja Badań i Innowacji (Expertenkommission Forschung und Innovation), która doradza rządowi federalnemu w kwestiach politycznych dotyczących badań, innowacji i technologii. Z kolei Rada Nauki (Wissenscha-ftsrat) zajmuje się doradztwem w dziedzinie szkolnictwa wyższego oraz nauki, skierowanym zarówno do władz federalnych, jak i lokalnych. Ponadto doko-nuje ona oceny szkół wyższych oraz instytucji naukowych. Ważną funkcję pełni także Narodowa Akademia Nauk (Nationale Akademie der Wissenschaft), która wraz z innymi krajowymi akademiami reprezentuje niemiecką naukę za gra-nicą oraz wspiera poszczególne ministerstwa w zakresie tworzenia prognoz i planów działania uwzględniających potencjalne szanse i zagrożenia związane z nowymi technologiami i działalnością innowacyjną, a zwłaszcza ich impli-kacje dla życia społecznego.
Podsumowując, założenia strategii wspierania innowacyjności w Niem-czech obejmują bardzo szeroki zakres zagadnień, od rozwoju konkretnych technologii przez wsparcie systemu nauki i edukacji po dosyć ogólne polep-szanie warunków ramowych. Zawierają one stwierdzenia stanowiące odpo-wiedź na zidentyfikowane w poprzednim rozdziale problemy czy też obszary wymagające dalszej poprawy, o czym mówiono w pierwszym punkcie opra-cowania. O pozycji innowacyjnej Niemiec decydują w dużym stopniu aktyw-ność innowacyjna przedsiębiorstw. Biorąc pod uwagę niekorzystny potencjał innowacyjny małych i średnich przedsiębiorstw w porównaniu do dużych przedsiębiorstw, polityka innowacyjna kładzie nacisk na ich wspieranie, aby zmniejszyć lukę innowacyjną. Świadczą o tym programy omówione w dalszej części opracowania.
31 Ibidem, s. 36–38.32 Ibidem, s. 39–40.
Krystyna Poznańska 206
3. Wspieranie innowacyjności małych i średnich przedsiębiorstw
Gospodarka niemiecka opiera swój rozwój gospodarczy na sektorze małych i średnich przedsiębiorstw, uznając go za swoisty „kręgosłup gospodarki”33. Dla-tego też dla tych firm stworzono odrębne programy dofinansowania działań naukowych oraz liczne programy wspierające innowacyjność w sposób mniej bezpośredni. Przy określaniu, które przedsiębiorstwa kwalifikują się do tego rodzaju wsparcia, stosuje się definicję Komisji Europejskiej. Zgodnie z tą defi-nicją, za małe lub średnie przedsiębiorstwo uznaje się takie, które zatrudnia mniej niż 250 osób oraz osiąga roczny obrót nie większy niż 50 mln euro lub roczną sumę bilansową nie wyższą niż 43 mln euro34.
Flagowym programem rządu w tym zakresie jest program Ministerstwa Edukacji i Nauki KMU-innovativ. Obecnie w ramach tego programu wsparcie mogą uzyskać projekty obejmujące badania przemysłowe oraz rozwój przed-konkurencyjny35 z 7 dziedzin naukowych: biotechnologii, techniki medycz-nej, technologii informacyjno-komunikacyjnej, nanotechnologii, technologii optycznej, technologii produkcyjnej oraz wydajności zasobowej i energetycz-nej36. Wspierane przedsięwzięcia muszą się cechować wysokim ryzykiem ze względu na zaawansowanie naukowo-techniczne oraz nastawieniem na prak-tyczne zastosowanie różnorodnych technologii, a także powinny wpływać na poprawę pozycji konkurencyjnej przedsiębiorstwa na rynku37. Warunkiem koniecznym dofinansowania jest udział w projekcie małej lub średniej firmy, jednak nie musi ona być jego jedynym uczestnikiem. Możliwe jest także wspar-cie projektów współpracy między firmami z sektora MŚP lub firm z uczelniami
33 Ministerstwo Gospodarki i Energii (2014): Wirtschaftsmotor Mittelstand – Zah-len und Fakten zu den deutschen KMU, http://www.bmwi.de/DE/Mediathek/publikatio-nen,did=548480.html, dostep 16.03.2016
34 Zalecenie Komisji Europejskiej z dnia 6 maja 2003 roku dotyczące definicji przedsię-biorstw mikro, małych i średnich, (2003/361/WE).
35 Według definicji unijnej, rozwój przedkonkurencyjny oznacza przekształcanie rezulta-tów badań przemysłowych w plan, organizację lub projekt nowych, zmienionych lub udo-skonalonych produktów, procesów lub usług zarówno tych planowanych na sprzedaż, jak i do użytku, łącznie z tworzeniem wstępnych prototypów, które nie mogą być wykorzystane w celach handlowych, por. Rozporządzenie Komisji (WE) nr 364/2004 z dnia 25 lutego 2004 roku.
36 Bundesministerium für Bildung und Forschung (2015): KMU-innovativ. Vorfahrt für Spitzenforschung im Mittelstand, Referat Neue Instrumente und Programme der Innovati-onsförderung, Bonn, Berlin.
37 Richtlinie des Bundesministeriums für Bildung und Forschung, z 6 lutego 2015.
Wspieranie innowacyjności w gospodarce niemieckiej 207
wyższymi i instytucjami badawczymi, a także będących częścią partnerstw strategicznych MŚP z dużymi firmami pod warunkiem, że taka współpraca ma charakter długoterminowy i wspiera dążenie MŚP do zajęcia trwałego miejsca w łańcuchu wartości w danej branży38. Aby uzyskać dofinansowanie, należy przedstawić projekt w ramach dwustopniowego postępowania konkursowego, wyszczególniając we wniosku etapy jego realizacji oraz przeznaczenie środ-ków. Środki mogą być wydatkowane na określone kategorie kosztów: materiały, wynagrodzenia, koszty podróży, koszty operacyjne, koszty usług związanych z działalnością badawczo-rozwojową świadczonych przez zewnętrzne pod-mioty oraz koszt amortyzacji39. Konieczne jest także przedstawienie własnego udziału w kosztach projektu, którego wysokość jest ustalana indywidualnie. Dla uczestników będących przedsiębiorstwami powinien on wynieść co naj-mniej 50% poniesionych kosztów, dla instytucji naukowych dofinansowanie może sięgać nawet 100% ich wartości40.
Zaletą programu z pewnością jest niski poziom zbiurokratyzowania towa-rzyszących mu procedur. Zgodnie z ankietą przeprowadzoną wśród przed-siębiorstw biorących udział w części programu poświęconej biotechnologii, ponad 90% jego uczestników było zadowolonych lub bardzo zadowolonych z administracyjnych aspektów programu. Wpływ na to mają specjalnie przy-gotowane internetowe narzędzia do tworzenia i składania wniosków, ograni-czenie procesu ubiegania się o dofinansowanie do czterech miesięcy, a także funkcjonowanie specjalnej jednostki doradczej (Lotsendienst) dedykowanej wyłącznie dla programu KMU-innovativ41. Korzystna jest także elastyczność finansowania i możliwość jego dopasowywania do potrzeb wnioskodawcy. Świadczy o tym to, że wymagana kwota udziału własnego jest ustalana indywi-dualnie, z uwzględnieniem wielkości przedsiębiorstwa oraz możliwość rozło-żenia w czasie koniecznych wpłat poprzez podzielenie finansowanego projektu na etapy42. Tym, co odróżnia program KMU-innovativ od innych inicjatyw, jest
38 Bundesministerium für Bildung und Forschung (2010): Förderung kleiner und mittel-ständischer Unternehmen in der Biotechnologie, Referat Biotechnologie, Bonn, Berln.
39 Nebenbestimmungen für Zuwendungen auf Kostenbasis des Bundesministeriums für Bildung und Forschung an Unternehmen der gewerblichen Wirtschaft für Forschungs- und Entwicklungsvorhaben, Kwiecień 2006, Punkt 5.6.1.
40 Opisy wariantów programu KMU-innovativ są dostępne na stronie http://www.foer-derdatenbank.de
41 Bundesministerium für Bildung und Forschung (2015): Lotsendienst für Unterneh-men. Ein Service der Förderberatung „Forschung und Innovation” des Bundes, Referat Neue Instrumente und Programme der Innovationsför-derung, Berlin, Bonn.
42 Bundesministerium für Bildung und Forschung (2015): KMU-innovativ…, op.cit., http://www.bmbf.de/de/20635.php
Krystyna Poznańska 208
przede wszystkim możliwość zgłaszania do niego projektów bardziej ryzykow-nych, o szerszym zakresie, i co za tym idzie, także bardziej kapitałochłonnych. Wpływa na to brak kwotowego ograniczenia maksymalnej dotacji43. Z wymie-nionych względów program cieszy się dużą popularnością. Środki wypłacone w ramach niego od 2007 roku stanowią ok. 1/4 całkowitego wsparcia rządo-wego MŚP w tym okresie44.
Drugim dużym rządowym programem wsparcia innowacyjności MŚP jest Zentrales Innovationsprogramm Mittelstand (w skrócie ZIM), stworzony i koor-dynowany przez Ministerstwo Gospodarki i Energii. Od wcześniej omówionego programu KMU-innovativ odróżnia go otwarty katalog technologii rozwój, któ-rych może być wsparty. Jedynym wymogiem jest wykroczenie poza obecny stan wiedzy i postępu technicznego w danej dziedzinie. Podobnie jak KMU-innova-tiv, program ZIM oferuje możliwość uzyskania dotacji różnym grupom pod-miotów45. W ramach niego możliwe jest finansowanie projektów pojedynczych przedsiębiorstw, mających na celu rozwój ich własnej zdolności innowacyjnej. W ramach tej części programu wspiera się także usługi (np. doradcze) ułatwia-jące przedsiębiorstwom działalność innowacyjną. Drugim wariantem są pro-jekty współpracującej grupy przedsiębiorstw lub przedsiębiorstw i instytucji naukowych, których celem jest zazwyczaj opracowanie innowacyjnych pro-duktów, procesów czy usług. Program oferuje także dofinansowanie sieciom przedsiębiorstw, składających się z minimum 6 MŚP i – ewentualnie – instytu-cji naukowych lub dużych firm. W tym przypadku celem programu może być konkretne przedsięwzięcie o charakterze innowacyjnym, ale także poprawa zarządzania siecią i jej funkcjonowania.
Innym podobieństwem programów jest konieczność wkładu własnego, wyższego niż w poprzednim przypadku. W ramach ZIM dofinansowane może zostać od 25 do 45% kosztów przedsięwzięcia, ale w maksymalnej wysokości 380 tys. euro. Ponadto maksymalna kwota dofinansowania przypadającego na jeden wniosek nie może przekroczyć 171 tys. euro46. Co więcej, wysokość wparcia w konkretnym przypadku uzależniona jest w dużym stopniu od wielko-ści przedsiębiorstwa wnioskującego. Programy różni ponadto proces przyzna-
43 ZEW (2011): Systemevaluierung KMU-innovativ“ Abschlussbericht, Zentrum für Euro-päische Wirtschaftsforschung GmbH (ZEW) Prognos AG, Institut für Mittelstandsforschung an der Universität Mannheim (ifm), Mannheim, Berlin.
44 Bundesministerium für Bildung und Forschung (2015): KMU-innovativ…, op.cit., http://www.bmbf.de/de/kmu-inovation.561.thml, dostęp 16.03.2016
45 Ibidem.46 Bundesministerium für Bildung und Forschung: Einzelprojekte, http://www.zim-bmwi.
de/einzelprojekte, dostep 16.03.2016

Wspieranie innowacyjności w gospodarce niemieckiej 209
wania dotacji. W programie ZIM jest on jednostopniowy, a nie dwustopniowy, jak w przypadku KMU- innovativ; inne są także ramy czasowe postępowania konkursowego47. Ocena wniosku trwa ok. trzech miesięcy, a realizację pro-jektu można zacząć na własne ryzyko nawet przed tym terminem. Ponadto, podczas trwania projektu finansowanego z programu ZIM nie jest konieczne tak częste raportowanie postępów. Kolejną różnicą jest katalog kosztów, które mogą zostać sfinansowane – ogranicza się on do kosztów wynagrodzeń, kosz-tów operacyjnych oraz kosztów usług zewnętrznych. Wszystko to sprawia, że w ramach ZIM dofinansowanie uzyskują projekty węziej zakrojone i mniej kapitałochłonne, cechujące się niższym ryzykiem. Mniejsza skala, elastyczność programu, a także dowolność w wyborze rozwijanej technologii umożliwiają zostanie adresatem programu szerokiej grupie podmiotów nawet o bardzo nie-wielkich rozmiarach. Celem programu jest więc nie tyle rozwój konkretnych priorytetowych technologii, ile zachęcenie dużej liczby MŚP do rozpoczęcia działalności naukowej i wdrażania innowacji oraz wzmocnienie całego sys-temu innowacji poprzez usprawnianie transferu technologii w ramach wspar-cia projektów powstających we współpracy kilku podmiotów48.
Działaniem poniekąd pokrewnym do opisywanych dotychczas programów bezpośrednich dotacji na działalność innowacyjną jest pomoc finansowa w zakła-daniu innowacyjnych przedsiębiorstw. Rząd federalny, a konkretnie Minister-stwo Gospodarki i Energii, realizuje ją bezpośrednio poprzez program EXIST. W ramach niego studenci i absolwenci uczelni wyższych oraz naukowcy mogą pozyskać środki na realizację swoich innowacyjnych pomysłów na biznes. Głównym instrumentem wsparcia są stypendia pozwalające młodym przedsię-biorcom utrzymać się w okresie rozpoczynania działalności gospodarczej. Jest ono uzupełnione o doradztwo merytoryczne oraz środki z oddzielnego filaru programu EXIST, przeznaczone na realizację pomysłu – jego opracowanie z uwzględnieniem potencjału komercyjnego oraz wdrożenie49.
Założyciele przedsiębiorstw mogą korzystać nie tylko z dotacji, lecz także z innych rodzajów finansowania oferowanych przez instytucje publiczne50. Jedną z możliwości są pożyczki państwowego banku KfW, oferowane na warunkach
47 Ibidem.48 RKW Rationalisierungs- und Innovationszentrum der Deutschen Wirtschaft e. V.
(2014): Das Zentrale Innovationsprogramm Mittelstand im Spiegel wissenschaftlicher Gut-achten und aus der Sicht von Unternehmen und Multiplikatoren, Eschborn.
49 Gesellschaft für Innovationsforschung und Beratung GmbH (2011): Evaluation der Fördermaßnahmen „EXIST-Gründerstipendium“ und „EXIST-Forschungstransfer“, Berlin.
50 Ibidem.
Krystyna Poznańska 210
korzystniejszych niż rynkowe, chociaż nie są one skierowane jedynie do pod-miotów prowadzących działalność innowacyjną. Ten sam bank prowadzi także program ułatwiający finansowanie kapitałowe poprzez ofertę kredytów refi-nansowanych dla dawców kapitału. Dawcy kapitału wysokiego ryzyka mogą także skorzystać z bezzwrotnej dotacji w ramach programu INVEST Minister-stwa Gospodarki i Energii. Ponadto rząd ułatwia młodym przedsiębiorstwom dostęp do tychże dawców za pomocą instrumentów, takich jak Fundusz High--Tech (High-Tech Gründerfonds – HTGF), Niemiecką Sieć Aniołów Biznesu (Business Angels Netzwerk Deutschland e.V – BAND) czy też Związek Niemiec-kich Spółek Private Equity (Der Bundesverband Deutscher Kapitalbeteiligungs-gesellschaften – BVK)51.
Pomoc w tworzeniu przedsiębiorstw stanowi ważny punkt działalności także dla niezależnych organizacji badawczych. Wspólnota Helmholtza, Towa-rzystwo Fraunhofera, a także Towarzystwo Maxa-Plancka prowadzą własne programy dofinansowania młodych przedsiębiorców. We wszystkich trzech przypadkach programy dotyczą naukowców pracujących w obrębie instytutów naukowych tych organizacji. Zapewnia się w nich (oprócz środków własnych czy też pochodzących z budżetu państwa) dodatkowe finansowanie mające na celu doprowadzenie innowacyjnego produktu do fazy dojrzałości na rynku. Wsparcie finansowe zostało uzupełnione o obszerne usługi doradztwa, przede wszystkim na temat zarządzania oraz kwestii ściśle związanych z działalno-ścią innowacyjną, takich jak tworzenie sieci partnerów czy też ochrona wła-sności intelektualnej52.
4. Wspieranie tworzenia i funkcjonowania klastrów
Rząd federalny prowadzi ponadto bezpośrednie działania zachęcające do tworzenia nowych klastrów i doskonalenia przepływów w już funkcjonujących. Jednym z nich jest Platforma Klastrów, stanowiąca źródło informacji i plat-formę kontaktu dla zainteresowanych podmiotów krajowych i zagranicznych. Flagowy program polityki klastrowej nosi zaś nazwę Konkursu Kluczowych
51 Die Bundesregierung, Technologieorientierte Unternehmensfinanzierung, http://www.foerderinfo.bund.de/de/Finanzierung-214.php, dostep 16.03.2016
52 Helmholtz Gesellschaft (2015): Aufruf zur Einreichung von Vorschlägen im Rahmen von „Helmholtz Enterprise“ vom 12. Januar 2015, http://www.helmholtz.de/fileadmin/user_upload/06_jobs_talente-/Ausschreibungen/Ausschreibung_Helmholtz_Enterprise_2015.pdf, dostep 16.03.2016

Wspieranie innowacyjności w gospodarce niemieckiej 211
Klastrów (Spitzencluster Wettbewerb). W ramach niego wybierane są najbar-dziej obiecujące klastry z wszelkich branż, którym następnie udziela się dota-cji w wysokości do 40 mln euro. W dotychczasowych trzech rundach konkursu dofinansowano 15 klastrów, obejmujących swym zasięgiem ponad 2 tys. uczest-ników. Łączna kwota dofinansowań wyniosła ponad 500 mln euro53..
Wybór kluczowych klastrów dokonuje się na podstawie stawianych przez uczestników wspólnych celów i strategii, oczywiście wiążących się z rozwo-jem technologicznym. Warto przy tym zaznaczyć, że w przypadku wybranych technologii duże znaczenie w tworzeniu projektów rozwoju w ramach klastra ma inspiracja wynikami badań podstawowych54. Ważne są także aspekty, takie jak kształcenie nowych pracowników klastra, nakłady finansowe prywatnych inwestorów i przedsiębiorstw, spójne zarządzanie klastrem, zrównoważony rozwój. Warto też zwrócić uwagę na aspekt prywatnego współfinansowania projektów prowadzonych w ramach klastra. Program Spitzencluster zakłada 50-procentowy udział własny przedsiębiorstw, przy czym zazwyczaj przyjmuje się, że powinien on zostać spożytkowany na zwiększenie własnych wydatków na badania i rozwój55. Ten element programu ma więc bezpośredni wpływ na korzystny rozwój wskaźników udziału wydatków na B+R w PKB w gospo-darce. Szacuje się, że dla MŚP tzw. efekt dźwigni polegający na zwiększeniu tych wydatków ponad sumę dofinansowania wyniósł 1,36. Oznacza to, że na każde 1 euro dofinansowania przedsiębiorstwa zwiększyły swoje wydatki o 1,36 euro56.
Według pierwszych ocen funkcjonowania programu, jego cel krótkotermi-nowy, czyli intensyfikacja usieciowienia aktorów systemu innowacji w regionach będących bazą dla klastrów, został spełniony57 Ze względu na krótki horyzont czasowy jest to jednak ocena bazująca na danych jakościowych, pochodzących z ankiety przeprowadzonej wśród uczestników programu, a nie na danych ilościo-wych58. Wynika z niej także, że program przyniósł pozytywne efekty dla całych regionów, będących siedzibą klastrów, w postaci ich większej atrakcyjności dla bezpośrednich inwestycji oraz wzrostu wskaźników dotyczących działalności badawczo-rozwojowej. Ponadto podkleśla się wysoki poziom profesjonalizmu zarządzania stającymi do konkursu klastrami, umożliwienie otwarcia klastrów
53 Bundesministerium für Bildung und Forschung (2015): Deutschlands Spitzenclusters, Referat Neue Instrumente und Programme der Innovationsförderung, Berlin.
54 M. Rothgang, U. Cantner, J. Dehio (2014): Begleitende Evaluierung des Förderinstru-ments „Spitzencluster-Wettbewerb“ des BMBF. Abschlussbericht – Kurzfassung, Essen, s. 31.
55 M. Rothgang, U. Cantner, J. Dehio, Begleitende Evaluierung..., op.cit., s. 45.56 Ibidem, s. 44.57 Ibidem.58 Ibidem, s. 48.
Krystyna Poznańska 212
dla większej ilości uczestników mogących korzystać z powstającej w nich wie-dzy oraz dużą intensywność przepływów wiedzy dzięki programowi59. Bardziej mierzalne efekty konkursu Spitzencluster to 900 powstałych innowacji, 300 patentów, prawie 1,5 tys. prac naukowych na różnych szczeblach uniwersytec-kich oraz 40 nowo założonych przedsiębiorstw60.
Klastry kluczowe są oczywiście jedynie częścią całej sieci klastrów w Niem-czech. Jak już wspomniano wcześniej, w całym kraju jest ich obecnie 498. Ist-nieją więc także instrumenty skierowane do ich szerszego grona. Należy tutaj wspomnieć o programie go-cluster, o udział w którym może ubiegać się każdy klaster. Uzyskawszy status członka programu po ocenie kryteriów, takich jak jakość zarządzania, aktywność, struktura oraz przejrzystość działań, klastry uzyskują dostęp do licznych usług ułatwiających funkcjonowanie i dalszy roz-wój, związanych głównie z promocją, szkoleniem, współpracą międzyregio-nalną i międzynarodową oraz pomocą w pozyskiwaniu dalszych środków wsparcia61. Ponadto sieci klastrów podlegają finansowaniu ze strony władz regionów. Wsparcie dla tzw. klastrów regionalnych (Ländercluster) oferuje każda z władz, może ono jednak znacząco różnić się formą i intensywnością62. Ponadto częściowo jest pokrywane ze środków pochodzących z Europejskiego Funduszu Rozwoju Regionalnego.
W ramach niektórych z przedstawionych dotychczas inicjatyw wsparcie mogą uzyskać również uczelnie wyższe. Twórcy polityki innowacyjnej Nie-miec, doceniając istotność jakości systemu kształcenia i nauki dla innowacyj-ności kraju, stworzyli także osobną strategię jego rozwoju. Należy nadmienić, że na jakość kadry naukowej, jej odpowiednie zorientowanie na praktyczny aspekt prowadzonych badań, a co za tym idzie, na sukces całego systemu inno-wacji ma wpływ także system edukacji szkolnej na etapach wcześniejszych niż szkolnictwo wyższe. Szczególne znaczenie mają tu powiązania szkół z przed-siębiorstwami – przyszłymi pracodawcami ich absolwentów. W Niemczech duże znaczenie ma tzw. edukacja dualna, czyli jednoczesne kształcenie w tej samej dziedzinie i w szkole zawodowej, i w zakładzie pracy. Uważa się, że zapewnia ono niemieckim przedsiębiorstwom, zwłaszcza małym i średnim, dopasowanie umiejętności pracowników do ich działalności i konkretnych potrzeb, a także tworzenie standardów umiejętności i ich stałe doskonalenie,
59 Ibidem, s. 45.60 http://www.bmbf.de/de/der-spitzencluster_wettbewerb_537.thml, dostep 16.03.201661 BMWi, go-cluster, http://www.clusterplattform.de/CLUSTER/Navigation/DE/Bund/go-
-cluster/go-cluster.htm62 M. Rothgang.,U Cantner, J. Dehio, Beleitende Evaluierung..., op.cit., s. 28.
Wspieranie innowacyjności w gospodarce niemieckiej 213
co umożliwia uzyskanie przewagi konkurencyjnej i przyczynia się do tworze-nia innowacji63. Działalność ściśle naukowa ma jednak miejsce przede wszyst-kim na uczelniach wyższych, stąd koncentracja działań polityki innowacyjnej na tym obszarze systemu edukacji. Podjęte w tym obszarze dziania zawierają się w trzech paktach: Inicjatywa Znakomitości, Pakt na Rzecz Szkół Wyższych oraz Pakt na Rzecz Badań i Innowacji.
Celem Inicjatywy Znakomitości (Exzellenzinitiative) jest zaradzenie niedo-finansowaniu uniwersytetów jako ośrodków nauki64. Od 2005 roku koordynuje ją Niemiecka Wspólnota Badawcza (Deutsche Forschunsgemeinschaft – DFG). Jest to organizacja zrzeszająca uczelnie wyższe, instytucje naukowe, związki i akademie naukowe zajmujące się wszelkimi dziedzinami nauki. Mimo że jest ona instytucją autonomiczną, w skład jej organów wchodzą także przedstawi-ciele rządu federalnego i krajów związkowych. Od tych podmiotów pochodzi duża cześć środków finansowych, którymi dysponuje organizacja. Do zadań DFG należy przede wszystkim wsparcie finansowe innowacyjnych pomysłów i młodych obiecujących naukowców, interdyscyplinarnej i międzynarodowej współpracy między naukowcami, a także doradzanie w kwestiach nauki orga-nom władzy oraz instytucjom publicznym na szczeblu krajowym i regionalnym65.
Inicjatywa znakomitości składa się z trzech części, zakres których częściowo pokrywa się z zakresem własnych programów wsparcia organizowanych przez DFG66. Program Exzellenzcluster (Klastry doskonałości) przypomina Centra badawcze DFG – w obu przypadkach na uczelniach wyższych finansuje się tworzenie centrów badawczych angażujących partnerów z regionu, a także z innych krajów, których obecność powinna do pewnego stopnia ukierunko-wać profil uczelni na daną dziedzinę nauki. Kolejna część Inicjatywy Znako-mitości, Graduiertenschule (Szkoła prowadząca studia doktoranckie), również ma swój odpowiednik wśród własnych programów DFG. W tym przypadku chodzi o dofinansowanie studentów studiów doktoranckich. Oba programy odróżniają wymagania dotyczące obszerności katalogu dyscyplin naukowych nauczanych w danej instytucji. Graduiertenschule może przy tym obejmo-wać nie tylko uniwersytet, ale także działania z zakresu nauczania i promocji
63 M. C. Allen Matthews (2009): Germany’s National Innovation System, w: Encyclope-dia of Technology and Innovation, red. V. K. Narayanan, G. C. O'Connor, Oxford: Blackwell, s. 375–389..
64 E. L. Winnacker (2005): Entstehung und Ziele der Exzellenzinitiative, „Forschung. Das Magazin der Deutschen Forschungsgemeinschaft“, luty.
65 DFG, http://www.dfg.de/66 Ibidem.

Krystyna Poznańska 214
młodych naukowców, wspomagające instytucje zewnętrzne. Trzeci filar inicja-tywy stanowi uzupełnienie wspomnianych programów – udział w nim mogą wziąć jedynie szkoły wyższe, które uczestniczą w dwóch pozostałych jej czę-ściach. Nosi on nazwę „Koncepty przyszłości” (Zukunftskonzepte) – w ramach niego tworzy się strategie całościowego rozwoju uniwersytetów, zwiększając ich atrakcyjność jako miejsc pozyskiwania wiedzy, pracy oraz prowadzenia badań naukowych.
Dotychczas zaakceptowano 37 wniosków o udział w programie Exzellenzc-luster, 39 – w programie wsparcia studiów doktoranckich oraz 9 propozycji całościowego rozwoju uniwersytetów. W latach 2006–2011 rząd federalny i kraje związkowe przeznaczyły na realizację programu 1,9 mld euro, na kolejny okres finansowania, czyli lata 2012–2017, przewidziano środki w wysokości 2,7 mld euro67.
5. Inicjatywy wspierania innowacyjności we wschodniej części Niemiec
Bardzo istotną rolę we wspieraniu innowacyjności pełnią polityki tworzone przez regionalne ośrodki władzy. Jednak same w sobie nie są one w stanie zrów-nywać różnic rozwojowych pomiędzy poszczególnymi krajami związkowymi. W tym celu konieczne jest wsparcie władz federalnych. Ważny tego przejaw sta-nowi program Unternehmen Region. W zasadzie nazwa ta określa zbiór wielu programów skierowanych do różnych podmiotów mających swoje siedziby we wciąż opóźnionych w rozwoju wschodnich krajów związkowych68.. Ich celem jest zwiększenie atrakcyjności regionów dla przedsiębiorców i naukowców, a co za tym idzie, powstrzymanie odpływu zasobów ludzkich69. Przykłady ini-cjatyw z tego zbioru obejmują:• Innovative regionale Wachstumskerne, czyli Regionalne Innowacyjne Cen-
tra Wzrostu – program skierowany do regionalnych związków przedsię-biorstw posługujących się platformą wymiany technologii lub wykazujących potencjał ku stworzeniu takiej platformy. Mogą one uzyskać dofinansowanie
67 M. Sondermann, D. Simon (2008): Die Exzellenzinitiative: Beobachtungen aus der Implementierungsphase, iFQ, Bonn 2008.
68 Bundesministerium für Bildung und Forschung, Die Einzelprogramme, http://www.unternehmen-region.de/de/56.php, dostep 16.03.2016
69 Bundesministerium für Bildung und Forschung, Leitidee „Unternehmen Region“, http://www.unternehmen-region.de/de/54.php, dostep 16.03.2016

Wspieranie innowacyjności w gospodarce niemieckiej 215
na 3-letnie projekty badawcze połączone z usługami doradczymi z zamiarem komercjalizacji ich wyników w średnie lub długie. Do tej pory w ramach programu sfinansowano łączną kwotą blisko 400 mln euro 107 inicjatyw.
• Zentren fuer Innovationskompetenz – Centra Kompetencji Innowacyjnych. Adresatem tego programu są uniwersytety i instytucje badawcze, a jego cel to kształcenie kadr, pozyskiwanie młodych naukowców z innych krajów oraz gromadzenie wiedzy o potencjale praktycznego zastosowania. Tutaj liczba dofinansowanych instytucji to 19, a kwota wsparcia 285 mln euro.
• Innovationsforen, czyli Fora Innowacji. Tutaj cel stanowi organizacja paneli umożliwiających uczestnikom systemu innowacji transfer wiedzy i pozyskiwanie kontaktów. Dotychczas odbyło się 172 panele, na co prze-znaczono 14 mln euro.
• Forschung für den Markt im Team – Zespołowe Badania dla rynku. Dofi-nansowania w tym przypadku przeznaczone są na projekty opracowywane w multidyscyplinarnych zespołach złożonych z pracowników różnych katedr uniwersyteckich. Od najwcześniejszej ich fazy nacisk kładzie się na tworzenie planów praktycznego zastosowania tworzonej wiedzy, które w dalszej fazie zostaną wcielone w życie. Multidyscyplinarna współpraca umożliwia w tym przypadku szersze potraktowanie tematów badawczych i wypracowanie bardziej kreatywnych rozwiązań. Na ten program dotych-czas wydano 59 mln euro.
• Zwanzig20 – Ten projekt wspiera projekty powstające w kooperacji mię-dzy podmiotami pochodzącymi ze wschodniej części kraju i/lub partnerami z pozostałych krajów związkowych i z zagranicy. Bezpośrednim efektem pro-jektu ma być stworzenie konkretnych innowacyjnych rozwiązań, produktów czy też usług, pośrednim zaś – nawiązanie międzyregionalnej współpracy umożliwiającej szybszy transfer technologii i poszerzenie zakresu działal-ności. Na ten cel przewidziano do 500 mln euro do 2019 roku70.Należy podkreślić że w przypadku wszystkich powyższych przykładów
wyraźnie zaznacza się dążenie twórców programu Unternehmen-Region do wzmocnienia transferu technologii i zachęcenia przedsiębiorstw i uniwersy-tetów do nawiązywania kontaktów i współpracy z innymi podmiotami sys-temu innowacji. Jest to przejawem przekonania, że same środki publiczne nie wystarczą. Aby podnieść innowacyjność niemieckiej gospodarki, konieczne jest przede wszystkim stworzenie odpowiednich warunków wymiany informacji i pozyskiwania partnerów oraz zachęt do podejmowania tego typu działań.
70 Ibidem.
Krystyna Poznańska 216
Podsumowanie
Omówione powyżej działania z zakresu polityki innowacyjnej podejmo-wane przez niemieckie władze centralne świadczą o tym, że podejmowane działania obejmują nie tylko wsparcie dla konkretnych technologii, wsparcie dla małych i średnich przedsiębiorstw, ale także szeroko rozumianą współ-pracę między wszystkimi podmiotami Narodowego Systemu Innowacji, co stanowi pozytywną przesłankę dla rozwoju klastrów i sieci innowacyjnych w kraju oraz coraz sprawniejszego transferu technologii, prowadzącego do udanego wdrażania innowacji. Oferta wsparcia dla przedsiębiorstw jest bar-dzo szeroka, różnorodna i dostępna zarówno dla przedsiębiorstw w formie zalążkowej, jak i bardziej dojrzałych, działających samodzielnie lubwspółpra-cujących z innymi podmiotami. Dzięki indywidualnemu podejściu do udzie-lanej pomocy dostęp do finansowania mogą uzyskać także najmniejsze firmy i nowo tworzone podmioty.
STRESZCZENIE
W opracowaniu przedstawiono najważniejsze wskaźniki ilustrujące poziom inno-wacyjności gospodarki niemieckiej. Porównano kształtowanie się wskaźników dla gospodarki niemieckiej i ze średnią unijną. Następnie omówiono założenia „Stra-tegii High-Tech”, uznawanej za najważniejszy element wspierania innowacyjności w gospodarce niemieckiej. Zwrócono uwagę na strategiczne cele związane z rozwo-jem technologii, wsparciem systemu nauki i edukacji, jak też wsparciem wybranych regionów i przedsiębiorstw. W ogólnym zarysie zaprezentowano najważniejsze pro-gramy i działania podejmowane przez władze federalne w celu wspierania innowa-cyjności małych i średnich przedsiębiorstw, klastrów oraz wybrane inicjatywy we wschodniej części kraju.
Słowa kluczowe: innowacyjność, strategia High-Tech, małe i średnie przedsiębiorstwa, klastry.
Wspieranie innowacyjności w gospodarce niemieckiej 217
ZUSAMMENFASSUNG
Im Beitrag werden die wichtigsten Kennziffern der Innovationsfähigkeit der deut-schen Wirtschaft vorgestellt. Danach wird die High-Tech-Strategie erläutert, die als ein hauptsächliches Element der komplexen Strategie der Innovationsförderung in Deutschland betrachtet wird. Besondere Aufmerksamkeit wird im Beitrag ins-besondere den Initiativen und Programmen der Innovationsförderung gewidmet, die für kleine und mittlere Unternehmen, Spitzencluster und Ostdeutschland ent-wickelt wurden.
Schlüsselwörter: Innovationsfähigkeit, High-Tech-Strategie, Innovationsförderung, kleine und mittlere Unternehmen, Spitzencluster, Ostdeutschland
Bibliografia
Allen Matthews M. C. (2009): Germany’s National Innovation System, w: Encyclope-dia of Technology and Innovation, red. V. K. Narayanan, G. C. O'Connor, Oxford: Blackwell.
BMWi, go-cluster, http://www.clusterplattform.de/CLUSTER/Navigation/DE/Bund/go--cluster/go-cluster.html, dostep 16.03.2016
Bundesministerium für Bildung und Forschung (2006): Die High-Tech Strategie für Deutschland, Referat Öffentlichkeitsarbeit, Bonn, Berlin.
Bundesministerium für Bildung und Forschung (2010): Förderung kleiner und mit-telständischer Unternehmen in der Biotechnologie, Referat Biotechnologie, Bonn, Berlin.
Bundesministerium für Bildung und Forschung (2014): Bekanntmachung des Bun-desministeriums für Bildung und Forschung von Richtlinien zur Förderung der „Internationalisierung von Spitzenclustern, Zukunftsprojekten und vergleichba-ren Netzwerken“, http://www.kooperation_international.de/detail/info/des-bun-desministerium-fuer-bildung-und-forschung-der-lichlinie-zur-foerderung-der-international.html, dostep 16.03.2016
Bundesministerium für Bildung und Forschung (2014): Bundesbericht Forschung und Innovation 2014, Referat Grundsatzfragen der Innovationspolitik, Bonn, Berlin.
Bundesministerium für Bildung und Forschung (2014): Die neue High-Strategie. Innovationen für Deutschland, Referat Öffentlichkeitsarbeit, Bonn, Berlin, https://www.bmbf.de/pub_hts/HTS_Broschure-Webpalt, dostep 16.03.2016
Krystyna Poznańska 218
Bundesministerium für Bildung und Forschung (2015): Deutschlands Spitzenclusters, Referat Neue Instrumente und Programme der Innovationsförderung, Berlin.Bundesministerium für Bildung und Forschung (2015): KMU-innovativ. Vorfahrt für Spitzenforschung im Mittelstand, Referat Neue Instrumente und Programme der Innovationsförderung, Bonn, Berlin. Bundesministerium für Bildung und Forschung (2015): Lotsendienst für Unternehmen. Ein Service der Förderberatung „Forschung und Innovation” des Bundes, Referat Neue Instrumente und Pro-gramme der Innovationsförderung, Berlin, Bonn.
Bundesministerium für Bildung und Forschung, Die Einzelprogramme, http://www.unternehmen-region.de/de/56.php, dostęp 16.03.2016
Bundesministerium für Bildung und Forschung, Einzelprojekte, http://www.zim--bmwi.de/einzelprojekte, dostęp 16.03.2016
Bundesministerium für Bildung und Forschung, Leitidee “Unternehmen Region”, http:// www.unternehmen-region.de/de/54.php, dostęp 16.03.2016
Dane Banku Światowego, http://data.worldbank.org/indicatorDestatis, https://www.destatis.de/DFG, http://www.dfg.deDie Bundesregierung, Technologieorientierte Unternehmensfinanzierung, http://www.
foerderinfo.bund.de/de/Finanzierung-214.php, dostęp 16.03.2016European Commission (2014): Innovation Union Scoreboard 2014.Gemeinsame Wissenschaftskonferenz (2015): Pakt für Forschung und Innovation.
Monitoring-Bericht 2015, Bonn.Gesellschaft für Innovationsforschung und Beratung GmbH (2011): Evaluation der
Fördermaßnahmen „EXIST-Gründerstipendium“ und „EXIST-Forschungstrans-fer“, Berlin.
Helmholtz Gesellschaft (2015): Aufruf zur Einreichung von Vorschlägen im Rahmen von „Helmholtz Enterprise“ vom 12. Januar 2015, http://www.helmholtz.de/file-admin/user_upload/06_jobs_talente/Ausschreibungen/Ausschreibung_Helmholtz_Enterprise_2015.pdf, 16.03.2016
Ketels C., Protsiv S. (2014): European Cluster Panorama 2014, Enterprise and Industry.
Ministerstwo Gospodarki i Energii (2014): Wirtschaftsmotor Mittelstand – Zahlen und Fakten zu den deutschen KMU, http://www.bmwi.de/DE/Mediathek/publika-tionen.did=548480.html, dostęp 16.03.2016
Nebenbestimmungen für Zuwendungen auf Kostenbasis des Bundesministeriums für Bildung und Forschung an Unternehmen der gewerblichen Wirtschaft für For-schungs- und Entwicklungsvorhaben, kwiecień 2006, punkt 5.6.1.
OECD (2014): Main Science and Technology Indicators Database, http://stats.oecd.org/Index.aspx?DataSetCode=MSTI_PUB, dostęp 16.03.2016
OECD (2014): Science, Technology and Industry Outlook 2014, OECD Publishing, Paris.

Wspieranie innowacyjności w gospodarce niemieckiej 219
Reaserch in Germany, Die neue Hightech-Strategie – Innovationen für Deutschland, http://www.research-in-germany.de/de/forschungslandschaft/fue-politik/high--tech-strategie.html (3.03.2016).
Richtlinie des Bundesministeriums für Bildung und Forschung, z dnia 6 lutego 2015.Richtlinie zur FuE-Förderung gemeinnütziger externer Industrieforschungseinrich-
tungen in Ostdeutschland – Innovationskompetenz Ost (INNO-KOM-Ost), z dnia 23 stycznia 2012.
RKW Rationalisierungs- und Innovationszentrum der Deutschen Wirtschaft e. V. (2014): Das Zentrale Innovationsprogramm Mittelstand im Spiegel wissenscha-ftlicher Gutachten und aus der Sicht von Unternehmen und Multiplikatoren, Eschborn.
Rothgan M., Cantner U., Dehio J. (2014): Begleitende Evaluierung des Förderinstru-ments „Spitzencluster-Wettbewerb“ des BMBF. Abschlussbericht – Kurzfassung, Essen.
Rozporządzenie Komisji (WE) nr 364/2004 z dnia 25 lutego 2004 roku.Sondermann M., Simon D. (2008): Die Exzellenzinitiative: Beobachtungen aus der
Implementierungsphase, iFQ, Bonn.Winnacker E. L. (2005): Entstehung und Ziele der Exzellenzinitiative, „Forschung. Das
Magazin der Deutschen Forschungsgemeinschaft“, luty.ZEW (2011): Systemevaluierung „KMU-innovativ“ Abschlussbericht, Zentrum für
Europäische Wirtschaftsforschung GmbH (ZEW) Prognos AG, Institut für Mit-telstandsforschung an der Universität Mannheim (ifm), Mannheim, Berlin.
http://www.clusterobservatory.euhttp://www.spitzencluster.dehttp://www.foerderdatenbank.de

Andreas BIELIG*
BETWEEN LISBON AGENDA AND EUROPE 2020. STATUS QUO AND PROBLEMS OF INNOVATION
POLICY IN THE GERMAN ECONOMY
1. Introduction
The German economy holds with a GDP of 2.915,7 billion € in 2014 not only a leading economic position in Europe1 but belongs in terms of several eco-nomic performance indicators also to the group of leading economies in the international perspective, what is reflected by its membership in the group of G7. For instance in 2014 the foreign trade of German enterprises reached not only in export and import volumes new record levels (1.133.541 billion vs. 916.636 billion €) but also the trade surplus revealed an all times-high (216.904 billion €), indicating the strong economic position on global markets. In eco-nomic analyses continous innovation activity of German firms is regarded as one of the major factors for the observable success results at the international scale and a valuable source for future growth and welfare.2 To support inno-vation activity in the domestic private sector and also in reaction of increased efforts to harmonise innovation policies in the European Union the German policy developed and adopted in the past years comprehensive programs and instruments of innovation policy with the aim to stabilise economic develop-ment and lead the German economy to a path of increased growth rates in the future. This article is analysing major results of the German innovation policy
* Research Centre for the German Economy, World Economy Research Institute, SGH Warsaw School of Economics, * e-mail: [email protected]
1 Destatis (2015).2 EFI (2015), p. 8, Sachverständigenrat (2014), p. 27 and Sachverständigenrat (2009),
pp. 240–251.

Andreas Bielig 222
from the Lisbon Agenda to the Agenda Europe 2020 with respect to its effects and shows actual problems of innovation activity.
2. German innovation policy in the mirror of the European framework
On 23./24.03.2000 the European Council passed on its meeting for employ-ment, economic development and social cohesion a strategy paper as presi-dency conclusions for the next ten years until 2010 which was labelled later as Lisbon Strategy.3 The ambitious strategical target formulated to transform the European Union in ten years to “become the most competitive and dynamic knowledge-based economy in the world capable of sustainable economic growth with more and better jobs and greater social cohesion”. As quantitative targets the strategy program formulated as priorities full employment and an average eco-nomic growth rate of 3% per annum. To provide adequate conditions to reach three comprehensive targets of 1) preparing the transition to a knowledge-based economy and society, 2) modernisation of the European social model and 3) securing sustainable economic growth and prospects the European council formuleted also concrete subtargets for supporting policy areas. Among them an investment target for research and development activities (R&D) in form of a share of 3% of R&D investments on the Gross Domestic Product (GDP) adressed the innovation area, underlining the high importance of innovation processes in the Lisbon Strategy.4 Germany, which adopted in the implementa-tion of the Lisbon process this three percent-rule also to its national innovation policy like other EU member states, had from the beginning serious problems not only to reach the final target but also to converge the trend of its R&D expenditures with other leading european member states. As table 1 indicates the R&D intensity (gross domestic expenditures for R&D as share of GDP) reached in 2000 after a period of slow increases from 2.1% in 1995 to 2.4% in 2000 an extended stagnation phase.5 The leading european economies Swe-den and Finland reached just even in 2001 R&D intensities of 3.9 respective 3.2%, thereby fullfiling the Lisbon target en passant qua status ante. In contrast to this the German economy could whether close or even reduce the existing
3 European Parliament (2000).4 European Parliament (2012), p. 1.5 Schasse (2015), p. 31.
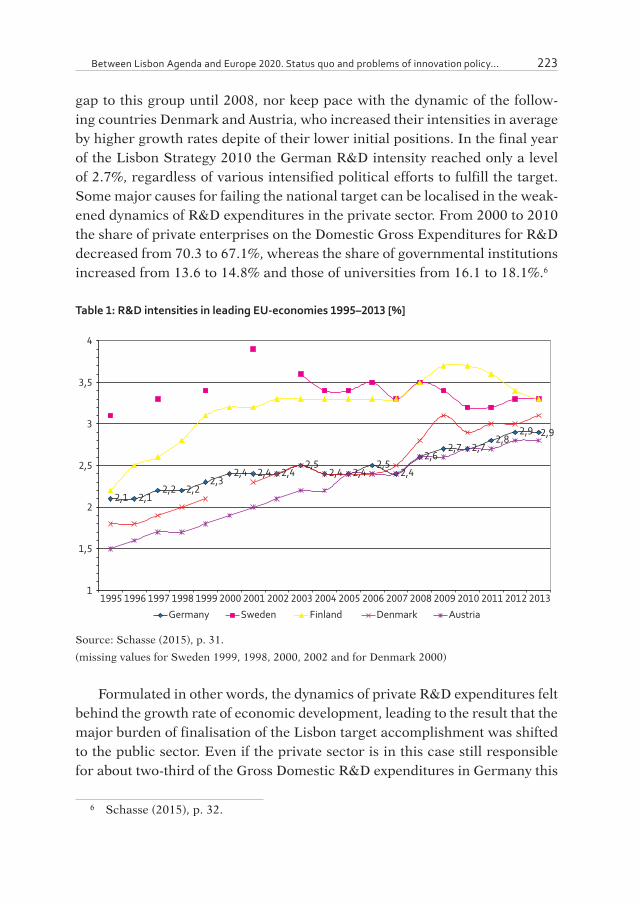
Between Lisbon Agenda and Europe 2020. Status quo and problems of innovation policy... 223
gap to this group until 2008, nor keep pace with the dynamic of the follow-ing countries Denmark and Austria, who increased their intensities in average by higher growth rates depite of their lower initial positions. In the final year of the Lisbon Strategy 2010 the German R&D intensity reached only a level of 2.7%, regardless of various intensified political efforts to fulfill the target. Some major causes for failing the national target can be localised in the weak-ened dynamics of R&D expenditures in the private sector. From 2000 to 2010 the share of private enterprises on the Domestic Gross Expenditures for R&D decreased from 70.3 to 67.1%, whereas the share of governmental institutions increased from 13.6 to 14.8% and those of universities from 16.1 to 18.1%.6
Table 1: R&D intensities in leading EU-economies 1995–2013 [%]
2,1 2,12,2 2,2
2,32,4 2,4 2,4
2,52,4 2,4
2,52,4
2,62,7 2,7
2,82,9 2,9
1
1,5
2
2,5
3
3,5
4
1995 1996 1997 1998 1999 2000 2001 2002 2003 2004 2005 2006 2007 2008 2009 2010 2011 2012 2013
Germany Sweden Finland Denmark Austria
Source: Schasse (2015), p. 31.
(missing values for Sweden 1999, 1998, 2000, 2002 and for Denmark 2000)
Formulated in other words, the dynamics of private R&D expenditures felt behind the growth rate of economic development, leading to the result that the major burden of finalisation of the Lisbon target accomplishment was shifted to the public sector. Even if the private sector is in this case still responsible for about two-third of the Gross Domestic R&D expenditures in Germany this
6 Schasse (2015), p. 32.
Andreas Bielig 224
shrinking trend is not compatible with the spirit of a more balanced R&D structure between private and public sector as it was required by the European Council in 2005 in its strategy for a revitalisation of the Lisbon Agenda.7 But not only Germany failed to reach the ambitious European target. With excep-tion of Sweden and Finland no other country in the European Union could achieve in 2010 this aim (also Denmark failed with 2.9% after 3.1% in 2009). Nevertheless in the international perspective other economies reached in the same time R&D intensities by far above the Lisbon target, like Israel 4.0%, South Korea 3.5% and Japan 3.3%, whereas the OECD average was only 2.3%.8 The German Joint Science Conference concluded in 2013 meaningful in its final report about the Lisbon Strategy for the German Government and of Federal Lands that the main effect of the three percent-target consisted in the mobilisation of the proved cooperation between policy, private economy and science,9 what is not only quite modest in comparison with the initial program aims set by the EU thirteen years ago but also more realistic. Nevertheless the conference insisted on underlining the fact that Germany still belonged to the leading group for this criterion at the European and international level.10 The European Commission came in its conclusions about the results of the Lisbon Strategy to the finding that despite of prioritisation of public R&D investments in 20 member states the disappointing performance of others led to no visible improvements in terms of the three percent-target at the aggregated EU level. According them the future key challenge of the EU remained the improvement of attracting private investments in R&D in Europe instead of other regions of the world economy.11 Hence the European Union reacted on the miss-ing accomplishment of the lofty targets of Lisbon in 2010 consequently with a modified strategy – the Agenda Europe 2020. The concept of the program was marked by the economic and social effects of the economic crisis, visible in most economies in the EU, and the valuable experiences made with the pre-decessor program of Lisbon. It outlined an economic and social vision for the European countries in 2020 based on a model of European Social Economy.12 The wide terms of the sketched European model base on three mutual rein-forcing political priorities (or requirements) for future growth: intelligence,
7 European Parliament (2005), p. 4.8 Schasse (2015), p. 31.9 GWK (2013), p. 4.10 GWK (2013), p. 3.11 EC (2010a), p. 12.12 EC (2010b), p. 5.
Between Lisbon Agenda and Europe 2020. Status quo and problems of innovation policy... 225
sustainability and integration. The first pillar of intelligent growth addresses by its definition the innovation area, with the target of the EU as a knowledge and innovation based economy and was linked by the European Commission with the achievement of the three percent-target for R&D expenditures, derived from the former Lisbon program. Also with respect to the seven flagship initia-tives for the implementation of targets on the European and national levels is the continuity of the program orientation remarkable. From the point of sup-porting innovation activities notably the targets of an Innovation Union, the realisation of a Digital Agenda and partially also the promotion of a Resource Efficient Europe are relevant topics on the Agenda. For the implementation at the national level all member states defined own national targets for eight EU core-targets, depending on their local economic and social conditions.13 The innovation input target of R&D expenditures for Germany remained unrevised with a share of 3% of the GDP, whereas the target levels for other member states vary between 0.5% for Cyprus and 4% for Sweden and Finland. The interim empirical development of R&D intensities after 2010 shows that the targets, announced in the Agenda Europe 2020 were for many countries not less ambi-tious than those formulated in the predecessor program, as well on national as for the European level. Table no. 1 indicates that the R&D intensity of the lead-ing European economy Finland decreased from 3.7 to 3.3% and the indicator for Sweden increased only slightly from 3.2 to 3.3%.14 In contrast to this Ger-many was nearly able to complete its conservative determined target already in 2012 with 2.9%, eight years before the agreed date. It is therefore not sur-prising that in the common choir of satisfaction in the German policy about the result also various admonishing voices stated a lack of incentives for fur-ther intensification of R&D efforts. The Expert Commission for Research and Innovation claimed in its annual report 2015 the need for a more ambitious R&D target to close the existing gap of the economy to the leading countries.15 It seems not only a question of perceptiveness but also of experiences made with the Lisbon Agenda that the commission considered a level of 3.5% R&D expen-ditures on GDP as still challenging but realistic enough to complete until 2020. This will require stable dynamics of the current R&D growth trend in the next future and further significant efforts beyond this level, because pure continua-tions of actual R&D policies will empirically fail this target (with 0.04%-points
13 EC (2015).14 Schasse (2015), p. 31.15 EFI (2015), p. 12 f.

Andreas Bielig 226
average growth of R&D intensities per annum in the last ten years only inten-sity levels of 3.3% can be achieved in 2020). With respect to the distribution of R&D efforts according sectors the actual situation indicates rather counter-productive developments: The share of private enterprises on Domestic Gross Expenditures for R&D decreased from an initial low level of 67.1% in 2010 to an even lower share of 66.9% in 2013.16 Instead of this governmental insti-tutions expanded their share from 14.8 to 15.1, whereas the relative engage-ment of universities was with 18.1 to 18.0% nearly stable. According this the private sector reduced its relative R&D engagement in Germany in comparison with the peaks of both 70.0% in 2006/2007 down to a level comparable with the year 1995 (66.3%). Seen from this perspective the success of the German economy in achieving the Europe 2020 R&D target puts a different complex-ion on the observable performance figures. To examine this issue more in detail table 2 visualises the share of R&D active entities in the international per-spective in 2012. Private enterprises held a share of 68.0% of Domestic Gross Expenditures for R&D, what equals only the OECD average level.17 Universities were responsible for 17.7%, what is below the OECD average. Governmental institutions held 14.3% in comparison with 11.3% in OECD, what signalises the stronger position of the state in German R&D. With exception of China all leading OECD economies revealed lower governmental shares in R&D. In contrast to this were the shares of private enterprises in other leading coun-tries substantially larger than in the German economy (U. S. A. 69.9%, China 76.1%, Japan 76.6%, South Korea 77.9%). The German economy is concern-ing the mobilisation of private R&D investments in the international perspec-tive by entities only in the average field of countries, what raises the question of lacking (relative) attractiveness for private engagement. Some affirmative hints give the shares of private non-profit organisations in R&D. In Germany were in 2012 only marginal activities of these institutions observable, whereas the OECD average share was 2.5%. Most leading economies revealed shares above 1% (South Korea 1.3%, Japan 1.4%, U. S. A. 4.0%).
It seems not surprising that the relative small share of private enterprises in R&D in the international perspective corresponds with the empirically observable low level of private non-profit organisation engagement. Prospering activities of private non-profit organisations rely on comparable requirements concerning space of operations like private enterprises, which are provided by
16 Schasse (2015), p. 32.17 Schasse (2015), p. 32.
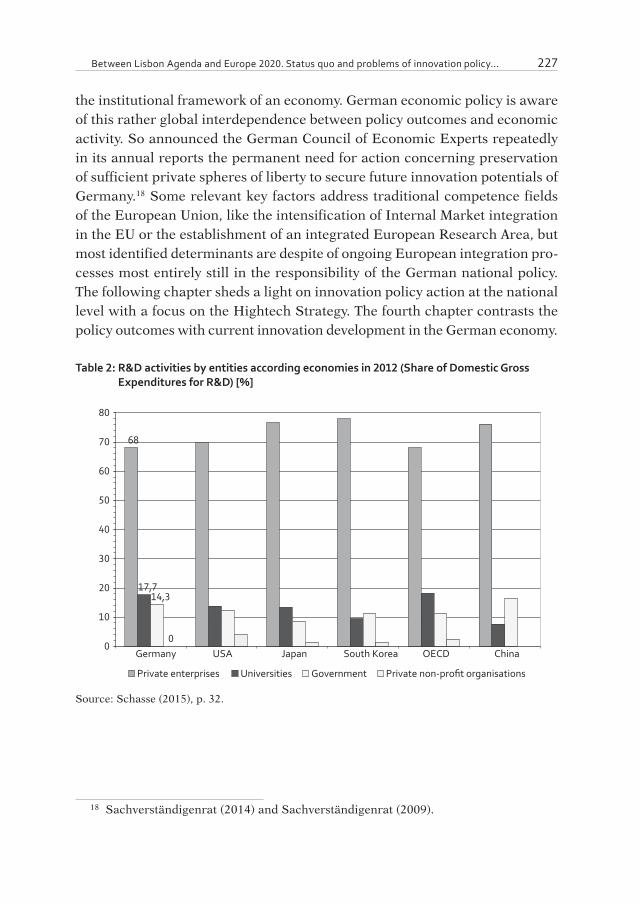
Between Lisbon Agenda and Europe 2020. Status quo and problems of innovation policy... 227
the institutional framework of an economy. German economic policy is aware of this rather global interdependence between policy outcomes and economic activity. So announced the German Council of Economic Experts repeatedly in its annual reports the permanent need for action concerning preservation of sufficient private spheres of liberty to secure future innovation potentials of Germany.18 Some relevant key factors address traditional competence fields of the European Union, like the intensification of Internal Market integration in the EU or the establishment of an integrated European Research Area, but most identified determinants are despite of ongoing European integration pro-cesses most entirely still in the responsibility of the German national policy. The following chapter sheds a light on innovation policy action at the national level with a focus on the Hightech Strategy. The fourth chapter contrasts the policy outcomes with current innovation development in the German economy.
Table 2: R&D activities by entities according economies in 2012 (Share of Domestic Gross Expenditures for R&D) [%]
0
68
17,714,3
0
10
20
30
40
50
60
70
80
Germany USA Japan South Korea OECD China
Private enterprises Universities Government Private non-profit organisations
Source: Schasse (2015), p. 32.
18 Sachverständigenrat (2014) and Sachverständigenrat (2009).

Andreas Bielig 228
3. German national innovation policy – policy outcomes
The national German innovation policy is traditionally characterised by a broad variety of different policy programs and instruments of a multitude of institutions and players. In the orchestrated polyphony of partially also over-laying activities in innovation policy is the Hightech Strategy most likely the most visible program at the national and international level. The program was designed in its first version in 2006 and is represented actually by its third edi-tion, underlining the ongoing success and reputation yielded in the last ten years. With the conception of the strategy were from the beginning ambitious and high ranking targets associated, against the factual European trend. Only one year after the disillusioning intermediate review of the Lisbon Agenda in 2005, where a revitalisation of the fizzled out Lisbon process was initiated by the European Commission, formulated national policy makers in Berlin a vision to transform Germany until 2020 into the most research-intensive coun-try in the world.19 The program followed a cross-ministerial approach headed by the Ministry of Education and Research to strengthen the policy coordina-tion in research and innovation and set priorities of policy action concerning three main topics: 1) establishment of lead markets in future areas, 2) inter-linking of economy and science and 3) implementation of research results and knowledge diffusion. The innovation focus on 17 from the policy selected future areas intended an increased attractiveness for investments and researchers to develop and produce new products and services thereby strengthening Ger-many as a production location and securing growth, jobs and economic welfare. In the initial technology-centred catalogue of supported fields were collected innovative technological developments for health and save (medicine, security, plants, energy and environment), for communication and mobility (information and communication, automotive and transport, aircraft, airspace, marine, ser-vices) as well as promising cross-sectional technologies (nano-tech, bio-tech, microystems, opto-tech, material-tech, production technology) with supposed relevance for economy and society. For the implementation of the first edi-tion of Hightech Strategy a substantial financial budget of 14.6 billion € was planned for 2006–2009 (11.94 billion € for future areas and 2.66 billion € for cross-sectional technologies, without 14.0 billion for institutional funding).20
19 BMBF (2006), p. 2.20 BMBF (2006), p. 106.

Between Lisbon Agenda and Europe 2020. Status quo and problems of innovation policy... 229
For the second edition of the Hightech Strategy in 2010 the innovation policy undertook a conceptual revision of the existing program. Guided by the find-ing of global challenges to be resolved by innovation processes for the society the new program defined five demand areas (climate and energy, health and nutrition, mobility, security, communication). The observed challenges in these fields were addressed in the new strategy by the fostered development of key technologies and the adequate response on cross-sectional topics and setting of framework conditions.21 For further development of the program the second edition listed as key technologies now the former cross-sectional areas (nano-tech, bio-tech, microystems, opto-tech, material-tech, production technology) plus some selected former future areas (services, airspace, information and communication technology) and added to the list micro- and nanoelectronics as one new funded key technology field.22 From the economic perspective it was hard to oversee the political will in the program for a continuation of funding policy with its predecessor. Also the selection of cross-sectional topics and set-ting of framework conditions reflected well-known problems and challenges of the German economy. Among them were improvements of start-up condi-tions, promotion of SME’s, funding of innovation and venture capital, partici-pation on standardisation processes, innovation-opened public procurement and qualification of specialists.23 Seen from this point the potential of the sec-ond Hightech Strategy to set new accents on the German innovation agenda was limited. The small paradigmatic shift of the program recentered innova-tion policy now more towards social needs but the general technology focus of the funding policy remained unchanged as well as the technological priori-ties. But with the new program was also a perceptive change of the fundamen-tal role of innovation policy intended, which is also from today’s perspective not to underestimate: Modern innovation policies adapt to important social challenges and influence thereby paths and pace of technological progress.24 Such socially centred innovation policies are due to their aimed mission ful-filment referred as mission-oriented.25 The decisive contribution of the revised second Hightech Strategy in the meaning of a value-added could therefore be seen in the initiation of changes in the self-conception of innovation policies, guiding their action mainly by observed social challenges to shape technological
21 BMBF (2010), p. 5.22 BMBF (2010), p. 9.23 BMBF (2010), pp. 9–11.24 EFI (2015), p. 25.25 Forray et al. (2012).
Andreas Bielig 230
progress. For measure implementation in 2010–2013 the Hightech Strategy notified for all five demand areas and ten key technologies a budget of nearly 27 billion €.26
The third edition of the Hightech Strategy which was introduced in 2014 con-tinued and modified the policy of its predecessors. The new program remained the global target unchanged to support Germany in its development to a global innovation leader, but renounced in contrast to former programs to notify concrete specifications.27 For aiming the target many elements of both former strategies were developed further and new accents were set. The new strategy followed now a more opened innovation perception, an element which was partially present just in the second edition of the program. It contained tech-nological innovations as well as social innovations and aimed to foster social participation in innovation processes.28 Whereas the first strategy focussed on technologies and their markets and the second discovered future demand areas for technological solutions integrated the third program now all central aspects of a comprehensive research and innovation policy to provide opti-mal conditions for creative processes along the whole innovation chain rang-ing from the ideas to new products and services.29 For this ambitious aim the strategy formulated five core elements of a comprehensive innovation policy: 1) prioritised future tasks for added value creation and life quality, 2) networks and transfer, 3) innovation dynamics in the economy, 4) innovation-friendly framework conditions, 5) transparency and participation of society. As future tasks of priority the strategy selected six fields: 1) digital economy and soci-ety, 2) sustainable economy and energy, 3) innovative working environment, 4) healthy life, 5) intelligent mobility and 6) civil security. The continuity of the strategy development is underlined by the fact, that with exception of the task “innovative working environment” all other future tasks were mainly derived from demand areas and key technologies of the second edition. With the focus on working issues, like digital working environment, innovative services and competences for future technologies, the Hightech Strategy reacted on inten-sified changes of modern working processes and requirements as a remain-ing challenge of the German economy.30 From the paradigmatic perspective the German innovation policy went with the third Hightech Strategy beyond
26 BMBF (2102), p. 23.27 BMBF (2014), p. 3.28 BMBF (2014), p. 4.29 BMBF (2014), p. 11.30 BMBF (2014), pp. 22 f.

Between Lisbon Agenda and Europe 2020. Status quo and problems of innovation policy... 231
the scope of the second edition and departed not only from a pure technol-ogy focus but opened public innovation funding now also for a broad vari-ety of measures and instruments to foster innovation potentials and abilities in a general sense. With exception of the prioritised future tasks all other core elements of the strategy focus reveal a technology-opened design and focus on improvements of framework conditions for innovation in a wide meaning including social innovations. For this target German policy departed even par-tially from the mission orientation of innovation policy, which yet character-ised intensively the conception of the second strategy. The paradigmatic change towards a more opened innovation policy to foster innovation activities at the aggregated level followed recommendations from economics and innovation science,31 targeting at more space for action at the micro level but required to give up the public aspiration of a centralised control or even management of innovation activities. The German policy seems to be aware of the balancing act between the latent temptation of public control and the subtle advantages of economic competition as discovery mechanism32 but especially the evolu-tion of the Hightech Strategy shows that the development is no one-way road and rather resembles a trial and error-process. The following chapter shows the results of innovation policy in the development of innovation processes on the example of some selected areas and observed problems. The chapter is thereby not focussing on foreign trade or high tech issues, which were just analysed in other contributions.
4. Innovation processes – development of conditions and activities in the German economy
Innovation processes are traditionally in Germany not equally distributed among regions but concentrate on industrial agglomerations. The intensity of research and development activities varies therefore among German federal lands substantially as table 3 indicates.33 By far the most intensive R&D activi-ties reveals Baden-Württemberg with 5.04% in 2011 before Berlin and Bavaria with 3.49 and 3.11%. Berlin holds with its large number of public research institutions a specific position what is also influencing the average of the East
31 Sachverständigenrat (2014), p. 27 f., EFI (2015), p. 26.32 EFI (2015), p. 28.33 Schasse (2015), p. 16.

Andreas Bielig 232
German lands.34 The smallest R&D intensities in Germany can be observed in Schleswig-Holstein, Saarland and Saxony-Anhalt with 1.44, 1.49 and 1.5%. With exception of Berlin in all lands R&D intensities increased in 2001–2011 (Berlin reduced its intensity by 0.45%-points) with Baden-Württemberg show-ing the largest absolute dynamics (plus 1.18%-points) and Bavaria the smallest (plus 0.04%-points). Large absolute improvements were achieved also espe-cially in Mecklenburg-West Pomerania and Hamburg with increases of 0.91 and 0.87%-points.
Table 3: R&D intensities of states in the Federal Republic of Germany 2001–2011 [%]
5,04
3,493,11 3,02 2,89 2,82 2,76
2,27 2,19 2,08 2,05 2,011,7
1,5 1,49 1,44
1
1,5
2
2,5
3
3,5
4
4,5
5
5,5
Baden-Württ
embergBerlin
BavariaHesse
Saxony
Lower Saxony
Bremen
Hamburg
Thuringia
Mecklenburg-W
est Pomerania
Rhineland-Palatin
ate
North Rine-W
estfalia
Brandenburg
Saxony-Anhalt
Saarland
Schleswig-H
olstein
2001 2005 2011
Source: Schasse (2015), p. 16.
These developments caused also several changes in R&D ranks, guiding Baden-Württemberg to the first rank or Hesse from the sixth to the fourth and Hamburg from place twelve to eight. From relative perspective achieved espe-cially Mecklenburg-West Pomerania, Hamburg and the Saarland in comparison with their initial positions in 2001 large improvements. Remarkable is the fact that among the five leading lands with Berlin and Saxony two East German regions and among the top ten even four lands (plus Thuringia and Mecklen-
34 Schasse (2015), p. 15.
Between Lisbon Agenda and Europe 2020. Status quo and problems of innovation policy... 233
burg-West Pomerania) from the former transformation area are present. This indicates that despite of reasonable doubts on the success of general economic convergence processes of East and West Germany35 in particular with respect to innovation processes the convergence was not limited to some singular out-liers or restricted to flagship regions.
Nevertheless a substantial divide in R&D intensities between East and West Germany remains also today as in addition to table 3 also table 4 indi-cates. Whereas West German regions achieved in 2011 intensities of 2.95% (the German average level nearly equals with 2.89% the development of the West regions because of their economic weight) reached the intensity in East Germany only a level of 2.53%. The existing divide between both regions even increased in this period. West German lands increased their R&D intensity in 2001–2011 by 0.47%-points (German average 0.42%-points), East German lands only by 0.15%-points. Until 2005 the R&D intensity of these regions even dropped to 2.23% whereas the western regions showed a volatile but intact intensification of their R&D over the time. In result the gap between West and East increased constantly over time. In 2001 lagged eastern regions 0.1%-points behind the West, in 2005 the lag was 0.32%-points and in 2011 even 0.42%-points. Also if from the perspective of federal lands as shown above some regions participated successfully in catching up-processes is on the aggre-gated level a diverging process in innovation dynamics observable. Also if this perspective not allows for causal analysis, German innovation policy appar-ently didn’t contribute to more equal regional distribution of innovation pro-cesses since the first launch of Hightech Strategy. Moreover, for East Germany especially the years until 2005 seemed “lost years”, wasting important poten-tials for future growth and welfare. All East German regions with exception of Mecklenburg-West Pomerania recorded until 2005 decreases of R&D intensi-ties, impeding the catching up-process with the Western regions. At the same time Western lands profited from the ongoing brain-drain of higher qualified labour migrants, especially from those with tertiary academic qualifications, thereby improving their future innovation potential. The German innovation policy here not only reveals its highly selective effects in favour of established innovation structures but also the self-reinforcing power of path dependences in innovation activities.
35 FAZ (2015).
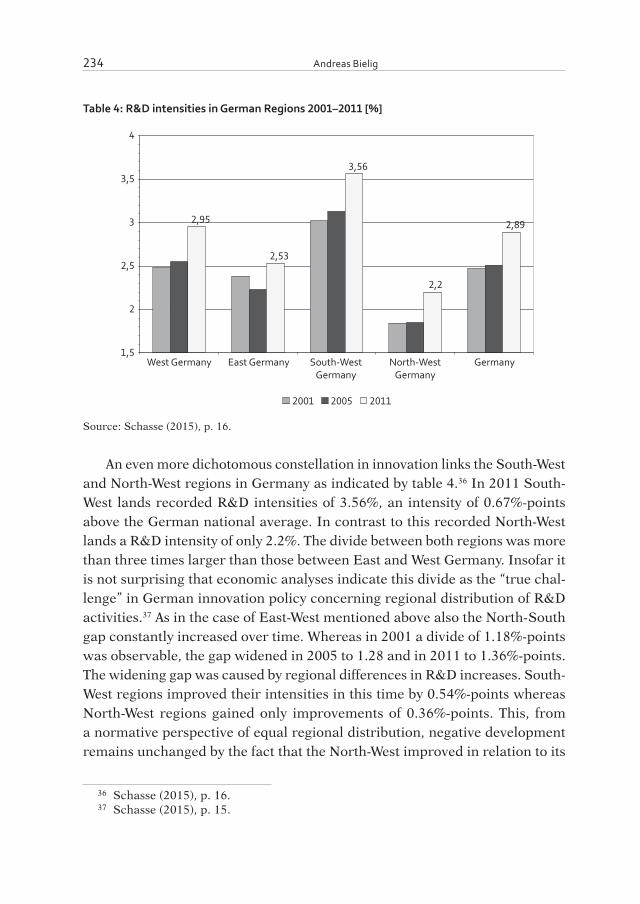
Andreas Bielig 234
Table 4: R&D intensities in German Regions 2001–2011 [%]
2,95
2,53
3,56
2,2
2,89
1,5
2
2,5
3
3,5
4
West Germany East Germany South-WestGermany
North-WestGermany
Germany
2001 2005 2011
Source: Schasse (2015), p. 16.
An even more dichotomous constellation in innovation links the South-West and North-West regions in Germany as indicated by table 4.36 In 2011 South-West lands recorded R&D intensities of 3.56%, an intensity of 0.67%-points above the German national average. In contrast to this recorded North-West lands a R&D intensity of only 2.2%. The divide between both regions was more than three times larger than those between East and West Germany. Insofar it is not surprising that economic analyses indicate this divide as the “true chal-lenge” in German innovation policy concerning regional distribution of R&D activities.37 As in the case of East-West mentioned above also the North-South gap constantly increased over time. Whereas in 2001 a divide of 1.18%-points was observable, the gap widened in 2005 to 1.28 and in 2011 to 1.36%-points. The widening gap was caused by regional differences in R&D increases. South-West regions improved their intensities in this time by 0.54%-points whereas North-West regions gained only improvements of 0.36%-points. This, from a normative perspective of equal regional distribution, negative development remains unchanged by the fact that the North-West improved in relation to its
36 Schasse (2015), p. 16.37 Schasse (2015), p. 15.

Between Lisbon Agenda and Europe 2020. Status quo and problems of innovation policy... 235
initial position its intensities slightly more than the South-West. With regard to the results of German innovation policy can be stated that South-West regions were most capable to profit from favourable trends and chances, including also of public financial funding as it will be shown later.
Concerning absolute R&D expenditures development of industry the German economy recorded in the first phase of the Lisbon Agenda a stagnation period as it was also mentioned above for aggregated R&D intensities (see table 5 on the left scale).38 Internal R&D expenditures of enterprises remained from 2003 to 2005 with 38 billion € nearly stable. Only since 2006, in the year of the launch of the first edition of the 14.6 billion € Hightech Strategy, significant increases of R&D efforts were observable which intensified from 2011 to 2013. Neverthe-less in 2003–2013 the expenditures increased by 41.04% from 38.029 million to 53.636 million €. Since 2010 the second edition of the Hightech Strategy contributed with an overall budget of nearly 27 billion € the growth trend of R&D although only a part of funding targeted directly on industrial R&D. The major financial sources aimed on scientific-industrial cooperation projects in the fields mentioned above but it stands to reason that also indirect effects of the substantial financial programs were positively influencing industrial activities via spill over-effects. The average annual growth rate of internal R&D expen-ditures in 2004–2006 was only 2.7%, which increased in 2011–2013 to 4.6% (the largest dynamics were in 2006–2008 with 6.0%). In 2011 the internal R&D growth reached a peak level with 8.8% p.a. The peak in absolute internal R&D expenditures was reached in 2012 with 53.790 million €.
German enterprises are not only active in internal R&D but engage also in external R&D for other enterprises. The share of external R&D is at the aggre-gated level substantially smaller than the internal share, which is dominating the innovation activities. The external R&D had in 2003 with 8.493 million € a dimension of 22.3% of the internal R&D efforts and increased until 2013 with 14.856 million € to 27.7%. In 2005 and 2013 the annual R&D growth rates reached with 26.8 and 15.9% two peaks, which were simultaneously also years of stagnating (2005) or reduced (2013) internal R&D efforts. External R&D is according these developments to a certain degree at least partially an (imper-fect) substitute of internal R&D activities for German enterprises. In 2004–2013 the average annual growth rate of external R&D expenditures was 7.49%. In contrast to this, internal R&D, which are responsible for major R&D activities, increased in this time only by 4.1%. p. a. The expenditures for external R&D
38 Stifterverband (2015), p. 1.
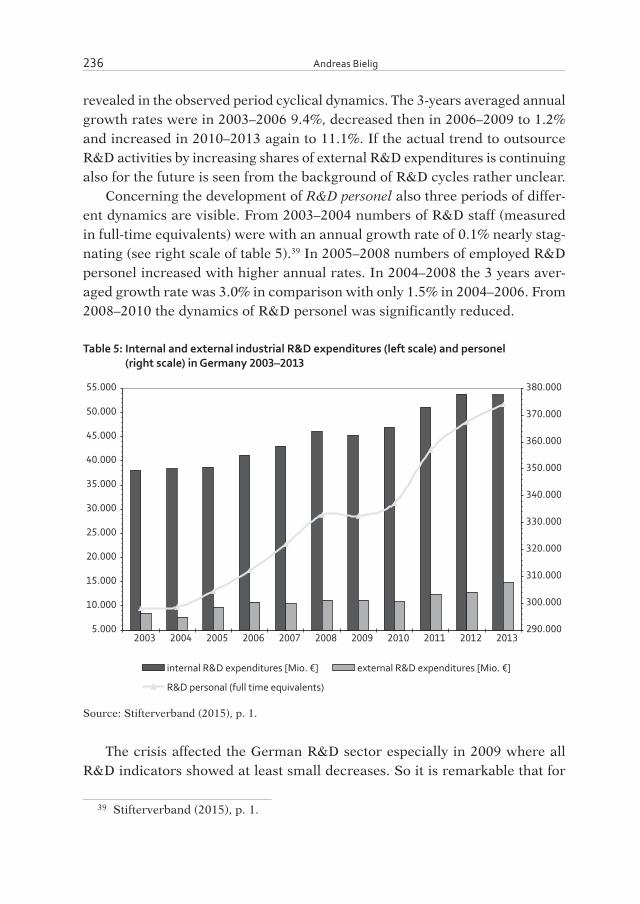
Andreas Bielig 236
revealed in the observed period cyclical dynamics. The 3-years averaged annual growth rates were in 2003–2006 9.4%, decreased then in 2006–2009 to 1.2% and increased in 2010–2013 again to 11.1%. If the actual trend to outsource R&D activities by increasing shares of external R&D expenditures is continuing also for the future is seen from the background of R&D cycles rather unclear.
Concerning the development of R&D personel also three periods of differ-ent dynamics are visible. From 2003–2004 numbers of R&D staff (measured in full-time equivalents) were with an annual growth rate of 0.1% nearly stag-nating (see right scale of table 5).39 In 2005–2008 numbers of employed R&D personel increased with higher annual rates. In 2004–2008 the 3 years aver-aged growth rate was 3.0% in comparison with only 1.5% in 2004–2006. From 2008–2010 the dynamics of R&D personel was significantly reduced.
Table 5: Internal and external industrial R&D expenditures (left scale) and personel (right scale) in Germany 2003–2013
5.000
10.000
15.000
20.000
25.000
30.000
35.000
40.000
45.000
50.000
55.000
2003 2004 2005 2006 2007 2008 2009 2010 2011 2012 2013290.000
300.000
310.000
320.000
330.000
340.000
350.000
360.000
370.000
380.000
internal R&D expenditures [Mio. €] external R&D expenditures [Mio. €]
R&D personal (full time equivalents)
Source: Stifterverband (2015), p. 1.
The crisis affected the German R&D sector especially in 2009 where all R&D indicators showed at least small decreases. So it is remarkable that for
39 Stifterverband (2015), p. 1.

Between Lisbon Agenda and Europe 2020. Status quo and problems of innovation policy... 237
the R&D personel with an annual growth rate of minus 0.1% only a marginal reduction was observable, which signalises the efforts of the German industry to stabilise their R&D in the crisis despite of the negative economic trend. Just in 2010 the R&D personel numbers increased again by 1.4% and gained fast dynamics in the following years so that the 3 years averaged annual growth rate in 2011–2013 was reaching with 3.5% the fastest pace in the observation period. In the whole period 2003–2013 the R&D personel numbers were growing by 25.4% from 298.072 to 373.898 with an average annual growth rate of 2.3%.
R&D activities are in Germany traditionally a domain of very large enter-prises. In 2013 83.7% of all internal R&D expenditures spent enterprises of 500 employees and above, which was stable in 2007–2013, as table 6 indi-cates on the left scale.40 Despite of this R&D domination by very large enti-ties the R&D efforts were not positively correlated with enterprise sizes at the aggregated macro level. Enterprises of the next size category between 250 and 499 employees were in 2013 responsible for 5.2% whereas small and medium sized enterprises (SME) of below 250 employees commanded a doubled share of 11.1% of internal R&D, what underlines the important role of SME for the German innovation system.
However the impact is influenced by a structural quantity effect of the Ger-man economy. With an enterprise stock in 2013 of 1.773 very large, 2.756 large and 40.895 small and medium sized enterprises,41 SMEs revealed average inter-nal R&D expenditures of 145.953 € per entity, large enterprises of 1.003.628 € and very large enterprises of even 25.325.437 € per firm. Size matters also in R&D. The structural effects of R&D behaviour held also for external R&D expenditures but with increased discrepancies as table 6 indicates on the right scale. In 2013 spent very large enterprises 91.7% of external R&D expenditures, 2.5% were spent by large and 5.8% by small and medium sized enterprises, what signalises that external R&D is even more than for internal a matter of size. In contrast to internal R&D the concentration of external R&D in favour of very large enterprises even increased in 2007–2013 slightly by reducing shares of large enterprises and of SME’s. SME’s revealed in 2013 in average internal R&D expenditures of 21.225 € per entity, large enterprises of 132.438 € and very large enterprises of 7.683.587 € per firm.
40 Stifterverband (2015), p. 2.41 iw Köln (2015), p. 38.

Andreas Bielig 238
Table 6: Industrial R&D expenditures in Germany by size categories 2007–2013 [million €] (internal R&D – columns on left scale, external R&D – graphs on right scale)
0
5000
10000
15000
20000
25000
30000
35000
40000
45000
50000
2007 2008 2009 2010 2011 2012 20130
2000
4000
6000
8000
10000
12000
14000
internal R&D expenditures below 250 employees
internal R&D expenditures 250-499 employees
internal R&D expenditures 500 and about employees
external R&D expenditures below 250 employees
external R&D expenditures 250 -499 employees
external R&D expenditures 500 and about employees
Source: Stifterverband (2015), p. 2.
With a focus on absolute R&D expenditures SME’s increased in 2007–2013 their internal R&D expenses by 30.2% steadily from 4.585 to 5.968 million € as indicated by the columns on the left scale. The growth of internal R&D increases was especially in 2011 with 9.1% p.a. very high whereas the annual average growth rate was 4.5% p.a. The period with the largest dynamics was 2009–2011 with a three years averaged growth rate p.a. of 5.6%. It is remark-able that SME didn’t record any years of decreasing internal R&D expendi-tures also during the crisis, what is contrasting the development of the other enterprises in the German economy, which recorded significant contractions of their internal R&D budgets. Hence SME’s were the only private economic subjects which stabilised the aggregated development of industrial internal R&D in the crisis and contributed with this secure innovation potentials and economic growth of Germany. Large enterprises increased in 2007–2013 their internal R&D expenditures by 22.0% from 2.266 to 2.766 million €. In 2009
Between Lisbon Agenda and Europe 2020. Status quo and problems of innovation policy... 239
they recorded during the crisis a contraction of internal R&D budgets by 1.8% in comparison with the last year. In the next years the dynamics of R&D activ-ity recovered and reached in 2010 a peak with 10.9% growth p.a. The annual average growth rate of large enterprises in 2007–2013 was 3.4%. Hence, their relative mid-term dynamics was substantially smaller than that of SME. For large enterprises the period with the largest dynamics in internal R&D was 2010–2012 with a three years averaged annual growth rate of 4.84%, with a slightly smaller and one year later occurring peak than for SME’s. For very large enterprises a very volatile development of internal R&D expenditures in 2007–2013 was observable. They increased their budgets in this period by 24.1% from 36.184 to 44.902 million €, what signalised in the relative per-spective a slightly better performance than for large enterprises but by far worse than for SME’s. The highest level of internal R&D was reached in 2012 with 45.440 million €. The dynamics of internal R&D revealed two years of budget contraction, in the crisis in 2009 the expenses reduced by 2.5% but also in 2013 internal R&D reduced by 1.2%. Between both contractions R&D budgets increased substantially, with a peak in 2011 with 8.7% p.a so that the annual average growth rate was in the observed period 3.8%. Also here very large enterprises showed a better performance than large firms but didn’t reach by far the dynamics of SME’s. The period of largest internal R&D dynam-ics for very large enterprises was synchronous with that of large enterprises 2010–2012, but with a three years averaged annual growth rate of 6.2% they revealed a better performance than those. Even in comparison with SME’s the high cycle performance of the very larger German firms was 0.6%-points larger, what underlined not only the immense financial potential of this player for R&D processes but also the huge leverage they hold.
For the substantially smaller external R&D expenditures in the German economy the dynamics differed from that of internal R&D in 2007–2013 as indicated by the right scale of table 6.42 SME’s increased their expenditures by 19.7% from 715 to 868 million €. The peak of external R&D was 881 million € in 2012. The expansion of external R&D was not only 10.5%-points smaller than for external R&D. It was in a relative perspective also the smallest among the three groups of enterprises in the economy, what contrasts the leading posi-tion of SME’s in internal R&D dynamics in the same period. In addition the dynamics of external R&D of SME’s revealed in this period also a large vola-tility. Starting with a growth of external R&D expenses by 10.8% in 2008 the
42 Stifterverband (2015), p. 2.

Andreas Bielig 240
expenditures decreased just in 2010 by 2.1% and decreased after an interme-diate recovery again in 2013 by 1.5%. Hence the average growth rate of exter-nal R&D of SME’s in 2007–2013 was only 3.1% p.a., what was the smallest dynamics in the economy. For large enterprises the development of external R&D expenditures was also very volatile. After 4.0% growth in 2008 the expen-ditures decreased in 2009 by 9.0% followed by a boom cycle with a peak of 19.9% in 2011 and finally ending with a decrease of 10.1% in 2013. Despite of this cyclical movement increased large enterprises in 2007–2013 their exter-nal R&D expenses by 22.5% from 298 to 365 million €. Because of the decline in 2013 the highest level was reached in 2012 with expenditures of 406 million €. The high volatility of the external R&D of large enterprises showed also the three years average of annual growth rates. In 2008–2010 the R&D growth decreased with 0.01% p.a. nearly at the zero level whereas in 2010–2012 the increase was 13.1% p.a. The average annual growth rate was in 2007–2013 4.0%, what is larger than for SME but substantially smaller than for very large enterprises. For these the development of external R&D expenditures showed also a cyclical movement but was more steadily than those of other firm groups. They increased their expenses in 2007–2013 by 45.1% from 9.390 to 13.623 million € with a doubled speed of the next group of enterprises in the German economy. The fast dynamics of expansion was in particular visible in 2013 with an annual growth of external R&D expenditures by 18.2%. Despite of a two years period of R&D contraction during the crisis in 2009–2010 their average growth p.a. was with 6.7% the largest in the German economy. Hence very large enterprises showed for external R&D expenses in the relative perspective not only a more stable development than others but also larger overall dynam-ics. In 2011–2013 their annual growth rate was with 12.0% the largest in the observed period. Very large enterprises were not only commanding the over-whelming share of internal and external R&D expenditures, they revealed also the largest dynamics in external and second largest in internal R&D.
The analysed R&D activities of enterprises were intensively supported by public funding of German or European innovation policy, which caused also distribution effects. Especially very large enterprises profited at the aggregated level from public financial support. Nearly two-third of public innovation funds to the industry allocated to very large enterprises.43 Nevertheless because of their huge innovation potential these funds covered only 3.1% of internal R&D expenditures. In contrast to this the share of public innovation funding of inter-
43 Schasse (2015), p. 22.
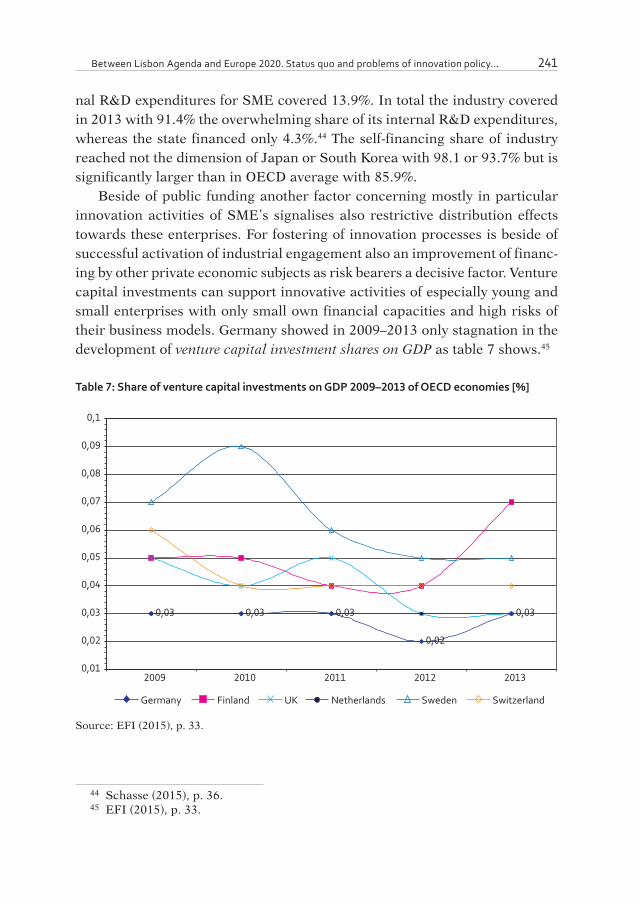
Between Lisbon Agenda and Europe 2020. Status quo and problems of innovation policy... 241
nal R&D expenditures for SME covered 13.9%. In total the industry covered in 2013 with 91.4% the overwhelming share of its internal R&D expenditures, whereas the state financed only 4.3%.44 The self-financing share of industry reached not the dimension of Japan or South Korea with 98.1 or 93.7% but is significantly larger than in OECD average with 85.9%.
Beside of public funding another factor concerning mostly in particular innovation activities of SME’s signalises also restrictive distribution effects towards these enterprises. For fostering of innovation processes is beside of successful activation of industrial engagement also an improvement of financ-ing by other private economic subjects as risk bearers a decisive factor. Venture capital investments can support innovative activities of especially young and small enterprises with only small own financial capacities and high risks of their business models. Germany showed in 2009–2013 only stagnation in the development of venture capital investment shares on GDP as table 7 shows.45
Table 7: Share of venture capital investments on GDP 2009–2013 of OECD economies [%]
0,03 0,03 0,03
0,02
0,03
0,01
0,02
0,03
0,04
0,05
0,06
0,07
0,08
0,09
0,1
2009 2010 2011 2012 2013
Germany Finland UK Netherlands Sweden Switzerland
Source: EFI (2015), p. 33.
44 Schasse (2015), p. 36.45 EFI (2015), p. 33.

Andreas Bielig 242
With a share of 0.03% in 2013 the German economy didn’t reach invest-ment levels of near competitors, like Switzerland with 0.04%, Sweden with 0.05% or Finland with 0.07%. In 2012 the share decreased even to 0.02%. The lacking success in attracting venture capital reflected a situation of insuffi-cient economic incentives for venture capital investors to allocate their finan-cial funds in the German economy. This derived according economic analyses not from a general lacking attractiveness of the German innovation sector for private investments but rather from inappropriate framework conditions set by economic policy and concerns unfavourable tax and legal rules for inves-tors but also missing liquid secondary markets for investments in young inno-vative enterprises to provide a broad basis for investments.46
Industrial innovation processes are in the most economies not equally dis-tributed among industrial sectors. In the German economy they cumulate espe-cially in traditional core branches with a specific focus on high quality products as table 8 shows on the left scale.47 In 2014 the major share of internal R&D expenditures commanded the automotive sector with 31.3% of the total indus-try. Its share on the total internal R&D was in 2007–2014 very stable, mov-ing in a narrow range between 30.5 and 33.2%, signalising the unquestioned dominance of this sector in the German industry. The second largest sector in internal R&D revealed not even 50% of the expenditures of the dominating automotive industry. It was constituted by enterprises active in IT, electrotech-nical and optical engineering with a share of 13.8%, which reduced slightly their R&D share since 2007 from former 14.1%. The third largest innovation active sector was machinery which held its R&D share nearly stable at 10.1%. The next large R&D active industrial sectors in 2013 were pharmaceuticals with 7.6%, freelancer, scientific and technical services with 6.4%, chemicals with 6.3%, information and communication with 5.8%, electrical equipment with 3.8%, other vehicles with 3.6% and aircraft and airspace with 3.1%. The sectoral share structure in internal R&D was in 2007–2014 very static. Only marginal changes occurred (small increases at freelancers, scientific and tech-nical services, information and communication and electrical equipment; small decreases at chemicals, other vehicles and aircraft and airspace) giving the impression of a non-dynamic picture of German R&D structure.
But a look on the dynamics of sectoral R&D growth shows that the static impression is deceptive. The leading automotive industry increased its internal
46 EFI (2015), pp. 33–35.47 Stifterverband (2015), p. 3.
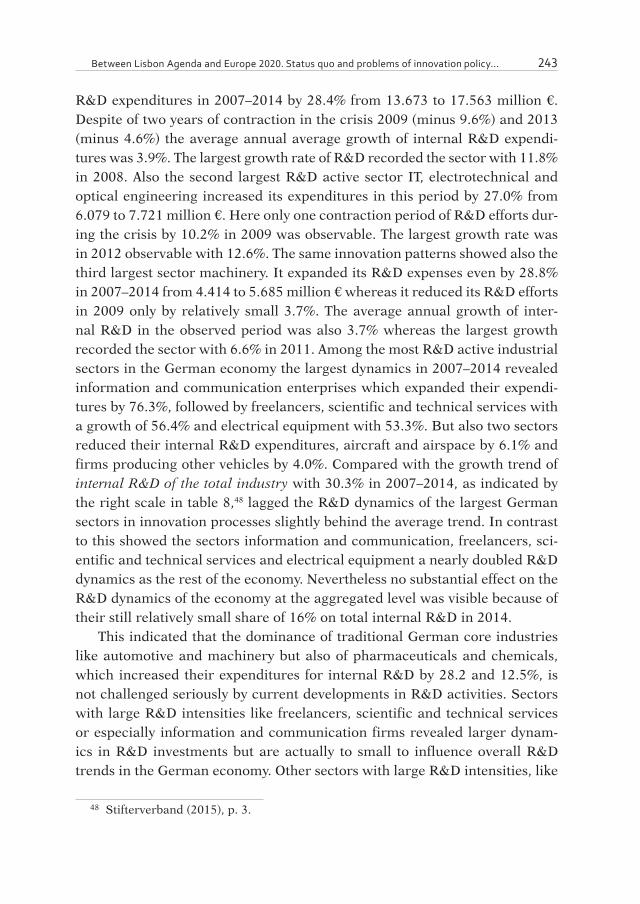
Between Lisbon Agenda and Europe 2020. Status quo and problems of innovation policy... 243
R&D expenditures in 2007–2014 by 28.4% from 13.673 to 17.563 million €. Despite of two years of contraction in the crisis 2009 (minus 9.6%) and 2013 (minus 4.6%) the average annual average growth of internal R&D expendi-tures was 3.9%. The largest growth rate of R&D recorded the sector with 11.8% in 2008. Also the second largest R&D active sector IT, electrotechnical and optical engineering increased its expenditures in this period by 27.0% from 6.079 to 7.721 million €. Here only one contraction period of R&D efforts dur-ing the crisis by 10.2% in 2009 was observable. The largest growth rate was in 2012 observable with 12.6%. The same innovation patterns showed also the third largest sector machinery. It expanded its R&D expenses even by 28.8% in 2007–2014 from 4.414 to 5.685 million € whereas it reduced its R&D efforts in 2009 only by relatively small 3.7%. The average annual growth of inter-nal R&D in the observed period was also 3.7% whereas the largest growth recorded the sector with 6.6% in 2011. Among the most R&D active industrial sectors in the German economy the largest dynamics in 2007–2014 revealed information and communication enterprises which expanded their expendi-tures by 76.3%, followed by freelancers, scientific and technical services with a growth of 56.4% and electrical equipment with 53.3%. But also two sectors reduced their internal R&D expenditures, aircraft and airspace by 6.1% and firms producing other vehicles by 4.0%. Compared with the growth trend of internal R&D of the total industry with 30.3% in 2007–2014, as indicated by the right scale in table 8,48 lagged the R&D dynamics of the largest German sectors in innovation processes slightly behind the average trend. In contrast to this showed the sectors information and communication, freelancers, sci-entific and technical services and electrical equipment a nearly doubled R&D dynamics as the rest of the economy. Nevertheless no substantial effect on the R&D dynamics of the economy at the aggregated level was visible because of their still relatively small share of 16% on total internal R&D in 2014.
This indicated that the dominance of traditional German core industries like automotive and machinery but also of pharmaceuticals and chemicals, which increased their expenditures for internal R&D by 28.2 and 12.5%, is not challenged seriously by current developments in R&D activities. Sectors with large R&D intensities like freelancers, scientific and technical services or especially information and communication firms revealed larger dynam-ics in R&D investments but are actually to small to influence overall R&D trends in the German economy. Other sectors with large R&D intensities, like
48 Stifterverband (2015), p. 3.
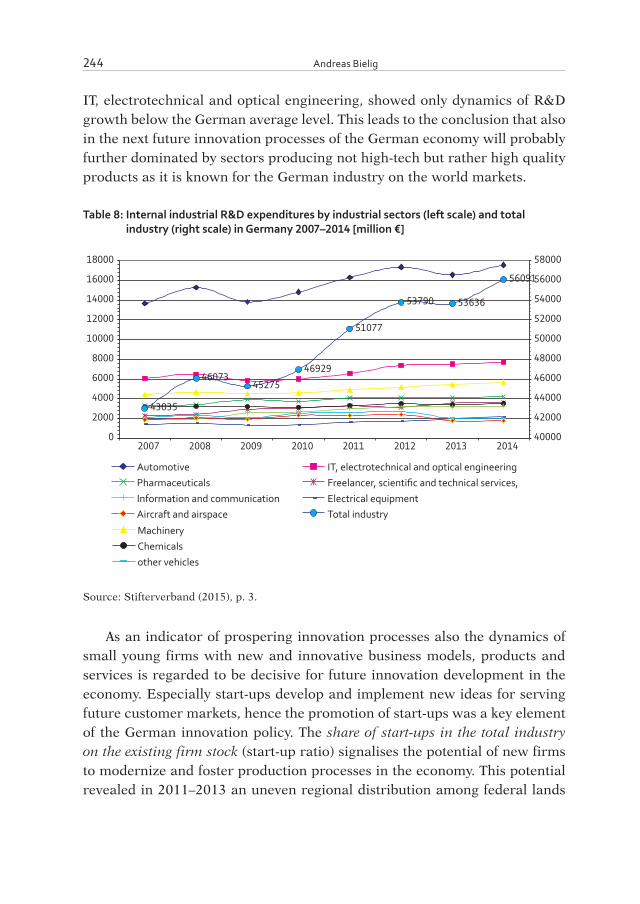
Andreas Bielig 244
IT, electrotechnical and optical engineering, showed only dynamics of R&D growth below the German average level. This leads to the conclusion that also in the next future innovation processes of the German economy will probably further dominated by sectors producing not high-tech but rather high quality products as it is known for the German industry on the world markets.
Table 8: Internal industrial R&D expenditures by industrial sectors (left scale) and total industry (right scale) in Germany 2007–2014 [million €]
43035
4607345275
46929
51077
53790 53636
56091
0
2000
4000
6000
8000
10000
12000
14000
16000
18000
2007 2008 2009 2010 2011 2012 2013 201440000
42000
44000
46000
48000
50000
52000
54000
56000
58000
Automotive IT, electrotechnical and optical engineering
Machinery
Pharmaceuticals Freelancer, scientific and technical services,
Chemicals
Information and communication Electrical equipment
other vehicles
Aircraft and airspace Total industry
Source: Stifterverband (2015), p. 3.
As an indicator of prospering innovation processes also the dynamics of small young firms with new and innovative business models, products and services is regarded to be decisive for future innovation development in the economy. Especially start-ups develop and implement new ideas for serving future customer markets, hence the promotion of start-ups was a key element of the German innovation policy. The share of start-ups in the total industry on the existing firm stock (start-up ratio) signalises the potential of new firms to modernize and foster production processes in the economy. This potential revealed in 2011–2013 an uneven regional distribution among federal lands
Between Lisbon Agenda and Europe 2020. Status quo and problems of innovation policy... 245
as table 9 shows.49 The largest start-up-ratio on total industry recorded Berlin with 7.22%, followed by Hamburg with 5.84% and Rhineland-Palatinate with 5.72%. Among the five lands with largest start-up ratio were two city states and, with exception of Berlin, four West German lands. In contrast to this the smallest start-up ratios revealed the East German lands (Thuringia 3.83%, Saxony 4.05%, Saxony-Anhalt together with Brandenburg 4.48% and Mecklen-burg-West Pomerania 4.58%) as a relatively homogeneous group concerning their overall start-up situation. The large existing differences visualises the fact that the region with the smallest ratio recorded only a ratio level of 53% of the leading land. If start-ups in R&D intensive industries are focussed the regional distribution is only moderately changing. The largest start-up ratio recorded Bremen with 5.27%, followed by Berlin with 4.65% and Hamburg with 4.2%. Remarkable is the fact that Mecklenburg-West Pomerania revealed with 4.17% the fourth largest start-up ratio, thereby nearly catching up with Hamburg. Also other East German lands, like Brandenburg with 3.78%, Saxony with 3.47% or to a smaller degree Saxony-Anhalt with 3.12%, showed in R&D intensive industry a larger start-up dynamics than for total industry. The smallest ratios recorded here Saarland with 2.3%, Lower Saxony with 2.6% and Hesse with 2.67%. The level of the region with the smallest ratio equals here only 44% of that of the leading land. For knowledge intensive services the leading group of regions reveals with exception of the leading Berlin with a ratio of 6.9% a dense distribution. The second largest ratio recorded and Rhineland-Palatinate with 5.53%, then followed Hesse with 5.47%, Bavaria with 5.38%, and Baden-Würt-temberg with 5.36%. The smallest ratios in these services from all lands had Thuringia with 3.75%, Mecklenburg-West Pomerania with 3.91% and Saxony-Anhalt with 4.05%. The last land reached in knowledge intensive services only a start-up ratio of 54% of the level of the leading region.
For the start-up situation in the German economy hence substantial dif-ferences among regions were visible, with Berlin and with some distance also Hamburg showing the most dynamic development. On the other side structur-ally weak regions, mainly from the group of East German lands but also some West German territorial lands, lack substantially on start-up dynamics. Theses regions have large risks to stay behind in future industrial development, espe-cially if they don’t reveal in addition sufficient large agglomerations of indus-trial core sectors, which drive the current economic development in Germany, as automotive or machinery. Also some regional specialisations of start-up
49 EFI (2015), p. 107.

Andreas Bielig 246
developments were observable, for instance Saarland and Hesse on knowledge intensive services. The start-up ratio for services was for the most regions sub-stantially larger than for R&D intensive industries, with exception of Bremen and Mecklenburg-West Pomerania.
Table 9: Start-up ratio: share of start-ups on firm stock according federal lands in Germany 2011–2013 [%]
0 1 2 3 4 5 6 7 8Berlin
HamburgRhineland-PalatinateNorth Rine-Westfalia
HesseSaarland
Baden-WürttembergBremen
Schleswig-HolsteinBavaria
Lower SaxonyMecklenburg-West Pomerania
BrandenburgSaxony-Anhalt
SaxonyThuringia
R&D intensive industry knowledge intensive services total industry
Source: EFI (2015), p. 107.
5. Summary
In the text of the Lisbon Agenda the European Union formulated in 2000 an existing innovation problem of the European member states. But it could be read also as a diagnosis of the German economy and was a basis for long-term orientation of German innovation policy in the following years. Concern-ing the formal three percent target of R&D expenditures on GDP the German economy achieves this intensity nearly since 2012 with 2.9%, but near com-petitors in Europe, like Sweden, Finland or Denmark, recorded since years substantially larger R&D intensities, shifting the benchmark to a higher level. In 2006 German innovation policy bundled its main efforts to foster innova-tive activities in the domestic economy in the Hightech Strategy. It focussed especially in its first edition on prospective future innovation technologies

Between Lisbon Agenda and Europe 2020. Status quo and problems of innovation policy... 247
and aimed on an intensified development of areas with high-tech products, which not belonged to the traditional strengths of the economy. This target of improving the position in high-tech fields to close the gap to leading econo-mies, as the name of the program suggests until now, could not achieved at the aggregated level. Despite of this the program was successful in fostering R&D and innovation activity in a broader sense in the economy and reached its last amendment in 2014. In its third edition it went far beyond the initial focus on high-tech areas, following the vision to promote innovation processes in a broad economic and also social meaning. Especially the general technol-ogy-opened design of the program and the focus on social innovations seems formally to preserve the spirit of the “intelligent growth target” of the Agenda Europe 2020 of the European Union in 2010 in a close way of interpretation. But the previous innovation development in Germany shows also problems to implement lofty targets concerning future innovations. The activation of private enterprises in R&D in the German economy, measured by the share of domestic gross expenditures for R&D, equals only the OECD average. If pri-vate engagement is regarded as the major factor for innovation processes a key restriction for innovation of global importance can be localised in this unused potential. Germany can beside of marketing slogans not be characterised as a homogeneous “land of innovation”. It is an economy of fragmented innova-tion zones grouped around industrial agglomerations of core industries. Here is also a West-East divide observable as an even more deep Southwest-Northeast gap. Current innovation policy did not compensate this situation but rather sta-bilized and increased these inequalities with its actual funding schemes. R&D is in the German economy a domain of large enterprises, which also receive two-third of public innovation funds. Despite of specific SME funding the share structure of R&D shows no visible improvements towards small enter-prises. Until 2005 the German economy revealed a stagnation period of R&D expenditures, which ended coincidentally in the year of the introduction of the Hightech Strategy. Since this time the R&D activities increased with remark-able growth rates. Internal R&D expenses increased in 2004–2013 by 4.1% and external R&D even by 7.5% p.a. Here especially SME’s recorded with an annual growth rate of internal R&D expenditures by 4.5% the fastest expansion of their innovation investments in the economy. Despite of this the dominance of very large enterprises in R&D remained unchallenged. This holds also true for the dominating industrial sectors in R&D, the automotive industry, which commands about 30% of internal R&D investments, the IT, electrotechnical and optical engineering enterprises with a share of 13.8% or machinery with
Andreas Bielig 248
10.1%. Other sectors revealed faster growth rates of R&D expenses but are actu-ally too small for visible shifts in the aggregated R&D structure. If the result of the Lisbon Agenda in 2000, of the German Hightech Strategy in 2006 and the European Agenda 2020 in 2010 can be seen in a mobilisation of R&D efforts in the economy for more innovation these programs were finally succeeding. But the way to more innovation still leads in the context of the actual structure of the German economy mainly across industrial core sectors, like automo-tive, IT, electrotechnical and optical engineering or machinery. The German innovation policy seems to have learned their lesson from the past to aim on more realistic but nevertheless still ambitious targets. Also in this case many challenges remain in the area of innovation for the future. Not only concerning achievements of sectoral innovation targets, for instance in the ITC area (non-sufficient dynamics of technology and services development and diffusion) or mobility area (renunciation of the Transrapid project and the deadlock of elec-tro mobility with only 24.000 registered e-cars in 2014 in comparison with the political target of one million cars for 2020) the empirical development lags partially behind or even neglects political expectations. In other areas innova-tion policy becomes also increasingly a plaything of external political or social upheavals, as it happened during the NSA-affair in 2013, changing not only the communication environment fundamentally but also setting new tasks on the political agenda. Insofar it is rather a question of normative perspective to look more on the challenges on the way forwards or backwards on the problems already solved. The paper tried to head the middle course, appreciating some of the efforts done and pointing out some of the tasks to do.
ABSTRACT
As a result of the European Lisbon Agenda and Europe 2020 Germany intensified its efforts to improve domestic innovation capabilities with the aim to stabilise eco-nomic development and increase future growth. The innovation program Hightech Strategy bundled major sources to strengthen innovation potential and foster inno-vative processes. With respect to activation of R&D efforts implemented instruments of innovation policy since 2000 were successful. But in some core aspects no vis-ible improvements occurred. The German economy reveals a non-competitive R&D intensity in comparison with leading economies, there is an increasing large divide in regional distribution of innovation activities, SME are lagging in R&D behind very large firms, whereas the latter receive the major budget of public R&D funding. In
Between Lisbon Agenda and Europe 2020. Status quo and problems of innovation policy... 249
general the relative engagement of private enterprises in R&D only equals OECD average level. Last but not least high tech branches are in German R&D despite of intensified efforts to strengthen their position still underrepresented. Therefore today’s German innovation policy aims on fostering broad innovation activities with specific focus on adequate framework conditions, what addresses major problems of the German innovation system.
Key words: Lisbon Agenda, Europe 2020, German economy, innovation policy, High-tech Strategy
References
Bundesministerium für Bildung und Forschung (BMBF) (2006): Die Hightech Stra-tegie für Deutschland, Bonn, Berlin.
Bundesministerium für Bildung und Forschung (BMBF) (2010): Ideen. Innovation. Wachstum. Hightech-Strategie 2020 für Deutschland, Bonn, Berlin.
Bundesministerium für Bildung und Forschung (BMBF) (2012): Bundesbericht For-schung und Innovation 2012, Bonn, Berlin.
Bundesministerium für Bildung und Forschung (BMBF) (2014): Die neue Hightech Strategie. Innovationen für Deutschland, Bonn, Berlin.
Destatis (2015): Pressemitteilung Nr. 305 vom 25.08.2015: Ausführliche Ergeb nisse zur Wirt schafts leistung im 2. Quartal 2015, in: https://www.destatis.de/DE/Pres-seService/Presse-/Pressemitteilungen/2015/08/PD15_305_811.html (31.08.2015).
European Commission (2010a): Lisbon Strategy evaluation document, Commission Staff Working Document, SEC (2010) 114 final, 02.02.2010, Brussels, in: http://ec.europa.eu/europe2020/pdf/lisbon_strategy_evaluation_en.pdf (01.09.2015).
Europäische Kommission (2010b): Mitteilung der Kommission EUROPA 2020. Eine Strategie für intelligentes, nachhaltiges und integratives Wachstum, KOM (2010) 2020 endgültig, Brüssel, 03.03.2010, in: http://eurlex.europa.eu/LexUriServ/LexU-riServ.do?uri=COM-:2010:2020: FIN:DE:PDF (01.09.2015).
European Commission (2015): Ziele der Strategie Europa 2020, Brüssel, in: http://ec.europa.eu/europe2020/pdf/targets_de.pdf (01.09.2015).
European Parliament (2000): Lisbon European Council, 23 and 24 March 2000. Pre-sidency conclusions, Brussels, in: http://www.europarl.europa.eu/summits/lis1_en.htm (31.08.2015).
European Parliament (2005): European Council Brussels, 22 and 23 March 2005, Pre-sidency conclusions, Brussels, in: http://www.consilium.europa.eu/uedocs/cms_data-/docs/pressdata/en/ec/84335.pdf (1.09.2015).
Andreas Bielig 250
European Parliament (2012): Lissabon-Strategie (Lissabon-Prozess), Brussels, in: http://www.europarl.europa.eu/brussels/website/media/Lexikon/Pdf/Lissabon_Strategie.pdf (31.08.2015).
Expertenkommission für Forschung und Innovation (2015): Gutachten zu Forschung, Innovation und technologischer Leistungsfähigkeit Deutschlands 2015, Berlin.
Frankfurter Allgemeine Zeitung (FAZ) (2015): 25 Jahre Wiedervereinigung. Ifo Insti-tut: Der Osten Deutschlands bleibt zurück, 03.09.2015, in: http://www.faz.net/aktu-ell/wirtschaft-/wirtschaftspolitik/25-jahre-wiedervereinigung-ifo-institut-der-osten-deutschlands-bleibt-zurueck-13782926.html (03.09.2015).
Foray, D.; Mowery, D. C.; Nelson, R. R. (2012): Public R&D and Social Challenges: What Lessons from Mission R&D Programs?, in: Research Policy, vol. 41 (10), pp. 1697–1792.
Gemeinsame Wissenschaftskonferenz (GWK) (2013): Steigerung des Anteils der FuE--Ausgaben am nationalen Bruttoinlandsprodukt (BIP) als Teilziel der Lissabon--Strategie und der Strategie Europa 2020. Abschlussbericht zum 3%-Ziel der Lis-sabon-Strategie 2000 bis 2010 und Sachstandsbericht zum 3%-Ziel der Strategie Europa 2020, Bericht an die Regierungschefinnen und Regierungschefs von Bund und Ländern, Materialien der GWK, Heft 31, Bonn.
Institut der deutschen Wirtschaft Köln (iw Köln) (2015): Deutschland in Zahlen, Ausgabe 2015, Köln.
Sachverständigenrat zur Begutachtung der gesamtwirtschaftlichen Entwicklung (2009): Die Zukunft nicht aufs Spiel setzen, Jahresgutachten 09/10, Wiesbaden.
Sachverständigenrat zur Begutachtung der gesamtwirtschaftlichen Entwicklung (2014): Mehr Vertrauen in Marktprozesse, Jahresgutachten 14/15, Wiesbaden.
Schasse, U. (2015): Forschung und Entwicklung in Staat und Wirtschaft – Kurzstudie 2015, Studien zum deutschen Innovationssystem Nr. 3–2015, NIW, Hannover.
Stifterverband (2012): Forschung und Entwicklung Facts, April.Stifterverband (2015): Forschung und Entwicklung Facts, April.

Ewa SOŃTA-DRĄCZKOWSKA*
STRATEGIE KREOWANIA I WDRAŻANIA INNOWACJI NA PRZYKŁADZIE WYBRANYCH
PRZEDSIĘBIORSTW NIEMIECKICH
Wprowadzenie
Wzmożona dyskusja na temat innowacyjności w Europie w kontekście pobu-dzania wzrostu gospodarczego trwa od ok. 2000 roku i znalazła odzwierciedlenie w zatwierdzeniu Strategii Lizbońskiej jako wytycznej dla rozwoju państw UE w tym zakresie. Strategia ta ustanowiła dla Unii Europejskiej cel: „to become the most competitive and dynamic knowledge-based economy in the world, capable of sustainable economic growth with more and better jobs and greater social cohesion”1. Cel ten powiązany został z mierzalnymi wskaźnikami: do roku 2010 wydatki krajów Unii Europejskiej na B&R powinny obejmować 3% produktu krajowego brutto, w tym 2/3 środków powinny pochodzić z sektora prywatnego2. Z perspektywy roku 2014 pojawia się pytanie: na ile cele Strate-gii Lizbońskiej zostały zrealizowane przez kraje unijne? Oceną wyników zało-żeń strategii lizbońskiej zajmuje się obecnie wiele instytucji: Bank Światowy, OECD, Komisja Europejska, Eurostat oraz narodowe instytucje3. Przykładem kraju, który wzorcowo realizuje wskaźniki postawione w ramach Strategii
* Szkoła Główna Handlowa, Zakład Badań nad Gospodarką Niemiecką, * e-mail: [email protected]
1 European Parliament, Presidency Conclusions of the Lisbon European Council on 23 and 24 March 2000, http://www.europarl.europa.eu/summits/lis1_en.htm (9.08.2014)
2 Presidency Conclusions, Barcelona European Council 15 and 16 March 2002, http://ec.europa.eu/invest-in-research/pdf/download_en/barcelona_european_council.pdf (9.08.2014).
3 A. Zenker (2011): Innovationssystem und Innovationsfähigkeit Deutschlands – Ausge-wählte Charakteristika des Deutschen Innovationssystems, w: Der deutsche Weg aus der Krise, Konrad Adenauer Stiftung, Deutsch-Französisches Dialog, Heft 6. Paris, s. 24.
Ewa Sońta-Drączkowska 252
Lizbońskiej są Niemcy. W Niemczech nakłady na B&R wynoszą ok. 3% PKB, z czego 2/3 środków pochodzą z gospodarki. Polska nie jest niestety dobrym przykładem państwa, któe osiągnęło te cele. Nakłady na działalność B&R wynoszą zaledwie ok. 0,77% PKB ( (przy średniej unijnej 1,26%)), a proporcje źródeł finansowania są dokładnie odwrotne – jedynie 1/3 środków pochodzi z gospodarki, 2/3 to środki rządowe i fundusze zewnętrzne4. Nie dziwi więc, że w zestawieniach zbiorczych dotyczących innowacyjności krajów Unii Europej-skiej Polska zajmuje czwarte miejsce od końca. Z drugiej strony pojawiają się pytania: czy wysokość nakładów na B&R jako procent PKB jest wystarczają-cym miernikiem, aby ocenić skuteczność procesów innowacyjnych oraz pręż-ność aktorów gospodarczych w tym zakresie? Jakie praktyki decydują o tym, że przedsiębiorstwa skutecznie kreują, rozwijają oraz przede wszystkim komer-cjalizują innowacyjne produkty i usługi?
Niniejszy artykuł będzie się koncentrował głównie na przedstawieniu spo-sobów organizacji działalności innowacyjnej w wybranych koncernach nie-mieckich, działających w skali międzynarodowej. Omówione zostaną studia przypadków dla Bosch A. G., Siemens A. G., Deutsche Telekom A. G. Kryterium wyboru tych przypadków były obecność koncernów na niemieckim i polskim rynku oraz dostępność danych do analizy studiów przypadków. Celem analizy było znalezienie elementów, które mogą być decydujące w skuteczności kreowa-nia, wdrażania i komercjalizacji innowacji w tych przedsiębiorstwach. Przed analizą studiów przypadków zostanie omówiony również kontekst makroeko-nomiczny – filary i mocne strony niemieckiego systemu innowacji ((Nationales Innovationssystem, NIS)), jak również wytyczne ze strategii „HighTech 2020”, która określa plany rozwoju niemieckiej gospodarki na kolejne lata. Do analizy przypadków wykorzystano informacje o firmach z raportów rocznych, stron internetowych, artykułów naukowych oraz opracowań dostępnych w Internecie.
1. Pojęcia stosowane w opracowaniu
W tym podrozdziale zostaną zdefiniowane kluczowe pojęcia stosowane w opracowaniu: innowacja, narodowy system innowacji, modele innowacji oraz strategia innowacji. Problematyka innowacyjności jest bardzo szeroka, więc definicje zostaną podane w sposób skrótowy i syntetyczny.
4 M. Burnat-Mikosz, M. Turczyk (2013): Inwestycje w B&R, Jak to robią najlepsi?, mate-riały z prezentacji, Deloitte Polska.

Strategie kreowania i wdrażania innowacji na przykładzie wybranych przedsiębiorstw... 253
Innowacja polega na wdrożeniu nowego lub znacząco udoskonalonego produktu ( (wyrobu lub usługi)) bądź procesu, nowej metody marketingowej lub organizacyjnej w praktyki gospodarcze w organizację miejsca pracy lub w relacje z otoczeniem. W literaturze przedmiotu istnieje wiele sposobów kla-syfikacji innowacji. Przegląd typów innowacji został przedstawiony w tabeli 15.
Tabela 1. Typy innowacji
Kryterium podziału Typy innowacji
Oryginalność zmian
Oryginalne: samodzielne wytwory, wynalazki i odkrycia zastosowane w gospodarce po raz pierwszy, będące efektem pracy jednostki, zespołu, całej organizacji.Imitujące (zwane również: odtwórcze, naśladowcze, wtórne, kopiujące)) polegają na odtworzeniu (powielaniu) już wdrożonych rozwiązań, które cieszą się powodzeniem.
Proces lub produkt (wyrób lub usługa)
Procesowe – nowe lub znacząco ulepszone metody wytwarzania produktów lub świadczenia usług.Produktowe – wprowadzenie na rynek produktu i/lub usługi, które zostały udoskonalone w zakresie swoich cech lub zastosowań.
Skala i zakres wprowadzanych zmian
Przełomowe (disruptive) – powodujące nowy lub zmieniony model biznesowy organizacji, mający ogromny wpływ na sposób działania organizacji i pociągają za sobą szereg innych zmian.Radykalne – dotyczą nowych, niestosowanych dotychczas rozwiązań (np. wprowadzenie całkiem nowego produktu czy automatyzacja linii produkcyjnych), charakteryzują się wysokim poziomem ryzyka technologicznego.Częściowe (usprawniające, inkrementalne) – polegające na modernizacji przedmiotu innowacji – ulepszenie określonych cech lub wprowadzenie nowych cech do przedmiotu innowacji.
Przedmiot zmian Technologiczne – dotyczą zmian technologicznych w zakresie produktów i procesów.Organizacyjne – polegają na wprowadzeniu zmian ukierunkowanych na funkcjonowanie organizacji.Dotyczące zarządzania – wdrożenie nowych systemów zarządzania organizacją, np. Total Quality Management, Lean, Six sigma, itp.Społeczne – dotyczą aspektu pozaprodukcyjnej działalności przedsiębiorstwa, w tym np. warunków BHP lub działań w zakresie społecznej odpowiedzialności przedsiębiorstwa. W tej kategorii mogą być też ujęte niektóre innowacje technologiczne i organizacyjne.Ekologiczne – eliminujące negatywne oddziaływanie na środowisko naturalne.
Złożoność Niesprzężone (autonomiczne) – będące rezultatem działalności jednostki,Sprzężone (systemowe) – są rezultatem wspólnego wysiłku wielu osób, zespołów czy instytucji.
Miejsce powstawania
Krajowe – będące rezultatem działalności podmiotów gospodarczych w danym kraju.Zagraniczne – zrealizowane za granicą lub zakupione za granicą.
Skala skutków Strategiczne – innowacje duże o strategicznym znaczeniu dla przedsiębiorstwa.Taktyczne – innowacje małe o niewielkim wpływie na całokształt działalności przedsiębiorstwa.
Źródło: opracowanie własne na podstawie:K. Poznańska, Zarządzanie innowacjami, materiały ze studiów SGGW, http://spir.sggw.pl/files/files/ wyk1-zarzadzanie-innowacjami (7.08.2014).
5 Expertenkommission Forschung und Innovation (EFI) (Hrsg.) (2010): Gutachten zu Forschung, Innovation und technologischer Leistungsfähigkeit Deutschlands, Berlin, s. 19.
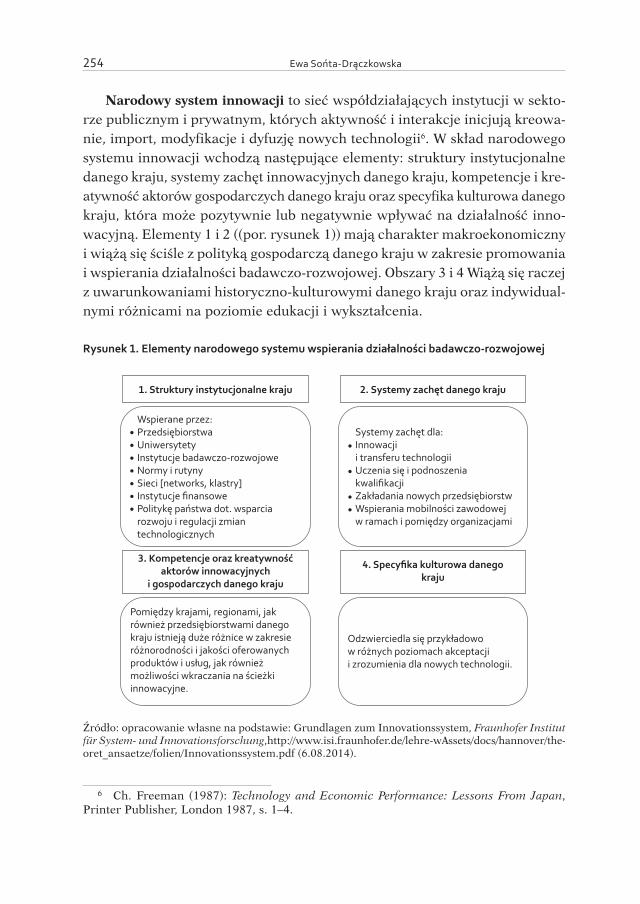
Ewa Sońta-Drączkowska 254
Narodowy system innowacji to sieć współdziałających instytucji w sekto-rze publicznym i prywatnym, których aktywność i interakcje inicjują kreowa-nie, import, modyfikacje i dyfuzję nowych technologii6. W skład narodowego systemu innowacji wchodzą następujące elementy: struktury instytucjonalne danego kraju, systemy zachęt innowacyjnych danego kraju, kompetencje i kre-atywność aktorów gospodarczych danego kraju oraz specyfika kulturowa danego kraju, która może pozytywnie lub negatywnie wpływać na działalność inno-wacyjną. Elementy 1 i 2 ((por. rysunek 1)) mają charakter makroekonomiczny i wiążą się ściśle z polityką gospodarczą danego kraju w zakresie promowania i wspierania działalności badawczo-rozwojowej. Obszary 3 i 4 Wiążą się raczej z uwarunkowaniami historyczno-kulturowymi danego kraju oraz indywidual-nymi różnicami na poziomie edukacji i wykształcenia.
Rysunek 1. Elementy narodowego systemu wspierania działalności badawczo-rozwojowej
Wspierane przez:PrzedsiębiorstwaUniwersytetyInstytucje badawczo-rozwojoweNormy i rutynySieci [networks, klastry]Instytucje finansowePolitykę państwa dot. wsparcia rozwoju i regulacji zmian technologicznych
•••••••
1. Struktury instytucjonalne kraju
Systemy zachęt dla:Innowacjii transferu technologiiUczenia się i podnoszenia kwalifikacjiZakładania nowych przedsiębiorstwWspierania mobilności zawodowej w ramach i pomiędzy organizacjami
•
•
••
2. Systemy zachęt danego kraju
Pomiędzy krajami, regionami, jak również przedsiębiorstwami danego kraju istnieją duże różnice w zakresie różnorodności i jakości oferowanych produktów i usług, jak również możliwości wkraczania na ścieżki innowacyjne.
3. Kompetencje oraz kreatywnośćaktorów innowacyjnych
i gospodarczych danego kraju
Odzwierciedla się przykładowow różnych poziomach akceptacjii zrozumienia dla nowych technologii.
4. Specyfika kulturowa danegokraju
Źródło: opracowanie własne na podstawie: Grundlagen zum Innovationssystem, Fraunhofer Institut für System- und Innovationsforschung,http://www.isi.fraunhofer.de/lehre-wAssets/docs/hannover/the-oret_ansaetze/folien/Innovationssystem.pdf (6.08.2014).
6 Ch. Freeman (1987): Technology and Economic Performance: Lessons From Japan, Printer Publisher, London 1987, s. 1–4.
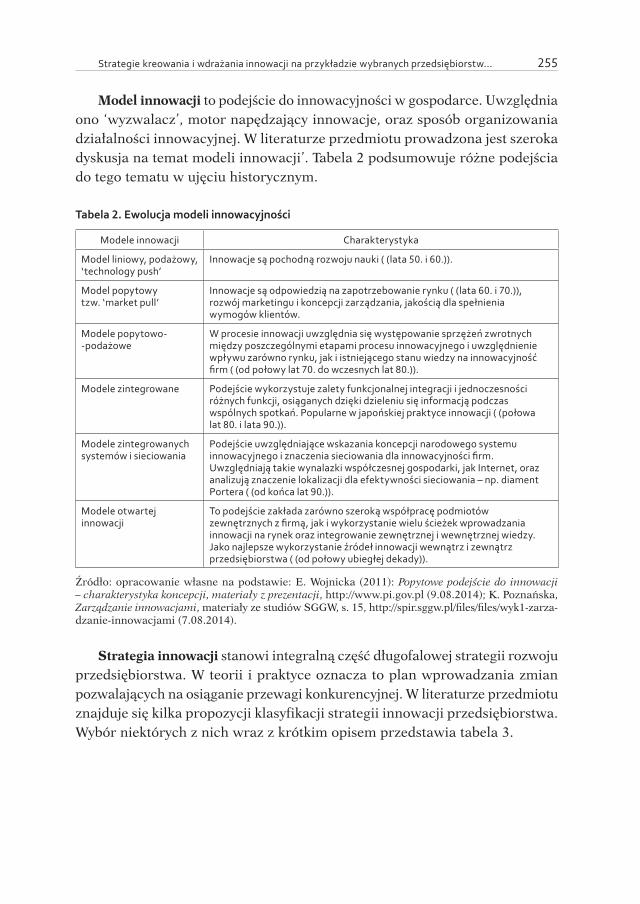
Strategie kreowania i wdrażania innowacji na przykładzie wybranych przedsiębiorstw... 255
Model innowacji to podejście do innowacyjności w gospodarce. Uwzględnia ono ‘wyzwalacz’, motor napędzający innowacje, oraz sposób organizowania działalności innowacyjnej. W literaturze przedmiotu prowadzona jest szeroka dyskusja na temat modeli innowacji’. Tabela 2 podsumowuje różne podejścia do tego tematu w ujęciu historycznym.
Tabela 2. Ewolucja modeli innowacyjności
Modele innowacji Charakterystyka
Model liniowy, podażowy, ‘technology push’
Innowacje są pochodną rozwoju nauki ( (lata 50. i 60.)).
Model popytowy tzw. ‘market pull’
Innowacje są odpowiedzią na zapotrzebowanie rynku ( (lata 60. i 70.)), rozwój marketingu i koncepcji zarządzania, jakością dla spełnienia wymogów klientów.
Modele popytowo- -podażowe
W procesie innowacji uwzględnia się występowanie sprzężeń zwrotnych między poszczególnymi etapami procesu innowacyjnego i uwzględnienie wpływu zarówno rynku, jak i istniejącego stanu wiedzy na innowacyjność firm ( (od połowy lat 70. do wczesnych lat 80.)).
Modele zintegrowane Podejście wykorzystuje zalety funkcjonalnej integracji i jednoczesności różnych funkcji, osiąganych dzięki dzieleniu się informacją podczas wspólnych spotkań. Popularne w japońskiej praktyce innowacji ( (połowa lat 80. i lata 90.)).
Modele zintegrowanych systemów i sieciowania
Podejście uwzględniające wskazania koncepcji narodowego systemu innowacyjnego i znaczenia sieciowania dla innowacyjności firm. Uwzględniają takie wynalazki współczesnej gospodarki, jak Internet, oraz analizują znaczenie lokalizacji dla efektywności sieciowania – np. diament Portera ( (od końca lat 90.)).
Modele otwartej innowacji
To podejście zakłada zarówno szeroką współpracę podmiotów zewnętrznych z firmą, jak i wykorzystanie wielu ścieżek wprowadzania innowacji na rynek oraz integrowanie zewnętrznej i wewnętrznej wiedzy. Jako najlepsze wykorzystanie źródeł innowacji wewnątrz i zewnątrz przedsiębiorstwa ( (od połowy ubiegłej dekady)).
Źródło: opracowanie własne na podstawie: E. Wojnicka (2011): Popytowe podejście do innowacji – charakterystyka koncepcji, materiały z prezentacji, http://www.pi.gov.pl (9.08.2014); K. Poznańska, Zarządzanie innowacjami, materiały ze studiów SGGW, s. 15, http://spir.sggw.pl/files/files/wyk1-zarza-dzanie-innowacjami (7.08.2014).
Strategia innowacji stanowi integralną część długofalowej strategii rozwoju przedsiębiorstwa. W teorii i praktyce oznacza to plan wprowadzania zmian pozwalających na osiąganie przewagi konkurencyjnej. W literaturze przedmiotu znajduje się kilka propozycji klasyfikacji strategii innowacji przedsiębiorstwa. Wybór niektórych z nich wraz z krótkim opisem przedstawia tabela 3.
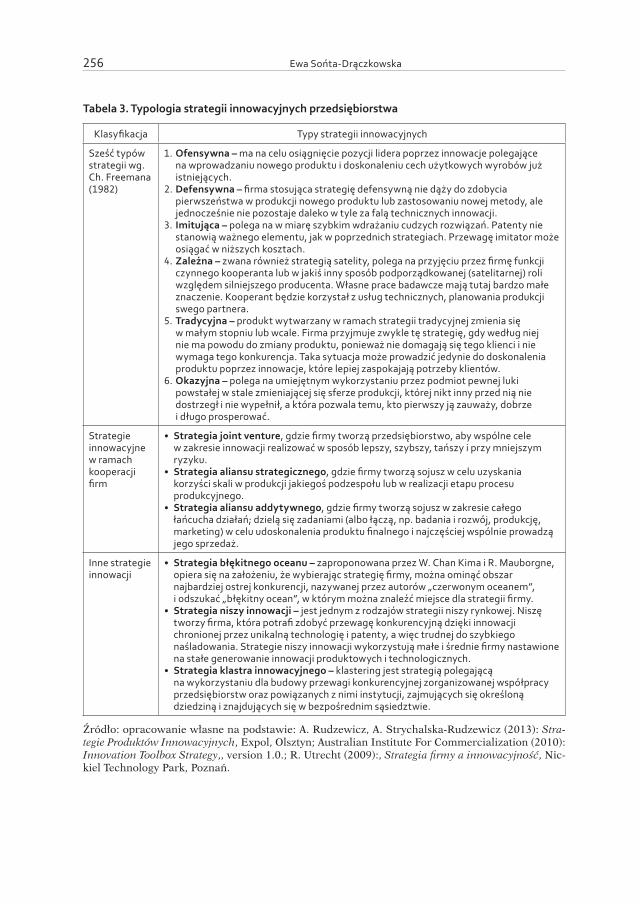
Ewa Sońta-Drączkowska 256
Tabela 3. Typologia strategii innowacyjnych przedsiębiorstwa
Klasyfikacja Typy strategii innowacyjnych
Sześć typów strategii wg. Ch. Freemana (1982)
1. Ofensywna – ma na celu osiągnięcie pozycji lidera poprzez innowacje polegające na wprowadzaniu nowego produktu i doskonaleniu cech użytkowych wyrobów już istniejących.
2. Defensywna – firma stosująca strategię defensywną nie dąży do zdobycia pierwszeństwa w produkcji nowego produktu lub zastosowaniu nowej metody, ale jednocześnie nie pozostaje daleko w tyle za falą technicznych innowacji.
3. Imitująca – polega na w miarę szybkim wdrażaniu cudzych rozwiązań. Patenty nie stanowią ważnego elementu, jak w poprzednich strategiach. Przewagę imitator może osiągać w niższych kosztach.
4. Zależna – zwana również strategią satelity, polega na przyjęciu przez firmę funkcji czynnego kooperanta lub w jakiś inny sposób podporządkowanej (satelitarnej) roli względem silniejszego producenta. Własne prace badawcze mają tutaj bardzo małe znaczenie. Kooperant będzie korzystał z usług technicznych, planowania produkcji swego partnera.
5. Tradycyjna – produkt wytwarzany w ramach strategii tradycyjnej zmienia się w małym stopniu lub wcale. Firma przyjmuje zwykle tę strategię, gdy według niej nie ma powodu do zmiany produktu, ponieważ nie domagają się tego klienci i nie wymaga tego konkurencja. Taka sytuacja może prowadzić jedynie do doskonalenia produktu poprzez innowacje, które lepiej zaspokajają potrzeby klientów.
6. Okazyjna – polega na umiejętnym wykorzystaniu przez podmiot pewnej luki powstałej w stale zmieniającej się sferze produkcji, której nikt inny przed nią nie dostrzegł i nie wypełnił, a która pozwala temu, kto pierwszy ją zauważy, dobrze i długo prosperować.
Strategie innowacyjne w ramach kooperacji firm
• Strategia joint venture, gdzie firmy tworzą przedsiębiorstwo, aby wspólne cele w zakresie innowacji realizować w sposób lepszy, szybszy, tańszy i przy mniejszym ryzyku.
• Strategia aliansu strategicznego, gdzie firmy tworzą sojusz w celu uzyskania korzyści skali w produkcji jakiegoś podzespołu lub w realizacji etapu procesu produkcyjnego.
• Strategia aliansu addytywnego, gdzie firmy tworzą sojusz w zakresie całego łańcucha działań; dzielą się zadaniami (albo łączą, np. badania i rozwój, produkcję, marketing) w celu udoskonalenia produktu finalnego i najczęściej wspólnie prowadzą jego sprzedaż.
Inne strategie innowacji
• Strategia błękitnego oceanu – zaproponowana przez W. Chan Kima i R. Mauborgne, opiera się na założeniu, że wybierając strategię firmy, można ominąć obszar najbardziej ostrej konkurencji, nazywanej przez autorów „czerwonym oceanem”, i odszukać „błękitny ocean”, w którym można znaleźć miejsce dla strategii firmy.
• Strategia niszy innowacji – jest jednym z rodzajów strategii niszy rynkowej. Niszę tworzy firma, która potrafi zdobyć przewagę konkurencyjną dzięki innowacji chronionej przez unikalną technologię i patenty, a więc trudnej do szybkiego naśladowania. Strategie niszy innowacji wykorzystują małe i średnie firmy nastawione na stałe generowanie innowacji produktowych i technologicznych.
• Strategia klastra innowacyjnego – klastering jest strategią polegającą na wykorzystaniu dla budowy przewagi konkurencyjnej zorganizowanej współpracy przedsiębiorstw oraz powiązanych z nimi instytucji, zajmujących się określoną dziedziną i znajdujących się w bezpośrednim sąsiedztwie.
Źródło: opracowanie własne na podstawie: A. Rudzewicz, A. Strychalska-Rudzewicz (2013): Stra-tegie Produktów Innowacyjnych, Expol, Olsztyn; Australian Institute For Commercialization (2010): Innovation Toolbox Strategy,, version 1.0.; R. Utrecht (2009):, Strategia firmy a innowacyjność, Nic-kiel Technology Park, Poznań.

Strategie kreowania i wdrażania innowacji na przykładzie wybranych przedsiębiorstw... 257
2. Niemiecki system innowacji – czynniki sukcesu i obszary dyskusyjne
W tym rozdziale zostaną przedyskutowane mocne strony niemieckiego systemu innowacji oraz najnowsze kierunki rozwojowe narodowej strategii innowacji „HighTech 2020”. Niemcy są w czołówce krajów europejskich pod względem polityki wspierania i wdrażania innowacji. Według ostatniego zesta-wienia europejskiej tablicy innowacyjności (Innovation Union Scoreboard) za rok 2014 Niemcy zakwalifikowali się do grupy państw liderów innowacji (Inno-vation Leaders) w Unii Europejskiej, w klasyfikacji ogólnej wyprzedza je tylko Szwecja7. Polska jest niestety na czwartej pozycji od końca i należy do grupy skromnych innowatorów (Modest Innovators). W ramach corocznej klasyfika-cji oceniane są wskaźniki innowacyjności w następujących wymiarach: zasoby ludzkie, otwartość i sprawność funkcjonowania systemu badań, finansowanie i wsparcie, nakłady inwestycyjne przedsiębiorstw na B&R, powiązania między podmiotami i przedsiębiorczość, ochrona aktywów intelektualnych, innowa-cyjność częścią strategii przedsiębiorstw, wskaźniki ekonomiczne8.
Według tablicy innowacyjności Niemcy mają szczególnie mocną pozycję w następujących czterech obszarach:• Innowacyjność częścią strategii przedsiębiorstw (1 miejsce). W tym wymia-
rze uwzględnione są następujące wskaźniki: MŚP wprowadzające innowacje produktowe/procesowe jako procent ogółu MŚP, MŚP wdrażające inno-wacje organizacyjne lub marketingowe jako procent ogółu MŚP, poziom zatrudnienia w firmach innowacyjnych. Niemcy posiadają najwyższy w Unii Europejskiej udział sektora prywatnego w działalności innowacyjnej. Firmy niemieckie traktują innowacyjność jako naturalny element swojej strategii, która wynika z odpowiedzi na oczekiwania klienta i rynku oraz presji kon-kurencji. Wysoka pozycja w tym obszarze pokazuje również bardzo mocną aktywność małych i średnich przedsiębiorstw w działalności innowacyjnej.
• Nakłady inwestycje przedsiębiorstw w B&R (2 miejsce). Wymiar ten obej-muje takie wskaźniki, jak wydatki sektora biznesowego na B&R jako procent PKB, wydatki na innowacje nie związane z B&R jako procent przychodów
7 W klasyfikacji Global Innovation Index Niemcy zajmują 13 miejsce w globalnej kla-syfikacji; S. Dutta, B. Lanvin, S. Wunsch-Vincent, The Global Innovation Index 2014, http://www.globalinnovationindex.org/userfiles/file/reportpdf/GII-2014-v5.pdf (29.02.2016).
8 Dokładny opis wymiarów innowacyjności znajduje się w metodyce oceny: European Union (2014): Innovation Union Scoreboard,, Belgia.
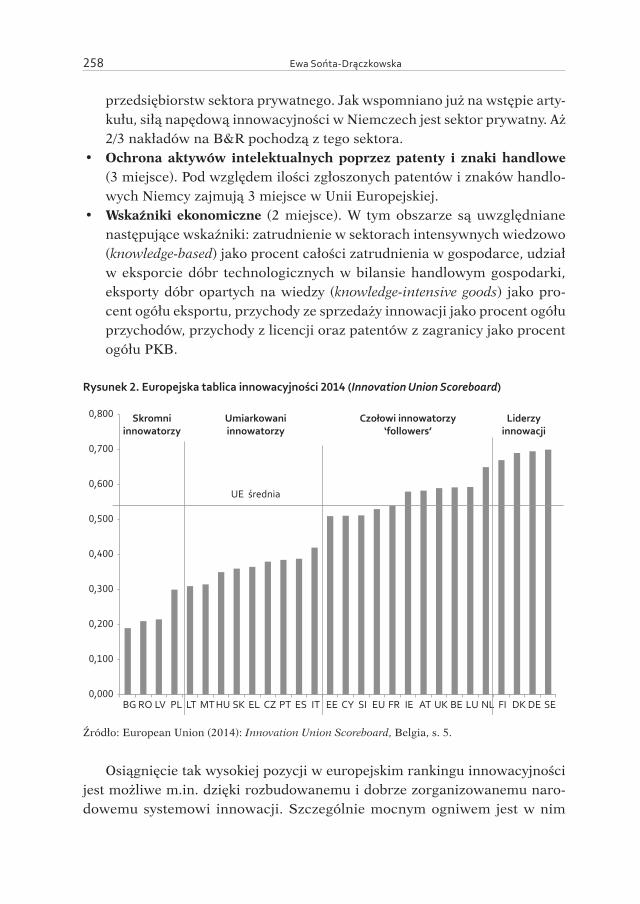
Ewa Sońta-Drączkowska 258
przedsiębiorstw sektora prywatnego. Jak wspomniano już na wstępie arty-kułu, siłą napędową innowacyjności w Niemczech jest sektor prywatny. Aż 2/3 nakładów na B&R pochodzą z tego sektora.
• Ochrona aktywów intelektualnych poprzez patenty i znaki handlowe (3 miejsce). Pod względem ilości zgłoszonych patentów i znaków handlo-wych Niemcy zajmują 3 miejsce w Unii Europejskiej.
• Wskaźniki ekonomiczne (2 miejsce). W tym obszarze są uwzględniane następujące wskaźniki: zatrudnienie w sektorach intensywnych wiedzowo (knowledge-based) jako procent całości zatrudnienia w gospodarce, udział w eksporcie dóbr technologicznych w bilansie handlowym gospodarki, eksporty dóbr opartych na wiedzy (knowledge-intensive goods) jako pro-cent ogółu eksportu, przychody ze sprzedaży innowacji jako procent ogółu przychodów, przychody z licencji oraz patentów z zagranicy jako procent ogółu PKB.
Rysunek 2. Europejska tablica innowacyjności 2014 (Innovation Union Scoreboard)
0,000
0,100
0,200
0,300
0,400
0,500
0,600
0,700
0,800
BG RO LV PL LT MT HU SK EL CZ PT ES IT EE CY SI EU FR IE AT UK BE LU NL FI DK DE SE
Liderzyinnowacji
Czołowi innowatorzy‘followers’
Umiarkowaniinnowatorzy
Skromniinnowatorzy
UE średnia
Źródło: European Union (2014): Innovation Union Scoreboard, Belgia, s. 5.
Osiągnięcie tak wysokiej pozycji w europejskim rankingu innowacyjności jest możliwe m.in. dzięki rozbudowanemu i dobrze zorganizowanemu naro-dowemu systemowi innowacji. Szczególnie mocnym ogniwem jest w nim
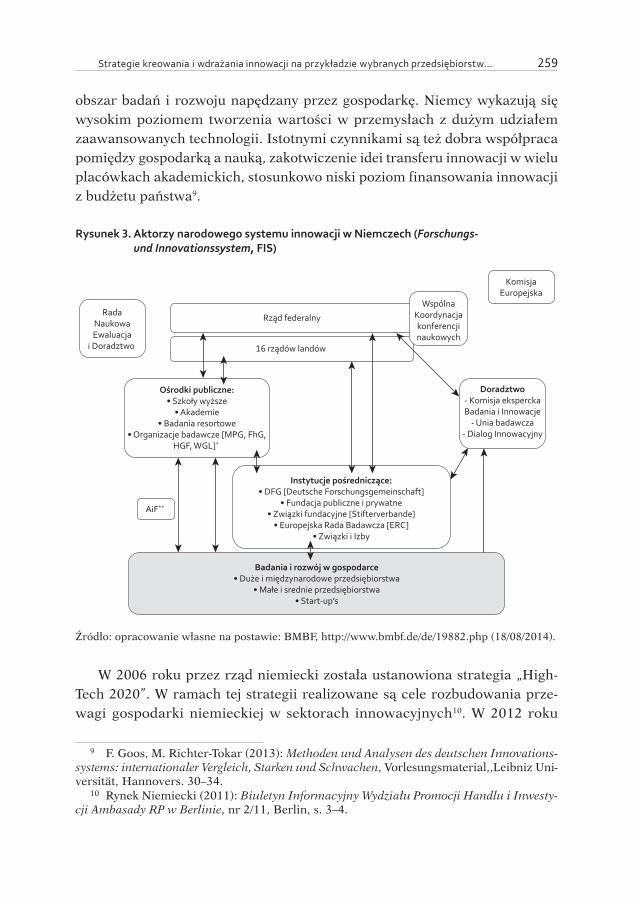
Strategie kreowania i wdrażania innowacji na przykładzie wybranych przedsiębiorstw... 259
obszar badań i rozwoju napędzany przez gospodarkę. Niemcy wykazują się wysokim poziomem tworzenia wartości w przemysłach z dużym udziałem zaawansowanych technologii. Istotnymi czynnikami są też dobra współpraca pomiędzy gospodarką a nauką, zakotwiczenie idei transferu innowacji w wielu placówkach akademickich, stosunkowo niski poziom finansowania innowacji z budżetu państwa9.
Rysunek 3. Aktorzy narodowego systemu innowacji w Niemczech (Forschungs- und Innovationssystem, FIS)
Rząd federalny
16 rządów landów
Ośrodki publiczne:• Szkoły wyższe
• Akademie• Badania resortowe
• Organizacje badawcze [MPG, FhG,HGF, WGL]*
Instytucje pośredniczące:• DFG [Deutsche Forschungsgemeinschaft]
• Fundacja publiczne i prywatne• Związki fundacyjne [Stifterverbande]
• Europejska Rada Badawcza [ERC]• Związki i Izby
Badania i rozwój w gospodarce• Duże i międzynarodowe przedsiębiorstwa
• Małe i srednie przedsiębiorstwa• Start-up’s
RadaNaukowaEwaluacja
i Doradztwo
KomisjaEuropejska
Doradztwo- Komisja eksperckaBadania i Innowacje
- Unia badawcza- Dialog Innowacyjny
WspólnaKoordynacjakonferencjinaukowych
AiF**
Źródło: opracowanie własne na postawie: BMBF, http://www.bmbf.de/de/19882.php (18/08/2014).
W 2006 roku przez rząd niemiecki została ustanowiona strategia „High-Tech 2020”. W ramach tej strategii realizowane są cele rozbudowania prze-wagi gospodarki niemieckiej w sektorach innowacyjnych10. W 2012 roku
9 F. Goos, M. Richter-Tokar (2013): Methoden und Analysen des deutschen Innovations-systems: internationaler Vergleich, Starken und Schwachen, Vorlesungsmaterial,,Leibniz Uni-versität, Hannovers. 30–34.
10 Rynek Niemiecki (2011): Biuletyn Informacyjny Wydziału Promocji Handlu i Inwesty-cji Ambasady RP w Berlinie, nr 2/11, Berlin, s. 3–4.
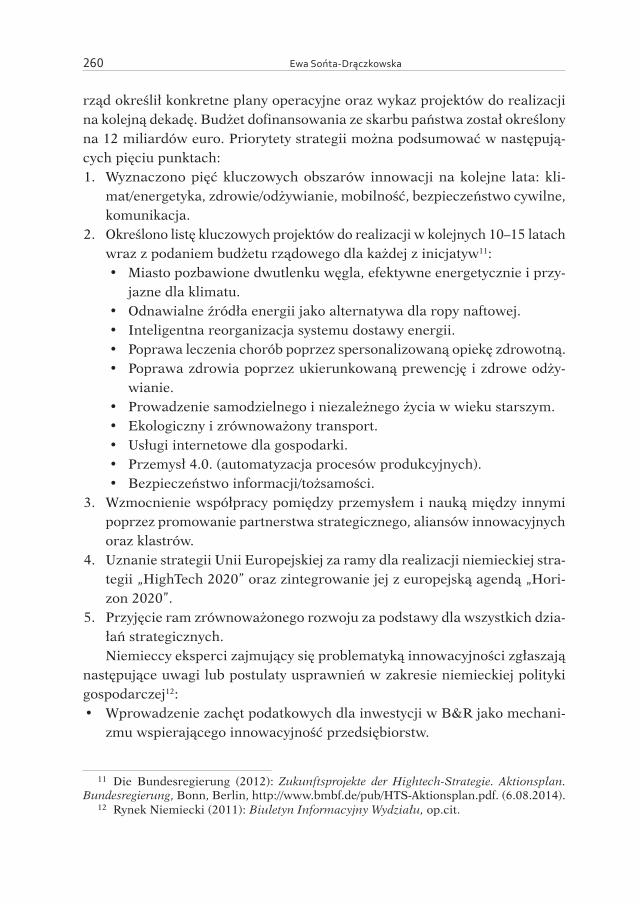
Ewa Sońta-Drączkowska 260
rząd określił konkretne plany operacyjne oraz wykaz projektów do realizacji na kolejną dekadę. Budżet dofinansowania ze skarbu państwa został określony na 12 miliardów euro. Priorytety strategii można podsumować w następują-cych pięciu punktach:1. Wyznaczono pięć kluczowych obszarów innowacji na kolejne lata: kli-
mat/energetyka, zdrowie/odżywianie, mobilność, bezpieczeństwo cywilne, komunikacja.
2. Określono listę kluczowych projektów do realizacji w kolejnych 10–15 latach wraz z podaniem budżetu rządowego dla każdej z inicjatyw11:• Miasto pozbawione dwutlenku węgla, efektywne energetycznie i przy-
jazne dla klimatu.• Odnawialne źródła energii jako alternatywa dla ropy naftowej.• Inteligentna reorganizacja systemu dostawy energii.• Poprawa leczenia chorób poprzez spersonalizowaną opiekę zdrowotną.• Poprawa zdrowia poprzez ukierunkowaną prewencję i zdrowe odży-
wianie.• Prowadzenie samodzielnego i niezależnego życia w wieku starszym.• Ekologiczny i zrównoważony transport.• Usługi internetowe dla gospodarki.• Przemysł 4.0. (automatyzacja procesów produkcyjnych).• Bezpieczeństwo informacji/tożsamości.
3. Wzmocnienie współpracy pomiędzy przemysłem i nauką między innymi poprzez promowanie partnerstwa strategicznego, aliansów innowacyjnych oraz klastrów.
4. Uznanie strategii Unii Europejskiej za ramy dla realizacji niemieckiej stra-tegii „HighTech 2020” oraz zintegrowanie jej z europejską agendą „Hori-zon 2020”.
5. Przyjęcie ram zrównoważonego rozwoju za podstawy dla wszystkich dzia-łań strategicznych.Niemieccy eksperci zajmujący się problematyką innowacyjności zgłaszają
następujące uwagi lub postulaty usprawnień w zakresie niemieckiej polityki gospodarczej12:• Wprowadzenie zachęt podatkowych dla inwestycji w B&R jako mechani-
zmu wspierającego innowacyjność przedsiębiorstw.
11 Die Bundesregierung (2012): Zukunftsprojekte der Hightech-Strategie. Aktionsplan. Bundesregierung, Bonn, Berlin, http://www.bmbf.de/pub/HTS-Aktionsplan.pdf. (6.08.2014).
12 Rynek Niemiecki (2011): Biuletyn Informacyjny Wydziału, op.cit.

Strategie kreowania i wdrażania innowacji na przykładzie wybranych przedsiębiorstw... 261
• Słabością niemieckiej gospodarki w kontekście innowacyjności jest sys-tem edukacji. W Niemczech rejestruje się stosunkowo niski udział absol-wentów szkół wyższych w ogóle zatrudnionych w gospodarce oraz niski udział wysoko-wykwalifikowanych młodych pracowników w stosunku do wysoko-wykwalifikowanych w wieku 55+.
• Z powyższym punktem wiąże się potrzeba modyfikacji ustawodawstwa na poziomie krajowym i europejskim tak, aby sprzyjało napływowi do Niemiec i EU osób z wyższym wykształceniem, szczególnie w zawodach technicznych.
• Wprowadzenie do niemieckiego systemu badawczego większych zachęt finansowych dla niemieckich naukowców, którzy obecnie coraz częściej wybierają lepiej opłacane zajęcia i badania w programach i instytutach europejskich.
• Możliwość negatywnego oddziaływania na dostępność kapitału wysokiego ryzyka, które mogą mieć dyrektywy dotyczące zarządzających alternatyw-nymi funduszami inwestycyjnymi (AIFM) wprowadzonymi w listopadzie 2010 roku przez Parlament Europejski. W wyniku tej dyrektywy dostęp MŚP do kapitału typu ‘private equity’, zamiast stać się motorem długotrwa-łego wzrostu dla tego segmentu przedsiębiorstw, może zostać ograniczony.
• Szybkie zakończenie prac nad przełożeniem przyjętych priorytetów dzia-łań innowacyjnych na konkretne projekty i programy oraz wprowadzenie wyraźnego rozgraniczenia między nowymi i kontynuowanymi projek-tami/programami.
• Umiejscowienie Europejskiego Sądu Patentowego w Niemczech oraz wpro-wadzenie unijnej harmonizacji w zakresie opodatkowania dochodów ze sprzedaży licencji i patentów.
• Uruchomienie programów badawczych ukierunkowanych i ułatwiających kooperację w ramach kraju w przemyśle motoryzacyjnym oraz budowy maszyn. Wsparłoby to efektywne wdrażanie priorytetu dotyczącego mobil-ności energetycznej.
• W zakresie europejskiej polityki B&R pożądane byłoby wyraźne rozgrani-czenie wsparcia udzielanego w ramach funduszy strukturalnych od wspar-cia w ramach programów ramowych.
• Dla lepszego wykorzystania potencjału wynalazczego tkwiącego w przed-siębiorstwach nieposiadających własnej bazy B&R, eksperci wskazują na potrzebę stworzenia w programach możliwości włączania takich przed-siębiorstw do programów B&R wspieranych ze środków publicznych.
• Uproszczenie procedur nadzoru i wdrożenia instrumentów wspierających innowacyjność na poziomie instytucji publicznych.
Ewa Sońta-Drączkowska 262
3. Studia przypadków – wybrane niemieckie korporacje międzynarodowe
W ostatniej dekadzie widoczny jest trend w kierunku globalizacji działal-ności B&R. Zjawisko to dotyczy również niemieckich korporacji transnarodo-wych. Spółki stowarzyszone niemieckich firm działających globalnie wydają ok. 11,2 mld euro na zagraniczną działalność badawczo-rozwojową, co sta-nowi około 1/3 całości nakładów na B&R gospodarki niemieckiej. Dlaczego korzystnie jest prowadzić działalność badawczo-rozwojową globalnie? Dzięki globalnej skali można wdrażać innowacje lepiej, szybciej i bardziej efektywnie kosztowo. Dodatkową zaletą jest również możliwość dostosowania oferty do wymagań lokalnego rynku13. Dwa z analizowanych poniżej studiów przypadku dotyczą firm, które wykazują ponad przeciętną globalizację działalności B&R. Są to BASF A. G. oraz Siemens A. G. Trzeci przypadek – Deutsche Telekom A. G. – to firma, która podjęła intensywne starania w kierunku umiędzynarodowie-nia i otwarcia procesu innowacji od połowy ubiegłej dekady14.
BASF A. G.
Profil firmyBASF A. G. jest wiodącym niemieckim koncernem chemicznym o ponad
140-letniej tradycji, mającym siedzibę w Ludwigshafen. Firma zatrudnia obec-nie 112 tys. pracowników w 6 ośrodkach produkcyjnych w Niemczech oraz w 376 innych zakładach produkcyjnych rozsianych na całym świecie. Firma generuje przychody z 5 głównych grup produktów:• Chemicals. Grupa produktów chemicznych: petrochemia, monomery, inne
produkty chemiczne (23% przychodów).• Performance products. Produkty o dużej wytrzymałości (21% przychodów).• Functional Materials&Solutions. Materiały i rozwiązania funkcjonalne dla
innych branż (23% przychodów).
13 R. Neukirchner (2012): Innovation strategies of selected German multinationals in India, Materials from Talk at Event “German-Indian Roundtable”, Hamburg University of Technology, s. 3–4.
14 A. Gerybadze, G. Reger (1997): Globalization of R&D: Recent Challenges in the Man-agement of Innovation in Transnational Corporations, Discussion Paper on International Management and Innovation, Stuttgart, s. 6.

Strategie kreowania i wdrażania innowacji na przykładzie wybranych przedsiębiorstw... 263
• Agricultural. Rozwiązania dla sektora rolniczego, jak np. środki ochrony roślin (7% przychodów).
• Oil&Gas. Sektor paliwowo-gazowy, eksploracja, wydobycie, handel (20% przychodów).
Sposób organizacji działalności B&RBASF A. G. ma bardzo mocno rozwinięty obszar działalności badawczo-
-rozwojowej. Około 10% pracowników (10.650) jest zatrudnionych w obsza-rach związanych z rozwojem nowych produktów i usług. W portfelu projektów badawczo-rozwojowych (pipeline) BASF znajduje się ok. 3 tys. projektów (według danych raportu rocznego z 2013 roku) Nakłady na B&R wyniosły w roku 2013 ok. 1,8 mln euro. Około 1/3 wydatków na B&R zostało poświęconych projek-tom w obszarze poprawy efektywności energetycznej oraz ochrony klimatycz-nej. Struktura działań badawczo-rozwojowych zorganizowana jest w formie czterech centrów kompetencyjnych:• Advanced Materials&Systems Research, badania dotyczące zaawansowa-
nych materiałów i systemów;• Biological&Effect Systems Research, badania nad systemami biologicznymi;• Process Research&Chemical Engineering, badania procesowe i inżynie-
ria chemiczna;• BASF Plant Science.
Tabela 4. Podział wydatków na B&R na segmenty działalności BASF AG
Grupy produktów Rozkład % Ogółem
1. Produkty chemiczne.2. Produkty wytrzymałościowe.3. Materiały i rozwiązania funkcjonalne.4. Rozwiązania dla rolnictwa.5. Rafineria&Gazownictwo (Oil & Gas).6. Badania w ramach koncernu i in.
10%20%20%26%
3%21%
Źródło: BASF Jahresbericht 2013, s. 35, http://bericht.basf.com/2013/de/serviceseiten/dateisamm-lung/files/collection.php (10.09.2014).
Dodatkowo w ramach organizacji działają jednostki BASF New Business GmbH, zajmująca się wczesną identyfikacją trendów w gospodarce oraz poten-cjalnych obszarów wzrostu dla firmy w perspektywie 2020 roku, i BASF Ven-ture Capital GmbH, stanowiący zaplecze finansowe dla nowych przedsięwzięć. BASF New Business składa się z dwóch podobszarów: jednostka ‘Foresight’

Ewa Sońta-Drączkowska 264
identyfikuje, ewaluuje i rozwija nowe obszary biznesowe, a jednostka ‘Ope-racje’ jest odpowiedzialna za budowę nowych obszarów wzrostu. BASF Ven-ture Capital działa jak klasyczna spółka venture capital i prowadzi regularny przegląd potencjalnych przedsiębiorstw, które mogą być przedmiotem akwi-zycji, jak również finansuje przedsiębiorstwa w fazie seed i start-up poprzez zakup udziałów.
Dodatkowym elementem organizacji innowacji w BASF jest globalna sieć partnerska obejmująca ponad 600 renomowanych uniwersytetów, instytutów badawczych oraz przedsiębiorstw. Nowa inicjatywa w obszarze współpracy to „North American Center for Research on Advanced Materials”, obejmujący wydziały uczelni, takich jak Harvard, MIT oraz Uniwersytet Massachusetts Amherst. BASF konsekwentnie globalizuje działalność B&R. W ostatnich cza-sach rozbudowano działalność w Ameryce Północnej (USA: Raleigh/Karolina Północna; ochrona roślin i biotechnologia) oraz Japonii (Agmasaki, centrum tech-niki stosowanej). Centra badawczo-rozwojowe koncernu rozsiane są po świecie:• Europa: Ludwigshafen, Bazylea, Dusseldorf.• Ameryka Północna: Raleigh, Iselin, Tarrytown.• Azja-Pacyfik: Szanghei, Singapur, Mumbai.• Ameryka Południowa: Guaratinguetá.
Dzięki sieci partnerów BASF New Business GmbH stosuje model otwartej innowacji w całym łańcuchu wartości przygotowania i wdrożenia innowacji. Partnerstwa z uczelniami wyższymi, instytutami badawczymi oraz agencjami rządowymi zawierane są już na bardzo wczesnym stadium procesu innowa-cyjnego15. Przykładem innowacji, która powstała w wyniki kooperacji BASF z zewnętrznymi partnerami, jest synteza witaminy B2 w 2000 roku. Podejście firmy do partnerstw jest jednak w dużej mierze kontrolowane i raczej dyskretne. Firma stara się całkowicie kontrolować własność intelektualną, wykorzysty-wać wartość partnerstw w długim horyzoncie czasowym 10+ oraz pozyskiwać ekspertyzę potrzebną dla konkretnego projektu badawczego.
Punkty ciężkości działalności B&R są ściśle ukierunkowane na potrzeby związane z trendami w gospodarce globalnej oraz ukierunkowane na ocze-kiwania i potrzeby klientów w poszczególnych branżach: badanie enzymów żywienia ludzi i zwierząt, środki piorące i czystościowe, e-power management, technologie oszczędnego zarządzania energią, energia wiatrowa. Obszary tech-nologiczne o szczególnym potencjale wzrostowym to materiały, systemy i nano-
15 BASF Jahresbericht 2013, http://www.basf-new-business.com/de-DE/scouting/inno-vationspartner (10.09.2014).
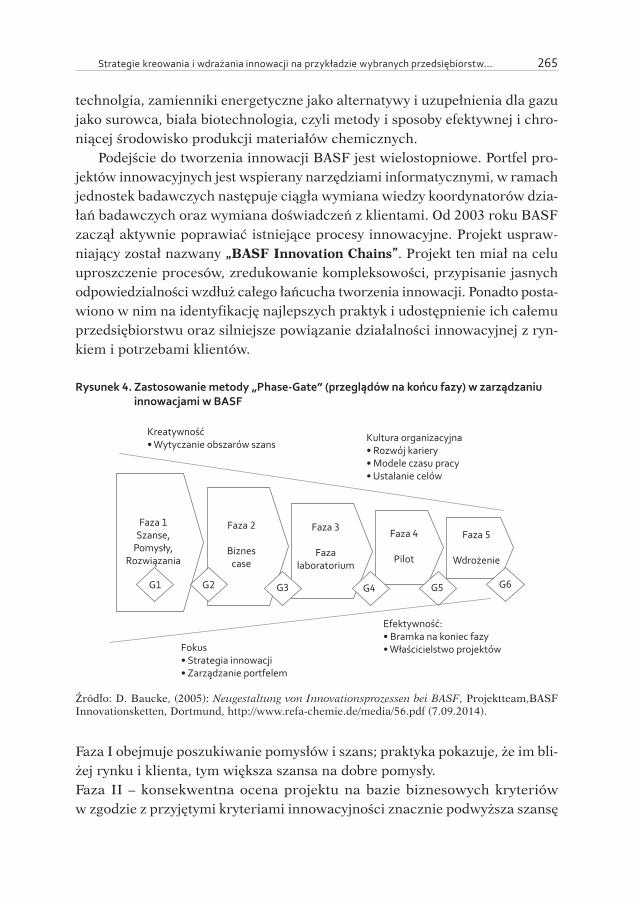
Strategie kreowania i wdrażania innowacji na przykładzie wybranych przedsiębiorstw... 265
technolgia, zamienniki energetyczne jako alternatywy i uzupełnienia dla gazu jako surowca, biała biotechnologia, czyli metody i sposoby efektywnej i chro-niącej środowisko produkcji materiałów chemicznych.
Podejście do tworzenia innowacji BASF jest wielostopniowe. Portfel pro-jektów innowacyjnych jest wspierany narzędziami informatycznymi, w ramach jednostek badawczych następuje ciągła wymiana wiedzy koordynatorów dzia-łań badawczych oraz wymiana doświadczeń z klientami. Od 2003 roku BASF zaczął aktywnie poprawiać istniejące procesy innowacyjne. Projekt uspraw-niający został nazwany „BASF Innovation Chains”. Projekt ten miał na celu uproszczenie procesów, zredukowanie kompleksowości, przypisanie jasnych odpowiedzialności wzdłuż całego łańcucha tworzenia innowacji. Ponadto posta-wiono w nim na identyfikację najlepszych praktyk i udostępnienie ich całemu przedsiębiorstwu oraz silniejsze powiązanie działalności innowacyjnej z ryn-kiem i potrzebami klientów.
Rysunek 4. Zastosowanie metody „Phase-Gate” (przeglądów na końcu fazy) w zarządzaniu innowacjami w BASF
Faza 1Szanse,
Pomysły,Rozwiązania
Faza 2
Biznescase
Faza 3
Fazalaboratorium
Faza 4
Pilot
Faza 5
Wdrożenie
G1 G2 G3 G4 G5 G6
Kreatywność• Wytyczanie obszarów szans
Kultura organizacyjna• Rozwój kariery• Modele czasu pracy• Ustalanie celów
Fokus• Strategia innowacji• Zarządzanie portfelem
Efektywność:• Bramka na koniec fazy• Właścicielstwo projektów
Źródło: D. Baucke, (2005): Neugestaltung von Innovationsprozessen bei BASF, Projektteam‚BASF Innovationsketten, Dortmund, http://www.refa-chemie.de/media/56.pdf (7.09.2014).
Faza I obejmuje poszukiwanie pomysłów i szans; praktyka pokazuje, że im bli-żej rynku i klienta, tym większa szansa na dobre pomysły.Faza II – konsekwentna ocena projektu na bazie biznesowych kryteriów w zgodzie z przyjętymi kryteriami innowacyjności znacznie podwyższa szansę
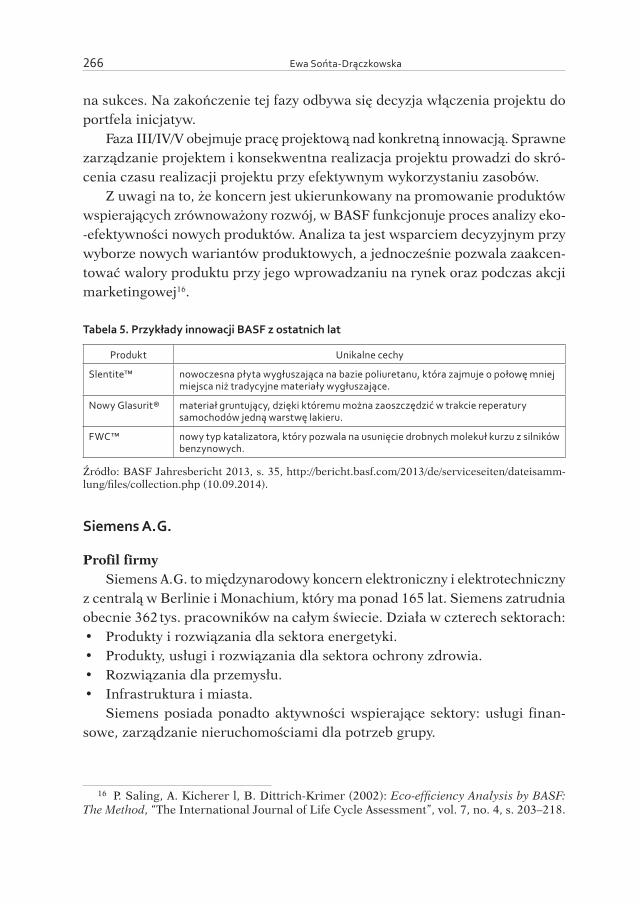
Ewa Sońta-Drączkowska 266
na sukces. Na zakończenie tej fazy odbywa się decyzja włączenia projektu do portfela inicjatyw.
Faza III/IV/V obejmuje pracę projektową nad konkretną innowacją. Sprawne zarządzanie projektem i konsekwentna realizacja projektu prowadzi do skró-cenia czasu realizacji projektu przy efektywnym wykorzystaniu zasobów.
Z uwagi na to, że koncern jest ukierunkowany na promowanie produktów wspierających zrównoważony rozwój, w BASF funkcjonuje proces analizy eko--efektywności nowych produktów. Analiza ta jest wsparciem decyzyjnym przy wyborze nowych wariantów produktowych, a jednocześnie pozwala zaakcen-tować walory produktu przy jego wprowadzaniu na rynek oraz podczas akcji marketingowej16.
Tabela 5. Przykłady innowacji BASF z ostatnich lat
Produkt Unikalne cechy
Slentite™ nowoczesna płyta wygłuszająca na bazie poliuretanu, która zajmuje o połowę mniej miejsca niż tradycyjne materiały wygłuszające.
Nowy Glasurit® materiał gruntujący, dzięki któremu można zaoszczędzić w trakcie reperatury samochodów jedną warstwę lakieru.
FWC™ nowy typ katalizatora, który pozwala na usunięcie drobnych molekuł kurzu z silników benzynowych.
Źródło: BASF Jahresbericht 2013, s. 35, http://bericht.basf.com/2013/de/serviceseiten/dateisamm-lung/files/collection.php (10.09.2014).
Siemens A. G.
Profil firmySiemens A. G. to międzynarodowy koncern elektroniczny i elektrotechniczny
z centralą w Berlinie i Monachium, który ma ponad 165 lat. Siemens zatrudnia obecnie 362 tys. pracowników na całym świecie. Działa w czterech sektorach:• Produkty i rozwiązania dla sektora energetyki.• Produkty, usługi i rozwiązania dla sektora ochrony zdrowia.• Rozwiązania dla przemysłu.• Infrastruktura i miasta.
Siemens posiada ponadto aktywności wspierające sektory: usługi finan-sowe, zarządzanie nieruchomościami dla potrzeb grupy.
16 P. Saling, A. Kicherer l, B. Dittrich-Krimer (2002): Eco-efficiency Analysis by BASF: The Method, “The International Journal of Life Cycle Assessment”, vol. 7, no. 4, s. 203–218.

Strategie kreowania i wdrażania innowacji na przykładzie wybranych przedsiębiorstw... 267
Sposób organizacji działalności B&RW działach związanych z badaniami i rozwojem pracuje 13 tys. pracow-
ników w Niemczech oraz 16.5 tys. w ok. 30 innych krajach świata. Nakłady na B&R w roku 2013 wynosiły 4,3 mld euro, co stanowi 5,7% ogółu przycho-dów firmy. Firma posiada obecnie 60 tys patentów, z czego 21,4 tys. patentów i znaków chronionych chronią produkty w obszarze ochrony środowiska. Jeśli chodzi o patenty, firma zajmuje drugie miejsce w Europie, czwarte – w Niem-czech oraz jedenaste – w USA (dane na rok 2013). Firma w skali roku koope-ruje z ca. 1 tys. uniwersytetami oraz instytutami badawczo-rozwojowymi.
Rysunek 5. Filary strategii innowacyjności firmy Siemens
• Koncentracja na technologiiwyznaczającej trendy
i osiągnięcie pozycji lidera
• Wzrost ilości patentówi technologii wyznaczającej trendy
• Efektywne wydatki na B & R
• Pełne wykorzystaniekompetencji i aktywów abyrozwijać dalsze potencjały
Strategiąstandardów
Umiejętnościami/LudźmiKulturą
Procesami
Strategiątechnologii
Strategiązasobów
B & R
Strategiąpatentów
Strategia innowacyjności
Zachowanie spójności z:
Być pionierem we wszystkichobszarach biznesowych/ utrzymać
pozycję lidera
Źródło: Innovation@Siemens (2012): Corporate Communications, Siemens AG 2012, http://i360insti-tute.com/wp-content/uploads/2013/07/innovation_at_siemens_2012.pdf (5.12.2014).
Kluczowe cele korporacyjnego procesu innowacji, który wspiera w Siemens organiczny wzrost firmy, to zapewnienie wczesnej identyfikacji możliwych problemów komercjalizacji innowacji przełomowych, wykorzystanie w pełni szans dla biznesu związanych z nowymi produktami i usługami, zapewnienie holistycznego podejścia do decyzji dotyczących alokowania kapitału na przed-sięwzięcia innowacyjne, zapewnienie uwagi oraz aktywnego uczestnictwa członków zarządu w tym procesie.
Strategia innowacyjna Siemensa w zasięgu globalnym jest zorientowana na wykorzystanie przewag z rynków wzrostowych pod względem niskich kosz-

Ewa Sońta-Drączkowska 268
tów pracy oraz zalet lokalizacji (np. Indie i Chiny), gdzie realizuje strategię lidera kosztowego w innowacjach na poziomie ‘low end’. Daje to potencjały oszczędności kosztów w procesie innowacji w portfelu innowacji o niskiej war-tości dodanej (low-end). Sieć partnerstw i instytucji w krajach wysokorozwi-niętych, takich jak Niemcy, USA, Japonia, pozwala na wykorzystanie efektu dźwigni dzięki dostępu do globalnej wiedzy z najbardziej prężnych ośrodków innowacji.
Rysunek 6. Proces innowacyjny w Siemens A. G.
Identyfikacjaobszarów
innowacyjnych
Dopracowaniepomysłów na
innowacje
Dyskusjana temat
propozycjiz zarządem
Wdrożenie‘follow-up’
Obszaryinnowacyjne
Biznes planZdefiniowane
Strategia, właściciel,budżet
Realizacjai z bramkamidecyzyjnymi[go / no go]
Preselekcja Priorytetyzacja Decyzja Zarząduo alokacji kapitału
Korporacyjny ‘lejek’ innowacyjny[ang. innovation pipeline]
Źródło: Innovation@Siemens (2012):, Corporate Communications, Siemens AG 2012, http://i360in-stitute.com/wp-content/uploads/2013/07/innovation_at_siemens_2012.pdf (5.12.2014).
W procesie innowacyjnym Siemens wykorzystuje synergie w obszarze tech-nologicznym:• Wspólne technologie i platformy – wykorzystanie działających już tech-
nologii i platform, współdzielenie projektów w obszarze B&R, projekty realizowane na wspólnych platformach, wykorzystujące innowacyjne łań-cuchy wartości.
• Dzielenie się najlepszymi praktykami – dzielenie się najlepszymi prakty-kami pomiędzy obszarami biznesowymi, działami, firmami działającymi w regionach, praktykami zarządzania projektami.
• Zarządzanie technologią na poziomie korporacji – doradztwo technolo-giczne, doradztwo w zakresie zarządzania innowacjami oraz procesowe, patenty, standaryzacja w ramach korporacji.
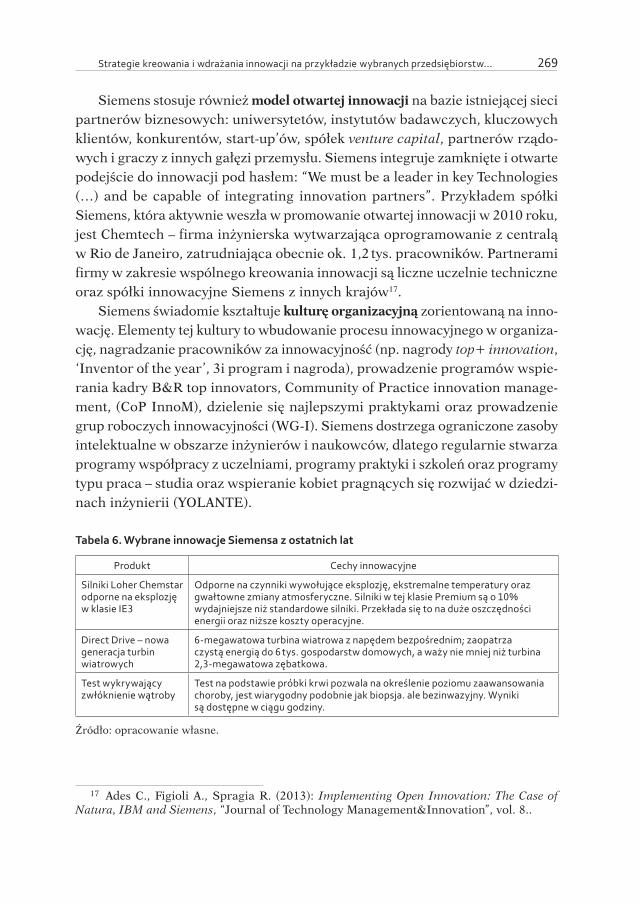
Strategie kreowania i wdrażania innowacji na przykładzie wybranych przedsiębiorstw... 269
Siemens stosuje również model otwartej innowacji na bazie istniejącej sieci partnerów biznesowych: uniwersytetów, instytutów badawczych, kluczowych klientów, konkurentów, start-up’ów, spółek venture capital, partnerów rządo-wych i graczy z innych gałęzi przemysłu. Siemens integruje zamknięte i otwarte podejście do innowacji pod hasłem: “We must be a leader in key Technologies (…) and be capable of integrating innovation partners”. Przykładem spółki Siemens, która aktywnie weszła w promowanie otwartej innowacji w 2010 roku, jest Chemtech – firma inżynierska wytwarzająca oprogramowanie z centralą w Rio de Janeiro, zatrudniająca obecnie ok. 1,2 tys. pracowników. Partnerami firmy w zakresie wspólnego kreowania innowacji są liczne uczelnie techniczne oraz spółki innowacyjne Siemens z innych krajów17.
Siemens świadomie kształtuje kulturę organizacyjną zorientowaną na inno-wację. Elementy tej kultury to wbudowanie procesu innowacyjnego w organiza-cję, nagradzanie pracowników za innowacyjność (np. nagrody top+ innovation, ‘Inventor of the year’, 3i program i nagroda), prowadzenie programów wspie-rania kadry B&R top innovators, Community of Practice innovation manage-ment, (CoP InnoM), dzielenie się najlepszymi praktykami oraz prowadzenie grup roboczych innowacyjności (WG-I). Siemens dostrzega ograniczone zasoby intelektualne w obszarze inżynierów i naukowców, dlatego regularnie stwarza programy współpracy z uczelniami, programy praktyki i szkoleń oraz programy typu praca – studia oraz wspieranie kobiet pragnących się rozwijać w dziedzi-nach inżynierii (YOLANTE).
Tabela 6. Wybrane innowacje Siemensa z ostatnich lat
Produkt Cechy innowacyjne
Silniki Loher Chemstar odporne na eksplozję w klasie IE3
Odporne na czynniki wywołujące eksplozję, ekstremalne temperatury oraz gwałtowne zmiany atmosferyczne. Silniki w tej klasie Premium są o 10% wydajniejsze niż standardowe silniki. Przekłada się to na duże oszczędności energii oraz niższe koszty operacyjne.
Direct Drive – nowa generacja turbin wiatrowych
6-megawatowa turbina wiatrowa z napędem bezpośrednim; zaopatrza czystą energią do 6 tys. gospodarstw domowych, a waży nie mniej niż turbina 2,3-megawatowa zębatkowa.
Test wykrywający zwłóknienie wątroby
Test na podstawie próbki krwi pozwala na określenie poziomu zaawansowania choroby, jest wiarygodny podobnie jak biopsja. ale bezinwazyjny. Wyniki są dostępne w ciągu godziny.
Źródło: opracowanie własne.
17 Ades C., Figioli A., Spragia R. (2013): Implementing Open Innovation: The Case of Natura, IBM and Siemens, “Journal of Technology Management&Innovation”, vol. 8..
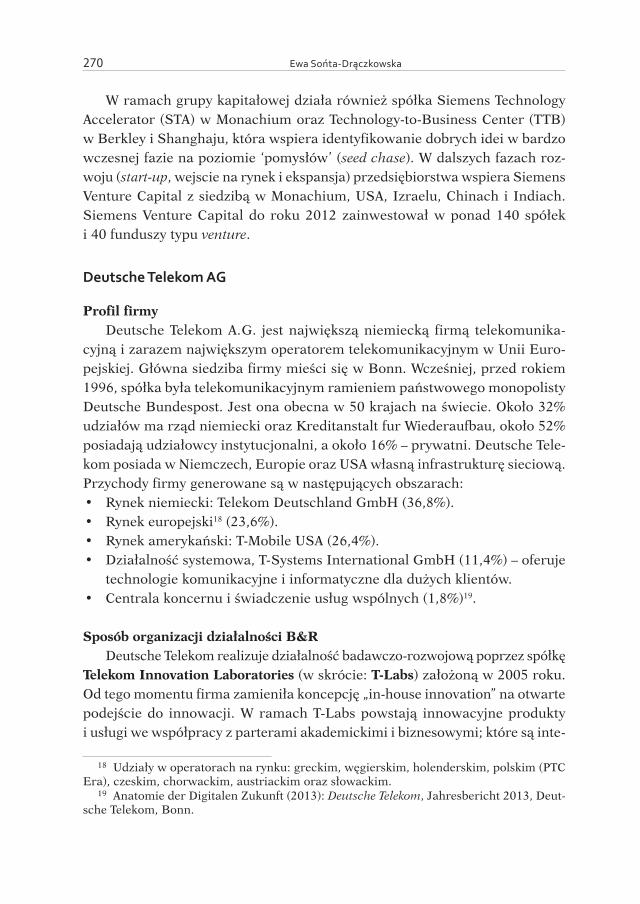
Ewa Sońta-Drączkowska 270
W ramach grupy kapitałowej działa również spółka Siemens Technology Accelerator (STA) w Monachium oraz Technology-to-Business Center (TTB) w Berkley i Shanghaju, która wspiera identyfikowanie dobrych idei w bardzo wczesnej fazie na poziomie ‘pomysłów’ (seed chase). W dalszych fazach roz-woju (start-up, wejscie na rynek i ekspansja) przedsiębiorstwa wspiera Siemens Venture Capital z siedzibą w Monachium, USA, Izraelu, Chinach i Indiach. Siemens Venture Capital do roku 2012 zainwestował w ponad 140 spółek i 40 funduszy typu venture.
Deutsche Telekom AG
Profil firmyDeutsche Telekom A. G. jest największą niemiecką firmą telekomunika-
cyjną i zarazem największym operatorem telekomunikacyjnym w Unii Euro-pejskiej. Główna siedziba firmy mieści się w Bonn. Wcześniej, przed rokiem 1996, spółka była telekomunikacyjnym ramieniem państwowego monopolisty Deutsche Bundespost. Jest ona obecna w 50 krajach na świecie. Około 32% udziałów ma rząd niemiecki oraz Kreditanstalt fur Wiederaufbau, około 52% posiadają udziałowcy instytucjonalni, a około 16% – prywatni. Deutsche Tele-kom posiada w Niemczech, Europie oraz USA własną infrastrukturę sieciową. Przychody firmy generowane są w następujących obszarach:• Rynek niemiecki: Telekom Deutschland GmbH (36,8%).• Rynek europejski18 (23,6%).• Rynek amerykański: T-Mobile USA (26,4%).• Działalność systemowa, T-Systems International GmbH (11,4%) – oferuje
technologie komunikacyjne i informatyczne dla dużych klientów.• Centrala koncernu i świadczenie usług wspólnych (1,8%)19.
Sposób organizacji działalności B&RDeutsche Telekom realizuje działalność badawczo-rozwojową poprzez spółkę
Telekom Innovation Laboratories (w skrócie: T-Labs) założoną w 2005 roku. Od tego momentu firma zamieniła koncepcję „in-house innovation” na otwarte podejście do innowacji. W ramach T-Labs powstają innowacyjne produkty i usługi we współpracy z parterami akademickimi i biznesowymi; które są inte-
18 Udziały w operatorach na rynku: greckim, węgierskim, holenderskim, polskim (PTC Era), czeskim, chorwackim, austriackim oraz słowackim.
19 Anatomie der Digitalen Zukunft (2013): Deutsche Telekom, Jahresbericht 2013, Deut-sche Telekom, Bonn.
Strategie kreowania i wdrażania innowacji na przykładzie wybranych przedsiębiorstw... 271
growane z działaniami operacyjnymi koncernu. W ramach działu pracuje ok. 180 ekspertów oraz 180 naukowców (praktykantów, dyplomantów, dokto-rantów i wyższa kadra naukowa) z ok. 25 krajów świata. T-Labs znajdują się w Niemczech (w Berlinie, Darmstadt, Bonn), Izraelu (w Beer Scheva, Tel Aviv) oraz w USA (w Mountain View). Jednostki te pracują nad identyfikacją szans oraz powstawaniem nowych pomysłów, a także koncentrują się na realizowa-niu planów średniookresowych. W ramach koncernu T-Labs należą do obszaru Products&Innovation i realizują zlecenia związane z pracami badawczymi dla wszystkich obszarów biznesowych.
Działalność innowacyjna Deutsche Telekom jest bardzo mocno powiązana z nauką i promuje model otwartej innowacji. T-Labs działają w bliskiej współ-pracy z Technische Universitat (TU Berlin) oraz Akademią Sztuk Pięknych w Berlinie. Na tych uczelniach powstały ufundowane przez Deutsche Telekom wydziały zajmujące się następującymi obszarami badawczymi:• Laboratorium: „Jakość i użyteczność” (Quality and Usability).• Bezpieczeństwo w telekomunikacji.• Struktury sieciowe skoncentrowane na dostarczanie usług.• Badania dotyczące projektowania (Design-research, na Akademii Sztuk
Pięknych).• Ocena aplikacji bazujących na protokole IP.
Lokalizacja działalności B&R jest mocno zintegrowana z uczelnią nawet lokalizacyjnie. W tzw. Telefunken-Hochhaus, który jest budynkiem uczelnianym, znajduje się otwarta struktura biur z współdzielonymi biurkami „fabryki myśli” (ang. Think tanks), pomieszczenia projektowe, kafeteria i liczne pomieszcze-nia konferencyjne. Taka koncepcja zapewnia intensywną wymianę informacji pomiędzy gospodarką a nauką oraz powiązanie badań podstawowych z ich jednoczesnym zastosowaniem w praktyce. Dzięki zaangażowaniu w prace nad innowacjami ekspertów, naukowców, przedsiębiorców Deutsche Telekom ini-cjuje innowacje przełomowe w obszarze technik informacyjnych i komunika-cyjnych. Powiązania personalne z uczelnią są na tyle rozwinięte, że niektórzy naukowcy z TU Berlin są menedżerami w T-Labs.
Poza tym T-Labs wspierają i współfinansują sieć startupów w Niemczech, Sillicon Valey (USA) oraz Izraelu. W wyniku tych działań powstało kilka firm odnoszących sukcesy na rynku, m.in. Zimory (Cloud solutions), LiteElements (miejsca pracy bazujące na rozwiązaniach internetowych), Trust2Core (rozwią-zania w zakresie bezpieczeństwa architektury systemowej).
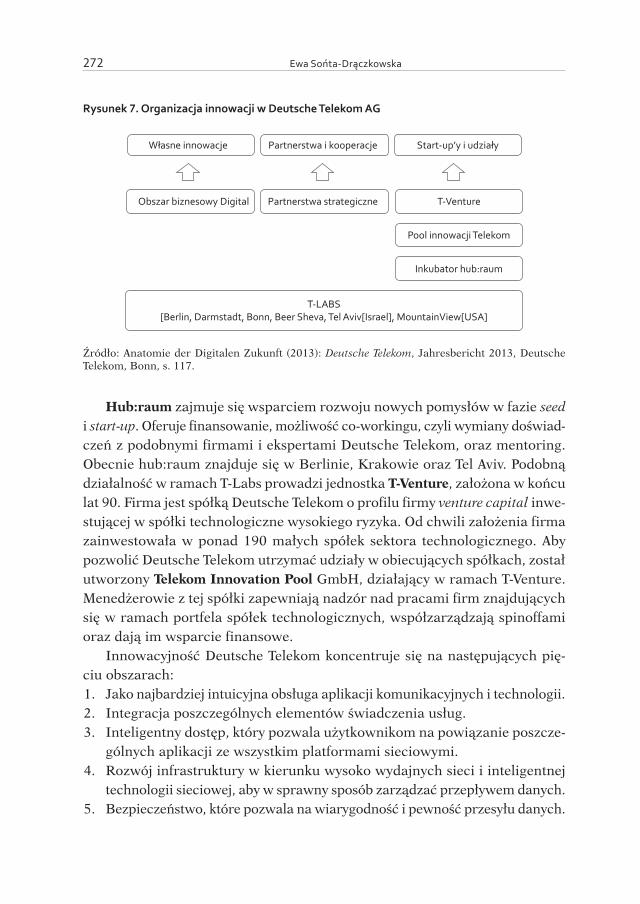
Ewa Sońta-Drączkowska 272
Rysunek 7. Organizacja innowacji w Deutsche Telekom AG
Własne innowacje Partnerstwa i kooperacje Start-up’y i udziały
Obszar biznesowy Digital Partnerstwa strategiczne T-Venture
Pool innowacji Telekom
Inkubator hub:raum
T-LABS[Berlin, Darmstadt, Bonn, Beer Sheva, Tel Aviv[Israel], MountainView[USA]
Źródło: Anatomie der Digitalen Zukunft (2013): Deutsche Telekom, Jahresbericht 2013, Deutsche Telekom, Bonn, s. 117.
Hub:raum zajmuje się wsparciem rozwoju nowych pomysłów w fazie seed i start-up. Oferuje finansowanie, możliwość co-workingu, czyli wymiany doświad-czeń z podobnymi firmami i ekspertami Deutsche Telekom, oraz mentoring. Obecnie hub:raum znajduje się w Berlinie, Krakowie oraz Tel Aviv. Podobną działalność w ramach T-Labs prowadzi jednostka T-Venture, założona w końcu lat 90. Firma jest spółką Deutsche Telekom o profilu firmy venture capital inwe-stującej w spółki technologiczne wysokiego ryzyka. Od chwili założenia firma zainwestowała w ponad 190 małych spółek sektora technologicznego. Aby pozwolić Deutsche Telekom utrzymać udziały w obiecujących spółkach, został utworzony Telekom Innovation Pool GmbH, działający w ramach T-Venture. Menedżerowie z tej spółki zapewniają nadzór nad pracami firm znajdujących się w ramach portfela spółek technologicznych, współzarządzają spinoffami oraz dają im wsparcie finansowe.
Innowacyjność Deutsche Telekom koncentruje się na następujących pię-ciu obszarach:1. Jako najbardziej intuicyjna obsługa aplikacji komunikacyjnych i technologii.2. Integracja poszczególnych elementów świadczenia usług.3. Inteligentny dostęp, który pozwala użytkownikom na powiązanie poszcze-
gólnych aplikacji ze wszystkim platformami sieciowymi.4. Rozwój infrastruktury w kierunku wysoko wydajnych sieci i inteligentnej
technologii sieciowej, aby w sprawny sposób zarządzać przepływem danych.5. Bezpieczeństwo, które pozwala na wiarygodność i pewność przesyłu danych.

Strategie kreowania i wdrażania innowacji na przykładzie wybranych przedsiębiorstw... 273
Rysunek 8. Metoda innowacji stosowana w Deutsche Telekom – innowacja ukierunkowana na użytkownika (User Driven Innovation)
Poszukiwanieobszarówinnowacji
Wglądużytkowników
i pomysłyinnowacyjne
Zredukowaneniepewności
rynkowe
Modelebiznesowei użytkowe
DoświadczenieSuper-
użytkownika
Prognozydługookresowe
Eksploracjai ideacja Wybór Modelowanie
Walidacjadoświadczenia klienta
Źródło: Telekom Innowation Laboratories, User Driven Innovation, http://www.laboratories.telekom.com/public/Deutsch/Netzwerk/Pages/UDI.aspx (29.02.2016).
Sukces koncepcji T-Labs przejawia się m.in. liczbą innowacji, które zostają wdrożone w jednostkach biznesowych. Naukowcy są odpowiednio zmotywo-wani poprzez ustanowione cele, związane z ilością artykułów do wydania, rejestracją patentów oraz zdobywaniem nagród. W momencie zakończenia kontraktu T-Labs ocenia pracownika i decyduje o przedłużeniu kontraktu lub rezygnacji z niego. Kolejnym czynnikiem sukcesu T-Labs jest wsparcie finan-sowe Deutsche Telekom, które jest silnym zapleczem dla rozwijających się tam pomysłów oraz firm. Nie bez znaczenia jest również silny międzynarodowy zespół naukowców oraz praktyków.
Tabela 7. Wybrane innowacje Deutsche Telekom z ostatnich lat
Produkt Cechy innowacyjne
Qivicon – Leben im Smarthome
Innowacyjne rozwiązanie dla typu smart-home integruje rozwiązania różnych dostawców do jednej platformy, która jest łatwa w obsłudze. Platforma umożliwia zdalne ustawianie oświetlenia i ogrzewania w domu.
Vernetztes AutomobilMultimedia system Comando
Rozwiązanie dla Mercedes Benz, w którym samochód jest drugim miejscem pracy, wyposażonym w dostęp do szerokopasmowego Internetu dla wszystkich pasażerów.
VeliQ Platforma, która pozwala przedsiębiorstwom zarządzać telefonami komórkowymi swoich pracowników na jednej platformie intranetowej.
Ewa Sońta-Drączkowska 274
Podsumowanie
Analiza sposobu organizacji działalności badawczo-rozwojowej na przykła-dach trzech transnarodowych korporacji niemieckich (BASF A. G., Siemens A. G. oraz Deutsche Telekom A. G.) pozwala na identyfikację kilku wspólnych cech, które liderzy innowacji wśród przedsiębiorstw stosują w swoich strategiach:• Ukierunkowanie działalności badawczo-rozwojowej na potrzeby klienta
oraz trendy rynkowe we współczesnej gospodarce (market-driven, user dri-ven innovation). W idoczne jest ukierunkowanie badań na obszary istotne z punktu widzenia potrzeb społeczno-gospodarczych, m.in. zrównoważony rozwój oraz efektywność energetyczna.
• Zastosowanie podejścia otwartej innowacji dziś, przede wszystkim we wcze-snych fazach rozwoju nowych produktów i usług: przejawia się to poprzez mocno rozbudowaną sieć partnerstw z ośrodkami akademickimi (instytutami badawczymi oraz przemysłem) oraz aktywną wymianę pomysłów pomię-dzy przedsiębiorstwami a najprężniej działającymi ośrodkami naukowymi w krajach wysoko innowacyjnych (USA, Japonia, Izrael, Szwajcaria, itp.).
• Wymianę kadry pracującej w obszarze B&R między krajami. Z punktu widzenia pracowników oznacza to, że istnieje system zachęt ułatwiający mobilność wysoko wykwalifikowanych pracowników.
• Ujednolicenie procesu B&R w całej organizacji oraz ukierunkowanie go na zapewnienie dobrego wyboru, priorytetyzacji oraz przeglądu projek-tów innowacyjnych pod kątem możliwości przyszłej komercjalizacji pro-duktów prac.
• Mocne zaplecze finansowe ze strony spółki macierzystej oraz spółek ven-ture capital działających w ramach koncernu.
• Udzielanie wsparcia zarządczego i finansowego oraz mentoring firm powstających jako nowe przedsiębiorstwa spinn-off w wyniku działalno-ści badawczo-rozwojowej.
• Umiejętność wdrożenia wyników działalności badawczo-rozwojowej do działalności operacyjnej oraz urynkowienia produktów prac.
Kierunki dalszych badań
Tematyka pobudzania innowacyjności w kontekście polskiej gospodarki jest bardzo interesująca, gdyż z pewnością dużo jest do zrobienia, aby Pol-ska mogła poprawić swoje miejsce w rankingach innowacyjności. Potrzebne
Strategie kreowania i wdrażania innowacji na przykładzie wybranych przedsiębiorstw... 275
są sprawdzone w innych gospodarkach wzorce i rozwiązania, które mogłyby zachęcić polskie przedsiębiorstwa do innowacyjności, oraz modele biznesowe i operacyjne, pokazujące, jak skutecznie wdrażać i komercjalizować innowacje. Obszernym tematem do dokładniejszego przyjrzenia się jest również kwestia zachęt rządowych wspierających polskie przedsiębiorstwa w innowacyjności, przy tym nie powinny być to tylko dotacje (granty unijne), ale również zachęty podatkowe i inne instrumenty pozabudżetowe. Niepokojący jest fakt, że polskie przedsiębiorstwa wycofują się z działalności B&R i raczej wolą zakupić licen-cje na innowacyjne produkty i usługi pochodzące z innych krajów.
Ciekawym tematem do dalszych badań byłaby analiza najlepszych praktyk i rozwiązań z sektora małych i średnich przedsiębiorstw niemieckich oraz moż-liwości przeniesienia ich doświadczeń na grunt polski. W Niemczech to właśnie małe i średnie przedsiębiorstwa są napędem innowacyjności. Dużym polem do badań jest kooperacja między biznesem i nauką, która w Niemczech jest prowadzona skutecznie i na dużą skalę, w Polsce zaś w dalszym ciągu kuleje. Z perspektywy przedsiębiorstw istotne jest podniesienie myślenia innowacyj-nego na poziom zarządzania strategicznego przedsiębiorstwem, zapewnienie obecności tego tematu na agendach zarządów oraz organizacja portfela pro-jektów innowacyjnych i konsekwentna jego realizacja.
STRESZCZENIE
W kontekście „Agendy 2020” nie sposób pominąć dążeń Unii Europejskiej do pod-niesienia poziomu innowacyjności gospodarek narodowych. Niniejsze opracowanie koncentruje się na perspektywie miko i ma na celu pokazanie na trzech wybranych przypadkach (Siemens A. G., BASF A. G. oraz Deutsche Telekom A. G.), w jaki sposób niemieckie i międzynarodowe koncerny organizują i wdrażają działalność badaw-czo-rozwojową. Działania te zostaną pokazane w kontekście Niemieckiego Systemu Innowacji (NIS, Nationales Innovationssystem), który stanowi doskonały przykład współdziałania biznesu i aktorów instytucjonalnych oraz środowisk akademickich w kierunku tworzenia i wspierania innowacyjności. Najlepsze praktyki zachodniego sąsiada stanowią dobry obiekt do badań oraz transferu sprawdzonych rozwiązań na polski grunt.
Słowa kluczowe: Innowacyjność, Niemcy, narodowy system innowacji, organizacja działalności badawczo-rozwojowej, B&R, korporacje międzynarodowe

Ewa Sońta-Drączkowska 276
SUMMARY
In the context of the Agenda 2020 the directives of the European Union towards strengthening of the innovation level of national economies cannot be ignored. This article concentrates on the micro perspective to show on the basis of selected 3 case studies (Siemens A. G., BASF A. G. and Deutsche Telekom A. G.) how German, multi-national enterprises organize and implement research & development activities. This has been put in the context of the German Innovation System (NIS, Nationales Inno-vationssystem), which is a good example for cooperation between business, institu-tional and academic stakeholders towards creation, producing and commercializing innovation. Best practices from the Western neighbor are a great subject for further research, in addition some best practices may be transferred into Polish economy.
Key words: Innovation, Germany, national innovation system, organization of R&D activities, R&D, multinational corporations
Bibliografia
Ades C., Figioli A., Spragia R. (2013): Implementing Open Innovation: The Case of Natura, IBM and Siemens, “Journal of Technology Management&Innovation”, vol. 8.
Anatomie der Digitalen Zukunft (2013): Deutsche Telekom, Jahresbericht 2013, Deut-sche Telekom, Bonn.
Australian Institute For Commercialization (2010): Innovation Toolbox Strategy, ver-sion 1.0.
BASF, http://www.basf-new-business.com/de-DE/scouting/innovationspartner (6.09.2014)
BASF Jahresbericht 2013, http://bericht.basf.com/2013/de/serviceseiten/dateisamm-lung/files/collection.php (10.09.2014) ().
Baucke D. (2005): Neugestaltung von Innovationsprozessen bei BASF, Projektte-am‚BASF Innovationsketten, Dortmund, http://www.refa-chemie.de/media/56.pdf (7.09.2014) ().
BMBF, http://www.bmbf.de/de/19882.php (7.09.2014).Burnat-Mikosz M., Turczyk M. (2013): Inwestycje w B&R, Jak to robią najlepsi?, mate-
riały z prezentacji, Deloitte Polska.Brdulak J., Chinowska K., Grzybowski P. (2013): Praktyka wdrażania innowacji w fir-
mach sukcesu Mazowsza, EMAR, Warszawa.

Strategie kreowania i wdrażania innowacji na przykładzie wybranych przedsiębiorstw... 277
Die Bundesregierung (2012): Zukunftsprojekte der Hightech-Strategie. Aktionsplan. Bundesregierung, Bonn, Berlin, http://www.bmbf.de/pub/HTS-Aktionsplan.pdf (6.08.2014).
Dutta S., Lanvin B., Wunsch-Vincent S. (2014): The Global Innovation Index 2014, http://www.globalinnovationindex.org/userfiles/file/reportpdf/GII-2014-v5.pdf (29.02.2016).
European Parliament (2000): Presidency Conclusions of the Lisbon European Coun-cil on
23 and 24 March 2000, http://www.europarl.europa.eu/summits/lis1_en.htm (9.08.2014) ().
Expertenkommission Forschung und Innovation (EFI) (Hrsg.) (2010): Gutachten zu Forschung, Innovation und technologischer Leistungsfähigkeit Deutschlands, Berlin.
Freeman Ch. (1987): Technology and Economic Performance: Lessons From Japan, Printer Publisher, London.
Gerybadze A., Reger G. (1997): Globalization of R&D: Recent Challenges in the Mana-gement of Innovation in Transnational Corporations, Discussion Paper on Inter-national Management and Innovation, Stuttgart.
Grundlagen zum Innovationssystem, Fraunhofer Institut für System- und Innova-tionsforschung,http://www.isi.fraunhofer.de/lehre-wAssets/docs/hannover/the-oret_ansaetze/folien/Innovationssystem.pdf (6.08.2014) ().
Goos F., Richter-Tokar M. (2013): Methoden und Analysen des deutschen Innovations-systems: internationaler Vergleich, Stärken und Schwächen, Vorlesungsmaterial, Leibniz Universität Hannover.
Innovation@Siemens (2012): Corporate Communications, Siemens AG 2012, http://i360institute.com/wp-content/uploads/2013/07/innovation_at_siemens_2012.pdf (5.12.2014) ().
European Union (2014):Innovation Union Scoreboard, Belgium.Neukirchner R. (2012): Innovation strategies of selected German multinationals
in India, Materials from Talk at Event “German-Indian Roundtable”, Hamburg University of Technology.
Poznańska K., Zarządzanie innowacjami, materiały ze studiów SGGW, http://spir.sggw.pl/files/files/wyk1-zarzadzanie-innowacjami (7.08.2014) ().
Presidency Conclusions (2002): Barcelona European Council 15 and 16 March 2002, http://ec.europa.eu/invest-in-research/pdf/download_en/barcelona_european_council.pdf (9.08.2014) ().
Rudzewicz A., Strychalska-Rudzewicz A. (2013): Strategie Produktów Innowacyj-nych, Expol, Olsztyn.
Rynek Niemiecki (2011): Biuletyn Informacyjny Wydziału Promocji Handlu i Inwe-stycji Ambasady RP w Berlinie, nr 2/11, Berlin.
Ewa Sońta-Drączkowska 278
Saling P., Kicherer A., Dittrich-Krimer B. (2002): Eco-efficiency Analysis by BASF: The Method, “The International Journal of Life Cycle Assessment”, vol. 7, no. 4.
Siemienc, http://www.siemens.com/sustainability/en/core-topics/innovation/mana-gement-and facts/index.php (7.09.2014)
Telekom Innowation Laboratories, User Driven Innovation, http://www.laboratories.telekom.com/public/Deutsch/Netzwerk/Pages/UDI.aspx (7.09.2014)
Utrecht R. (2009): Strategia firmy a innowacyjność, Nickiel Technology Park, Poznań.Wojnicka E. (2011): Popytowe podejście do innowacji – charakterystyka koncepcji,
materiały z prezentacji, http://www.pi.gov.pl (9.08.2014) ().Zenker A. (2011): Innovationssystem und Innovationsfähigkeit Deutschlands – Ausge-
wählte Charakteristika des Deutschen Innovationssystems, w: Der deutsche Weg aus der Krise, Konrad Adenauer Stiftung, Deutsch-Französisches Dialog, Heft 6. Paris.

Piotr KALKA*
REALIZACJA PRZEZ POLSKĘ STRATEGII „EUROPA 2020” W ZAKRESIE PRAC BADAWCZYCH I ROZWOJOWYCH
Wprowadzenie
Polska jest od maja 2004 roku państwem członkowskim Unii Europejskiej. W konsekwencji powstały liczne prace naukowe poświęcone integracji europej-skiej. Znajdowały się wśród nich opracowania o charakterze ogólnym, prace dotyczące pierwszych doświadczeń oraz ewentualnych barier w rozwoju inte-gracji, dostosowań Polski do wymagań unijnych oraz uzyskiwanych korzyści z uczestnictwa w integracji. W tej ostatniej grupie najwięcej prac odnosiło się do korzyści uzyskiwanych z regionalnej i rolnej polityki Unii.
Warto tu pokreślić, że stosunkowo mało było opracowań dotyczących udziału Polski we wspólnej polityce badawczo-rozwojowej czy realizacji celów strategii lizbońskiej oraz strategii „Europa 2020” w zakresie prac badawczych i rozwo-jowych (B+R). Odzwierciedlało to pewną ogólną tendencję w naukach ekono-micznych. Wśród prac naukowych mało miejsca zajmowały książki i artykuły na temat postępu naukowo-technicznego.
Autor zmierza do przeanalizowania trzech kwestii. Pierwsza to cel strategii „Europa 2020” w dziedzinie prac badawczych i rozwojowych i jego uwarun-kowania. Druga to stopień, w jakim Polska dotąd realizowała ten cel strate-gii. Trzecią kwestią jest realizacja celu badawczo-rozwojowego w przyszłości. Struktura pracy w istotnej mierze jest ukształtowana, uwzględniając te kwe-stie. W ostatniej części opracowania znajduje się podsumowanie rozważań.
W poszczególnych rozdziałach autor wykorzystuje dwie metody badaw-cze. Są to tradycyjna metoda zbierania materiału statystycznego oraz metoda
* Wyższa Szkoła Finansów i Informatyki w Łodzi, * e-mail: [email protected]
Piotr Kalka 280
wyjaśniania go drogą indukcji czy – głównie – dedukcji. Stara się opierać w prze-ważającej mierze na danych statystycznych zawartych w półroczniku „Main Science and Technology Indicators” („Główne wskaźniki w dziedzinie nauki i technologii”), wydawanym przez Organizację Ekonomicznej Współpracy i Roz-woju (OECD). Te dane statystyczne mają zasadniczo charakter porównywalny.
1. Cel strategii „Europa 2020” w zakresie prac badawczych i rozwojowych oraz jego uwarunkowania
Na posiedzeniu z 17 czerwca 2010 roku Rada Europejska przyjęła zapro-ponowaną przez Komisję Unii strategię „Europa 2020”. Określiła tu pięć pod-stawowych celów dla całej Unii dotyczących zatrudnienia, prac badawczych i rozwojowych (B+R), zmiany klimatu, oświaty opartej na mocy gospodarki energetycznej oraz zwalczania biedy i społecznego wykluczenia. Cel w zakre-sie B+R polegał na osiągnięciu przez wszystkie państwa członkowskie UE do 2020 roku udziału ogólnych wydatków w produkcie krajowym brutto wynoszą-cego 3% PKB, czyli kształtującej się na tym poziomie intensywności badawczo--rozwojowej1. Uchwała Rady Europejskiej nie określała wielkości uczestnictwa przedsiębiorstw w finansowaniu tych wydatków.
O przyjęciu takiego celu zadecydowało kilka przyczyn. Jedną z nich stano-wiło istotne znaczenie ekonomiczne prac badawczych i rozwojowych. Prace te są szczególnie ważnym czynnikiem wzrostu gospodarczego, ponieważ prowa-dzą do powstawania innowacji procesów produkcyjnych i produktów. Innowacje procesów produkcyjnych polegają na zastosowaniu nowych albo udoskonalo-nych procesów technologicznych, a innowacje produktów – na wprowadzeniu do produkcji nowych albo ulepszonych wyrobów.
Kolejna przyczyna to osłabienie wzrostu gospodarczego w Unii Europej-skiej (por. tabela 1), będące konsekwencją kryzysu na rynkach finansowych, zapoczątkowanego w 2007 roku w Stanach Zjednoczonych. Kryzys ten wynikł z błędów w amerykańskiej polityce gospodarczej _ stosowanie przez Rezerwę Federalną nadzwyczajnie niskich stóp procentowych, posługiwanie się pożycz-kami wysokiego ryzyka (typu subprime), stymulowanie przez rząd federalny posiadania domów oraz wykorzystanie złożonych instrumentów finansowych2.
1 Europäische Kommission (2015): Europa-2020-Ziele, s. 1, http://ec.europa.eu2 Międzynarodowy kryzys finansowy został omówiony w licznych pracach, por. J. B. Tay-
lor (2010): Zrozumieć kryzys finansowy. Przyczyny, skutki, interpretacje, Wydawnictwo Naukowe PWN, Warszawa.
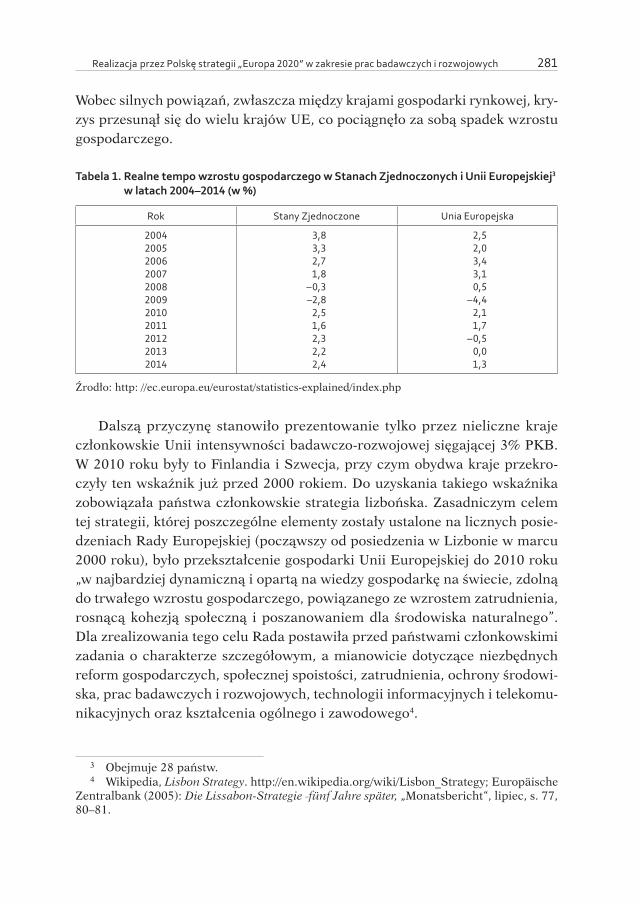
Realizacja przez Polskę strategii „Europa 2020” w zakresie prac badawczych i rozwojowych 281
Wobec silnych powiązań, zwłaszcza między krajami gospodarki rynkowej, kry-zys przesunął się do wielu krajów UE, co pociągnęło za sobą spadek wzrostu gospodarczego.
Tabela 1. Realne tempo wzrostu gospodarczego w Stanach Zjednoczonych i Unii Europejskiej3 w latach 2004–2014 (w %)
Rok Stany Zjednoczone Unia Europejska
20042005200620072008200920102011201220132014
3,83,32,71,8–0,3–2,82,51,62,32,22,4
2,52,03,43,10,5–4,42,11,7–0,50,01,3
Źrodło: http: //ec.europa.eu/eurostat/statistics-explained/index.php
Dalszą przyczynę stanowiło prezentowanie tylko przez nieliczne kraje członkowskie Unii intensywności badawczo-rozwojowej sięgającej 3% PKB. W 2010 roku były to Finlandia i Szwecja, przy czym obydwa kraje przekro-czyły ten wskaźnik już przed 2000 rokiem. Do uzyskania takiego wskaźnika zobowiązała państwa członkowskie strategia lizbońska. Zasadniczym celem tej strategii, której poszczególne elementy zostały ustalone na licznych posie-dzeniach Rady Europejskiej (począwszy od posiedzenia w Lizbonie w marcu 2000 roku), było przekształcenie gospodarki Unii Europejskiej do 2010 roku „w najbardziej dynamiczną i opartą na wiedzy gospodarkę na świecie, zdolną do trwałego wzrostu gospodarczego, powiązanego ze wzrostem zatrudnienia, rosnącą kohezją społeczną i poszanowaniem dla środowiska naturalnego”. Dla zrealizowania tego celu Rada postawiła przed państwami członkowskimi zadania o charakterze szczegółowym, a mianowicie dotyczące niezbędnych reform gospodarczych, społecznej spoistości, zatrudnienia, ochrony środowi-ska, prac badawczych i rozwojowych, technologii informacyjnych i telekomu-nikacyjnych oraz kształcenia ogólnego i zawodowego4.
3 Obejmuje 28 państw.4 Wikipedia, Lisbon Strategy. http://en.wikipedia.org/wiki/Lisbon_Strategy; Europäische
Zentralbank (2005): Die Lissabon-Strategie _fünf Jahre später, „Monatsbericht“, lipiec, s. 77, 80–81.
Piotr Kalka 282
Polska należała do krajów członkowskich o bardzo niskiej intensywności badawczo-rozwojowej. Wśród badanych krajów jedynie w Grecji i Słowacji intensywność ta była niższa (por. tabela 2). O tak niskiej intensywności zade-cydowało w Polsce ograniczone finansowanie przez firmy B+R. Przedsię-biorstwa finansowały w szczególności B+R w dziedzinie nauk inżynieryjnych i technicznych. Prace nad wysoko zaawansowanymi technologiami przemy-słowymi stanowiły w 2010 roku jedynie 14,5% B+R5.
Ograniczone finansowanie B+R wynikało z kilku uwarunkowań. Pierwsze to struktura firm wyodrębnianych z punktu widzenia ich wielkości i zaawanso-wania technologicznego. W Polsce działa bardzo dużo mikroprzedsiębiorstw. Są to podmioty gospodarcze zatrudniające mniej niż 10 pracowników, o rocz-nym obrocie lub całkowitym bilansie rocznym nie przekraczającym 2 mln euro, a także nie powiązane kapitałowo lub osobowo z innymi podmiotami. W latach 2009–2010 należało do tych firm ponad 1,654 mln przedsiębiorstw, czyli 96% wszystkich firm. Mikrofirmy funkcjonują głównie w handlu i usługach, a w mniej-szym stopniu w przemyśle i budownictwie6. Nie są one w stanie praktycznie prowadzić B+R.
W strukturze gospodarki polskiej dominują firmy, stosujące albo wytwarza-jące technologie średnio-niskie oraz niskie. Realizacja prac badawczych i roz-wojowych nie jest tu związana z wydatkowaniem dużych środków. Wydatki te stanowią nikłą część obrotu przedsiębiorstw.
Kolejny czynnik to zbyt mały nacisk na eksport7. Nie dotyczy to zasadniczo firm z udziałem kapitału zagranicznego, prowadzących ożywioną wymianę han-dlową zwłaszcza z krajem, w którym się znajduje siedziba przedsiębiorstwa--matki. Położenie większego nacisku na eksport wymagałoby podjęcia szeroko zakrojonych działań zmierzających do zwiększenia międzynarodowej konku-rencyjności przedsiębiorstw, w tym do wzmożenia realizacji B+R w firmach.
Wiele firm o czysto polskim kapitale uważa, że bardziej się opłaca dokonać zakupu licencji za granicą niż realizować własne prace badawcze i rozwojowe. Podobnie zachowuje się część firm z udziałem kapitału zagranicznego, opie-
5 Obliczono na podstawie danych statystycznych zawartych w: OECD (2014): Main Science and Technology Indicators, vol. 2, s. 42, 57–60.
6 N. Gorynia-Pfeffer (2012): Institutionelle Rahmenbedingungen des nationalen Innova-tionssystems in Deutschland und Polen _ Implikationen für Polen, Dissertation verfasst unter wissenschaftlicher Betreuung von Prof. Dr. habil. A. Budnikowski. Warsaw School of Eco-nomics, Collegium of World Economy, Warszawa, s. 196; J. Orłowska (2015): Mikroprzed-siębiorstwa w Polsce czyli o większości polskich firm, „Biuletyn Euro Info”, s. 1, http://www.een.org.pol
7 N. Gorynia-Pfeffer (2012):, Institutionelle Rahmenbedingungen…, op.cit., s. 196.

Realizacja przez Polskę strategii „Europa 2020” w zakresie prac badawczych i rozwojowych 283
rających proces innowacyjny w przeważającej mierze na innowacjach pocho-dzących z przedsiębiorstw-matek. Pozostałe przeznaczały na B+R np. w latach 2008–2011 od 9,6 do 13,7% ogólnych wydatków badawczo-rozwojowych8.
Tabela 2. Intensywność badawczo-rozwojowa i zakres finansowania ogólnych wydatków na B+R przez państwo i gospodarkę w krajach członkowskich UE w 2010 roku9
Kraj członkowski Unii Europejskiej
Intensywność badawczo-rozwojowa (w % nominalnego PKB)
Udział państwa w finansowaniu ogólnych wydatków na B+R (%)
Udział gospodarki w finansowania ogólnych wydatków na B+R (w %)
AustriaBelgiaDaniaEstoniaFinlandiaFrancjaGrecjaHiszpaniaHolandiaIrlandiaLuksemburgNiemcyPolskaPortugaliaCzechySłowacjaSłoweniaSzwecjaWielka BrytaniaWłochy
2,74a
2,052,941,583,732,18c
0,60a
1,351,721,62a
1,50d2,720,721,531,340,622,063,22a
1,69a
1,22
38,32a,b25,3728,2344,3025,7437,16c
48,33a
46,67.
29,63a
34,6730,1561,1145,1044,7850,0035,44
.32,5441,80
45,26a
57,5660,8843,6765,9553,21c
36,67a
42,96.
52,47a
44,6765,5525,0043,7941,0435,4858,25
.44,38a
44,26
Źródło: obliczenia własne na podstawie: OECD (2014): Main Science and Technology Indicators, vol. 2, s.21, 30, 31.
Również istniejące uregulowania z zakresu prawa podatkowego nie przy-czyniają się do wzrostu wydatków firm na B+R. Przedsiębiorstwa prowadzące prace badawcze i rozwojowe mogą otrzymać status centrum badawczo-roz-wojowego, co pozwala na wliczenie do kosztów funduszu innowacyjności oraz na zwolnienie z podatku od nieruchomości.
Uzyskanie tego statusu wymaga spełnienia określonych warunków, m.in. osiągania przez przedsiębiorstwo przychodu wynoszącego co najmniej 800 tys. euro, z czego co najmniej 20% powinny pochodzić ze sprzedaży wyników
8 Obliczono na podstawie danych zawartych w: Główny Urząd Statystyczny (2013): Nauka i technika w 2012 roku, Warszawa, s. 65; OECD (2008): Main and Science and Tech-nology Indicators, vol. 2. Paris 2009, s. 20, 122.
9 Wyjaśnienia: a narodowe szacunki albo prognozy; bobejmuje także inne podmioty finansujące B+R; c dane nie w pełni porównywalne z informacjami za poprzedni rok; d dane niedoszacowane.
Piotr Kalka 284
B+R. Konieczność spełnienia tego warunku powodowała, że status centrum mogły otrzymać tylko nieliczne firmy realizujące prace badawcze i rozwojowe na własne potrzeby10.
Kolejne stosowane bodźce w sferze podatkowej wyrażały się we wprowa-dzeniu możliwości zaliczenia do kosztów wydatków na B+R (niezależnie od ich wyniku) oraz na skróceniu okresu amortyzacji zakończonych prac rozwo-jowych z 36 do 12 miesięcy11.
Najważniejszy sektor finansujący B+R w Polsce stanowiło państwo (sektor rządowy i samorządowy). Prace te popierały zwłaszcza Ministerstwo Nauki i Szkolnictwa Wyższego oraz Narodowe Centrum Nauki i Narodowe Centrum Badań i Rozwoju. Pierwsze z nich, utworzone w 2010 roku, zajmowało się finan-sowaniem programów z dziedziny badań podstawowych, a drugie, powstałe w 2007 roku, finansowaniem badań stosowanych i prac rozwojowych. Państwo ponosiło głównie koszty badań w zakresie nauk przyrodniczych, medycznych, nauki o zdrowiu oraz nauk społecznych i humanistycznych.
2. Intensywność badawczo-rozwojowa Polski w latach 2010–2013 na tle innych krajów członkowskich Unii
U końca pierwszej dekady obecnego stulecia intensywność badawczo-roz-wojowa kształtowała się w Polsce na niskim poziomie; w latach następnych przyspieszenie jej wzrostu nie nastąpiło. Był on identyczny w latach 2007–2010 i 2010–2013 i sięgał 0,15 punkta procentowego12.
Wzrost intensywności badawczo-rozwojowej nie był w Polsce szybszy, gdyż rola przedsiębiorstw w finansowaniu ogólnych wydatków badawczo-rozwo-jowych była nadal (z powodów wyżej omówionych) zbyt mała. W 2013 roku sięgała ona 36,78% (por. tabela 3). Zmniejszyło przy tym znaczenie prac badaw-czych i rozwojowych w zakresie wysoko zawansowanych technologii przemy-słowych wśród B+R przedsiębiorstw (do 10,4% w 2012 roku).
Najważniejszym sektorem finansującym B+R było nadal państwo, w którym szczególną rolę odgrywały zwłaszcza Ministerstwo Nauki i Szkolnictwa Wyż-szego, Narodowe Centrum Nauki oraz Narodowe Centrum Badań i Rozwoju.
10 A. Adamczyk A. (2012): Propozycje zmian bodźców podatkowych wspierających dzia-łalność B+R, „Gospodarka Narodowa”, nr 11–12, 48.
11 Ibidem, s. 48–49.12 Ustalono na podstawie: OECD (2014): “Main Science and Technology Indicators”,
vol. 1, s. 21; OECD (2014): “Main Science and Technology Indicators”, vol. 2, s. 21.

Realizacja przez Polskę strategii „Europa 2020” w zakresie prac badawczych i rozwojowych 285
Państwo (Rząd) ponosiło głównie koszty badań w zakresie nauk przyrodni-czych, medycznych, nauki o zdrowiu oraz nauk społecznych i humanistycznych.
Tabela 3. Intensywność badawczo-rozwojowa i udział w finansowaniu B+R państwa i gospodarki w krajach członkowskich Unii Europejskiej w latach 2010–201313
Kraj członkowski
UniiLata
Intensywność badawczo-rozwojowa (w % nominalnego PKB)
Udział państwa w finansowaniu ogólnych wydatków na B+R (w %)
Udział gospodarki w finansowania ogólnych wydatków na B+R (w %)
Austria 2010201120122013
2,74a
2,682,81a
2,83b,c
38,32a,b35,8239,50a,b38,87b,c
45,26a
46,2744,13a
43,82c
Belgia 2010201120122013
2,052,152,24a
2,28b
25,3723,26
.
.
57,5660,00
.
.
Dania 2010201120122013
2,942,973,023,06c
28,2328,2829,14a
29,08c
60,8860,9459,93a
59,80c
Estonia 2010201120122013
1,582,342,161,74c
44,3032,9138,4347,70c
43,6755,1251,3941,37c
Finlandia 2010201120122013
3,733,643,433,32
25,7425,00d26,8225,90
65,9567,0362,9760,84
Francja 2010201120122013
2,18d2,192,232,23
37,16d35,1634,98
.
53,21d55,2555,16
.
Grecja 2010201120122013
0,60a
0,670,690,78a
48,33a
49,2550,7251,28a
36,67a
32,8430,4332,05a
Hiszpania 2010201120122013
1,351,321,271,24c
46,6744,7043,31
.
42, 9643,9445,67
.
Holandia 2010201120122013
1,721,89d1,971,98c
.35,45d35,0334,34c
.49,74d48,2246,97c
13 Wyjaśnienia: a narodowe szacunki albo projekcje; b obejmuje także inne podmioty finansujące B+R; c dane przybliżone; d dane nie w pełni porównywalne z informacjami za poprzedni rok; e dane niedoszacowane.
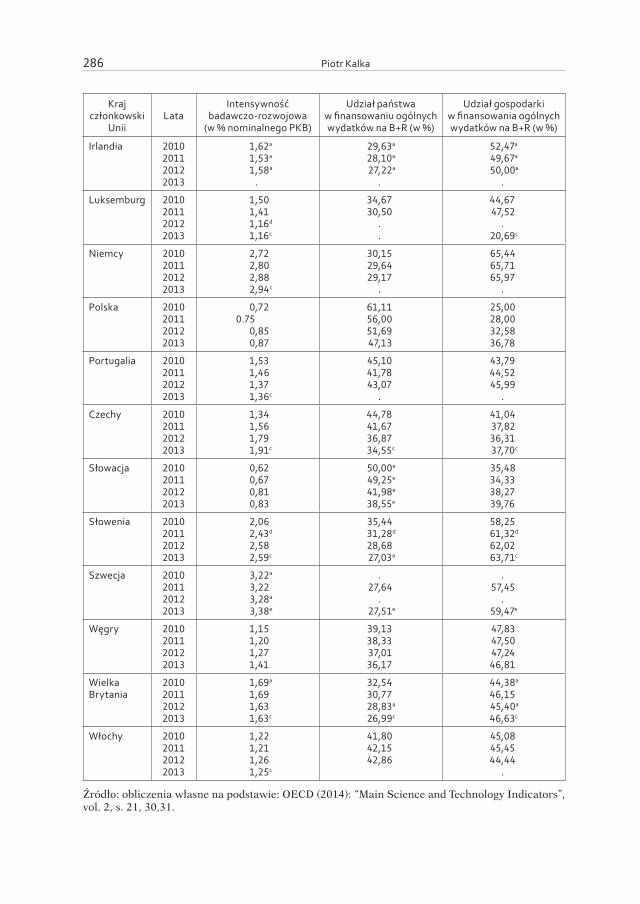
Piotr Kalka 286
Kraj członkowski
UniiLata
Intensywność badawczo-rozwojowa (w % nominalnego PKB)
Udział państwa w finansowaniu ogólnych wydatków na B+R (w %)
Udział gospodarki w finansowania ogólnych wydatków na B+R (w %)
Irlandia 2010201120122013
1,62a
1,53a
1,58a
.
29,63a
28,10a
27,22a
.
52,47a
49,67a
50,00a
.
Luksemburg 2010201120122013
1,501,411,16d1,16c
34,6730,50
.
.
44,6747,52
.20,69c
Niemcy 2010201120122013
2,722,802,882,94c
30,1529,6429,17
.
65,4465,7165,97
.
Polska 2010201120122013
0,720.75
0,850,87
61,1156,0051,6947,13
25,0028,0032,5836,78
Portugalia 2010201120122013
1,531,461,371,36c
45,1041,7843,07
.
43,7944,5245,99
.
Czechy 2010201120122013
1,341,561,791,91c
44,7841,6736,8734,55c
41,0437,8236,3137,70c
Słowacja 2010201120122013
0,620,670,810,83
50,00e
49,25e
41,98e
38,55e
35,4834,3338,2739,76
Słowenia 2010201120122013
2,062,43d2,582,59c
35,4431,28d28,6827,03a
58,2561,32d62,0263,71c
Szwecja 2010201120122013
3,22a
3,223,28a
3,38e
.27,64
.27,51e
.57,45
.59,47e
Węgry 2010201120122013
1,151,201,271,41
39,1338,3337,0136,17
47,8347,5047,2446,81
Wielka Brytania
2010201120122013
1,69a
1,691,631,63c
32,5430,7728,83a
26,99c
44,38a
46,1545,40a
46,63c
Włochy 2010201120122013
1,221,211,261,25c
41,8042,1542,86
45,0845,4544,44
.
Źródło: obliczenia własne na podstawie: OECD (2014): “Main Science and Technology Indicators”, vol. 2, s. 21, 30,31.

Realizacja przez Polskę strategii „Europa 2020” w zakresie prac badawczych i rozwojowych 287
We wielu krajach członkowskich Unii intensywność ta wzrastała szybciej niż w Polsce. Były to Czechy, Słowenia, Holandia, Węgry, Belgia, RFN, Sło-wacja, Grecja, Estonia, i Szwecja, gdzie stosowany wskaźnik zwiększył się odpowiednio 0,57; 0,53; 0,26; 0,23; 0,22; 0,21; 0,18; 0,16 p.p. (por. tabela 3). Przyczyny tego wzrostu wynikały albo ze znacznego zaangażowania gospo-darki w popieranie B+R, albo z poważnego finansowania prac badawczych i rozwojowych zarówno przez przedsiębiorstwa, jak i przez państwo. Pierwsza z powyższych przyczyn dotyczyła Belgii, Niemiec, Słowenii i Szwecji, a druga _ Estonii, Holandii, Czech i Węgier.
W niektórych państwach członkowskich intensywność badawczo-rozwojowa spadła, przy czym najbardziej zmalała w Finlandii (por. tabela 3). Nastąpiło to pod wpływem recesji panującej w latach 2012–2013 w gospodarce fińskiej. Realny wzrost gospodarczy wynosił wówczas –0,2 i –1,4%14. W warunkach słabej koniunktury, począwszy od końca lat 80. XX wieku, przedsiębiorstwa ograni-czają w większości krajów OECD swe prace badawcze i rozwojowe o charak-terze średnioterminowym. Przedtem, nawet w czasie recesji, nie wstrzymywały one realizacji tych prac15.
3. Przyszły rozwój intensywności badawczo-rozwojowej w Polsce
Polska nie zdoła osiągnąć do 2020 roku intensywności badawczo-rozwojo-wej wynoszącej 3% PKB. W okresie 2010–2013 zwiększyła swą intensywność _ jak już wskazano _ tylko o 0,15 p.p., a musiałaby dodatkowo podnieść ten wskaźnik o 1,28 p.p.p. W odróżnieniu od Polski kolejnymi państwami człon-kowskimi, które osiągną albo przekroczą wskaźnik 3% PKB będą Niemcy, Austria i Słowenia. W 2013 roku wydawały one już odpowiednio 2,94%, 2,81% i 2,59% produktu krajowego brutto.
W okresie przed wyborami prezydenckimi i parlamentarnymi wydawało się, że jakkolwiek Polska nie uzyska do 2020 roku udziału ogólnych wydatków
14 Boysen-Hogrefe (2013): Weltkonjunktur kommt nur allmählich in Schwung. Weltkon-junktur und deutsche Konjunktur im Sommer 2013, „Kieler Diskussionsbeiträge”, nr 524/525, s. 22; K.-J. Gern (2014): Weltkonjunktur vorerst weiter mit wenig Schwung. Weltkonjunktur und deutsche Konjuktur im Sommer 2014. „Kieler Diskussionsbeiträge”, nr 539/540, s. 12.
15 Por. Bundesministerium für Bildung und Forschung (2007): Bericht zur technologi-schen Leistungsfähigkeit Deutschlands 2007, s. 59; H. Legler (2006): FuE-Aktivitäten und –Schwerpunkte der deutschen Wirtschaft, w: FuE- Aktivitäten der deutschen Wirtschaft. Ana-lysen auf der Basis von FuE- Erhebungen, red. H. Legler, Ch. Grenzmann, Wissenschaftsta-tistik im Stifterverband für die Deutsche Wissenschaft, Essen, s. 41–42.

Piotr Kalka 288
badawczo-rozwojowych w PKB sięgającego 3%, to jednak udział ten będzie ulegał systematycznemu zwiększeniu. Stałemu jego podniesieniu sprzyjałyby trzy następujące czynniki: dynamiczne prognozowane realne tempo wzrostu gospodarczego w latach 2015–2018, przewidziany w latach 2013–2018 niemały wzrost wydatków państwa na gospodarkę oraz zapowiedziane na 2016 roku przez Rząd wprowadzenie ulg podatkowych w stosunku do firm w zakresie B+R16. Tempo wzrostu gospodarczego należałoby w Polsce do najwyższych w krajach Unii Europejskiej, wahając się od 3,4% w 2015 roku do 4,0% w 2018 roku (por.tabela 3). Wydatki państwa na gospodarkę miały wzrosnąć o 20% 17.
Wzrost intensywności badawczo-rozwojowej będzie _ jak można sądzić – uzależniony od stopnia realizacji przez Prawo i Sprawiedliwość obietnic wyborczych. Będzie on tym słabszy, im w większym stopniu PiS wprowadzi w życie te obietnice. Obejmowały one zarówno postulaty polityczne, jak i eko-nomiczno-społeczne. Te pierwsze przewidywały dokonanie zmian w ustroju Trybunału Konstytucyjnego, mediów i służby cywilnej, a drugie _ obniżenie wieku emerytalnego, zwiększenie kwoty wolnej od podatku do 8 tys. zł, przy-znanie kwoty 500 zł na każde drugie i trzecie dziecko oraz uzyskanie dodatko-wych wpływów budżetowych. PiS postanowił je otrzymać poprzez osiągnięcie dodatkowych wpływów z VAT, poprzez uszczelnienie systemu podatkowego i dodatkowe opodatkowanie hipermarketów i banków18. Zwiększone wpływy budżetowe były niezbędne dla pokrycia kosztów realizacji innych postulatów ekonomicznych.
Zawarta w programie wyborczym PiS koncepcja polityki gospodarczo-spo-łecznej była obarczona licznymi wadami. Wprowadzenie jej w życie prowadzi-łoby do wzrostu cen towarów i kapitału, a więc nie pozostałoby bez wpływu na wysokość wydatków badawczo-rozwojowych firm. Zasadnicze trudności napotykałoby uszczelnienie systemu podatkowego. W każdym kraju istnieje szara strefa.
Jak dotąd nowy parlament uchwalił nowelizację ustaw o Trybunale Konsty-tucyjnym, mediach publicznych i służbie cywilnej, a także ustawę bankową19. Uchwalenie nowelizacji skłoniło jedną z trzech wielkich agencji ratingowych
16 T. Gutkowski (2015): Badania i rozwój siłą napędową polskiej gospodarki, s. 1, www.web.gov.pl/wiedza
17 Rada Ministrów (2015): Wieloletni Plan Finansowy Państwa na lata 2015–2018, War-szawa, s. 57.
18 TVN24 (2015): PO o obietnicach Beaty Szydło: dramatycznie niedoszacowane, Wp.pl/kat.140716.title
19 Nowelizacja ustawy o Trybunale Konstytucyjnym została uchwalona 24 grudnia 2015, o mediach publicznych _ 7 stycznia 2016, o służbie cywilnej _ 8 stycznia 2016. Tzw. „Ustawa
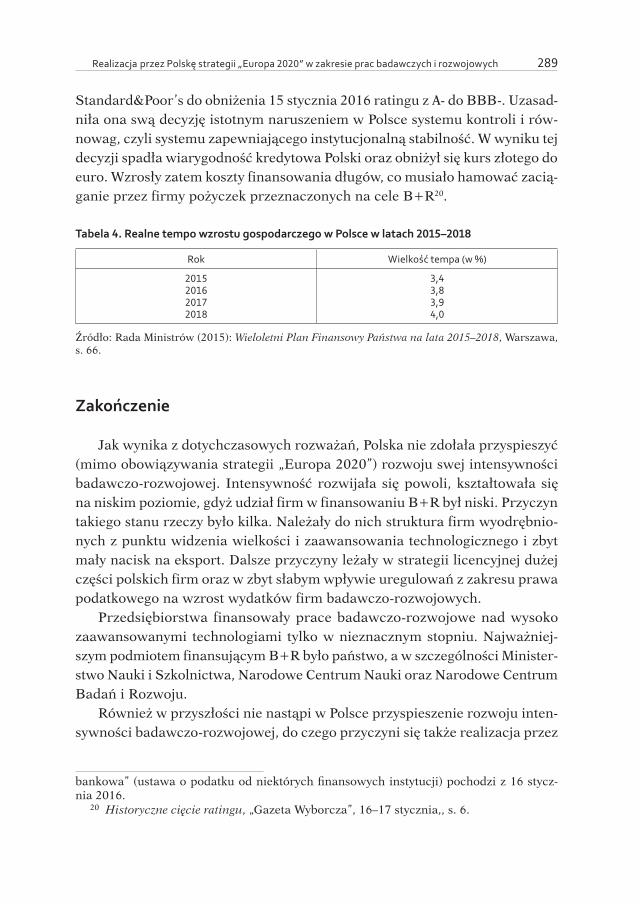
Realizacja przez Polskę strategii „Europa 2020” w zakresie prac badawczych i rozwojowych 289
Standard&Poor’s do obniżenia 15 stycznia 2016 ratingu z A- do BBB-. Uzasad-niła ona swą decyzję istotnym naruszeniem w Polsce systemu kontroli i rów-nowag, czyli systemu zapewniającego instytucjonalną stabilność. W wyniku tej decyzji spadła wiarygodność kredytowa Polski oraz obniżył się kurs złotego do euro. Wzrosły zatem koszty finansowania długów, co musiało hamować zacią-ganie przez firmy pożyczek przeznaczonych na cele B+R20.
Tabela 4. Realne tempo wzrostu gospodarczego w Polsce w latach 2015–2018
Rok Wielkość tempa (w %)
2015201620172018
3,43,83,94,0
Źródło: Rada Ministrów (2015): Wieloletni Plan Finansowy Państwa na lata 2015–2018, Warszawa, s. 66.
Zakończenie
Jak wynika z dotychczasowych rozważań, Polska nie zdołała przyspieszyć (mimo obowiązywania strategii „Europa 2020”) rozwoju swej intensywności badawczo-rozwojowej. Intensywność rozwijała się powoli, kształtowała się na niskim poziomie, gdyż udział firm w finansowaniu B+R był niski. Przyczyn takiego stanu rzeczy było kilka. Należały do nich struktura firm wyodrębnio-nych z punktu widzenia wielkości i zaawansowania technologicznego i zbyt mały nacisk na eksport. Dalsze przyczyny leżały w strategii licencyjnej dużej części polskich firm oraz w zbyt słabym wpływie uregulowań z zakresu prawa podatkowego na wzrost wydatków firm badawczo-rozwojowych.
Przedsiębiorstwa finansowały prace badawczo-rozwojowe nad wysoko zaawansowanymi technologiami tylko w nieznacznym stopniu. Najważniej-szym podmiotem finansującym B+R było państwo, a w szczególności Minister-stwo Nauki i Szkolnictwa, Narodowe Centrum Nauki oraz Narodowe Centrum Badań i Rozwoju.
Również w przyszłości nie nastąpi w Polsce przyspieszenie rozwoju inten-sywności badawczo-rozwojowej, do czego przyczyni się także realizacja przez
bankowa” (ustawa o podatku od niektórych finansowych instytucji) pochodzi z 16 stycz-nia 2016.
20 Historyczne cięcie ratingu, „Gazeta Wyborcza”, 16–17 stycznia,, s. 6.

Piotr Kalka 290
PiS obietnic wyborczych. Spowoduje ona pogorszenie warunków zaciągania przez firmy pożyczek przeznaczonych na B+R. Zjawisko to jest tym bardziej szkodliwe, że będzie przeciwdziałać procesowi uniezależniania się Polski od zagranicznych rozwiązań technicznych. Na dłuższą metę opieranie się głównie na własnych rozwiązaniach stanowi warunek dynamicznego wzrostu gospodar-czego w danym kraju. Zagranicą można zakupić licencje na produkty i tech-nologie, niebędące najnowszymi osiągnięciami myśli technicznej.
ZUSAMMENFASSUNG
Der Verfasser versucht in diesem Beitrag drei Fragen zu analysieren. Diese umfas-sen: 1. das Forschung-und Entwicklungsziel der Europa 2020 Strategie und dessen Bedingtheiten; 2. den Umfang in dem Polen bisher dieses Ziel realisiert hat und in der Zukunft realisieren wird. Die Strategie Europa 2020 hat alle Mitgliedsländer ver-pflichtet, eine F+E Intensität in der Größe von 3% des BIPs zu erreichen. Der Ver-fasser weist auf, daß die F+E Intensität Polens sich bisher nur langsam entwickelt hat. Diese Erscheinung war mit vielen im Artikel gezeigten beeinflussenden Faktoren verbunden. Auch in Zukunft wird sich die F+E Intensität Polens voraussichtlich nur langsam entwickeln, wobei die PIS-Politik einen Anteil an dieser Entwicklung hat.
Schlüsselworte: F&E-Ziele, Zielrealisierung, F&E-Intensität, polnische Wirtschaft, Wirtschaftspolitik
Bibliografia
Adamczyk A. (2012): Propozycje zmian bodźców podatkowych wspierających dzi-ałalność B+R, „Gospodarka Narodowa”, nr 11–12.
Boysen-Hogrefe (2013): Weltkonjunktur kommt nur allmählich in Schwung. Welt-konjunktur und deutsche Konjunktur im Sommer 2013, „Kieler Diskussionsbei-träge”, nr 524/525.
Bundesministerium für Bildung und Forschung (2007): Bericht zur technologischen Leistungsfähigkeit Deutschlands 2007.
Europäische Kommission (2015): Europa-2020-Ziele, http://ec.europa.euEuropäische Zentralbank (2005): Die Lissabon-Strategie _fünf Jahre später, „Monats-
bericht“, Juli.

Realizacja przez Polskę strategii „Europa 2020” w zakresie prac badawczych i rozwojowych 291
Gern K. J. (2014): Weltkonjunktur vorerst weiter mit wenig Schwung. Weltkonjunk-tur und deutsche Konjunktur im Sommer 2014, „Kieler Diskussionsbeiträge”, nr 539/540.
Główny Urząd Statystyczny, Urząd Statystyczny w Szczecinie (2013): Nauka i tech-nika w 2012 roku, Warszawa.
Główny Urząd Statystyczny, Urząd Statystyczny w Szczecinie (2013): Nauka i tech-nika w 2013 roku, Warszawa.
Główny Urząd Statystyczny (2014): Rocznik Statystyczny Handlu Zagranicznego 2014, Warszawa.
Gorynia-Pfeffer N. (2012): Institutionelle Rahmenbedingungen des nationalen Inno-vationssystems in Deutschland und Polen _ Implikationen für Polen, Dissertation verfasst unter wissenschaftlicher Betreuung von Prof. Dr. habil. A. Budnikowski, Warsaw School of Economics, Collegium of World Economy, Warszawa.
Gutkowski T. (2015): Badania i rozwój siłą napędową polskiej gospodarki?, www.web.gov.pl/wiedza
Legler H. (2006): FuE-Aktivitäten und –Schwerpunkte der deutschen Wirtschaft, w: FuE- Aktivitäten der deutschen Wirtschaft. Analysen auf der Basis von FuE- Erhebungen, red. H. Legler, Ch. Grenzmann, Wissenschaftsstatistik im Stifter-verband für die Deutsche Wissenschaft, Essen.Ministerstwo Gospodarki (2015): Bezpośrednie inwestycje zagraniczne w Polsce w 2013 roku, Warszawa.
OECD (różne): “Main and Science and Technology Indicators”, (różne półroczniki).Orłowska J. (2015): Mikroprzedsiębiorstwa w Polsce czyli o większości polskich firm,
„Biuletyn Euro Info”, http://www.een.org.polRada Ministrów (2015): Wieloletni Plan Finansowy Państwa na lata 2015–2018,
Warszawa.Taylor J. B. (2010): Zrozumieć kryzys finansowy. Przyczyny, skutki, interpretacje,
Wydawnictwo Naukowe PWN, Warszawa.TVN24 (2015): PO o obietnicach Beaty Szydło: dramatycznie niedoszacowane,
Wp.pl/kat.140716.titleWikipedia, Lisbon Strategy, http://en.wikipedia.org/wiki/Lisbon_StrategyWybory parlamentarne. Podatki, ustrój i prawa obywateli. Krótki opis partyjnych pro-
gramów wyborczych, Wyborcza.pl

Jürgen WANDEL*
THE POLITICAL ECONOMY OF ENERGY POLICY IN GERMANY IN THE CONTEXT OF EUROPE 2020
AND ITS IMPLICATIONS FOR POLAND
“Es gibt kein gutmütigeres, aber auch kein leichtgläubigeres Volk als das deutsche…Keine Lüge kann grob genug ersonnen werden, die Deutschen glau‑
ben sie. Um eine Parole, die man ihnen gab, verfolgen sie ihre Landsleute mit größerer Erbitterung als ihre wirklichen Feinde”
(Napoleon Bonaparte, quoted in Baader, 2005)
“Climate policy has almost nothing to do anymore with environmental protec‑tion. One must say clearly that we redistribute de facto the world’s wealth by
climate policy” (Ottmar Edenhofer, Neue Zürcher Zeitung, 14.11.2010)
1. Introduction
One of the priorities of European Union’s strategy for smart, sustainable and inclusive growth “Europe 2020” is reforming the energy sector in order to address three objectives: economic competitiveness, security of supply and in particular environmental sustainability with the aim to mitigate climate change. The latter has become the main driver of European energy policy since 2008. In 2009 the European Union had embarked on ambitious climate and energy targets and policy measures as part of the so-called “2020 Climate and Energy Package” which were incorporated into Europe 2020. The central aim is to boost the shift towards a resource efficient and low-carbon economy and thereby making the European Union a global leader in this field.1 However,
* Research Centre for the German Economy, World Economy Research Institute, SGH Warsaw School of Economics, * e-mail: [email protected]
1 IAE (2014).

Jürgen Wandel 294
following the disruption of Libyan supplies and the Russia-Ukraine crisis energy security concerns have increased. Hence, EU’s energy sector is one of the most politicized economic branches where in particular environmental and secu‑rity issues heavily influence the policy design. As a result, the energy sector is uniquely prone to government intervention.2
At the same time EU’s internal energy market is still fragmented and has not achieved its potential for transparency, accessibility and choice. Large parts of the market in Eastern and Southern Europe remain isolated3 and national energy policies differ considerably among member countries. This holds in par‑ticular for Germany and Poland. The relation between the two countries is con‑sidered as good as never before. Yet, energy policy is one of the few topics over which both governments disagree considerably. While Germany has advanced to the frontrunner of renewable energies in order to fight climate change Poland is reluctant to follow this path and is in fact considered the brake block for the further radical decarbonisation of EU’s energy system.
The aim of this paper is to analyze the latest development in the energy policy in Germany in the context of Europe’s growth strategy “Europe 2020” and to discuss the potential impact on Poland. Thereby the focus is laid on the political economy of energy policy. Rather than to describe what policy meas‑ures have been taken in the two countries the central aim is to explain why certain policies have been chosen. In doing so the following questions will be addressed:• What guidelines are set in “Europa 2020” for EU’s energy sector in general
and for the national energy policy in Germany and Poland?• How does Germany implement these guidelines and why is this implemen‑
tation as it is? What are the political driving forces for Germany’s unprec‑edented transition from fossil fuel to renewable energies? What are the economic consequences?
• What are the impacts of Germany’s energy policy on Poland directly and on the EU level?For answering these questions the paper draws primarily on insights of
Public Choice Theory and in addition of the Austrian School of Economics. Public choice theory argues that in the real world, not only economic but also political actors are often not benevolent, but self-interested. Thus, they pursue in the first place retention of power, higher salaries, benefits, and social status
2 Loris (2015).3 IAE (2014).
The political economy of energy policy in Germany in the context of Europe 2020... 295
rather than the public welfare. Combined with the limits to their knowledge, an issue elaborated most prominently by Hayek4, this raises serious doubts that they will and can apply economic policies that yield the intended results.5
The remainder of the article is organized as follows: Section 2 briefly high‑lights the targets of EU’s energy policy as laid down in “Europe 2020” and its follow-up documents as well as the recommend policy instruments to achieve these goals. Section 3 analyses what energy policy Germany has so far imple‑mented in this context. Then section 4 tries to explain why Germany has chosen this policy by working out the major political driving forces. Section 5 examines tentatively what implication can be expected from Germany’s energy policy on Poland. The paper ends with concluding remarks (section 6).
2. Energy policy in Europe 2020
The energy sector has played a crucial role in the European integra‑tion process from its very beginning. In fact, this integration process started around major energy sources with the European Community for Steel and Coal (1951–2002) and the European Atomic Energy Community (Euratom) of 1958. Later in 2007 the Treaty on the Functioning of the European Union (TFEU) put energy policy (Art 194 TFEU) under a shared competence between the European Union and member states. This means the member states may legislate and adopt legally binding acts to the extent that the European Union has not exercised its competence.6 Articles 170–172 TFEU entitle the Union to propose guidelines and priorities for the identification of projects of com‑mon interest. Member states have to approve the projects of common inter‑est that are located in their territory. In addition, the European Commission has gained the exclusive competence on trade and investment negotiations for bilateral trade talks and negotiates on behalf of EU member states.
In the context of the global fight against climate change, the European Union has set the aim to take the lead in the transition to a low-carbon econ‑omy. In 2007, the governments of the member states agreed on the so called “20–20– 20” targets which in 2009 were enacted through the climate and energy package. These targets require from all member states until 2020: (1) the
4 Hayek (1945).5 Kirzner (1978), Boettke et al. (2007).6 IEA (2014).
Jürgen Wandel 296
reduction of greenhouse gas (GHG) emissions by 20% compared to 1990 lev‑els, (2) the increase of the share of renewable energies to 20% in gross final energy consumption7 and to 10% in transport and (3) a reduction of the total primary energy consumption by 20%.8 These 20–20–20 targets were incorpo‑rated into the 2010 “Europe 2020 strategy for smart, sustainable and inclusive growth”. It places energy within its headline targets and two flagship initiatives – the Resource-Efficient Union and the Innovation Union, which indicates the importance of the sector for EU’s ten-year growth program.9 Energy policy is expected to promote three core objectives, which are considered interrelated and mutually reinforcing – competitiveness, sustainability and energy secu‑rity. The European Commission assumes that “tackling the climate and energy challenge contributes to the creation of jobs, the generation of ‘green’ growth and a strengthening of Europe's competitiveness. It is estimated that meeting the 20% renewable energy target could have a net effect of creating around 417 000 additional jobs, while getting on track to achieve the 20% energy efficiency improvement in 2020 is forecast to boost net employment by some 400 000 jobs”.10 Hence, there is great hope for a prospective and growing mar‑ket for green technologies in which the EU will be the market leader and that this market can significantly boost EU’s stagnating growth.
For reaching these goals the “Europe 2020” proposes a range of state-pro‑vided targeted benefits.11 These include various financial support measures from several EU programs and funds (e.g. the rural development program, the R&D framework program and the structural funds) as well as so called “market-based” instruments (e.g. emissions trading, energy taxation, state-aid framework, “green” public procurement). In addition “Europe 2020” advo‑cates accelerating the implementation of strategic projects with high Euro‑pean added value, in particular cross border sections and interring modal nodes (cities, ports, logistic platforms), completing the internal energy market
7 The target that 20% of the energy consumed within the European Union must be renewable was pooled among the member states. Under the Renewable Energy Directive of 2009 they have taken on binding national targets for raising the share of renewable energy in their energy consumption by 2020. These targets, which reflect member states’ differ‑ent starting points and potential for increasing renewables production, range from 10% in Malta to 49% in Sweden. For Germany the share was set at 18% and for Poland 15% by 2020 (European Commission, (2015)).
8 IEA (2014), p. 36.9 European Commission (2010).10 European Commission (2013).11 European Commission (2010), p. 14f.
The political economy of energy policy in Germany in the context of Europe 2020... 297
through upgrading Europe‘s networks towards a European super grid and pro‑moting resource efficiency as well as changes in consumption and production patterns. Member states are requested to phase out environmentally harmful subsidies, to deploy fiscal incentives and state procurement to change pro‑duction and consumption methods, and to incentivize the reduction of energy and resource consumption as well as the increase of energy efficiency in pub‑lic buildings using appropriate regulation, taxation, subsidization and public procurement schemes.
“Europe 2020” does not demand the harmonization of national support policies for renewable energies and energy efficiency. Most member states had rejected such a proposal of the EU-Commission. Some feared this would impose on their national economies too high cost while others feared that harmonization might undermine their existing national support schemes. The only issue that is regulated on the EU-level is the share of renewable energies in EU gross final energy consumption until 2020 as well as the corresponding national targets. Here changes have been introduced in the EU policy frame‑work for climate and energy for period 2020–2030 of October 2014.12 On the one hand this new policy framework has set even stronger targets. For exam‑ple, the share of renewables in EU energy consumption must now increase until 2030 from 20% to 27% and the energy efficiency target has been raised to 30%.13 On the other hand the 27% target for renewable energy resources has made binding only for the EU as whole and not for each single member state. This leaves member states the freedom both to set own national targets and to choice the appropriate policy instruments.
Currently, there are three main types of support mechanisms for renew‑able energy sources in EU member states: (1) fixed feed-in-tariffs, (2) feed-in premiums, where the producer receives a fixed premium on top of the price achieved at the electricity spot market and (3) quotas based on auctions or tradable green certificates. There are also combinations of these three types, e.g. feed-in-tariff and quota systems, feed-in-tariffs and premiums or feed-in-tariff, quota and premium.14
12 European Commission (2014a). 13 For more detail see IEA (2014), p. 48f.14 Fischer and Westphal (2012), IEA (2014).
Jürgen Wandel 298
3. Characteristics of the German energy policy
For Germany EU regulations on energy policy in “Europe 2020 and the October 2014 policy framework did not have much impact on its national energy policy, because it is much more ambitious than in any other EU mem‑ber country. Already before the endorsement of “Europe 2020”, Germany had embarked on a radical transition of its energy system from nuclear and fossil fuels to renewables. This transition is called Energiewende (energy transforma‑tion or change) and became policy as early as in 2000 under Gerhard Schröder’s government. It has then been speeded up after the Fukushima disaster in March 2011. Germany’s Chancellor Angela Merkel scrapped her extension of nuclear power and instead to phased out nuclear energy by the end of 2022.
The key policy document outlining the Energiewende is the 2010 “Energy Concept for an Environmentally-Friendly, Reliable, and Affordable Energy Sup‑ply” which was reaffirmed in 2011 by the so called “Energy Packet 2011”.15 It set the following very ambitious targets for Germany’s energy policy until 2050 without using nuclear power: the reduction of greenhouse gases by 80–95%, a share of renewable energy in gross energy consumption of 60% and in gross electrical consumption of 80% as well as an increase in electricity efficiency by 50%.16
Both in “Europe 2020” and in Germany’s legislative acts on energy quan‑titative targets are missing for the other two proclaimed goals of energy policy – energy supply security and competitiveness, resp. affordable prices. Missing is also a prioritization of the goals. This would be necessary, because they are, in fact, not mutually complementary but conflicting objectives. Environmental and climate protection as well as the security of energy supply come at costs and so obviously are in conflict with competiveness and affordability. As Feld and his co-authors point out these omissions in the documents indicates that the goals of supply security and competitiveness (affordability) have so far been
15 The energy package of 2011 consists of 8 legislative: Act to Accelerate the Expansion of Electricity Networks (NABEG): acceleration of spatial planning; Energy Industry Act (EnWG): transposition of Third Internal Market Directive; Renewable Energies Act (EEG): cost-efficient expansion of renewables; Nuclear Energy Act: phase-out of German nuclear power plants until 2022; Energy and Climate Fund Act; Act to Strengthen Climate-compat‑ible Development in Cities and Municipalities; Act on Tax Incentives for Energy-Related Modernisation of Residential Buildings; Ordinance on the Award of Public Contracts (IAE (2013), p. 28).
16 Fischer and Westphal (2012), p. 7.
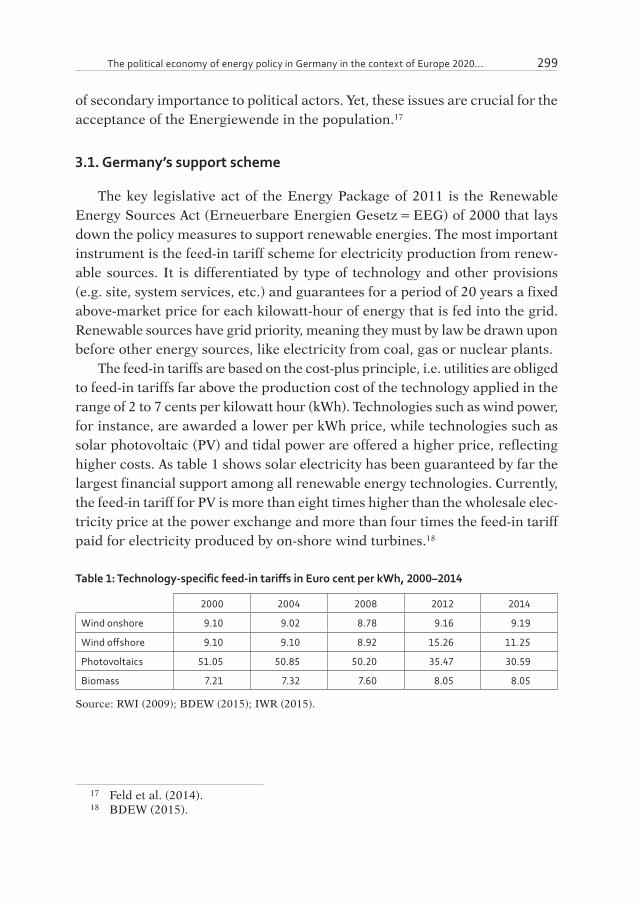
The political economy of energy policy in Germany in the context of Europe 2020... 299
of secondary importance to political actors. Yet, these issues are crucial for the acceptance of the Energiewende in the population.17
3.1. Germany’s support scheme
The key legislative act of the Energy Package of 2011 is the Renewable Energy Sources Act (Erneuerbare Energien Gesetz = EEG) of 2000 that lays down the policy measures to support renewable energies. The most important instrument is the feed-in tariff scheme for electricity production from renew‑able sources. It is differentiated by type of technology and other provisions (e.g. site, system services, etc.) and guarantees for a period of 20 years a fixed above-market price for each kilowatt-hour of energy that is fed into the grid. Renewable sources have grid priority, meaning they must by law be drawn upon before other energy sources, like electricity from coal, gas or nuclear plants.
The feed-in tariffs are based on the cost-plus principle, i.e. utilities are obliged to feed-in tariffs far above the production cost of the technology applied in the range of 2 to 7 cents per kilowatt hour (kWh). Technologies such as wind power, for instance, are awarded a lower per kWh price, while technologies such as solar photovoltaic (PV) and tidal power are offered a higher price, reflecting higher costs. As table 1 shows solar electricity has been guaranteed by far the largest financial support among all renewable energy technologies. Currently, the feed-in tariff for PV is more than eight times higher than the wholesale elec‑tricity price at the power exchange and more than four times the feed-in tariff paid for electricity produced by on-shore wind turbines.18
Table 1: Technology-specific feed-in tariffs in Euro cent per kWh, 2000–2014
2000 2004 2008 2012 2014
Wind onshore 9.10 9.02 8.78 9.16 9.19
Wind offshore 9.10 9.10 8.92 15.26 11.25
Photovoltaics 51.05 50.85 50.20 35.47 30.59
Biomass 7.21 7.32 7.60 8.05 8.05
Source: RWI (2009); BDEW (2015); IWR (2015).
17 Feld et al. (2014).18 BDEW (2015).
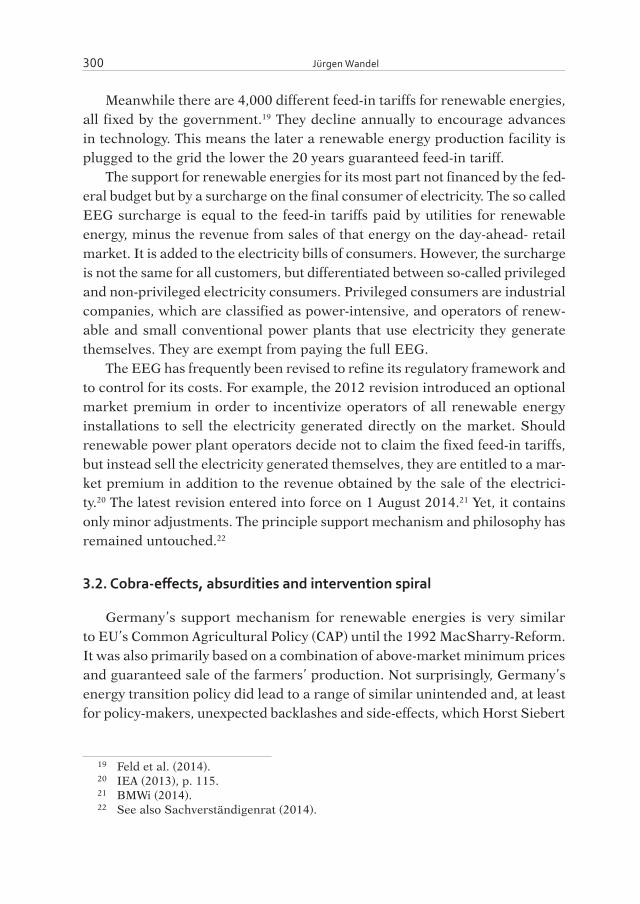
Jürgen Wandel 300
Meanwhile there are 4,000 different feed-in tariffs for renewable energies, all fixed by the government.19 They decline annually to encourage advances in technology. This means the later a renewable energy production facility is plugged to the grid the lower the 20 years guaranteed feed-in tariff.
The support for renewable energies for its most part not financed by the fed‑eral budget but by a surcharge on the final consumer of electricity. The so called EEG surcharge is equal to the feed-in tariffs paid by utilities for renewable energy, minus the revenue from sales of that energy on the day-ahead- retail market. It is added to the electricity bills of consumers. However, the surcharge is not the same for all customers, but differentiated between so-called privileged and non-privileged electricity consumers. Privileged consumers are industrial companies, which are classified as power-intensive, and operators of renew‑able and small conventional power plants that use electricity they generate themselves. They are exempt from paying the full EEG.
The EEG has frequently been revised to refine its regulatory framework and to control for its costs. For example, the 2012 revision introduced an optional market premium in order to incentivize operators of all renewable energy installations to sell the electricity generated directly on the market. Should renewable power plant operators decide not to claim the fixed feed-in tariffs, but instead sell the electricity generated themselves, they are entitled to a mar‑ket premium in addition to the revenue obtained by the sale of the electrici‑ty.20 The latest revision entered into force on 1 August 2014.21 Yet, it contains only minor adjustments. The principle support mechanism and philosophy has remained untouched.22
3.2. Cobra-effects, absurdities and intervention spiral
Germany’s support mechanism for renewable energies is very similar to EU’s Common Agricultural Policy (CAP) until the 1992 MacSharry-Reform. It was also primarily based on a combination of above-market minimum prices and guaranteed sale of the farmers’ production. Not surprisingly, Germany’s energy transition policy did lead to a range of similar unintended and, at least for policy-makers, unexpected backlashes and side-effects, which Horst Siebert
19 Feld et al. (2014).20 IEA (2013), p. 115.21 BMWi (2014).22 See also Sachverständigenrat (2014).

The political economy of energy policy in Germany in the context of Europe 2020... 301
(2001) termed „cobra effects“.23 A further parallel to EU’s CAP is the typical reaction of policy-makers on these side-effects which most prominently have been described by Ludwig von Mises (1976/96). In order to eliminate the cobra effects politicians are usually reluctant to abandon wrong policy measures. Instead they try to correct them with further interventions, setting in motion a destructive spiral of more and more government control thereby making the system even more complicated.24 Against this background in 2012 the Econo‑mist came in an assessment of Germany’s renewable energy policy to following conclusion: “It is hard to think of a messier and more wasteful way of shifting from fossil and nuclear fuel to renewable energy than the one Germany has blundered into”.25 And in 2014 the Financial Times (FT) termed Germany’s Energiewende “a lesson in the danger of doing too much too quickly on energy policy.”26 In the following it will be explained why these judgement is justified.
Surge in renewable energy resources
A first consequence of the generous subsidy policy based on feed-in tariffs was a surge in renewable energy production capacities and electricity genera‑tion from renewable resources. This is not surprising as the 20 year long guar‑antee of revenue eliminates almost any market risk and creates a produce and forget mentality that is well known from EU’s CAP.27 Between 1990 and 2014 the share of renewables in total primary energy consumption increased from 1.3% to 11% and gross electricity consumption from 3.4% to an impressive 25.8%.28 Nevertheless, still three quarters of all electricity is generated in con‑ventional, non-renewable power plants.
The most important renewable energy resources are wind power, biomass and photovoltaic. Meanwhile, Germany gets more electricity from renewable sources than any other big country. Apart from the U. S., Germany has the larg‑est wind power capacities globally and with respect to PV, Germany’s capac‑ity outstrips that of any other country, followed by Spain in second position.29
23 Siebert (2001).24 Mises (1976/96).25 Economist (2012).26 FT (2014).27 See also Feld et al. (2014).28 BMWi (2015a). 29 RWI (2009).
Jürgen Wandel 302
This tremendous growth of renewable energy capacity explains why propo‑nents of renewable energy worldwide tout Germany’s support scheme based on feed-in tariffs as a great success. Indeed, if measured only in terms of green electricity shares Germany’s EEG could be called successful. However, such a view neglects the high social and economic costs of such a policy.
Perverse redistribution of income
As noted above the costs of this support scheme must be borne by the con‑sumers of electricity via the EEG surcharge and hence in the form of higher electricity prices.30 The EEG-surcharge has increased from 0.2 euro cent per kilowatt-hour (kWh) in 2000 to 2.05 euro cents in 2010 and lately to 6.24 cents per kilowatt-hour in 2014 (see figure 1). Thus, alone during the last five years the EEG-surcharge surged by five times. Meanwhile, by 2014 it accounted for 22% of the total retail price for electricity consumers.31
This rise occurred as the number of installed renewables capacity has increased. The large amounts of renewable power that has entered the mar‑ket lowered prices on the electricity exchange. Consequently, the difference between these lowered wholesale prices and the fixed remuneration for renewa‑bles has increased – and, with it, the EEG-surcharge. As a result the retail price for electricity for private consumers almost doubled between 2000 and 2014 from 14 euro cent/kwh to 29cent/kwh. A typical household consisting of three persons with an average power consumption of 4,000 kWh has to pay approxi‑mately 1.122 Euros per year.32 A similar situation occurred for manufacturing companies. They faced a price increase between 2000 and 2014 from 6c/kwh to 15c/kwh. Meanwhile German electricity prices are the highest in Europe. Private and industrial consumers pay 46%, resp. 18% more than the EU-aver‑age.33 The annual cost for the EEG-surcharge has increased from roughly 1 bil‑lion euros in 2000 to 20 billion in 2014. This is means that each employee in the renewable energy industry is subsidized by 400.000 euro.34
Since a number of industrial companies as well as individual energy pro‑ducers for their own consumption are exempt from paying the full surcharge this finance mechanism has considerable redistribution effects. The privileged
30 Feld et al. (2014).31 Feld et al. (2014).32 Feld et al. (2014).33 Vahlenkamp et al. (2014).34 Frondel et al. (2008).

The political economy of energy policy in Germany in the context of Europe 2020... 303
consumers benefit from lowered retail prices on the electricity exchange, while leaving a larger part of the bill to non-privileged consumers. The poor household are disproportionately affected by the hike in energy prices. They spent a higher proportion of their income on electricity than richer consum‑ers. As a result the surcharge redistributes income from the poor to the rich.35 For low-income households poor electricity is increasingly becoming a luxury good in Germany.
Figure 1: Development of the EEG-surcharge, 2000–2014
0,0
1,0
2,0
3,0
4,0
5,0
6,0
7,0
2000200120022003200420052006200720082009201020112012201320142015
Source: BDEW (2015).
Support of inefficient technologies
A further cobra effect of Germany’s current energy policy is that it rewards the most inefficient technology. This is a logical consequence of the cost-plus-based remuneration system. It is grounded on the bizarre logic that the farther away a technology is from market maturity the more it is in need of government support. The indicator used to assess this need is the cost disadvantages of a cer‑tain technology. While this incentive structure ensures that various resources of renewable energy are used it does not allow sorting out the most cost-effi‑cient one.36 This explains the massive expansion of photovoltaic although it is one of the most expensive technologies. The cost of generating power from PVs are six-times higher than in lignite power plants and three-times higher than in onshore wind power plans. At the same time, as table 1 shows, PV enjoys the highest fixed feed-in tariffs. So the EEG lead to massive misallocation of
35 Feld et al. (2014).36 Klodt (2012).
Jürgen Wandel 304
resources, because the most effective way to find out the most efficient tech‑nology has been completely erased – the competitive market mechanism.
A further side-effect of that support mechanism is disincentive to cut costs.37 Not surprisingly, instead of becoming a leader in the world market Germany’s solar industry got into a severe crisis in 2011 revealing that it was far from being internationally competitive despite enormous subsidies. It turned out that the politically spurred demand for solar panels was so high that it could only be met by imports. They came mainly from China and were much cheaper than the German products.38 Within only one year the world market share of Ger‑man solar panel producers almost halved from 15.4 to 9.7% in 2011 while Chi‑na’s share expanded to 48%.39 As a result, in 2011 and 2012 many prominent German solar cell producers went bankrupt or were taken over by competi‑tors. Examples are Solar Millennium, Solarhybrid, SMA Solar or Solarworld. Employment in the solar industry also halved between 2012 and 2015 from 100.300 to 56.000 people.40
However, instead of letting market forces correct for this misallocation the EU-Commission introduced protectionist measures against non-EU-compet‑itors. German and 40 other European solar companies had lobbied the EU-Commission to impose anti-dumping duties at a rate of 47.7% on Chinas solar panels. In addition, at the end of 2013 the EU and China agreed on minimum import prices and annual import quota of up to 7GW.41
“Energiewende-Paradox”
Closely related to the issue of supporting inefficient technologies are two other absurdities which in the German media became known as the “Ener‑giewende-Paradox”42 or “Irsching-Paradox”.43 They are associated to the unre‑solved problem that renewables are not able to provide for a constantly stable, reliable energy supply. Solar panels and wind turbines at times generate huge amounts of electricity, and sometimes none at all, depending on the weather and the time of day. If there is too much power coming from the grid, wind
37 Loris (2015).38 FAZ (2008).39 Die Welt (2011).40 Handelsblatt (2014).41 Handelsblatt (2014).42 ZEIT-Online (2014).43 FAZ (2015a).
The political economy of energy policy in Germany in the context of Europe 2020... 305
turbines have to be shut down or the surplus must be pumped into the grid of neighbouring countries like Poland, the Netherlands or Switzerland. Both sit‑uations cause additional subsidies. In the first case operators of wind turbines and PVs have to be compensated for being switch offed from the grid. In the second case, the Germany has to pay fees to purchasers of energy in neighbour‑ing countries for the allowance to pump the surplus into their grid.44
The other absurdity occurs in the opposite situation, i.e. when the wind suddenly stops blowing or during the cold season when energy supply becomes scarce. To fill this gap, Germany has little choice but to rely on electricity gen‑eration from conventional, fossil fuel power stations. However, the massive sub‑sidization of renewables makes power from conventional energy producers less and less profitable. This holds in particular for gas-fired power plants. Their advantages are that natural gas is relatively climate-friendly, they are flexible and modern gas-fired power plants, like the one in the Bavarian town of Irsch‑ing, operate at almost double the efficiency levels of coal plants. But their big disadvantage is that they have much higher fuel costs than oil or coal-based electricity producers. Therefore, utilities have turned to much cheaper coal for power generation, which, however is considered to be more climate-damaging.
As a result, state-of-the-art gas-fired power plants, like the most modern one in the Bavarian town of Irsching, stand idle and incur big losses. How‑ever, closing the plant is not so easy to do. Any plan to shut down a conven‑tional power plant has to be approved by the government’s Federal Network Agency. In eleven cases known so far the Agency has rejected the permission arguing the power plants are need for times when energy supply from renew‑ables becomes scarce. In the negotiations on the Energiewende in early July 2015 the governing grand coalition decided to pay compensations to the own‑ers for keeping gas and coal-fired power plants on reserve.45
So, there are two perverse effects of Germany’s energy policy: First, power producers are also paid subsidies for producing nothing at all and second, the massive subsidization of renewables made coal power stations profitable although they are held the environmentally most damaging form of energy generation. As a result, Germans have ended up emitting even more carbon dioxide as before.46
44 Die Welt (2011).45 FAZ (2015b). 46 Economist (2014a).

Jürgen Wandel 306
Against all these backlashes and cobra effects Germany’s energy policy can hardly be called a success story and an archetype for other EU countries to fol‑low. Many economists in Germany 47 and even political journals with a usually permissive attitude towards government interventions agree on that.48 State-provided targeted benefits to a certain industry always artificially prop up that market and suppress the real price signals that drive efficiency.49 The misallo‑cation of labour and capital, the waste of taxpayer money, and the perpetuated stagnation among the very technologies that governments want to promote is the inevitable result.
4. Explaining policy choices
In the following it is tried to explain this policy choice focusing on three questions. (1) Why did Germany decide do to so much so fast in terms of renew‑able energy? (2) Why did they choose a fixed feed-in tariff system with manda‑tory purchases? (3) What is the likelihood for reversing this inefficient policy?
4.1. The German Angst?
For policy-makers the marginal cost of providing of targeted benefits to a cer‑tain group of society at the expense of others are the lower the higher the accept‑ance in society that the support of that group is something very important. In the case of the Energiewende, German society might be willing to accept the economic costs of an interventionist energy policy because it believes this is the price that has and is worth to be paid for a clean environment and secure energy supply. It is irrelevant, that the policy measures in reality are not appro‑priate to bring about the desired goals. The only thing that matters is that the population accepts the justification for the need of this policy.50
This seems indeed to be the case in Germany with the Energiewende. A survey conducted by the research institute TNS Emnid on demand by the “Initiative Erneuerbare Energiewende Jetzt!“ (EEWJ!) among 1,000 people
47 See for example the studies conducted by the Rheinisch-Westfälisches Institut für Wirtschaftsforschung RWI (2009), by Feld et al. (2014), or by the German Council of Eco‑nomic EXperts (Sachverständigenrat (2014)).
48 See for example “Spiegel-Online” (2013).49 Loris (2015).50 Koester (2005), Wegner (2014).
The political economy of energy policy in Germany in the context of Europe 2020... 307
after the parliamentary polls in 2013 revealed that an overwhelming majority (84% of those interviewed) wants a quick transition to clean renewable ener‑gy.51 Another survey carried out by the research group Forsa on request of the “Verbraucherzentrale Bundesverband” in the same year came up with a similar result. A fast energy transition enjoys the backing of voters of all major politi‑cal parties. More than 90% of supporters of Germany’s Green Party, over 80% of the voters of the center-left Social Democrats and even 70% of conservative party voters back this policy.52
How can this high support for the Energiewende be explained? The answer can, of course, only be tentative and speculative. One factor could be what for‑eign observers call the “German Angst”.53 This notion describes a nebulous fear of the unknown often combined with an extreme political reaction to it. Exam‑ples of such fears in Germany are the mad cow disease, swine fever, bird flu, Google Street View, the NSA-affair, TTIP, acid rain or nuclear energy, and lately climate change. While other nations seem happy to accept the world as it is, Germans often are most alarmed and are quick to take efforts trying to make an imperfect world perfect.54
There is some indication that fears of nuclear energy and of the negative consequences of climate change is a driving-force of the Energiewende. On the nuclear issue, many remain haunted by memories of the 1986 Chernobyl catastrophe and even more so after the 2011 the Fukushima nuclear disaster. Although it could be argued that despite these incidents nuclear energy is still the safest form of electricity generation and that it secures economic stability, Germans insist on seeing it as a deadly risk. According to a survey carried out on behalf of ARD–Deutschlandtrend shortly after the catastrophe in Japan 53% of those questioned favoured the rapid closure of all German nuclear power plants. Almost 70% feared a similar accident could happen in Germany as well.55 This attitude of the population might explain the reaction of Angela Merkel in 2011 after the Fukushima nuclear disaster when she decided to promptly shut down
51 Results of the Emnid survey are published in http://www.unendlich-viel-energie.de/media/file/173. AEE_RenewsKompakt_Akzeptanzumfrage_Sep13.pdf and of the Forsa survey in http://zap.vzbv.de/400aa9dd-c598-455f-a6d6-0de258eaeb83/Energiewende_Studie_lang_vzbv_2013.pdf.
52 DW (2013).53 Welt (2014), DW (2012).54 See also DW (2012).55 The results of the survey were published by Spiegel Online International (2011).
Jürgen Wandel 308
eight out of 17 nuclear reactors and announced that the rest would be closed by 2022 and the pace of Germany’s energy transition will be accelerated.56
In the same direction could work the fear of supposed negative conse‑quences of a climate change. According to s survery conducted by the PEW Research Institute in 2015 among 40 selected countries around the world 55% of German’s consider climate change as a very serious problem, roughly 35% are very concerned and only one-in-ten does not share this concern. Yet, this is almost equal to the median of the eight European countries surveyed where 54% say it poses a very serious problem. However, concerns vary among those countries. While in France, Italy and Spain the percentage of those who express substantial concern about climate change is similar to Germany57, 41% of Britains and only 19% of Poles consider global climate change a critical issue. Merely in China is the share with 18% lower. In the U. S., 45% believe global climate change is a very serious problem. However, one-in-four Americans do not consider climate change to be a serious problem, which is the highest share of all nations surveyed. People in Latin America and Sub-Saharia Africa, the regions considered especially vulnerable to the feared negative effects of climate change like droughts and water shortages, voiced the biggest concerns about climate change. Interestlingly, worldwide a median of 78% support the idea of their country limiting greenhouse gas emissions, even in when in individual countries there are big doubts about climate change. This could be explained by the precautionary principle following the motto “Even when in doubt, act out of prudence”.58
The survery also found that Germans (66%) are most likely to say global cli‑mate change is harming people now, followed closely by Italians (65%), while again Poles (28%) are among the least worried. Globally, Americans are among the most likely to believe that the effects of climate change are a long way off.59
A further finding of the survey is that views about climate change often divide sharply along partisan lines. Typically, those on the political left are sig‑nificantly more likely than those on the right to view climate change as a major threat. This divide is especially large in the United States and in Australia. In the U. S. almost 70% of the Democrats, but only 20% of the Republicans see climate change as a problem, and in Austrialia only 31% of Liberals are con‑
56 See also FT (2014).57 The respective numbers are 56% in France, 55% in Italy and and 53% in Spain (Pew
Research Institute (2015)). 58 Pew Research Institute (2015).59 Pew Research Institute (2015).
The political economy of energy policy in Germany in the context of Europe 2020... 309
cerned by global warming, compared with 65% of Labor Party supporters and 72% of Greens. Although these partisan and ideological differences also exist in Germany, they are less pronounced than in the other survey wealthi‑est democraciy. There, 51% of partisans of the right-of-center Christian Demo‑cratic Union/Christian Social Union hold climate change a serious issue, which is the highest share among conservative or right-wing liberal parties in these countries. This meaning is shared by 76% of adherents of the Green Party, and 63% of the left-of-center Social Democratic Party.60
This relatively large consensus among partisans of Germany’s major politi‑cal parties, which since 1998 by turns formed the federal government, though in different coaltions 61 seems to make an open and controversial discussion on the legitimization of the Energiewende more difficult than in other countries, like e.g. in the USA. This holds for the theory of man-made climate change as well as for the possible consequences of a climate change and for the question if mankind can really have the capability to influence and steer precisely a com‑plex phenomenon such as the climate.62 Instead of a discussion, it is often sim‑ply declared that the debate is over.63 While such statements can be found in the other countries, too, even in the USA, there seems still to be a bigger contro‑versial debate both in public and in science about several issues in the context of climate change, e.g. about the rate of warming, the magnitude of climate change induced by GHG emissions, or the ability of climate models to predict conditions several centuries into the future.64 For example, according to the Pew Research Center in the USA only 40% of Americans accept that human activity is the root cause of global warming.65 As Rahn from the Cato Institute explained “What we do know is that climate and the earth’s physical features have been in continuous change – but it is all too clear that there is much dis‑agreement about both the direction and magnitude of such changes. Those who say the “science is settled” have not been reading the scientific studies”.66
60 Pew Research Institute (2015).61 Between 1998 and 2005 Social Democrats governed together with Greens, and since
2005 until today (2015) the reigned as junior partner in a Christian Democrat-led grand coalition, expect for the period 2009–2013. when Christan Democates have been in a coala‑tion with the Liberal Party (FDP).
62 See also Krause (2014).63 So did, e.g., Otmar Edenhofer and Stefan Rahmstorf from the Potsdam Institute for
Climate Impact Research (Ederer (2011)). 64 Loris (2015).65 Moore (2015).66 Rahn (2015).

Jürgen Wandel 310
Those who are familiar with the work of F. A. Hayek on the “limits to knowledge”67 and complex phenomena68 must indeed be surprised about declaring a scientific debate about such a complex phenomenon like the cli‑mate settled and pretending being able to apply highly accurate policy meas‑ures to steer this phenomenon into a certain direction, like the 2°C climate target. For him such a pretence is a “fatal conceit” and the extreme all hubris. As Hayek showed in his article due to limited cognitive abilities man can never get full knowledge of complex phenomena of any kind, be it an economy based on the division of labour or the climate. He argued that in complex phenomena “individual events regularly depend on so many concrete circumstances that we shall never in fact be in a position to ascertain them all; and that in conse‑quence not only the ideal of prediction and control must largely remain beyond our reach, but also the hope remain illusory that we can discover by obser‑vation regular connections between individual events…If the theories which we yet have achieved tell us anything, it is that no such regularities are to be expected.” What research on complex phenomena actually showed is “that we … learned enough to know that we cannot know all that we would have to know for a full explanation of the phenomena”.69 From the insight of the impossibil‑ity to achieve full knowledge and control about complex phenomena Hayek demands an attitude of humility of what man can know and do without caus‑ing worse outcomes than before an intervention.70 This also holds for the sup‑posed benefits of the energy transition on climate change.
Even if the above mentioned cobra effects of Germany’s energy policy are acknowledged it is often argued that in the long run acting now so quickly and intemperately is much cheaper than the socio-economic cost that would result from damages caused by climate change.71 For example, Nicholas Stern (2007, p. xv), former chief economist of the World Bank, claims in his promi‑nent “Stern Review” that ‘if we don’t act, the overall costs and risks of climate change will be equivalent to losing at least 5% of global GDP each year, now and forever’. However, just like the Global Circulation Models (GCMs), which are used to predict the effect of CO2 emissions the economic climate model models
67 Hayek (1945).68 Hayek (1967/94).69 Hayek (1967/94), p. 65.70 Hayek (1967).71 See e.g. Venjakob & Mersmann (2013). The socio-economic effects of these physical
changes are claimed to include the displacement of possibly ‘tens to hundreds of millions’ of people through inundation and desertification and increased mortality from heatrelated deaths and the spread of tropical diseases.

The political economy of energy policy in Germany in the context of Europe 2020... 311
(usually so called integrated assessment models – IAMs) have limitations and uncertainties that are inescapable in modelling complex phenomena.72 Mac‑Cracken & Richardson (2010) question whether an IAM can capture problems inherent to the complexity of the earth system.73
In a critical analysis of the research spread by the Intergovernmental Panel on Climate Change (IPCC) and other global warming scientists Johnston con‑tends: “The climate establishment engages in stylized rhetorical techniques that seem to oversell what is actually known about climate change while con‑cealing fundamental uncertainties and open questions regarding many of the key processes involved in climate change”.74 Stephen Moore comes to a simi‑lar conclusion arguing “for a scientific fact to be true, it has to be testable and refutable. But if any weather pattern confirms “climate change,” then by defi‑nition it is neither refutable nor is it testable.”75
Meanwhile, the discussion on many aspects of climate change and the ade‑quate policy response has turned into a quasi-religious dispute. Those who hold different positions than those shared by the so called “climate change estab‑lishment” under the leadership of IPCC are titled wild deniers and eccentric sceptics. In doing so, suspicion is cast upon their motives and any debate is blocked from the very beginning. As a result this field of research turns more and more into an evangelical science that is used to justify certain ideologies and policies in order to redistribute wealth.76 Even Ottmar Edenhofer, chief economist from Germany’s Potsdam Institute for Climate Impact Research (PICR), and leading IPCC official admitted: “Climate policy has almost noth‑ing to do any more with environmental protection. One must say clearly that we redistribute de facto the world’s wealth by climate policy”.77
Irrespective of how one assesses climate science there is hardly any doubt about a strong public sentiment on environmental matters in Germany and hence a big support for the Energiewende. Therefore, with reference to Witt‑man one could argue voters in Germany get what they want, if it is assumed that democracies work the similar way as perfectly competitive markets, so that like consumers voters have very effective disciplinary devices in place
72 See e.g. Bell (2011).73 For example, the values of crucial parameters such as the sensitivity of the global cli‑
mate to increases in atmospheric concentrations of CO2 are not known and climate mod‑ellers have to make assumptions about such values (Dawson (2012)).
74 See Johnston (2010), p. 1.75 Moore (2015).76 See also Ravetz (2010), Krause (2014), Gärtner (2014).77 Neue Zürcher Zeitung, 14 November 2010.

Jürgen Wandel 312
to penalize politicians who do not conform to their will.78 As Ludwig von Mises argues: “Were they to attempt to stand up against the prevailing doctrines they would very soon lose their positions to men willing to conform to the demands of the man in the street”.79 Therefore, “no government, whether democratic or dictatorial, can free itself from the sway of the generally accepted ideology.”80
At least this congruence of interests between large parts of the population and political actors seems to exist in Germany regarding the speed of the Ener‑giewende. But what about the wasteful and inefficient way the Energiewende is carried out? According to Mises the reason why people favour wasteful gov‑ernment programs is that they fail to consider the alternative uses of wasted resources. As he put it “Democracy guarantees a system of government in accord‑ance with the wishes and plans of the majority. But it cannot prevent majorities from falling victim to erroneous ideas and from adopting inappropriate policies which not only fail to realize the ends aimed at but result in disaster.”81 Mises focuses in this context on the public’s erroneous ideas about economics: “The fact that the majority of our contemporaries … entirely ignore everything that economics has brought forward, is the main political problem of our age.”82
4.2. Political actors
Boettke et al. who draw on insights of the Austrian school as evidenced in the writings of Ludwig von Mises, F. A. Hayek and Israel Kirzner to recast political economy question that the political process in democracies works as efficiently as the free market process. The reason is that the political process generates incentives that are entirely different than what is exhibited in the competitive market process.83 This argument is not necessarily in contradic‑tion to the Misean line of reasoning in the previous section to explain the adop‑tion of erroneous policies. It is rather an additional rationale to the defective public opinion argument.
As Kirzner has argued, the driving forces in the market process are alert private entrepreneurs which are guided by the lure of profit and invest their
78 Wittman (1995).79 Mises (1998a), p. xii.80 Mises (1998b), p. 850.81 Mises (1998b), p. 193.82 Mises (1981/2006), p. 325.83 Boettke et al. (2007).
The political economy of energy policy in Germany in the context of Europe 2020... 313
own resources.84 Therefore, they must be very careful and astute when making investment decisions. In doing so the market process reveals the knowledge of the most cost-efficient mode to produce energy. In contrast, government bodies generally are institutionally precluded from capturing pecuniary profits in the market in the course of their activities. But even when they are not, they invest not their own but taxpayer money and they are not exposed to the menace of bankruptcy in the case of long-term losses.85 So, even if government officials were completely dedicated to the well-being of the citizenry nothing within this intervention process “seems to be able to simulate, even remotely well, the discovery process that is so integral to the unregulated market”.86 Instead, self-interested policy-makers have an incentive to engage in rent-provision in order to secure re-elections and retention of power. Targeted benefits like subsidies or regulations on competitors are popular instruments to mobilize votes and donations. The greater the likelihood that the favoured group will in turn pro‑vide noticeable support for the policy-makers in the political competition, the bigger is the incentive for the latter to offer targeted benefits.
A peculiarity of the political process is that it tends to concentrate benefits on the well-organized and well-informed special interested voters in the short run and disperse costs among the unorganized and ill-informed voters in the long run, whereas the market process tends to concentrate costs and disperse benefits.87 In addition, “decisions in the market to either buy or abstain from buying are a direct signal to sellers, whereas in the political process voters do not have the same extent of feedback opportunities with respect to public pol‑icy offerings because they vote only periodically for representatives and their vote is rarely decisive“.88
The election cycle in combination with the unequal dispersion of the ben‑efits also explains why politicians prefer policy measures like the fixed feed-in tariffs that lead to quick visible results over instruments that yield benefits only in the long-run. If the unorganized and ill-informed voters are not aware of the negative effects of those measures, politicians can even expand them with‑out losing votes in the next election. This is also the reason why policy-makers prefer relatively non-transparent policy measures like the complicated support
84 Kirzner (1978).85 Kirzner (1985).86 Kirzener (1978), p. 16.87 Gwartney and Wagner (1988), Boettke et al. (2007).88 Boettke et al. (2007), p. 138.
Jürgen Wandel 314
scheme of the EEG.89 In contrast to direct transfer payments price support schemes tax consumers indirectly without making apparent neither the extent of the taxation nor the magnitude of the benefits given to the targeted group. As has been shown in section 3.2 while some of the costs of the energy change do become visible in the form of a higher electricity price the huge transfers to producers of renewable energy remains obscure. For the recipients of tar‑geted benefits price support measures like the fixed feed-in tariff system are attractive, because they create the impression that they earn their money on the “market” rather than being receivers of government charity.
As has been illustrated in section 3, the typical results of such policies are malinvestment, often in large-scale, observable projects that are deemed to contribute to economic activity and well-being, but in fact regularly turn out economically non-viable.90 Nevertheless, German consumers seem to be ready to bear these costs in order to save the planet. The 2013 Emnid survey revealed that 73% of all respondents are indeed in favour of continuing the support for renewables despite high electricity prices. Likewise support is very high among all major political parties represented in the German Bundestag. So even if there was notable dissatisfaction in the population, there is so far no significant political movement to represent this discontent.
As a result of these peculiarities of the political process economically inef‑ficient policies often persist for a long time, whereas within a market system the profit and loss mechanism provides strong incentives to give up wasteful projects relatively rapidly. Since Germany’s Energiewende has suppressed the market mechanism, profound changes in the project of the energy transi‑tion can only be induced by the political process itself. There changes usually occur at relatively late stage, typically only when policy-makers must seriously fear losing popular vote. At the same time, those negatively affected by a policy switch will try to resist radical changes.91 Among those are not only diverse interest groups related to the energy sector, which will be discussed in the next section, but also bureaucrats.
In fact, a wide range of ministries and agencies both on the federal and Länder level are involved in the energy transition making out of it a compli‑cated administrative process. The federal government is primarily responsible for passing legislation while the Länder are responsible for the administrative
89 See also Wegner (2014).90 Boettke et al. (2007).91 Wegner (2014).
The political economy of energy policy in Germany in the context of Europe 2020... 315
implementation of national law. At the national level, the primary responsibility for energy policy rests within the Federal Ministry of Economics and Energy (Bundesministerium für Wirtschaft und Energie, BMWi). However, market development of renewable energy sources and the research on renewables is overseen by the Federal Ministry for the Environment, Nature Conservation and Nuclear Safety (Bundesministerium für Umwelt, Naturschutz und Reak‑torsicherheit, BMU). It is also the BMU that administers the Renewable Energy Sources Act (Erneuerbare-Energien-Gesetz, EEG) and is responsible for envi‑ronmental regulation that affects the energy sector (e.g. regulations relating to pollution abatement, climate change mitigation, nuclear safety and radiation protection). Further ministries involved are the Federal Ministry of Transport, Building and Urban Development (Bundesministerium für Verkehr, Bau und Stadtentwicklung, BMVBS) which shares responsibilities with the BMWi con‑cerning energy savings in buildings, the Federal Ministry for Food, Agriculture and Consumer Protection (Bundesministerium für Ernährung, Landwirtschaft und Verbraucherschutz, BMELV) which oversees policy matters related to bio‑mass and the Federal Ministry of Finance (Bundesministerium der Finanzen, BMF) which is in charge of energy taxation.92
The theory of bureaucracy as put forward by Anthony Downs, Gordon Tull‑ock and William A. Niskanen93 assumes that bureaucratic officials (directors and their subordinates) like all other agents of society are motivated by their own self-interest. Self-interest may not only include loyalty to an idea or insti‑tution and pride to serve the public interest, but also power, income, prestige, security or convenience. Members of a bureaucracy are dependent upon their superiors for promotion and promotion depends upon performance. However, the performance cannot be evaluated on a market.94 This facilitates certain actions that satisfy their personal interests. They can in particular be well sat‑isfied with interventionist policy measures, because they justify their existence and enable them to increase power. Usually interventionist policies lead to an expansion of budget and more discretionary power. This allows hiring more bureaucrats, to create opportunities for more manager positions, and to devote resources for particular tasks, which in turn increase personal power. Because of all these benefits and because of what Niskanen calls the survival behaviour95
92 IEA (2013).93 For more detail see e.g. Anthony Downs (1964) and (1965), Gordon Tullock (1965),
and William A. Niskanen (1971) and (1994).94 Downs (1964).95 Niskanen (1994).
Jürgen Wandel 316
the ministries and subordinated agencies involved in Germany’s energy tran‑sition are unlikely to have much interest in a fundamental reversal of the cur‑rent policy. Even the opposite might occur, i.e. an extension of bureaucratic activities through the creation of new public bodies. The reason is that gov‑ernments often try to correct for unsuccessful interventions with additional and new kinds of interventions.96 They “see in the failure of their preceding measures a proof that further inroads into the market system are necessary”.97
The general public is often not well informed about the work of ministries and government agencies, because of high information costs. In addition, the complexities of indirect democracies intensify these problems, making it even harder for voters to identify and punish misconduct. How should the blame for a wasteful policy be divided between the various government agents, the Bundestag and Bundesrat? Even if the electorate were lucky enough to spot bureaucratic excesses, they hardly have any instruments to discipline unelected officials.98 Those who are more likely to observe and control the working of the relevant agencies are the interest groups, because they are more than any‑one else directly affected by their work. At the same time, government offi‑cials often depend on the cooperation with interest groups, because they are the best sources of information to learn how an industry operates and how it responds to various incentives. The problem is that these are also the people with the biggest interest in offering biased policy advice. This also adds to the persistence of inefficient policies.
4.3. Interest groups
In fact, the most preferred explanation for the persistence of economic policies that harm the majority is special interests.99 Special interest groups coalesce to express a demand for wealth transfers. In seeking political profit, politicians respond to these demands by supplying the transfers through leg‑islation and regulation.100 However, politicians do not just passively respond to the demands of interest groups. They also have an incentive to stimulate the demand for their “services”, i.e. state-provided target benefits, in order
96 Mises (1976/1996).97 Mises (1983), p. 35.98 Caplan and Stringham (2005).99 Caplan and Stringham (2005), p. 85.100 Lorenzo (1988).
The political economy of energy policy in Germany in the context of Europe 2020... 317
to secure re-election and retention of power.101 Olson showed that small well-organized, concentrated beneficiaries are more effective at lobbying for gov‑ernment handouts than the amorphous public is at blocking them.102 The most prominent example is the farm lobby in most western market economies. The average (“rationally ignorant”103) voter is totally unaware that special inter‑est policies have pushed up the price of a certain product – in the case of Ger‑many’s Energiewende the price of electricity – while producers of renewable energy sources are among the leading contributors to those politicians who exert a key impact on energy policy. Because one vote has little effect on pol‑icy, the general public chooses to remain ignorant about the vital details: what drives energy prices, who benefits most and who is responsible for it. Special interests, in contrast, have strong incentives to get informed and actively par‑ticipate in the political process, because their livelihood depends on it.104 So, “even if a comfortable majority opposes a given policy in the abstract, narrow interests of well-organized groups tend to prevail”.105 Any attempt to abolish state-provided targeted benefits can cost the political support of the favoured group, while the simple preservation of the existing interventions does not nec‑essarily guarantee future support.
This exactly seems to be the case in Germany’s energy sector. The Ener‑giewende has caused the emergence of a host of interest groups with vested interests that all owe their existence to the current centrally planning-type support system.106 The German weekly journal “Zeit“ of 14.12.2014 speaks in this context of a “green-industrial complex” with an extremely high influ‑ence. It contends that all actors are united in their effort to provide arguments for the on-going subsidization of renewables. The journal concludes that “the enthusiasm for the green transformation as such and the enthusiasm for the profits that can be made with the green transformation have already become inseparable”.107
101 Mitchell (1984).102 Olson (1965) and (1982).103 Rational ignorance occurs when the cost of educating oneself on an issue exceeds the
potential benefit that the knowledge would provide.104 Gwartney and Wagner (1988).105 Caplan and Stringham (2005), p. 87.106 See also Wegner (2014).107 Own translation of the following passage: „Alle Akteure in diesem Komplex verbindet
ein Interesse: Probleme der Energiewende müssen lösbar erscheinen, damit die Wind- und die Sonnenbranche weiter subventioniert werden. Die Begeisterung für den grünen Umbau und die Begeisterung für das Geschäft mit dem grünen Umbau sind längst nicht mehr zu unterscheiden“.

Jürgen Wandel 318
Yet, it is difficult to grasp this green lobby entirely and completely. It con‑sists not only of the operators of renewable energy plants and related up-and downstream firms (e.g. producers of components and machineries, engineer and planning agency). Service companies in the field of project development and finance as well as non-profit environmental and scientific organizations also belong to it. The biggest and most powerful association of the renewable energy business is the “Bundesverband Erneuerbare Energie e.V. (BEE)”. It is the umbrella organization of more than 20 specialized business associations with more than 30,000 members. The biggest association is the Bundesver‑band WindEnergie e.V. (BWE), followed by the Bundesverband Solarwirtschaft (BSW-Solar), the Bundesverband Deutscher Wasserkraftwerke e.V. (BDV) and the Bundesverband BioEnergie e.V. (BBE) (Grewe, 2009). Influential lobby groups are several environmental organizations, e.g. the German section of the World Wide Fund for Nature (WWF.), the Deutsche Umwelthilfe e. V. (DUH), Germanwatch and Greenpeace. They provide studies on climate change and advocate a swift and comprehensive transition of the national energy sys‑tem. Not surprisingly their policy suggestions are almost identical if not even more radical than the existing non-market policy approach of Germany’s Energiewende (Grewe, 2009). The same holds for various research organi‑zations that engage in campaigning for the Energiewende. An example is the ForschungsVerbund Erneuerbare Energien (FVEE). According to information on its website (http://www.fvee.de/) it employs 2,800 people and unites about 80% of all research capacities that exits in Germany in the field of renewable energies. Its declared goal is to increase confidence among the population and decision-makers into the reliability of energy supply from renewables. Assum‑ing that self-interested behaviour for scientists does not only comprise the self‑less commitment to scientific progress but also personal advancement then the research results of researchers are not necessarily independent, but might be skewed in a certain direction, one that supports an agency mission, policy or paradigm in order to receive funding or get published.108 As Ravetz reports the most prospective way to get published is using sophisticated computer simu‑lations without questioning the quality of data, the theory about global warm‑ing or the need of a radical transition of the energy system.109 Likewise, Moore
108 Koester (2005), Wojcik and Michaels (2015).109 Ravetz (2010).
The political economy of energy policy in Germany in the context of Europe 2020... 319
points out, questioning what is deemed to be common wisdom and consensus would be the best way to go unnoticed and to get defunded.110
A particular big potential for funding-induced biased research exists in the case of contract research be it commercially or publicly funded.111 If for instance politicians or business associations fund research projects they are likely to be more interested in results that support the hitherto applied policy rather than call it into question. For example, Feld et al. report that all forecasts made by major proponents of the EEG about the possible increase of the EEG-sur‑charge have turned out to be too low and hence misleading.112 The so called climategate scandal of November 2009 is perhaps that most prominent case of alleged biased research. Leading climate change researchers from the Cli‑matic Research Unit (CRU) of UK’s University of East Anglia were accused of having deliberately falsified data, and then used the results of the falsification to obtain additional research funding.113
Hence, in Germany there exists an exceptionally large and influential spec‑trum of “green” interest groups which acts in a political environment which is well-disposed and a very sympathetic towards renewable energies. In such a situation, the renewables industry would actually not need specific lobby organizations, because all major political parties support the extension of renewable energy resources (Grewe 2009).
An interesting case of interest groups from Germany’s energy sectors are conventional energy producers as well as electricity-intensive industries and their up- and downstream industries. They exercise pressure on the federal gov‑ernment, because their businesses suffer from the Energiewende. As a result, most of the big players in this field RWE, E. ON, Siemens and Bosch moved also into the more lucrative renewables business and hence have become part of the green lobby, too.114 So they reap the state-provided benefits for renewables while at the same time they lobby for compensation for the losses incurred due to the massive support of renewables and/or for keeping loss-making conventional
110 Moore (2015).111 Koester (2005), Wojcik and Michaels (2015).112 Feld et al. (2014). Examples of such misleading forecast are Traber et al. (2011) or
the Wuppertal Institut für Klima, Umwelt, Energie (Institute for Climate, Environment and Energy) on behalf of the Agency for Renewable Energies (Agentur für Erneuerbare Energien). For a summary of other wrong forecasts see Haucap et al. (2013), p. 50. Krause (2015) demonstrates the missing independence of research in the case of the Institute “Agora Energiewende”.
113 FAZ (2009).114 Grewe (2009), Wiwo – Wirtschaftswoche (2014).
Jürgen Wandel 320
power plants in reserve. Finally, there are the energy-intensive industries. They lobby for further relief from higher energy prices that threaten their competi‑tiveness on international markets.115
So actually, the federal government in Germany is wedged between the green-energy lobby and the lobby of established electric utilities and energy-intensive industries, with their warnings of chaotic supply problems and job losses. In this political situation profound changes in the support scheme are very unlikely to happen in the near future even though the federal government is aware of the undesirable effects of the Energiewende. In the worst case a deep reform of the energy transition might only then be possible when the institutional sclerosis116 brought about by the many special-interest privileges slowed down growth to such an extent that the only way out are radical mar‑ket reforms. This was the case in New Zealand in the 1980 s.117
Another pressure to changes could come from the supranational level of the EU. However, it is unlikely that this would induce deep changes, since the EU itself advocates the shift towards renewables and leaves it up to the mem‑ber states how they design their national energy policy to meet the targets of “Europe 2020” and of October 2014 for 2030. An intervention from the Com‑mission might only be possible, when Germany’s energy policy negatively influ‑ences the principles of the common market and the rights of other EU member states. This was indeed the reason for a conflict between the EU Commission and the German government over Germany’s Renewable Energies Act. Brus‑sels considers being state aid and criticizes in particular the green energy rebate system, which largely exempts energy-intensive industries from paying the EEG’s surcharge and so gives them unfair advantages vis-à-vis competitors in other EU countries. The dispute was preliminary settled by a decision of 25 November 2014, in which the Commission approved the majority of exemp‑tions. Yet, it considered “a limited portion of the reductions exceed what is per‑mitted under EU state aid rules”.118
115 Bardt (2015).116 Olson (1982).117 For more details see e.g. Scrimgeour & Pasour, Jr. (1996), Knorr (1997) or Sautet
(2006).118 EurActive.com (2015).
The political economy of energy policy in Germany in the context of Europe 2020... 321
5. Implications for Poland
The German government and proponents of the Energiewende see the radi‑cal transition of Germany’s energy system as a blueprint for other European countries. Germany’s energy transition of course has impacts on its neighbours. This is most evident with the uncontrolled loop flows (see section 3.2). More‑over, in order to pursue the goals of the Energiewende more cost efficiently and provide for more investment security, Germany’s energy policy depends on a consistent climate and energy path at the international level, or at least on the European level.119 The following section examines to what extent Ger‑many’s imagination of the Energiewende meets the preferences of its biggest eastern neighbour Poland and whether it is likely that Germany can influence Poland’s energy policy via the European Union.
5.1. Poland’s preferences in energy policy
Germany and Poland have very different views on the main objectives of energy policy. While for Germany environmental and climate issues dominate energy policy, in Poland energy supply security and economic development are the major concerns.120 These differences became obvious on the EU summit of October 24, 2014 where the 2030 energy targets have been adopted. While Germany advocated even stronger targets than those which have in fact been decided Poland was the country that opposed ambitious climate goals, fear‑ing the financial burdens for its economy.121 There are three main reasons for Poland’s different attitude towards energy policy compared to Germany. The first is related to the country’s energy mix, the second to the low importance of environmental issues in the Polish society and third a suspicion towards Russia as a reliable energy supplier based on the fear of being too dependent on Russia’s gas and oil.
Poland is the second largest coal producer in the European Union Europe, behind Germany and the largest hard coal producer. In 2012 coal constituted
119 See also Ćwiek-Karpowicz et al. (2013).120 KAS (2011).121 Germany’s chancellor Angela Merkel emphasized that "Germany will not have a hard
time (living up to the targets). We have already set tougher national targets" while Polish Prime Minister Ewa Kopacz said that “we will not return from this summit with new (finan‑cial) burdens” (EurActive (2014)).
Jürgen Wandel 322
55% of Poland’s total primary energy consumption, with the remainder rep‑resented by oil (26%), natural gas (15%), and renewable energy sources (4%), according to the EU 2014 Statistical Pocketbook.122 In electricity generation the share of coal is with 83% even higher followed by renewables with 11%, natural gas (5%) and oil (1%).123 The country also contains shale resources, but resource estimates have recently been revised downward following unsatisfac‑tory exploration results.124 In addition, as the Economist reports, bureaucratic problems in getting a drilling license (which can take up to a year) and uncer‑tainty over future regulation and taxation have stunted the industry and driven away companies such as ExxonMobil, Talisman Energy and Marathon Oil.125
The dominant role of hard coal and lignite in the Polish energy mix is, of course, contradictory to the EU’s ambitious strategy to combat climate change. For Poland in this context, major challenges are posed by binding targets to reduce carbon dioxide emissions and increase the share of renewables by 2020. A further decrease of CO2 emissions is feared to be too great a burden on the Polish economy. In particular the Polish government is afraid that emission-intensive industries might relocate to countries in Eastern Europe with less restrictive environmental regulations and that, as the case of Germany shows, an energy transition towards renewables might lead to unacceptable financial burdens for low-income households.126 Moreover, the vested interests of the coal industry lobby contribute to Poland’s opposition to far-reaching environ‑mental measures as proposed by the European Union. The strength of these vested interests became obvious in the latest crisis of Poland’s coal industry in 2014/15. The country’s coal industry is chronically lossmaking, inefficient and under threat from external pressures. Not least the US shale boom led to tumbling coal prices exposing vast inefficiencies across the country’s state-owned mining companies.127 At the same time environmental concerns have led to pressure from the EU on Poland to wean itself off the coal. Coal min‑ing in Poland employs more than 100,000 people, and in particular the trade unions that represent their interests are considered as the most powerful lobby group.128 Any attempt to drastically restructure the industry is associated with
122 European Commission (2014b). 123 Wojtkowska-Łodej (2015).124 US EIA (2013).125 Economist (2014b). 126 KAS (2011).127 As the Financial Times (2014c) reports, Britain’s coal mines produce more than four
times as much coal per employee as Polish ones.128 Newsletter AHK Polen, 04.02.2015.
The political economy of energy policy in Germany in the context of Europe 2020... 323
high political and social costs as it evokes protests and unrest in the coal min‑ing region of southern Poland. As a result, with local, parliamentary and presi‑dential elections all due in the course of 2015 the government of Premier Ewa Kopacz was not able to implement overdue profound reforms.
As Olszewski explains environmental issues still play a minor role in the public debate in Poland.129 Across ideological boundaries and political parties there is a great distrust towards renewable energies.130 Instead, security issues are considered a far more important driver of national energy policy. Its impor‑tance grew considerably following the Ukraine-crisis. On the one hand this is surprising. Given the significant role of fossil fuels from vast domestic coal reserves in the energy mix, Poland is one of the few EU member states to have a low level of dependence on energy imports.131 On the other hand, however, the majority of natural gas and crude oil consumed in Poland comes from abroad, in particular from Russia. Russian oil and gas supplies cover 90% and 65% of domestic demand, respectively. Due to its transit role, Poland has for a long time been able to receive energy supplies from Russia at a reasonable price as two of the main energy routes from Russia to Germany, the Druzhba and Yamal pipelines, ran through its territory. These circumstances changed between 2011 and 2012 when the Nord Stream gas pipeline was launched, as well as the Baltic Pipeline System and Ust-Luga crude-oil terminal in Rus‑sia. The significance of Poland’s transit role for Russian energy exports was reduced, as a considerable amount of Russian fossil fuels can now be deliv‑ered directly to Germany and other countries in Western Europe. This situa‑tion has diminished the bargaining position of Polish energy companies with their Russian partners.132 Against this background offsetting reliance on Rus‑sia through a stronger diversification of energy resources is seen as a major challenge for Polish energy policy.133 But in contrast to Germany Poland does not focus only on renewables as alternative energy resources but also nuclear energy and shale gas. On January 28th, 2014 the ministry for economic affairs presented a detailed 150-page plan for the construction of two nuclear-power plants. While surveys have found a majority of Poles in favour of nuclear energy,
129 Olszewski (2013).130 See also KAS (2011).131 The Polish score in this regard is about 31%, well below the EU average (53%) (Ćwiek-
Karpowicz et al., (2013)). 132 Ćwiek-Karpowicz et al. (2013).133 Wojtkowska-Łodej (2015).

Jürgen Wandel 324
the government scheme contains no information on how these plants can be financed and be made profitable.134
In spite of this reserved attitude towards renewables, in March 2015 the Polish President enacted a new law on the support of renewable energy sources (“New RES Act”) in order to comply with EU’s climate targets. Its goal is sourcing 15.5% of domestic energy supply from renewable energy sources. For micro installations of up to 10 kWh a feed-in tariff system was introduced that is similar to the German support scheme. However, it will be phased out in 15 years. Bigger installations will compete for support based on a type of contract-for-difference granted through auctions organized by the President of the Energy Regulatory Office. The new support scheme based on auctions will enter into force on 1 January 2016. Support is also limited to 15 years from initiating generation (both existing and new installations), but not longer than until 31 December 2035.135
5.2. European energy policy
Since the EU sets the framework for the member states’ national energy policy Germany and Poland try to advocate their preferences for energy sup‑ply on the European level in order to influence EU’s energy policy guidelines and directives accordingly. Until the dispute between Brussels and Berlin on undue state aid through Germany’s renewable energy act, negotiations on energy policy on the EU level were of minor importance for the German gov‑ernment because of its self-perception as a pioneer in transforming the energy system towards renewables. It was believed that sooner or later other mem‑ber states would follow Germany’s ambitious climate and energy targets, and consequently apply a similar energy policy approach.136 Yet, the high costs and many absurdities of Germany’s Energiewende deters other member states, in particular those from Central and Eastern Europe that want to catch up with economic development. Therefore, Germany is interested in more ambitious binding climate and environmental targets in energy policy and in accelerating an Energiewende across to EU because of rising fears about increasing com‑petitive disadvantages for Germany’s industry if decarbonisation is pursued unilaterally.137 A positive side-effect of a EU-wide support policy for renewa‑
134 Economist (2014c). 135 Energieagentur NRW (2015).136 Geden and Löschel (2014).137 Ćwiek-Karpowicz et al. (2013).
The political economy of energy policy in Germany in the context of Europe 2020... 325
ble energy resources would be that qualifying Germany’s support system for renewables an undue state aid would lose its foundation.
Poland advocates on the EU level the idea of an energy union, however, mainly for security reasons in order to reduce dependence from Russian gas. This idea was triggered against the background of the Ukraine-crisis by a pro‑vocative article of Poland’s former Prime Minister and today’s President of European Council Donald Tusk in the Financial Times in April 2014.138 There he emphasized the importance of conventional domestic energy sources such as coal and shale gas as well as nuclear energy for EU’s energy supply secu‑rity and demanded a new European policy approach under the term “energy union”.139 Among others he proposed a single body charged with negotiating energy contracts with Russia and purchasing gas supplies, as a means of break‑ing Russia’s “stranglehold” over the region’s energy market. In addition he sug‑gested diverting resources to expand storage capacity and gas links among its 28 member states in case the government in Moscow shuts off supplies. Mem‑ber states should also work more closely together on energy infrastructure to guarantee the security of supplies and to improve efficiency in exploiting fossil-fuel resources. EU member states, particularly those in the east, should be allowed to exploit shale resources and coal, because for them, including Poland “coal is synonymous with energy security. No nation should be forced to extract minerals but none should be prevented from doing so – as long as it is done in a sustainable way. We need to fight for a cleaner planet but we must have safe access to energy resources and jobs to finance it.”
Germany is not principally opposed to the project of an energy union but it sees it primarily as a vehicle to implement the 2030 climate and energy targets. This was emphasized by Chancellor Angela Merkel in her government state‑ment of 19 March 2015 after the head of states of the EU member countries had agreed to foster an energy union and to accelerate the integration of national energy markets.140 The energy union shall not only take into account issues of supply security, but also energy efficiency, climate change and research and development. Some commentators hold that the March 2015 strategy “differs sharply from what Tusk suggested a year ago and his language extolling coal and shale gas has been slashed. Instead, the text says, ‘we have to move away from an economy driven by fossil fuels and shale’”.141 Likewise, the idea of joint
138 Tusk (2014).139 Fischer and Geden (2015).140 Bundesregierung Deutschland (2015).141 Oroschakoff (2015).
Jürgen Wandel 326
gas purchases features only as a voluntary option. In particular Germany and the United Kingdom had been skeptical about its compatibility with free mar‑ket principles. In addition many energy companies Western European coun‑tries like France and Germany had solid long-term contracts with Gazprom, and so neither needed nor wanted greater Commission involvement in their business dealings.142 As Ćwiek-Karpowicz et al. argue already before the March 2015 agreement these strategic business alliances, and the Nord Stream deal in 2005, set Germany and other gas-consuming countries on the continent with close ties to Gazprom apart from Poland and other new Central Eastern European Member States.143
Fischer and Geben maintain that the spectrum of objectives of an energy union on the March 2015 EU summit has been consciously held both large and rather vaguely formulated in order to make it easy for all member states to agree to it. This leaves much room for them to interpret the notion of “energy union” according to their own national preferences. Therefore, it is in fact dif‑ficult to say that the preferences of one country dominate EU energy policy. They further contend that the March 2015 agreement is actually a continuation the EU Commission’s its hitherto applied policy approach. It is characterized by promoting harmonization in small steps to foster the further integration of EU energy markets while at the same time safeguarding national preferences. And these are still fundamentally different not only between Poland and Ger‑many, but also between Germany and other member states.144 For example, like Poland Great Britain and France advocate nuclear energy as an environ‑mentally clean and reliable energy source.145 Obviously, Germany has so far not been successful to convince other member countries, including Poland, to follow its radical energy transition. Similarly, Poland did not completely succeed to convince Western European member states that security from Rus‑sia and access to affordable energy should form the central pillars of a Euro‑pean energy union.
142 For example while Poland pays one of the highest prices in Europe for Russian gas – about $ 500 per 1,000 cubic metres Germany pays only about $ 370 (Economist (2014b).
143 Ćwiek-Karpowicz et al. (2013).144 Fischer and Geben (2015).145 Welt (2015).
The political economy of energy policy in Germany in the context of Europe 2020... 327
6. Concluding remarks
Germany’s radical energy transition towards renewables pays little if any attention to what Peter Boettke, Peter T. Leeson. J. Robert Subrick and Mark Pennington call a robust political economy.146 According to this concept eco‑nomic policies are only then robust, if the proposed goals are not undermined by either the difficulties to capture the relevant information necessary for achiev‑ing the desired goals or/and by the self-interested behaviour of decision-makers gaming the system to their own advantage. As has been demonstrated Germa‑ny’s state-guided energy policy ignores both the knowledge and the incentive problem in an extreme way. Politicians and not market forces determine the future energy mix using financial incentives and coercive legal measures which actually supports the most expensive and unreliable modes of energy produc‑tion. This has in addition created large vested interests. Also Poland’s energy policy with its state-owned and state-supported inefficient coal industry lacks robustness as it, too, does not allow the free market to find out the best energy supply system for the country. Likewise, the government faces strong vested interests from the coal industry which resist reforms.
For becoming robust energy policy in both countries must make much more use of competition as a discovery procedure which at the same time reduces the incentives for rent-seeking and regulatory capture. If society agrees in the political process that it wants more environmental protection in energy genera‑tion or energy supply security then this could be achieved by referring to what Hayek called abstract rules.147 These are rules that do not prescribe certain actions (e.g. what sources and technologies to use for energy production), but merely names those actions which are not allowed. It is then left to the individ‑ual economic actors to discover innovative modes of action in a trial-and-error process on the market. In the case of Germany’s preference for a low-carbon energy production these rules would either have to forbid or make more expen‑sive the emission of CO2 in energy generation, e.g. through taxation of fossil fuel use or a CO2 emissions trading scheme.148 But it would be left to market
146 Boettke and Leeson (2004), Leeson and Subrick (2006), Pennington (2011).147 Hayek (1973). See also Wegner (2014).148 As Dawson (2012) correctly argues taxes and trading also suffer from the knowledge
problem, since both assume that the government knows the optimal quantity of carbon emissions, the quantity that equalizes the marginal social costs and benefits of using fossil fuels. He therefore pleads for a complete repeal of a public policy towards climate change.
Jürgen Wandel 328
process to find out what energy sources, technologies and forms of business organizations are most efficient to achieve this goal. Hence, in contrast to the hitherto applied constructivist approach which rests on the pretence of knowl‑edge abstract rules are the corner stone of an open innovation-friendly market process, because the individual economic actors are free to experiment with different approaches according to their own personal choices. Typically the con‑crete outcome of this trial-and error process, i.e. which energy mix will result or which technologies will be used, is unpredictable. But just precisely because the knowledge about the most efficient technology to reduce CO2‑emissions or other environmentally harmful effects is not given to any one in its totality, but is dispersed among the many individuals of society, is the use of competition to activate the knowledge so important. As has been explained a shift to such a more market-based energy policy is very difficult to implement in the fore‑seeable future not only in Germany, but also in Poland because of the massive vested interests that exist in both countries’ energy sector. As long as this is the case the energy policies of these countries are far from being success stories; in fact, “they are cautionary tales”.149
ABSTRACT
The paper analyzes the political economy of Germany’s energy policy in the context of Europe’s growth strategy “Europe 2020” and the impact on Poland. It is argued that Germany’s accelerated transition to a low-carbon energy system (the so called Energiewende) is highly ignorant of the knowledge requirements to bring about an economically efficient, affordable and environmentally friendly energy mix as well as of the severe political economic problems related to a highly intervention‑ist energy policy course. It is argued that this policy is the result of a mix of fear and of extreme rent-seeking behaviour. As a result hardly any of the desired goals of the energy trilemma have so far been achieved and due to the many vested inter‑ests profound reforms of this policy are unlikely to occur. Given the high cost and
Instead “it should be up to individuals or organisations who believed that fossil fuel use was infringing their property rights to seek redress in the courts, which should build up a body of common law and establish precedents to guide the actions of the users of fossil fuels”. Yet, taken into the realities of the political process in Germany and the preferences revealed through it as well as high transaction costs when both sources and victims are many and remote from one another, an approach based on Hayekian negative rules could be considered a second-best solution and much more in line with robustness than the exist‑ing centrally-planning energy policy (see also Dolan (2014)).
149 Loris (2015).

The political economy of energy policy in Germany in the context of Europe 2020... 329
complicated mechanisms of Germany’s Energiewende it is a questionable example for Poland to follow.
Keywords: Germany, European Union,Poland, energy policy, political economy, interventionism
References
Baader, R. (2005): Die belogene Generation, Gräfelding: Resch Verlag.Bardt, H. (2015): Potential Consequences of the Energiewende for the Manufacturing
Sector in Germany, in: International Journal of Management and Economics (forthcoming).
BDEW- Bundesverband der Energie- und Wasserwirtschaft (2015), Erneuerbare Energien und das EEG: Zahlen, Fakten, Grafiken (2015), https://www.bdew.de/internet.nsf/id-/20150511-o-energie-info-erneuerbare-energien-und-das-eeg-zahlen-fakten-grafiken-2015-de/$file/Energie-Info_Erneuerbare_Energien_und_das_EEG_2015_–11.05.2015_final.pdf.
Bell, R. G. (2011): The “Social Cost of Carbon” and Climate Change Policy. World Reso‑urces Institute, July 13, 2011, http://www.wri.org/blog/2011/07/%E2%80%9Cso‑cial-cost-carbon%E2%80%9D-and-climate-change-policy.
Boettke, Peter J. and Leeson, Peter T. (2004): Liberalism, Socialism, and Robust Poli-tical Economy, Journal of Markets & Morality, Vol. 7, 1, pp. 99–111.
Boettke, P. J.; Coyne, C. J.and Leeson, P. T. (2007): Saving government failure theory from itself: recasting political economy from an Austrian perspective, Constitutio‑nal Political Economy, Vol. 18, Issue 2, pp 127–143.
BMWi – Bundesministerium für Wirtschaft und Energie (Federal Ministry for Econo‑mic Affairs and Energy) (2014): 2014 Renewable Energy Sources Act: Plannable. Affordable. Efficient, http://www.bmwi.de/EN/Topics/Energy/Renewable-Ener‑gy/2014-renewable-energy-sources-act.html.
BMWI – Bundesministerium für Wirtschaft und Energie (2015a): Development of renewable energy sources in Germany 2014: Charts and figures based on statistical data from the Working Group on Renewable Energy-Statistics (AGEE-Stat), February 2015; http://www.erneuerbare-energien.de/EE/Redak‑tion/DE/Downloads/development-of-renewable-energy-sources-in-germany-2014.pdf?__blob=publicationFile&v=6.
BMWi – Bundesministerium für Wirtschaft und Energie (2015b): Renewable Energy at a Glance, http://www.bmwi.de/EN/Topics/Energy/Renewable-Energy/renewa‑ble‑energy‑at‑a‑glance.html.

Jürgen Wandel 330
Bundesregierung Deutschland (2010): Energiekonzept für eine umweltschonende, zuverlässige und bezahlbare Energieversorgung. Berlin: Bundesministerium für Wirtschaft und Technologie (BMWi) und Bundesministerium für Umwelt, Naturschutz und Reaktorsicherheit (BMU) 28 September 2010, http://www.bmwi.de/BMWi/Redaktion/PDF-/E/energiekonzept-2010, property=pdf,bere‑ich=bmwi2012, sprache=de,rwb=true.pdf; English: Energy Concept for an Environmentally-Friendly, Reliable, and Affordable Energy Supply, http://www.bmwi.de/English/Redaktion/Pdf/energy-concept,property-=pdf,bereich=bmwi,sprache=en,rwb=true.pdf.
Bundesregierung Deutschland (2015): EU-Energiepolitik: Europäische Energieunion, 23.03.2015, http://www.bundesregierung.de/Content/DE/Artikel/2015/03/2015––03-23-energieunion.html.
Caplan, E. and Stringham, E. (2005): Mises, Bastiat, Public Opinion, and Public Cho-ice. Review of Political Economy.Vol.17, 1 (January), pp. 79–105.
Coyne, C. J. and Moberg, L. (2014): The Political Economy of State-Provided Targeted Benefits. George Mason University Working Paper in Economics, No. 14–13. Mer‑catus Center, http://mercatus.org/sites/default/files/Coyne_TargetedBenefits_v2.pdf.
Ćwiek-Karpowicz, J.; Gawlikowska-Fyk, A. and Westphal, K. (2013): German and Polish Energy Policies: Is Cooperation Possible? Policy Paper, No. 49, January, Insti‑tute of International Affairs (PISM), https://www.pism.pl/files/?id_plik=12692.
DiLorenzo, T. (1988): Competition and Political Entrepreneurship, Austrian Insights into Public-Choice Theory, Review of Austrian Economics, Vol. 2, 1, pp 59–71, https://mises.org/sites/default/files/rae2_1_3_2.pdf.
Dolan, E. (2014): The Austrian Paradigm in Environmental Economics: Theory and Practice. Quarterly Journal of Austrian Economics, Vol. 17, 2, pp. 197–217.
Downs, A. (1964): Inside Bureaucracy; http://www.rand.org/dam/rand/pubs/papers/ 2008-/P2963.pdf.
Downs, A. (1965): A Theory of Bureaucracy, The American Economic Review, Vol. 55, 1/2, pp. 439–446.
DW – Deutsche Welle (2012): Germans and why they worry about “German Angst”, http://www.dw.com/en/germans-and-why-they-worry-about-german-angst/a-16425161.
DW – Deutsche Welle (2013): Survey finds Germans want shift to renewables, http://www.dw.com/en/survey-finds-germans-want-shift-to-renewables/a-17167037.
Economist (2012): Energiewende: Germany’s energy transformation, July 28th 2012, http://www.economist.com/node/21559667/print.
Economist (2014a): What has gone wrong with Germany's energy policy, December 14th 2014, http://www.economist.com/node/21636440/print.
Economist (2014b): Donald Tusk's energy union: Paying the price Tusk, April 29th 2014, http://www.economist.com/node/21601453/print.
Economist (2014c): Polish energy policy: A different Energiewende, February 8th 2014, http://www.economist.com/node/21595954/print.

The political economy of energy policy in Germany in the context of Europe 2020... 331
Ederer, G. (2011): Die CO2‑Theorie ist nur geniale Propaganda. Welt, 04.07.11, http://www.welt.de/debatte/kommentare/article13466483/Die-CO2-Theorie-ist-nur‑-geniale-Propaganda.html.
Energieagentur.NRW (2015): Polen beschließt ein Erneuerbare-Energien-Gesetz, http://www.energieagentur.nrw.de/polen-22349.asp.
EurActive.com (2014): EU leaders adopt 'flexible' energy and climate targets for 2030, 24.10.2014, http://www.euractiv.com/sections/eu-priorities-2020/eu-leaders-adopt-flexible-energy-and-climate-targets-2030–309462.
EurActive.com (2015): Berlin sues European Commission in dispute over renewables law, 18.02.2015, http://www.euractiv.com/sections/energy/berlin-sues-european-commission-dispute-over-renewables-law-312205?.
European Commission (2010): Europe 2020 – A Strategy for Smart, Sustainable and Inclusive Growth. COM (2010) 2020, Brussels. 3 March 2010. http://ec.europa.eu/eu2020/pdf-/COMPLET%20EN%20BARROSO%20%20%20007%20-%20Europe%202020%20-%20EN%20version.pdf.
European Commission (2013): 2020 energy strategy, http://ec.europa.eu/energy/en/energy-strategy/2020-energy-strategy.
European Commission (2014a): Communication from the Commission, A policy fra-mework for climate and energy in the period from 2020 to 2030, COM (2014) 015 final, January, Brussels.
European Commission (2014b): EU Energy in figures 2014, Statistical Pocketbook, https://ec.europa.eu/energy/sites/ener/files/documents/2014_pocketbook.pdf.
European Commission (2015): Renewable energy progress report, Press release, 16.06.2015, http://europa.eu/rapid/press-release_IP-15-5180_en.htm.
FAZ – Frankfurter Allgemeine Zeitung (2008): Sonnenenergie verbrennt Geld, 19.04.2008, http://www.faz.net/-gmp-x5iq.
FAZ – Frankfurter Allgemeine Zeitung (2009): Vor dem Gipfel: Klima-Gate, 04.12.2009, http://www.faz.net/aktuell/wissen/klima/vor-dem-gipfel-klima-gate-1896057.html.
FAZ – Frankfurter Allgemeine Zeitung (2015a): Irrsinn in Irsching, 17.03.2015, http://www.faz.net/aktuell/wirtschaft/wirtschaftspolitik/eon-kraftwerk-irsching-das-scheitern-der-energiewende-13483187.html.
FAZ – Frankfurter Allgemeine Zeitung (2015b): Koalitions-Kompromiss: Neue Ener-gie für die Energiewende? http://www.faz.net/aktuell/wirtschaft/einigung-zur-energiewende-noch-teurer-noch-komplizierter-13681824.html.
Feld, L. P.; Fuest, C.; Haucap, J.; Schweitzer, H.; Wieland, V. and Wigger, B. U. (2014): Neustart in der Energiepolitik jetzt! Kronberger Kreis 58, Stiftung Marktwirt‑schaft, Berlin, http://www.stiftung-marktwirtschaft.de/fileadmin/user_upload/KK‑-Studien/KK_58_Energiewende_2014.pdf.
Fischer, S. and Westphal, K. (2012): Erneuerbare Energien im Stromsektor: Gestaltung-soptionen in der EU, Stiftung Wissenschaft und Politik (SWP), SWP-Studie 27, http://www.swp-berlin.org/fileadmin/contents/products/studien/2012_S27_fis_wep.pdf.

Jürgen Wandel 332
Fischer, S. and Geden, O. (2014): Die Verhandlungen über die EU-Energie- und Klima-politik nach 2020 und ihr Einfluss auf die deutsche Energiewende, http://www.bpb.de/politik/wirtschaft/energiepolitik/181293/die-verhandlungen-ueber-die-eu-ener‑gie-und-klimapolitik-nach-2020-und-ihr-einfluss-auf-die-deutsche-energiewende.
Fischer, S. and Geden, O. (2015): Die Grenzen der „Energieunion“. SWP-Aktuell 36, http://www.swp-berlin.org/fileadmin/contents/products/aktuell/2015A36_fis_gdn.pdf.
FT – Financial Times (2014): The growing absurdity of German energy, November 25, 2014, http://www.ft.com/cms/s/0/01e65008-74a6-11e4-b30b-00144feabdc0.html.
Frankfurter Rundschau (2013): Die Krise der deutschen Solarindustrie, 27.05.2013, http://www.fr-online.de/wirtschaft/die-krise-der-deutschen-solarindustrie, 1472780-,14641576.html.
Frondel, M.; Ritter, N. and Schmidt, C. M. (2008): Germany's Solar Cell Pro-motion – Dark Clouds on the Horizon. Rheinisch-Westfälisches Institut für Wirtschafts‑forschung, Ruhr Economic Papers Nr. 40, http://www.rwi-essen.de/media/con‑tent/pages/publikationen-/ruhr-economic-papers/REP_08_040.pdf.
Gärtner, E. L. (2014): Klima: Suizidale Offenbarungsreligion. eigentümlich frei, 17. Juni 2014 http://ef-magazin.de/2014/06/17/5443-klima-suizidale-offenbarungsreligion.
Geden, O. and Löschel, A. (2014): Keine Wende ohne die EU: Die deutschen Klimaziele drohen zur Makulatur zu werden, Gastkommentar im Handelsblatt, 24.03.2014, p. 15, http://www.swp-berlin.org/fileadmin/contents/products/medienbeitra‑ege/Energie-wende_EU_Klima.pdf.
Grewe, H. (2009): Die Branche der erneuerbaren Energien und ihre Lobby: Eine deutsche Bestandsaufnahme, Konrad-Adenauer-Stiftung. Analysen & Argu‑mente, Ausgabe 74, Dezember, http://www.kas.de/wf/doc/kas_18465-544-1–30.pdf?091218151149.
Gwartney, J. and Wagner, R. (1988): The public choice revolution, Intercollegiate Review, 23, Spring, pp. 17–26, http://www.mmisi.org/ir/23_02/gwartney.pdf.
Handelsblatt (2014): Solarbranche verliert Hälfte aller Jobs, 28.01.2014 http://www.handelsblatt.com/unternehmen/industrie/job-krise-solarbranche-verliert-haelfte-aller-jobs/9393308.html.
Haucap, J., C. Klein und J. Kühling (2013): Die Marktintegration der Stromerzeugung aus erneuerbaren Energien: Eine ökonomische und juristische Analyse. Baden‑-Baden: Nomos.
Hayek, F. A. (1945): The Use of Knowledge in Society, The American Economic Review, Vol. 35, 4, pp. 519–530.
Hayek, F. A. (1967): The Theory of Complex Phenomena. in: Martin, M. & McIntyre, L. C. (ed., 1994). Readings in the Philosophy of Social Science, Massachusetts Institute of Technology (MIT), Cambridge, Massachusetts: MIT Press, pp. 55–70.
Hayek, F. A. (1973): Law, Legislation and Liberty, vol.1: Rules and Order, Chicago: University of Chicago Press.
The political economy of energy policy in Germany in the context of Europe 2020... 333
IEA – International Energy Agency (2013): Energy Policies of IEA Countries: 2013 Review Germany, http://www.iea.org/publications/freepublications/publica‑tion/IDR_Germany_-WEB_GER.pdf.
IEA – International Energy Agency (2014): Energy Policies of IEA Counties: Euro-pean Union, http://www.cne.es/cgi-bin/BRSCGI.exe?CMD=VEROBJ&MLKOB =833276425353.
IWR – Internationales Wirtschaftsforum Regenerative Energien (2015): EEG-Ver-gütungssätze, http://www.iwr.de/re/wf/EEG%20Verguetung.htm.
Johnston, J. S. (2010): Global Warming Advocacy Science: a Cross Exami-nation. University of Pennsylvania Institute of Law and Economics, Rese‑arch Paper No. 10–08, http://scholarship.law.upenn.edu/cgi/viewcontent.cgi?article=1314&context=faculty_scholarship.
KAS – Konrad-Adenauer-Stiftung (2011): Klimareport 2011: Politik und Wahrneh-mung, Berlin, http://www.kas.de/wf/de/33.29457/.
Kirzner, I. M. (1978): The Perils of Regulation: A Market‑Process Approach, Coral Gables, Fla.: University of Miami School of Law.
Kirzner, I. M. (1985): Capitalism and the discovery process, Chicago: University of Chicago Press.
Klodt, H. (2012): Solarförderung: Nicht kürzen, sondern streichen, Wirtschaftliche Freiheit, 5. Mai 2012, http://wirtschaftlichefreiheit.de/wordpress/?p=9131.
Knorr, A. (1997): Das ordnungspolitische Modell Neuseelands: ein Vorbild für Deutsch-land? Tübingen: Mohr Siebeck.
Koester, U. (2005): Grundzüge der landwirtschaftlichen Marktlehre, 3 rd edition, Mün‑chen: Verlag Franz Vahlen.
Krause, K.-P. (2014): Die staatliche Intervention „Energiewende“, Ludwig von Mises Institut Deutschland, http://www.misesde.org/?p=8477&print=1.
Krause, K.-P. (2015): EEG: Gaukelei mit sinkendem Strompreis. eigentümlich frei, 21.01.2015, http://ef-magazin.de/2015/01/21/6260-eeg-gaukelei-mit-sinkendem- strom‑preis.
Leeson, P. T. & Subrick, J. R. (2006): Robust political economy, Review of Austrian Economics, Vol. 19, 2–3, pp. 107–111.
Loris, N. D. (2015): Economic Freedom, Energy, and Development, in: Miller, T. & Kim, A. B. (ed.): 2015 Index of Economic Freedom. The Heritage Foundation http://www.heritage.org/index/book/chapter-5.
MacCracken, M. C. & Richardson, L. J. (2010): Challenges to Providing Quantitative Estimates of the Environmental and Societal Impacts of Global Climate Change. In Gulledge, J., Richardson, L. J. Adkins, L. & Seidel, S. (eds.): Assessing the Benefits of Avoided Climate Change: Cost-Benefit Analysis and Beyond. Proceedings of Workshop on Assessing the Benefits of Avoided Climate Change, March 16–17, 2009, Pew Center on Global Climate Change: Arlington, VA, p. 41–65, http://www.c2es.org/docUp-loads/maccracken-richardson-challenges-quantitative-estimates.pdf.
Jürgen Wandel 334
Mises, L. v. (1976/1996): A Critique of interventionism: inquiries into present day eco-nomic policy and ideology. Revised English translation of the 1976 German new edition (Kritik des Interventionismus: Untersuchengen zur Wirtschaftspolitik und Wirtschaftsideologie der Gegenwart, Stuttgart: Gustav Fischer) translated by Hans F. Sennholz, Irvington-on-Hudson, N. Y.: Foundation for Economic Edu‑cation, 1996, published by the Ludwig von Mises Institute, Auburn, Ala, https://mises.org/etexts/mises/critique/critique.pdf.
Mises, L. v. (1981/2006): Economic freedom and interventionism, Indianapolis, Liberty Fund, Inc. 2006.
Mises, L.v. (1983): Bureaucracy, Grove City, Penn.: The Libertarian Press.Mises, L.v. (1998a): Interventionism: An Economic Analysis, Irvington-on Hudson,
NY: Foundation for Economic Education.Mises, L.v. (1998b): Human Action. Auburn, AL: Mises Institute.Mitchell, W. C. (1984): Schumpeter and Public Choice, Part II: Democracy and the
Demise of Capitalism: The Missing Chapter in Schumpeter, Public Choice, Vol. 42, 2, pp. 161–74.
Moore, S. (2015): No, Being a Climate Change Skeptic Isn’t Like Fearing Vacci-nes, The Daily Signal, http://dailysignal.com/2015/03/22/no-being-a-climate- change-skeptic-isnt-like-fearing-vaccines/.
Newsletter der AHK Polen (2015): 04.02.2015, Regierung einigt sich mit Gewerk-schaften über Kohlereform, http://ahk.pl/newsletter-gosp-art/newsletter-der-ahk- polen-04022015/?no_-cache=1.
Niskanen, W. A (1971): Bureaucracy and Representative Government, Chicago & New. York: Aldine-Atherton.
Niskanen, W. A. (1994): Bureaucracy and Public Economics, The Locke Institute, Aldershot, UK and Brookfield, US: Edward Elgar.
NZZ – Neue Zürcher Zeitung (2010): 14.11.2010, Klimapolitik verteilt das Weltvermögen neu, http://www.nzz.ch/klimapolitik-verteilt-das-weltvermo‑egen-neu-1.8373227. English translation: Climate Policy Is Redistributing The World’s Wealth, http://wattsupwiththat.com/2010/11/18/ipcc-official-%‑E2%80%9Cclimate-policy-is-redistributing-the-worlds-wealth%E2%80%9D/.
Olson, M. (1965): The logic of collective action, Cambridge: Harvard University Press.Olson, M. (1982): The Rise and Decline of Nations: Economic Growth, Stagflation,
and Social Rigidities, New Haven, Conn.: Yale University Press.Olszewski; M. (2013): Die Polen und die Energiewende, Polen-Analysen, Nr. 124,
16.04.2013, http://www.laender-analysen.de/polen/pdf/PolenAnalysen124.pdf.Oroschakoff, K. (2015): Tusk’s rude awakening, Politico, 20.04.15, http://www.poli‑
tico.eu-/article/tusk-energy-union-hits-eu-reality/.Pennington, M. (2011): Robust Political Economy: Classical Liberalism and the Future
of Public Policy, Cheltenham, UK and Northampton, MA, USA: Edward Elgar.

The political economy of energy policy in Germany in the context of Europe 2020... 335
Pew Research Center (2015): Gobal Concern about Climate Change: Broad Support for Limiting Emissions, November, http://www.pewglobal.org/files/2015/11/Pew-Research-Center-Climate-Change-Report-FINAL-November-5–2015.pdf.
Rahn, R. W. (2015): Promoting Very Unsettled Science, The Cato Institute, http://www.cato.org/publications/commentary/promoting-very-unsettled-science.
Ravetz, J. (2010): Die Lehren aus Climategate, Die Weltwoche, 16.02.2010, http://www.weltwoche.ch/ausgaben/2010–07/artikel-2010–07-die-lehren-aus-climate‑gate.html.
RWI – Rheinisch-Westfälisches Institut für Wirtschaftsforschung (2009): Economic impacts from the promotion of renewable energies: The German experience. Final report, http://www.rwi-essen.de/media/content/pages/publikationen/ruhr-econo‑mic-papers/REP_09_156.pdf.
Sachverständigenrat zur Begutachtung der gesamtwirtschaftlichen Entwicklung (2014): Jahresgutachten 2014/15: Mehr Vertrauen in Marktprozesse (More confi‑dence in market processes), November 2014, Wiesbaden, http://www.sachversta‑endigenrat-wirtschaft.de/fileadmin/dateiablage/gutachten/jg201415/JG14_ges.pdf.
Sautet, F. (2006): Why Have Kiwis Not Become Tigers? Reforms, Entrepreneurship, and Economic Performance in New Zealand, The Independent Review, Vol. 10, 4, pp. 573–597, https://www.independent.org/pdf/tir/tir_10_4_04_sautet.pdf.
Scrimgeour, F. G. & Pasour Jr., E. C. (1996): A Public Choice Perspective on Agricultu-ral Policy Reform: Implications of the New Zealand Experience, American Journal of Agricultural Economics, Vol. 78, 2, pp. 257–267.
Siebert, H. (2001): Der Kobra-Effekt. Wie man Irrwege der Wirtschaftspolitik verme-idet, Stuttgart: DVA.
Spiegel Online International (2011): Umfragen: Deutsche wenden sich radikal von der Atomkraft ab, March 15, 2011, http://www.spiegel.de/panorama/umfragen-deutsche-wenden-sich-radikal-von-der-atomkraft-ab-a-750955.html.
Spiegel Online International (2013): Germany’s Energy Poverty: How Electricity Became a Luxury Good, September 4, 2013, http://www.spiegel.de/international/ germany/high-costs-and-errors-of-german-transition-to-renewable-energy- a-920288.html.
Stern, N. (2007): The economics of climate change: the stern review, Cambridge: Cam‑bridge University Press.
Traber, T., C. Kemfert und J. Diekmann (2011): Strompreise: Künftig nur noch geringe Erhöhung durch erneuerbare Energien, DIW Wochenbericht 6/2011, pp. 2–9.
Tullock, G. (1965): The Politics of Bureacracy. Washington, D. C.: Public Affairs.Tusk, D. (2014): A united Europe can end Russia’s energy stranglehold, Financial
Times, April 21 2014, http://www.ft.com/cms/s/0/91508464-c661-11e3-ba0e-00144feabdc0-.html#axzz3k6JAu6tN.
US-EIA – U. S. Energy Information Administration (2013): Poland. Country Analysis Note, http://eia.gov/countries/country-data.cfm?fips=pl (28.08.2015).
Jürgen Wandel 336
Vahlenkamp, T.; Peters, M. & Frunzetti, K. (2014): Energiewende‑Index Deutschland 2020: Aktives und glaubwürdiges Management unverzichtbar, Energiewirtscha‑ftliche Tagesfragen Vol. 64., 9, pp. 32–36.
Venjakob, M. & Mersmann, F. (2013): Dossier Klimawandel: Kosten des Klimawan-dels. Bundeszentrale für politische Bildung (bpb), 23.05.2013, http://www.bpb.de/gesellschaft/umwelt/klimawandel/38487/kosten-des-klimawandels.
Wegner, G. (2014): Hayek und die Konstruktivismusfalle: Die geplante Energie-wende, Wirtschaftliche Freiheit, 08.04.2014 http://wirtschaftlichefreiheit.de/wordpress/?p=-14656&print=1.
Welt (2011): Der große Schwindel mit der Solarenergie, 26.06.11, http://www.welt.de-/13451001.
Welt (2014): Die “German Angst“ steckt tief in unseren Genen, 29.04.14, http://www.welt.de/wissenschaft/article132728527/Die-German-Angst-steckt-tief-in-unse‑ren-Genen.html.
Welt (2015): Die kaum erfüllbare Vision von der Energie-Union, 25.02.15, http://www.welt.de/wirtschaft/energie/article137831845/Die-kaum-erfuellbare-Vision-von-der-Energie-Union.html.
Wiwo – Wirtschaftswoche (2014): Konventionelle Energie adé: E. On trennt sich von Kohle, Gas und Atomkraft, 01.12.14, http://www.wiwo.de/unterneh‑men/energie/konventionelle-energie-ade-e-on-trennt-sich-von-kohle-gas-und-atomkraft/11055760.html.
Wittman, D. A. (1995): The myth of democratic failure: Why political institutions are efficient, Chicago: University of Chicago Press.
Wojcik, D. E. & Michael. P. J. (2015): Is the Government Buying Science or Support? A Framework Analysis of Federal Funding‑induced Biases, The Cato Institute, Cato Working Paper, No. 29, http://object.cato.org/sites/cato.org/files/pubs/pdf/wor‑king-paper-29.pdf.
Wojtkowska-Łodej, G. (2015): Poland’s Energy Security after the Accession to the Euro-pean Union. In: Wojtkowska-Łodej, G. & Bąk, H. (ed.): Selected Aspects of func‑tioning of Poland in the European Union: The Balance of Ten Years of Member‑ship, Warsaw: Warsaw School of Economics Press, pp. 197–215.
ZEIT-Online (2014): Schmutziger Irrtum, 04.12.14, http://www.zeit.de/2014/50/ schmutziger-irrtum-energiewende-klimawandel.
Grażyna WOJTKOWSKA-ŁODEJ*
W KIERUNKU POPRAWY EFEKTYWNOŚCI ENERGETYCZNEJ – PRZEDSIĘWZIĘCIA UNII EUROPEJSKIEJ I ICH IMPLIKACJE
DLA POLSKI I NIEMIEC
Wprowadzenie
U progu XXI stulecia Unia Europejska stanęła wobec wielu wyzwań wynika-jących m.in. z rosnącego uzależnienia od importu nośników energii w warun-kach rosnącej niestabilności politycznej w państwach trzecich, konieczności ograniczania zmiany klimatu i przezwyciężenia kryzysu ekonomicznego. Efek-tywność energetyczna jest jednym z istotnych czynników w pokonywaniu tych wyzwań i może się przyczynić do realnej transformacji branży gospodarowa-nia energią i gospodarek państw członkowskich.
Efektywne wykorzystania energii prowadzi do mniejszego stosownie do zapotrzebowania zużycia nośników energii, zmniejszonego obciążenia śro-dowiska przyrodniczego, w tym ograniczenia zagrożeń klimatycznych, dzięki mniejszej emisji CO2. W sytuacji niedoboru energii można dzięki efektywnemu jej wykorzystaniu uzyskać maksymalne korzyści. Efektywność energetyczna jest również środkiem do łagodzenia mogących się w przyszłości pojawić niedobo-rów energii, które mogą wynikać na przykład z wyczerpywania się kopalnych źródeł energii. Stąd poprawa efektywności może być głównym instrumentem na drodze do zrównoważonego zaopatrzenia w energię.
Ponadto, efektywna energetycznie gospodarka i innowacyjne energetycz-nie rozwiązania technologicznie mogą poprawiać konkurencyjność przemysłu, wpływać na wzrost gospodarczy, tworzenie nowych miejsc pracy w sektorach
* Instytut Handlu Zagranicznego i Studiów Europejskich Kolegium Gospodarki Światowej, Szkoła Główna Handlowa w Warszawie, * e-mail: [email protected]

Grażyna Wojtkowska-Łodej 338
związanych z efektywnością energetyczną. Stąd w polityce unijnej podkreślano potrzebę zwiększenia efektywności energetycznej i podejmowano wiele starań, mających na celu stymulowanie pożądanych działań w tym zakresie. Poprawa efektywności energetycznej w procesie wytwarzania, przesyłu, dystrybucji i obrotu oraz użytkowania energii jest bowiem podstawą prowadzenia zrów-noważonej polityki energetycznej. Jej wyrazem są regulacje prawne, strategie i programy gospodarcze podejmowane na szczeblu UE i państw członkowskich.
W niniejszym opracowaniu dokonano prezentacji przedsięwzięć podejmo-wanych w Unii Europejskiej w kierunku pożądanych zmian w zakresie efektyw-ności energetycznej. Skupiono się na programach gospodarczych i regulacjach prawnych tworzonych w pierwszej dekadzie obecnego stulecia. Podjęto próbę analizy i oceny tych przedsięwzięć, w tym określenia ich wpływu na dwa pań-stwa członkowskie, a mianowicie Polskę i Niemcy. Poddano analizie imple-mentacje regulacji unijnych dotyczących efektywności energetycznej w tych państwach, dokonano analizy porównawczej pod tym względem.
W analizie wykorzystano literaturę przedmiotu, regulacje prawne dotyczące efektywności energetycznej, dane Eurostatu, IEA, oraz z bazy ODYSSEE-MURE.
1. Pojęcie efektywności energetycznej
Efektywność energetyczna jest jednym z ważnych pojęć ekonomicznych obok sprawności, skuteczności i produktywności. Przybliżając pojęcie efektywności energetycznej, należy odnieść się w pierwszej kolejności do pojęcia efektywno-ści. W literaturze ekonomicznej jest ono szeroko omówione. W wąskim zna-czeniu efektywność ekonomiczną rozumie się jako relację efektu do nakładu1. W przypadku odniesienia uzyskanego efektu do ilości wykorzystanej energii (np. w procesie produkcji, na różnych jej etapach czy w odniesieniu do poszcze-gólnych urządzeń) można użyć pojęcia efektywności energetycznej. Jest to jed-nak kategoria nie tylko związana z procesami technologicznymi, w znaczeniu jakościowym oznacza efektywne wykorzystanie energii. Efektywność energe-
1 Por. K. Roszek (2008): Skuteczność – przegląd definicji, „Zeszyty Naukowe Uniw-ersytetu Ekonomicznego w Krakowie”, nr. 71,, s. 125–133; F. Piontek (2001): Kategoria efektywności w procesie ochrony środowiska i rozwoju zrównoważonego i trwałego, „Ekono-mia i środowisko”, nr 2, s. 32–33; M. G. Patterson (1996): What is energy efficiency? – Con-cepts, indicators and methodological issues, “Energy Policy”, no. 5, s. 377–390.

W kierunku poprawy efektywności energetycznej – przedsięwzięcia Unii Europejskiej... 339
tyczna przekłada się na większą wydajność energetyczną i sprzyja oszczędza-niu energii2.
W myśl regulacji unijnych efektywność energetyczna oznacza stosunek uzy-skanych wyników, usług, towarów lub energii do wkładu energii, a jej poprawa oznacza zwiększenie efektywności energetycznej w wyniku zmian technolo-gicznych, zachowań lub zmian ekonomicznych3.
Motywy dla działań na rzecz zwiększenia efektywności energetycznej są róż-norodne i dotyczą aspektów ekonomicznych (cen i kosztów emisji, wydajno-ści w przemysłach zwłaszcza energochłonnych, rynku pracy), społecznych (oszczędności energii, dostępności do energii i przeciwdziałaniu ubóstwu ener-getycznemu, bezpieczeństwu energetycznemu) oraz środowiskowych (ogra-niczenia emisji gazów cieplarnianych, w tym CO2, lokalnego zmniejszenia zanieczyszczenia powietrza, długofalowegoo wpływu na zdrowie społeczeń-stwa) (por. rysunek 1).
Potencjał poprawy efektywności energetycznej dotyczy zarówno branży energetycznej, jak również wszystkich konsumentów energii, tj. przedsię-biorstw, instytucji i gospodarstw domowych. W procesie wytwarzania energii zwiększoną efektywność energetyczną można osiągnąć np. poprzez skojarzoną produkcję energii elektrycznej i ciepła lub poprawę sprawności bloków elek-troenergetycznych i ciepłowniczych, w procesie przesyłu i dystrybucji nato-miast poprzez zmniejszenie strat w tych sieciach.
Bilans korzyści wynikających ze zwiększania wydajności energetycznej czę-sto nie jest widoczny w krótkim okresie, a osiągnięcie zwiększonej efektywności energetycznej wymaga dużych inwestycji, które nie zawsze są ekonomicznie uzasadnione, zwłaszcza gdy np. ceny źródeł pozyskiwania energii są niskie. Jednak w długim czasie mogą one stwarzać dobre podstawy dla innowacyj-nego wzrostu gospodarczego.
2 RP-Energie-Lexikon, http://www.energie-lexikon.info/ (28.09.2015).3 Dyrektywa Parlamentu Europejskiego i Rady 2012/27/UE z dnia 25 października
2012 r. w sprawie efektywności energetycznej, zmiany dyrektyw 2009/125/WE i 2010/30/WE oraz uchylenia dyrektyw 2004/8/WE i 2006/32/WE, art. 2, pkt 3 i 4.
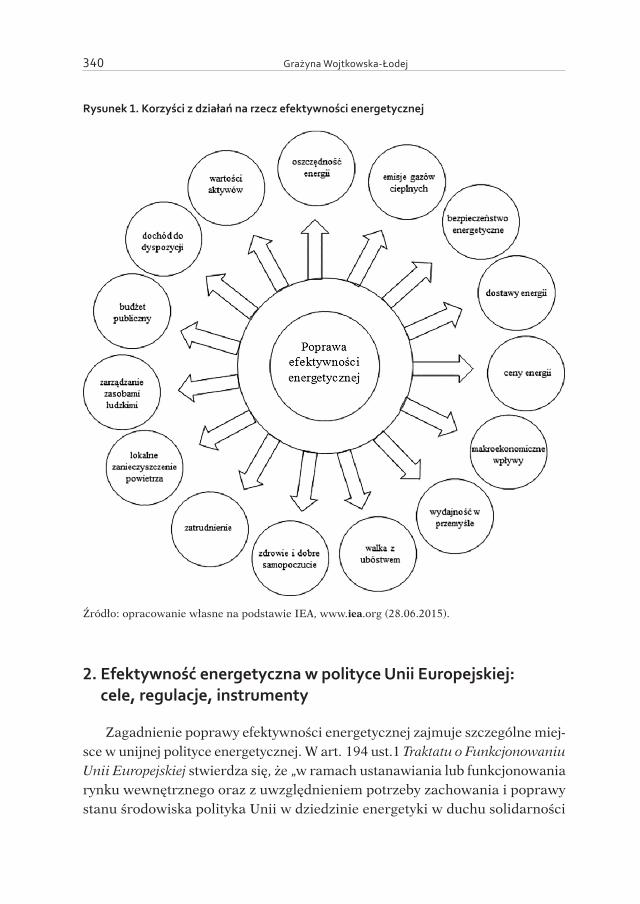
Grażyna Wojtkowska-Łodej 340
Rysunek 1. Korzyści z działań na rzecz efektywności energetycznej
Źródło: opracowanie własne na podstawie IEA, www.iea.org (28.06.2015).
2. Efektywność energetyczna w polityce Unii Europejskiej: cele, regulacje, instrumenty
Zagadnienie poprawy efektywności energetycznej zajmuje szczególne miej-sce w unijnej polityce energetycznej. W art. 194 ust.1 Traktatu o Funkcjonowaniu Unii Europejskiej stwierdza się, że „w ramach ustanawiania lub funkcjonowania rynku wewnętrznego oraz z uwzględnieniem potrzeby zachowania i poprawy stanu środowiska polityka Unii w dziedzinie energetyki w duchu solidarności
W kierunku poprawy efektywności energetycznej – przedsięwzięcia Unii Europejskiej... 341
między Państwami Członkowskimi ma na celu: zapewnienie funkcjonowania rynku energii; zapewnienie bezpieczeństwa dostaw energii w Unii; wspiera-nie efektywności energetycznej i oszczędności energii, jak również rozwoju nowych i odnawialnych form energii oraz wspieranie wzajemnych połączeń między sieciami energii”4.
W strategii rozwoju gospodarki i społeczeństwa europejskiego „Europa 2020” – obejmującej trzy powiązane ze sobą priorytety, a mianowicie: roz-wój inteligentny tj. oparty na wiedzy i innowacji, rozwój sprzyjający włącze-niu społecznemu – znalazł się postulat rozwoju zrównoważonego, polegający na wspieraniu gospodarki efektywniej korzystającej z zasobów, bardziej przy-jaznej środowisku i bardziej konkurencyjnej5.
Jednocześnie, wraz z tą strategią rozwoju, Komisja Europejska wyznaczyła w ramach każdego z priorytetów zamierzone do osiągnięcia, wymierne cele na 2020 rok. Jeśli chodzi o kwestie zrównoważonego rozwoju, określono pożą-dane i wcześniej określone w tzw. pakiecie klimatyczno-energetycznym6 wskaź-niki w zakresie gospodarowania energią i powstających efektów zewnętrznych, a mianowicie: ograniczenie o 20% emisji gazów cieplarnianych w UE w sto-sunku do poziomów z 1990 roku; zwiększenie o 20% udziału energii ze źródeł odnawialnych w zużyciu energii w UE oraz poprawa efektywności energetycz-nej w UE o 20% w stosunku do poziomów z 1990 roku.
Z myślą o osiągnięciu celów dotyczących zwiększenia efektywności ener-getycznej w strategii „Europa 2020” zaproponowano inicjatywę pt. Europa efektywnie korzystająca z zasobów. Ma ona doprowadzić do stworzenia ram strategicznych, wspierających zmiany prowadzące do przejścia na gospodarkę zasobooszczędną i niskoemisyjną, pozwalających na poprawę wyniku ekono-micznego przy jednoczesnym ograniczeniu wykorzystania zasobów, na okre-ślenie i stworzenie nowych możliwości wzrostu gospodarczego oraz większej innowacyjności i konkurencyjności UE, na zapewnienie bezpieczeństwa dostaw
4 Por. Unia Europejska (2010): Wersja skonsolidowana Traktatu o Unii Europejskiej i Trak-tatu o Funkcjonowaniu Unii Europejskiej, Karta Praw Podstawowych Unii Europejskiej, Luk-semburg, s. 134.
5 Komisja Europejska (2010): Europa 2020. Strategia na rzecz inteligentnego i zrównoważonego rozwoju sprzyjającego włączeniu społecznemu, Komunikat Komisji do Parlamentu Europejskiego, Rady, Europejskiego Komitetu Ekonomiczno-Społecznego i Komitetu Regionów KOM(2010) 2020, 3 marca, Bruksela.
6 Dwa pierwsze cele obowiązujące na poziomie krajowym realizowano za sprawą pakietu klimatyczno-energetycznego. Decyzja nr 406/2009/WE z dnia 23 kwietnia 2009 r. (Dz. U. L 140 z 5.6.2009, s. 136); Dyrektywa 20069/28/WE z dnia 23 kwietnia 2009 r. (Dz. U. L 140 z 5.6.2009, s. 16).
Grażyna Wojtkowska-Łodej 342
podstawowych zasobów, przeciwdziałanie zmianom klimatu i ograniczenie wpływu korzystania z zasobów na środowisko7.
W ramach tego projektu zaplanowano działania podejmowane przez Komi-sję Europejską na płaszczyźnie UE. Były one również skierowane do państw członkowskich i tam podejmowane.
W dokumencie zostały wymienione następujące działania, podejmowane na płaszczyźnie UE przez Komisję Europejską w celu realizacji zadań projektu dotyczącego efektywnego korzystania z zasobów8:
– korzystanie z instrumentów finansowych (np. rozwój obszarów wiejskich, fundusze strukturalne, program ramowy dotyczący działalności badawczo--rozwojowej, sieci TEN, EBI) wykorzystujących środki publiczne i prywatne UE i państw członkowskich;
– poprawienie ram prawnych stosowania instrumentów rynkowych (np. han-del emisjami, przegląd zasad opodatkowania energii, pomoc państwa, sprzyjanie szerszemu wykorzystaniu ekologicznych zamówień publicznych);
– tworzenie legislacji dotyczącej modernizacji sektora transportu; – przyspieszenie realizacji strategicznych projektów Europy; – dokończenie tworzenia wewnętrznego rynku energii oraz europejskiego
planu strategicznego w dziedzinie technologii energetycznych (plan EPSTE) i rozwój odnawialnych źródeł energii (wykorzystując fundusze strukturalne i środki z EBI);
– potrzeba unowocześnienia sieci europejskich, w tym transeuropejskich sieci energetycznych, i ich transformacji w kierunku europejskich „super sieci”, sieci inteligentnych i połączeń międzysystemowych, szczególnie połączeń miedzy siecią i odnawialnymi źródłami energii;
– przyjęcie i zrealizowanie zmienionego planu działania na rzecz racjonalizacji zużycia energii oraz propagowanie programu na rzecz efektywnego korzy-stania z zasobów (wspierając zarówno MŚP, jak i gospodarstwa domowe);
– opracowanie wizji zmian strukturalnych i technologicznych dla stworze-nia gospodarki niskoemisyjnej do roku 2050.Do działań zaś skierowanych w dokumencie do państw członkowskich
należą:
7 Komisja Europejska (2011): Europa efektywnie korzystająca z zasobów, inicjatywa prze-wodnia strategii „Europa 2020”, Komunikat Komisji do Parlamentu Europejskiego, Rady, Europejskiego Komitetu Ekonomiczno-Społecznego i Komitetu Regionów, KOM(2011) 21 wersja ostateczna, 26 stycznia, Bruksela.
8 Por. Komisja Europejska (2010): Europa 2020..., op.cit., s. 18.
W kierunku poprawy efektywności energetycznej – przedsięwzięcia Unii Europejskiej... 343
– stopniowe wycofywanie się z dotacji szkodliwych dla środowiska; – stosowanie instrumentów rynkowych, takich jak zachęty fiskalne i zamó-
wienia publiczne, w celu zmiany metod produkcji konsumpcji; – stworzenie inteligentnych zmodernizowanych w pełni wzajemnie połączo-
nych sieci infrastruktury transportowej i energetycznej.W celu dalszych działań na rzecz zmian strukturalnych i technologicznych,
istotnych dla przejścia na gospodarkę niskoemisyjną, efektywnie korzystającą z zasobów i odporną na zmiany klimatyczne, Komisja 22 stycznia 2014 roku w komunikacie pt. Ramy polityczne na okres 2020–2030 dotyczące klimatu i ener-gii9 zaproponowała nowe cele związane z energią i klimatem, które mają zostać zrealizowane do 2030 roku. Znalazły się wśród nich dalsze działania na rzecz ograniczania emisji gazów cieplarnianych (o 40% w stosunku do poziomu z 1990 roku), projektowany (obowiązujący dla całej UE) wzrost udziału ener-gii ze źródeł odnawialnych, wynoszący co najmniej 27%, oraz nowe aspiracje i wyzwania w obszarze polityki ukierunkowanej na efektywność energetyczną, zakładające jej wzrost o 27%10. Ponadto określono nowy system zarządzania i zestaw nowych wskaźników w celu zapewnienia konkurencyjnego i bezpiecz-nego systemu energii.
Dalszą ważną inicjatywą i przedsięwzięciem było podjęcie w lutym 2015 roku decyzji o utworzeniu unii energetycznej, której podstawą jest ambitna polityka klimatyczna, a celem – zapewnienie konsumentom UE bezpiecznej, zrównowa-żonej, konkurencyjnej energii w przystępnej cenie11. Opiera się ona w swych założeniach na pięciu wzajemnie powiązanych ze sobą obszarach:
– bezpieczeństwie energetycznym, solidarności i zaufaniu; – w pełni zintegrowanym europejskim rynku energii; – efektywności energetycznej, przyczyniającej się do zabezpieczenia zapo-
trzebowania na energię;
9 Komisja Europejska (2014): Ramy polityczne na okres 2020–2030 dotyczące klimatu i energii, Komunikat Komisji do Parlamentu Europejskiego, Rady, Europejskiego Komitetu Ekonomiczno-Społecznego i Komitetu Regionów, KOM(2014) 15 wersja ostateczna, 22 stycznia, Bruksela.
10 Komisja Europejska (2014): Europejska strategia bezpieczeństwa energetycznego, Komu-nikat Komisji do Parlamentu Europejskiego, Rady, Europejskiego Komitetu Ekonomiczno-Społecznego i Komitetu Regionów, KOM(2014) 330 wersja ostateczna, 28 maja, Bruksela.
11 Komisja Europejska (2015): Strategia ramowa na rzecz stabilnej unii energetycznej opartej na przyszłościowej polityce w dziedzinie klimatu, Komunikat Komisji do Parlamentu Europejskiego, Rady, Europejskiego Komitetu Ekonomiczno-Społecznego, Komitetu Regionów i Europejskiego Banku Inwestycyjnego, KOM(2015) 80 wersja ostateczna, 25 lutego, Bruksela, s. 14–16.
Grażyna Wojtkowska-Łodej 344
– dekarbonizacji gospodarki oraz badaniach naukowych, innowacjach i kon-kurencyjności.Ze względu na wymienione cele i wyzwania dotyczące wzrostu efektywności
energetycznej, w strategii ramowej na rzecz stabilnej unii energetycznej, opar-tej na przyszłościowej polityce w dziedzinie klimatu, zwiększa się konieczność gruntownej rewizji podejścia do efektywności energetycznej, potraktowania jej jako pełnoprawnego źródła energii, utożsamionego z wartością zaoszczę-dzonej energii12.
Ambitne cele wyznaczone na szczeblu UE przez Radę Europejska w paź-dzierniku 2014 roku, zakładające poprawę efektywności energetycznej co naj-mniej o 27% do roku 2030 (z możliwością jego zwiększenia po przeglądzie w 2020 roku do 30%), są wyrazem traktowania efektywności energetycznej jako dodatkowego źródła energii, wyrażającego wartość zaoszczędzonej ener-gii, i wymagają zrewidowania dotychczasowego podejścia w państwach człon-kowskich. Poprzez strategie i programy działania Komisja Europejska tworzy jedynie ramy dla reform, które winny być wdrażane na szczeblu krajowym, regionalnym i lokalnym.
Ramowym projektom i programom towarzyszą zestawy środków mających na celu podniesienie wydajności zużycia energii. Są wśród nich instrumenty o charakterze regulacyjnym, finansowym, fiskalnym, dobrowolnym lub infor-macyjnym, określone na poziomie UE i państw członkowskich.
W myśl dyrektywy dotyczącej efektywności energetycznej „mają one stwo-rzyć ramy wsparcia, wymóg lub zachętę dla uczestników rynku do oferowa-nia i nabywania usług energetycznych i do podejmowania innych środków poprawy efektywności energetycznej”13. Spośród strategicznych instrumen-tów i ich stosowanych kombinacji na uwagę zasługują podatki energetyczne, podatki od emisji CO2, systemy finansowe i zachęty podatkowe, standardy i normy podnoszące wydajność energetyczną podmiotów, urządzeń, procesów oraz etykietowanie energetyczne. Działania proefektywnościowe są skierowane do konsumentów, przedsiębiorstw, sektorów o dużym potencjale w zakresie efektywności energetycznej, zwłaszcza przemysłu, budownictwa i transportu; dotyczą też gospodarki o obiegu zamkniętym, nakierowanym na zwiększanie efektywności energii i maksymalizowanie jej oszczędzania.
Wpływ oddziaływania wybranych głównych narzędzi unijnych na realiza-cję zadań polityki efektywności energetycznej przedstawia tabela 1.
12 Komisja Europejska (2015): Pakiet dotyczący unii..., op.cit., s. 14–16.13 Por. Dyrektywa 2012/27/UE, op.cit., art. 1, pkt 18.
W kierunku poprawy efektywności energetycznej – przedsięwzięcia Unii Europejskiej... 345
Tabela 1. Główne narzędzia i cele polityki UE w zakresie efektywności energetycznej
Sektor Główne cele i regulacje Ocena wpływu
Oddziaływanie międzysektorowe
Dyrektywa dotycząca efektywności energetycznej (2012/27/UE).
Opodatkowanie produktów energetycznych i energii elektrycznej (dyrektywa 2003/96/WE).Promowanie stosowania energii ze źródeł odnawialnych (dyrektywa 2009/28/WE).
20% redukcja energii pierwotnej odpowiada zmniejszeniu o 368 Mtoe energii pierwotnej do poziomu 1,474 Mtoe w 2020 roku.
Ograniczenie emisji CO2 o 600–900 mln ton/rok do 2020 roku
Przemysł Zmieniony system handlu emisjami UE (dyrektywa 2009/29/WE).
Ograniczony wpływ z powodu nadmiernej alokacji.
Budownictwo i wyposażenie
Charakterystyka energetyczna budynków (Dyrektywa 2010/31/UE).
Dyrektywa w sprawie ekowzornictwa produktów (dyrektywa 2009/125/WE).
Dyrektywa dotycząca etykietowania produktów (dyrektywa 2010/30/UE).Rozporządzenie ustanawiające ramy etykietowania efektywności energetycznej uchylające w/w dyr. COM(2015) 341.
Etykiety efektywności energetycznej urządzeń biurowych (Energy Star).
Od 60 do 80 Mtoe/rok oszczędności energii w 2020 roku; 160–210 Mtoe/rok oszczędności CO2 w 2020 roku.
Szacunkowe roczne oszczędności energii na poziomie 376TWh (32,3 Mtoe) w 2020 roku i 150 mln ton CO2.
Oszczędności energii ok. 27 Mtoe w 2020 roku; ograniczenie emisji CO2 o 80 mln ton w 2020 roku.
Redukcja emisji 3,7 mln ton CO2. oszczędności energii rzędu 10 TWh (0,9 Mtoe) w 2015 roku.
Transport Normy emisji dla nowych samochodów osobowych (dyrektywa 443/2009/WE).
Skumulowane oszczędności 624–638 ton CO2 w okresie 2006–2020, (tj. średnioroczne zmniejszenie o 45 mln ton CO2).
Źródło: opracowanie własne na podstawie: ODYSSEE-MURE (2015): Synthesis: Energy Efficiency Trends and Policies in the EU. An Analysis Based on the ODYSSEE an MURE Databases, Intelligent Energy Europe, s. 59.
Regulacje prawne, w szczególności dyrektywa efektywności energetycz-nej (2012/27/UE), są skierowane na działania w obrębie całej gospodarki i jej sektorów, odnosząc się do podmiotów energetycznych; dotyczą także promo-wania odnawialnych źródeł energii i wszelkich działań na rzecz zwiększenia efektywności energetycznej, oszczędzania energii, zmniejszenia emisji CO2.
Na najbliższych latach w ramach projektu unii energetycznej Komisja pla-nuje podjęcie dalszych działań na rzecz wzmacniania i promowania efektyw-ności energetycznej (por. tabela 2).
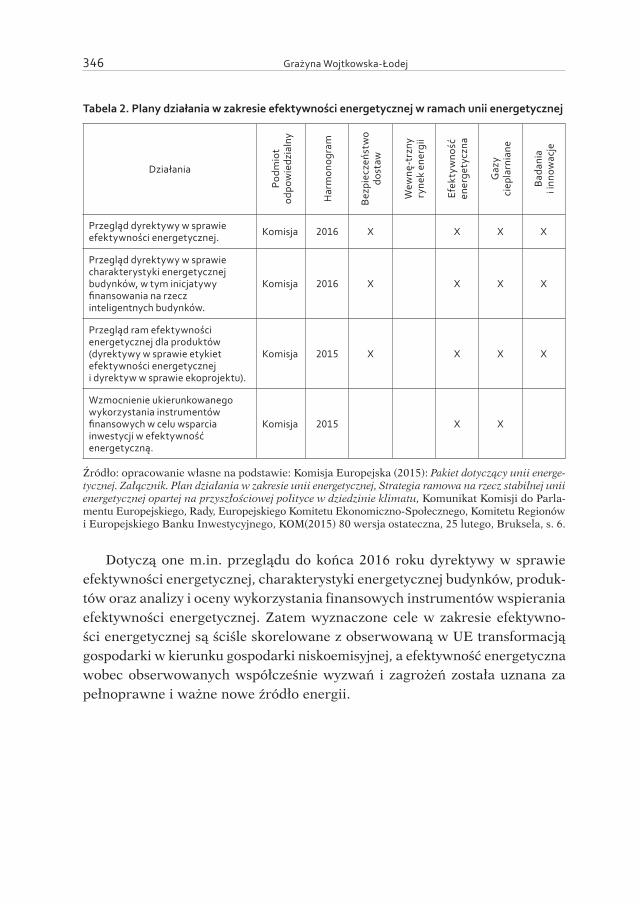
Grażyna Wojtkowska-Łodej 346
Tabela 2. Plany działania w zakresie efektywności energetycznej w ramach unii energetycznej
Działania
Podm
iot
odpo
wie
dzia
lny
Har
mon
ogra
m
Bez
piec
zeńs
two
dost
aw
Wew
nę-t
rzny
ry
nek
ener
gii
Efek
tyw
ność
en
erge
tycz
na
Gaz
y ci
epla
rnia
ne
Bad
ania
i i
nnow
acje
Przegląd dyrektywy w sprawie efektywności energetycznej. Komisja 2016 X X X X
Przegląd dyrektywy w sprawie charakterystyki energetycznej budynków, w tym inicjatywy finansowania na rzecz inteligentnych budynków.
Komisja 2016 X X X X
Przegląd ram efektywności energetycznej dla produktów (dyrektywy w sprawie etykiet efektywności energetycznej i dyrektyw w sprawie ekoprojektu).
Komisja 2015 X X X X
Wzmocnienie ukierunkowanego wykorzystania instrumentów finansowych w celu wsparcia inwestycji w efektywność energetyczną.
Komisja 2015 X X
Źródło: opracowanie własne na podstawie: Komisja Europejska (2015): Pakiet dotyczący unii energe-tycznej. Załącznik. Plan działania w zakresie unii energetycznej, Strategia ramowa na rzecz stabilnej unii energetycznej opartej na przyszłościowej polityce w dziedzinie klimatu, Komunikat Komisji do Parla-mentu Europejskiego, Rady, Europejskiego Komitetu Ekonomiczno-Społecznego, Komitetu Regionów i Europejskiego Banku Inwestycyjnego, KOM(2015) 80 wersja ostateczna, 25 lutego, Bruksela, s. 6.
Dotyczą one m.in. przeglądu do końca 2016 roku dyrektywy w sprawie efektywności energetycznej, charakterystyki energetycznej budynków, produk-tów oraz analizy i oceny wykorzystania finansowych instrumentów wspierania efektywności energetycznej. Zatem wyznaczone cele w zakresie efektywno-ści energetycznej są ściśle skorelowane z obserwowaną w UE transformacją gospodarki w kierunku gospodarki niskoemisyjnej, a efektywność energetyczna wobec obserwowanych współcześnie wyzwań i zagrożeń została uznana za pełnoprawne i ważne nowe źródło energii.

W kierunku poprawy efektywności energetycznej – przedsięwzięcia Unii Europejskiej... 347
3. Polityka efektywności energetycznej i działania na rzecz jej poprawy w Polsce i Niemczech: możliwości współdziałania polsko-niemieckiego
Ważność problematyki efektywności energetycznej wyrażona w unijnej strategii „Europa 2020”, w komunikacie Efektywność energetyczna i jej wkład w bezpieczeństwo energetyczne a ramy polityczne dotyczące klimatu i energii do roku 2030 (KOM/2014/520) oraz w projekcie unii energetycznej (KOM/2015/80) i stworzenie ram instytucjonalnych dla ich realizacji oznaczało, że większość prac w zakresie osiągnięcia celów efektywnościowych musi być wykonana na szczeblu państw członkowskich.
Dyrektywa w sprawie efektywności energetycznej (2012/27/UE) wskazuje na potrzebę tworzenia nowych polityk efektywności energetycznych w pań-stwach członkowskich14, Krajowych Planów Działania dotyczących efektywności energetycznej; nakłada zobowiązania dotyczące oszczędności energii oraz sto-sowania środków jej wspierania, prowadzenia audytów energetycznych i wpro-wadzania systemów zarządzania energią oraz nowych systemów certyfikacji.
Krajowe programy efektywności zawierają działania o zasięgu horyzontal-nym, tj. odnoszące się do całej gospodarki oraz do sektorów przemysłu, trans-portu, usług oraz gospodarstw domowych. Z danych zawartych w tabeli 3 wynika, że w Niemczech w porównaniu z Polską jest podejmowanych zdecy-dowanie więcej działań zarówno skierowanych do całej gospodarki, jak i do sektorów i gospodarstw domowych. Są one w głównej mierze skierowane do małych i średnich przedsiębiorstw (MSP), bywspierać efektywności i odna-wialne źródła energii15.
Tabela 3. Zestawienie liczby działań na rzecz poprawy efektywności energetycznej w Polsce i Niemczech (stan na 10 czerwca 2015 roku)
Państwo Działania horyzontalne Przemysł Transport Usługi Gospodarstwa
domowe Razem
PolskaNiemcy
827
938
1219
1134
539
45157
Źródło: opracowanie własne na podstawie: GUS (2015): Efektywność wykorzystania energii w latach 2003–2013, Informacje i opracowania statystyczne, Warszawa, s. 45.
14 Dyrektywa ta stanowi kontynuację działań w zakresie efektywności energetycznej regulowanych dyrektywami: 2004/8/WE; 2006/32/WE; 2009/125/WE, 2010/30/WE.
15 Por. ODYSSEE-MURE (2015): Synthesis: Energy Efficiency…, op.cit., s. 85.
Grażyna Wojtkowska-Łodej 348
Głównymi instytucjami odpowiedzialnymi za politykę energetyczną, w tym efektywność energetyczną, w Polsce są Ministerstwo Gospodarki, Ministerstwo Środowiska, Narodowy Fundusz Ochrony Środowiska i Gospodarki Wodnej (NFOŚiGW) (i oddziały terenowe), Krajowa Agencja Poszanowania Energii (KAPE S. A.). W Niemczech natomiast są to Ministerstwo Gospodarki Techno-logii, Niemiecka Agencja Energetyczna (DENA), Grupa Bankowa (Kreditan-stalt für Wiederaufbau – KfW). W obu krajach działa także wiele organizacji, stowarzyszeń i instytucji mających na celu informowanie i edukowanie społe-czeństwa w zakresie racjonalnego i oszczędnego wykorzystania energii.
Wśród priorytetowych kierunków działań w obowiązujących w obu krajach politykach energetycznych znajduje się poprawa efektywności energetycznej (por. tabela 4). W Polsce – obok wzrostu bezpieczeństwa dostaw paliw i energii, dywersyfikacji struktury wytwarzania energii elektrycznej poprzez wprowa-dzenie energetyki jądrowej, rozwoju wykorzystania OZE, rozwoju konkuren-cyjnych rynków paliw i energii oraz ograniczenia oddziaływania energetyki na środowisko – na pierwszym miejscu znajduje się efektywność energetyczna. W polityce energetycznej Niemiec, zakładającej istotne zmiany i jej transfor-mację (Energiewende), efektywność energetyczna oraz ograniczanie energo-chłonności gospodarki jest – obok ochrony środowiska naturalnego, rozwoju OZE oraz bezpieczeństwa zasobów energetycznych – istotnym priorytetem.
Obok programowania działań na rzecz efektywności energetycznej, uję-tych w Krajowych Planach Działania (przyjętych na lata: 2007, 2011, 2014), oraz regulacji ustawowych dotyczących funkcjonowania gospodarki energe-tycznej w obu państwach są ustawowo uregulowane kwestie bezpośrednio związane z efektywnością energetyczną, etykietowaniem zużywających ener-gię i wspieraniem wykorzystania OZE. Regulacjom tym towarzyszą wprowa-dzane narzędzia o charakterze obligatoryjnym, elastycznym lub dobrowolnym. W aktualnie obowiązujących Krajowych Planach Działania zostały określone cele dotyczące ograniczenia zużycia energii pierwotnej, działania na rzecz wzmacniania istniejących środków w zakresie efektywności budynków, opo-datkowania, doradztwa, wsparcia dla inwestycji oraz potrzebnych działań na rzecz informowania i edukacji w odniesieniu do zwiększania efektywno-ści energetycznej.
W kierunku poprawy efektywności energetycznej – przedsięwzięcia Unii Europejskiej... 349
Tabela 4. Polityka efektywności energetycznej w Polsce i Niemczech
Polska Niemcy
• Polityka energetyczna do 2030 roku.• Krajowe Plany Działań dotyczące
efektywności energetycznej (lata 2007, 2013, 2014).
Główne regulacje prawne:• Ustawa Prawo energetyczne ze
zmianami w 2007 roku, w 2010 roku.• Ustawa o efektywności energetycznej
z 2011 roku.• Ustawa o efektywności produktów
związanych z energią (2012).
Instrumenty obligatoryjne:• Raporty i sprawozdania.• Rozwój badan statystycznych.• Obowiązek rozliczania oszczędności
energii.
Instrumenty elastyczne:• Białe certyfikaty.• Wsparcie dla przedsiębiorstw.• Audyt energetyczny.• Program priorytetowy „Inteligentne
sieci energetyczne”.• Program operacyjny „Infrastruktura
i środowisko 2014–2020”.• Przetargi na przedsiębiorstwa
energooszczędne.• Kampanie informacyjno-edukacyjne.
Instrumenty dobrowolne:• Audyt aktywności energetycznej.• Ubieganie się o przydział świadectw
efektywności energetycznej i ich zamiana na białe certyfikaty.
Inne:• Środki w zakresie efektywności
energetycznej budynków i w instytucjach publicznych.
• Środki efektywności energetycznej w przemyśle i MSP.
• Środki efektywności energetycznej w transporcie.
• Nowa strategia energetyczna Niemiec do 2050 roku (Energiewende).
• Krajowe Plany Działań dotyczące efektywności energetycznej (2007, 2012, 2014).
Główne regulacje prawne:• Regulacja dotycząca oszczędzania energii
(Energieeinsparverordnung – EnEV), zmiany w latach 2007 i 2009.
• Ustawa o wspieraniu produkcji z wysokosprawnej kogeneracji (KWKG) – 2002; zmiany w latach 2009 i 2013.
• Ustawa o kosztach ogrzewania (Heizkosten V ) 1981; zmiana w 2009 roku.
• Ustawa o odnawialnych źródłach energii (EEG) – rok 2000; zmieniona w 2009 roku.
• Ustawa o energii odnawialnej i cieple (EEWärmeG) – 2009 rok.
Instrumenty obligatoryjne:• Certyfikaty energetyczne budynków (Energy Performance Certificates – EPC).
• Podatek od ruchu powietrznego.• Ekologiczna reforma podatkowa (Eco-tax) – stopniowe
wprowadzanie obciążeń podatkowych na produkty energetyczne (od 1999 roku).
• Podatek od nowych samochodów – od lipca 2009 roku nowo rejestrowane samochody podlegają opodatkowaniu, które różni się od pojemności skokowej silnika i emisji CO2.
• Promocja i ułatwienia dla odbioru energii z kogeneracji
Instrumenty elastyczne:• Wsparcie produkcji w jednostkach wysokosprawnej
kogeneracji.• Wsparcie programów proefektywnościowych
i środowiskowych.
Instrumenty dobrowolne:• Wsparcie finansowe dla inwestycji w urządzenia
i technologie międzysektorowe (cross-subsidy)• Bonus Środowiskowy – jednorazowa dotacja związana
z wykluczeniem z użycia starych wysokoemisyjnych pojazdów.
• Pożyczki na inwestycje w energooszczędne budownictwo – KfW Grupa Bankowa.
• Fundusz wsparcia mikrogeneracji (o mocy zainstalowanej poniżej 20 kW).
• Akcje informacyjne zwiększające świadomość społeczną.• Inicjatywa zachęcajaca MSP do transformacji
energetycznej (Mittelstands-initative Energiewende).• Dobrowolne porozumienia/zobowiązania (dobrowolne
zobowiązanie przedstawicieli przemysłu wobec organów administracji rządowej).
Źródło: opracowanie własne, por. Z. Parczewski (2014): Efektywność energetyczna w wybranych kra-jach UE, USA oraz w Polsce (trendy zmian, mechanizmy i instrumenty polityki), Instytut Energetyki – Instytut Badawczy, Warszawa, s. 162–178; GUS (2015): Efektywność wykorzystania energii w latach 2003–2013, Informacje i opracowania statystyczne, Warszawa, s. 49–58.
Grażyna Wojtkowska-Łodej 350
Jeśli chodzi o transpozycję na grunt prawa krajowego regulacji unijnych, to proces ten przebiega w wolnym tempie. Dla przykładu, jeśli chodzi o dyrek-tywę w sprawie charakterystyki energetycznej budynków w Niemczech, trans-pozycja była zadeklarowana i zakończona, w Polsce natomiast jej przyjęcie na grunt prawa krajowego jest w toku (według stanu na 22 lipca 2015)16. Mimo zróżnicowanego tempa przejmowania regulacji unijnych na grunt prawa krajo-wego zarówno w Polsce, jak i Niemczech podejmowano wiele działań na rzecz wzrostu efektywności energetycznej.
W okresie 2000–2007 i w Polsce, i w Niemczech obserwowano występującą zależność między zapotrzebowaniem na energię a wzrostem gospodarczym. W Niemczech jednak można było obserwować znaczne rozluźnienie zależno-ści między konsumpcją energii pierwotną a dynamiką PKB. W okresie tym możliwy był wzrost gospodarczy ok. 1,5% na rok przy ujemnym zapotrzebo-waniem na energię (ok. –0,2% na rok)17. W tym samym okresie w Polsce śred-nioroczna dynamika PKB wynosiła ok. 4%, towarzyszył jej wzrost konsumpcji energii średniorocznie ok. 1%.
Od 2007–2013 roku zużycie energii pierwotnej uległo zmniejszeniu i wynosiło w Polsce ok. –0,1% i ok. –0,3% na rok w Niemczech. Jednak w analizowanym okresie wzrost gospodarczy w Polsce wyniósł ok. 3% rocznie, a w Niemczech ok. 0,7–0,8%, co oznaczało znaczne zmniejszenie w Polsce energochłonności PKB. Zatem energochłonność PKB w Polsce jest nadal wyższa niż w Niem-czech, mimo że w Polsce obserwuje się większą niż Niemiec dynamikę jej zmniejszania. Według danych GUS w okresie 1996–2013 energochłonność polskiej gospodarki zmniejszyła się o 51% (por. rysunek 2)18.
Poprawa efektywności energetycznej w Polsce od 2000 roku wyniosła śred-niorocznie powyżej 2% wobec wzrostu ok. 1,4% w Niemczech. Polska więc należała z tego względu do czołówki państw UE, obok Węgier, Słowacji, Łotwy, Irlandii i Bułgarii19. Szczególnie wysoki w polskim przemyśle w porównaniu z przemysłem niemieckim był trend spadku konsumpcji energii pierwotnej (rysunek 3).
16 Por. Komisja Europejska (2014): Efektywność energetyczna i jej wkład w bezpieczeń-stwo energetyczne a ramy polityczne dotyczące klimatu i energii do roku 2030, KOM(2014) 520 wersja ostateczna, 23 lipca, Bruksela, załączniki 1–3, s. 1–2.
17 Por. ODYSSEE-MURE (2015): Synthesis: Energy Efficiency…, op.cit., s.. 7–8.18 Por. GUS (2015): Energia, http://www.stat.gov.pl (28.06.2015).19 Por. ODYSSEE-MURE (2015): Synthesis: Energy Efficiency…, op.cit., s. 12.

W kierunku poprawy efektywności energetycznej – przedsięwzięcia Unii Europejskiej... 351
Rysunek 2. Energochłonność gospodarek państw UE 2002 i 2012, kgtoe/1000 EUR PKB
Rysunek 3. Trend w efektywności energetycznej przemysłu w UE (%/rok)
Źródło: ODYSSEE-MURE (2015): Synthesis: Energy Efficiency Trends and Policies in the EU, An Analysis Based on the ODYSSEE and MURE Databases, s. 25.
W strukturze finalnego zużycia energii obok przemysłu wyróżnia się gospo-darstwa domowe, transport, usługi oraz rolnictwo. Gospodarstwa domowe w Polsce zużywały ok. 33% energii finalnej20 i osiągnęły na początku 2000 roku znaczące oszczędności energii, jednakw okresie do 2012 roku dynamika zmian
20 Por. GUS (2015): Efektywność wykorzystania energii…, op.cit., s. 22.

Grażyna Wojtkowska-Łodej 352
w tym zakresie osłabła nie tylko w porównaniu ze średnim poziomem w UE, ale także – w Niemczech (rysunek 4).
Rysunek 4. Efektywność energetyczna w sektorze gospodarstw domowych w UE
Źródło: ODYSSEE-MURE (2015): Synthesis: Energy Efficiency Trends and Policies in the EU, An Analysis Based on the ODYSSEE and MURE Databases, s. 47.
Podejmując próbę analizy i oceny działań na rzecz efektywności energe-tycznej w Unii Europejskiej ze szczególnym uwzględnieniem przypadku Polski i Niemiec, na uwagę zasługuje to, że z uwagi na różnice w poziomie rozwoju gospodarczego, strukturę gospodarek, znaczenie w nich przemysłu, wskaźnik energochłonności PKB w 2012 roku w Polsce wyniósł0,0964 (kg/€ 2005/ppp2005), a w Niemczech – 0,0884 (kg/€ 2005/ppp2005). Jednak wskaźnik ODEX (obej-mujący roczny wzrost efektywności energetycznej w okresie 2000–2012) w Pol-sce był ponad dwukrotnie wyższy niż w Niemczech i wynosił 2,79% wobec 1,04% (tabela 4).
W ocenie ekspertów ODYSSEE-MURE wyższa pozycja Niemiec w rankingu oceniającym wpływ polityki dotyczącej efektywności energetycznej daje więk-sze możliwości realizacji założonych celów krajowych. Niemcy ze swoją poli-tyką w ramach tzw. Energiewende znajdują się w rankingu na trzecim miejscu w UE (53 pkt), Polska natomiast na 28 miejscu (15 pkt).
Zatem dla osiągania zaplanowanych celów w zakresie efektywności ener-getycznej w Polsce i Niemczech są i nadal będą istotne dobre programy działa-nia dostosowane do potrzeb gospodarek, stosowne instrumenty oddziaływania oraz konsekwencja w realizacji zaplanowanych celów.
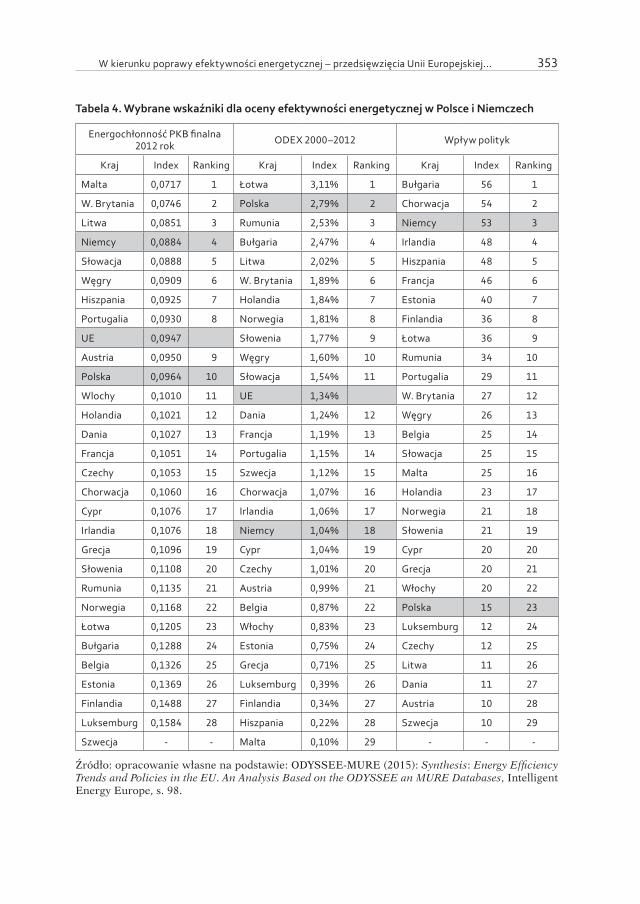
W kierunku poprawy efektywności energetycznej – przedsięwzięcia Unii Europejskiej... 353
Tabela 4. Wybrane wskaźniki dla oceny efektywności energetycznej w Polsce i Niemczech
Energochłonność PKB finalna 2012 rok ODEX 2000–2012 Wpływ polityk
Kraj Index Ranking Kraj Index Ranking Kraj Index Ranking
Malta 0,0717 1 Łotwa 3,11% 1 Bułgaria 56 1
W. Brytania 0,0746 2 Polska 2,79% 2 Chorwacja 54 2
Litwa 0,0851 3 Rumunia 2,53% 3 Niemcy 53 3
Niemcy 0,0884 4 Bułgaria 2,47% 4 Irlandia 48 4
Słowacja 0,0888 5 Litwa 2,02% 5 Hiszpania 48 5
Węgry 0,0909 6 W. Brytania 1,89% 6 Francja 46 6
Hiszpania 0,0925 7 Holandia 1,84% 7 Estonia 40 7
Portugalia 0,0930 8 Norwegia 1,81% 8 Finlandia 36 8
UE 0,0947 Słowenia 1,77% 9 Łotwa 36 9
Austria 0,0950 9 Węgry 1,60% 10 Rumunia 34 10
Polska 0,0964 10 Słowacja 1,54% 11 Portugalia 29 11
Wlochy 0,1010 11 UE 1,34% W. Brytania 27 12
Holandia 0,1021 12 Dania 1,24% 12 Węgry 26 13
Dania 0,1027 13 Francja 1,19% 13 Belgia 25 14
Francja 0,1051 14 Portugalia 1,15% 14 Słowacja 25 15
Czechy 0,1053 15 Szwecja 1,12% 15 Malta 25 16
Chorwacja 0,1060 16 Chorwacja 1,07% 16 Holandia 23 17
Cypr 0,1076 17 Irlandia 1,06% 17 Norwegia 21 18
Irlandia 0,1076 18 Niemcy 1,04% 18 Słowenia 21 19
Grecja 0,1096 19 Cypr 1,04% 19 Cypr 20 20
Słowenia 0,1108 20 Czechy 1,01% 20 Grecja 20 21
Rumunia 0,1135 21 Austria 0,99% 21 Włochy 20 22
Norwegia 0,1168 22 Belgia 0,87% 22 Polska 15 23
Łotwa 0,1205 23 Włochy 0,83% 23 Luksemburg 12 24
Bułgaria 0,1288 24 Estonia 0,75% 24 Czechy 12 25
Belgia 0,1326 25 Grecja 0,71% 25 Litwa 11 26
Estonia 0,1369 26 Luksemburg 0,39% 26 Dania 11 27
Finlandia 0,1488 27 Finlandia 0,34% 27 Austria 10 28
Luksemburg 0,1584 28 Hiszpania 0,22% 28 Szwecja 10 29
Szwecja - - Malta 0,10% 29 - - -
Źródło: opracowanie własne na podstawie: ODYSSEE-MURE (2015): Synthesis: Energy Efficiency Trends and Policies in the EU. An Analysis Based on the ODYSSEE an MURE Databases, Intelligent Energy Europe, s. 98.
Grażyna Wojtkowska-Łodej 354
Podsumowanie
Efektywność energetyczna w świetle ustaleń programowych i regulacji unijnych staje się ważnym dodatkowym źródłem energii, wyrażającym wartość zaoszczędzonej energii. Znajduje to wyraz w kształtowanej polityce dotyczącej efektywności energetycznej w Unii Europejskiej w ramach długookresowej stra-tegii rozwoju gospodarczego „Europa 2020”, tworzonej polityki energetyczno--klimatycznej oraz w podjętej próbie budowy w perspektywie do 2050 roku europejskiej gospodarki niskoemisyjnej.
Poprzez stwarzane strategie i programy działania Komisja Europejska tworzy ramy dla stosownych działań i reform, które powinny być wdrażane na szczeblu państw członkowskich, na poziomie regionalnym i lokalnym. Jed-nocześnie kieruje do państw członkowskich wiele instrumentów, które wska-zując kierunek pożądanych zmian, wspomagają je w działaniach na szczeblu krajowym. Instrumenty finansowe (w szczególności środki z funduszy struk-turalnych) i instrumenty podatkowe odgrywają kluczową rolę w ograniczaniu barier ekonomicznych, zwłaszcza braku kapitału i kosztów transakcyjnych. Instrumenty regulacyjne mogą także pośrednio podnieść priorytet dla inwe-stycji w zakresie efektywności energetycznej.
Na uwagę zasługują wzrost efektywności energetycznej w polskiej gospo-darce w analizowanym okresie i obserwowana – większa niż w Niemczech – jej dynamika. Jednak dla dalszego zwiększania efektywności energetycz-nej nadal istotne będzie zwiększanie wiedzy i zwalczanie deficytu informacji w tym względzie.
KURZZUSAMMENFASSUNG
Der Beitrag präsentiert von der EU unternommene Schritte in Richtung des im Bereich Energieeffizienz gewünschten Wandels. Er konzentriert sich auf Wirtschafts-programme und Rechtsregelungen aus der 2000er Jahresdekade. Es erfolgt ein Ver-such der Analyse und eine Bewertung der Schritte im Hinblick auf ihren Einfluss auf die zwei Mitgliedsländer Polen und Deutschland. Die Implementierung der EU-Regu-lierungen der Energieeffizienz in beiden Ländern wird einer komparativen Analyse unterzogen. Als Quellen werden Fachliteratur, Rechtsregelungen zur Energieeffizi-enz, Daten von Eurostat, der IEA und der Datenbasis ODYSSEE-MURE verwendet.
Schlüsselworte: Energieeffizienz, Energiesparen, Energiepolitik
W kierunku poprawy efektywności energetycznej – przedsięwzięcia Unii Europejskiej... 355
Bibliografia
Decyzja nr 406/2009/WE z dnia 23 kwietnia 2009 r. (Dz. U. L 140 z 5.6.2009).Dyrektywa Parlamentu Europejskiego i Rady 2012/27/UE z dnia 25 października
2012 r. w sprawie efektywności energetycznej, zmiany dyrektyw 2009/125/WE i 2010/30/WE oraz uchylenia dyrektyw 2004/8/WE i 2006/32/WE.
Dyrektywa 2006/28/WE z dnia 23 kwietnia 2009 r. (Dz. U. L 140 z 5.6.2009).GUS (2015): Efektywność wykorzystania energii w latach 2003–2013, Informacje
i opracowania statystyczne, Warszawa.GUS (2015): Energia, http://www.stat.gov.pl (28.06.2015).IEA, www.iea.orgKomisja Europejska (2010): Europa 2020. Strategia na rzecz inteligentnego i zrówno-
ważonego rozwoju sprzyjającego włączeniu społecznemu, Komunikat Komisji do Parlamentu Europejskiego, Rady, Europejskiego Komitetu Ekonomiczno-Spo-łecznego i Komitetu Regionów KOM(2010) 2020, 3 marca, Bruksela.
Komisja Europejska (2011): Europa efektywnie korzystająca z zasobów, inicjatywa przewodnia strategii „Europa 2020”, Komunikat Komisji do Parlamentu Euro-pejskiego, Rady, Europejskiego Komitetu Ekonomiczno-Społecznego i Komitetu Regionów, KOM(2011) 21 wersja ostateczna, 26 stycznia, Bruksela.
Komisja Europejska (2014): Efektywność energetyczna i jej wkład w bezpieczeństwo energetyczne a ramy polityczne dotyczące klimatu i energii do roku 2030, Komuni-kat Komisji do Parlamentu Europejskiego, Rady, Europejskiego Komitetu Ekono-miczno-Społecznego i Komitetu Regionów, KOM(2014) 520 wersja ostateczna, 23 lipca, Bruksela.
Komisja Europejska (2014): Europejska strategia bezpieczeństwa energetycznego, Komunikat Komisji do Parlamentu Europejskiego, Rady, Europejskiego Komi-tetu Ekonomiczno-Społecznego i Komitetu Regionów, KOM(2014) 330 wersja ostateczna, 28 maja, Bruksela.
Komisja Europejska (2014): Ramy polityczne na okres 2020–2030 dotyczące klimatu i energii, Komunikat Komisji do Parlamentu Europejskiego, Rady, Europejskiego Komitetu Ekonomiczno-Społecznego i Komitetu Regionów, KOM(2014) 15 wer-sja ostateczna, 22 stycznia, Bruksela.
Komisja Europejska (2015): Pakiet dotyczący unii energetycznej. Załącznik. Plan dzia-łania w zakresie unii energetycznej oraz Strategia ramowa na rzecz stabilnej unii energetycznej opartej na przyszłościowej polityce w dziedzinie klimatu, Komuni-kat Komisji do Parlamentu Europejskiego, Rady, Europejskiego Komitetu Eko-nomiczno-Społecznego, Komitetu Regionów i Europejskiego Banku Inwestycyj-nego, KOM(2015) 80 wersja ostateczna, 25 luty, Bruksela.

Grażyna Wojtkowska-Łodej 356
ODYSSEE-MURE (2015): Synthesis: Energy Efficiency Trends and Policies in the EU. An Analysis Based on the ODYSSEE an MURE Databases, Intelligent Energy Europe.
Parczewski Z. (2014): Efektywność energetyczna w wybranych krajach UE, USA oraz w Polsce (trendy zmian, mechanizmy i instrumenty polityki), Instytut Energetyki – Instytut Badawczy, Warszawa.
Patterson, M. G (1996): What is energy efficiency? – Concepts, indicators and metho-dological issues, “Energy Policy”, no. 5.
Piontek F. (2001): Kategoria efektywności w procesie ochrony środowiska i rozwoju zrównoważonego i trwałego, „Ekonomia i środowisko”, nr 2.
Roszek K. (2008): Skuteczność – przegląd definicji, „Zeszyty Naukowe Uniwersytetu Ekonomicznego w Krakowie”, nr. 71.
RP-Energie-Lexikon, http://www.energie-lexikon.info/ (28.06.2015).Unia Europejska (2010): Wersja skonsolidowana Traktatu o Unii Europejskiej i Trak-
tatu o Funkcjonowaniu Unii Europejskiej, Karta Praw Podstawowych Unii Euro-pejskiej, Luksemburg.
Tomasz BAKOŃ*
REPOWERING JAKO METODA POPRAWY EFEKTYWNOŚCI ENERGETYCZNEJ ODNAWIALNYCH ŹRÓDEŁ ENERGII
W NIEMCZECH I POLSCE
Wprowadzenie
W energetyce odnawialnej trwa ciągły postęp technologiczny. Nowe urzą-dzenia OZE posiadają większą moc znamionową, wyższą sprawność, niższe koszty eksploatacyjne oraz w większym stopniu spełniają wymagania doty-czące przyłączenia do sieci elektroenergetycznej, stawiane konwencjonalnym źródłom energii1. W Polsce repowering (zamiany starych urządzeń na nowe) dotyczy głównie konwencjonalnych źródeł energii i w niewielkim stopniu energetyki wiatrowej2. W Europie Zachodniej jest zjawiskiem powszechniej-szym i mocno wspieranym przez rządy poszczególnych krajów. Repowering stosowany na dużą skalę może mieć istotne znaczenie dla poprawy efektyw-ności energetycznej zarówno Polsce, jak i w Niemczech, przyczyniając się do realizacji przez Unię Europejską, a zatem i jej państwa członkowskie, polityki energetycznej przewidzianej w traktacie lizbońskim, a zwłaszcza wspierania efektywności energetycznej i oszczędności energii, jak również rozwoju nowych i odnawialnych form energii oraz zapewnienia bezpieczeństwa dostaw energii. W tabeli 1 zestawiono aktualne dane dotyczące elektrowni wiatrowych i foto-woltaicznych w Polsce i w Niemczech.
* Szkoła Główna Gospodarstwa Wiejskiego w Warszawie, Wydział Inżynierii Produkcji, Zakład Gospodarki Energetycznej, * e-mail: [email protected], [email protected]
1 CIGRE Brochure 450 (2011): Grid Integration of Wind Generation, ISBN 9782858731398, CIGRE.
2 DStGB (2009): Dokumentation N 94: Repowering von Windenergieanlagen – Kommu-nale Handlungsmöglichkeiten, Deutscher Städte- und Gemeindebund 9/2009, www.dstgb.de

Tomasz Bakoń 358
Tabela 1. Liczba instalacji i moc zainstalowana w Polsce i w Niemczech
Elektrownie wiatrowe
Polska (30.06.2015)
Elektrownie fotowoltaiczne
Polska (30.06.2015)
Elektrownie wiatroweNiemcy
(31.12.2014)
Elektrownie fotowoltaiczne
Niemcy (28.02.2015)
Liczba instalacji 981 193 24 867 ok. 28 7000
Moc zainstalowana 4117 MW 35,6 MW 38 115 MW ok. 39 000 MW
Źródło: Deutsche WindGuard GmbH (2015): Status des Windenergieausbaus an Land in Deutschland (Jahr 2014), Varel; Fraunhofer ISE (2015): Aktuelle Fakten zur Photovoltaik in Deutschland, Freiburg; Urząd Regulacji Energetyki (2015): Mapa odnawialnych źródeł energii, aktualizacja 30.06.2015.
1. Energetyka wiatrowa
Od ok. 25 lat energia wiatru jest wykorzystywana do produkcji energii elek-trycznej na skalę przemysłową. W Europie w latach 60. i 70. XX wieku naj-popularniejsze były konstrukcje trójpłatowe o mocy ok. 10–25 kW. Do lat 80. największa dostępna turbina miała wirnik o średnicy 30 m i posiadała gene-rator o mocy znamionowej 300 kW. Obecnie najczęściej stosowane są turbiny o mocach od 1,5 do 3 MW, w których średnica wirnika dochodzi do 90 m. Skonstruowano również turbiny, których moc przekracza 5 MW, a średnica wirnika dochodzi do 160 m. Montowane w Niemczech w 2014 roku turbiny wiatrowe miały średnio 2,69 MW mocy, 116 m wysokości do osi wirnika oraz 99 m średnicy wirnika3.
1.1. Przyłączanie do sieci
W chwili obecnej wiele krajów dąży do ujednolicenia lub chociażby zbli-żenia warunków stawianych elektrowniom wiatrowym do warunków, które muszą spełniać elektrownie konwencjonalne podczas zachowania się w sta-nach awaryjnych sieci4. Stare turbiny przyłączone sztywno do sieci – wyko-rzystujące podczas regulacji założenie, że napięcie i częstotliwość sieci nie zmieniają się w zależności od obciążenia i generacji – nie są w stanie sprostać takim wymaganiom, muszą więc stopniowo ustępować miejsca nowoczesnym konstrukcjom z przekształtnikami energoelektronicznymi, które są w większym
3 Deutsche WindGuard GmbH (2015): Status des Windenergieausbaus an Land in Deutschland (Jahr 2014), Varel.
4 CIGRE Brochure 450 (2011): Grid Integration..., op.cit.

Repowering jako metoda poprawy efektywności energetycznej odnawialnych źródeł energii... 359
stopniu odporne na wahania napięcia i częstotliwości w sieci elektroenerge-tycznej. Takie elektrownie są także mniej czułe na krótkotrwałe zmiany wiatru.
Czas użytkowania farmy wiatrowej szacuje się na 25–40 lat. Koszty opera-cyjne i serwisowe można oszacować na 20–25% całkowitych kosztów eksplo-atacji, przy czym dla turbin nowych są one mniejsze – wynoszą od 10 do 15% i wzrastają wraz z zużywaniem się turbiny do ok. 20–35% w końcowej fazie jej eksploatacji5. Całkowity koszt wytworzenia energii wiatrowej po uwzględnieniu kosztów serwisu oraz okresów przestoju wynosi ok. 26 gr/kWh w elektrowniach typu on-shore i 34 gr/kWh w elektrowniach typu off-shore, co w porównaniu z kosztami generacji rzędu 12 do 16 gr/kWh w elektrowniach węglowych i 10 do 15 gr/kWh w elektrowniach gazowych6 oraz z subwencjami do energii wytworzonej w modernizowanych elektrowniach (np. w Niemczech operator elektrowni wiatrowej powstałej w wyniku repoweringu mógł liczyć na dodat-kową dopłatę do wytworzonej energii elektrycznej w wysokości 0,5 ct/kWh7) – przemawia za wymianą starych turbin wiatrowych. Starsze turbiny częściej są narażone na uszkodzenia8. Dzięki zamianie turbiny można wytworzyć wię-cej energii elektrycznej przy jednoczesnym zmniejszeniu liczby turbin9.
1.2. Repowering w energetyce wiatrowej
Sukces repoweringu w dużym stopniu jest uzależniony od sytuacji prawnej, czynników ekonomicznych, możliwości uzyskania odpowiednich pozwoleń oraz od przepustowości sieci elektroenergetycznych i możliwości ich rozbudowy.
Zjawisko repoweringu bardzo często występuje w Niemczech i Danii, ponie-waż istnieje tam dużo elektrowni, których okres eksploatacji dobiega końca. Parametry przykładowych farm wiatrowych w Niemczech, przebudowanych w wyniku repoweringu, przedstawiano w tabeli 2.
W przypadku farmy w Bürgerpark konieczne było wybudowanie trans-formatora o mocy 50 MW. Na rysunku 1 przedstawiono szerokość zjawiska repoweringu w Niemczech. Jak widać, obecnie moc zainstalowana poprzez
5 T. Bakoń, A. Krzemińska (2012): Repowering w energetyce wiatrowej – korzyści i zagrożenia, elektro.info 12/2012, s. 32–36.
6 The Royal Academy of Engineering (2010): The Cost of Generating Electricity, London, www.raeng.org.uk
7 DStGB (2009): Dokumentation N 94: Repowering von Windenergieanlagen..., op.cit.8 T. Bakoń (2011): Uszkodzenia turbin wiatrowych i metody ich wczesnego wykrywania,
elektro.info 11/2011, s. 46–49.9 T. Bakoń (2015): Impact of Wind Power Generation on the Stability of Small Energy
System, Report COST-STSM-TU1304–26764, winercost.com
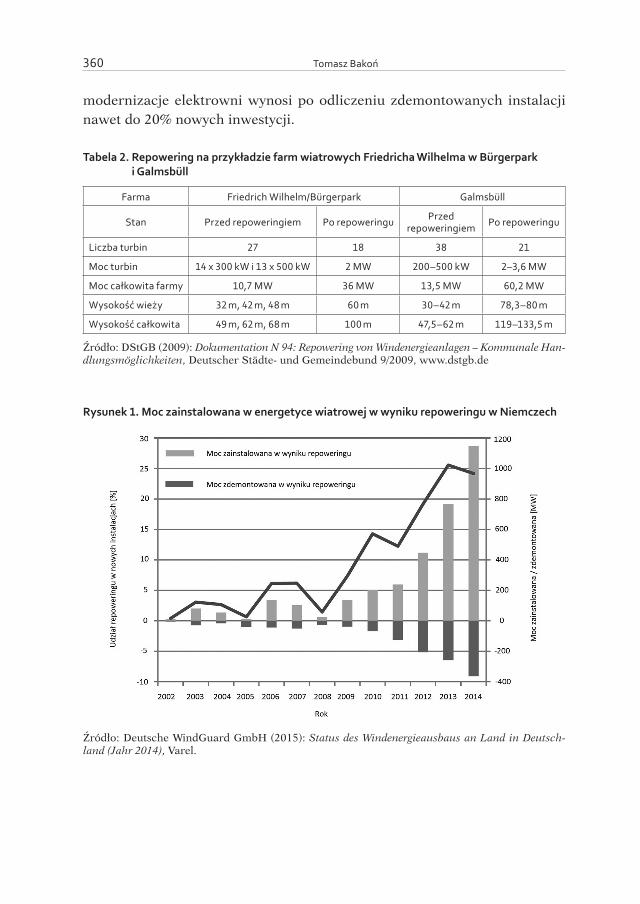
Tomasz Bakoń 360
modernizacje elektrowni wynosi po odliczeniu zdemontowanych instalacji nawet do 20% nowych inwestycji.
Tabela 2. Repowering na przykładzie farm wiatrowych Friedricha Wilhelma w Bürgerpark i Galmsbüll
Farma Friedrich Wilhelm/Bürgerpark Galmsbüll
Stan Przed repoweringiem Po repoweringu Przed repoweringiem Po repoweringu
Liczba turbin 27 18 38 21
Moc turbin 14 x 300 kW i 13 x 500 kW 2 MW 200–500 kW 2–3,6 MW
Moc całkowita farmy 10,7 MW 36 MW 13,5 MW 60,2 MW
Wysokość wieży 32 m, 42 m, 48 m 60 m 30–42 m 78,3–80 m
Wysokość całkowita 49 m, 62 m, 68 m 100 m 47,5–62 m 119–133,5 m
Źródło: DStGB (2009): Dokumentation N 94: Repowering von Windenergieanlagen – Kommunale Han-dlungsmöglichkeiten, Deutscher Städte- und Gemeindebund 9/2009, www.dstgb.de
Rysunek 1. Moc zainstalowana w energetyce wiatrowej w wyniku repoweringu w Niemczech
Źródło: Deutsche WindGuard GmbH (2015): Status des Windenergieausbaus an Land in Deutsch-land (Jahr 2014), Varel.
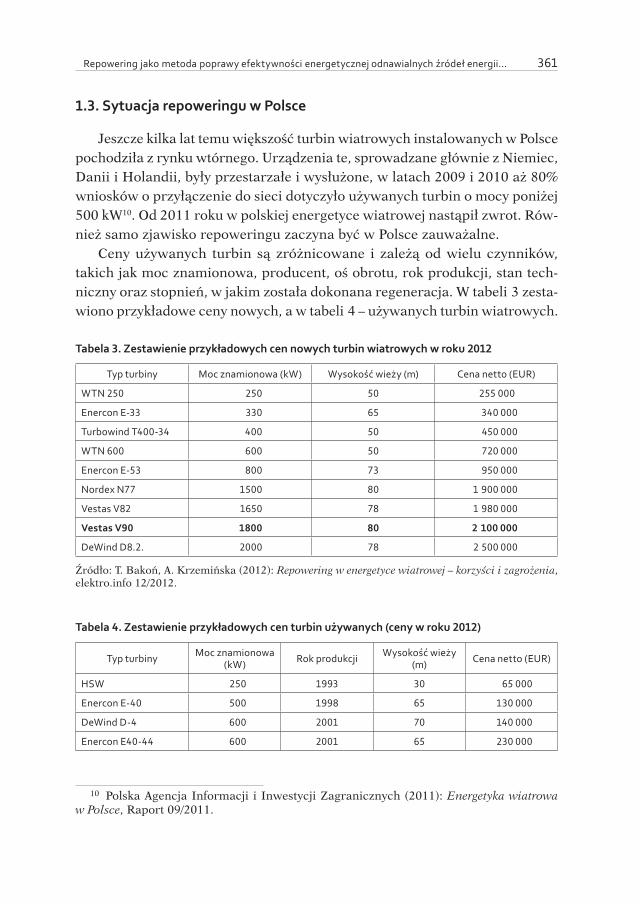
Repowering jako metoda poprawy efektywności energetycznej odnawialnych źródeł energii... 361
1.3. Sytuacja repoweringu w Polsce
Jeszcze kilka lat temu większość turbin wiatrowych instalowanych w Polsce pochodziła z rynku wtórnego. Urządzenia te, sprowadzane głównie z Niemiec, Danii i Holandii, były przestarzałe i wysłużone, w latach 2009 i 2010 aż 80% wniosków o przyłączenie do sieci dotyczyło używanych turbin o mocy poniżej 500 kW10. Od 2011 roku w polskiej energetyce wiatrowej nastąpił zwrot. Rów-nież samo zjawisko repoweringu zaczyna być w Polsce zauważalne.
Ceny używanych turbin są zróżnicowane i zależą od wielu czynników, takich jak moc znamionowa, producent, oś obrotu, rok produkcji, stan tech-niczny oraz stopnień, w jakim została dokonana regeneracja. W tabeli 3 zesta-wiono przykładowe ceny nowych, a w tabeli 4 – używanych turbin wiatrowych.
Tabela 3. Zestawienie przykładowych cen nowych turbin wiatrowych w roku 2012
Typ turbiny Moc znamionowa (kW) Wysokość wieży (m) Cena netto (EUR)
WTN 250 250 50 255 000
Enercon E-33 330 65 340 000
Turbowind T400-34 400 50 450 000
WTN 600 600 50 720 000
Enercon E-53 800 73 950 000
Nordex N77 1500 80 1 900 000
Vestas V82 1650 78 1 980 000
Vestas V90 1800 80 2 100 000
DeWind D8.2. 2000 78 2 500 000
Źródło: T. Bakoń, A. Krzemińska (2012): Repowering w energetyce wiatrowej – korzyści i zagrożenia, elektro.info 12/2012.
Tabela 4. Zestawienie przykładowych cen turbin używanych (ceny w roku 2012)
Typ turbiny Moc znamionowa (kW) Rok produkcji Wysokość wieży
(m) Cena netto (EUR)
HSW 250 1993 30 65 000
Enercon E-40 500 1998 65 130 000
DeWind D-4 600 2001 70 140 000
Enercon E40-44 600 2001 65 230 000
10 Polska Agencja Informacji i Inwestycji Zagranicznych (2011): Energetyka wiatrowa w Polsce, Raport 09/2011.
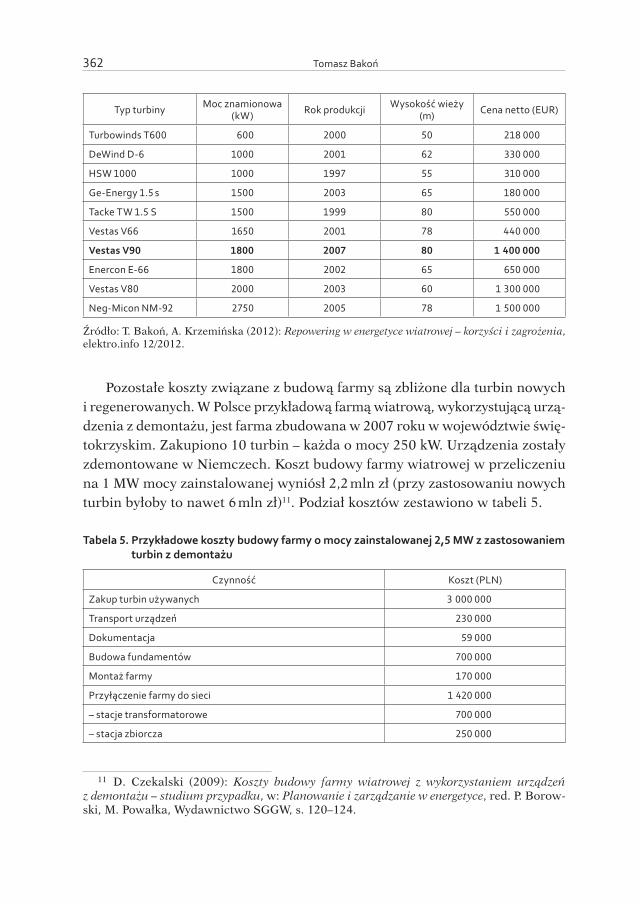
Tomasz Bakoń 362
Typ turbiny Moc znamionowa (kW) Rok produkcji Wysokość wieży
(m) Cena netto (EUR)
Turbowinds T600 600 2000 50 218 000
DeWind D-6 1000 2001 62 330 000
HSW 1000 1000 1997 55 310 000
Ge-Energy 1.5 s 1500 2003 65 180 000
Tacke TW 1.5 S 1500 1999 80 550 000
Vestas V66 1650 2001 78 440 000
Vestas V90 1800 2007 80 1 400 000
Enercon E-66 1800 2002 65 650 000
Vestas V80 2000 2003 60 1 300 000
Neg-Micon NM-92 2750 2005 78 1 500 000
Źródło: T. Bakoń, A. Krzemińska (2012): Repowering w energetyce wiatrowej – korzyści i zagrożenia, elektro.info 12/2012.
Pozostałe koszty związane z budową farmy są zbliżone dla turbin nowych i regenerowanych. W Polsce przykładową farmą wiatrową, wykorzystującą urzą-dzenia z demontażu, jest farma zbudowana w 2007 roku w województwie świę-tokrzyskim. Zakupiono 10 turbin – każda o mocy 250 kW. Urządzenia zostały zdemontowane w Niemczech. Koszt budowy farmy wiatrowej w przeliczeniu na 1 MW mocy zainstalowanej wyniósł 2,2 mln zł (przy zastosowaniu nowych turbin byłoby to nawet 6 mln zł)11. Podział kosztów zestawiono w tabeli 5.
Tabela 5. Przykładowe koszty budowy farmy o mocy zainstalowanej 2,5 MW z zastosowaniem turbin z demontażu
Czynność Koszt (PLN)
Zakup turbin używanych 3 000 000
Transport urządzeń 230 000
Dokumentacja 59 000
Budowa fundamentów 700 000
Montaż farmy 170 000
Przyłączenie farmy do sieci 1 420 000
– stacje transformatorowe 700 000
– stacja zbiorcza 250 000
11 D. Czekalski (2009): Koszty budowy farmy wiatrowej z wykorzystaniem urządzeń z demontażu – studium przypadku, w: Planowanie i zarządzanie w energetyce, red. P. Borow-ski, M. Powałka, Wydawnictwo SGGW, s. 120–124.
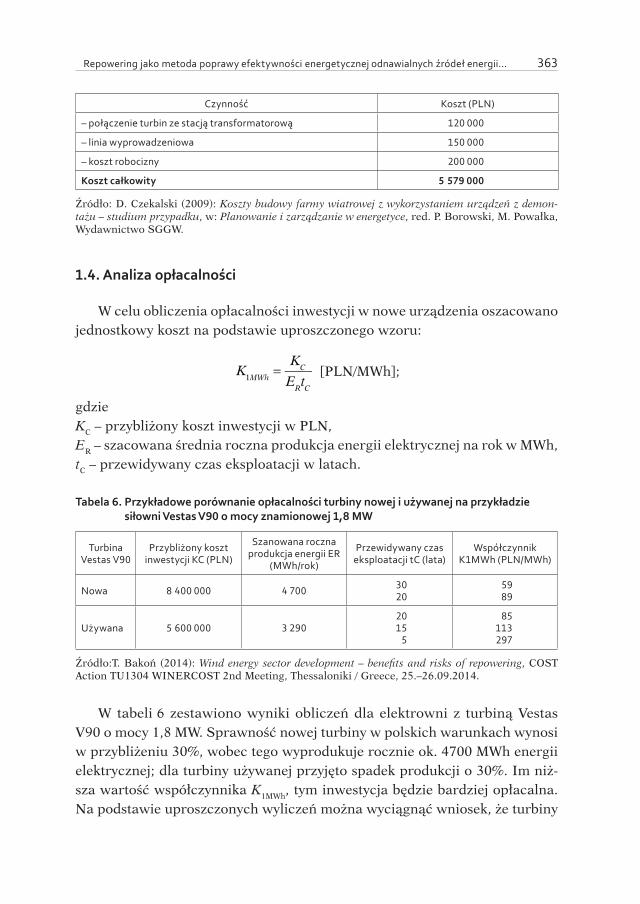
Repowering jako metoda poprawy efektywności energetycznej odnawialnych źródeł energii... 363
Czynność Koszt (PLN)
– połączenie turbin ze stacją transformatorową 120 000
– linia wyprowadzeniowa 150 000
– koszt robocizny 200 000
Koszt całkowity 5 579 000
Źródło: D. Czekalski (2009): Koszty budowy farmy wiatrowej z wykorzystaniem urządzeń z demon-tażu – studium przypadku, w: Planowanie i zarządzanie w energetyce, red. P. Borowski, M. Powałka, Wydawnictwo SGGW.
1.4. Analiza opłacalności
W celu obliczenia opłacalności inwestycji w nowe urządzenia oszacowano jednostkowy koszt na podstawie uproszczonego wzoru:
K1MWh
=K
C
ERtC
[PLN/MWh];
gdzieKC – przybliżony koszt inwestycji w PLN,ER – szacowana średnia roczna produkcja energii elektrycznej na rok w MWh,tC – przewidywany czas eksploatacji w latach.
Tabela 6. Przykładowe porównanie opłacalności turbiny nowej i używanej na przykładzie siłowni Vestas V90 o mocy znamionowej 1,8 MW
Turbina Vestas V90
Przybliżony koszt inwestycji KC (PLN)
Szanowana roczna produkcja energii ER
(MWh/rok)
Przewidywany czas eksploatacji tC (lata)
Współczynnik K1MWh (PLN/MWh)
Nowa 8 400 000 4 700 3020
5989
Używana 5 600 000 3 2902015
5
85113297
Źródło:T. Bakoń (2014): Wind energy sector development – benefits and risks of repowering, COST Action TU1304 WINERCOST 2nd Meeting, Thessaloniki / Greece, 25.–26.09.2014.
W tabeli 6 zestawiono wyniki obliczeń dla elektrowni z turbiną Vestas V90 o mocy 1,8 MW. Sprawność nowej turbiny w polskich warunkach wynosi w przybliżeniu 30%, wobec tego wyprodukuje rocznie ok. 4700 MWh energii elektrycznej; dla turbiny używanej przyjęto spadek produkcji o 30%. Im niż-sza wartość współczynnika K1MWh, tym inwestycja będzie bardziej opłacalna. Na podstawie uproszczonych wyliczeń można wyciągnąć wniosek, że turbiny

Tomasz Bakoń 364
nowe – mimo większych początkowych nakładów inwestycyjnych – powinny być bardziej opłacalne przy długotrwałej eksploatacji. Ze względów technicz-nych okres eksploatacji turbin używanych będzie krótszy od nowych.
2. Elektrownie fotowoltaiczne
Instalacje fotowoltaiczne – głównie zbudowane z paneli krzemowych – zaczęto wykorzystywać na szeroką skalę w latach 80. XX wieku. Średni okres eksploatacji paneli fotowoltaicznych wynosi ok. 20–25 lat. Najniższym współ-czynnikiem średniorocznej degradacji odznaczają się monokrystaliczne ogniwa krzemowe (tabela 7). Szacuje się, że w roku 2010 w Europie ilość wycofanych z użytku modułów wyniosła 290 ton, a w roku 2040 wzrośnie do 33,5 tys. ton12. Powołana w 2007 roku do bezpłatnej zbiórki i recyklingu wyeksploatowanych paneli fotowoltaicznych organizacja PV Cycle zebrała do tej pory ponad 10 tys. ton odpadów fotowoltaicznych z ponad 350 instalacji w 20 krajach Europy.
Tabela 7. Średnioroczne wartości degradacji ogniw fotowoltaicznych
Typ ogniwaŚrednioroczna wartość stopnia degradacji (w %)
produkowanych przed rokiem 2000
produkowanych po roku 2000
Krzemowe monokrystaliczne 0,47 0,36
Krzemowe polikrystaliczne 0,71 0,64
Krzemowe amorficzne 0,96 0,87
Kadmowo-tellurowe 3,33 0,40
Miedziowo-indowo-galowo-selenowe 1,44 0,96
Źródło: D. Jordan, S. Kurtz (2012): Photovoltaic Degradation Rates – An Analytical Review, NREL.
2.1. Repowering a rozwój fotowoltaiki
Przykładem kraju, w którym rozwój fotowoltaiki jest wspierany na drodze repoweringu, są Niemcy. Zgodnie z niemiecką ustawą o OZE przyrost roczny skumulowanej mocy zainstalowanej musi zawierać się w przedziale między 2,5 a 3,5 GW aż do chwili osiągnięcia łącznej mocy zainstalowanej na pozio-mie 52 GW (nastąpi to najprawdopodobniej w 2017 roku). Intensywny rozwój
12 E. Klugman-Radziemska (2010): Aspekty ekologiczne i ekonomiczne recyklingu krze-mowych ogniw i modułów fotowoltaicznych, Nafta i Gaz.
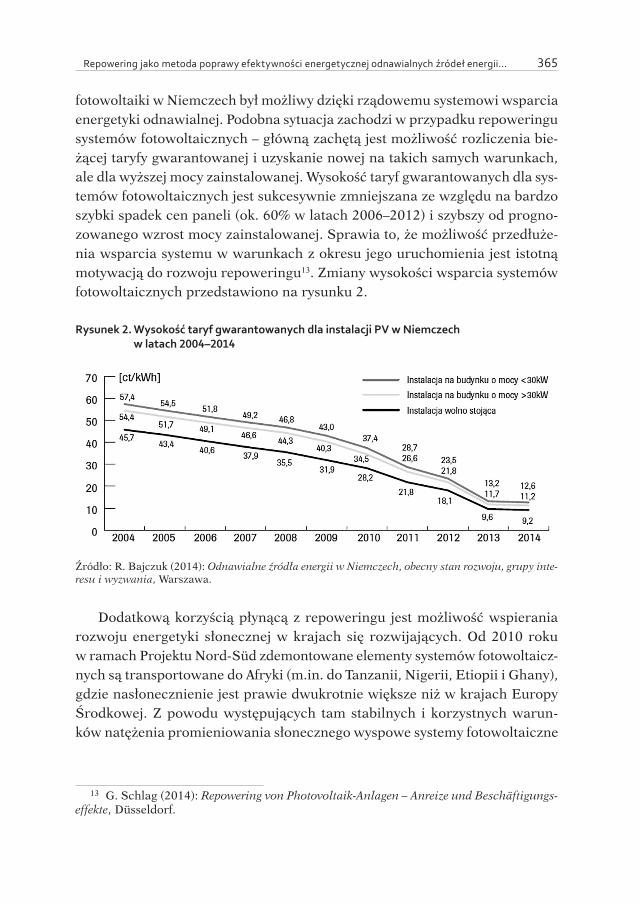
Repowering jako metoda poprawy efektywności energetycznej odnawialnych źródeł energii... 365
fotowoltaiki w Niemczech był możliwy dzięki rządowemu systemowi wsparcia energetyki odnawialnej. Podobna sytuacja zachodzi w przypadku repoweringu systemów fotowoltaicznych – główną zachętą jest możliwość rozliczenia bie-żącej taryfy gwarantowanej i uzyskanie nowej na takich samych warunkach, ale dla wyższej mocy zainstalowanej. Wysokość taryf gwarantowanych dla sys-temów fotowoltaicznych jest sukcesywnie zmniejszana ze względu na bardzo szybki spadek cen paneli (ok. 60% w latach 2006–2012) i szybszy od progno-zowanego wzrost mocy zainstalowanej. Sprawia to, że możliwość przedłuże-nia wsparcia systemu w warunkach z okresu jego uruchomienia jest istotną motywacją do rozwoju repoweringu13. Zmiany wysokości wsparcia systemów fotowoltaicznych przedstawiono na rysunku 2.
Rysunek 2. Wysokość taryf gwarantowanych dla instalacji PV w Niemczech w latach 2004–2014
Źródło: R. Bajczuk (2014): Odnawialne źródła energii w Niemczech, obecny stan rozwoju, grupy inte-resu i wyzwania, Warszawa.
Dodatkową korzyścią płynącą z repoweringu jest możliwość wspierania rozwoju energetyki słonecznej w krajach się rozwijających. Od 2010 roku w ramach Projektu Nord-Süd zdemontowane elementy systemów fotowoltaicz-nych są transportowane do Afryki (m.in. do Tanzanii, Nigerii, Etiopii i Ghany), gdzie nasłonecznienie jest prawie dwukrotnie większe niż w krajach Europy Środkowej. Z powodu występujących tam stabilnych i korzystnych warun-ków natężenia promieniowania słonecznego wyspowe systemy fotowoltaiczne
13 G. Schlag (2014): Repowering von Photovoltaik-Anlagen – Anreize und Beschäftigungs-effekte, Düsseldorf.

Tomasz Bakoń 366
niepodłączone do sieci elektroenergetycznej są dobrym rozwiązaniem na tere-nach wiejskich, gdzie brakuje infrastruktury sieciowej14.
2.2. Repowering przykładowej instalacji fotowoltaicznej
Analizowana instalacja fotowoltaiczna (tabela 8)15 została oddana do użytku w Monachium w roku 2000 i ma funkcjonować w ciągu 16 lat, a proces jej repoweringu jest przewidziany na rok 2016. Następnie w ramach projektów pomocowych zostanie przeniesiona do Ghany, gdzie przy znacznie korzyst-niejszych warunkach nasłonecznienia będzie eksploatowana przez kolejne lata, przyczyniając się do bardziej efektywnego wykorzystania energii włożo-nej w wyprodukowanie paneli fotowoltaicznych.
Tabela 8. Ogniwa fotowoltaiczne wykorzystane w analizowanej elektrowni fotowoltaicznej
Parametr Przed repoweringiem Po repoweringu
Model panelu AP-1206 BEP 300Wp
Typ panelu monokrystaliczny polikrystaliczny
Moc znamionowa panelu 120 Wp 300 Wp
Ilość ogniw w panelu 36 72
Sprawność ogniwa 12% 15,5%
Liczba paneli 18 szt. 9 szt.
Moc systemu 2,16 kW 2,7 kW
powierzchnia panelu 0,97 m2 1,94 m2
Powierzchnia systemu 17,46 m2 17,46 m2
Moc na jednostkę powierzchni 123,71 W/m2 154,64 W/m2
Źródło: Bakoń T., Plikunas E. (2015): Repowering w fotowoltaice, elektro.info 12/2015
2.3. Obliczenia instalacji przeznaczonej do repoweringu
Wraz z upływem czasu maleje sprawność konwersji promieniowania sło-necznego przez ogniwo. Ilość energii elektrycznej produkowanej obliczono ze wzoru:
E =HP
elW
wη
PSTC
;
14 T. Bakoń, E. Plikunas (2015): Repowering w fotowoltaice, elektro.info 12/2015, s. 98–102.
15 Ibidem.
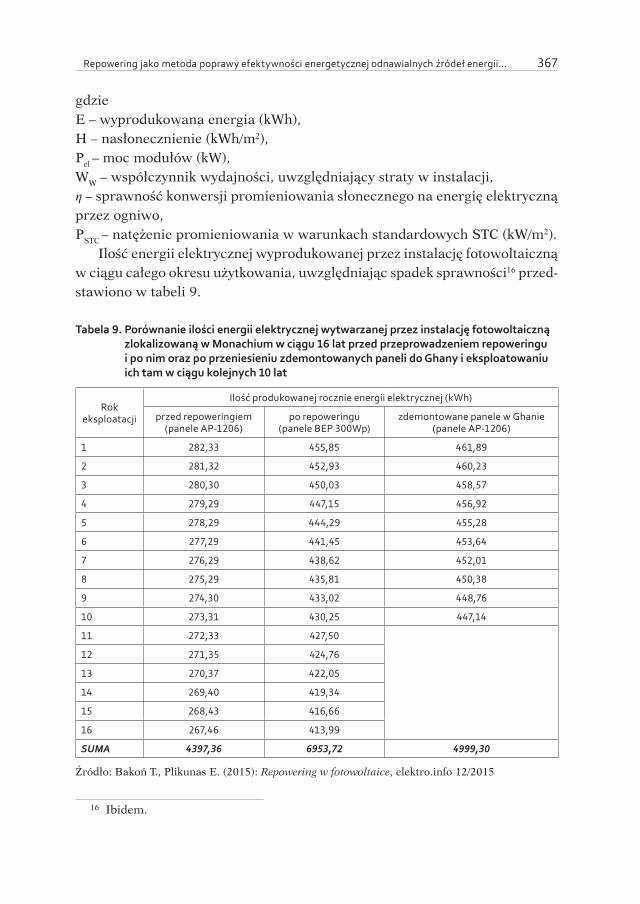
Repowering jako metoda poprawy efektywności energetycznej odnawialnych źródeł energii... 367
gdzieE – wyprodukowana energia (kWh),H – nasłonecznienie (kWh/m2),Pel – moc modułów (kW),WW – współczynnik wydajności, uwzględniający straty w instalacji,η – sprawność konwersji promieniowania słonecznego na energię elektryczną przez ogniwo,PSTC – natężenie promieniowania w warunkach standardowych STC (kW/m2).
Ilość energii elektrycznej wyprodukowanej przez instalację fotowoltaiczną w ciągu całego okresu użytkowania, uwzględniając spadek sprawności16 przed-stawiono w tabeli 9.
Tabela 9. Porównanie ilości energii elektrycznej wytwarzanej przez instalację fotowoltaiczną zlokalizowaną w Monachium w ciągu 16 lat przed przeprowadzeniem repoweringu i po nim oraz po przeniesieniu zdemontowanych paneli do Ghany i eksploatowaniu ich tam w ciągu kolejnych 10 lat
Rok eksploatacji
Ilość produkowanej rocznie energii elektrycznej (kWh)
przed repoweringiem (panele AP-1206)
po repoweringu(panele BEP 300Wp)
zdemontowane panele w Ghanie(panele AP-1206)
1 282,33 455,85 461,89
2 281,32 452,93 460,23
3 280,30 450,03 458,57
4 279,29 447,15 456,92
5 278,29 444,29 455,28
6 277,29 441,45 453,64
7 276,29 438,62 452,01
8 275,29 435,81 450,38
9 274,30 433,02 448,76
10 273,31 430,25 447,14
11 272,33 427,50
12 271,35 424,76
13 270,37 422,05
14 269,40 419,34
15 268,43 416,66
16 267,46 413,99
SUMA 4397,36 6953,72 4999,30
Źródło: Bakoń T., Plikunas E. (2015): Repowering w fotowoltaice, elektro.info 12/2015
16 Ibidem.
Tomasz Bakoń 368
Opłacalność energetyczna repoweringu. Ilość energii możliwej do wypro-dukowania w ciągu całego okresu użytkowania po przeprowadzeniu repowe-ringu zwiększyła się z blisko 4 400 kWh do ok. 6 950 kWh. Ilość zaś energii produkowanej średniorocznie przez rozpatrywaną instalację wzrosła z około 275 kWh do blisko 435 kW. Przeprowadzenie procesu repoweringu modelo-wej instalacji pozwoliło na zwiększenie mocy zainstalowanej o 25%. Dodat-kowo średnia ilość produkowanej rocznie energii elektrycznej wzrosła o 58%. Powierzchnia instalacji nie uległa zmianie. Nasłonecznienie w Ghanie jest niemal dwukrotnie większe. Uzysk energii z instalacji w Ghanie, zbudowa-nej z używanych paneli, jest większy o ponad 60% niż uzysk z nowych paneli tego samego typu w Monachium (tabela 9). Panujące w Ghanie wyjątkowo korzystne i stabilne warunki nasłonecznienia oraz niskie zużycie energii (ok. 300 kWh na osobę) powodują, że wyprodukowanie oczekiwanej ilości energii elektrycznej może odbyć się nawet przy wykorzystaniu paneli fotowoltaicznych zdemontowanych w Europie.
Aspekty finansowe repoweringu. W analizie ekonomicznej repoweringu, poza przychodem finansowym wynikającym z ilości energii elektrycznej wypro-dukowanej przez panele i z ewentualnych zysków ze sprzedaży nadwyżek wyprodukowanej energii, należy uwzględnić koszty:
– diagnostyki istniejącego systemu fotowoltaicznego, – projektu modernizacji instalacji fotowoltaicznej, – demontażu paneli, – zakupu i montażu nowych elementów instalacji (koszty paneli i falownika), – mycia oraz przeglądu stanu technicznego zdemontowanych paneli, – opakowania i transportu zdemontowanych paneli do miejsca ich ponow-
nego montażu, – dystrybucji przetransportowanych paneli.
W Niemczech średni koszt zakupu paneli monokrystalicznych wynosi ok. 0,67 EUR/W, a paneli polikrystalicznych – 0,61 EUR/W, co odpowiada cenie ok. 80 EUR za monokrystaliczny panel o mocy 120 kWp. Koszt transportu poje-dynczego panelu można oszacować na ok. 5 EUR, przy jednoczesnym transpor-cie ok. 1,5 tys. paneli17. Dla mieszkańców Ghany wybór paneli pochodzących z repoweringu wydaje się bardziej atrakcyjny ekonomicznie niż kupno nowych paneli. Dodatkowo repowering przyczynia się do wydłużenia okresu eksplo-
17 Ibidem.
Repowering jako metoda poprawy efektywności energetycznej odnawialnych źródeł energii... 369
atacji paneli słonecznych, co korzystnie zmniejsza uciążliwość instalacji foto-woltaicznych dla środowiska naturalnego18.
Podsumowanie
Utylizacja elektrowni wiatrowych i fotowoltaicznych jest bardzo droga, dlatego wysłużone komponenty są sprzedawane głównie do krajów się roz-wijających. Pojawia się demobil, który jest negatywnym efektem ubocznym repoweringu.
Turbiny używane spowalniają rozwój energetyki wiatrowej, ale także stwa-rzają zagrożenie dla środowiska. Trudno przewidzieć trwałość wyremonto-wanej starej turbiny. Po 20 latach użytkowania turbiny wsparcie techniczne producentów często wygasa, w związku z tym części zamienne przy ewentu-alnym uszkodzeniu mogą być trudno dostępne. W momencie gdy kraje roz-winięte (w tym Niemcy) skutecznie zwiększały moc zainstalowaną, w Polsce tereny atrakcyjne pod względem wietrzności były często zajmowane przez stare, sprowadzane po repoweringu turbiny o małej sprawności. Takie urzą-dzenia emitują również większy hałas. Instalowanie starych i głośnych turbin wywołuje niechęć społeczeństwa do energii ze źródeł odnawialnych. Powody, dla których inwestorzy decydują się na zakup używanych urządzeń, to przede wszystkim niższa cena i chęć przyczynienia się małym kosztem do rozwoju odnawialnych źródeł energii oraz uzyskania odpowiednich certyfikatów. Ist-nieje nadzieja, że zaostrzenie warunków współpracy elektrowni wiatrowych z siecią wymusi inwestycje w nowe technologie oraz stopniowo wyeliminuje stare i wyeksploatowane urządzenia.
Początkowym etapem rozwoju elektrowni fotowoltaicznych jest instalowanie nowych jednostek wytwórczych do momentu osiągnięcia planowanego pułapu mocy zainstalowanej. Następnie powstają działania mające na celu zwiększa-nie mocy zainstalowanej poprzez modernizację istniejących systemów fotowol-taicznych. Przeprowadzanie procesu repoweringu jest możliwe i uzasadnione w krajach, w których rynek fotowoltaiki jest ustabilizowany (np. w Niemczech) i bliski osiągnięcia stopnia nasycenia, oraz wszędzie tam, gdzie oczekuje się jak największej produkcji energii elektrycznej z fotowoltaiki z możliwie najmniej-szej powierzchni. Repowering w energetyce słonecznej może być elementem
18 T. Bakoń (2015): Wpływ produkcji i recyklingu elektrowni fotowoltaicznych na środo-wisko, elektro.info 1–2/2015, s. 78–81.
Tomasz Bakoń 370
stymulującym rozwój gospodarczy krajów się rozwijających. Zdemontowane panele z Europy, ponownie zainstalowane w Afryce, mogą produkować do 70% więcej energii elektrycznej. W Polsce zjawisko repoweringu w fotowolta-ice praktycznie nie występuje.
STRESZCZENIE
W opracowaniu przedstawiono repowering jako metodę poprawy efektywności energetycznej. Skupiono się na elektrowniach wiatrowych i fotowoltaicznych, jako sektorach energetyki odnawialnej, w których to zjawisko jest najbardziej opłacalne. Zwrócono uwagę na problem zagospodarowania zdemontowanych urządzeń. Ana-liza została zilustrowana odpowiednio dobranymi przykładami z Niemiec i Polski.
Słowa kluczowe: efektywność energetyczna, repowering, elektrownie wiatrowe, ele-ktrownie słoneczne, fotowoltaika, odnawialne źródła energii
KURZZUSAMMENFASSUNG
Die Ausarbeitung stellt Repowering als eine Methode zur Verbesserung der Ener-gieeffizienz dar. Der Fokus liegt auf Windkraft und Photovoltaik als Energiesektoren in denen dieses Phänomen im erneuerbaren Energiebereich am profitabelsten ist. Besonderes Augenmerk wurde auf das Problem der Entsorgung von demontierten Anlagen gerichtet. Die Analyse wurde mit dementsprechend ausgewählten Beispie-len aus Deutschland und Polen illustriert.
Schlüsselwörter: Energieeffizienz, Repowering, Windkraft, Solarenergie, Photovol-taik, erneuerbare Energiequellen
Bibliografia
Bajczuk R. (2014): Odnawialne źródła energii w Niemczech, obecny stan rozwoju, grupy interesu i wyzwania, Warszawa.
Bakoń T. (2012): Uszkodzenia turbin wiatrowych i metody ich wczesnego wykrywa-nia, elektro.info 11/2011.

Repowering jako metoda poprawy efektywności energetycznej odnawialnych źródeł energii... 371
Bakoń T. (2014): Wind energy sector development – benefits and risks of repowe-ring, COST Action TU1304 WINERCOST 2nd Meeting, Thessaloniki / Greece, 25.–26.09.2014.
Bakoń T. (2015): Impact of Wind Power Generation on the Stability of Small Energy System, Report COST-STSM-TU1304–26764, winercost.com (2.05.2015).
Bakoń T. (2015): Wpływ produkcji i recyklingu elektrowni fotowoltaicznych na środo-wisko, elektro.info 1–2/2015.
Bakoń T. (2015): Wpływ wybranych czynników eksploatacyjnych na sprawność ogniw fotowoltaicznych, elektro.info 5/2015.
Bakoń T., Krzemińska A. (2012): Repowering w energetyce wiatrowej – korzyści i zagro-żenia, elektro.info 12/2012.
Bakoń T., Plikunas E. (2015): Repowering w fotowoltaice, elektro.info 12/2015.CIGRE Brochure 450 (2011): Grid Integration of Wind Generation, ISBN
9782858731398, CIGRE.Czekalski D. (2009): Koszty budowy farmy wiatrowej z wykorzystaniem urządzeń
z demontażu – studium przypadku, w: Planowanie i zarządzanie w energetyce, red. P. Borowski, M. Powałka, Wydawnictwo SGGW.
Deutsche WindGuard GmbH (2015): Status des Windenergieausbaus an Land in Deutschland (Jahr 2014), Varel.
DStGB (2009): Dokumentation N 94: Repowering von Windenergieanlagen – Kom-munale Handlungsmöglichkeiten, Deutscher Städte- und Gemeindebund 9/2009, www.dstgb.de
Fraunhofer ISE (2015): Aktuelle Fakten zur Photovoltaik in Deutschland, Freiburg.Jordan D., Kurtz S. (2012): Photovoltaic Degradation Rates – An Analytical Review,
NREL.Klugman-Radziemska E. (2010): Aspekty ekologiczne i ekonomiczne recyklingu krze-
mowych ogniw i modułów fotowoltaicznych, Nafta i Gaz.Polska Agencja Informacji i Inwestycji Zagranicznych (2011): Energetyka wiatrowa
w Polsce, Raport 09/2011.Schlag G. (2014): Repowering von Photovoltaik-Anlagen – Anreize und Beschäftigung-
seffekte, Düsseldorf.The Royal Academy of Engineering (2010): The Cost of Generating Electricity, Lon-
don, www.raeng.org.ukUrząd Regulacji Energetyki (2015): Mapa odnawialnych źródeł energii, aktualizacja
30.06.2015.

Ewa SOŃTA-DRĄCZKOWSKA*
INNOVATION STRATEGIES IN THE TELECOMMUNICATIONS INDUSTRY:
ORGANIZATIONAL CHALLENGES BASED ON A CASE STUDY OF DEUTSCHE TELEKOM
IN GERMANY AND POLAND
1. Introduction
Today, the telecommunications industry is facing difficult competitive chal-lenges. Telecommunications companies across the globe are struggling with continued pressure on top lines and eroding margins, trying to maintain the user base and prevent customers from migrating to newer technologies. Data from various industry reports shows that revenues and investments of tele-com operators are declining in the last 5 years. To find ways to keep up with reduced margins many telecoms undergo cost-cutting and restructuring activi-ties and in parallel they search for new growth opportunities not only on the core market but also through diversification and new product development.1 Increasing innovation capabilities is therefore definitely one of the top priori-ties for CEO’s of telecommunication operators.
According to R. Rohrbeck at al.2 the telecommunications industry went recently through a few dramatic transformations making the industry one of
* Research Centre for the German Economy, World Economy Research Institute, SGH Warsaw School of Economics, * e-mail: [email protected]
1 Reshaping telco organization to meet the industry’s new challenges, McKinsey TMT Practice, March 2011, www.mckinsey.com.; ICT Sector in Poland, EMIS, July 2015; Germany 2011 Telecommunications Market and Regulatory Developments, European Commission, Brussels, 12 June 2012; [https://ec.europa.eu/digital-agenda/sites/digital-agenda/files/DE_Country_Chapter_17th_Report_0.pdf].
2 Rohrbeck R., Holzle K., Gemunden H. G. (2009): Opening up for competitive advantage – How Deutsche Telecom creates an open innovation system, R&D Management, Vol. 39, No. 4. pp. 420–430, 2009.

Ewa Sońta-Drączkowska 374
the most volatile industries overall. 1) liberalization of the telecommunica-tions industry in the 90thies, what resulted in reconfiguration of the competi-tive landscape 2) horizontalization of service architecture, which allowed small companies enter the market and offer voice services via Internet, e.g. Skype 3) shift in the value distribution in the industry threatening the margins, today the network operators might be reduced to mere “bit-pipes” and price premiums will be captured by the device manufacturers like Apple or service providers. In addition the sector has to comply with high regulatory pressures.
2. Research purpose and methodology
The aim of this paper is to discuss, how telecommunication operators apply new forms of innovation organization to keep up with the above mentioned market pressures. The study is based on a case study of Deutsche Telekom, the owner of T-Mobile brand and the largest telecommunications company in Europe. Since subsidiaries of Deutsche Telekom operate in Poland and Ger-many, some of cross-country comparison of innovation capabilities is possible. This paper summarizes research findings on new forms of innovation applied in by Deutsche Telkom in Germany and its Polish branch. The research has been conducted on the basis of secondary literature, publically accessible com-pany materials, Internet research as well as five interviews with company’s employees [top and middle management] from the Polish subsidiary.
3. Telecommunications market structure and financial situation of Deutsche Telekom in Poland and Germany
The telecommunications market structure on the Polish and German mar-ket is quite similar, the competitive landscape in both countries is dominated by 3–4 major players. On the German market: the former state monopolist, Deutsche Telekom [32,5%], used to be the dominant player in the fixed and broadband markets, but lost its leading position in the mobile market to Tel-efónica of Spain in late 2014 [current Telefónica market share amounts for 38,4%]. The rest of the market share belongs to Vodafone of UK [29%]. The market in Poland is divided between 4 players, T-Mobile owned by Deutsche Telekom [29%], Centertel a joint venture between Orange [France] and TPSA [31%]; P4, Play network, owned by a consortium of investors based in Cyprus
Innovation strategies in the telecommunications industry: Organizational challenges... 375
and Iceland [11%], and regarded as an alternative operator and Polkomtel [29%], which is owned by a local media tycoon, Zygmunt Solorz-Zak, and operates the Plus network.
The former Polish telecom operator Era with Deutsche Telekom as a major shareholder has been rebranded into T-Mobile in 2011. The rebranding strat-egy was aiming at capitalizing the strong European brand name of T-Mobile and strengthening international presence of Deutsche Telekom in Central and Eastern Europe as well as improving product offering. Deutsche Telekom has already a wide presence in: Czech Republic, Slovakia, Hungary, Romania, Croatia, Austria, Netherlands and Greece.
The telecom market in Poland has been declining in value for a second year in a row – by 2.6% in 2014 and by 3.7% in 2013. This trend is expected to be sustained.3 The declines are largely due to the results of the mobile telephony segment. Declines in traditional voice services have also been dragging down the fixed-line segment, even though VoIP and WLL-based services are growing. The trends are also visible in the results of the Polish subsidiary of the Deutsche Telekom. The Polish subsidiary’s revenue sank by 5,6% in 2013 and the number of alive SIM cards was reduced by3%. Despite this drawbacks the EBIDA grew by 2,2% due to strong cost controlling activities. The falling financial results persisted in 2014. The company revenue sank by 6,1% compared to 2013.
Almost all European subsidiaries of the Deutsche Telekom report falling financial results. The best financial results in the last 3 years achieved the Ger-man subsidiary of Deutsche Telekom with revenues growing by 1,3%. Rela-tively good situation is on the American market. In 2014 Deutsche Telekom won over 8 million new users with revenues rising by ca. 20%.4
The telecom market players both on the German and Polish market are competing heavily on prices and attractive product bundling for customers in order to maintain strong client base and prevent high churn rates. In order to consolidate for further growth, T-Mobile is on the path of looking for external market opportunities. A strategic project conducted in Central Europe in 2014 was the acquisition of GTS Central Europe. This acquisition gives Deutsche Telekom access to fixed line network especially in Poland, Czech Republic. This is a complementary area to the existing products and services portfolio
3 EMIS, op, cit.4 Reshaping telco organization to meet the industry’s new challenges, op. cit.; ICT Sec-
tor in Poland, EMIS, July 2015 op. cit.; Germany 2011 Telecommunications Market and Regulatory Developments, European Commission, op. cit.
Ewa Sońta-Drączkowska 376
and increases the potential for innovative services offering as well as exten-sion of B2B services.
4. New organizational forms of innovation in the telecommunications industry
One of major ways to compete on the difficult, competitive and volatile tel-ecommunications market is to foster innovation and use innovation as a driver for further growth. Since it is difficult to grow only internally, companies open up to the external environment and try to capture innovation in open innova-tion forms.5 Today, many companies are dependent on the network of partners in pursuing innovations. This is especially important for disruptive innovations, where the whole innovation ecosystem must be prepared for successful launch of an innovative product or service.6 Successful innovations in telecommunica-tions industry requires also using the ‘wide lens’ perspective and opening up to external partners. According to McKinsey study7 one of key implications for the organization of telecommunication companies to keep up with the future trends will be:• Opening the organization and managing its ecosystem: In response they
must capture benefits by accessing knowledge, talent, resources and mar-kets outside their current boundaries. Telcos have to build network of third party suppliers/ partners, focus on orchestrating proprietary knowledge rather than creating it, build efficient M&A integration engine to enhance product portfolio and capabilities through a series of smaller deals.
• Establishing structures that foster innovation in the core business as well as in related businesses [‘playing two different games’]. Due to market pres-sures, discussed above, telecoms need to capture innovation opportunities both within and beyond their core business areas. Specialists for incremental innovations and specialized teams can be integrated into the existing organi-zation, while separate innovation units pursue growth beyond the core. The best telecommunication companies enable coexistence of the “supertanker” the large existing core business – and speedboats or small pockets of non-
5 H. W. Chesbrough (2003): The Era of Open Innovation, MIT Sloan Management Review, 44, 35, 41.
6 R. Adner, (2006): Match Your Innovation Strategy to Your Innovation Ecosystem, Har-vard Business Review, April, 2006. R. Adner, The Wide Lens. Penguin Group, 2012.
7 Reshaping telco organization to meet the industry’s new challenges, op. cit.
Innovation strategies in the telecommunications industry: Organizational challenges... 377
core growth business. The non core business should be ring fenced with its own funding, governance and access to external talent. For key strategic topics, building a separate organization makes sense. When implementing the two approaches managers must juggle the trade-off between the syner-gies possible with integration and the need for entrepreneurial freedom.8
Another important shift with a strong impact on innovation models is the movement from a traditional management based on hierarchies, rules, plans and reports toward customer centric “Creative Economy”.9 Nowadays the power in the marketplace has shifted from seller to buyer. It is based on the belief that if you delight the customer, the organization itself will flourish. In the light of these trends, managers must rethink the way organizations are run. The creative approaches have various names, like: Agile, Scrum, Kanban, Continuous Improvement, Customer-Centric Design or User Driven Innova-tion. The approaches have different names but several features in common:• Work is done by self-organizing teams that could mobilize the full talents
of those doing the work• Work is focused directly on meeting customer needs• A ”lens” focuses attention on that customer needs [in Scrum, the person
with that responsibility is known as “product owner”]• Work proceeds in an iterative fashion and progress toward fulfilling the
needs of customers is assessed at every stage.10
Telecommunication firms have to align with the above challenges and trans-form the organizational structures towards flexible, adaptive organizations, which are listening to their customer voice in new product, service development.
One of the more and more popular ways how large companies may solve so called “Innovation Dilemma”11 is to open up to smaller, innovative companies and set-up funds for providing them with venture capital. Corporate venturing is a way of bringing external innovation in-house, funding them and earning money by increasing value of the innovative start-ups. Here are some bene-fits of corporate venturing, as an alternative to traditional R&D approaches:• Faster response to market transformations by providing both an inside
look at new technological fields and a path to possible ownership or use of new ideas
8 Reshaping telco organization to meet the industry’s new challenges, op. cit.9 S. Denning. (2015): Customer preeminence: the lodestar for continuous innovation
in the business ecosystem, Strategy & Leadership, vol. 43 No. 4, 2015, pp. 18–25.10 S. Denning. (2015): Customer preeminence, op. cit.11 C. M. Christensen (2000): The Innovator’s Dilemma, HarperBusiness, New York, 2000.
Ewa Sońta-Drączkowska 378
• A better view of threats – a venture fund can serve as intelligence gather-ing initiative helping company to protect itself from emerging competitive threats.
• Easier disengagement. It gives executives a faster way to disengage from investments that seem to be going nowhere.
• A bigger impact. By combining its own capital with that of other VCs, a cor-porate venture can magnify the impact of its investments. This is particu-larly beneficial when technological uncertainty is high.
• Increased demand. By encouraging the development of technologies that rely on the parent corporation’s platform, venture investments can help increase demand for the corporation’s own products.
• Higher returns. For corporate venture funds, gaining strategic benefits is usually the main goal; profits from venturing typically aren’t significant enough to matter to the parent company’s bottom line. Still, profits are always nice to have and there is a high possibility to achieve them from well structured portfolio.12
5. New forms of innovation organization at the Deutsche Telekom in Germany
There are several new organizational forms of managing innovation, which are actively pursued by the Deutsche Telekom in Germany as a response to growing market pressures. Three of the organizational approaches will be discussed in this article: 1) Open innovation ecosystem with elements of the User-Driven Innovation [UDI] 2) Culture of customer insights implementation across organization 3) Corporate venturing.
The open, User-Driven Innovation (UDI) project field at Telekom Innovation Laboratories (T-Labs)13 analyzes customer wishes that have yet to be expressed and then develops innovative solutions and products together with potential users. The UDI team is interdisciplinary and consists of economists, psychol-ogists, designers and social scientists, who explore, plan and apply new, cus-tom-developed qualitative and quantitative research methods to identify high potential innovations. The aim of this interdisciplinary work is to generate and
12 J. Lerner (2003): Corporate Venturing, Harvard Business Review, October 2013.13 Deutsche Telekom Laboratories [T-Labs] have been founded in 2004 at the campus
of Technische Universitat Berlin with the purpose of strengthening of R&D. Another key research sites are in Israel and Silicon Valley.

Innovation strategies in the telecommunications industry: Organizational challenges... 379
evaluate innovative ideas that have market relevance, along with the customer-centric design and realization of concepts, the definition of business models and transfer of results to the key business areas of Deutsche Telekom AG. All of this requires information about the daily experiences of customers, along with the expertise available from project teams and the know-how of internal and external specialists. The UDI team conducts projects independently, serves as an interface between various interests within the Group and cooperates with external service providers. UDI supports individual projects and T-Labs spin-offs with intelligent methods for user and innovation market research, helps the superordinate innovation fields focus and prioritize their activities and ensures that T-Labs develops technical innovations that are aimed at customer needs.
Picture 1: Phase-specific concept of open, User-Driven Innovation at Deutsche Telekom
NeedsNeeds
&Ideas
SelectedIdeas
&Concepts
Concepts&
Prototypes
Prototype& New Product
ForesightExplorationand Ideation Selection Modelling
User ExperienceValidation
•••
Future workshopsScenario analysisTrend-based scouting
•
••••
Personal visits topotential customersEthnographic researchDiary researchInsights clinicsExplanatory interviews
•••
Ideation WorkshopsIdeation PumpLead-user workshops
Search Fieldsinnovation
User Insights& Innovative Ideas
Reducedmarket uncertainties
••
Evaluation clinicsOnline surveys
Business& Use models
SuperiorUser experience
••
Business modellingCo-creation
••••••••
Test market simulationTouch-point analysisBeta testingHome use testingExpert evaluationUsability testingField TrialPost-Launch Evaluation
Source: based on [http://www.laboratories.telekom.com/public/English/Netzwerk/Pages/UDI.aspx, 10.11.2015]
The user-centered innovation process at Deutsche Telekom typically embraces 5 stages:• Foresight stage: Main focus of this stage is identification of future trends as
well as search fields for future projects. Main instruments applied in this stage are: future workshops, scenario analysis, trend-based scouting. As a result search fields for innovation are determined.

Ewa Sońta-Drączkowska 380
• Exploration: This phase refers to the initial fuzzy front end of an innova-tion project and aims at a deep understanding of current and future cus-tomers in terms of e.g., their living/ working situation, unsolved problems, needs and wants. The result of this phase is so called customer insights, descriptions of unsolved problems or unmet needs, presented from the customer’s own perspective, their perception of, their beliefs about, and their feelings toward the problem. There are several possible instruments, which may be applied in this stage: day-in-the-life visits – personal visits to potential customers, ethnographic research, diary research, insights clinics, explanatory interviews. An example of a technique deployed in an interview is introduction and prioritization of future usage functionalities [so called, mini concepts].
• Ideation: This phase relates to the search for ideas for innovations as well as any initial pre-selection. Several techniques can be applied at this stage: ideation pump – a we-based discussion forum similar to the well established Delphi method. Participants articulate their ideas for future products and services. The ideas are then evaluated in a second round the other partici-pants. During subsequent ideation workshops various creativity techniques are employed in order to elicit creative input. Lead-user workshops may be also applied and they generate information about the needs of visionary customers at an early point in time.
• Selection: The main purpose of this phase is investigation of the feasibility and the return on investment of the innovation. The use of evaluation clin-ics enables testing of the match between new service/ product concepts and prototypes and the needs of different customer segments at later stages. Evaluation clinics can give access to information about a variety of areas such as product use, understanding customer preferences in detail, prod-uct modifications and learning behaviour. Another instrument for selec-tion are online surveys based on the a new media panel, where product concepts or prototypes can are represented online by their features. A web based conjoint analysis is carried out in order to obtain valid and reliable information about prioritization of product and service functions from the potential customer’s point of view. The selected ideas assure reduced mar-ket uncertainties and risks of the innovation.
• Modelling: In the modelling phase the key tasks is to prepare a business model for the new product/ service idea. This phase is sometimes a part of a selection phase or alternatively can also be run after selection of most

Innovation strategies in the telecommunications industry: Organizational challenges... 381
promising ideas. At this stage a business model canvas template14 may be used to discuss the possible variants of value proposition for the clients. The phase of business modelling needs to be done very carefully if the innova-tion has a disruptive character and requires changes in the whole business ecosystem. Breuer and Ketabdar15 suggest 3 possible formats for model-ling new business in telecommunications 1) business model game – a self – explanatory, game-like do it yourself starter kit supports small teams in thinking about new business in a structured way. 2) instant business mod-eling – a moderated workshop format. 3) full scale business modelling pro-ject – covers a five step process including an initial domain research, a user and a modelling workshop, a model test, model specification and finally illustration and storytelling, making it easy to communicate the business model. The last approach is comprehensive and may be an complemen-tary exercise to the process described on the Picture 1. A modelling phase is important part of the user cantered innovation process because it helps to start with the future customers and value created for and with them. The second steps addresses customer needs and value creation by means of customer touch points and user experience as well as revenue structure. Finally solutions and operational costs are covered including cost structure and dynamic capabilities of the company, and key partner relations.16 This is a key concept for supporting business feasibility of a new idea.
• User Experience Validation17: At this stage there is a necessity to validate user experience on the basis of a low cost, quickly made prototype. This prototypes are tested in the real life environment to gain feedback on user experience. Another method, which may be used for user experience valida-tion is test market simulation – in laboratories and/or virtual environments participants are able to gain experience in the usage of products and ser-vices and can then state purchase intentions. Innovation can be also tested on real test markets. Possible field tests may embrace selected users only or local market introduction. Input from testing can be still used to improve user experience of the product through feedback from the validation process.
14 A. Osterwalder, Y. Pigneur, (2010): Business Model Generation. New Jersey: John Wiley & Sons.
15 H Breuer., H. Ketabdar (2012): User-Driven Business Model Innovation – New For-mats & Methods in Business Modeling and Interaction Design, And the Case of Magitact, IADIS International Conference e-Society 2012.
16 H. Breuer, H. Ketabdar (2012), op. cit.17 This stage may be also described in different models as “commercialization” phase.

Ewa Sońta-Drączkowska 382
Another mechanisms supporting product validation are: Touch-point anal-ysis – this makes all clients interaction points with the product visible and allows for optimization of client experience process. Beta testing – clients are invited to test the product/ service, before they are informed about main functionalities and can provide feedback based on their experience. Home-use testing provides the possibility for user feedback on an advanced proto-type. The clients use the product in a natural environment, for the defined period of time and predefined use cases as well as documentation kit.The strength of the customer-oriented innovation process is one o the key
factors for the new product development.18Generation of client feedback infor-mation in the user-centered, open R&D process contributes to the reduction of uncertainty about the market.19 As a result the risk of the whole company innovation ecosystem can be reduced.20 In addition, by concentrating as early as possible on the product functions most preferred by the target customer, the duration and costs of the product development process can be lowered. By meeting customer’s needs as optimally as possible, the diffusion process can be shortened and influenced positively.21
Research conducted by Roehback at. al22, 2009, showed that Deutsche Tel-ekom applies different governance structure over different stages of the open innovation process. These findings confirm the initial hypothesis of Chesbrough that companies engaging in open innovation are primarily seeking to share cost and risk in research and in-source knowledge and technology for new product development.23 The phase of idea generation has been described in more details by the instruments of the open, User Driven Innovation [UDI] process in the pre-vious chapter. The R&D and commercialization will be discussed below. T-Labs are managing research phase and university-industry collaborations based on technology transfer or ‘endowed chairs’ [chairs at T-Labs and Post-Doctoral Researchers]. This area is illustrated by the deep gray color on the Picture 2. Development work is more budget, time and resources intensive, therefore the
18 K. B. Kahn (2001): Market orientation, interdepartmental integration, and product development performance, Journal of Product Innovation Management 18 (5): 314–323.
19 C. M. McDermott (1999): Managing radical product development in large manufac-turing firms: a longitudinal study, Journal of Operations Management 17 (6): 631–644.
20 R. Adner, (2012): op. cit.21 Rogers E. M. (2003): Diffusion of Innovations, Free Press, New York.22 Rohrbeck R., Holzle K., Gemunden H. G. (2009): op. cit.23 H. W. Chesbrough (2003): op. cit.
Innovation strategies in the telecommunications industry: Organizational challenges... 383
companies may use networking more intensively at this stage.24 Deutsche Tel-ekom has founded the European Center for Information and Communication Technology [EICT] as an intermediate that facilitates joint research programs with a network of preferred partners. The funding partners were Daimler AG, the automotive company, Siemens AG and the Technical University of Berlin and three Fraunhofer Institutes for applied research. Through this organiza-tions Deutsche Telekom organizes consortia projects as well as bilateral devel-opment projects. Grey areas on the Picture 2 mark the influence areas of EICT. The commercialization may be conducted in two ways: as a spin off. A T-Labs there are two examples of spin-out companies: Qiro and Zimory. Both com-panies develop technology that is close to the core business of T-Mobile, but fits only weakly into current innovation technologies. They are financed by the external seed capital. Another instrument of open innovation supporting the commercialization phase is ‘test market’. The idea of test market started in 2007. Deutsche Telekom chose Friedrichshaften, with 58 Thousand inhab-itants to become T-City. Developed innovation, such related to e-government applications, mobile worker solutions or e-health schemes can be applied and tested in a real-world environment. Test market as well as corporate venturing activities and strategic alliances are managed by the Deutsche Telekom busi-ness units, this is visualized on the Picture 2 as white fields.
For the implementation of customer insights a “5-I Approach” has been developed at Deutsche Telekom to assure that the whole organization is aligned with customer centric innovation process. This aspects put emphasis on organ-izational culture and its transformation towards integration of customer ori-ented innovation. There are five basic elements, which help to embed this in the corporate culture:1. Integrated process [Integrativer Process] – a very close integration of three
perspectives: market, client and technology. The interaction of the three perspectives allows for a selection of the most viable and profitable innova-tion ideas for the realization. The innovation ideas must be assessed from the technology, market and client perspectives – this is the basis for the suc-cessful user based design. Customer integration in the innovation process is a responsibility of business units of the Deutsche Telekom.
24 U. Lichtentahler, E Lichtentahler (2004): Alliance Functions: implications of the inter-national multi-R&D-alliance perspective, Technovation, 24, 541–552.

Ewa Sońta-Drączkowska 384
Picture 2: Open innovation ecosystem at Deutsche Telecom
IDEAGENERATION
RESEARCH
DEVELOPMENT
COMMERZIA-LIZATION
Foresight workshops
CustomerIntegration
Endowed chairs
Joint development
Spin -outs
StrategicAlliances
Corporateventuring
Test market
Consortia Projects
Executive Forums
InternetPlatform
Managedby T-LABS
Managedby EICT
Managed byBusiness units
Source: based on: Rohrbeck R., Holzle K., Gemunden H. G. (2009), Opening up for competitive advantage – How Deutsche Telecom creates an open innovation system, R&D Management, Vol. 39, No. 4. pp. 420–430, 2009.
2. Inspirational environment [Inspirierende Umgebung] – An example for the operationalisation of this idea is a Creation Centre founded in 2008, which works closely with the Creation Centre von T-Mobile in Seattle in USA. Users, technology researcher and company line managers come together to work here on user centered innovation and select profitable and func-tional solutions.
3. Cross-functional communication [Interdizipliare Kommunikation]. There are many events and workshops at T-Labs, which are organized for integration of diverse teams, e.g.: young talents meet in Design Research Street-Labs, top management of the company in Young European Leadership Work-shops, experts and academia have possibility to meet in Creation Centre – UDI and product management and clients in Creation Centre Observa-tion “Family” workshops.
4. Intuitive transfer [Intuitiver Transfer] through multimedia and various pres-entation formats there is a possibility to gain diverse insights and immedi-
Innovation strategies in the telecommunications industry: Organizational challenges... 385
ate feedback on product quality and functionality. The applied methods are emotionally engaging for the customer. Several techniques may be applied, e.g.: Illustrations and storyboards, animations, plays and movies, booklets, insights, product demonstrations and facilitated discussions.
5. Innovative methods [Innovative Methoden]. In addition there is a whole range of various data collection and creativity methods and tools available to support innovation process, such as: Brain sketching, Empathic Design, Prediction markets, Virtual customer integration, Concept labs, Lateral Thinking, Speedstorming, Nethnograhy, Customer advisory board, Cus-tomer-idealised Design, User Toolkits and other.The interplay of the above factors creates an innovation-oriented culture
at Deutsche Telekom in Germany.Deutsche Telekom in Germany applies forms of corporate venturing instru-
ments. There are several forms of corporate venturing activities: spin-in approach, spin-out approach, another one is a combination of the two of them: so called spin-along approach. Internal venturing promotes business ideas generated within the organization through acquisition of new technologies, entering new market as well as accessing new knowledge. External venturing promotes business ideas developed outside the company, commercializes ideas through spin outs and outsources non-core activities. The spin-along approach depicts a unique method that brings together rudiments of internal and external cor-porate venturing.25 The spin-along approach is strategically motivated and is an alternative path for innovations that are non-core or radical, driving busi-ness model innovations and innovations with little synergy with the existing business. This approach allows for being very close to the market. In the spin-along approach, a company encourages its employees to take their business idea external and to found a company. Successful companies might later be bought back and integrated into the parent company or the parental will exit the company by selling its equity share.26
Deutsche Telekom pursues corporate venturing through T-Venture, founded in 1997 as well as in form of Telekom Innovation Pool [TPI] subsidiaries. Recently, in October 2015, Deutsche Telekom transferred all corporate venturing activi-ties to a new unit – Deutsche Telekom Strategic Investments [DTSI]. T-Venture is the foundation of DTSI, which will also include Telekom Innovation Pool
25 S. Fischer, (2015): The Spin-Along Strategy, DRUID15, Rome, June 15–17, 2015.26 R. Rohrbeck (2008): Corporate Venturing at Deutsche Telekom AG, presentation mate-
rial, 2008, http://www.rene-rohrbeck.de/documents/Rohrbeck_%282008%29_Talk_Corpo-rate-Venturing.pdf [22.11.2015].
Ewa Sońta-Drączkowska 386
(TIP). The` combined unit will have over 360 million Euro in capital under management. The firm has made over 200 investments and currently man-ages a portfolio of around 90 companies. T-Venture brand will be subsumed by that of DTSI. Through corporate venturing Deutsche Telekom connects sev-eral actors in the innovation ecosystem: venture capitalists [including third party investors] and entrepreneurs both internal and external to the company.
6. Innovation at Deutsche Telekom in the Polish subsidiary – best practices transfer possibility?
New, open forms of innovation applied by Deutsche Telekom in Germany have been presented and discussed in the previous chapter. The question is whether and to what extend some of the German best-practices are applied by the Polish subsidiary of the Deutsche Telekom? One of important factors, which may determine best practice transfer possibility, is the different macroeconomic situation of both countries. Germany is a definitive innovation leader among European countries, whereas Poland holds low positions in the rankings and belongs to the group of moderate innovators.27 There are several areas, where according to recent rankings, Germany’s position is especially strong: 1) Inno-vation is a part of a company’s strategy [exemplary metric: % of medium and small enterprises introducing product and service innovation] 2) High R&D spending a % of firms revenue 3) High number of patents/trademarks per PCT patents applications per billion GDP (in Purchasing Power Standard €) 4) Strong economic indicators supporting innovation on the macroeconomic level [exemplary metric: employment in knowledge intensive activities as a % of total employment]. Another factor, which influences innovation strategies on the micro level is well designed and organized national innovation system in Germany. Especially strong area of the German NIS is the participation of the industry sector in R&D activities. In addition, Germany creates a lot o macroeconomic value added in high technology industries. Cooperation between industry and academia is well-established and organized. Two thirds of R&D capital in Germany comes from the industry.28 In Poland only 1/3 of
27 Innovation Union Scoreboard, European Commission, Belgium (2014).28 F. Goos, M. Richter-Tokar (2013): Methoden und Analysen des deutschen Innovations-
systems: internationaler Vergleich, Starken und Schwachen. Leibniz Universität Hannover, 2013. Vorlesungsmaterial, s. 30–34.
Innovation strategies in the telecommunications industry: Organizational challenges... 387
R&D spending is related to private sector, the rest is financed from publicly available funds, especially EU subsidies.
The above macroeconomic factors can influence innovation strategies conducted by Deutsche Telekom [T-Mobile] in Poland. But in the perspective of the next 5 years the situation will be probably changing due to large funds available in Poland for innovation projects especially in high technology, R&D, cooperation between private sector and academia and for small and medium enterprises. High qualified and relatively inexpensive labor, stable economy, and relatively large consumer market, may be attractive for setting up higher value R&D innovation process in Poland.
In the German branch of Deutsche Telekom the cooperation with TU Berlin and other scientific research institutions, such as Fraunhofer, is a very strong driver of the company’s R&D. Some steps of using the potential of scientific insti-tutions have been undertaken also by the Polish subsidiary. In 2006 a research Lab BRAMA was founded by T-mobile [formally Era] at Technical University in Warsaw, however the beginnings of the cooperation with this scientific institu-tion are dated by the early 2000. BRAMA is a meeting point between academia and business to create innovative project’s in the area of mobile technologies. Infrastructure and education at this site is sponsored by T-Mobile. T-Mobile is a member of a Steering Committee of the European Mobile Technologies platform [e-Mobility] and initiator of series of projects in the area of data min-ing. The results of the cooperation with Warsaw University of Technology are two patents: application Soft OIT – solution, which was also sold to the west-ern telecom operators, and solutions for predictions of traffic on un-covered areas, which supports the extension of telecom network. However, according to interviews, the importance of this cooperation for the revenue generation of the local subsidiary has rather a marginal character.
Another example of the open innovation at T-Mobile in Poland is the cre-ation of an internet portal innowacje.t-mobile.pl launched in 2012. This is a communication platform supporting cooperation between T-Mobile, start-ups and young developers. T-Mobile cooperates also with one of the most popu-lar industry portals: mamstartup.pl and coordinates a range of events such as T-Mobile Startup Challenge – Internet and mobile technology startup contest. T-Mobile is also a strategic partner of Entrepreneurial Poland – one of the most effective start-up ecosystems in the world offering tools for testing and business development. The best companies recruited during these events have a chance for a long-term cooperation and mentoring provided by T-Mobile. One of the examples for new forms of innovation organization on the Polish market is
Ewa Sońta-Drączkowska 388
the Poland-based subsidiary of the Deutsche Telekom innovation accelerator hub:raum Kraków. It provides seed funding for start-ups that have potential to transform important markets for Deutsche Telekom. hub:raum connects the digital startup ecosystem with Deutsche Telekom, linking tech entrepreneurs and high growth startup companies with the expert network, capital, and busi-ness opportunities of Deutsche Telekom. hub:raum offers various programs in three locations:• Berlin (covering Germany and Western Europe),• Krakow (serving CEE region)• Tel Aviv (Israel).
There are 4 service areas, which are provided by hub:raum:• Financing: hub:raum supports start-ups with a pre-seed and seed funding,
the funding framework differs for the various hub:raum programs.• Co-working: it offers a place to work and the opportunity to exchange with
the peers and T-Mobile expert team.• Mentoring: It provides with hands-on mentors and experts that support
start-ups with entrepreneurial experience and specialized know-how.• Leveraging: It connects and allows to pragmatically exploit corporate levers
for start-up innovation.Currently there are 7 start-up companies in the hub:raum Kraków invest-
ments portfolio. The most challenging issue is to bridge the gap between prod-uct development and market commercialization. Partnering and using the existing client database of T-Mobile may help young entrepreneurs in market launch of their ideas.
Another instrument of open innovation applied by Polish subsidiary is partnering and vendor driven innovation. In Poland there are several innova-tive products, which have been launched in cooperation with external parties, below are selected examples:• MyWallet. This service offers mobile payments through mobile phone. The
service is currently available for 4 banks acting on a Polish market: mBank, Raiffeisen Polbank, Getin Noble.
• T-mobile banking services: This is a banking platform with services offered in cooperation with Alior Bank [former Alior Sync].
• Mozilla co-development: Cooperation with Mozilla on the new mobile system OS Firefox aims at implementation of a new technology HTML5. Poland is first country in Europe and second in the world where there is possibility of buying a first device working fully on Firefox OS – Smartfon Alcatel One Touch Fire.
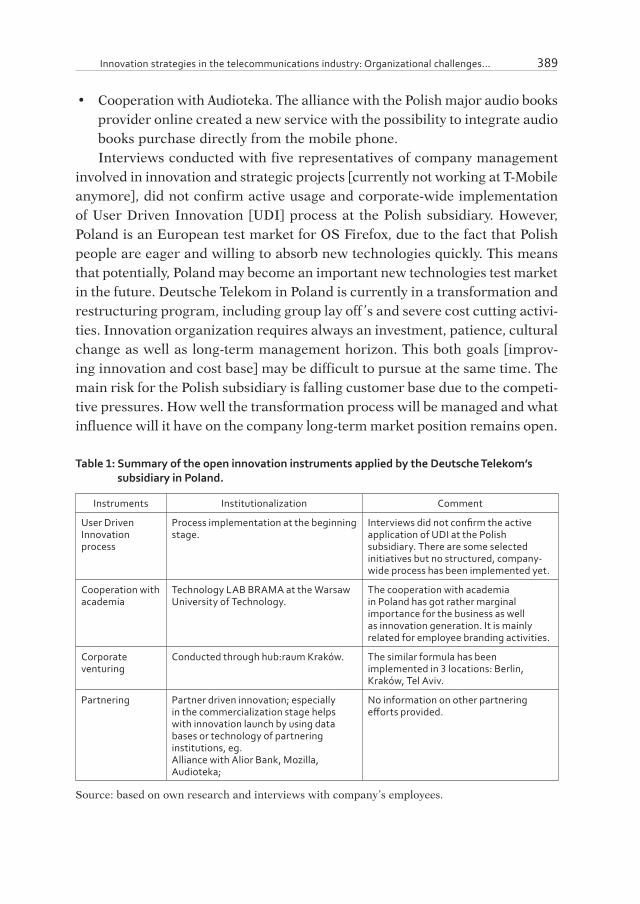
Innovation strategies in the telecommunications industry: Organizational challenges... 389
• Cooperation with Audioteka. The alliance with the Polish major audio books provider online created a new service with the possibility to integrate audio books purchase directly from the mobile phone.Interviews conducted with five representatives of company management
involved in innovation and strategic projects [currently not working at T-Mobile anymore], did not confirm active usage and corporate-wide implementation of User Driven Innovation [UDI] process at the Polish subsidiary. However, Poland is an European test market for OS Firefox, due to the fact that Polish people are eager and willing to absorb new technologies quickly. This means that potentially, Poland may become an important new technologies test market in the future. Deutsche Telekom in Poland is currently in a transformation and restructuring program, including group lay off ’s and severe cost cutting activi-ties. Innovation organization requires always an investment, patience, cultural change as well as long-term management horizon. This both goals [improv-ing innovation and cost base] may be difficult to pursue at the same time. The main risk for the Polish subsidiary is falling customer base due to the competi-tive pressures. How well the transformation process will be managed and what influence will it have on the company long-term market position remains open.
Table 1: Summary of the open innovation instruments applied by the Deutsche Telekom’s subsidiary in Poland.
Instruments Institutionalization Comment
User Driven Innovation process
Process implementation at the beginning stage.
Interviews did not confirm the active application of UDI at the Polish subsidiary. There are some selected initiatives but no structured, company-wide process has been implemented yet.
Cooperation with academia
Technology LAB BRAMA at the Warsaw University of Technology.
The cooperation with academia in Poland has got rather marginal importance for the business as well as innovation generation. It is mainly related for employee branding activities.
Corporate venturing
Conducted through hub:raum Kraków. The similar formula has been implemented in 3 locations: Berlin, Kraków, Tel Aviv.
Partnering Partner driven innovation; especially in the commercialization stage helps with innovation launch by using data bases or technology of partnering institutions, eg.Alliance with Alior Bank, Mozilla, Audioteka;
No information on other partnering efforts provided.
Source: based on own research and interviews with company’s employees.
Ewa Sońta-Drączkowska 390
7. Conclusions
This article discusses new forms of innovation organization in the telecom-munications industry on the basis of a case study conducted for the Deutsche Telekom in Germany and its subsidiary in Poland. Today, telecoms have to create open innovation ecosystems to enhance innovation agility and create growth. German subsidiary of the European telecom giant shows application of many examples of open innovation forms, such as User Driven Innovation [UDI] process, partnering, corporate venturing and implementation of innovation-oriented, customer- centered corporate culture. The Polish subsidiary oper-ates in a different macroeconomic set-up. Poland is far behind Germany in the innovation rankings. However the exploration of open innovation mechanisms applied by Deutsche Telekom in Poland showed that a various range of best practices applied by the German company have been transferred also to the Polish market. One of them is creation of an innovation accelerator: hub:raum Kraków. Interviews with company representatives from the local market con-firmed that the process of User Driven Innovation is currently at the early stages of implementation at T-Mobile in Poland. The Polish subsidiary is cur-rently in a restructuring process, with group layoffs and cost cutting activi-ties. The dominant observation from interviews was, that the priority for the Germany-based headquarter is to show short-term improvement of financial results. Therefore this pressure reflects in the strategy of the local subsidiar-ies across Central Europe. This may however stay in conflict with a long-term perspective of building an innovation potential of the company on the Polish market. This would be particularly important in the context of the next EU 2016–2020 – funding perspective, where priorities are set on increasing inno-vation potential of the Polish economy. Further research on the open innovation topic may concentrate on how Deutsche Telekom may explore new EU finan-cial perspective for building an innovation and R&D infrastructure in Poland. Another interesting research area would also be to explore mechanisms of risk mitigation in open innovation settings.
Innovation strategies in the telecommunications industry: Organizational challenges... 391
ABSTRACT
Today, companies operating on the telecommunications market face many com-petitive as well as organizational challenges. To find ways to keep up with reduced margins many telecoms undergo currently cost-cutting and restructuring activities and in parallel they search for new growth opportunities not only on the core mar-ket but also through diversification and new product development. This encourages experimentation with new forms of innovation. Telecoms have to create open inno-vation ecosystems to enhance innovation agility and create growth. The article dis-cusses new forms of innovation organization in the telecommunications industry on the basis of a case study conducted for Deutsche Telekom in Germany and Poland. Several best practices of the open innovation organization from the German mar-ket are presented as well as examples of best practices transfer to the Polish market. The implementation constraints for the Polish subsidiary have been discussed in the macroeconomic and strategic context.
Key words: telecommunications market, open R&D, customer centric design, user designed innovation, corporate venturing, T-Mobile in Poland and Germany, Deutsche Telekom
Sources
Adner R. (2012):The Wide Lens. Penguin Group.Adner R. (2006): Match Your Innovation Strategy to Your Innovation Ecosystem, Har-
vard Business Review, April.Breuer H., Ketabdar H. (2012): User-Driven Business Model Innovation – New For-
mats & Methods in Business Modeling and Interaction Design, And the Case of Magitact, IADIS International Conference e-Society.
Chesbrough, H. W. (2003): The Era of Open Innovation, MIT Sloan Management Review, 44, 35, 41.
Christensen C. M. (2000): The Innovator’s Dilemma, HarperBusiness, New York.Denning. S. (2015): Customer preeminence: the lodestar for continuous innovation
in the business ecosystem, Strategy & Leadership, vol. 43 No. 4, 2015, pp. 18–25.EMIS (2015): ICT Sector in Poland, July.European Commission (2012): Germany 2011 Telecommunications Market and
Regulatory Developments, Brussels, 12 June 2012; [https://ec.europa.eu/digital-agenda/sites/digital-agenda/files/DE_Country_Chapter_17th_Report_0.pdf].
European Commission (2014): Innovation Union Scoreboard, Belgium.Fischer, S. (2015): The Spin-Along Strategy, DRUID15, Rome, June 15–17, 2015.
Ewa Sońta-Drączkowska 392
Goos F., Richter-Tokar M. (2013): Methoden und Analysen des deutschen Innovation-ssystems: internationaler Vergleich, Stärken und Schwächen. Leibniz Universität Hannover, 2013. Vorlesungsmaterial, S. 30–34.
Kahn K. B. (2001): Market orientation, interdepartmental integration, and product development performance, Journal of Product Innovation Management 18 (5): 314–323.
Lerner, J. (2003): Corporate Venturing, Harvard Business Review, October 2013.Lichtentahler, U and Lichtentahler, E. (2004): Alliance Functions: implications of
the international multi-R&D-alliance perspective, Technovation, 24, 541–552.McDermott C. M. (1999): Managing radical product development in large manufac-
turing firms: a longitudinal study, Journal of Operations Management 17 (6): 631–644.
Osterwalder, A. and Pigneur, Y. (2010): Business Model Generation. New Jersey: John Wiley & Sons.
Reshaping telco organization to meet the industry’s new challenges, McKinsey TMT Practice, March 2011, www.mckinsey.com.
Rogers E. M., (2003), Diffusion of Innovations, Free Press, New York.Rohrbeck R., Holzle K., Gemunden H. G. (2009), Opening up for competitive advan-
tage – How Deutsche Telecom creates an open innovation system, R&D Manage-ment, Vol. 39, No. 4. pp. 420–430, 2009.
Rohrbeck R. (2008), Corporate Venturing at Deutsche Telekom AG, presentation material, 2008,
http://www.rene-rohrbeck.de/documents/Rohrbeck_%282008%29_Talk_Corporate-Venturing.pdf [22.11.2015].
Steinhof F., Breuer H. (2009), Customer-Centric Open R&D and Innovation in the Telecommunication Industry, Technische Universitat Berlin, Proceedings of the 16th International Product Development Management Conference. 2009.
Company information
http://www.telekom.com/home [30.11.2015]https://online.t-mobilebankowe.pl/ib/login.html [30.11.2015]http://firma.t-mobile.pl/pl/o-firmie [30.11.2015]https://www.hubraum.com/ [30.11.2015]http://www.laboratories.telekom.com/public/Deutsch/Pages/default.aspx [30.11.2015]
Bartosz DESZCZYŃSKI*
DIE KOOPERATION ZWISCHEN VOLKSWAGEN GROUP UND KULCZYK TRADEX
IN DEM CRM IMPLEMENTIERUNGSPROZESS
1. Einführung
Das polnische Wagenvertriebnetz wird ähnlich wie in Westeuropa von drei Typen der Wirtschaftsubjekten zusammengesetzt: den Händlern (Dealers), dem Importeur (National Sales Company) und dem Hersteller (OEM). Die Händler sind in der Regel unabhängige Firmen die mit dem Importeur durch Franchise-vertrag verbunden sind. Zu ihren Aufgaben zählen Wagenvertrieb und Kunden-service, der nach strengen Standards ausgeführt werden soll. Die Importeure sind Vermittler zwischen den Händlern und dem Hersteller. Zu ihren Haupt-aufgaben zählen in erster Linie die Koordination von Vertrieb, Marketing, Qualitätssicherung, Kundendienst, Schulungen und Logistik. Deswegen blei-ben die Importeure in der direkten Verbindung sowohl mit den Händlern als auch mit dem Hersteller.1
Dieser Beitrag zeigt den Implementierungsprozess von Kundebeziehungs-management (Customer Relationship Management – CRM) bei dem Volkswa-genwagenvertriebsnetz in Polen zwischen den Jahren 2003–2011 und danach, als ein Beispiel der Kooperation zwischen den deutschen und polnischen Part-nern. Zu dieser Zeit wurde Volkswagen Group in Polen durch die Firma Kulc-zyk Tradex GmbH vertreten. Dieses Unternehmen wurde im Jahre 1991 von Grażyna und Jan Kulczyk – eine allgemein bekannte Businessehepaar, gegrün-det. Im Jahre 1995 ein neuer Partner – PON Investments B. V. – niederländi-
* Poznan University of Economics, * e-mail: [email protected] Es zeichnet sich aber eine Tendenz zur horizontalen Integration ab, was die Über-
nahme der Kulczyk Tradex GmbH von Volkswagen AG im Jahre 2012 bestätigt.

Bartosz Deszczyński 394
scher Importeur von Volkswagen und Audi erwarb 49,9% der Firmenanteile. Als polnisch-niederländisches Joint Venture war die Firma imstande die von Volkswagen geforderten Investitionen zu leisten und eine aktive Rolle im Markt, der immer mehr dem westeuropäischen ähnelte zu spielen. Darüber hinaus hat sie sich von dem Wissensannehmenden- in einen aktiven Partner des Kon-zerns umgewandelt der seine Kundenbeziehungsmanagementpolitik verant-wortungsvoll auf eigene Faust führen konnte. Diese Entwicklung zeigt, welch großem Potential die deutsch-polnische Wirtschaftliche Zusammenarbeit auch auf der mikroökonomischen Ebene spielen kann. Solche organisatorischen Verbesserungen sind neben den neuen Herstellungstechnologien ein wichtiges Innovationsfaktor – besonders wichtig im Kontext der Strategie Europa 2020.
Der empirisch-analytisches Charakter dieses Beitrags erforderte den Ein-satz eines mehrjähriges Dauerfallbeispiels als Hauptforschungsmethode. Dies ermöglichte die Darstellung der Herausforderungen, die vor den Organisa-tionen die Kundenbeziehungsmanagement einführen wollen stehen. In dem geschilderten Beispiel haben sie sich als besonders kompliziert erwiesen, da sich mit dem dreidimensionaler CRM-Prozess die verschieden Partnerinter-essen und Prioritäten überlappten. Darüber hinaus wurde die Systemanalyse eingesetzt. Die war behilflich bei der Darlegung der komplexen Interdependen-zen zwischen den organisatorischen Vorrausetzungen, HR-Ressourcen, Pro-zessen und IT die mit diversen Intensität bei den verschiedenen Stufen dieses internationalen Projekts ihre Rolle spielten.
2. Die Idee von CRM bei Audi
Ende 20. Jahrhundert hat sich Audi AG – eine weitgehend selbständig im Markt agierende Volkswagensparte, für Einführung der neuen Kundenbin-dungsstrategien entschieden mit dem Ziel Kunden im Premiumsegment erfolg-reich zu erwerben und zu halten. Ihr Vorstand hat im Jahre 1999 ein Team zum Leben berufen, der für die Implementierung des Kundenbeziehungsma-nagements (CRM) verantwortlich war. Eine seiner ersten Aufgaben war es die CRM Strategie zu erarbeiten. Die wurde folgend definiert: Innovation, inten-siver Dialog und einzigartige Kundenorientierung schaffen ein Kontakterlebnis, das die Kunden von einer langfristigen Partnerschaft mit Audi überzeugt.2 Die
2 Allgemein CRM, Customer Relationship Management I/VM-8, Audi AG interne Bear-beitung, Ingolstadt 2001.
Die Kooperation zwischen Volkswagen Group und Kulczyk Tradex... 395
strategische Zielsetzung umfasste Steigerung der Loyalitätsrate, Optimierung der Loyalitätssicherungskosten und Neukundenakquisekosten. Die Implemen-tierung dieser Ziele sollte auf folgenden strategischen Meilensteinen basieren:
– Vollständigkeit (der Kunde in der ganzen Lebensperspektive wahrgenom-men, die Kommunikation, Tätigkeiten und Prozesse and individuelle Bedürf-nisse angepasst),
– Integration (Loyalitätsprogramme, Prozesse, Systeme), – Qualität bei jedem Kundenkontakt (klare, kommunikative und lebendige
Markenwahrnehmung).Nachdem diese Pläne im Jahre 2001 von dem Vorstand gebilligt worden
waren, wurde ein CRM Unterabteilung in der Marketingstruktur der Audi AG etabliert.3
3. Die drei CRM Dimensionen
Um eine einheitliche Ansicht auf das CRM zu schaffen sollte man dieses Akronym erklären und ihren Zusammenhang mit drei wichtigen Geschäfts-dimensionen verdeutlichen. CRM ist Management also Planung des Kunden-dialogs zusammen mit operativem Handeln und der Infrastruktur die für die Auswahl der profitablen Kunden und ihrer Motivierung zur Loyalität notwen-dig ist.4 Der Kunde soll sowohl als aktiver Verbraucher als auch Ex-Kunde and potenzieller Kunde betrachtet werden.5 Die Beziehung ist als ein individuel-les, langfristiges Verhältnis zwischen den Kunden und Unternehmen zu ver-stehen. Diese Beziehungen sollen als Nullsummenspiel betrachtet werden d.h. auf gegenseitiger Partnerschaft und Nutzen basieren.6
CRM wird allgegenwärtig mit Informations- und Kommunikationstechno-logien (ICT) assoziiert.7 Dies ist nicht ohne Grund aber obwohl die ICT eine wichtige Rolle spielen, sie bleiben ein Werkzeug, dass z.B. Verwirklichung des CRM 360° Konzepts ermöglicht.8 Solche technizisierte Wahrnehmung von CRM
3 CRM Abteilung wurde später in eine CRM und Neue Medien Abteilung umgewandelt.4 J. Dyche, CRM – Relacje z Klientami, Wydawnictwo Helion, Gliwice 2002.5 K. Mazurek-Łopacińska, Orientacja na klienta w przedsiębiorstwie, PWE, Warszawa
2002.6 P. Kotler i in., Marketing – Podręcznik europejski, PWE, Warszawa 2002.7 B. Deszczynski, Uwarunkowania wdrażania CRM w przedsiębiorstwie, Ruch Praw-
niczy, Ekonomiczny i Socjologiczny, 2/2007.8 A. Payne, P. Frow P., Strategic Customer Management, Integrating Relationship Mar-
keting and CRM, Cambridge University Press, Cambridge 2013.

Bartosz Deszczyński 396
trägt zu immer noch niedrigen Implementierungserfolgsraten.9 Deswegen hat man versucht mehr ausbalancierte Proportionen zwischen CRM Software und strategischen und organisatorischen Voraussetzungen zu erzielen.10 In diesem Kontext kann man CRM als eine Innovation betrachten, die im Prozess der rati-onalen Managemententscheidungen kreiert wird und kontinuierlich an die ver-änderliche Umwelt angepasst wird mit dem Ziel Kunden- und Firmenwertkette zu optimieren. In dem Sinne kann man neben der Beziehungsmarketingstra-tegie und den digitalen Tools eine dritte CRM Dimension unterscheiden – das Änderungsmanagement (change management). Dies kann sowohl Form eines taktischen als auch tiefgreifenden Sanierungsprojekt annehmen. Als dieser Beitrag zeigt kann dieser Prozess besonders hart zu verwalten sein, besonders in solch komplexen Organisationen wie Volkswagennetz.
4. Die erste Kooperationsphase
Bei der Schaffung von CRM Abteilung hat sich der Vorstand von Audi AG Ziele gesetzt, die sich in drei thematischen Gruppen teilen lassen:
– Kundenbeziehungsmarketing und Kundenservice Prozessen, – Wissensmanagement, – CRM and e-CRM Systeme.
Bei der ersten Gruppe ging es besonders um: Ausarbeitung der Basis Kun-denserviceprogramme, Forschung der Loyalitätsfaktoren in der Automobil-branche, Erstellung der globalen Kundenservicestandards, wie auch Planung der Implementierung und Management von allgemeiner CRM Strategie und ICT-Tools. Zu den Wissensmanagementaktivitäten zählten vor allem die Fort-setzung der Programme für Verbesserung der internen Kommunikation und Implementierung von @sk System, das zu der Registrierung und Weiterge-bung der Informationen abhängig von Bedarf und Befugnisse der Mitarbei-tergruppen dienen sollte. Im Bereich der elektronischen Systeme wurde CRM Abteilung beauftragt die Richtlinien für ein CRM System zu erarbeiten, das
9 Nach Berichten der mehreren Instituten, beträgt die Misserfolgsrate bis zu 70%: 2001 Gartner Group: 70%, 2002 Selling Power, CSO Forum: 69.3%, 2005 AMR Research: 18%, 2006 AMR Research: 31%, 2007 Economist Intelligence Unit: 56%, 2009 Forrester Research: 47%, 2011 Standish Group: 63%.
10 B. Deszczyński, K. Fonfara, Marketing partnerski (relationship marketing) na rynku międzynarodowym, [in:] K. Fonfara (red.), Marketing międzynarodowy, Współczesne trendy i praktyka, PWN, Warszawa 2014.

Die Kooperation zwischen Volkswagen Group und Kulczyk Tradex... 397
in vielen zentralen Systemen der Audi AG fragmentarisierten Kundendaten integrieren sollte.11
Das Interesse von Audi AG an Kundenbeziehungsmanagement beeinflusste ihre Importeure. Die Konzerntochtergesellschaften wie Audi Deutschland, Auto-germa (Italien), Vaesa (Spanien) wie auch private Importeure von europäischen Hauptmärkten wie AMAG (Schweiz) wurden zur Konsultationen eingeladen und beteiligten sich später an der Pilotimplementierungsphase des zentralen CRM Systems (KuBa benannt von Kundendatenbank). Kleinere Firmen, wie Kulczyk Tradex wurden nur über Grundlinien des CRM Projektes informiert. Ohne entsprechende Unterstützung haben einige von ihnen eigene Initiativen unternommen. So war es auch in Polen. Im Jahre 2003 wurde eine kleine CRM Einheit in der Marketingorganisation von Kulczyk Tradex ins Leben berufen.
Das erste Ziel von CRM Einheit war es ein Audit der bisherigen Projekte die für Hauptmarken von Volkswagen Group (Audi, Volkswagen, Volkswagen Nutzfahrzeuge) gestartet wurden durchzuführen. Im Resultat wurden vier Pro-jektbereiche identifiziert:
– Kundendialog, – Kundendialog im Internet (e-CRM), – Kundendatensystem, – Loyalitätsprogramme.
Für den Kundendialog auf Importeurebene war das Customer Care Center (CCC) verantwortlich. Seit 2001 beschäftigte es sich mit Hotline und E-mail Kommunikation wie auch mit Telemarketingkampagnen. Im Bereich von e-CRM wurden keine Aktivitäten identifiziert außer einem online Service (Zusendung der elektronischen Wagenkonfigurationen direkt an die Händler). Seit 2000 verfügte die Firma über eine Kundendatenbank die manuell von Verkaufs- und Servicefakturen eingepflegt wurde. In der selben Zeit haben einige Händler begonnen Acquisupport – ein lokales IT-Software von Audi AG zu nutzen. Die-ses System hatte einige Vertriebsunterstützende Funktionen und eine einfache Workflow die vorwiegend an Kundenprospecting fokussiert war. Unter den Loyalitätsprogrammen wurden nur taktische, Kampagnenorientierte Aktivi-täten identifiziert ohne einen größeren Einfluss auf die langfristige Partner-schaftsbildung.
Der Auditbericht wurde um ein Dokument “Vision von CRM” ergänzt das relativ konkrete Vorhaben beschrieb. Der bedeutsamste Vorschlag war es eine
11 B. Deszczyński, CRM. Strategia, System, Zarządzanie zmianą, Wolter Kluwer, War-szawa 2011.

Bartosz Deszczyński 398
neue Kundendatenbank zu implementieren, die nicht nur allgemeine Kontakt-daten speichert, sondern auch relevante, spezifische Informationen beinhal-tet, die auf verschiedenen organisatorischen Ebenen zu der Fortführung des Kundendialogs beitragen würden. Diese Vorhaben wurden von dem Vorstand von Kulczyk Tradex weder zurückgewiesen noch aktiv unterstützt. Zu dieser Zeit (2003/2004) war das CRM Konzept nicht weitbekannt in Polen und ohne entsprechende Hilfe seitens Volkswagen Group waren die meisten geplanten Aktivitäten stillgelegt. Dennoch dank der ersten CRM Konferenz die von Audi AG im Jahre 2003 organisiert wurde, war der polnische Importeur imstande mit einigen eigenen Initiativen zu beginnen. Diese konzentrierten sich auf:
– Optimierung der bisherigen CRM Aktivitäten, – Implementierung der kostengünstigen Programme, – Perfektionierung von CRM Business Case und Suche nach internen Part-
nern die bereit waren die Marketingabteilung zu unterstützen.Als Beispiel kann man die Aktivierung von CCC nennen, dessen Ziel “Stelle
den Kunden die Information die sie suchen zur Verfügung” um weitere Aufga-ben ergänzt wurde “…und versuche sie auf Basis ihrer erkannten Bedürfnisse zu beraten wie auch ihr Einverständnis für Personendatenbearbeitung von Händ-lern zu sichern.“. Dies forderte eine engere Zusammenarbeit mit dem externen Dienstleister, z.B. bei der Verbesserung des Trainingsystems, Mitarbeitereva-luierungs- und Einstellungsprozesses. Darüber hinaus wurden umfassende Prozeduren eingeführt die erstmals von Best Practices von Audi AG inspiriert worden sind und später an Volkswagen AG CCC-Richtlinien angepasst wurden, mit dem Ziel ein konstantes Niveau der Kundenservice zu sichern. Im Hinblick auf fehlende IT-Unterstützung wurde ein simpler Lead Management Prozess eingeführt, der auf E-mail Kommunikation und MS Excel Berichte basierte. Dies war gleichzeitig der Beginn der Kooperation zwischen dem Importeur und ihren Händler auf CRM Ebene.
Die Beispiele für kleine Marketing Investitionen waren die e-CRM Projekte. Das einfachste von ihnen war ein auf reguläre Basis zirkulierter Newsletter. Die Newsletter Registrierung war mit “My Audi/My Volkswagen” integriert. Dieser ursprünglich für den deutschen Markt konzipierte Service stellte außerdem seinen Usern einige Dienste zur Verfügung, wie z.B. Speicherung der Wagen-konfigurationen, Wagenrestwertrechner, Personalisierung des Newsletters, Beschwerdenformular mit vorerst eingefüllten Daten, usw.
Als schon erwähnt, versuchte die Marketing Abteilung von Kulczyk Tradex die Idee von Kundendatenregistrierung, – Pflege und -Ausnutzung weiterzu-entwickeln, was Einbindung von Händlern, Service Partnern, CCC, Beschwer-
Die Kooperation zwischen Volkswagen Group und Kulczyk Tradex... 399
denmanagement und e-CRM Kommunikation erforderte. Eine ganze Reihe von Vorschlägen wurden erarbeitet – u.a. Kundenserviceprozessen (von ersten Bedarfsdefinition zu dem Aftersales Service). Auch Workshops und Konsultati-onen mit den Händlern wurden geführt. In der Zwischenzeit wurde Acquisup-port auch in dem Volkswagen Händlernetz implementiert und man versuchte die lokalen Partner zu der aktiven Teilnahme an der Pflege der zentralen Kun-dendatenbank zu motivieren.
5. Das CRM System Projekt
Das Acquisupport System war instabil und nur auf Prospecting beschränkt. Das fehlende Schulungsprogramm und IT-Unterstützung trug dazu bei, das nur geringe Zahl der Audi und Volkswagen Händler diese Software nutzte. Die bisherige zentrale Kundendatenbank funktionierte auch mit nur beding-tem Engagement der Händler wegen aufwendiger Datenerhebungsprozedur und ihren Bedenken Kundendaten mit dem Importeur zu teilen. Diese Situ-ation hat sich bisschen verbessert nachdem obligatorische Kundenzufrie-denheitsanalysen von Volkswagen Group eingeführt worden sind. Immerhin blieben aber die Probleme der fehlenden Kundendaten und Verzögerung im Datentausch nicht gelöst.
In dieser Hinsicht hat die Marketing Abteilung einen komplexen Plan für die CRM Implementierung vorbereitet, der umfasste u.a.:
– vorher eingeführten und aktualisierten Kundendienstprogramme, – auf Verkaufserhöhung orientierte Marketingprojekte, – Anforderungen an das zentrale ICT-System, – Business Case für System Implementierung.
Dank der Interesse von Audi AG an CRM Initiativen, wurde einer von den Kulczyk Tradex Vorstandsmitglieder aktiver Sponsor des Projekts und die Ver-treter der Audi AG haben begonnen den polnischen Kollegen Konsultationen zu leisten. Sie haben sich jedoch schnell in ein Feasibility Study von dem KuBa System entwickelt, das zusammen mit SAP für den deutschen Markt vorberei-tet worden war. Dieses hat sich als nicht an Kleinmarktbedürfnisse angepasst erwiesen (von dem Preis und Funktionalität) was im Endeffekt bedeutete, dass Kulczyk Tradex alleine ihr CRM Projekt weiterführen musste.
Im Jahre 2005 hat der polnische Importeur Lizenzen von PeopleSoft Enterprise 8.9 und Implementierungsservice von polnischen IT-Giganten Comarch erworben. Dennoch wegen Budgeteinschränkungen hat sich die
Bartosz Deszczyński 400
Implementierungsphase um ein ganzes Jahr verzögert. Während dieser Zeit wurden zahlreichen Konsultationen mit allen wichtigen internen Partnern wie auch erneut mit den Händlern durchgeführt, die präzise Darlegung der Erwar-tungen an die Funktionalität und Workflow des Systems bringen sollten. Am Ende wurde eine Hundertseitige Dokumentation erstellt die alle Datenfelder und Prozesse beschrieb. Leider hat sich erwiesen, dass ohne aktives Engage-ment von Audi AG genoss diese Projektphase relativ kleine Interesse der ver-schiedenen Stakeholder – mit einigen negativen Konsequenzen, die etwas später geschildert werden.
Die technische Implementierung die für neun Monate vorgesehen wor-den war und im September 2006 beendet sein sollte hat sich bis etwa Februar 2007 verzögert. Dies war auf die Unterschätzung des Anpassungsaufwands von Basisversion des PeopleSoft Systems an die Projektanforderungen zurückzufüh-ren. Dank detaillierter Dokumentation und ihrer direkten Anbindung an dem Implementierungsvertrag hat Comarch die meisten Kosten dafür tragen müs-sen. Aufgrund einiger Veränderungen der geplanten Systemprozesse musste jedoch das Budget um 16% erhöht werden.
6. Volkswagen Group Markendifferenzierung
Bevor das CRM System in der Pilotphase eintrat, wurden in Kulczyk Tra-dex einige strukturelle Veränderungen unternommen, die in einem direkten Zusammenhang mit Markendifferenzierung in der Volkswagen Group standen. Diese strategische Ausrichtung, die besonders im Vertrieb und Marketing sicht-bar war, sollte das Risiko der Konzernmarkenkannibalismus reduzieren. Die zentrale Marketingabteilung von Kulczyk Tradex wurde geteilt und ihre Kom-petenzen und Budget wurden hauptsächlich an drei Marken Business Units transferiert. Die Verantwortlichkeit für CRM Projekt wurde jedoch einer neuen Qualitätsabteilung gegeben.
Formal erhob die Entstehung der Qualitätsabteilung die Bedeutung von Kundenbeziehungsmanagement in Kulczyk Tradex, z.B. dank Zuteilung neues Personals. Dennoch kamen viele neue Probleme auf. Das neue Personal war hauptsächlich bei den Beschwerdenmanagement eingesetzt, das als erstes nach dem Implementierungsplan (seit April 2007) operativ gestartet ist. Dies jedoch lenkte die Aufmerksamkeit des CRM Managers von dem globalen Implemen-tierungsprozess. Darüber hinaus war die organisatorische Position der Quali-
Die Kooperation zwischen Volkswagen Group und Kulczyk Tradex... 401
tätsabteilung schlechter als die der ehemaligen Marketingabteilung und ihre Beziehungen zu den wichtigsten Business Units schwächer.
Ende 2006 wurde ein Trainingsprojekt People and Processes von dem Volks-wagen Business Unit (BU VW) initiiert. Das war die erste derartige Initiative mit Budget nah am Kost der Marketing Kampagnen. Ihr Ziel war eine wesent-liche Qualitätserhöhung der Kundenbetreuung. Zusammen mit Volkswagen AG und einem externen Coachingdienstleister wurde ein Plan erarbeitet der regulären Coachingsessions mit den Händlervertriebsleitern voraussah. Dar-über hinaus wurde eine Pilot Implementierung von CRM System bei drei ausgewählten Händlern und Workshops für fast alle lokalen Managern und Verkäufer vorgesehen.
Dank dem People and Processes Projekt wurde wichtiges Input gesammelt, das dem CRM Team ermöglichte das System an zuerst nicht identifizierten Bedürfnisse anzupassen, was ein positives Resonanz erbrachte. Zu dieser Zeit sind jedoch zwei wichtige Probleme erschienen. Das erste Problem waren die begrenzten Systemkapazitäten. Der Hostingservice von Comarch war nicht imstande eine ununterbrochene Leistung für 20–30 Usern zu leisten. Optimie-rung des Quellcodes verbesserte die Situation jedoch bei dem Einsatz neuer Usergruppen verschlechterten sich die Responsezeiten wiederum. Dank Annex zum Hostingvertrag wurde die Lage etwas besser, aber mit der neuen User-welle hat sich die Geschichte wiederholt. Wegen technischer Probleme haben sich die Coachs nicht für die Systemimplementierung aktiv engagiert. Ende 2007 wurde das System nur von drei Händlern benutzt.
Die Konzeption des neuen Trainingprojekt Retail Sales Excellence (RSE), das von BU VW im Jahre 2008 eingeführt worden ist, ließ CRM System voll-ständig aus. Der Grund dazu hieß, dass es nicht den Ansprüchen von BU VW gerecht war (trotz Engagement ihrer Mitarbeiten in der Implementierungs-gruppe). Das RSE Projekt war jedoch vor allem von Volkswagen AG Europa-weit koordiniert und wegen Probleme mit elektronischen Systemen war die IT-Unterstützung nicht vorgesehen. Im diesem Kontext hat der Vorstand von Kulczyk Tradex eine doppelte Auffassung angenommen. Beide Projekte wur-den weitergeführt jedoch blieben unkoordiniert, was im Endeffekt die „RSE Händler“ von CRM ablenkte.
Nach dem Verlust der Unterstützung von BU VW wurde das CRM Projekt in der Zusammenarbeit von Volkswagen Nutzfahrzeuge (BU VWNF) weiterent-wickelt. Es wurde ein Implementierungsplan vorbereitet, der Rollout des Sys-tems bei einigen Händler ermöglichte. Es ist interessant, dass das Projekt von BU VWNF von Volkswagen AG mitfinanziert wurde. Im Endeffekt unterstützte

Bartosz Deszczyński 402
Volkswagen Group gleichzeitig zwei Projekte: ein schloss das CRM System komplett aus während das andere es in der Mitte der tagtäglichen Arbeit des Verkäufers stellte.
Positives Feedback von BU VWNF erwachten die Aufmerksamkeit der Audi Business Unit (BU Audi), die ihre eigene Implementierungsinitiative initiierte. Die Methode war ähnlich mit Engagement von etwas höheren Mittel, was grö-ßere Häufigkeit der Coachsessions ermöglichte. Das alles trug dazu bei, dass am Ende 2009 fünfzehn Händler das System benutzten. Darüber hinaus wurde auch der Lead Management Prozess mit dem Verkaufsprozess gekoppelt, was CCC und die Händler erstmals in einer einheitlichen digitaler Kommunikati-onsplattform integrierte.12
7. Koordinierte Implementierungsstrategie
Inkohärenz bei dem Projektmanagement in Kulczyk Tradex erreichte ihren Höhepunkt im Jahre 2009. Zu dieser Zeit ist BU VW mit der Planung von RSE IT Applikation begonnen, die im begrenzten Sinne die Rolle des CRM Systems erfühlen sollte.13 Dies brachte einen starken Wiederstand von BU VWNF und BU Audi die hauptsächlich mit dem selben Händlernetz kooperierten. Aufgrund vielseitiger Verständigung wurde eine neue Implementierungswelle initiiert die beide Projekte miteinander verband.
Die neue Initiative wurde für den Zeitraum 2010–2011 geplant. Der Grund für solche Ausdehnung waren limitierte Ressourcen (5 Coachs) im Bezug auf Händlerzahl und Programmintensität (12 Manntage / Händler). Im neuem Projekt waren die Markendifferenzen sichtbar. Audi Verkäufer benutzten die RSE Funktionalität von Volkswagen nicht. BU Audi und BU VWNF haben im Jahre 2011 ein Motivierungsprogramm für ihre Händler eingeführt, das auf quantitativen und qualitativen Kriterien basierte. BU VW folgte ihnen nicht. BU VWNF erlangte die Mitfinanzierung der Schulungen für ihre Händler von Volkswagen AG, BU Audi und BU VW wiederum nicht.
Trotzt solchen Differenzen erreichte das Projekt im Jahre 2011 seine Ziele. Eine der Indizien dafür war das CRM Workshop für Händler aller Marken. Er wurde aktiv von den Vertriebsmanagern mitgeführt, die ihren Kollegen die
12 Dank Digitalisierung von Lead Management wurde entdeckt, dass im Durchschnitt 30% der Kundenkontakte von den Verkäufern nicht angenommen werden.
13 Das System wurde erstmals für den deutschen Markt entwickelt.
Die Kooperation zwischen Volkswagen Group und Kulczyk Tradex... 403
Best Practices zeigten und zu höherem Engagement ermunterten. Außerdem wurden Marketingmöglichkeiten des Systems gezeigt, was eine Vorbereitung auf eine neue Stufe der Projektentwicklung war.
Anderes Beispiel für den Erfolg war die erste zentral gesteuerten Marketing Aktivitäten mit dem Einsatz der Datenbank, Koordinierung von Lead Manage-ment Prozess und Messung der Kampagneneffizienz in Echtzeit. Unter ihnen war besonders die sogenannte „Long-term Lead Management Kampagne” inte-ressant. Ihr Merkmal war eine besonders präzise Kundenselektion. Im End-effekt erzielte diese Kampagne eine sehr hohe Konversionsrate (Erstkontakt – Einkauf) von 8,4% mit Kosten von ca. 350 EUR pro Kontakt.14
Trotz solchen positiven Ergebnissen trat das CRM Projekt Ende 2011 in eine Stagnationsphase. Dies ist auf Eigentumsänderung der Kulczyk Tradex zurück-zuführen. Schon Anfang 2011 wurde immer klarer, dass die Importeursfirma von dem Volkswagen AG übernommen wird. Deswegen hat sich der Vorstand auf kurzfristige Erhöhung von Firmenwert konzentriert. Der neue Vorstand von Volkswagen Group Polska GmbH war dagegen vorwiegend an Zusammen-führung aller seinen Marken in Polen konzentriert – neben Volkswagen und Audi, auch Skoda und Seat. In diesem Prozess wurde Kontinuität des Projekt-managements unterbrochen.
8. Fazit
Das Beispiel der CRM Implementierung zeigt ausdrücklich, wie wichtig die Koordinierung und Zusammenarbeit bei Projekten, die in internationa-len Organisationen geführt werden ist. In diesem Kontext kann die Rolle der Volkswagen AG nur in einer von drei CRM Dimensionen positiv beurteilt wer-den – d.h. bei der Kundenbeziehungsstrategie. Das Interesse an CRM durch Kulczyk Tradex wurde erst dann geweckt, nachdem der deutsche Partner es zu einer seinen Prioritäten erhoben hatte. Auf diese Art und Weise wurden in Polen Lead Management und CCC-Richtlinien eingeführt. Mit diesem ers-ten Anstoß kam jedoch keine kontinuierliche Zusammenarbeit aufgrund der unzureichenden Ressourcen, die für Kleinmärkte eingesetzt werden konnten, wie auch der fehlenden globalen CRM Strategie. Darüber hinaus verzögerten die Fehler bei dem Konzernmarkendifferenzierungsprozess die eigentliche
14 Deszczyński B., Lead Management jako źródło short-term wins w procesie zarządza-nia relacjami z klientami, w: Marketing i Rynek 5/2013, PWE, Warszawa 2013.
Bartosz Deszczyński 404
Einführung des Kundebeziehungsmanagements, was eine volle Entfaltung von ihrem Potenzial verhinderte.
Das beschriebene Fallbeispiel zeigt, wie wichtig es ist die mehrseitige Dif-fusion von Wissen zu fördern, auch wenn sie im Netz ungleichen Partner statt-findet. Bei komplexen Prozessen, die eine Zusammenarbeit der Menschen aus verschiedenen Organisationseinheiten und den Einsatz komplizierter ICT-Sys-tem erfordern, ist einerseits eine einheitliche Koordinierung, anderseits aber auch ein Vertrauen wichtig, um die bestehenden Ressourcen zu Gunsten der verschiedenen Stakeholdergruppen optimal einzusetzen.15 Was sehr positiv ist, dass die Probleme bei der Umsetzung des CRM Implementierungsprozesses im Volkswagennetz in Polen nie von einem negativen politischen, kulturellen oder geschichtlichen Kontext belastet waren. Es heißt also, dass sich die deutsch-pol-nische Zusammenarbeit auf dem geschäftlichen Niveau frei entwickeln kann, wenn auch manchmal aus organisatorischen Gründen nicht immer die opti-malen Effekte sofort erzielt werden können.
Aus dem Beispiel von Volkswagen und Kulczyk Tradex kann auch eine wei-tere bedeutsame Schlussfolgerung gezogen werden. Infolge der politischen und wirtschaftlichen Wende der Jahre 1989/1990 wurde die Bundesrepublik Deutschland Polens wichtigster Handelspartner und Investor. Die Präsenz deut-scher Firmen im polnischen Markt bedeutete einen Investitionszufluss von Geld und Technologie aber auch einen Transfer von moderner Arbeitsweise. Gegen-wärtig können die polnischen Tochtergesellschaften (wie auch unabhängige Partner) eine aktivere Rolle spielen und zu dem Wissenspool der deutschen Fir-men einen Beitrag leisten. Die geschäftlichen Beziehungen sind dann eng und langfristig, wenn die Partner eine relativ gleiche Position haben.16 Das schafft eine Ebene der zukünftigen deutsch-polnischen wirtschaftlichen Zusammen-arbeit, die im Hinblick auf die Europa 2020-Strategie auf technologischen wie auch auf Prozess-Innovationen basieren soll.
15 K. Fonfara i inni., The development of business networks in the company interna-tionalisation process, Wydawnictwo Uniwersytetu Ekonomicznego w Poznaniu 2012 und Ł. Małys, Siła powiązań sieciowych w procesie internacjonalizacji a wyniki przedsiębiorstwa, Difin, Warszawa 2013.
16 D. C. Movery, J. E. Oxley, B. S. Silverman, Technological overlap and interfirm coopera-tion: implications for the resource-based view of the firm, Research Policy 27 (1998), Elsevier 1998 und W. Czakon, Paradygmat sieciowy w naukach o zarządzaniu, Przegląd Organizacji, 2011.
Die Kooperation zwischen Volkswagen Group und Kulczyk Tradex... 405
ZUSAMMENFASSUNG
Transnationale Unternehmen (TNU) spielen eine erhebliche Rolle in der Weltwirt-schaft. Unter den einhundert größten Unternehmen der Welt befinden sich 51 TNU [UNCTAD 2013]. TNU unterhalten beträchtliche Netze der mit ihnen verbundenen kleineren Firmen. Eine der größten Herausforderungen in solchen komplexen Orga-nisationen ist die volle Ausschöpfung des Arbeitspotentials und die Implementie-rung einer innovativen Praxis bei allen Partnern. Entscheidend dabei ist die Rolle der Zusammenarbeit zwischen dem TNU und seinen Partnern. Unter den wichtigs-ten TNU befindet sich die Volkswagen AG, die gleichzeitig das größte staatskont-rollierte TNU der Welt ist [UNCTAD 2015] und seit 1993 1.132 Mrd. EUR in Polen investierte [Instytut Lecha Wałęsy 2015]. Das Ziel dieses Artikels ist die Beschreibung der Zusammenarbeit zwischen der Volkswagen Group und seinem Importeur Kulc-zyk Tradex GmbH in Polen am Beispiel des mehrjährigen CRM Implementierungs-prozesses (Customer Relationship Management). Die Volkswagen Group versuchte diesen Prozess zu steuern, jedoch wegen mangelnder Koordination sowohl auf der Herstellerebene als auch bei seinem Importeur war das nur bedingt möglich, was erhebliche Prozessverzögerungen verursachte.
Schlüsselworte: Audi, Automobilindustrie, CRM, Kundebeziehungsmanagement, Kulczyk Tradex, Volkswagen, Volkswagen Group.
Literatur
Audi AG (2001): Allgemein CRM, Customer Relationship Management I/VM-8, Audi AG interne Bearbeitung, Ingolstadt.
Czakon W. (2011): Paradygmat sieciowy w naukach o zarządzaniu, Przegląd Organizacji.
Deszczynski B. (2007): Uwarunkowania wdrażania CRM w przedsiębiorstwie, Ruch Prawniczy, Ekonomiczny i Socjologiczny, 2/2007.
Deszczyński B. (2011): CRM. Strategia, System, Zarządzanie zmianą, Wolter Kluwer, Warszawa.
Deszczyński B. (2013): Lead Management jako źródło short-term wins w procesie zarządzania relacjami z klientami, w: Marketing i Rynek 5/2013, PWE, Warszawa.
Deszczyński B. (2014): Marketing partnerski (relationship marketing) na rynku mię-dzynarodowym, [in:] K. Fonfara (red.), Marketing międzynarodowy, Współczesne trendy i praktyka, PWN, Warszawa.
Dyche J. (2002): CRM – Relacje z Klientami, Wydawnictwo Helion, Gliwice.
Bartosz Deszczyński 406
Fonfara K., Deszczyński B., Dymitrowski A., Łuczak M., Małys Ł., Ratajczak-Mro-zek M., Soniewicki M., Szczepański R. (2012): The development of business networks in the company internationalisation process, Wydawnictwo Uniwersy-tetu Ekonomicznego w Poznaniu.
Kotler P. i in. (2002): Marketing – Podręcznik europejski, PWE, Warszawa.Małys Ł. (2013): Siła powiązań sieciowych w procesie internacjonalizacji a wyniki
przedsiębiorstwa, Difin, Warszawa.Mazurek-Łopacińska K. (2002): Orientacja na klienta w przedsiębiorstwie, PWE,
Warszawa.Movery D. C., Oxley J. E., Silverman B. S. (1998): Technological overlap and interfirm
cooperation: implications for the resource-based view of the firm, Research Policy 27, Elsevier.
Payne A, Frow P. (2013): Strategic Customer Management, Integrating Relationship Marketing and CRM, Cambridge University Press, Cambridge.