Dewatering at the Capo Xavier Iron Open Pit Mine (Minas ... · assistance of the Spanish consultant...
13
Abstracts of the International Mine Water Conference 19 th – 23 rd October 2009 Proceedings ISBN Number: 978-0-9802623-5-3 Pretoria, South Africa Produced by: Document Transformation Technologies cc Conference organised by: Cilla Taylor Conferences DEWATERING AT THE CAPÃO XAVIER IRON OPEN PIT MINE (MINAS GERAIS, BRAZIL) PROF. RAFAEL FERNÁNDEZ RUBIO 1 , ENG. CÉSAR GRANDCHAMP 2 , ENG. MAURO LOBO DE REZENDE 3 , ENG. DAVID LORCA FERNÁNDEZ 4 and GEOL. ANTÔNIO CARLOS BERTACHINI 5 1 IMWA Founder and Emeritus President. FRASA Consulting Engineers President. Algete, Madrid, Spain; E-mail: [email protected] 2 VALE. Dep. Gerência Técnica de Planejamento Operacional. Senior Geologist. Nova Lima, MG, Brazil; E-mail: [email protected] 3 VALE. Gerente de Meio Ambiente. Diretoria de Ferrosos Sul – DIFL. Nova Lima, MG, Brazil; E-mail: [email protected] 4 FRASA Consulting Engineers. Head of Projects. Algete, Madrid, Spain; E-mail: [email protected] 5 MDGEO Serviços de Hidrogeologia. Director. Belo Horizonte, MG, Brazil; E-mail: [email protected] ABSTRACT Highly detailed hydrological and hydrogeological studies of the areas surrounding the Capão Xavier iron orebody, south of the city of Belo Horizonte (MG, Brazil), began in 1993. Dewatering of the aquifer in which the mineralization is located started in September, 2003, in advance of mining. Open pit mining of 220 million tonnes of ore, most of it below groundwater level, began in June 2004. This paper outlines the dewatering operations, its evolution and the actions taken to minimize the effects of the dewatering on four water systems that supply the city of Belo Horizonte and other residential areas. A very strict monitoring system has ensured that losses have been fully compensated for with water of excellent quality. In addition, all hydrological and environmental objectives have been met; these include the water needs of the mining company, municipal water supply; and additional water required for other uses. This large dewatering operation required the diversion of surface drainage lines, the extraction of groundwater through deep wells, and a dense network of multiple piezometers and equipment to monitor the yield of the springs surrounding the mine area. This paper summarizes the results of over 15 years of accurate monitoring, mainly as regards water pumped for mine dewatering, the effect of dewatering on groundwater levels surrounding the mine area, and the evolution of water outflow in springs. The most important aspect to highlight is the high quality of the mine drainage water compatible to attend the water supply to the city of Belo Horizonte and other nearby urban areas. 1. INTRODUCTION The Capão Xavier mine is located 15 km south of the city of Belo Horizonte at the western border of the Iron Ore Quadrangle (Figure 1), immediately to the north of the Jardim Canadá district (Figure 2). The mine was initiated by MBR in June 2004 and now belongs to Vale, which extracted 19.080 Mt in 2008, with a waste to ore ratio of 0.48. The mine contains 220 million tonnes of high-grade hematite ore reserves. Most of the ore body is part of the Cauê Aquifer, and is located below the water table. The mine also happens to be located near four of the water impoundment areas of Belo Horizonte (in Minas Gerais, Brazil): Mutuca, Fechos, Catarina, and Barreiros. The proximity between the mine and the water impoundments has required detailed hydrogeologic studies to assess the potential impact of mining activities on the water resources. These studies were jointly conducted by the mining company (MBR) and by the public enterprise (COPASA) responsible for the water impoundments and supplying potable water to Belo Horizonte, with the assistance of the Spanish consultant company FRASA and the Ouro Preto University Geology Department (for geological aspects). Based on the 15 years of data that have been collected on volumetric flow rates, piezometry, and hydrochemistry, it is clear that the mining activities and the exploitation of water are compatible. 149
Transcript of Dewatering at the Capo Xavier Iron Open Pit Mine (Minas ... · assistance of the Spanish consultant...
Abstracts of the International Mine Water Conference 19th – 23rd October 2009 Proceedings ISBN Number: 978-0-9802623-5-3 Pretoria, South Africa Produced by: Document Transformation Technologies cc Conference organised by: Cilla Taylor Conferences
DEWATERING AT THE CAPÃO XAVIER IRON OPEN PIT MINE (MINAS GERAIS, BRAZIL)
PROF. RAFAEL FERNÁNDEZ RUBIO1, ENG. CÉSAR GRANDCHAMP2, ENG. MAURO LOBO DE REZENDE3, ENG. DAVID LORCA FERNÁNDEZ4
and GEOL. ANTÔNIO CARLOS BERTACHINI5
1IMWA Founder and Emeritus President. FRASA Consulting Engineers President. Algete, Madrid, Spain; E-mail: [email protected]
2VALE. Dep. Gerência Técnica de Planejamento Operacional. Senior Geologist. Nova Lima, MG, Brazil; E-mail: [email protected]
3VALE. Gerente de Meio Ambiente. Diretoria de Ferrosos Sul – DIFL. Nova Lima, MG, Brazil; E-mail: [email protected]
4FRASA Consulting Engineers. Head of Projects. Algete, Madrid, Spain; E-mail: [email protected] 5MDGEO Serviços de Hidrogeologia. Director. Belo Horizonte, MG, Brazil; E-mail: [email protected]
ABSTRACT
Highly detailed hydrological and hydrogeological studies of the areas surrounding the Capão Xavier iron orebody, south of the city of Belo Horizonte (MG, Brazil), began in 1993. Dewatering of the aquifer in which the mineralization is located started in September, 2003, in advance of mining. Open pit mining of 220 million tonnes of ore, most of it below groundwater level, began in June 2004. This paper outlines the dewatering operations, its evolution and the actions taken to minimize the effects of the dewatering on four water systems that supply the city of Belo Horizonte and other residential areas. A very strict monitoring system has ensured that losses have been fully compensated for with water of excellent quality. In addition, all hydrological and environmental objectives have been met; these include the water needs of the mining company, municipal water supply; and additional water required for other uses. This large dewatering operation required the diversion of surface drainage lines, the extraction of groundwater through deep wells, and a dense network of multiple piezometers and equipment to monitor the yield of the springs surrounding the mine area. This paper summarizes the results of over 15 years of accurate monitoring, mainly as regards water pumped for mine dewatering, the effect of dewatering on groundwater levels surrounding the mine area, and the evolution of water outflow in springs. The most important aspect to highlight is the high quality of the mine drainage water compatible to attend the water supply to the city of Belo Horizonte and other nearby urban areas.
1. INTRODUCTION
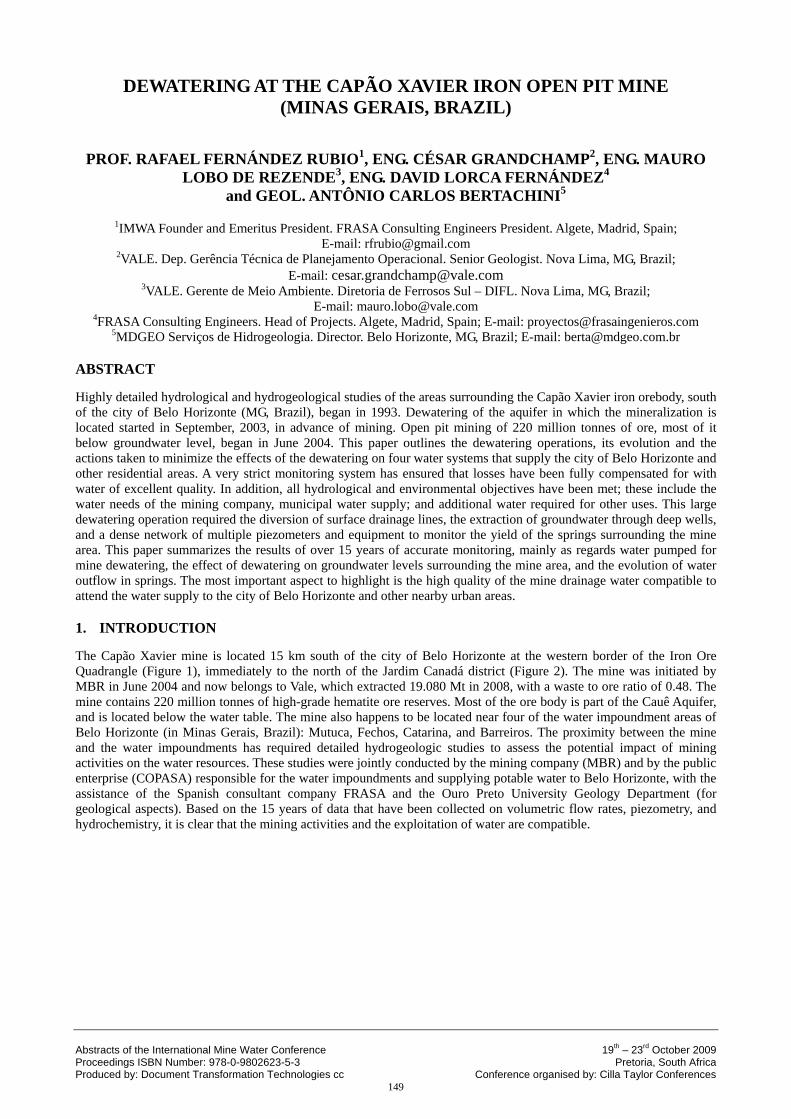
The Capão Xavier mine is located 15 km south of the city of Belo Horizonte at the western border of the Iron Ore Quadrangle (Figure 1), immediately to the north of the Jardim Canadá district (Figure 2). The mine was initiated by MBR in June 2004 and now belongs to Vale, which extracted 19.080 Mt in 2008, with a waste to ore ratio of 0.48. The mine contains 220 million tonnes of high-grade hematite ore reserves. Most of the ore body is part of the Cauê Aquifer, and is located below the water table. The mine also happens to be located near four of the water impoundment areas of Belo Horizonte (in Minas Gerais, Brazil): Mutuca, Fechos, Catarina, and Barreiros. The proximity between the mine and the water impoundments has required detailed hydrogeologic studies to assess the potential impact of mining activities on the water resources. These studies were jointly conducted by the mining company (MBR) and by the public enterprise (COPASA) responsible for the water impoundments and supplying potable water to Belo Horizonte, with the assistance of the Spanish consultant company FRASA and the Ouro Preto University Geology Department (for geological aspects). Based on the 15 years of data that have been collected on volumetric flow rates, piezometry, and hydrochemistry, it is clear that the mining activities and the exploitation of water are compatible.
149
BELOHORIZONTE
0°
60°
BRASIL
AMÉRICADO SUL
CapãoXavier
0 20 km
BELOHORIZONTE
0°
60°
BRASIL
AMÉRICADO SUL
CapãoXavier
0 20 km
South America
Figure 1. Location of Capão Xavier mine, relative to Brazil and the Iron Ore Quadrangle
Figure 2. Mine location close to Jardim Canadá suburb
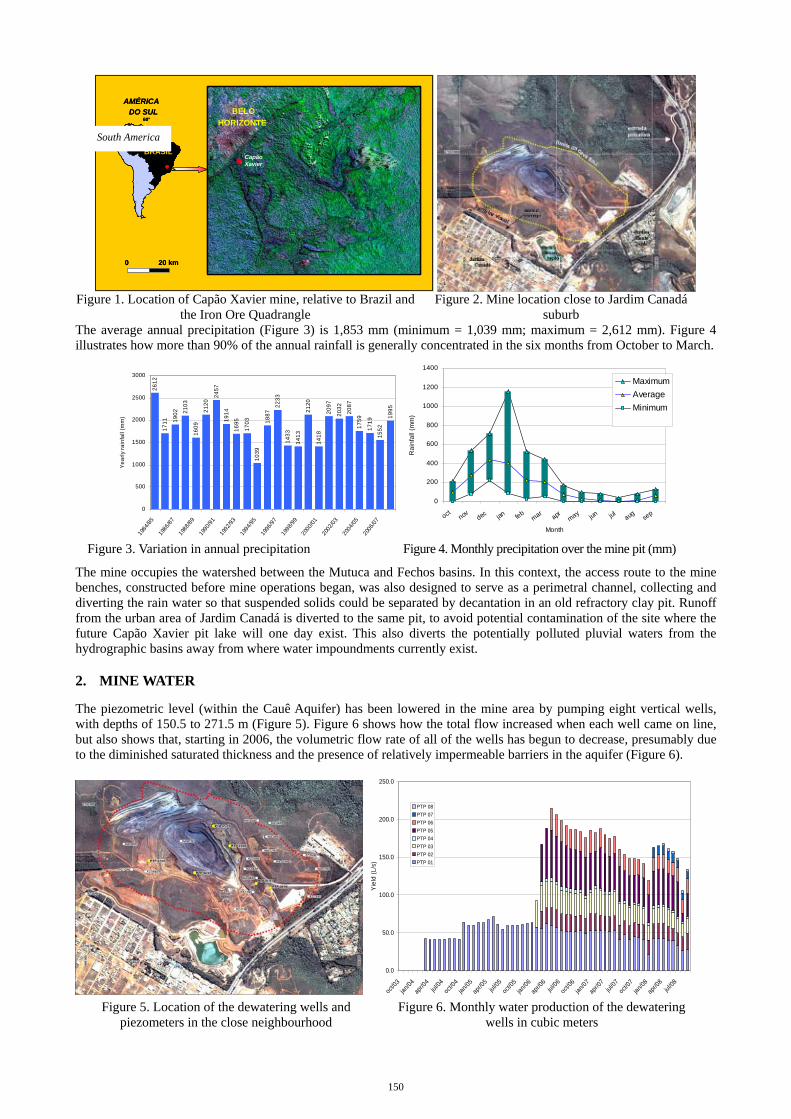
The average annual precipitation (Figure 3) is 1,853 mm (minimum = 1,039 mm; maximum = 2,612 mm). Figure 4 illustrates how more than 90% of the annual rainfall is generally concentrated in the six months from October to March.
2612
1711 19
02 2103
1609
2120
2457
1914
1695
1703
1039
1887
2233
1433
1413
2120
1418
2097
2032
2087
1759
1719
1552
1995
0
500
1000
1500
2000
2500
3000
1984
/8519
86/87
1988
/8919
90/91
1992
/9319
94/95
1996
/9719
98/99
2000
/0120
02/03
2004
/0520
06/07
Yea
rly ra
infa
ll (m
m)
0
200
400
600
800
1000
1200
1400
oct nov dec jan febmar
apr may jun jul aug sep
Month
Rai
nfal
l (m
m)
MaximumAverageMinimum
Figure 3. Variation in annual precipitation Figure 4. Monthly precipitation over the mine pit (mm)
The mine occupies the watershed between the Mutuca and Fechos basins. In this context, the access route to the mine benches, constructed before mine operations began, was also designed to serve as a perimetral channel, collecting and diverting the rain water so that suspended solids could be separated by decantation in an old refractory clay pit. Runoff from the urban area of Jardim Canadá is diverted to the same pit, to avoid potential contamination of the site where the future Capão Xavier pit lake will one day exist. This also diverts the potentially polluted pluvial waters from the hydrographic basins away from where water impoundments currently exist.
2. MINE WATER
The piezometric level (within the Cauê Aquifer) has been lowered in the mine area by pumping eight vertical wells, with depths of 150.5 to 271.5 m (Figure 5). Figure 6 shows how the total flow increased when each well came on line, but also shows that, starting in 2006, the volumetric flow rate of all of the wells has begun to decrease, presumably due to the diminished saturated thickness and the presence of relatively impermeable barriers in the aquifer (Figure 6).
0.0
50.0
100.0
150.0
200.0
250.0
oct/03
jan/04
apr/0
4jul/0
4oct/
04jan
/05apr/
05jul/0
5oct/
05jan/0
6apr/
06jul/0
6oct/
06jan/0
7ap
r/07
jul/07
oct/07
jan/08
apr/08
jul/08
Yie
ld (L
/s)
PTP 08PTP 07PTP 06PTP 05PTP 04PTP 03PTP 02PTP 01
Figure 5. Location of the dewatering wells and
piezometers in the close neighbourhood Figure 6. Monthly water production of the dewatering
wells in cubic meters
150
Modelling has shown that mine dewatering could interfere with the volumetric flow rate in some water impoundments (especially the Fechos and Mutuca basins) and impact some third party wells (mainly in the Jardim Canada district and wells supplying the Jardim Monte Verde condominium).
At the end of the life of mine, it is expected that the dewatering wells will be gradually deactivated. The Capão Xavier pit will be inundated in a gradual and natural manner, until the water reaches an elevation of 1,327 m above sea level, at which point water will be diverted by a spillway to the Mutuca basin. The mine lake will become a reservoir, which will increase both the public water supply and the diversity of aquatic life in the area.
The gradual increase in the piezometric level will allow flow rates in affected wells and water springs to recover. Vale will furnish water equivalent to the remnant impacts to the springs or wells until the original hydrologic regime is re-established. Monitoring of the springs and piezometers will continue until this occurs.
The piezometric level of the Cauê Aquifer before pit dewatering began ranged between 1,320 and 1,340 m above sea level. Thus, the pit lake can be used as a regulation reservoir, since it should discharge to the Mutuca basin during the rainy season, but can be pumped over a small manometric height during the dry season to increase the supply capacities of both the Mutuca and Fechos systems. This will allow joint management of the capacities of the lake and the Cauê Aquifer.
Collected data on pluviometric-evaporation balances, the dimensions of the involved basin and mine pit, and the anticipated evolution of water levels infers that the filling process will take around 15 years, though it could require more time depending on how much water is pumped to augment the public water supply and to circumvent possible remnant hydrological impacts. The water quality of the lake water should be very good due the low mineralization of the filling waters, the low solubility of the involved metamorphic rocks, and the positive hydrologic balance, which will reduce the risks of salinization and eutrophication.
3. HYDROLOGY
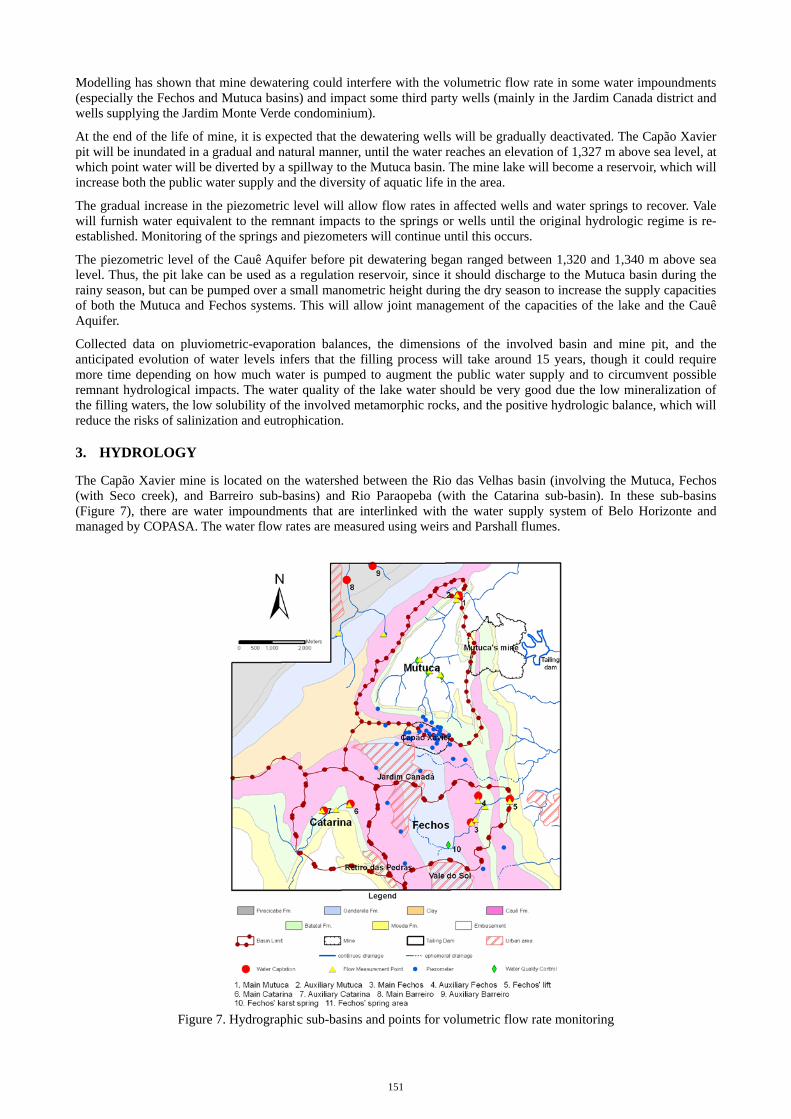
The Capão Xavier mine is located on the watershed between the Rio das Velhas basin (involving the Mutuca, Fechos (with Seco creek), and Barreiro sub-basins) and Rio Paraopeba (with the Catarina sub-basin). In these sub-basins (Figure 7), there are water impoundments that are interlinked with the water supply system of Belo Horizonte and managed by COPASA. The water flow rates are measured using weirs and Parshall flumes.
Figure 7. Hydrographic sub-basins and points for volumetric flow rate monitoring
151
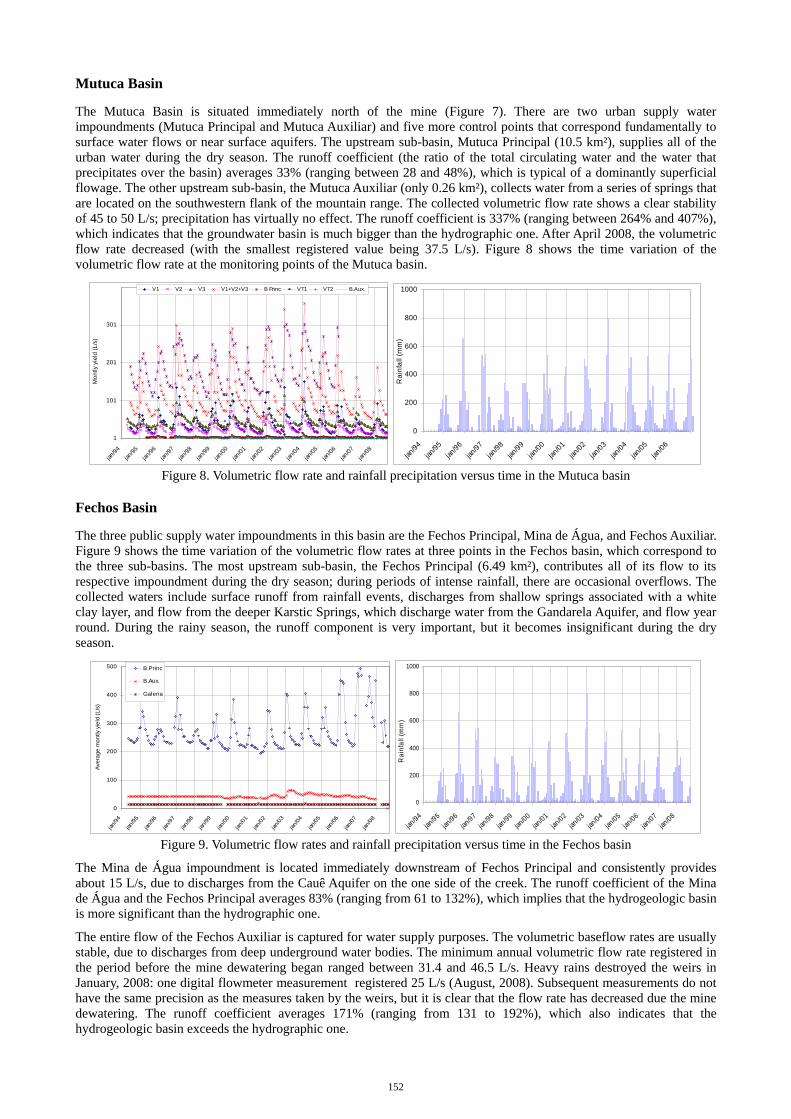
Mutuca Basin
The Mutuca Basin is situated immediately north of the mine (Figure 7). There are two urban supply water impoundments (Mutuca Principal and Mutuca Auxiliar) and five more control points that correspond fundamentally to surface water flows or near surface aquifers. The upstream sub-basin, Mutuca Principal (10.5 km²), supplies all of the urban water during the dry season. The runoff coefficient (the ratio of the total circulating water and the water that precipitates over the basin) averages 33% (ranging between 28 and 48%), which is typical of a dominantly superficial flowage. The other upstream sub-basin, the Mutuca Auxiliar (only 0.26 km²), collects water from a series of springs that are located on the southwestern flank of the mountain range. The collected volumetric flow rate shows a clear stability of 45 to 50 L/s; precipitation has virtually no effect. The runoff coefficient is 337% (ranging between 264% and 407%), which indicates that the groundwater basin is much bigger than the hydrographic one. After April 2008, the volumetric flow rate decreased (with the smallest registered value being 37.5 L/s). Figure 8 shows the time variation of the volumetric flow rate at the monitoring points of the Mutuca basin.
1
101
201
301
jan/94
jan/95
jan/96
jan/97
jan/98
jan/99
jan/00
jan/01
jan/02
jan/03
jan/04
jan/05
jan/06
jan/07
jan/08
Mon
tly y
ield
(L/s
)
V1 V2 V3 V1+V2+V3 B Princ VT1 VT2 B.Aux.
0
200
400
600
800
1000
jan/94
jan/95
jan/96
jan/97
jan/98
jan/99
jan/00
jan/01
jan/02
jan/03
jan/04
jan/05
jan/06
Rai
nfal
l (m
m)
Figure 8. Volumetric flow rate and rainfall precipitation versus time in the Mutuca basin
Fechos Basin
The three public supply water impoundments in this basin are the Fechos Principal, Mina de Água, and Fechos Auxiliar. Figure 9 shows the time variation of the volumetric flow rates at three points in the Fechos basin, which correspond to the three sub-basins. The most upstream sub-basin, the Fechos Principal (6.49 km²), contributes all of its flow to its respective impoundment during the dry season; during periods of intense rainfall, there are occasional overflows. The collected waters include surface runoff from rainfall events, discharges from shallow springs associated with a white clay layer, and flow from the deeper Karstic Springs, which discharge water from the Gandarela Aquifer, and flow year round. During the rainy season, the runoff component is very important, but it becomes insignificant during the dry season.
0
100
200
300
400
500
jan/94
jan/95
jan/96
jan/97
jan/98
jan/99
jan/00
jan/01
jan/02
jan/03
jan/04
jan/05
jan/06
jan/07
jan/08
Ave
rage
mon
tly y
ield
(L/s
)
B.Princ
B.Aux.
Galeria
0
200
400
600
800
1000
jan/94
jan/95
jan/96
jan/97
jan/98
jan/99
jan/00
jan/01
jan/02
jan/03
jan/04
jan/05
jan/06
jan/07
jan/08
Rai
nfal
l (m
m)
Figure 9. Volumetric flow rates and rainfall precipitation versus time in the Fechos basin
The Mina de Água impoundment is located immediately downstream of Fechos Principal and consistently provides about 15 L/s, due to discharges from the Cauê Aquifer on the one side of the creek. The runoff coefficient of the Mina de Água and the Fechos Principal averages 83% (ranging from 61 to 132%), which implies that the hydrogeologic basin is more significant than the hydrographic one.
The entire flow of the Fechos Auxiliar is captured for water supply purposes. The volumetric baseflow rates are usually stable, due to discharges from deep underground water bodies. The minimum annual volumetric flow rate registered in the period before the mine dewatering began ranged between 31.4 and 46.5 L/s. Heavy rains destroyed the weirs in January, 2008: one digital flowmeter measurement registered 25 L/s (August, 2008). Subsequent measurements do not have the same precision as the measures taken by the weirs, but it is clear that the flow rate has decreased due the mine dewatering. The runoff coefficient averages 171% (ranging from 131 to 192%), which also indicates that the hydrogeologic basin exceeds the hydrographic one.
152
Catarina Basin
This basin is located southwest of the mine and contains two impoundments for public water supply: Catarina Principal and Catarina Auxiliar. Catarina Principal (0.87 km2) is located at the base of the Piedade Range and collects most of its water from the Cauê Aquifer. The influence of surface runoff is very small. The runoff coefficient averages 183%, which indicates that the hydrographic basin is much smaller than the hydrogeologic one (which extends to the north plateau of Moeda Syncline and Moeda range). Observed flow rates at Catarina Principal have decreased, which may be due to the mine dewatering but may also be due to the exploitation of water wells by third parties, as will be discussed later in this paper.
Catarina Auxiliar (0.70 km2) is also located at the base of the Piedade Range and collects water from several springs. The sub-basin minimum flow (baseflow) varies, apparently randomly, all year long (low values do not necessarily correspond to the dry season), between 41.6 (in 2001) and 56.1 L/s. Flow from the impoundment shows less variation, but flow rates have been diminishing for three consecutive years. The runoff coefficient averages 128%, which indicates that the hydrogeologic basin is much bigger than the hydrographic one. The groundwater basin is probably not limited by the Piedade Range and may extend to the Serra do Curral Homoclinal.
Barreiro Basin
The impoundments in this basin are the Alto Barreiro and Baixo Barreiro. The V7 control point is also located in this basin. The baseflow of the Alto Barreiro sub-basin (5.58 km2), based on the minimum volumetric flows, ranges from 43.1 (in 2001) to 61.1 L/s; these are generally associated with the end of the dry season, from August to October.
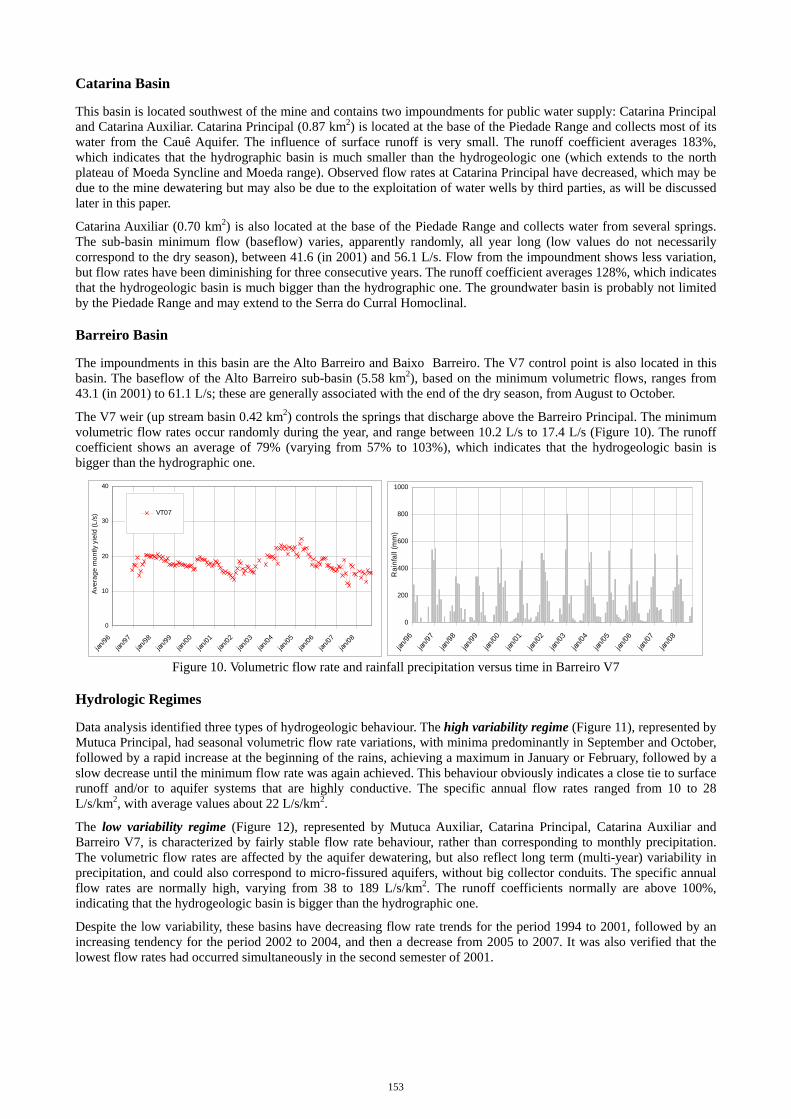
The V7 weir (up stream basin 0.42 km2) controls the springs that discharge above the Barreiro Principal. The minimum volumetric flow rates occur randomly during the year, and range between 10.2 L/s to 17.4 L/s (Figure 10). The runoff coefficient shows an average of 79% (varying from 57% to 103%), which indicates that the hydrogeologic basin is bigger than the hydrographic one.
0
10
20
30
40
jan/96
jan/97
jan/98
jan/99
jan/00
jan/01
jan/02
jan/03
jan/04
jan/05
jan/06
jan/07
jan/08
Aver
age
mon
tly y
ield
(L/s
) VT07
0
200
400
600
800
1000
jan/96
jan/97
jan/98
jan/99
jan/00
jan/01
jan/02
jan/03
jan/04
jan/05
jan/06
jan/07
jan/08
Rai
nfal
l (m
m)
Figure 10. Volumetric flow rate and rainfall precipitation versus time in Barreiro V7
Hydrologic Regimes
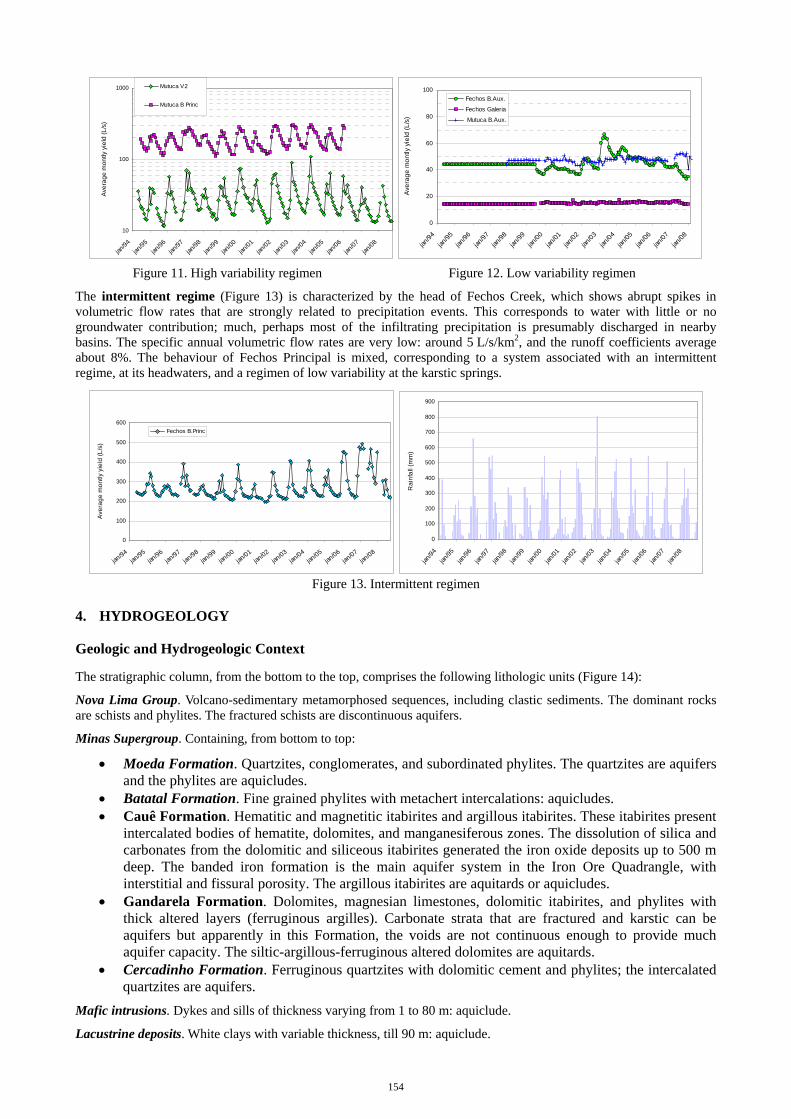
Data analysis identified three types of hydrogeologic behaviour. The high variability regime (Figure 11), represented by Mutuca Principal, had seasonal volumetric flow rate variations, with minima predominantly in September and October, followed by a rapid increase at the beginning of the rains, achieving a maximum in January or February, followed by a slow decrease until the minimum flow rate was again achieved. This behaviour obviously indicates a close tie to surface runoff and/or to aquifer systems that are highly conductive. The specific annual flow rates ranged from 10 to 28 L/s/km2, with average values about 22 L/s/km2.
The low variability regime (Figure 12), represented by Mutuca Auxiliar, Catarina Principal, Catarina Auxiliar and Barreiro V7, is characterized by fairly stable flow rate behaviour, rather than corresponding to monthly precipitation. The volumetric flow rates are affected by the aquifer dewatering, but also reflect long term (multi-year) variability in precipitation, and could also correspond to micro-fissured aquifers, without big collector conduits. The specific annual flow rates are normally high, varying from 38 to 189 L/s/km2. The runoff coefficients normally are above 100%, indicating that the hydrogeologic basin is bigger than the hydrographic one.
Despite the low variability, these basins have decreasing flow rate trends for the period 1994 to 2001, followed by an increasing tendency for the period 2002 to 2004, and then a decrease from 2005 to 2007. It was also verified that the lowest flow rates had occurred simultaneously in the second semester of 2001.
153
10
100
1000
jan/94
jan/95
jan/96
jan/97
jan/98
jan/99
jan/00
jan/01
jan/02
jan/03
jan/04
jan/05
jan/06
jan/07
jan/08
Ave
rage
mon
tly y
ield
(L/s
)
Mutuca V2
Mutuca B Princ
0
20
40
60
80
100
jan/94
jan/95
jan/96
jan/97
jan/98
jan/99
jan/00
jan/01
jan/02
jan/03
jan/04
jan/05
jan/06
jan/07
jan/08
Ave
rage
mon
tly y
ield
(L/s
)
Fechos B.Aux.
Fechos Galeria
Mutuca B.Aux.
Figure 11. High variability regimen Figure 12. Low variability regimen
The intermittent regime (Figure 13) is characterized by the head of Fechos Creek, which shows abrupt spikes in volumetric flow rates that are strongly related to precipitation events. This corresponds to water with little or no groundwater contribution; much, perhaps most of the infiltrating precipitation is presumably discharged in nearby basins. The specific annual volumetric flow rates are very low: around 5 L/s/km2, and the runoff coefficients average about 8%. The behaviour of Fechos Principal is mixed, corresponding to a system associated with an intermittent regime, at its headwaters, and a regimen of low variability at the karstic springs.
0
100
200
300
400
500
600
jan/94
jan/95
jan/96
jan/97
jan/98
jan/99
jan/00
jan/01
jan/02
jan/03
jan/04
jan/05
jan/06
jan/07
jan/08
Ave
rage
mon
tly y
ield
(L/s
)
Fechos B.Princ
0
100
200
300
400
500
600
700
800
900
jan/94
jan/95
jan/96
jan/97
jan/98
jan/99
jan/00
jan/01
jan/02
jan/03
jan/04
jan/05
jan/06
jan/07
jan/08
Rai
nfal
l (m
m)
Figure 13. Intermittent regimen
4. HYDROGEOLOGY
Geologic and Hydrogeologic Context
The stratigraphic column, from the bottom to the top, comprises the following lithologic units (Figure 14):
Nova Lima Group. Volcano-sedimentary metamorphosed sequences, including clastic sediments. The dominant rocks are schists and phylites. The fractured schists are discontinuous aquifers.
Minas Supergroup. Containing, from bottom to top:
• Moeda Formation. Quartzites, conglomerates, and subordinated phylites. The quartzites are aquifers and the phylites are aquicludes.
• Batatal Formation. Fine grained phylites with metachert intercalations: aquicludes. • Cauê Formation. Hematitic and magnetitic itabirites and argillous itabirites. These itabirites present
intercalated bodies of hematite, dolomites, and manganesiferous zones. The dissolution of silica and carbonates from the dolomitic and siliceous itabirites generated the iron oxide deposits up to 500 m deep. The banded iron formation is the main aquifer system in the Iron Ore Quadrangle, with interstitial and fissural porosity. The argillous itabirites are aquitards or aquicludes.
• Gandarela Formation. Dolomites, magnesian limestones, dolomitic itabirites, and phylites with thick altered layers (ferruginous argilles). Carbonate strata that are fractured and karstic can be aquifers but apparently in this Formation, the voids are not continuous enough to provide much aquifer capacity. The siltic-argillous-ferruginous altered dolomites are aquitards.
• Cercadinho Formation. Ferruginous quartzites with dolomitic cement and phylites; the intercalated quartzites are aquifers.
Mafic intrusions. Dykes and sills of thickness varying from 1 to 80 m: aquiclude.
Lacustrine deposits. White clays with variable thickness, till 90 m: aquiclude.
154
Cangas and laterites. Compact fragments of hematite and itabirites cemented by limonites; localized deposit of bauxite; this unconsolidated aquifer has high porosity and hydraulic conductivity.
Eluvial, coluvial and alluvial deposits. Sands, silts, and argilles, mixed with itabiritic, hematitic, quartzites, and dolomitic boulders eventually cemented by limonites. These unconsolidated deposits are shallow circulation aquifers, with good storage coefficient and variable hydraulic conductivity.
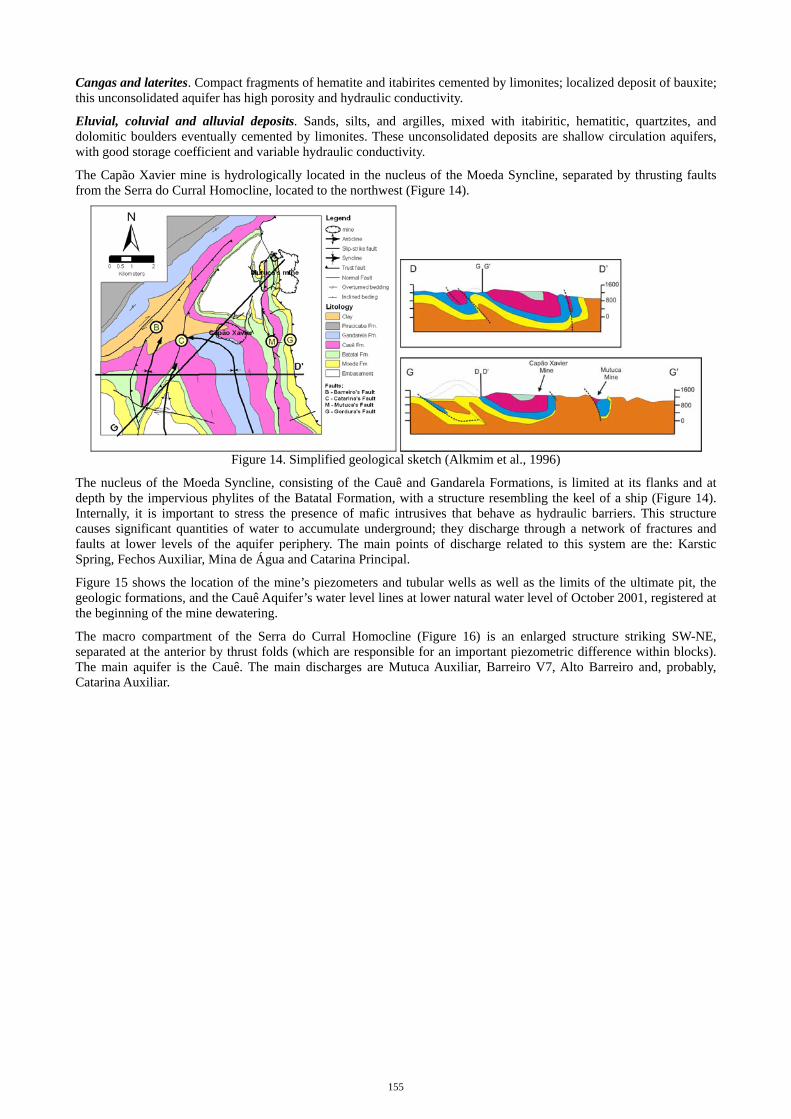
The Capão Xavier mine is hydrologically located in the nucleus of the Moeda Syncline, separated by thrusting faults from the Serra do Curral Homocline, located to the northwest (Figure 14).
Figure 14. Simplified geological sketch (Alkmim et al., 1996)
The nucleus of the Moeda Syncline, consisting of the Cauê and Gandarela Formations, is limited at its flanks and at depth by the impervious phylites of the Batatal Formation, with a structure resembling the keel of a ship (Figure 14). Internally, it is important to stress the presence of mafic intrusives that behave as hydraulic barriers. This structure causes significant quantities of water to accumulate underground; they discharge through a network of fractures and faults at lower levels of the aquifer periphery. The main points of discharge related to this system are the: Karstic Spring, Fechos Auxiliar, Mina de Água and Catarina Principal.
Figure 15 shows the location of the mine’s piezometers and tubular wells as well as the limits of the ultimate pit, the geologic formations, and the Cauê Aquifer’s water level lines at lower natural water level of October 2001, registered at the beginning of the mine dewatering.
The macro compartment of the Serra do Curral Homocline (Figure 16) is an enlarged structure striking SW-NE, separated at the anterior by thrust folds (which are responsible for an important piezometric difference within blocks). The main aquifer is the Cauê. The main discharges are Mutuca Auxiliar, Barreiro V7, Alto Barreiro and, probably, Catarina Auxiliar.
155

Escala Gráfica
1 km
CONDOMÍNIOCONDOMÍNIOCONDOMÍNIOCONDOMÍNIOCONDOMÍNIOCONDOMÍNIOCONDOMÍNIOCONDOMÍNIOCONDOMÍNIOVALE DO SOLVALE DO SOLVALE DO SOLVALE DO SOLVALE DO SOLVALE DO SOLVALE DO SOLVALE DO SOLVALE DO SOL
CONDOMÍNIOCONDOMÍNIOCONDOMÍNIOCONDOMÍNIOCONDOMÍNIOCONDOMÍNIOCONDOMÍNIOCONDOMÍNIOCONDOMÍNIOJARDIM MONTEJARDIM MONTEJARDIM MONTEJARDIM MONTEJARDIM MONTEJARDIM MONTEJARDIM MONTEJARDIM MONTEJARDIM MONTE
VERDE VERDE VERDE VERDE VERDE VERDE VERDE VERDE VERDE
BR-0
40BR
-040
BR-0
40BR
-040
BR-0
40BR
-040
BR-0
40BR
-040
BR-0
40BR
-040
BR-0
40BR
-040
BR-0
40BR
-040
BR-0
40BR
-040
BR-0
40BR
-040
BR-0
40BR
-040
BR-0
40BR
-040
BR-0
40BR
-040
BR-0
40BR
-040
BR-0
40BR
-040
BR-0
40BR
-040
BR-0
40BR
-040
BR-0
40BR
-040
BR-0
40BR
-040
BR-0
40BR
-040
BR-0
40BR
-040
BR-0
40BR
-040
BR-0
40BR
-040
BR-0
40BR
-040
BR-0
40BR
-040
BR-0
40
BAIRROBAIRROBAIRROBAIRROBAIRROBAIRROBAIRROBAIRROBAIRRO JARDIM JARDIM JARDIM JARDIM JARDIM JARDIM JARDIM JARDIM JARDIM CANADÁ CANADÁ CANADÁ CANADÁ CANADÁ CANADÁ CANADÁ CANADÁ CANADÁ
CONDOMÍNIOCONDOMÍNIOCONDOMÍNIOCONDOMÍNIOCONDOMÍNIOCONDOMÍNIOCONDOMÍNIOCONDOMÍNIOCONDOMÍNIORETIRO DAS PEDRASRETIRO DAS PEDRASRETIRO DAS PEDRASRETIRO DAS PEDRASRETIRO DAS PEDRASRETIRO DAS PEDRASRETIRO DAS PEDRASRETIRO DAS PEDRASRETIRO DAS PEDRAS CONDOMÍNIOCONDOMÍNIOCONDOMÍNIOCONDOMÍNIOCONDOMÍNIOCONDOMÍNIOCONDOMÍNIOCONDOMÍNIOCONDOMÍNIO
SERRA DOSSERRA DOSSERRA DOSSERRA DOSSERRA DOSSERRA DOSSERRA DOSSERRA DOSSERRA DOSMANACÁSMANACÁSMANACÁSMANACÁSMANACÁSMANACÁSMANACÁSMANACÁSMANACÁS
CaptaçãoCaptaçãoCaptaçãoCaptaçãoCaptaçãoCaptaçãoCaptaçãoCaptaçãoCaptaçãoCatarina PrincipalCatarina PrincipalCatarina PrincipalCatarina PrincipalCatarina PrincipalCatarina PrincipalCatarina PrincipalCatarina PrincipalCatarina Principal
CaptaçãoCaptaçãoCaptaçãoCaptaçãoCaptaçãoCaptaçãoCaptaçãoCaptaçãoCaptaçãoCatarina AuxiliarCatarina AuxiliarCatarina AuxiliarCatarina AuxiliarCatarina AuxiliarCatarina AuxiliarCatarina AuxiliarCatarina AuxiliarCatarina Auxiliar
Captação Captação Captação Captação Captação Captação Captação Captação Captação Fechos PrincipalFechos PrincipalFechos PrincipalFechos PrincipalFechos PrincipalFechos PrincipalFechos PrincipalFechos PrincipalFechos Principal
Captação Captação Captação Captação Captação Captação Captação Captação Captação Fechos AuxiliarFechos AuxiliarFechos AuxiliarFechos AuxiliaFechos AuxiliaFechos AuxiliaFechos AuxiliaFechos AuxiliaFechos Auxilia
INA 26/93INA 26/93INA 26/93INA 26/93INA 26/93INA 26/93INA 26/93INA 26/93INA 26/93
INA-32/99INA-32/99INA-32/99INA-32/99INA-32/99INA-32/99INA-32/99INA-32/99INA-32/99
INA-33/99INA-33/99INA-33/99INA-33/99INA-33/99INA-33/99INA-33/99INA-33/99INA-33/99
INA-30/99INA-30/99INA-30/99INA-30/99INA-30/99INA-30/99INA-30/99INA-30/99INA-30/99
PZ06/91PZ06/91PZ06/91PZ06/91PZ06/91PZ06/91PZ06/91PZ06/91PZ06/91
PZ12/92PZ12/92PZ12/92PZ12/92PZ12/92PZ12/92PZ12/92PZ12/92PZ12/92
INA 02/02INA 02/02INA 02/02INA 02/02INA 02/02INA 02/02INA 02/02INA 02/02INA 02/02
PZ14/92PZ14/92PZ14/92PZ14/92PZ14/92PZ14/92PZ14/92PZ14/92PZ14/92PZ11/92PZ11/92PZ11/92PZ11/92PZ11/92PZ11/92PZ11/92PZ11/92PZ11/92
PZ17/92PZ17/92PZ17/92PZ17/92PZ17/92PZ17/92PZ17/92PZ17/92PZ17/92 INA 01/93INA 01/93INA 01/93INA 01/93INA 01/93INA 01/93INA 01/93INA 01/93INA 01/93
INA02/91INA02/91INA02/91INA02/91INA02/91INA02/91INA02/91INA02/91INA02/91
INA20/93INA20/93INA20/93INA20/93INA20/93INA20/93INA20/93INA20/93INA20/93
INA24/93INA24/93INA24/93INA24/93INA24/93INA24/93INA24/93INA24/93INA24/93
INA23/93INA23/93INA23/93INA23/93INA23/93INA23/93INA23/93INA23/93INA23/93
PZ15/92PZ15/92PZ15/92PZ15/92PZ15/92PZ15/92PZ15/92PZ15/92PZ15/92
PZ-31/99PZ-31/99PZ-31/99PZ-31/99PZ-31/99PZ-31/99PZ-31/99PZ-31/99PZ-31/99
PZ01/91PZ01/91PZ01/91PZ01/91PZ01/91PZ01/91PZ01/91PZ01/91PZ01/91
INA28/93INA28/93INA28/93INA28/93INA28/93INA28/93INA28/93INA28/93INA28/93
PZ16/92PZ16/92PZ16/92PZ16/92PZ16/92PZ16/92PZ16/92PZ16/92PZ16/92
INA19/93INA19/93INA19/93INA19/93INA19/93INA19/93INA19/93INA19/93INA19/93
INA 21/93INA 21/93INA 21/93INA 21/93INA 21/93INA 21/93INA 21/93INA 21/93INA 21/93
PZ-34/99PZ-34/99PZ-34/99PZ-34/99PZ-34/99PZ-34/99PZ-34/99PZ-34/99PZ-34/99
INAPC09/93INAPC09/93INAPC09/93INAPC09/93INAPC09/93INAPC09/93INAPC09/93INAPC09/93INAPC09/93
PZ04/91PZ04/91PZ04/91PZ04/91PZ04/91PZ04/91PZ04/91PZ04/91PZ04/91
PZ08/91PZ08/91PZ08/91PZ08/91PZ08/91PZ08/91PZ08/91PZ08/91PZ08/91
INA13/92INA13/92INA13/92INA13/92INA13/92INA13/92INA13/92INA13/92INA13/92
INA18/93INA18/93INA18/93INA18/93INA18/93INA18/93INA18/93INA18/93INA18/93
INAPC22/93INAPC22/93INAPC22/93INAPC22/93INAPC22/93INAPC22/93INAPC22/93INAPC22/93INAPC22/93
INA-36INA-36INA-36INA-36INA-36INA-36INA-36INA-36INA-36
PZ-29PZ-29PZ-29PZ-29PZ-29PZ-29PZ-29PZ-29PZ-29
Figure 15. Cauê Aquifer water level isolines in the nucleus of Moeda Syncline (October 2001) Figure 16. Hydrogeologic basins (Mourão, 2007)
Piezometry
Monthly water level data were collected from around 70 piezometers (some of which were simple boreholes and some of which contained two or three chambers) for a period of 15 years. In general, the piezometric levels reflect the pluviometry. The piezometric maxima generally occur during February and March, two or three months after the start of the rainy season. When the rains stop, the descent of the piezometric curve is slow and constant, indicating a continuous discharge in a media of moderate permeability, without major preferential conduits.
The unconsolidated aquifers show, in general, a rapid recharge followed by an also quick discharge, with seasonal variations of the water level varying from 10 to 30 m. During the rainy season, the water level reaches the topographic surface at the suburb, Jardim Canadá, producing a great number of natural springs.
The data collected by the piezometers equipped with more than one chamber (Figure 17) show that the entire mine neighbourhood is a region of aquifer recharge. The blue vertical line represents the beginning of the mine dewatering; it is evident that the piezometry is being affected.
In the case of piezometers where the superior chamber is installed in the unconsolidated aquifer and the lower chamber is in the Cauê Aquifer, with a clay layer isolating these chambers, the deep aquifer is more intensely affected by the mine dewatering (Figure 18); the clay barrier reduces the effect that lowering of the water level has on the unconsolidated aquifer.
1300
1310
1320
1330
1340
1350
1360
Oct-91
Oct-92
Oct-93
Oct-94
Oct-95
Oct-96
Oct-97
Oct-98
Oct-99
Oct-00
Oct-01
Oct-02
Oct-03
Oct-04
Oct-05
Oct-06
Oct-07
Oct-08
Met
er a
bove
sea
leve
l (m
)
PZ 12/92 - A
PZ 12/92 - B
PZ 12/92 - C
Mine dew atering1285
1295
1305
1315
1325
1335
1345
Oct-91
Oct-92
Oct-93
Oct-94
Oct-95
Oct-96
Oct-97
Oct-98
Oct-99
Oct-00
Oct-01
Oct-02
Oct-03
Oct-04
Oct-05
Oct-06
Oct-07
Oct-08
Met
er a
bove
sea
leve
l (m
)
PZ 10/92 - A
PZ 10/92 - B
PZ 10/92 - C
Mine dew atering
Figure 17. Piezometer with multiple observation chambers within the Cauê Aquifer
Figure 18. Multiple piezometers within unconsolidated aquifers and the Cauê Aquifer
156

Piezometric Zoning
Based on piezometric behaviour, the Capão Xavier mine area was divided into six domains (Figure 19). In Domain A, the piezometers present almost identical behaviour, indicating a highly permeable media (the Cauê Aquifer) (Figure 20). The water level oscillates around the 1,280 m level and the seasonal variations are small (only 2 m). Pluriannual variations occur within this sector, with minimum values registered in 2001 and 2007. In the unconsolidated aquifer, the water level is situated above an elevation of 1,315 m. Mine dewatering apparently did not affect either the Cauê or the unconsolidated aquifer.
CaptaçãoPrincipal de
Fechos
CaptaçãoAuxiliar de
FechosCaptaçãoPrincipal deCatarina
B
A
BC
C
D
E
F
G
INAPC01/93INAPC01/93INAPC01/93INAPC01/93INAPC01/93INAPC01/93INAPC01/93INAPC01/93INAPC01/93
PZ17/92PZ17/92PZ17/92PZ17/92PZ17/92PZ17/92PZ17/92PZ17/92PZ17/92 PZ11/92PZ11/92PZ11/92PZ11/92PZ11/92PZ11/92PZ11/92PZ11/92PZ11/92PZ-29PZ-29PZ-29PZ-29PZ-29PZ-29PZ-29PZ-29PZ-29
INA28/93INA28/93INA28/93INA28/93INA28/93INA28/93INA28/93INA28/93INA28/93
PZ12/92PZ12/92PZ12/92PZ12/92PZ12/92PZ12/92PZ12/92PZ12/92PZ12/92
INAPC22/93INAPC22/93INAPC22/93INAPC22/93INAPC22/93INAPC22/93INAPC22/93INAPC22/93INAPC22/93
PZ02/02PZ02/02PZ02/02PZ02/02PZ02/02PZ02/02PZ02/02PZ02/02PZ02/02
PZ14/92PZ14/92PZ14/92PZ14/92PZ14/92PZ14/92PZ14/92PZ14/92PZ14/92
INA-30INA-30INA-30INA-30INA-30INA-30INA-30INA-30INA-30
INA-36INA-36INA-36INA-36INA-36INA-36INA-36INA-36INA-36
INAPC21/93INAPC21/93INAPC21/93INAPC21/93INAPC21/93INAPC21/93INAPC21/93INAPC21/93INAPC21/93
INA23/93INA23/93INA23/93INA23/93INA23/93INA23/93INA23/93INA23/93INA23/93
PZ-34PZ-34PZ-34PZ-34PZ-34PZ-34PZ-34PZ-34PZ-34
INA14/06INA14/06INA14/06INA14/06INA14/06INA14/06INA14/06INA14/06INA14/06
INA13/06INA13/06INA13/06INA13/06INA13/06INA13/06INA13/06INA13/06INA13/06
INA10/06INA10/06INA10/06INA10/06INA10/06INA10/06INA10/06INA10/06INA10/06
P 41P 41P 41P 41P 41P 41P 41P 41P 41P 38P 38P 38P 38P 38P 38P 38P 38P 38
P 13P 13P 13P 13P 13P 13P 13P 13P 13
P 01P 01P 01P 01P 01P 01P 01P 01P 01
P 01P 01P 01P 01P 01P 01P 01P 01P 01P 2P 2P 2P 2P 2P 2P 2P 2P 2 PZ15/92PZ15/92PZ15/92PZ15/92PZ15/92PZ15/92PZ15/92PZ15/92PZ15/92
INA19/93INA19/93INA19/93INA19/93INA19/93INA19/93INA19/93INA19/93INA19/93
INA-35INA-35INA-35INA-35INA-35INA-35INA-35INA-35INA-35
PZ-31PZ-31PZ-31PZ-31PZ-31PZ-31PZ-31PZ-31PZ-31
INA-33INA-33INA-33INA-33INA-33INA-33INA-33INA-33INA-33
INA-32INA-32INA-32INA-32INA-32INA-32INA-32INA-32INA-32
P 14P 14P 14P 14P 14P 14P 14P 14P 14
P 32P 32P 32P 32P 32P 32P 32P 32P 32
P 34P 34P 34P 34P 34P 34P 34P 34P 34
P 42P 42P 42P 42P 42P 42P 42P 42P 42
P 43P 43P 43P 43P 43P 43P 43P 43P 43
P 44P 44P 44P 44P 44P 44P 44P 44P 44
P-40P-40P-40P-40P-40P-40P-40P-40P-40
P 3P 3P 3P 3P 3P 3P 3P 3P 3
P 4P 4P 4P 4P 4P 4P 4P 4P 4
P 5P 5P 5P 5P 5P 5P 5P 5P 5
P 6P 6P 6P 6P 6P 6P 6P 6P 6
Figure 19. Piezometric zoning in the neighborhood of Capão Xavier mine
In Domain B, the original water level oscillates about 15 m around the 1,340 m level (Figure 21), which is higher than anywhere else in this study. The aquifer is rapidly recharged in the beginning of the rainy season and the discharge is slow. The effect of mining dewatering can be observed in this domain.
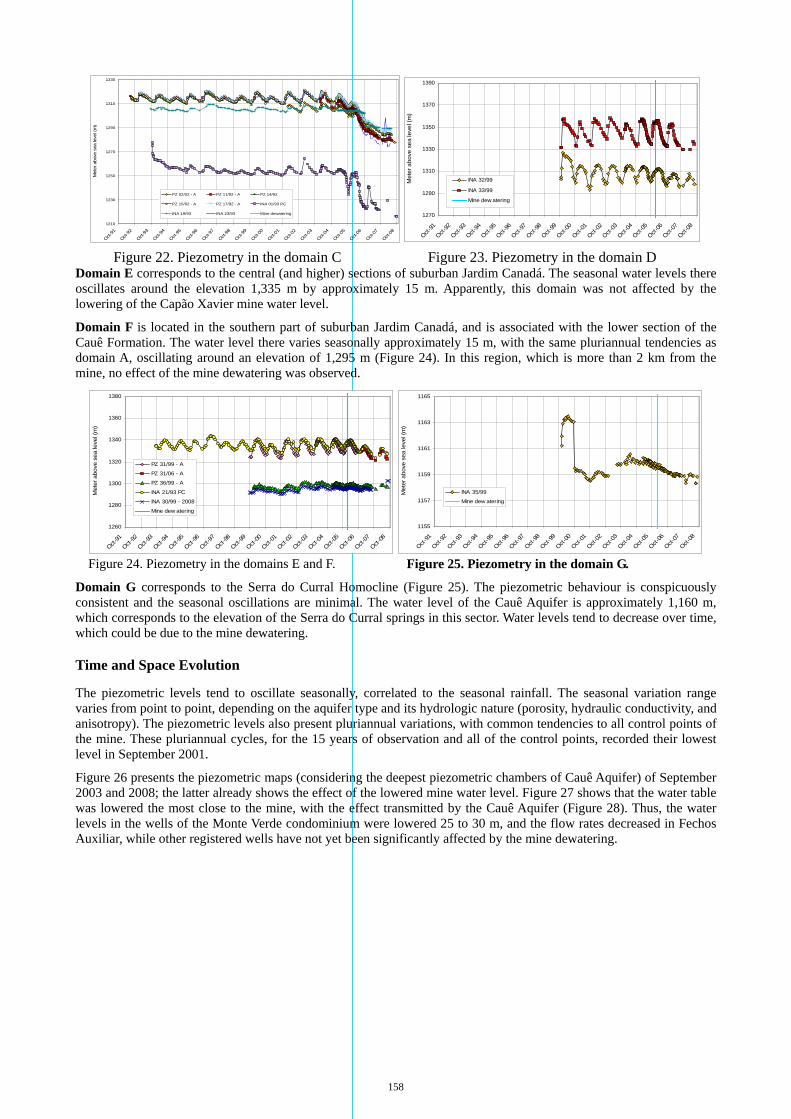
Domain C occupies the major part of the mine pit, mainly its eastern and southeastern sectors. The original water level oscillated around the 1,315 m level. The piezometers indicate that the strata are highly permeable (Figure 22). This domain is certainly the most affected by the mine dewatering.
1260
1270
1280
1290
1300
1310
1320
1330
1340
Oct-91
Sep-92
Sep-93
Sep-94
Oct-95
Sep-96
Sep-97
Sep-98
Oct-99
Sep-00
Sep-01
Sep-02
Oct-03
Sep-04
Sep-05
Sep-06
Oct-07
Sep-08
Met
er a
bove
sea
leve
l (m
)
PZ 34/99 - A
INA 22/93 PC
Mine dewatering
PZ 34/99 - B
1310
1315
1320
1325
1330
1335
1340
1345
1350
Oct-99
Oct-00
Oct-01
Oct-02
Oct-03
Oct-04
Oct-05
Oct-06
Oct-07
Oct-08
Met
er a
bove
sea
leve
l (m
)
PZ 12/92 - A
PZ 29/99 - A
INA 28/93
Mine dewatering
Figure 20. Piezometry in the domain A Figure 21. Piezometry in the domain B
Domain D presents very high seasonal variations, up to 20 m (Figure 23).
157
1210
1230
1250
1270
1290
1310
1330
Oct-91
Oct-92
Oct-93
Oct-94
Oct-95
Oct-96
Oct-97
Oct-98
Oct-99
Oct-00
Oct-01
Oct-02
Oct-03
Oct-04
Oct-05
Oct-06
Oct-07
Oct-08
Met
er a
bove
sea
leve
l (m
)
PZ 02/02 - A PZ 11/92 - A PZ 14/92
PZ 15/92 - A PZ 17/92 - A INA 01/93 PC
INA 19/93 INA 23/93 Mine dewatering 1270
1290
1310
1330
1350
1370
1390
Oct-91
Oct-92
Oct-93
Oct-94
Oct-95
Oct-96
Oct-97
Oct-98
Oct-99
Oct-00
Oct-01
Oct-02
Oct-03
Oct-04
Oct-05
Oct-06
Oct-07
Oct-08
Met
er a
bove
sea
leve
l (m
)
INA 32/99
INA 33/99
Mine dew atering
Figure 22. Piezometry in the domain C Figure 23. Piezometry in the domain D
Domain E corresponds to the central (and higher) sections of suburban Jardim Canadá. The seasonal water levels there oscillates around the elevation 1,335 m by approximately 15 m. Apparently, this domain was not affected by the lowering of the Capão Xavier mine water level.
Domain F is located in the southern part of suburban Jardim Canadá, and is associated with the lower section of the Cauê Formation. The water level there varies seasonally approximately 15 m, with the same pluriannual tendencies as domain A, oscillating around an elevation of 1,295 m (Figure 24). In this region, which is more than 2 km from the mine, no effect of the mine dewatering was observed.
1260
1280
1300
1320
1340
1360
1380
Oct-91
Oct-92
Oct-93
Oct-94
Oct-95
Oct-96
Oct-97
Oct-98
Oct-99
Oct-00
Oct-01
Oct-02
Oct-03
Oct-04
Oct-05
Oct-06
Oct-07
Oct-08
Met
er a
bove
sea
leve
l (m
)
PZ 31/99 - A
PZ 31/06 - A
PZ 36/99 - A
INA 21/93 PC
INA 30/99 - 2008
Mine dew atering
1155
1157
1159
1161
1163
1165
Oct-91
Oct-92
Oct-93
Oct-94
Oct-95
Oct-96
Oct-97
Oct-98
Oct-99
Oct-00
Oct-01
Oct-02
Oct-03
Oct-04
Oct-05
Oct-06
Oct-07
Oct-08
Met
er a
bove
sea
leve
l (m
)
INA 35/99
Mine dew atering
Figure 24. Piezometry in the domains E and F. Figure 25. Piezometry in the domain G.
Domain G corresponds to the Serra do Curral Homocline (Figure 25). The piezometric behaviour is conspicuously consistent and the seasonal oscillations are minimal. The water level of the Cauê Aquifer is approximately 1,160 m, which corresponds to the elevation of the Serra do Curral springs in this sector. Water levels tend to decrease over time, which could be due to the mine dewatering.
Time and Space Evolution
The piezometric levels tend to oscillate seasonally, correlated to the seasonal rainfall. The seasonal variation range varies from point to point, depending on the aquifer type and its hydrologic nature (porosity, hydraulic conductivity, and anisotropy). The piezometric levels also present pluriannual variations, with common tendencies to all control points of the mine. These pluriannual cycles, for the 15 years of observation and all of the control points, recorded their lowest level in September 2001.
Figure 26 presents the piezometric maps (considering the deepest piezometric chambers of Cauê Aquifer) of September 2003 and 2008; the latter already shows the effect of the lowered mine water level. Figure 27 shows that the water table was lowered the most close to the mine, with the effect transmitted by the Cauê Aquifer (Figure 28). Thus, the water levels in the wells of the Monte Verde condominium were lowered 25 to 30 m, and the flow rates decreased in Fechos Auxiliar, while other registered wells have not yet been significantly affected by the mine dewatering.
158
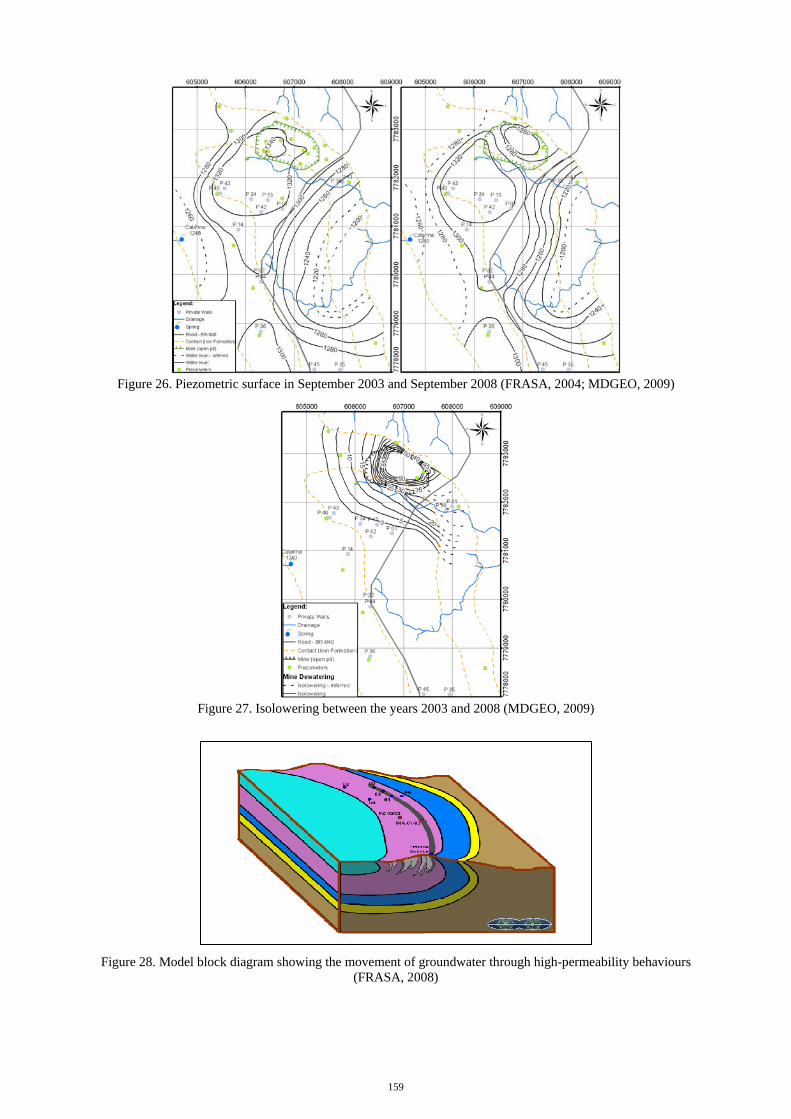
Figure 26. Piezometric surface in September 2003 and September 2008 (FRASA, 2004; MDGEO, 2009)
Figure 27. Isolowering between the years 2003 and 2008 (MDGEO, 2009)
Figure 28. Model block diagram showing the movement of groundwater through high-permeability behaviours
(FRASA, 2008)
159

5. HYDROCHEMISTRY
Water quality has been systematically monitored in the area since 1997. Monitoring intensified when exploitation began. All of the water was bicarbonated chalco-magnesian, and all except the Karstic Spring of Fechos presents similar concentrations, and were weakly mineralized, with all ions less than 0.5 meq/L (milli-equivalent per liter). Analyses of water samples for several years indicate that the lowering of the water levels at the Capão Xavier Mine has not significantly changed water chemistry.
6. HIDROLOGIC IMPACTS, CONTROL ACTIONS AND MITIGATION
Impacts on Third Party Wells
The water levels in the wells of the Monte Verde condominium were lowered by 25 to 30 m. As a compensation measure, Vale made available 4.2 L/s of water from the dewatering wells to supply the condominium. The water has been piped from the mine to the condominium since March 2007. The other registered wells in the area have not been affected by the mine dewatering yet.
Impacts on the Springs
A hydrological impact was identified at Mutuca V2, representing a volume flow rate drop of approximately 5.4 L/s. In Mutuca Auxiliar, all monthly values after April 2008 were below the historic monthly minimum; the lowest value was registered in September with a drop of approximately 7.3 L/s. However, given the difficult hydraulic connection between the Capão Xavier mine and the Serra do Curral Homocline, the decrease is more likely due to the new wells installed in the real estate development of Serra do Curral (from the BH Shopping till the Mutuca viaduct). The water flow drop at the weir Mutuca VTR2 and the decrease of flow at the weir Barreiro V7 to less than the historic minimum (October to December 2007) is attributed to the same development.
A possible impact of approximately 3 L/s to the Fechos Auxiliar impoundment was identified. To mitigate the hydrologic impact, Vale has already constructed a water pipeline (5 km in length and 400 mm in internal diameter) with the capacity to pump 250 L/s of the water it pumps from underground, and has linked it to the COPASA system that supplies potable water to Belo Horizonte. According to the commitment signed by MBR and COPASA, the mining company will supply water to the municipality at a volumetric flow rate equivalent to 1/3 of the total underground water pumped. Based on the volumetric flow rate pumped in the hydrologic cycle of 2007/2008 (151 L/s), the amount of water that will have to be pumped will total about 50 L/s.
7. CONCLUSIONS
The water level at the Capão Xavier mine is being lowered as anticipated in the hydrogeological studies. The hydrochemical characteristics of the area’s surface and groundwater have not been affected by the mine dewatering. The environmental impacts of the drainage on Mutuca V2 and Fechos Auxiliar were determined to be related to this mine dewatering, as was the lowering of the water levels at the Monte Verde condominium. However, the decreased volumetric flow rate at Mutuca Auxiliar and Barreiro V7 is imputed to be due to the increased use of underground water at Serra do Curral; hydrogeologic studies have been initiated in this sector to determine if this indeed the case.
Since February 2008, Vale is making available a minimum of one third (50 L/s) of the total volumetric flow rate that it pumps from underground to compensate COPASA for the possible hydrogeological impacts. The wells of the Monte Verde condominium was cleaned and regenerated by Vale, to enhance the volumetric flow rate; nevertheless, the specific capacity was still diminished. So Vale is directly supplying potable water to the condominium by a pipeline system constructed specifically for that purpose. Thus, Vale is compensating for any loss of water to COPASA or any third party wells due to the lowering of the water table by providing them with a portion of the water it has pumped.
After the mineral deposit is exhausted, the mine will become a high level lake and will serve as a big water reservoir interlinked with the existing supply system and optimizing the use of the region’s water resources.
8. REFERENCES
Alkmim, F.F.; Amorim, L.Q.A.; Souza, K.; Cavalcanti, J.A.D.; Freitas, C.A.; Lanfranchi, R.A.; Oliveira, F.M.; Santos, G.J.I.; Barbosa, V.C. , 1996. A junção entre o sinclinal da Moeda e o homoclinal da serra do Curral, Quadrilátero Ferrífero, MG. In: Congresso Brasileiro Geologia, 39, Salvador. Sociedade Brasileira de Geologia. v.1, p. 337-340.
FRASA, 2007. Mina Capão Xavier. Auditoria Hidrogeológica Anual. Madrid, 34 pp. Vale Internal Report. FRASA, 2008. Mina Capão Xavier. Auditoria Hidrogeológica Annual. Madrid, 35 pp. Vale Internal Report. FRASA, 2009. Mina Capão Xavier. Auditoria Hidrogeológica Annual. Resumo. Nova Lina & Madrid, 34 pp. Vale
Internal Report. MDGEO. 2009. Relatório de acompanhamento hidrogeológico Mina de Capão Xavier – Vale. Belo Horizonte: Vale
Internal Report.
160

Mourão, M. A. A. 2007. Caracterização Hidrogeológica do Aquífero Cauê, Quadrilátero Ferrífero, MG. Tese (doutorado) - Universidade Federal Minas Gerais, Escola Engenharia.
9. ACKNOWLEDGMENTS
The authors express their gratitude to Mr. Robert Kleinmann for his review of the paper and its conspicuous comments.
161