EXPLOSIVE WELDING WYTWORZONEGO … · 1152 detonation energy, the distance between the plates and...
12
A R C H I V E S O F M E T A L L U R G Y A N D M A T E R I A L S Volume 57 2012 Issue 4 DOI: 10.2478/v10172-012-0129-x H. PAUL * , L. LITYŃSKA-DOBRZYŃSKA * , M. MISZCZYK * , M. PRAŻMOWSKI ** MICROSTRUCTURE AND PHASE TRANSFORMATIONS NEAR THE BONDING ZONE OF Al/Cu CLAD MANUFACTURED BY EXPLOSIVE WELDING ZMIANY MIKROSTRUKTURALNE I FAZOWE W POBLIŻU STREFY POLĄCZENIA UKLADU WARSTWOWEGO Al/Cu WYTWORZONEGO TECHNOLOGIĄ ZGRZEWANIA WYBUCHOWEGO The structure near the interface of bimetallic strips strongly influences their properties. In this work, the interfacial layers of explosively welded aluminium and copper plates were investigated by means of a scanning electron microscope (SEM), equipped with a high resolution system for local orientation measurements (SEMFEG/EBSD), and a transmission electron microscope (TEM), equipped with energy dispersive spectrometry (EDX) for the analysis of chemical composition changes. The SEMFEG/EBSD-based local orientation measurements in the areas close to the interface, in both sheets, revealed fine-grained layers characterized by the clearly marked tendency of the copper-type rolling texture formation. The texture was described by an increased density of the orientations near the {112}<111>, {123}<634>and {110}<112>positions. The internal microstructure of the intermetallic inclusion is mostly composed of dendrites. The electron diffractions and the TEM/EDX chemical composition measurements in the intermetallic inclusions revealed only crystalline phases, both equilibrium and ’metastable’. Additionally, no significant regularity in the phase distribution with respect to the parent sheets was observed. Keywords: intermetallic inclusion, interface, transmission electron microscopy, orientation mapping, explosive welding Mikrostruktura w pobliżu strefy polączenia silnie wplywa na wlasności ukladów bimetalowych. W niniejszej pracy analizie poddano uklady warstwowe Al/Cu wytworzone technologią zgrzewania wybuchowego. Badania prowadzono z wykorzystaniem skaningowej mikroskopii elektronowej wyposażonej w wysokorozdzielczy system pomiaru orientacji lokalnych oraz transmi- syjnej mikroskopii elektronowej wyposażonej w analizator skladu chemicznego. Systematyczne pomiary orientacji lokalnych w pobliżu strefy polączenia, w obydwu lączonych plytach, ujawniają formowanie się strefy silnie rozdrobnionych ziaren. Strefa ta scharakteryzowana jest przez formowanie się tekstury walcowania typu miedzi z dobrze uwidocznionymi skladowymi zbliżony- mi do polożeń: {112}<111>, {123}<634> oraz {110}<112>. Wewnętrzna struktura ’intermetalicznych inkluzji’ zbudowana jest z dendrytów. Badania z wykorzystaniem elektronowej mikroskopii transmisyjnej dokumentują, że wewnątrz strefy przetopień następuje formowanie się faz krystalicznych, zarówno równowagowych jak i ’metastabilnych’. Sklad chemiczny formujących się faz nie wykazywal związku z polożeniem ziaren względem plyt bazowych. 1. Introduction Explosive welding is a solid state metal joining process used to create a metallurgical bond between two similar or dissimilar metals [1]. A weld joint is produced by means of a high velocity impact of one metallic mass onto another, aided by a controlled det- onation with an explosive charge. In explosive welded plates at the collision point, the perfectly clean surfaces are brought together under very high pressure. The high velocity oblique collision will ‘produce’ high tempera- ture and high shear strain near the collision point in a very short time. This causes local melting of the bonded metals, simultaneously with the local plastic deforma- tion. The very short time of the heat influence, due to the high thermal conductivity of the metals, leads to high cooling rates and thus, in the solidification process, the melted metals are ‘transformed’ to brittle intermetallic of different compounds, e.g. [2-11]. Explosive weld microstructures have been examined for half a century. In these works, the techniques of op- tical microscopy, scanning electron microscopy (SEM) and mechanical testing were used for the microstruc- tural analyses and the clad properties’ characterization. Particular attention was paid to the description of the influence of the technological parameters, such as the * INSTITUTE OF METALLURGY AND MATERIALS SCIENCE PAS, KRAKÓW, 25 REYMONTA ST., POLAND ** OPOLE UNIVERSITY OF TECHNOLOGY, FACULTY OF MECHANICS, OPOLE, 5 MIKOLAJCZYKA ST., POLAND
Transcript of EXPLOSIVE WELDING WYTWORZONEGO … · 1152 detonation energy, the distance between the plates and...
A R C H I V E S O F M E T A L L U R G Y A N D M A T E R I A L S
Volume 57 2012 Issue 4
DOI: 10.2478/v10172-012-0129-x
H. PAUL∗, L. LITYŃSKA-DOBRZYŃSKA∗, M. MISZCZYK∗, M. PRAŻMOWSKI∗∗
MICROSTRUCTURE AND PHASE TRANSFORMATIONS NEAR THE BONDING ZONE OF Al/Cu CLAD MANUFACTURED BYEXPLOSIVE WELDING
ZMIANY MIKROSTRUKTURALNE I FAZOWE W POBLIŻU STREFY POŁĄCZENIA UKŁADU WARSTWOWEGO Al/CuWYTWORZONEGO TECHNOLOGIĄ ZGRZEWANIA WYBUCHOWEGO
The structure near the interface of bimetallic strips strongly influences their properties. In this work, the interfacial layersof explosively welded aluminium and copper plates were investigated by means of a scanning electron microscope (SEM),equipped with a high resolution system for local orientation measurements (SEMFEG/EBSD), and a transmission electronmicroscope (TEM), equipped with energy dispersive spectrometry (EDX) for the analysis of chemical composition changes.
The SEMFEG/EBSD-based local orientation measurements in the areas close to the interface, in both sheets, revealedfine-grained layers characterized by the clearly marked tendency of the copper-type rolling texture formation. The texture wasdescribed by an increased density of the orientations near the {112}<111>, {123}<634>and {110}<112>positions. The internalmicrostructure of the intermetallic inclusion is mostly composed of dendrites. The electron diffractions and the TEM/EDXchemical composition measurements in the intermetallic inclusions revealed only crystalline phases, both equilibrium and’metastable’. Additionally, no significant regularity in the phase distribution with respect to the parent sheets was observed.
Keywords: intermetallic inclusion, interface, transmission electron microscopy, orientation mapping, explosive welding
Mikrostruktura w pobliżu strefy połączenia silnie wpływa na własności układów bimetalowych. W niniejszej pracy analiziepoddano układy warstwowe Al/Cu wytworzone technologią zgrzewania wybuchowego. Badania prowadzono z wykorzystaniemskaningowej mikroskopii elektronowej wyposażonej w wysokorozdzielczy system pomiaru orientacji lokalnych oraz transmi-syjnej mikroskopii elektronowej wyposażonej w analizator składu chemicznego. Systematyczne pomiary orientacji lokalnych wpobliżu strefy połączenia, w obydwu łączonych płytach, ujawniają formowanie się strefy silnie rozdrobnionych ziaren. Strefa tascharakteryzowana jest przez formowanie się tekstury walcowania typu miedzi z dobrze uwidocznionymi składowymi zbliżony-mi do położeń: {112}<111>, {123}<634> oraz {110}<112>. Wewnętrzna struktura ’intermetalicznych inkluzji’ zbudowana jestz dendrytów. Badania z wykorzystaniem elektronowej mikroskopii transmisyjnej dokumentują, że wewnątrz strefy przetopieńnastępuje formowanie się faz krystalicznych, zarówno równowagowych jak i ’metastabilnych’. Skład chemiczny formującychsię faz nie wykazywał związku z położeniem ziaren względem płyt bazowych.
1. Introduction
Explosive welding is a solid state metal joiningprocess used to create a metallurgical bond betweentwo similar or dissimilar metals [1]. A weld joint isproduced by means of a high velocity impact of onemetallic mass onto another, aided by a controlled det-onation with an explosive charge. In explosive weldedplates at the collision point, the perfectly clean surfacesare brought together under very high pressure. The highvelocity oblique collision will ‘produce’ high tempera-ture and high shear strain near the collision point in avery short time. This causes local melting of the bonded
metals, simultaneously with the local plastic deforma-tion. The very short time of the heat influence, due tothe high thermal conductivity of the metals, leads to highcooling rates and thus, in the solidification process, themelted metals are ‘transformed’ to brittle intermetallicof different compounds, e.g. [2-11].
Explosive weld microstructures have been examinedfor half a century. In these works, the techniques of op-tical microscopy, scanning electron microscopy (SEM)and mechanical testing were used for the microstruc-tural analyses and the clad properties’ characterization.Particular attention was paid to the description of theinfluence of the technological parameters, such as the
∗ INSTITUTE OF METALLURGY AND MATERIALS SCIENCE PAS, KRAKÓW, 25 REYMONTA ST., POLAND∗∗ OPOLE UNIVERSITY OF TECHNOLOGY, FACULTY OF MECHANICS, OPOLE, 5 MIKOŁAJCZYKA ST., POLAND
1152
detonation energy, the distance between the plates andthe inclination angle of the flyer plate, on the ‘quality ofthe weld’, e.g. [1, 2-6]. Despite the fact that the literaturedata, based on SEM analyses, is relatively rich, there areonly few works dealing with the textural transformationsoccurring in the parent sheets close to the interface, e.g.[11, 12].
A strongly limited number of publications has beenissued also on the nano- scale transmission electron mi-croscopy (TEM) analyses of the phenomena that occurwithin the intermetallic inclusions. They were limitedto selected metal compositions, e.g. the steel/Ti clad[2, 10], Ti/Ti clad [13], copper to copper clad [2] or aNi-based amorphous or metallic glass film clad on stain-less steel [14]. However, among those works,only thepaper by Song et al. [10] on the steel to Ti clad soundlycharacterizes the nano-scale events observed inside theintermetallic inclusion. Nothing has been done, to ourknowledge, in respect to a detailed microstructure char-acterization of the intermetallic inclusions of the Cu/Alclad and the parent materials close to the interface. Itis, therefore, the aim of this work to characterize, atthe micro-/nano- scale, the events that occur near theinterface in the Cu/Al cladding system.
This work analyses two aspects of the changes thatoccur near the interface of explosively welded sheets. Onthe one hand, the texture and microstructure changes thatoccur close to the interface in explosively welded alu-minium and copper sheets were analysed by means of aSEM equipped with a high resolution electron backscat-tered (EBSD) facility. On the other hand, the investi-gations of the reaction products formed at the claddinginterface were carried out by means of TEM. The quitedifferent electrochemical properties of the bonded met-als necessitated the application of the focus ion beam(FIB) technique for the thin foil preparation from the ar-eas covering the interfaces. Finally, the events occurringduring the intermetallic phase’s formation under dynam-ic loading (explosive bonding) were discussed in relationto those observed in the static terms of ageing, after theapplication of other bonding techniques.
2. Materials and experimental procedures
2.1. Materials and initial microstructure of sheets
The explosion welded materials evaluated in thisstudy were a standard explosion clad product producedby High Energy Technologies Works ‘Explomet’ (Opole,Poland). Commercial purity aluminium (AA1050) andcopper (M1E-99.5%) were used to manufacture theAl/Cu composites for electrotechnical applications. Thethickness of the base (Al) and the flyer (Cu) plates were25 mm and 3 mm, respectively, whereas their widthand length were 2000 mm×4000 mm. The surfaces ofthe plates were used as-received. The composites wereobtained by means of the constant stand-off explosivecladding technique. A detonator was placed in the mid-dle of the plate’s width close to one of the edges. In themiddle of the plate’s width, the jetting direction was par-allel to the rolling direction (RD). The stand-off distancewas 3 mm, whereas the measured explosive detonationvelocity was 2200 m/s. Samples for further microscopicobservations were cut-off from the end parts of the sheet.
2.2. Meso- scale analyses based on SEM/EBSD
The microstructures of the parent sheets (before andafter cladding) were analyzed in the section perpendic-ular to the transverse direction (TD) with the use ofa JEOL 6500F scanning electron microscope, equippedwith a field emission gun and an electron backscattereddiffraction facility. The microscope control, the patternacquisition and the indexing were performed with theuse of the HKL Channel 5 software. The orientationmaps were created in the beam-scanning mode withthe step size ranged between 50 nm and 500 nm. Be-fore cladding, the copper plates (in the ND-RD section,where: ND is the normal direction), were characterizedby the equiaxed grains, with the average grain diameterof 30 µm. The aluminium plate (in the same section) wascharacterized by a microstructure typically observed af-ter hot rolling, i.e. composed of layers of very flat grains.The (average) dimensions of the elongated grains alongthe longer and the shorter axes equalled about 100µmand 15µm, respectively (Fig. 2).
1153
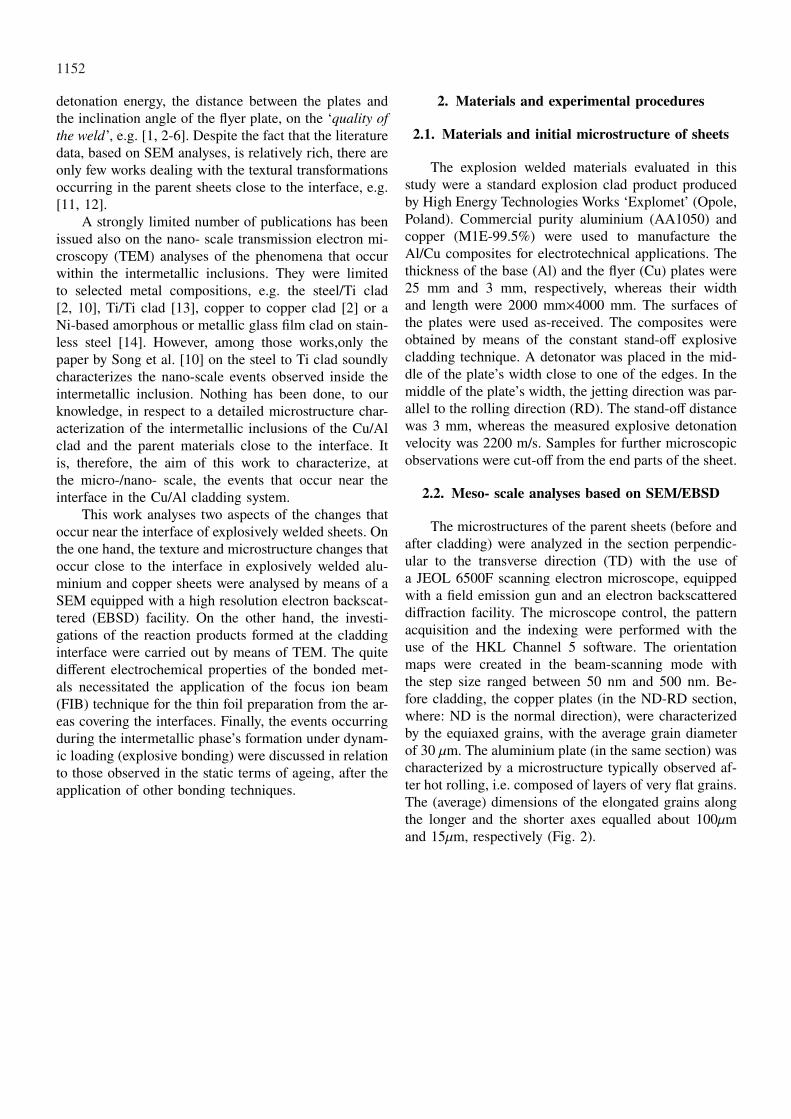
Fig. 1. The ‘wavy character’ of the interface and the formation of melting zones at the crest of the waves. SEM image in the Back ScatteredElectron mode. ND-RD section [16]
Fig. 2. (a) SEMFEG/EBSD orientation map showing the microstructure close to the interface. The map corresponds to SEM-BSE micrographspresented in Fig. 1 (marked area). The {111} pole figures calculated for (b) Aland (c) Cu layers. ND-RD section. SEMFEG/EBSD localorientation measurements. Step size of 200 nm
2.3. TEM analysis of structure and chemicalcomposition changes in the intermetallic inclusion
The microstructure observations and the chemicalcomposition measurements were performed by meansof TEM with the use of a FEI Technai G2 micro-scope, operating at the accelerating voltage of 200kV.The TEM was equipped with a field emission gun anda high-angle annular dark field scanning/transmissiondetector (HAADF/STEM), combined with an EDAXTM
energy dispersive X-ray (EDX) microanalyser. The res-olution of the TEM/EDX system was ∼1nm. Due to thequite different electrochemical properties of the weldedmetals, the classic technique of thin foil preparation by
means of electrolytic polishing was not adequate here.Therefore, for the nano- scale analyses of the microstruc-tural and the chemical composition changes across theinterface, the FIB cutting was applied for the thin foilspreparation along the ND-TD section. In that case, theFEI FIB (FB2000A) instrument operating at 30kV wasused.
3. Results
The cases of ‘well-welded’ sheets were analyzed inthis work. A macroscopically acceptable weld was pro-duced, since the strength of the weld was higher than the
1154
strength of the weaker one of the two components. Addi-tionally, the electrical conductivity was at an acceptablelevel. In the case of the Cu/Al clad, the electrical conduc-tivity is, beside the strength, one of the most importantproperties in industrial applications. The conductivity ofintermetallic compounds is about one-seventh of the con-ductivity of copper and one-fifth of the conductivity ofaluminium and depends on the exact chemical composi-tion of the intermetallic phase [15]. This indicates thatthe total conductivity sharply decreases, due to the in-tense formation of volumes of solidified liquid.
In the present case, the applied technological set-tings of bonding ’produced’ interfaces with only a smallnumber of intermetallic inclusions. However, for practi-cal reasons, the areas covering the relatively thick inter-metallic inclusions were found and selected for furtherTEM-based analyses, as presented in Fig. 1a.
3.1. Macro- scale morphology of the interfacial zone
The morphology of the present joint was character-ized by the mixture of wavy and flat patterns. A sig-nificant part of the interface was without intermetallicinclusions. The latter, if they occurred, were preferen-tially located near the front slope of the waves or withinthe vortex of the waves. The presence or absence ofthe intermetallic inclusions led to the ‘creation’ of oneof the two types of interface, i.e. pure metal-solidifiedmelt or pure metal-pure metal. The interfaces aroundthe intermetallic inclusions were always very sharp. Thissuggests strong chemical composition changes across theboundary.
3.2. Microstructure and texture changes close toand far from the interface
The microstructure and texture across the interfacewere characterized by means of the local orientationmeasurement system. Two characteristic places withinthe samples in the ’after bonding’ state, i.e. the areas lo-cated across the interface (including the areas coveringthe crest of the wave) and the areas distanced 1.5mmfrom the interface, were analyzed in detail.
Figure 2a shows the orientation map presentedas a ’function’ of the IPF colour code made acrossthe interface. The map (from area marked in Fig. 1)clearly reveals the differences observed in the mi-crostructure of both welded metals. The structure ofthe Al sheet near the interface is composed of de-
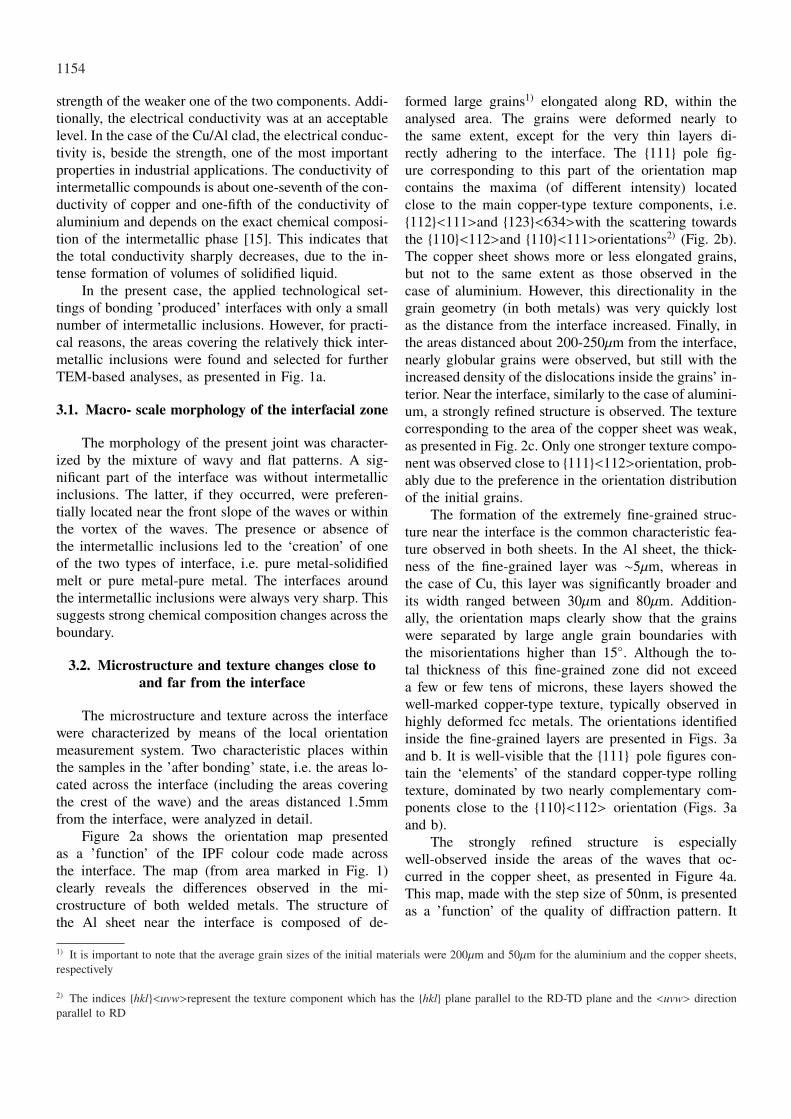
formed large grains1) elongated along RD, within theanalysed area. The grains were deformed nearly tothe same extent, except for the very thin layers di-rectly adhering to the interface. The {111} pole fig-ure corresponding to this part of the orientation mapcontains the maxima (of different intensity) locatedclose to the main copper-type texture components, i.e.{112}<111>and {123}<634>with the scattering towardsthe {110}<112>and {110}<111>orientations2) (Fig. 2b).The copper sheet shows more or less elongated grains,but not to the same extent as those observed in thecase of aluminium. However, this directionality in thegrain geometry (in both metals) was very quickly lostas the distance from the interface increased. Finally, inthe areas distanced about 200-250µm from the interface,nearly globular grains were observed, but still with theincreased density of the dislocations inside the grains’ in-terior. Near the interface, similarly to the case of alumini-um, a strongly refined structure is observed. The texturecorresponding to the area of the copper sheet was weak,as presented in Fig. 2c. Only one stronger texture compo-nent was observed close to {111}<112>orientation, prob-ably due to the preference in the orientation distributionof the initial grains.
The formation of the extremely fine-grained struc-ture near the interface is the common characteristic fea-ture observed in both sheets. In the Al sheet, the thick-ness of the fine-grained layer was ∼5µm, whereas inthe case of Cu, this layer was significantly broader andits width ranged between 30µm and 80µm. Addition-ally, the orientation maps clearly show that the grainswere separated by large angle grain boundaries withthe misorientations higher than 15◦. Although the to-tal thickness of this fine-grained zone did not exceeda few or few tens of microns, these layers showed thewell-marked copper-type texture, typically observed inhighly deformed fcc metals. The orientations identifiedinside the fine-grained layers are presented in Figs. 3aand b. It is well-visible that the {111} pole figures con-tain the ‘elements’ of the standard copper-type rollingtexture, dominated by two nearly complementary com-ponents close to the {110}<112> orientation (Figs. 3aand b).
The strongly refined structure is especiallywell-observed inside the areas of the waves that oc-curred in the copper sheet, as presented in Figure 4a.This map, made with the step size of 50nm, is presentedas a ’function’ of the quality of diffraction pattern. It
1) It is important to note that the average grain sizes of the initial materials were 200µm and 50µm for the aluminium and the copper sheets,respectively
2) The indices {hkl}<uvw>represent the texture component which has the {hkl} plane parallel to the RD-TD plane and the <uvw> directionparallel to RD
1155
is well visible that the crest of the waves was com-posed of very thin (with the thickness below 200nm)and elongated grains, separated by large angle grainboundaries with the misorientations higher than 15◦.These thin grains were strongly curved inside the crestof the wave and imitated well the rotational characterof the material (copper) displacement during the waveformation, i.e. reflecting the non-homogeneous flow inthe copper sheet close to the interface. Although thetotal thickness of this fine-grained zone did not exceed a
few microns, the layers showed well-marked copper-typetexture components. This effect is typically observed inthe highly deformed face centred cubic metals.
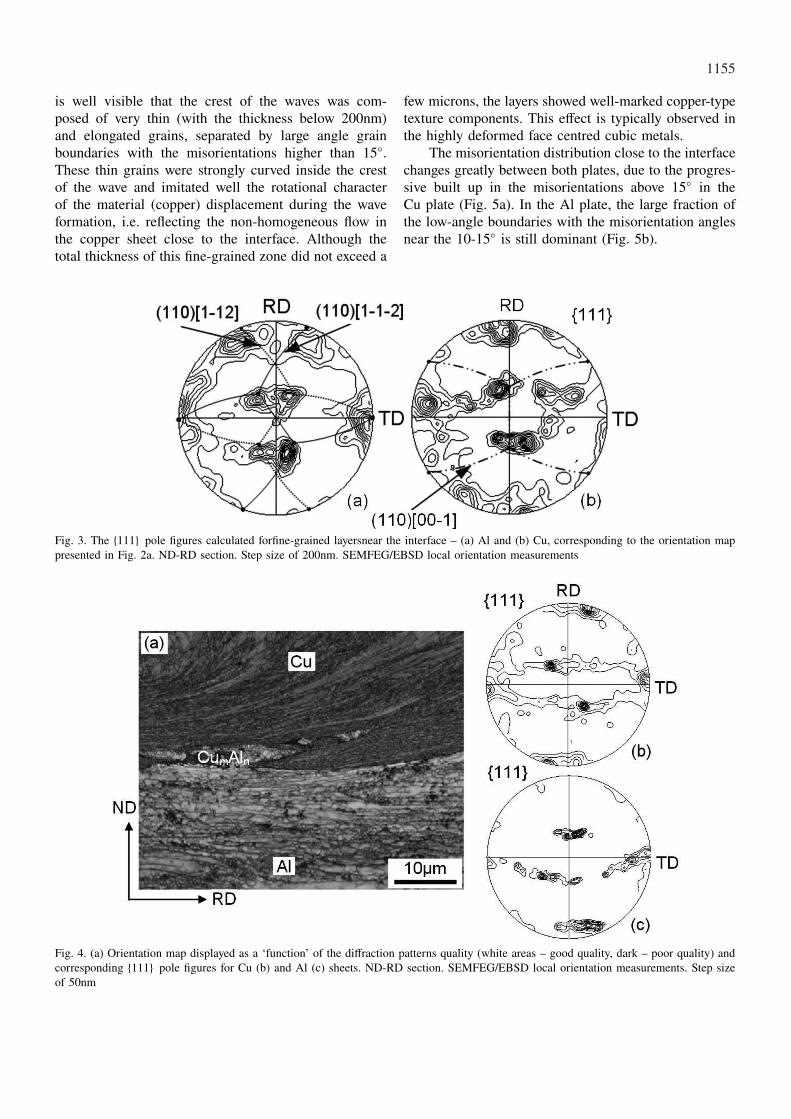
The misorientation distribution close to the interfacechanges greatly between both plates, due to the progres-sive built up in the misorientations above 15◦ in theCu plate (Fig. 5a). In the Al plate, the large fraction ofthe low-angle boundaries with the misorientation anglesnear the 10-15◦ is still dominant (Fig. 5b).
Fig. 3. The {111} pole figures calculated forfine-grained layersnear the interface – (a) Al and (b) Cu, corresponding to the orientation mappresented in Fig. 2a. ND-RD section. Step size of 200nm. SEMFEG/EBSD local orientation measurements
Fig. 4. (a) Orientation map displayed as a ‘function’ of the diffraction patterns quality (white areas – good quality, dark – poor quality) andcorresponding {111} pole figures for Cu (b) and Al (c) sheets. ND-RD section. SEMFEG/EBSD local orientation measurements. Step sizeof 50nm
1156
Fig. 5. Relative frequency of the grain boundaries’ occurrence within particular class of misorientation angles, calculated separately for bothsheets. (a) Nearly random distribution of grain boundaries (with large fraction of high-angle boundaries) in copper. (b) Increased fraction oflow-angle grain boundaries in aluminium. The graphs correspond to the orientation map presented in Fig. 4
The ’intensity’ of the plastic deformation decreas-es as the distance from the interface increases. In thecopper plate, in the areas distanced ∼1.5mm from theinterface, the grains are nearly equiaxed and their interi-or is characterized by only a slightly increased density ofthe dislocations. This is visible as an increased densityof the low angle boundaries (Fig. 6a and c). In the alu-minium plate, for the same distance from the interface,the subdivision of the large grains is still visible (Fig.6b and d). Figures 6a and b show the misorientation
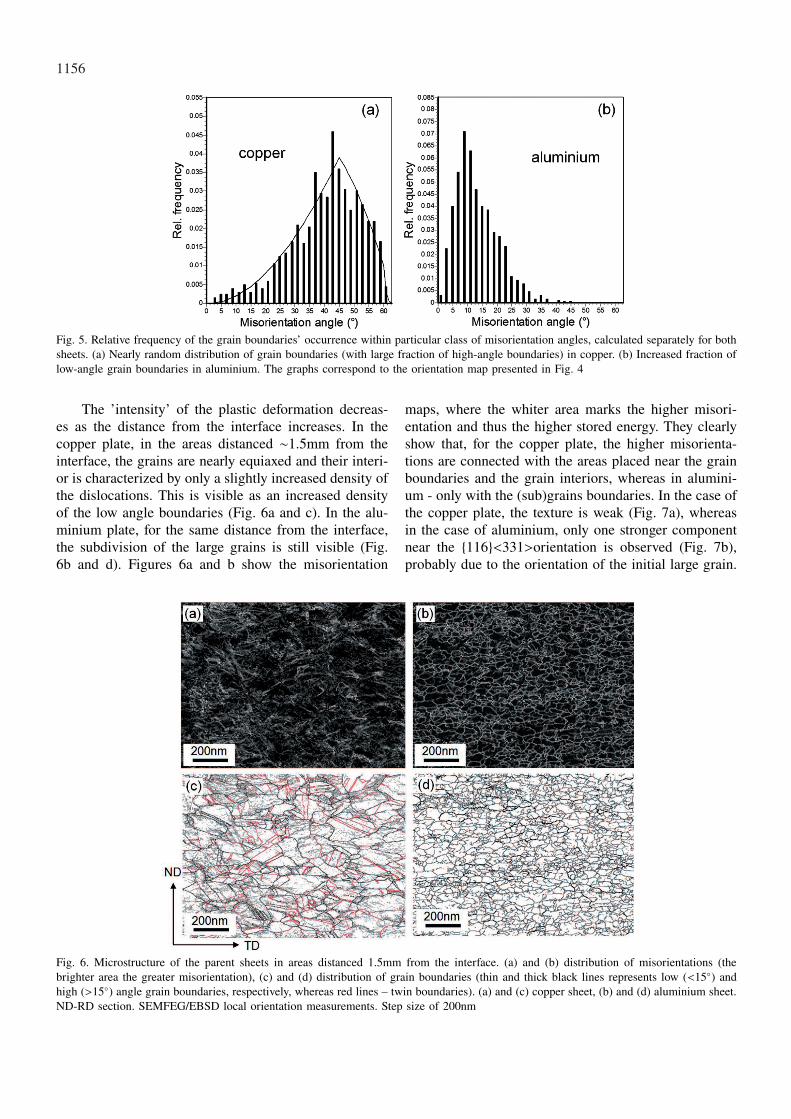
maps, where the whiter area marks the higher misori-entation and thus the higher stored energy. They clearlyshow that, for the copper plate, the higher misorienta-tions are connected with the areas placed near the grainboundaries and the grain interiors, whereas in alumini-um - only with the (sub)grains boundaries. In the case ofthe copper plate, the texture is weak (Fig. 7a), whereasin the case of aluminium, only one stronger componentnear the {116}<331>orientation is observed (Fig. 7b),probably due to the orientation of the initial large grain.
Fig. 6. Microstructure of the parent sheets in areas distanced 1.5mm from the interface. (a) and (b) distribution of misorientations (thebrighter area the greater misorientation), (c) and (d) distribution of grain boundaries (thin and thick black lines represents low (<15◦) andhigh (>15◦) angle grain boundaries, respectively, whereas red lines – twin boundaries). (a) and (c) copper sheet, (b) and (d) aluminium sheet.ND-RD section. SEMFEG/EBSD local orientation measurements. Step size of 200nm
1157
Fig. 7. Texture of the parent sheets in the areas distanced 1.5 mm from the interface. The {111} pole figures corresponding orientation mapspresented in Fig. 6. (a) Cu and (b) Al sheet. ND-RD section. SEMFEG/EBSD local orientation measurements. Step size of 200nm
Fig. 8. Microstructural changes across the interfacial zone. (a) HAADF-STEM microstructure showing interfacial zone with intermetallicinclusion. The parent sheets microstructures in areas directly adhering to the intermetallic inclusion: (b) aluminium and (c) copper. (d) – (f)TEM bright field images showing dendrites inside the intermetallic inclusion. TEM imaging in ND-TD section
3.3. Microstructure of the interfacial zone
A detailed TEM microstructure characterizationof the interfacial zones was performed on thin foilsprepared by means of the FIB technique. Figure 8ashows the typical HAADF-STEM micrographs acrossthe whole thickness of the intermetallic layer and theareas of the parent sheets directly adhering to the in-terfaces. In the present case, the thin foil was cut offthe sample area containing a ∼6µm thick intermetallic
zone. As expected, two distinct interfaces of the puremetal-intermetallic inclusion type, clearly separating theAl and Cu sheets, were observed. It is visible that themicrostructures of the Al and Cu sheets were differentin the areas directly adhering to the intermetallic layer.
In aluminium, regular dislocation arrangementsforming the (sub)grain structure are visible (Fig. 8b).The (sub)grains’3) length was of the order of a few mi-crons,
3) It should be noted that the bright field imaging counts all types of boundaries, i.e. low- and high- angle, without distinction
1158
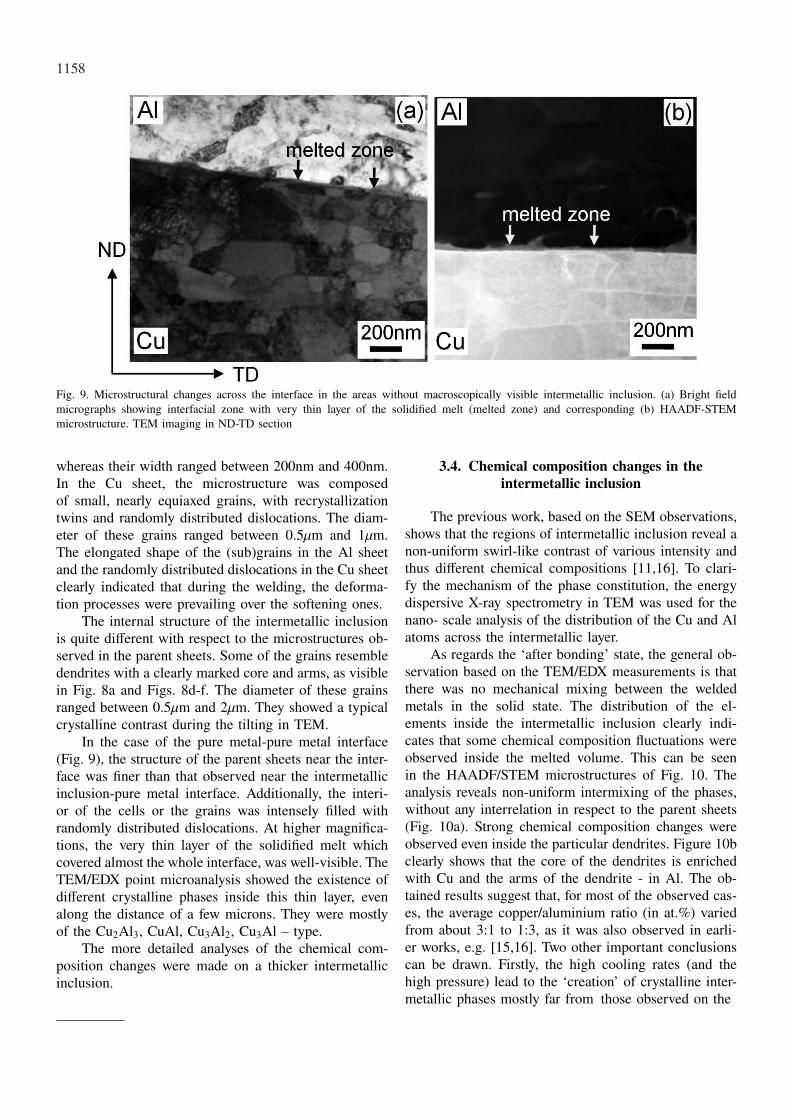
Fig. 9. Microstructural changes across the interface in the areas without macroscopically visible intermetallic inclusion. (a) Bright fieldmicrographs showing interfacial zone with very thin layer of the solidified melt (melted zone) and corresponding (b) HAADF-STEMmicrostructure. TEM imaging in ND-TD section
whereas their width ranged between 200nm and 400nm.In the Cu sheet, the microstructure was composedof small, nearly equiaxed grains, with recrystallizationtwins and randomly distributed dislocations. The diam-eter of these grains ranged between 0.5µm and 1µm.The elongated shape of the (sub)grains in the Al sheetand the randomly distributed dislocations in the Cu sheetclearly indicated that during the welding, the deforma-tion processes were prevailing over the softening ones.
The internal structure of the intermetallic inclusionis quite different with respect to the microstructures ob-served in the parent sheets. Some of the grains resembledendrites with a clearly marked core and arms, as visiblein Fig. 8a and Figs. 8d-f. The diameter of these grainsranged between 0.5µm and 2µm. They showed a typicalcrystalline contrast during the tilting in TEM.
In the case of the pure metal-pure metal interface(Fig. 9), the structure of the parent sheets near the inter-face was finer than that observed near the intermetallicinclusion-pure metal interface. Additionally, the interi-or of the cells or the grains was intensely filled withrandomly distributed dislocations. At higher magnifica-tions, the very thin layer of the solidified melt whichcovered almost the whole interface, was well-visible. TheTEM/EDX point microanalysis showed the existence ofdifferent crystalline phases inside this thin layer, evenalong the distance of a few microns. They were mostlyof the Cu2Al3, CuAl, Cu3Al2, Cu3Al – type.
The more detailed analyses of the chemical com-position changes were made on a thicker intermetallicinclusion.
3.4. Chemical composition changes in theintermetallic inclusion
The previous work, based on the SEM observations,shows that the regions of intermetallic inclusion reveal anon-uniform swirl-like contrast of various intensity andthus different chemical compositions [11,16]. To clari-fy the mechanism of the phase constitution, the energydispersive X-ray spectrometry in TEM was used for thenano- scale analysis of the distribution of the Cu and Alatoms across the intermetallic layer.
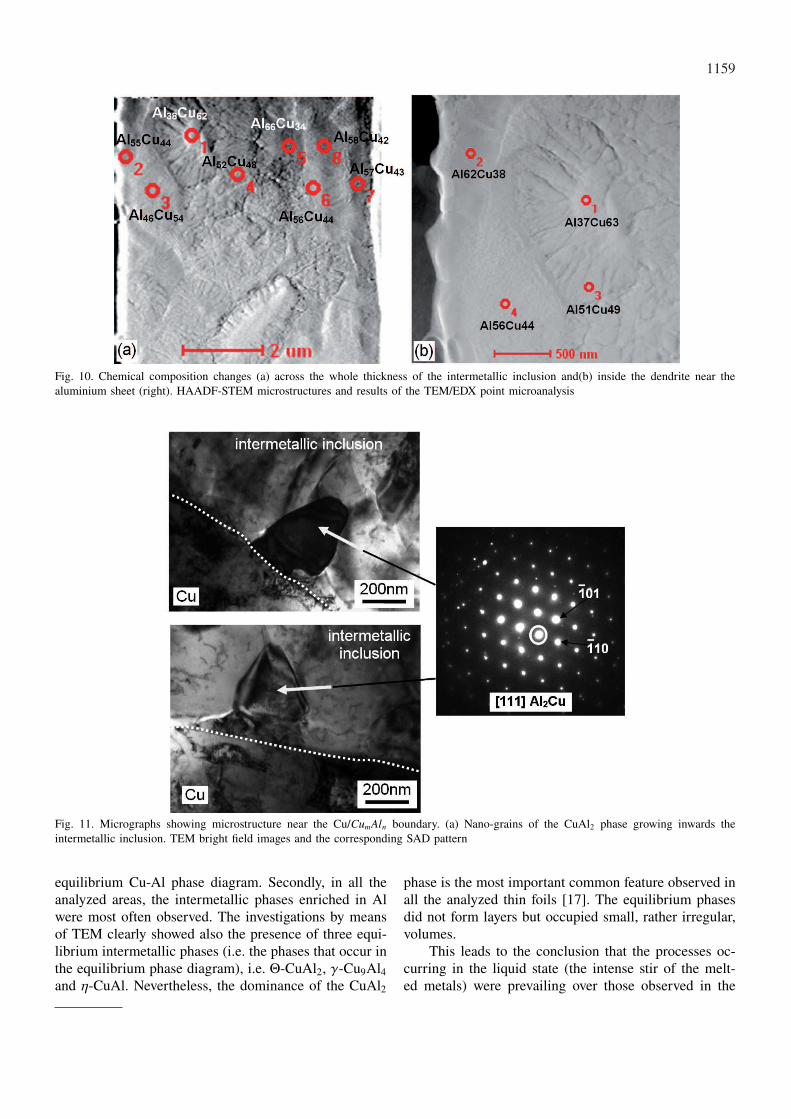
As regards the ‘after bonding’ state, the general ob-servation based on the TEM/EDX measurements is thatthere was no mechanical mixing between the weldedmetals in the solid state. The distribution of the el-ements inside the intermetallic inclusion clearly indi-cates that some chemical composition fluctuations wereobserved inside the melted volume. This can be seenin the HAADF/STEM microstructures of Fig. 10. Theanalysis reveals non-uniform intermixing of the phases,without any interrelation in respect to the parent sheets(Fig. 10a). Strong chemical composition changes wereobserved even inside the particular dendrites. Figure 10bclearly shows that the core of the dendrites is enrichedwith Cu and the arms of the dendrite - in Al. The ob-tained results suggest that, for most of the observed cas-es, the average copper/aluminium ratio (in at.%) variedfrom about 3:1 to 1:3, as it was also observed in earli-er works, e.g. [15,16]. Two other important conclusionscan be drawn. Firstly, the high cooling rates (and thehigh pressure) lead to the ‘creation’ of crystalline inter-metallic phases mostly far from those observed on the
1159
Fig. 10. Chemical composition changes (a) across the whole thickness of the intermetallic inclusion and(b) inside the dendrite near thealuminium sheet (right). HAADF-STEM microstructures and results of the TEM/EDX point microanalysis
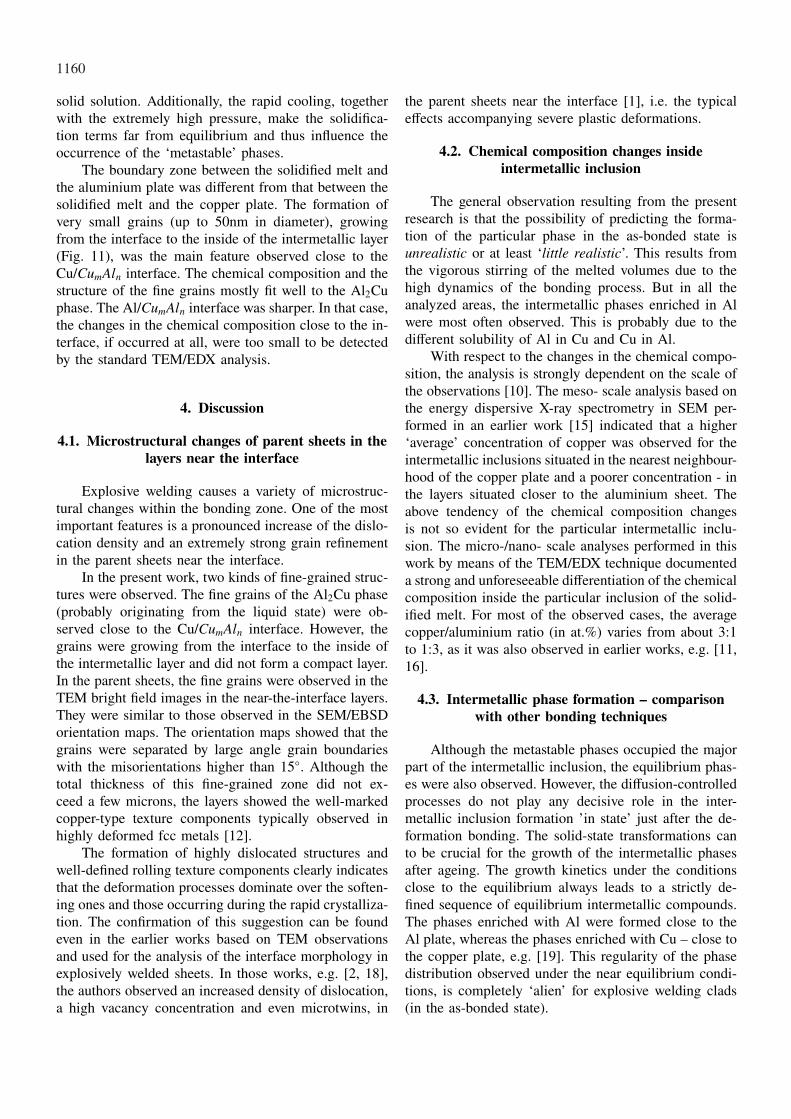
Fig. 11. Micrographs showing microstructure near the Cu/CumAln boundary. (a) Nano-grains of the CuAl2 phase growing inwards theintermetallic inclusion. TEM bright field images and the corresponding SAD pattern
equilibrium Cu-Al phase diagram. Secondly, in all theanalyzed areas, the intermetallic phases enriched in Alwere most often observed. The investigations by meansof TEM clearly showed also the presence of three equi-librium intermetallic phases (i.e. the phases that occur inthe equilibrium phase diagram), i.e. Θ-CuAl2, γ-Cu9Al4and η-CuAl. Nevertheless, the dominance of the CuAl2
phase is the most important common feature observed inall the analyzed thin foils [17]. The equilibrium phasesdid not form layers but occupied small, rather irregular,volumes.
This leads to the conclusion that the processes oc-curring in the liquid state (the intense stir of the melt-ed metals) were prevailing over those observed in the
1160
solid solution. Additionally, the rapid cooling, togetherwith the extremely high pressure, make the solidifica-tion terms far from equilibrium and thus influence theoccurrence of the ‘metastable’ phases.
The boundary zone between the solidified melt andthe aluminium plate was different from that between thesolidified melt and the copper plate. The formation ofvery small grains (up to 50nm in diameter), growingfrom the interface to the inside of the intermetallic layer(Fig. 11), was the main feature observed close to theCu/CumAln interface. The chemical composition and thestructure of the fine grains mostly fit well to the Al2Cuphase. The Al/CumAln interface was sharper. In that case,the changes in the chemical composition close to the in-terface, if occurred at all, were too small to be detectedby the standard TEM/EDX analysis.
4. Discussion
4.1. Microstructural changes of parent sheets in thelayers near the interface
Explosive welding causes a variety of microstruc-tural changes within the bonding zone. One of the mostimportant features is a pronounced increase of the dislo-cation density and an extremely strong grain refinementin the parent sheets near the interface.
In the present work, two kinds of fine-grained struc-tures were observed. The fine grains of the Al2Cu phase(probably originating from the liquid state) were ob-served close to the Cu/CumAln interface. However, thegrains were growing from the interface to the inside ofthe intermetallic layer and did not form a compact layer.In the parent sheets, the fine grains were observed in theTEM bright field images in the near-the-interface layers.They were similar to those observed in the SEM/EBSDorientation maps. The orientation maps showed that thegrains were separated by large angle grain boundarieswith the misorientations higher than 15◦. Although thetotal thickness of this fine-grained zone did not ex-ceed a few microns, the layers showed the well-markedcopper-type texture components typically observed inhighly deformed fcc metals [12].
The formation of highly dislocated structures andwell-defined rolling texture components clearly indicatesthat the deformation processes dominate over the soften-ing ones and those occurring during the rapid crystalliza-tion. The confirmation of this suggestion can be foundeven in the earlier works based on TEM observationsand used for the analysis of the interface morphology inexplosively welded sheets. In those works, e.g. [2, 18],the authors observed an increased density of dislocation,a high vacancy concentration and even microtwins, in
the parent sheets near the interface [1], i.e. the typicaleffects accompanying severe plastic deformations.
4.2. Chemical composition changes insideintermetallic inclusion
The general observation resulting from the presentresearch is that the possibility of predicting the forma-tion of the particular phase in the as-bonded state isunrealistic or at least ‘little realistic’. This results fromthe vigorous stirring of the melted volumes due to thehigh dynamics of the bonding process. But in all theanalyzed areas, the intermetallic phases enriched in Alwere most often observed. This is probably due to thedifferent solubility of Al in Cu and Cu in Al.
With respect to the changes in the chemical compo-sition, the analysis is strongly dependent on the scale ofthe observations [10]. The meso- scale analysis based onthe energy dispersive X-ray spectrometry in SEM per-formed in an earlier work [15] indicated that a higher‘average’ concentration of copper was observed for theintermetallic inclusions situated in the nearest neighbour-hood of the copper plate and a poorer concentration - inthe layers situated closer to the aluminium sheet. Theabove tendency of the chemical composition changesis not so evident for the particular intermetallic inclu-sion. The micro-/nano- scale analyses performed in thiswork by means of the TEM/EDX technique documenteda strong and unforeseeable differentiation of the chemicalcomposition inside the particular inclusion of the solid-ified melt. For most of the observed cases, the averagecopper/aluminium ratio (in at.%) varies from about 3:1to 1:3, as it was also observed in earlier works, e.g. [11,16].
4.3. Intermetallic phase formation – comparisonwith other bonding techniques
Although the metastable phases occupied the majorpart of the intermetallic inclusion, the equilibrium phas-es were also observed. However, the diffusion-controlledprocesses do not play any decisive role in the inter-metallic inclusion formation ’in state’ just after the de-formation bonding. The solid-state transformations canto be crucial for the growth of the intermetallic phasesafter ageing. The growth kinetics under the conditionsclose to the equilibrium always leads to a strictly de-fined sequence of equilibrium intermetallic compounds.The phases enriched with Al were formed close to theAl plate, whereas the phases enriched with Cu – close tothe copper plate, e.g. [19]. This regularity of the phasedistribution observed under the near equilibrium condi-tions, is completely ‘alien’ for explosive welding clads(in the as-bonded state).
1161
The theoretical predictions of the intermetallic phaseformation (under the near equilibrium conditions of thesolid-state diffusion processes and within a broad rangeof temperatures) could be based on the free energy val-ues. Since the free energy of formation was negative [19,21], the Al4Cu9 phase was predicted first to be formedat the Cu-Al interface and then on the AlCu and theAl2Cu phases. However, the experimental observations[19-21] in the diffusion bonded Cu/Al laminates showthat Al2Cu was the first phase which appeared betweenCu and Al - before Al4Cu9 and AlCu. The differences inthe solubility of the elements in the solid solution and themelting temperatures can be the reason why the Al2Cuphase is more frequently observed in the solidified meltthan the other equilibrium phases. Guo et al [19] andChen et al [21] studied the thermodynamic aspects ofthe growth of the Al-Cu intermetallic compounds closeto the interface after the Cu wire bonding. On the basisof the different solubility of either element, they statedthat, since the solubility limit of Cu in Al is an order ofmagnitude less than that of Al in Cu, the Al(Cu) solidsolution would be expected to saturate first, resulting inthe preferred nucleation of Al2Cu. The Al crystals melt-ed as first and solidified later than copper. This causeslarger volumes of the Al plate (with respect to Cu) tomelt. Therefore, the liquid which was enriched with theAl and Al2Cu phase was detected more frequently.
5. Conclusions
This work describes the SEM/EBSD and TEM/EDXinvestigations of the microstructure, the texture and thechemical composition changes near the interface of ex-plosively welded Al and Cu plates. The following de-tailed conclusions can be drawn.
• During the bond formation, the layers of the parentsheets near the interfaces underwent intense plasticdeformation. Consequently, a strong structure refine-ment was observed in the intermediate layers of bothmetals. Fine-grained volumes were characterized bythe copper-type rolling texture and described by thetexture components lying close to the {112}<111>,{123}<634>and {110}<112>orientations. The effectof the grain refinement was clearly observed in cop-per, whereas aluminium deformed more uniformly inthe significant part of the sheet.
• Local melting leads to the formation of intermetallicsof different types. The equilibrium phases in the formof dendrites of different chemical compositions werealways surrounded by metastable ones (also crys-talline). Moreover, no significant regularity in thephase distribution (inside intermetallic inclusions)
with respect to the parent sheets was observed. Thelatter facts univocally show the dominance of theprocesses occurring during the intense stirring of therapidly solidified melt.
Acknowledgements
The authors give thanks to Mr. Z. Szulc and High Energy Tech-nologies Works ’Explomet’ (Opole, Poland) for the provision of theCu/Al clad. The authors are also grateful to Dr J. Wojewoda-Budka(IMIM PAN in Krakow) for the thin foils preparation by FIB.
This work was supported in part by the Polish Ministry of Scie-nce and Higher Education (UMO-2012/04/M/ST8/00401).
REFERENCES
[1] T.Z. B l a z y n s k i, Explosive Welding, Forming andCompaction, Applied Science Publishers LTD, NewYork, 1983.
[2] S.H. C a r p e n t e r, Shock Waves and High-Strain-RatePhenomena in Metals, eds. M.A. Meyers, L.E. Murr,Plenum Press, 941-959 New York 1981.
[3] D.G. B r a s h e r, D.J. B u t l e r, A.W. H a r e, inShock Waves for Industrial Applications, ed. L.E. Murr,Noyes Publications, 216-236 (1988).
[4] N.V. N a u m o v i c h, A.I. Y a d e v i c h, N.M. C h i -g r i n o v a, in Shock Waves for Industrial Applications,ed. L.E. Murr, Noyes Publications, 170-215 (1988).
[5] A.G. M a m a l i s, A. S z a l a y, N.M. V a x e v a n i -d i s, D.I. P a n t e l i s, Mat. Sci. Engn. A188, 267-275(1994).
[6] Y. Ya n g, B. W a n g, J. X i o n g, J. Mat. Sci. 41,3501-3505 (2006).
[7] S.A.A. A k b a r i M o u s a v i, S.T.S. A l - H a s -s a n i, A.G. A t k i n s, Materials and Design 29,1334-1352 (2008).
[8] S.A.A. A k b a r i M o u s a v i, P. F a r h a d i S a r -t a n g i, Materials and Design 30, 459-468 (2009).
[9] F. F i n d i k, Materials and Design 32, 1081-1093(2011).
[10] J. S o n g, A. K o s t k a, M. V e e h m a y e r, D.R a a b e, Mat. Sci. Engn. A528, 2641-2647 (2011).
[11] H. P a u l, M. F a r y n a, M. P r a ż m o w s k i, R.B a ń s k i, Arch. Metall. Mater. 56, 463-474 (2011).
[12] H. P a u l, M. M i s z c z y k, M. P r a ż m o w s k i,Z. S z u l c, Inżynieria Materiałowa 5, 1339-1346 (inpolish) (2010).
[13] M. G e r l a n d, H.N. P r e s l e s, J.P. G u i n, D.B e r t h e a u, Mat. Sci. Engn. A280, 311-319 (2000).
[14] K. H o k a m o t o, K. N a k a t a, A. M o r i, R. T o -m o s h i g e, S. T s u d a, T. T s u m u r a, A. I n o u e,Journal of Alloys and Compounds 485, 817-821 (2009).
[15] M. A b b a s i, A. K a r i m T a h e r i, M.T. S a l e h i,Journal of Alloys and Compounds 319, 233-241 (2001).
[16] H. P a u l, M. M i s z c z y k, M. P r a ż m o w s k i,Mat. Sci. Forum 702-703, 603-606 (2012).

1162
[17] H. P a u l, L. L i t y ń s k a - D o b r z y ń s k a, M.P r a ż m o w s k i, Metall. Mater. Trans A, in print(2013).
[18] L.F. T r u e b, J. Appl. Phys. 40, 2976-2987 (1969).[19] Y. G u o, G. L i u, H. J i n, Z. S h i, G. Q i a o, J.
Mater. Sci. 46, 2467-2473 (2011).
[20] Y. T a n a k a, M. K a j i h a r a, Y. W a t a n a b e, Mat.Sci. Engn. A445-446, 335-363 (2007).
[21] J. C h e n, Y-S. L a i, Y-W. W a n g, C.R. C a o, Mi-croelectronics Reliability 51, 125-129 (2011).
Received: 17 Oktober 2012.


![Uwarunkowania produkcji biogazu rolniczego w Polsce · Ilość wytworzonego zainstalowanych mocy biogazu rolniczego [w mln m3] Wykorzystanie na poziomie 59% 810 16 2830 42 58 78 0](https://static.fdocuments.pl/doc/165x107/5c774fc109d3f291718c2a69/uwarunkowania-produkcji-biogazu-rolniczego-w-ilosc-wytworzonego-zainstalowanych.jpg)