
Arch. Min. Sci., Vol. 58 (2013), No 3, p. 823–841
19
Arch. Min. Sci., Vol. 58 (2013), No 3, p. 823–841 Electronic version (in color) of this paper is available: http://mining.archives.pl HENRYK OTWINOWSKI* CUT SIZE DETERMINATION OF CENTRIFUGAL CLASSIFIER WITH FLUIDIZED BED WYZNACZANIE ZIARNA GRANICZNEGO KLASYFIKATORA ODŚRODKOWEGO Z WARSTWĄ FLUIDALNĄ The cut size determination on the basis of proposed matrix model of classification process in a cen- trifugal air flow classifier with a fluidized bed is presented using matrix model. The presented methodology of cut size determination is based on the precise measurement of the total mass of fed material and coarse product in experimental tests. Knowledge of the feed particle size distribution is also required. Considered classifier is a part of the fluidized bed jet mill. The presented cut size determination will allow to optimize mill work and prediction of particle size distribution of the classification products. Keywords: cut size determination, classification matrix model, Tromp curve, air classifier W artykule przedstawiono metodykę wyznaczania rozmiaru ziarna granicznego procesu klasyfikacji w odśrodkowym klasyfikatorze przepływowym z warstwą fluidalną przy wykorzystaniu modelu macierzo- wego. Przedstawiona metodyka oparta jest na dokładnym wyznaczeniu masy nadawy i gruboziarnistego produktu klasyfikacji na podstawie badań eksperymentalnych. Wymagana jest także znajomość składu ziarnowego nadawy. Rozpatrywany klasyfikator stanowi część fluidalnego młyna strumieniowego. Wyznaczenie rozmiaru ziarna granicznego umożliwia przeprowadzenie optymalizacji pracy młyna i prognozowanie składu ziarnowego produktów klasyfikacji. Słowa kluczowe: wyznaczanie ziarna granicznego, macierzowy model klasyfikacji, krzywa Trompa, klasyfikator aerodynamiczny * CZESTOCHOWA UNIVERSITY OF TECHNOLOGY, INSTITUTE OF THERMAL MACHINERY, ARMII KRAJOWEJ 21 AVE., 42-201 CZĘSTOCHOWA, POLAND, E-mail: [email protected] DOI 10.2478/amsc-2013-0057
Transcript of Arch. Min. Sci., Vol. 58 (2013), No 3, p. 823–841
Arch. Min. Sci., Vol. 58 (2013), No 3, p. 823–841Electronic version (in color) of this paper is available: http://mining.archives.pl
HENRYK OTWINOWSKI*
CUT SIZE DETERMINATION OF CENTRIFUGAL CLASSIFIER WITH FLUIDIZED BED
WYZNACZANIE ZIARNA GRANICZNEGO KLASYFIKATORA ODŚRODKOWEGO Z WARSTWĄ FLUIDALNĄ
The cut size determination on the basis of proposed matrix model of classification process in a cen-trifugal air flow classifier with a fluidized bed is presented using matrix model. The presented methodology of cut size determination is based on the precise measurement of the total mass of fed material and coarse product in experimental tests. Knowledge of the feed particle size distribution is also required. Considered classifier is a part of the fluidized bed jet mill. The presented cut size determination will allow to optimize mill work and prediction of particle size distribution of the classification products.
Keywords: cut size determination, classification matrix model, Tromp curve, air classifier
W artykule przedstawiono metodykę wyznaczania rozmiaru ziarna granicznego procesu klasyfikacji w odśrodkowym klasyfikatorze przepływowym z warstwą fluidalną przy wykorzystaniu modelu macierzo-wego. Przedstawiona metodyka oparta jest na dokładnym wyznaczeniu masy nadawy i gruboziarnistego produktu klasyfikacji na podstawie badań eksperymentalnych. Wymagana jest także znajomość składu ziarnowego nadawy. Rozpatrywany klasyfikator stanowi część fluidalnego młyna strumieniowego. Wyznaczenie rozmiaru ziarna granicznego umożliwia przeprowadzenie optymalizacji pracy młyna i prognozowanie składu ziarnowego produktów klasyfikacji.
Słowa kluczowe: wyznaczanie ziarna granicznego, macierzowy model klasyfikacji, krzywa Trompa, klasyfikator aerodynamiczny
* CZESTOCHOWA UNIVERSITY OF TECHNOLOGY, INSTITUTE OF THERMAL MACHINERY, ARMII KRAJOWEJ 21 AVE., 42-201 CZĘSTOCHOWA, POLAND, E-mail: [email protected]
DOI 10.2478/amsc-2013-0057
824
1. Introduction
The air classifiers are commonly used in mineral powder processing industries, where a large volume of mixed materials with differing physical characteristics should be sorted quickly and efficiently. The process of air classification is also of critical importance for many grinding operations. Developments within powder processing have led to demands for increasingly finer particles and narrower particle size distributions.
Classification process is common characterized by a Tromp curve (Tromp, 1937). This curve is also called in a different way: partition curve (King, 2001; Wills & Napier-Munn, 2006), distribution curve (Mohanta & Mishra, 2009), classification curve (Eswaraiah et al., 2012), clas-sification efficiency (Johansson & Evertsson, 2012), classification efficiency curve (Schmidt & Werther, 2006), partial classification efficiency curve (Morimoto & Shakouchi, 2003), partial classification efficiency (Huang et al., 2012), grade efficiency curve (Rumpf, 1990; Bauder et al., 2004; Shapiro & Galperin, 2005) and grade efficiency function (Lanzerstorfer 2011).
From mathematical point of view the Tromp curve is a monotonic function and determines the probability that feed fraction with a defined property will enter one of the products (Pyka & Wierzchowski, 2012). There are also some other definitions of this curve:
– Tromp curve shows the mass fraction of material of a specific size in feed to the classifier that reports to the coarse product (Schmidt & Werther, 2006; Eswaraiah et al., 2012),
– Tromp curve determines what part of the classified material with defined size will enter the coarse product (Mohanta & Mishra, 2009),
– Tromp curve shows the chance of a particle to be found in the coarse fraction in relation to its particle size (Dijkink et al., 2007).
There are a few methods to determine this curve. The Tromp curve frequently is calculated on the basis of the experimental data (Leschonski, 1984; Allen, 1997; Wills & Napier-Munn, 2006). Dijkink et al. (2007) investigated relation between the dispersability in air of protein starch mixtures and the results of air classification. These mixtures, which are used in the food indus-try, were classified with a rotor air classifier. After classification the mass and the particle size distribution (PSD) of the coarse and fine products were determined. Using these results Tromp curves were constructed. A strong relation was found between dispersive index of protein/starch mixtures and their performance upon air classification. A number of experiments were carried out in a circulating air classifier to study the mechanism of particle separation and fish-hook effect of the Tromp curve (Eswaraiah et al., 2012). Tromp curve was calculated using mass flow rate and cumulative size distribution of the coarse and fine fractions. Johansson and Evertsson (2012a) reported a simulation study on gravitational air classifier using computer fluid dynam-ics (CFD). The Tromp curve was obtained on the basis of experimentally determined: feed and coarse mass and PSD of feed and coarse product. The influence of the parameters controlling the flow field on the behavior and efficiency of the classification process were simulated using the CFD technique. The influence of the design and the geometrical parameters of the gravitational classifier on the flow field and air classification performance were also simulated and evaluated.
Tromp curve can be also described by approximation functions which were introduced by Molerus (1966, 1967) and Austin and Klimpel (1981). The exponential Tromp curve and particle agglomeration were used to explain the fish-hook effect in air horizontal turbine classification (Wang et al. 1999). Heavy metals concentrations in fly ash from a biomass incineration plant are
825
investigated by Lanzerstorfer (2011) where the Tromp curve of the used flow air classifier was modeled by a Plitt function (Plitt, 1971) based on experimental data. Plitt function was also used in stochastic model of gravity/centrifugal separator (Venkoba Rao et al., 2003; Venkoba Rao, 2005).
Some useful parameters can be estimated from the Tromp curve (Allen, 1997; Wills & Napier-Munn, 2006): cut size of the classified particles; sharpness index (Eder-Mayer’s index), which is related to the slope of the Tromp curve; probable error (Ecart probable), which reflects the classification precision; imperfection, which relates to the shape of the Tromp curve. The cut size is the most important parameter. Particles of this size have an equal chance of being in coarse or fine product. The cut size can be determined from the Tromp curve as particle size where the ordinate is equal to 0.5. This method was often used by many authors: Wang et al. (1999) for horizontal turbine classifier, Dijkink et al. (2007) for rotor air classifier. The cut size can be also evaluated from approximation relationship. Huang et al. (2012) the cut size of the turbo air classifier calculated from the formula, in which tangential and radial velocities must be known. These velocities distributions are found using numerical simulations in the annular region of the classifier. The same formula was used by: Morimoto and Shakouchi (2003) for ultra fine pneumatic classifier research, Bauder et al. (2004) to investigate the separation mechanism in deflector wheel classifier, Feng et al. (2008) for the experimental study of the classification process in a turbo air classifier. The similar formula was used by Palaniandy and Azizli (2009). They were investigated mechanochemical effect in the ground product. The fine grinding testwork was carried out with fluidized bed jet mill equipped with vortex air classifier.
In this paper the modified experimental method for cut size determination on the basis of proposed matrix model of classification process is presented. Matrix models are commonly used in the mechanical processing of mineral resources, especially in the modeling of the comminution process. The balance model of the ring-roller mill’s table (Bozhenko et al., 2011) is an interesting example of these models.
2. Modelling the process in a centrifugal classifier with a fluidized bed
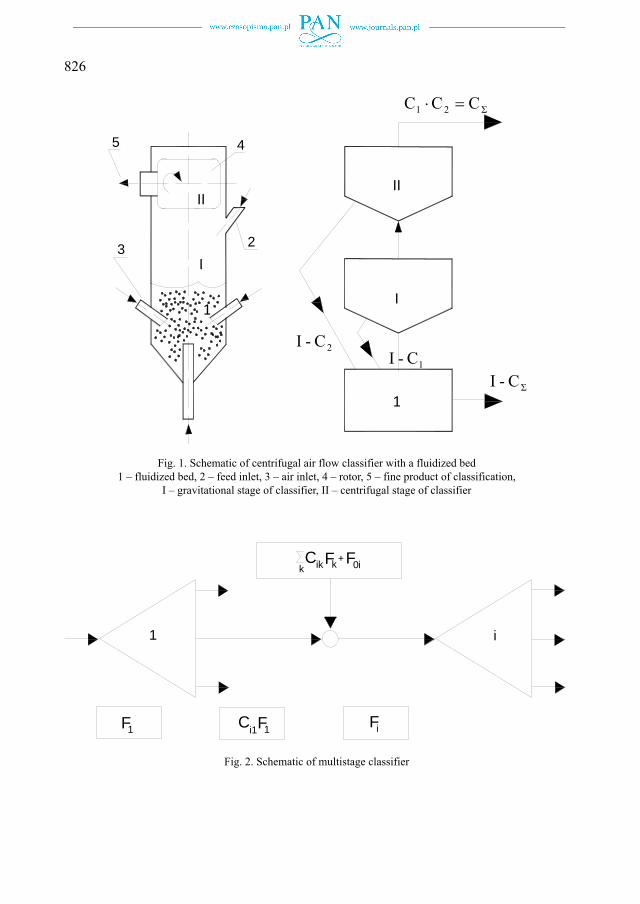
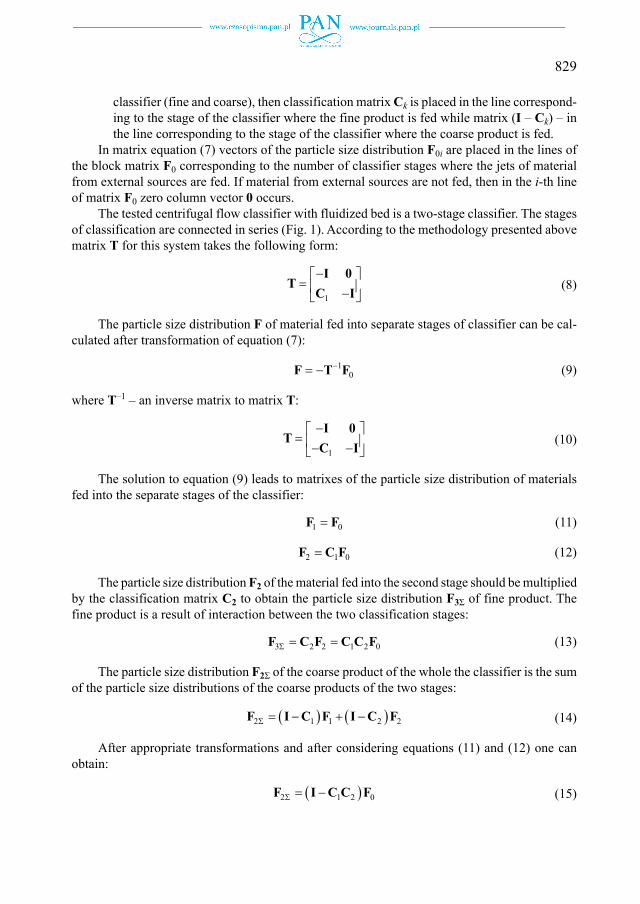
Particle distribution is the result of the interaction between two degrees of classification in centrifugal air flow classifier with a fluidized bed (Fig. 1). In this device, fed material is put into the classifier column through port 2 while classifying air is supplied by four nozzles 3. Three nozzles are placed uniformly on the column circuit and the fourth on the column axis. A fluidi-zation layer is formed in the lower part of classifier and due to this, lifting of granular material takes place. At first, the granular material goes through gravitational stage I in the middle part of the classifier column and then to centrifugal stage II enclosing region of rotor work 4. Coarse particles stay in the gravitational classification zone while fine particles 5 leave the classification zone together with air and they are directed to the separation units (cyclone and filter). The aim of the proposed classification model is to describe a process encompassing both stages.
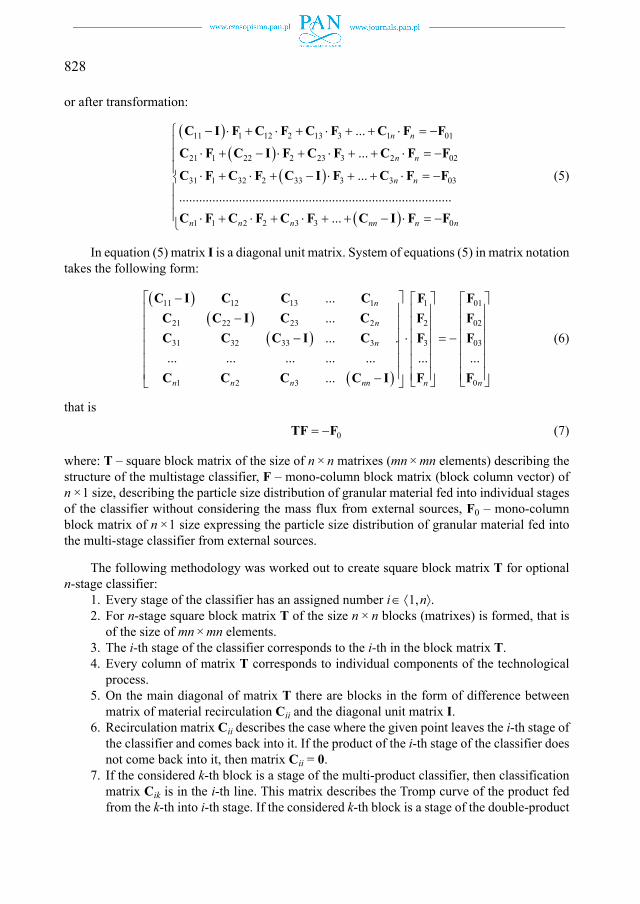
The proposed mathematical model of classification covers the general case of a multistage classifier presented in Fig. 2 (Zhukov et al., 2009; Otwinowski et al., 2011). A single i-th stage is separated from a classifier with n stages. Classification is characterised by Tromp’s curve C(x). It is a random function whose values determine the probability of finding particles of the elemen-tary class fed material with sizes (x, x + dx) in the coarse product. If one considers the granular
826
Fig. 2. Schematic of multistage classifier
Fig. 1. Schematic of centrifugal air flow classifier with a fluidized bed1 – fluidized bed, 2 – feed inlet, 3 – air inlet, 4 – rotor, 5 – fine product of classification,
I – gravitational stage of classifier, II – centrifugal stage of classifier
3
45
2
I
II
1
I
II
1
21 CCC
2C - I1C - I
C - I
Ci11F 1F iF
i1
+ F0ikikFkC
827
material divided into size classes, the Tromp curve has a discrete form and can be described by the diagonal matrix C, the so-called classification matrix:
1
2
3
0 0 0 00 0 0 00 0 0 0... ... ... ... ...0 0 0 0 m
cc
c
c
C (1)
where m – a number of the considered size classes.
Every element cj of the classification matrix (j = 1, 2, 3,…, m) determines the probability of finding particles of j-th class in the coarse product, which corresponds to the mass fraction of this part of j-th size class which passed into the coarse product of classification.
In the considered multistage classifier (Fig. 2), it is assumed that the mass flux of the granular material with a particle size distribution determined by matrix F1 was supplied to the first stage of the classifier. Matrix F1 is a mono-column matrix of m × 1 size
1
21 ...
m
ff
f
F (2)
The Tromp curve is presented by diagonal matrix Ci1. The mass flux directed towards the i-th stage is described by this curve. Therefore, the mass flux of the classification product of the first stage with a particle size distribution Ci1F1 goes into the i-th classifier. In the general case it is assumed that into the i-th classifier stage the following can be inserted: classification products from the all remaining stages ik k
kC F (where k = 1, 2,…, n), taking into account the
considered stage, and a mass flux of particle size distribution F0i originated from an external source. The relationship for the particle size distribution on entrance into the i-th stage of the classifier is received from the mass balance of mixing node before the i-th stage (Fig. 2). This relationship is given in the form:
0i ik k i
k F C F F (3)
For i = 1, 2, 3,…, n (n-the number of classifier stages), the following system of equations is obtained:
1 11 1 12 2 13 3 1 01
2 21 1 22 2 23 3 2 02
3 31 1 32 2 33 3 3 03
1
.........
...............................................................................
n n
n n
n n
n n
F C F C F C F C F FF C F C F C F C F FF C F C F C F C F F
F C 1 2 2 3 3 0...n n nn n n
F C F C F C F F
(4)
828
or after transformation:
11 1 12 2 13 3 1 01
21 1 22 2 23 3 2 02
31 1 32 2 33 3 3 03
1
...
...
.....................................................................................
n n
n n
n n
n
C I F C F C F C F F
C F C I F C F C F F
C F C F C I F C F F
C 1 2 2 3 3 0...n n nn n n
F C F C F C I F F
(5)
In equation (5) matrix I is a diagonal unit matrix. System of equations (5) in matrix notation takes the following form:
11 12 13 1 1 01
21 22 23 2 2 02
31 32 33 3 3 03
1 2 3 0
...
...
... .... ... ... ... ... ... ...
...
n
n
n
n n n nn n n
C I C C C F FC C I C C F FC C C I C F F
C C C C I F F
(6)
that is
0 TF F (7)
where: T – square block matrix of the size of n × n matrixes (mn × mn elements) describing the structure of the multistage classifier, F – mono-column block matrix (block column vector) of n ×1 size, describing the particle size distribution of granular material fed into individual stages of the classifier without considering the mass flux from external sources, F0 – mono-column block matrix of n ×1 size expressing the particle size distribution of granular material fed into the multi-stage classifier from external sources.
The following methodology was worked out to create square block matrix T for optional n-stage classifier:
1. Every stage of the classifier has an assigned number i 1,n. 2. For n-stage square block matrix T of the size n × n blocks (matrixes) is formed, that is
of the size of mn × mn elements.3. The i-th stage of the classifier corresponds to the i-th in the block matrix T.4. Every column of matrix T corresponds to individual components of the technological
process.5. On the main diagonal of matrix T there are blocks in the form of difference between
matrix of material recirculation Cii and the diagonal unit matrix I. 6. Recirculation matrix Cii describes the case where the given point leaves the i-th stage of
the classifier and comes back into it. If the product of the i-th stage of the classifier does not come back into it, then matrix Cii = 0.
7. If the considered k-th block is a stage of the multi-product classifier, then classification matrix Cik is in the i-th line. This matrix describes the Tromp curve of the product fed from the k-th into i-th stage. If the considered k-th block is a stage of the double-product
829
classifier (fine and coarse), then classification matrix Ck is placed in the line correspond-ing to the stage of the classifier where the fine product is fed while matrix (I – Ck) – in the line corresponding to the stage of the classifier where the coarse product is fed.
In matrix equation (7) vectors of the particle size distribution F0i are placed in the lines of the block matrix F0 corresponding to the number of classifier stages where the jets of material from external sources are fed. If material from external sources are not fed, then in the i-th line of matrix F0 zero column vector 0 occurs.
The tested centrifugal flow classifier with fluidized bed is a two-stage classifier. The stages of classification are connected in series (Fig. 1). According to the methodology presented above matrix T for this system takes the following form:
1
I 0T
C I (8)
The particle size distribution F of material fed into separate stages of classifier can be cal-culated after transformation of equation (7):
1
0 F T F (9)
where T–1 – an inverse matrix to matrix T:
1
I 0T
C I (10)
The solution to equation (9) leads to matrixes of the particle size distribution of materials fed into the separate stages of the classifier:
1 0F F (11)
2 1 0F C F (12)
The particle size distribution F2 of the material fed into the second stage should be multiplied by the classification matrix C2 to obtain the particle size distribution F3Σ of fine product. The fine product is a result of interaction between the two classification stages:
3 2 2 1 2 0 F C F C C F (13)
The particle size distribution F2Σ of the coarse product of the whole the classifier is the sum of the particle size distributions of the coarse products of the two stages:
2 1 1 2 2 F I C F I C F (14)
After appropriate transformations and after considering equations (11) and (12) one can obtain:
2 1 2 0 F I C C F (15)
830
Molerus’ equation (Molerus, 1966, 1967) was applied to determine elements of the matrix C1 of the gravitational stage and matrix C2 of the centrifugal stage. This equation is commonly used in flow classifiers. According to Molerus’ equation, the classification matrix elements of the gravitational stage are described by the following relationship:
1
11
1
1 exp 0.5 1j
j
c
cx
Sx
(16)
while classification matrix elements of the centrifugal stage are determined from the equation:
2
22
1
1 exp 0.5 1j
j
c
cx
Sx
(17)
where: xj – mean size of the j-th class particles, xc1, xc2 – cut sizes of I and II stage of the clas-sifier, S1, S2 – parameters of distribution effectiveness (Molerus parameters) of I and II stage of the classifier.
The parameter of distribution effectiveness depends on the construction and work condi-tions of the classifier. It is determined on the basis of experimental data and its value is usually included in the range 0-10 for the processes of high efficiency S =10 (Heinrich et al., 2003, Mizonov et al. 2005).
Equations (13) and (15) make it possible to calculate the particle size distribution of the coarse products in the optional two-stage classifier. Determination of the cut size for I and II classification stage is required to carry out calculations. The method for cut size determination is presented in the chapter 4.
3. Experimental research into the two-stage classification
Experimental research into the two-stage classification was carried out in a centrifugal air classifier with a fluidized bed (Kaniowski, 2012). The tested classifier consists of a fluid part with a chamber of conical – cylindrical shape and of a centrifugal part with a square cross-section and with a built-in horizontal rotor. The first part accounts for the gravitational stage of the clas-sifier, while the second – the centrifugal stage. A fountain fluidized bed is created in the conical – cylindrical sets. A fluidizing air stream flows through the central part of the set and captures particles of solid material. These particles are lifted up and then part of them (the coarse particles) fall down along the chamber walls and return to the fluidized bed. The remaining particles (fines) pass into the centrifugal stage. The bladed rotor with a horizontal rotation axis is a basic element of the centrifugal stage. In the tested classifier, material distribution is achieved in two-stages with two main forces affecting the particle due to the construction specification. These forces are: the gravity force in the gravitational stage and the centrifugal force in the centrifugal stage.
831
3.1. Selection and characteristic of the tested material
In the centrifugal air classifier, accurate experiments on the particle distribution required proper selection and preparation of the tested material. Quartz sand was the starting material for the preparation of feed samples with an adequate particle size distribution. This material is characterised by the abrasion resistance, the shape of the sand particles is closed to a ball and its density is equal to 2638 kg/m3 and corresponds to materials which are the most often applied in the processing industry of mineral raw materials. Low transient humidity is also an important feature. The tested material was sieved with the use of a mechanical vibratory shaker with rec-tangular screens. In this way the samples of quartz sand with a dominant mass participation of particles of sizes in a range 63-100 μm were obtained.
3.2. Experimental stand
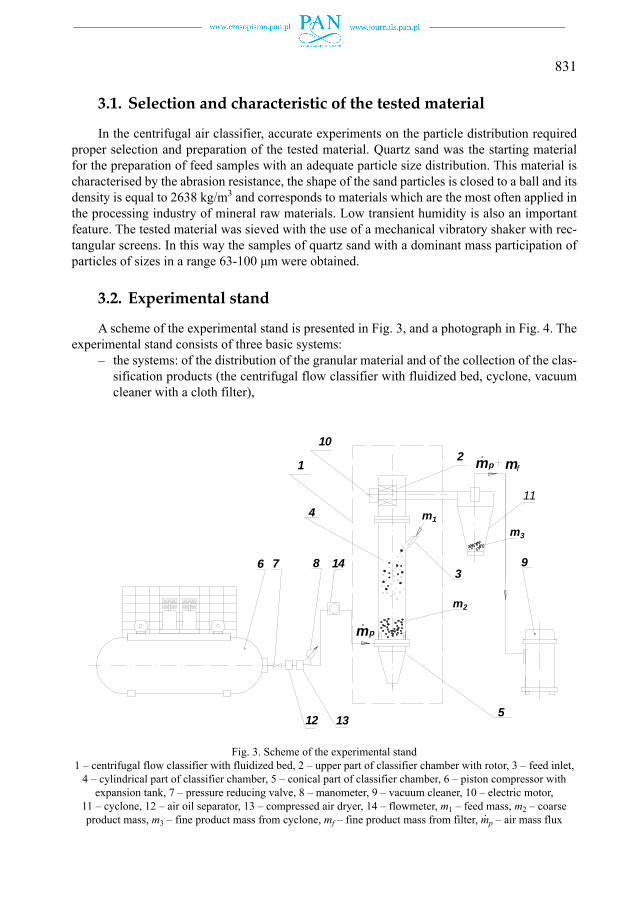
A scheme of the experimental stand is presented in Fig. 3, and a photograph in Fig. 4. The experimental stand consists of three basic systems:
– the systems: of the distribution of the granular material and of the collection of the clas-sification products (the centrifugal flow classifier with fluidized bed, cyclone, vacuum cleaner with a cloth filter),
Fig. 3. Scheme of the experimental stand1 – centrifugal flow classifier with fluidized bed, 2 – upper part of classifier chamber with rotor, 3 – feed inlet,
4 – cylindrical part of classifier chamber, 5 – conical part of classifier chamber, 6 – piston compressor with expansion tank, 7 – pressure reducing valve, 8 – manometer, 9 – vacuum cleaner, 10 – electric motor,
11 – cyclone, 12 – air oil separator, 13 – compressed air dryer, 14 – flowmeter, m1 – feed mass, m2 – coarse product mass, m3 – fine product mass from cyclone, mf – fine product mass from filter, m· p – air mass flux
2m
4
3
m3
14
11
pm fm2
1m
9
5
mp
10
1
86 7
12 13
832
– filling system of the classifier with the fed material (container of feed, supplying port),– feed system of the classifier with air (piston compressor, system of purifying air, pressure
reducing valves, distribution collector, gauges).
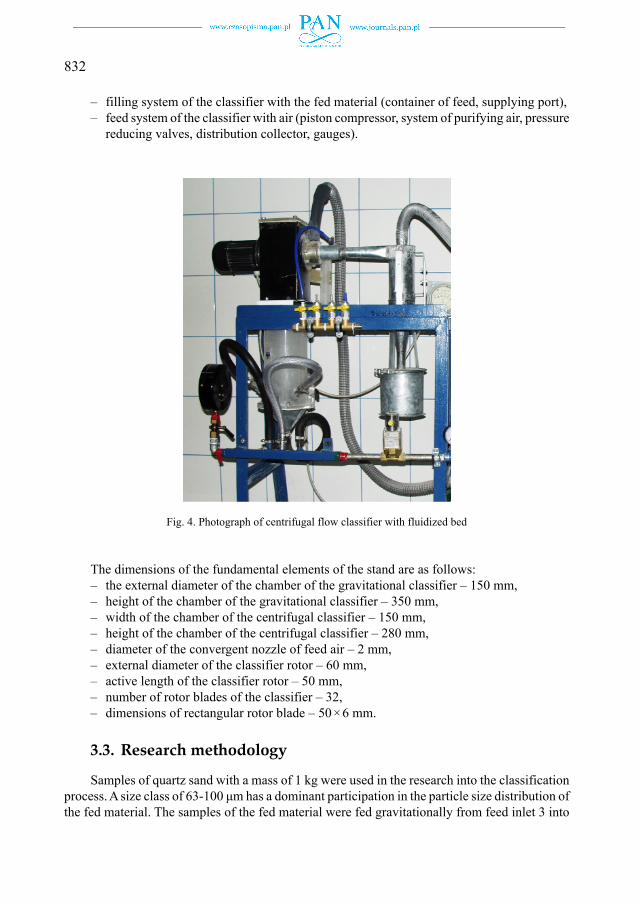
Fig. 4. Photograph of centrifugal flow classifier with fluidized bed
The dimensions of the fundamental elements of the stand are as follows:– the external diameter of the chamber of the gravitational classifier – 150 mm,– height of the chamber of the gravitational classifier – 350 mm,– width of the chamber of the centrifugal classifier – 150 mm,– height of the chamber of the centrifugal classifier – 280 mm,– diameter of the convergent nozzle of feed air – 2 mm,– external diameter of the classifier rotor – 60 mm,– active length of the classifier rotor – 50 mm,– number of rotor blades of the classifier – 32,– dimensions of rectangular rotor blade – 50×6 mm.
3.3. Research methodology
Samples of quartz sand with a mass of 1 kg were used in the research into the classification process. A size class of 63-100 μm has a dominant participation in the particle size distribution of the fed material. The samples of the fed material were fed gravitationally from feed inlet 3 into
833
classifier column 4. Working air was put into the bottom part of the column by the system of four convergent nozzles from piston compressor 6, with a maximum compression ratio 1 MPa and maximum efficiency 71.4 m3/h. After compression, air was supplied into the equalizing tank and then underwent treatment in oil separator 12 and dehydrator 13. The overpressure and mass flow of the working air were measured by elastic pressure gauge 8 and electromagnetic flowmeter 14 manufactured by KOBOLD Instruments. The centrifugal classifier with a horizontal cylindrical rotor with radial blades was placed over column 4 of the classifier. The rotational speed of the rotor is regulated by a Hitachi inverter. Particles smaller than cut size entered cyclone 11 between the rotor blades. To generate negative pressure in the classifier chamber, winding device 9 – an industrial vacuum cleaner made by Portotecnica with a maximum suction 22 kPa and maximum air flow 510 m3/h – was applied. Continuous measurement of the negative pressure in the cham-ber was carried out. After every experiment, the distribution products were weighed using an electronic laboratory scales with an accuracy of 0.01 g. Then, representative material samples were collected from the classifier column m2, cyclone m3 and filter mf. The measurements of the particle size distributions of the collected samples of the fed material and classification products were carried out using IPS (Infrared Particle Sizer) electronic analyser of KAMIKA Instruments.
The pressure of the feeding factor was changed over the range of p = 100-600 kPa during the measurements. The rotational speed of the classifier rotor was equal to n = 0; 7.5; 15; 25 1/s. During research unchangeable values were: mass of the fed material m1 = 1 kg and time of clas-sification process τ = 3 min. Mass of the feed was selected to assure a proper run of fluidization, and time was short enough to assure that comminution of the particles of the tested material did not take place.
4. Determination of the cut size of the centrifugal classifier with fluidized bed
These methods based on the mass balance of the fed material and classification products (Leschonski 1984, Mizonov and Ushakov 1989) are the most often applied to determine the cut size. The mass balance is prepared separately for every size class on the basis of measurements of the mass and the particle size distribution of the feed and classification products, obtained as a result of the conducted experimental tests. These methods are not very accurate due to errors made in the determination of the particle size distribution – samples taken for analysis are not representative to a sufficient degree (which has a negative influence on the results of particle analyses). The analyses are burdened with considerable error, especially in the range of the finest particles. As a consequence of the above errors, the mass balances are not met for individual size classes, and there is further imprecise determination of the Tromp curve and cut size.
A following methodology was proposed for the adequate determination of the cut size during classification in a centrifugal flow classifier with fluidized bed. In this methodology the following are applied:
– equation (14) describing the particle size distribution of coarse product,– Molerus’ equation for the two stages (16) and (17), – the measurement results of the particle size distribution of fed material,– experimentally determined mass fraction of the coarse product of two-stage classification.
834
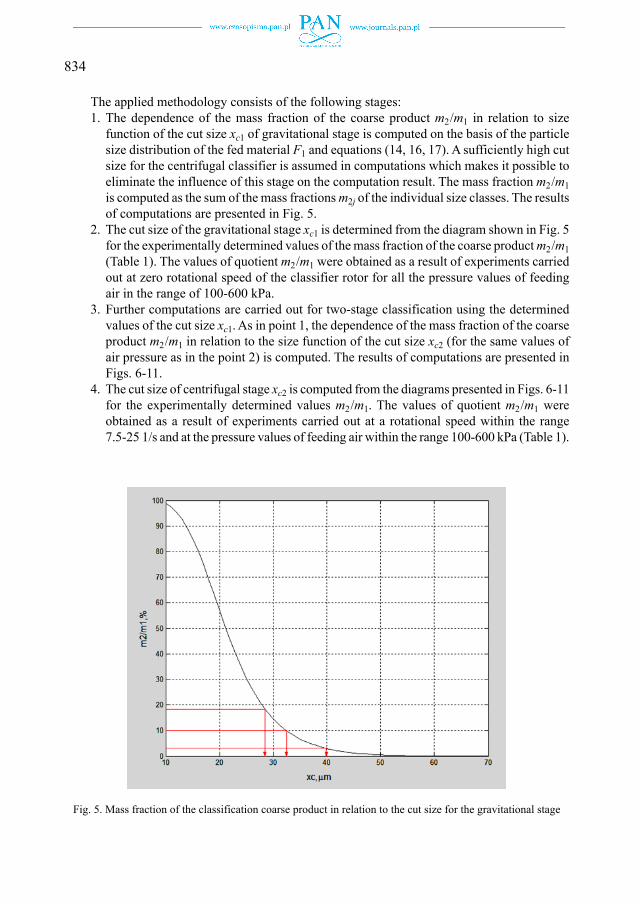
The applied methodology consists of the following stages:1. The dependence of the mass fraction of the coarse product m2/m1 in relation to size
function of the cut size xc1 of gravitational stage is computed on the basis of the particle size distribution of the fed material F1 and equations (14, 16, 17). A sufficiently high cut size for the centrifugal classifier is assumed in computations which makes it possible to eliminate the influence of this stage on the computation result. The mass fraction m2/m1 is computed as the sum of the mass fractions m2j of the individual size classes. The results of computations are presented in Fig. 5.
2. The cut size of the gravitational stage xc1 is determined from the diagram shown in Fig. 5 for the experimentally determined values of the mass fraction of the coarse product m2/m1 (Table 1). The values of quotient m2/m1 were obtained as a result of experiments carried out at zero rotational speed of the classifier rotor for all the pressure values of feeding air in the range of 100-600 kPa.
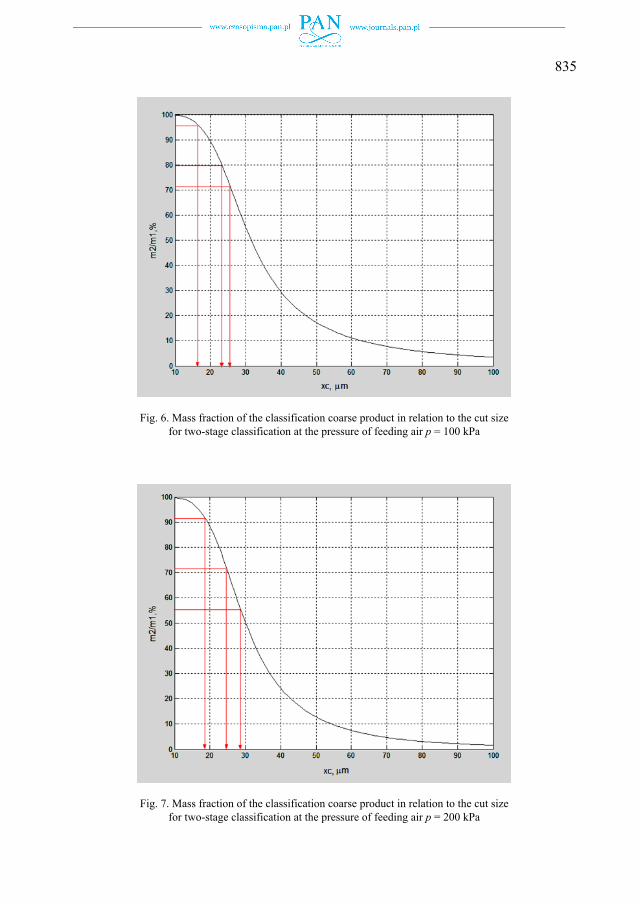
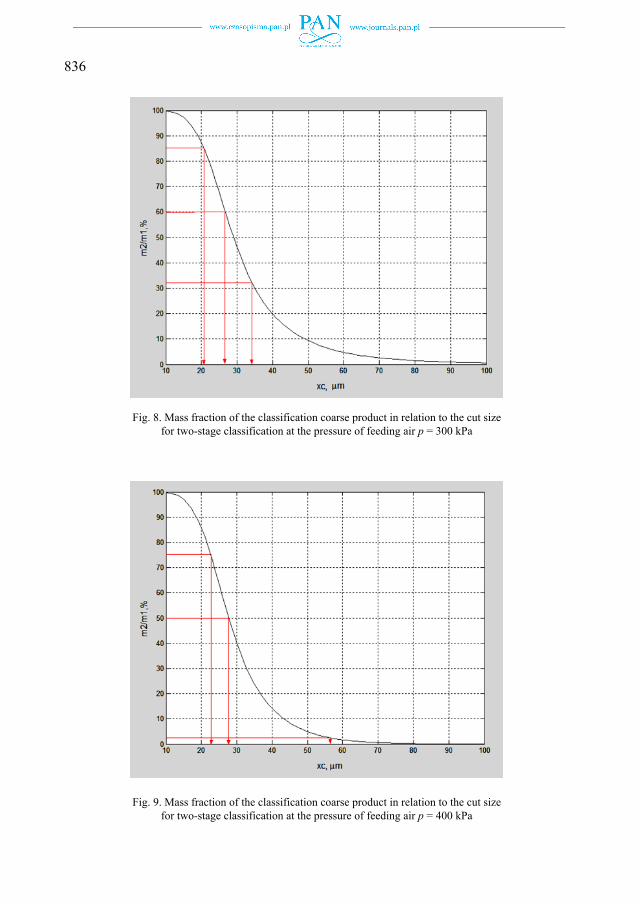
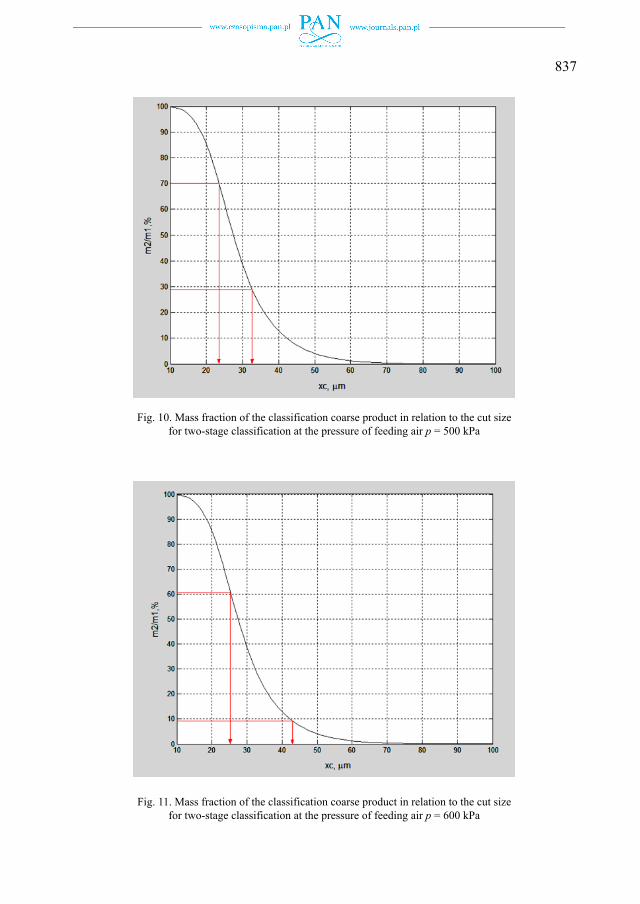
3. Further computations are carried out for two-stage classification using the determined values of the cut size xc1. As in point 1, the dependence of the mass fraction of the coarse product m2/m1 in relation to the size function of the cut size xc2 (for the same values of air pressure as in the point 2) is computed. The results of computations are presented in Figs. 6-11.
4. The cut size of centrifugal stage xc2 is computed from the diagrams presented in Figs. 6-11 for the experimentally determined values m2/m1. The values of quotient m2/m1 were obtained as a result of experiments carried out at a rotational speed within the range 7.5-25 1/s and at the pressure values of feeding air within the range 100-600 kPa (Table 1).
Fig. 5. Mass fraction of the classification coarse product in relation to the cut size for the gravitational stage
835
Fig. 6. Mass fraction of the classification coarse product in relation to the cut size for two-stage classification at the pressure of feeding air p = 100 kPa
Fig. 7. Mass fraction of the classification coarse product in relation to the cut size for two-stage classification at the pressure of feeding air p = 200 kPa
836
Fig. 8. Mass fraction of the classification coarse product in relation to the cut size for two-stage classification at the pressure of feeding air p = 300 kPa
Fig. 9. Mass fraction of the classification coarse product in relation to the cut size for two-stage classification at the pressure of feeding air p = 400 kPa
837
Fig. 11. Mass fraction of the classification coarse product in relation to the cut size for two-stage classification at the pressure of feeding air p = 600 kPa
Fig. 10. Mass fraction of the classification coarse product in relation to the cut size for two-stage classification at the pressure of feeding air p = 500 kPa
838
The above presented methodology of cut size determination is based on the precise meas-urement of the total mass of fed material and coarse product in individual experimental tests. The results of particle analyses of classification products are not used in the computations, only knowledge of the particle size distribution of the feed is required. Due to this, the mass balance of fed material and classification products for individual size classes can be avoided. Any inac-curacy in the determination of the particle size distribution of feed has an insignificant influence on the cut size determination. The results of experimental research carried out in the centrifugal classifier with fluidization bed presented in chapter 3, are applied to computations. The deter-mined values of the cut sizes for two classification stages and for different rotational speeds of the classifier rotor and different pressure values of feeding air are presented in Table 1. A cut size equal to 200 μm for the gravitational stage corresponds to the maximal size of the feed particles.
TABLE 1
The values of cut sizes for different rotational speeds of the classifier rotor n and for different pressure values of feeding air p
p, kPa 100 200 300 400 500 600
n = 0 1/s m2/m1 0.19 0.10 0.03 0.00 0.00 0.00xc, μm 28 33 40 70 200 200
n = 7.5 1/s m2/m1 0.72 0.56 0.32 0.02 0.00 0.00xc, μm 25.5 28 34 56 70 200
n = 15 1/s m2/m1 0.80 0.72 0.60 0.50 0.29 0.095xc, μm 23 25 27 28 33 43
n = 25 1/s m2/m1 0.97 0.92 0.86 0.76 0.70 0.61xc, μm 16 18 21 23 24 26
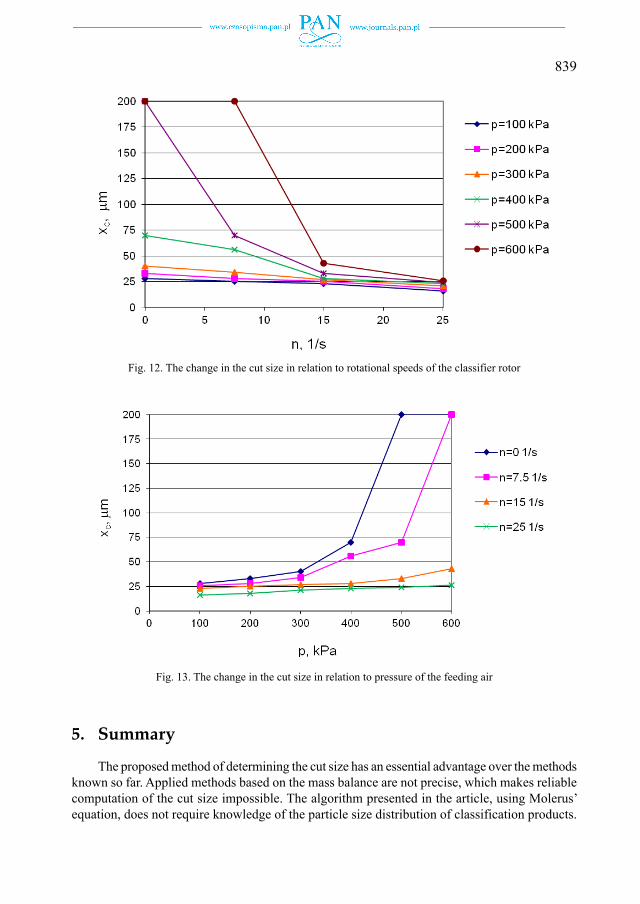
The diagrams presented in Figs. 12 and 13 are plotted on the basis of computations of cut sizes. The changes in cut sizes in relation to rotational speeds of the classifier rotor are presented in Fig. 12, while in Fig. 13 – in relation to the pressure of the feeding air. A strong dependence between changes in the basic parameters of classification process and cut size results from the course of these functions. Greater influence of feeding factor on the cut size is present for the values above 300 kPa. This results from a noticeable increase in fluidization intensity in this range of pressures. Due to this, one can state that having a high-power fluidization layer is an important factor in the particle distribution in the tested classifier. At the same time it should be underlined that for the highest pressures the quantity of fine product is its lowest level because the classifier stops particles with sizes higher than cut sizes with lower efficiency. The higher values of rotational speeds of the classifier rotor should be applied to obtain a fine product of good quality at maximal pressure and at the highest energy-consuming process.
In the developed numerical algorithm the cut size is computed for I and II classification stage, which enables prediction of the particle size distribution of both classification products to be forecast on the basis of equations (13) and (15) after experimental identification of the parameters present in equations (16) and (17).
839
Fig. 13. The change in the cut size in relation to pressure of the feeding air
Fig. 12. The change in the cut size in relation to rotational speeds of the classifier rotor
5. Summary
The proposed method of determining the cut size has an essential advantage over the methods known so far. Applied methods based on the mass balance are not precise, which makes reliable computation of the cut size impossible. The algorithm presented in the article, using Molerus’ equation, does not require knowledge of the particle size distribution of classification products.
840
This has an essential influence on the precise determination of the cut size. During computations only a knowledge of the particle size distribution of the fed material and mass of the feed and classification coarse product is required. The mass can be determined with high accuracy. On the basis of additional simulation computations it was stated that possible mistakes made during the determination of the particle size distribution of the feed have negligible influence on the computation of the cut size. In turn, reliable determination of the cut size has a direct influence on the prognosis result of the particle size distribution of the classification fine product. The presented model can be used to model the process of coal cleaning, where a classification is one of the most important stages (Benović et al., 2012). It should be noted that the waste, generated in the process of coal wet cleaning, can be used for combustion in the coal-water slurry (Kijo-Kleczkowska, 2012; Mochalov et al., 2012). The application of other equations of Tromp’s curve (Napier-Munn, 1991; Wang et al., 1999; Benzer, 2005, Kis et al., 2006; Mohanta & Mishra, 2009; Lanzerstorfer, 2011) and the consideration of particles dynamics (Brożek & Surowiak, 2010).can be considered in future research.
References
Allen T., 1997. Particle size measurement. Chapman and Hall, London.Austin L.G., Klimpel R.R., 1981. An improved method for analyzing classifier data. Powder Technology 29, 277-281.Bauder A., Müller F., Polke R., 2004. Investigations concerning the separation mechanism in deflector wheel classifiers.
International Journal of Mineral Processing 74S, S147-S154.Benović T., Miljanović I., Vujić S., 2012. Fuzzy model of autogenous suspension coal cleaning. Arch. Min. Sci., Vol. 57,
No. 4, p. 843-860.Benzer H., 2005. Modeling and simulation of a fully air swept ball mill in a raw material grinding circuit. Powder
Technology 150, 145-154.Bozhenko B., Junga R., Pospolita J., 2011. Mathematical model of the milling process on the ring-roller’s table. Part 1.
Mathematic model and it’s numeric solution. Arch. Min. Sci., Vol. 56, No. 3, p. 441-450.Brożek M., Surowiak A., 2010. Argument of separation at upgrading in the jig. Arch. Min. Sci., Vol. 55, No. 1, p. 21-40.Dijkink B.H., Speranza L., Paltsidis D., Vereijken J.M., 2007. Air dispersion of starch–protein mixtures: A predictive
tool for air classification performance. Powder Technology 172, 113-119.Eswaraiah C., Angadi S.I., Mishra B.K., 2012. Mechanism of particle separation and analysis of fish-hook phenomenon
in a circulating air classifier. Powder Technology 218, 57-63.Feng Y., Liu J., Liu S., 2008. Effects of operating parameters on flow field in a turbo air classifier. Minerals Engineer-
ing 21, 598-604.Heinrich S., Peglow M., Ihlow M., Mörl L., 2003. Particle population modeling in fluidized bed-spray granulation –
analysis of the steady state and unsteady behavior. Powder Technology, 130, 154-161.Huang Q., Liu J., Yu Y., 2012. Turbo air classifier guide vane improvement and inner flow field numerical simulation.
Powder Technology 226, 10-15.Johansson R., Evertsson M., 2012. An empirical study of a gravitational air classifier. Minerals Engineering 31, 10-16.Johansson R., Evertsson M., 2012a. CFD simulation of a gravitational air classifier. Minerals Engineering 33, 20-26.Kaniowski P., 2012. Research and modeling of particles classification process in a flow centrifugal classifier (in Polish).
PhD Thesis, Czestochowa University of Technology.Kijo-Kleczkowska A. 2012. Research on coal-water fuel combustion in a circulating fluidized bed. Arch. Min. Sci.,
Vol. 57, No. 1, p. 79-92.King R.P., 2001. Modeling and simulation of mineral processing systems. Butterworth-Heinemann, Oxford.
841
Kis P.B., Mihálykó C., Lakatos B.G., 2006. Discrete model for analysis and design of grinding mill-classifier systems. Chemical Engineering and Processing 45, 340-349.
Lanzerstorfer C., 2011. Model based prediction of required cut size diameter for fractionation of fly ash from a grate-fired wood chip incineration plant. Fuel Processing Technology 92, 1095-1100.
Leschonski K., 1984. Particle characterisation 1. Verlag Chemie, Weinheim, 89-95.Mizonov V.E., Ushakov S.G., 1989. Aerodynamic classification of powders (in Russian). Khimiya, Moskva.Mizonov V., Zhukov V., Korovkin A., Berthiaux H. 2005. On possible instability of throughputs in complex milling
circuits. Chemical Engineering and Processing, 44, 267-272.Mochalov S.P., Rybenko I.A., Mochalov P.S., Kalashnikov S.N., 2012. Dynamic combustion of suspended coal-water
fuel from enrichment wastes in a turbulent furnace. Steel in Translation 42, 611-613.Mohanta S., Mishra B.K., 2009. On the adequacy of distribution curves used in coal cleaning – A statistical analysis.
Fuel 88, 2262-2268.Molerus O., 1966. Über die Axialvermischung bei Transportprozessen in kontinuierlich betriebenen Apparaturen. Chemie
Ingenieur Technik 38, 137-145.Molerus O., 1967. Stochastisches Modell der Gleichgewichtssichtung. Chemie Ingenieur Technik 39, 792-796.Morimoto H., Shakouchi T., 2003. Classification of ultra fine powder by a new pneumatic type classifier. Powder
Technology 131, 71-79.Napier-Munn T.J., 1991. Modelling and simulating dense medium separation processes – A Progress Report. Minerals
Engineering, 4, 329-346.Otwinowski H., Kaniowski P., Urbaniak D., 2011: Experimental identification of a matrix model of classification process.
Thermodynamics in Science and Technology, Scientific Papers of Poznań University of Technology, Poznań, part 1, 165-172 (1st International Congress on Thermodynamics ICT 2011).
Palaniandy S., Azizli K.A.M., 2009. Mechanochemical effects on talc during fine grinding process in a jet mill. Inter-national Journal of Mineral Processing 92, 22-33.
Plitt L.R., 1971. The analysis of solid–solid separations in classifier. Canadian Institute of Mining Metallurgy and Petroleum CIM Bulletin 64 (708), 42-47.
Pyka I., Wierzchowski K., 2012. Characterisation method for population of mineral particles for flow processes and the assessment of its application potential. International Journal of Mineral Processing 110-111, 126-134.
Rumpf H., 1990. Particle technology. Chapman and Hall, London.Schmidt J., Werther J., 2006. Simulation and optimization of a centrifugal fluidized bed classifier in the micrometer
range. Chemical Engineering and Processing 45, 488-499.Shapiro M., Galperin V., 2005. Air classification of solid particles: a review. Chemical Engineering and Processing 44,
279-285.Tromp K.F., 1937. New method of computing the washability of coals. Glückauf 37, 125-131, 151-156. Excerpts in Tromp
K.F. 1937. New methods of computing the washability of coals. Colliery Guardian 154, 955-959, 1009.Venkoba Rao B., 2005. Analytical expressions for classifier product size distributions. Minerals Engineering 18, 557-560.Venkoba Rao B., Kapur P.C., Konnur R., 2003. Modeling the size–density partition surface of dense-medium separators.
International Journal of Mineral Processing 72, 443-453.Wang X., Ge X., Zhao X., Wang Z., 1999. Study on horizontal turbine classification. Powder Technology 102, 166-170.Wills B.A., Napier-Munn T.J., 2006. Will’s mineral processing technology. Butterworth-Heinemann, Musselburgh.Zhukov V.P., Otwinowski H., Smirnov S.F., Kaniowski P., 2009: Analytical and experimental investigations of processes
in the fluidized bed jet mill (in Russian). Vestnik ISPEU 4, 74-77.
Received: 13 December 2012

![wykład-akustyka [tryb zgodności] - kurtz.zut.edu.plkurtz.zut.edu.pl/fileadmin/ARCH/wyklad-akustyka__tryb_zgodnosci_.pdf · „Fizyka Budowli” AKUSTYKA Akustyka techniczna ...](https://static.fdocuments.pl/doc/165x107/5c765fc609d3f2d3778bdd15/wyklad-akustyka-tryb-zgodnosci-kurtzzutedu-fizyka-budowli-akustyka.jpg)