[email protected] Paweł Pawliński (CERT Polska / NASK ... · Towards a Methodology for...
67
Towards a Methodology for Evaluating Threat Intelligence Feeds 28th Annual FIRST Conference Seoul, South Korea, 15th July 2016 Paweł Pawliński (CERT Polska / NASK) [email protected] Piotr Kijewski (CERT Polska / NASK) [email protected] Andrew (Drew) Kompanek (CERT/CC) [email protected]
Transcript of [email protected] Paweł Pawliński (CERT Polska / NASK ... · Towards a Methodology for...
Towards a Methodology for Evaluating Threat Intelligence Feeds
28th Annual FIRST ConferenceSeoul, South Korea, 15th July 2016
Paweł Pawliński (CERT Polska / NASK)[email protected]
Piotr Kijewski (CERT Polska / NASK)[email protected]
Andrew (Drew) Kompanek (CERT/CC) [email protected]

AgendaMotivation
Focus
Prior work
Methodology
Results
Discussion
2
AgendaMotivation
Focus
Prior work
Methodology
Results
Discussion
A little psychology, some economics and a little about intel providers as “middlemen”.
3
4
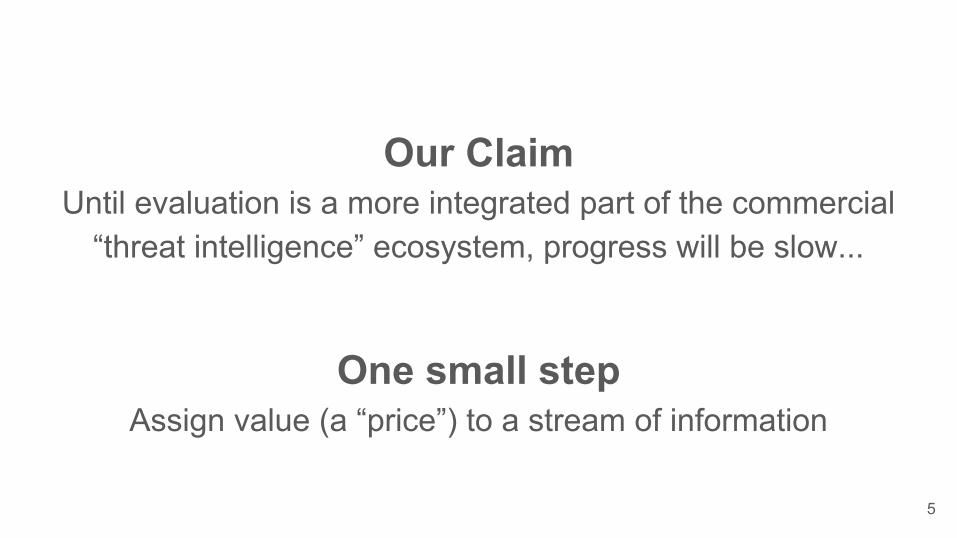
Our ClaimUntil evaluation is a more integrated part of the commercial
“threat intelligence” ecosystem, progress will be slow...
One small stepAssign value (a “price”) to a stream of information
5

6
So tell me a little bit about your process...
7
“We know our network, our users and our needs best. We’re going to do it
ourselves.”
Anonymous
8
Respect my authoritah!
Clean up your netblock…
or I’m going home.
9
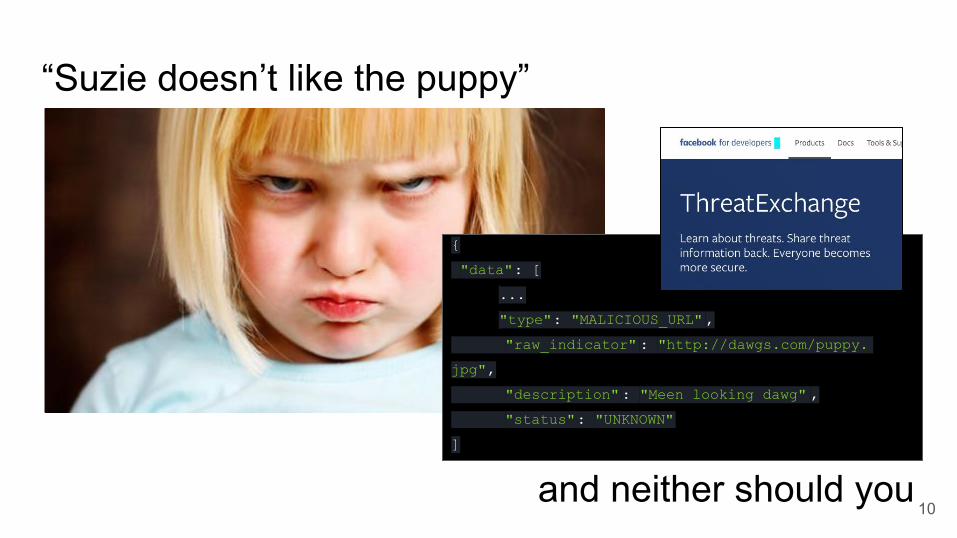
“Suzie doesn’t like the puppy”
and neither should you
{
"data": [
...
"type": "MALICIOUS_URL" ,
"raw_indicator" : "http://dawgs.com/puppy.
jpg",
"description": "Meen looking dawg" ,
"status": "UNKNOWN"
]
10
Is there an echo in here?
11
“[The Internet will be] the ultimate go-between, the universal middleman [such that] the only humans involved in a
transaction will be the actual buyer and seller,”
Bill Gates in The Road Ahead (1995)
12

So what use do I have forthis guy?
13
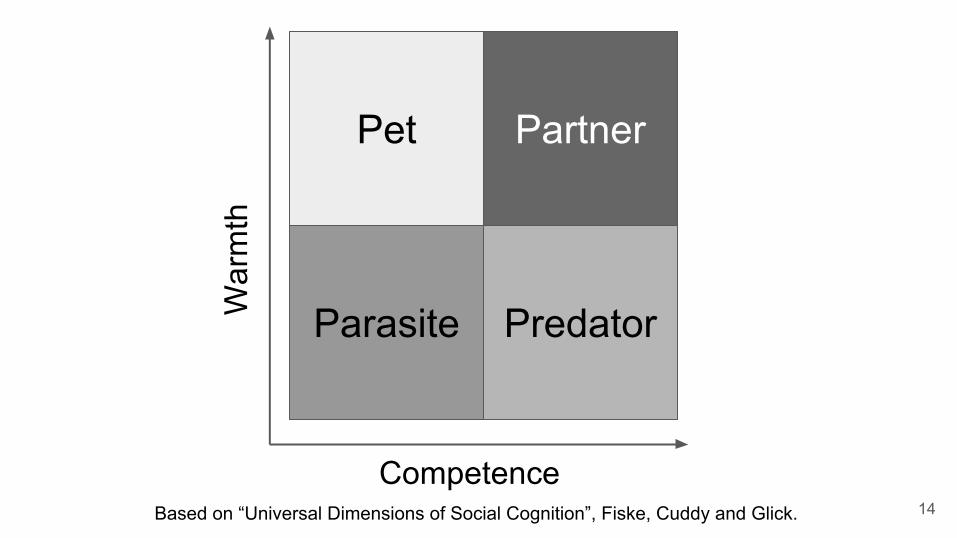
Pet Partner
Parasite PredatorWar
mth
CompetenceBased on “Universal Dimensions of Social Cognition”, Fiske, Cuddy and Glick. 14
15
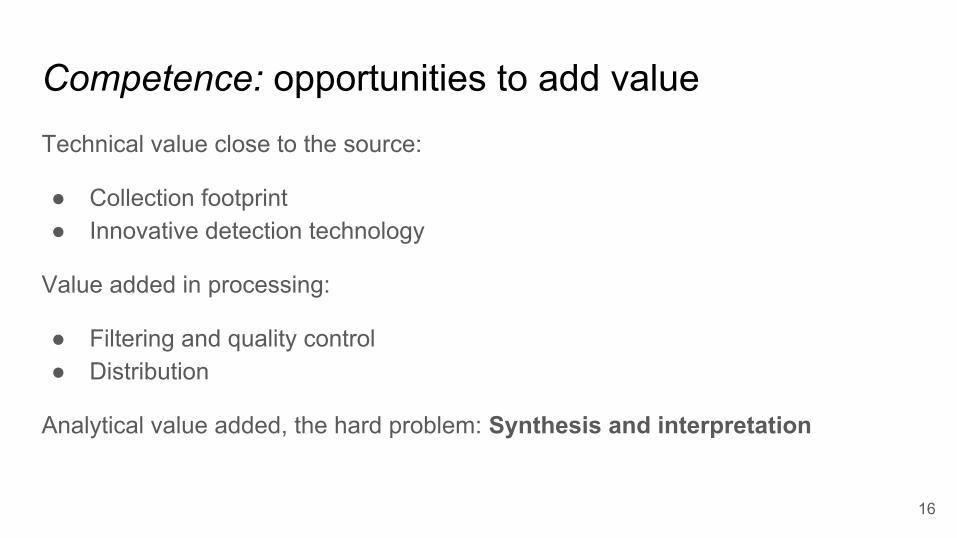
Competence: opportunities to add valueTechnical value close to the source:
● Collection footprint● Innovative detection technology
Value added in processing:
● Filtering and quality control● Distribution
Analytical value added, the hard problem: Synthesis and interpretation
16
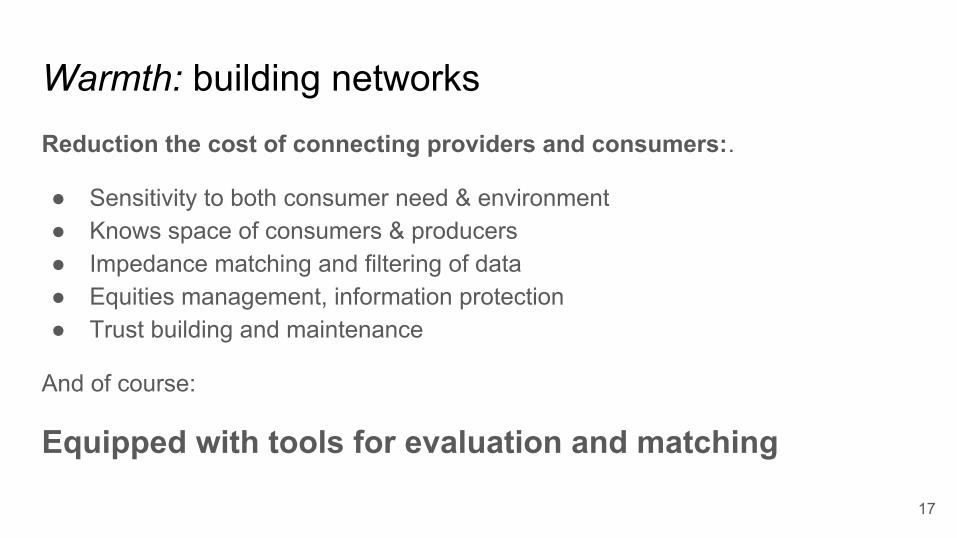
Warmth: building networksReduction the cost of connecting providers and consumers:.
● Sensitivity to both consumer need & environment● Knows space of consumers & producers● Impedance matching and filtering of data● Equities management, information protection● Trust building and maintenance
And of course:
Equipped with tools for evaluation and matching
17
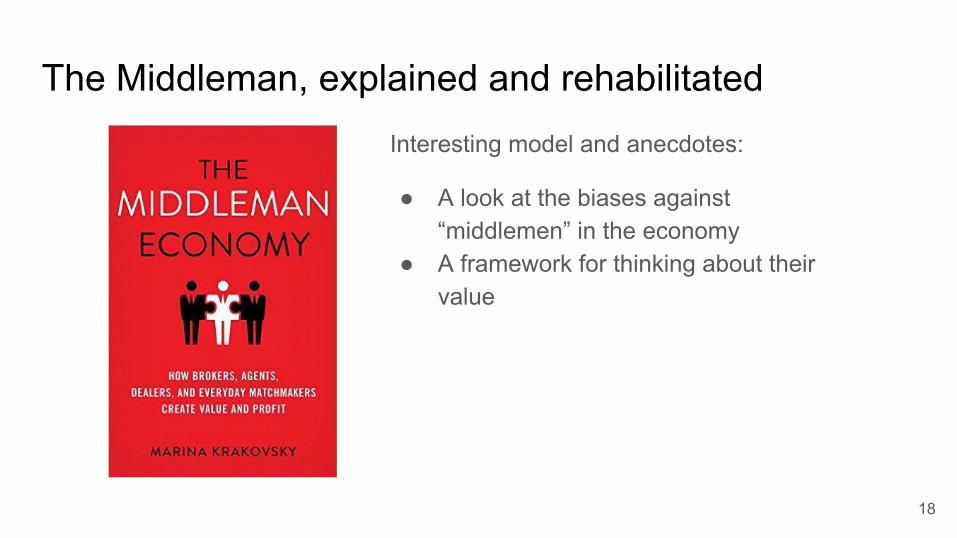
The Middleman, explained and rehabilitatedInteresting model and anecdotes:
● A look at the biases against “middlemen” in the economy
● A framework for thinking about their value
18

19
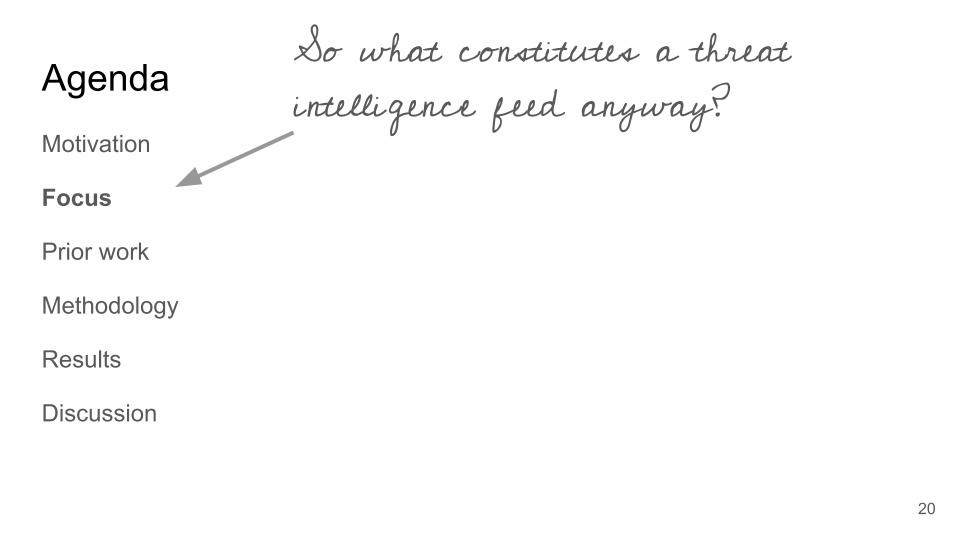
AgendaMotivation
Focus
Prior work
Methodology
Results
Discussion
So what constitutes a threat intelligence feed anyway?
20
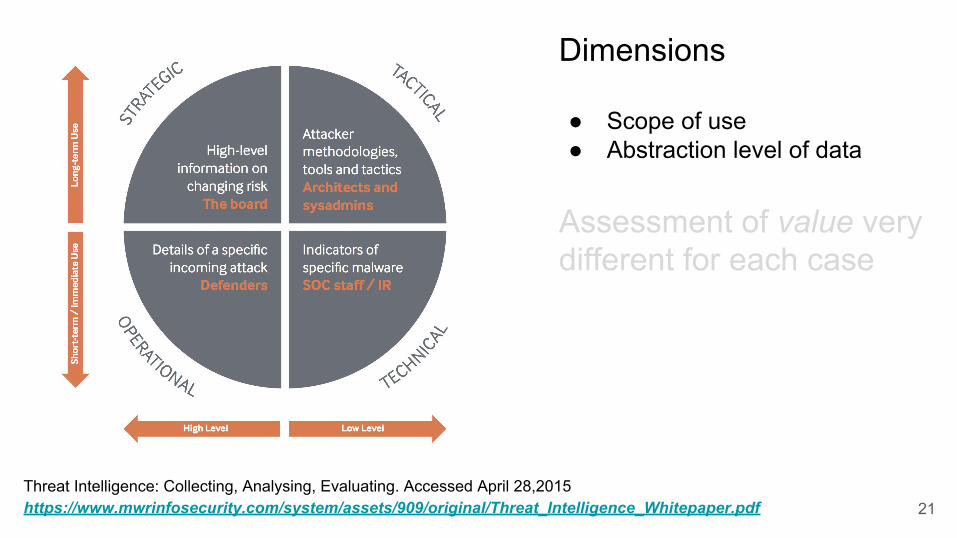
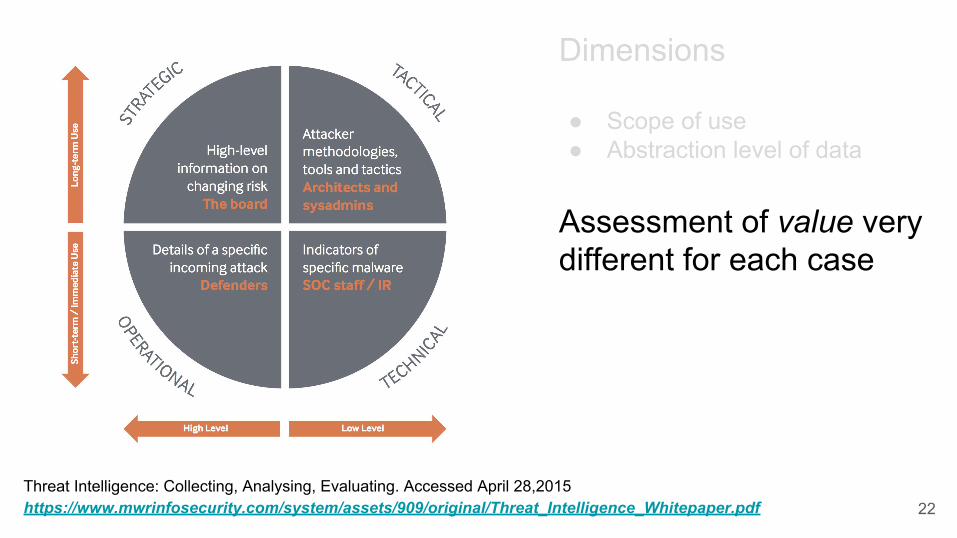
Dimensions
● Scope of use● Abstraction level of data
Assessment of value very different for each case
Threat Intelligence: Collecting, Analysing, Evaluating. Accessed April 28,2015https://www.mwrinfosecurity.com/system/assets/909/original/Threat_Intelligence_Whitepaper.pdf 21
Dimensions
● Scope of use● Abstraction level of data
Assessment of value very different for each case
Threat Intelligence: Collecting, Analysing, Evaluating. Accessed April 28,2015https://www.mwrinfosecurity.com/system/assets/909/original/Threat_Intelligence_Whitepaper.pdf 22
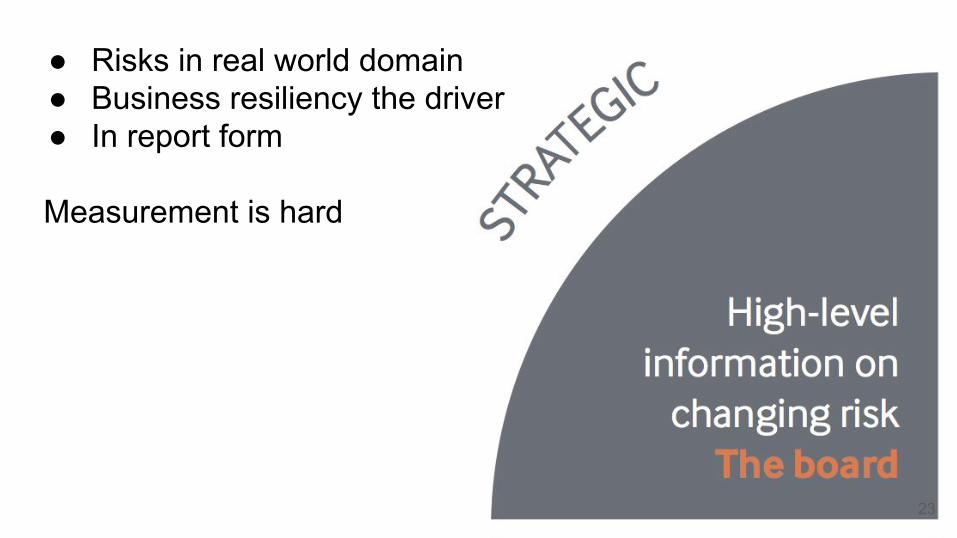
● Risks in real world domain● Business resiliency the driver● In report form
Measurement is hard
23
24
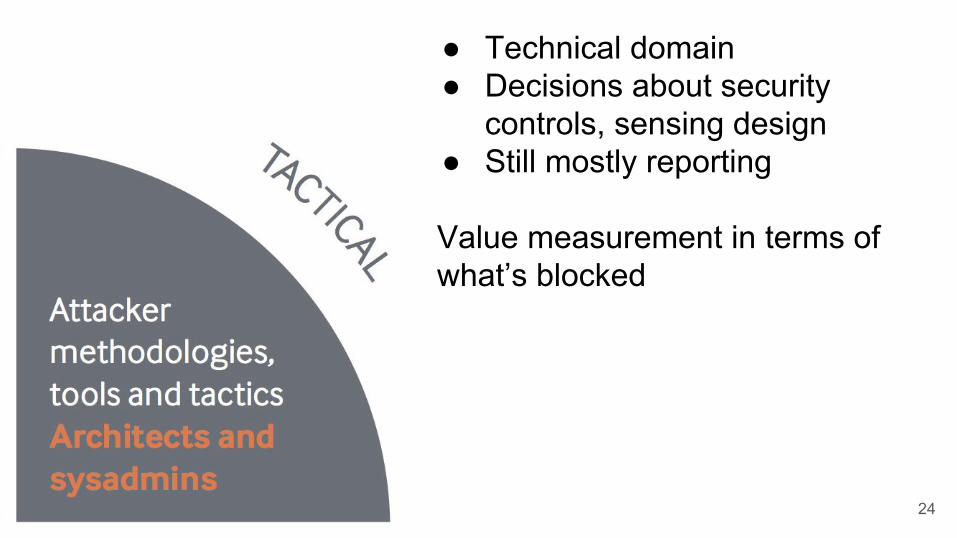
● Technical domain● Decisions about security
controls, sensing design● Still mostly reporting
Value measurement in terms of what’s blocked
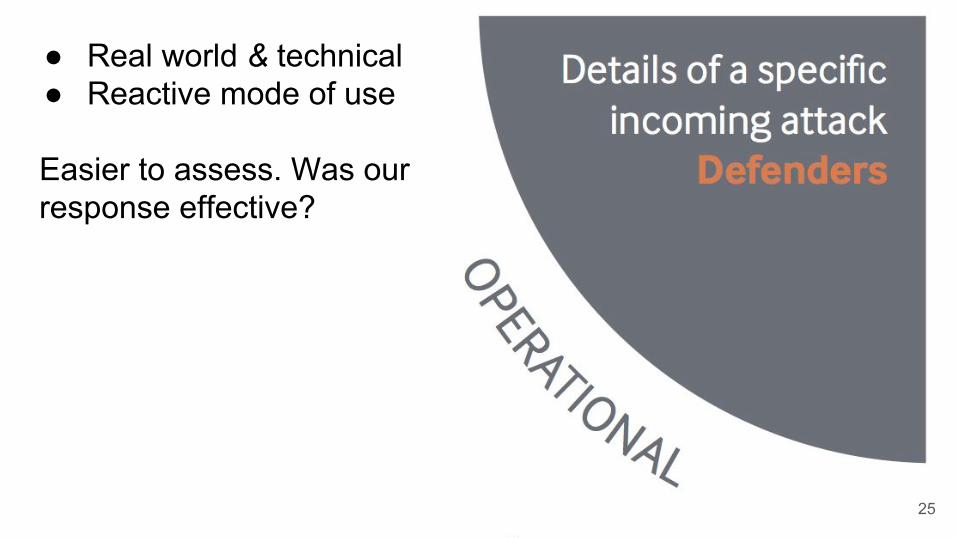
● Real world & technical ● Reactive mode of use
Easier to assess. Was our response effective?
25
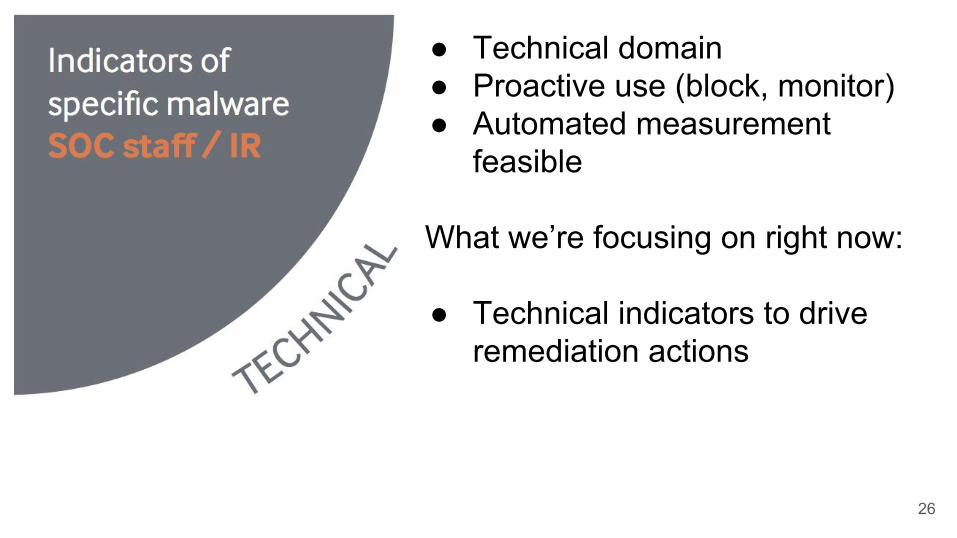
● Technical domain● Proactive use (block, monitor)● Automated measurement
feasible
What we’re focusing on right now:
● Technical indicators to drive remediation actions
26

Measurement rubric
Do I care?
Is it true?
Enough context?
Still valid?
Effort to process it?
Relevance
Completeness
Accuracy
Ingest-ability
Timeliness
Measures of quality:
How much data?
Where are the sensors?
How was it detected?Detection
Volume
Vantage
Measures of scope:
27

AgendaMotivation
Focus
Prior work
Methodology
Results
Discussion
What we learned from a couple other efforts
28
Prior work Related evaluations of sources of technical indicators
1. Everything You Wanted to Know About Blacklists But Were Afraid to Ask
2. Measuring the IQ of your Threat Intelligence
3. Paint it Black: Evaluating the Effectiveness of Malware Blacklists
29
“Everything you Wanted to Know…”
Everything You Wanted to Know About Blacklists But Were Afraid to AskLeigh Metcalf, Jonathan M. Spring, CERT / SEI, September 2013
Updates in 2014 and 2016, more coming.
30
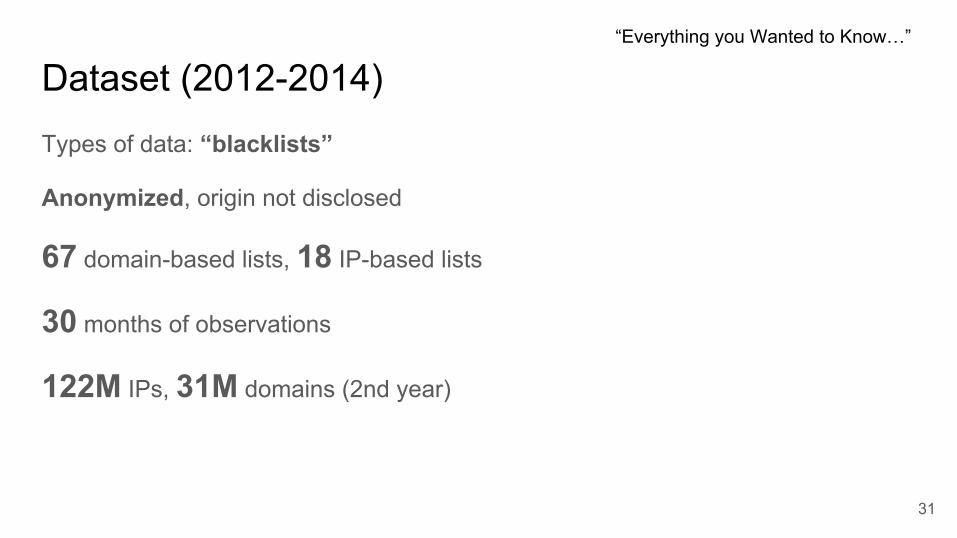
Dataset (2012-2014)Types of data: “blacklists”
Anonymized, origin not disclosed
67 domain-based lists, 18 IP-based lists
30 months of observations
122M IPs, 31M domains (2nd year)
“Everything you Wanted to Know…”
31
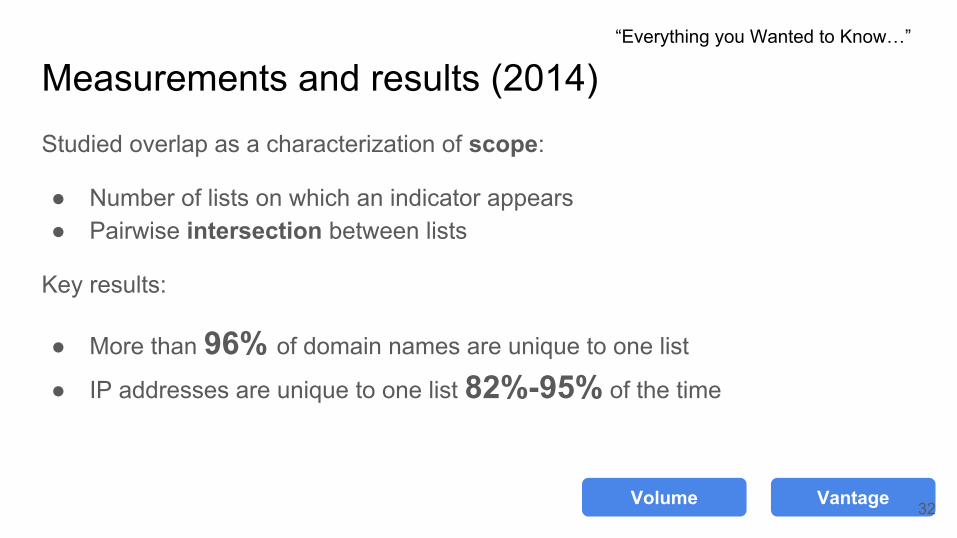
Measurements and results (2014)Studied overlap as a characterization of scope:
● Number of lists on which an indicator appears● Pairwise intersection between lists
Key results:
● More than 96% of domain names are unique to one list
● IP addresses are unique to one list 82%-95% of the time
Volume Vantage
“Everything you Wanted to Know…”
32
InsightsLess overlap than expected:
● Blacklists paint fragmented picture of malicious infrastructure● Providers have very different scope of collection
33
“Measuring the IQ…”Measuring the IQ of your Threat IntelligenceAlexandre Pinto, Kyle Maxwell, DEFCON 22, August 2014
Data-Driven Threat IntelligenceAlexandre Pinto, Alexandre Sieira, FIRST Conference 2015, June 2015
Verizon DBIR 2015, Indicators of Compromise chapter, May 2015
https://github.com/mlsecproject/tiq-test
34
DatasetSimilar types of data
54 unnamed blacklists
Inbound & outbound indicators
6 months of observations
“Measuring the IQ…”
35
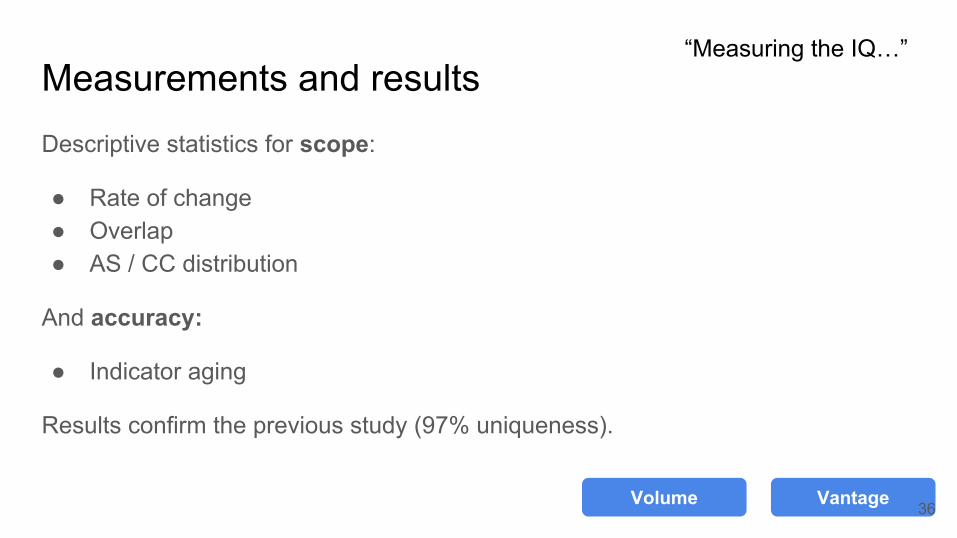
Measurements and resultsDescriptive statistics for scope:
● Rate of change● Overlap● AS / CC distribution
And accuracy:
● Indicator aging
Results confirm the previous study (97% uniqueness).
“Measuring the IQ…”
Volume Vantage 36
InsightsDIY approach is feasible, some tools available.
“Measuring the IQ…”
37
“Paint it Black…”Paint it Black: Evaluating the Effectiveness of Malware BlacklistsMarc Kührer, Christian Rossow, Thorsten HolzRuhr-Universität Bochum, June 2014
38
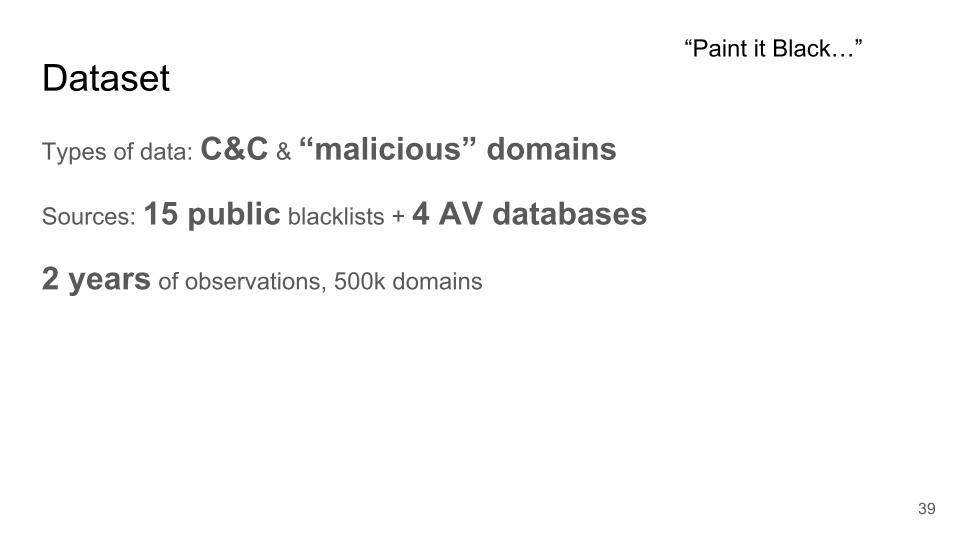
Dataset
Types of data: C&C & “malicious” domains
Sources: 15 public blacklists + 4 AV databases
2 years of observations, 500k domains
“Paint it Black…”
39
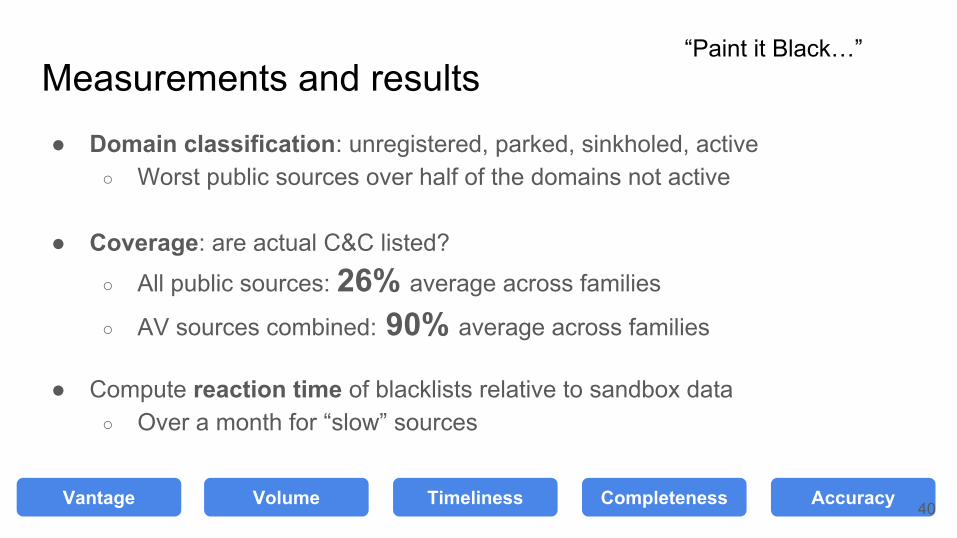
Measurements and results● Domain classification: unregistered, parked, sinkholed, active
○ Worst public sources over half of the domains not active
● Coverage: are actual C&C listed?
○ All public sources: 26% average across families
○ AV sources combined: 90% average across families
● Compute reaction time of blacklists relative to sandbox data○ Over a month for “slow” sources
Volume
“Paint it Black…”
Completeness AccuracyVolume TimelinessVantage 40
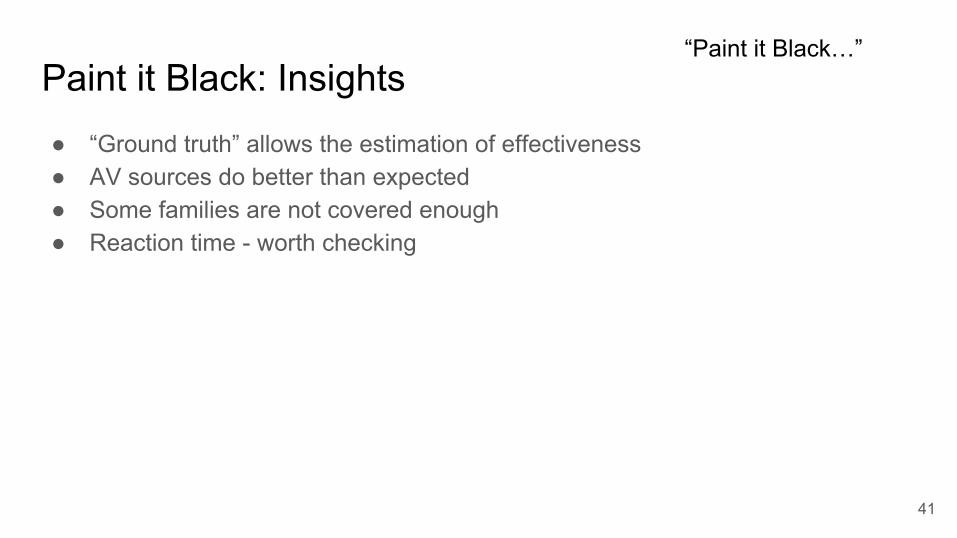
Paint it Black: Insights● “Ground truth” allows the estimation of effectiveness● AV sources do better than expected● Some families are not covered enough● Reaction time - worth checking
“Paint it Black…”
41

AgendaMotivation
Focus
Previous work
Methodology
Results
Discussion
How we approached on the analysis of our CERT.pl data
42
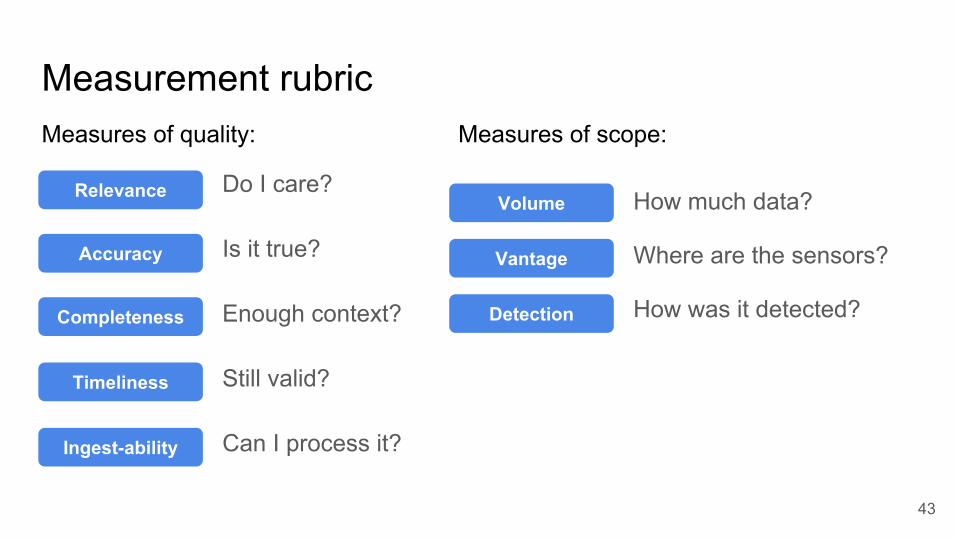
Measurement rubric
Do I care?
Is it true?
Enough context?
Still valid?
Can I process it?
Relevance
Completeness
Accuracy
Ingest-ability
Timeliness
Measures of quality:
How much data?
Where are the sensors?
How was it detected?Detection
Volume
Vantage
Measures of scope:
43
44
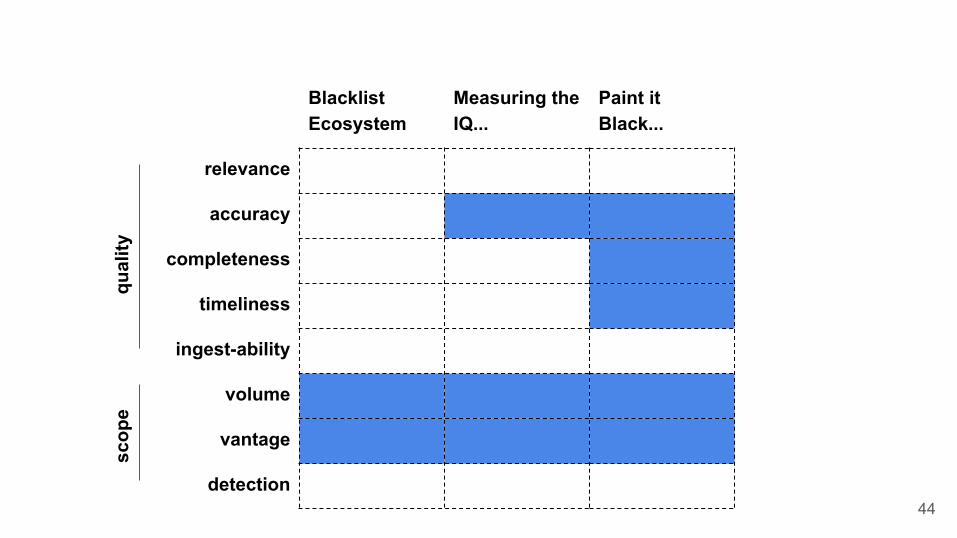
Blacklist Ecosystem
Measuring the IQ...
Paint it Black...
relevance
accuracy
completeness
timeliness
ingest-ability
volume
vantage
detection
qual
itysc
ope
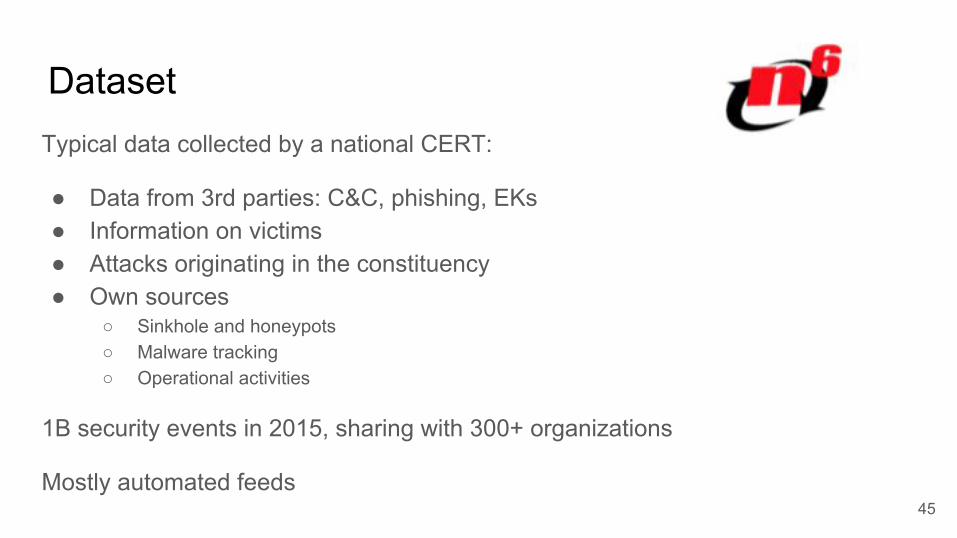
DatasetTypical data collected by a national CERT:
● Data from 3rd parties: C&C, phishing, EKs● Information on victims● Attacks originating in the constituency● Own sources
○ Sinkhole and honeypots○ Malware tracking○ Operational activities
1B security events in 2015, sharing with 300+ organizations
Mostly automated feeds45
www.necoma-project.eu
Deliverable 2.2: Threat Analysis Platform, Dataset rating
46
MethodologyMeasurements
● Rate● Delivery delay● False positive rate● Cross-dataset linkage● Representativeness● Utility
47
MethodologyMeasurements
● Rate● Delivery delay● False positive rate● Cross-dataset linkage● Representativeness● Utility
48
AgendaMotivation
Focus
Previous work
Methodology
Results
Discussion
What running our analysis on the data we’ve got told us...
49
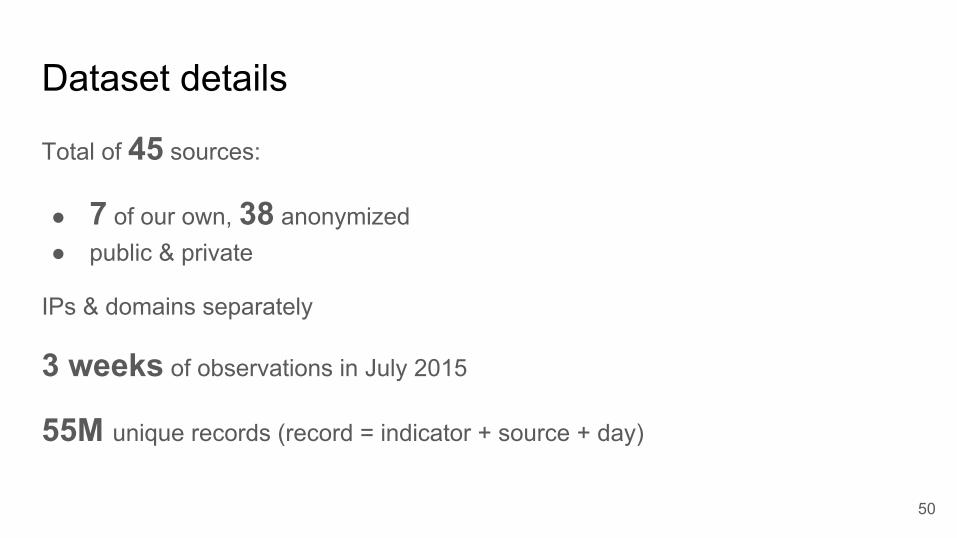
Dataset details
Total of 45 sources:
● 7 of our own, 38 anonymized● public & private
IPs & domains separately
3 weeks of observations in July 2015
55M unique records (record = indicator + source + day)
50
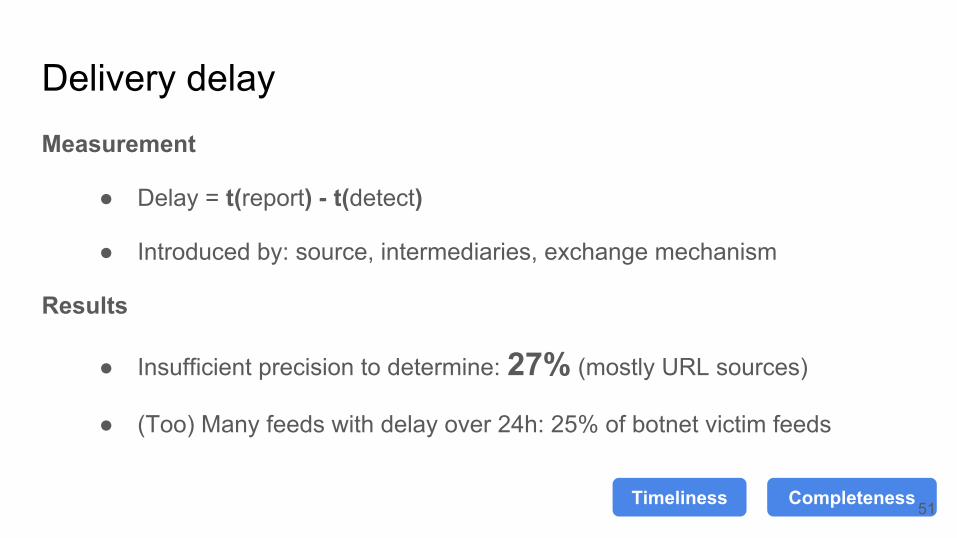
Delivery delayMeasurement
● Delay = t(report) - t(detect)
● Introduced by: source, intermediaries, exchange mechanism
Results
● Insufficient precision to determine: 27% (mostly URL sources)
● (Too) Many feeds with delay over 24h: 25% of botnet victim feeds
Timeliness Completeness 51
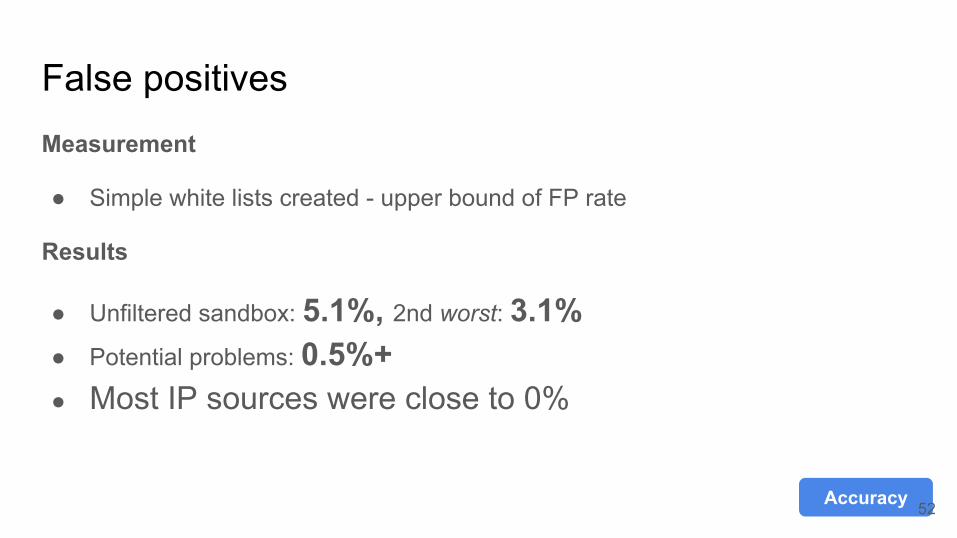
False positivesMeasurement
● Simple white lists created - upper bound of FP rate
Results
● Unfiltered sandbox: 5.1%, 2nd worst: 3.1%● Potential problems: 0.5%+● Most IP sources were close to 0%
Accuracy 52
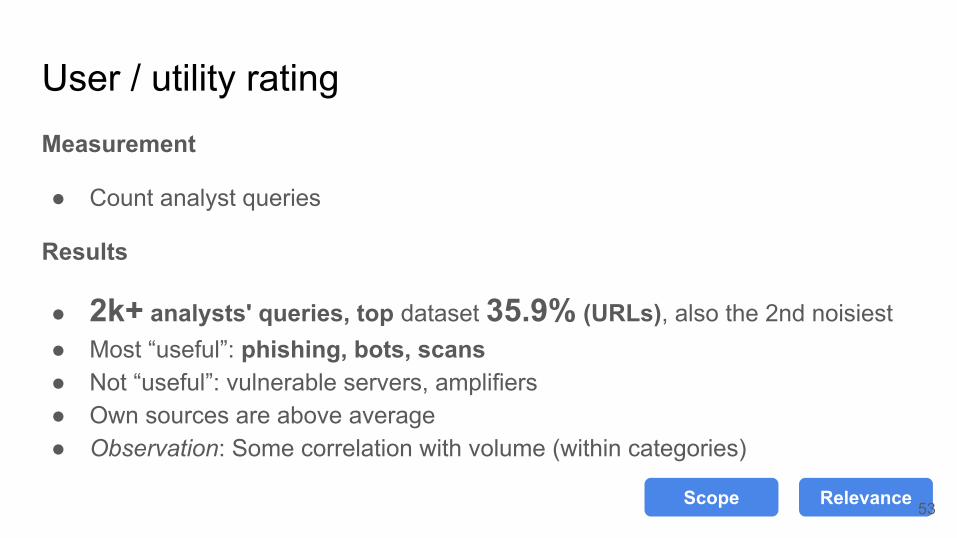
User / utility ratingMeasurement
● Count analyst queries
Results
● 2k+ analysts' queries, top dataset 35.9% (URLs), also the 2nd noisiest● Most “useful”: phishing, bots, scans ● Not “useful”: vulnerable servers, amplifiers● Own sources are above average● Observation: Some correlation with volume (within categories)
Scope Relevance 53
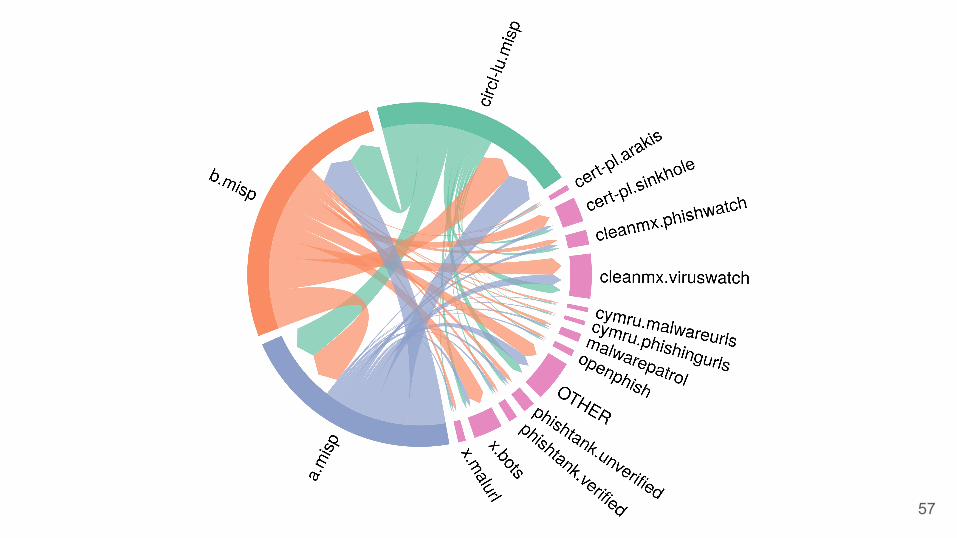
Case study: closed intelligence sharing groups
● 3 groups
● Manually verified indicators (in theory)
● Compared against all n6 sources
● 1 year of data: July 2015 - June 2016
54
Linkage / OverlapAnalyze relationships between sources
Check overlap for IPs - including data expanded via DNS
VantageDetectionVolume 55
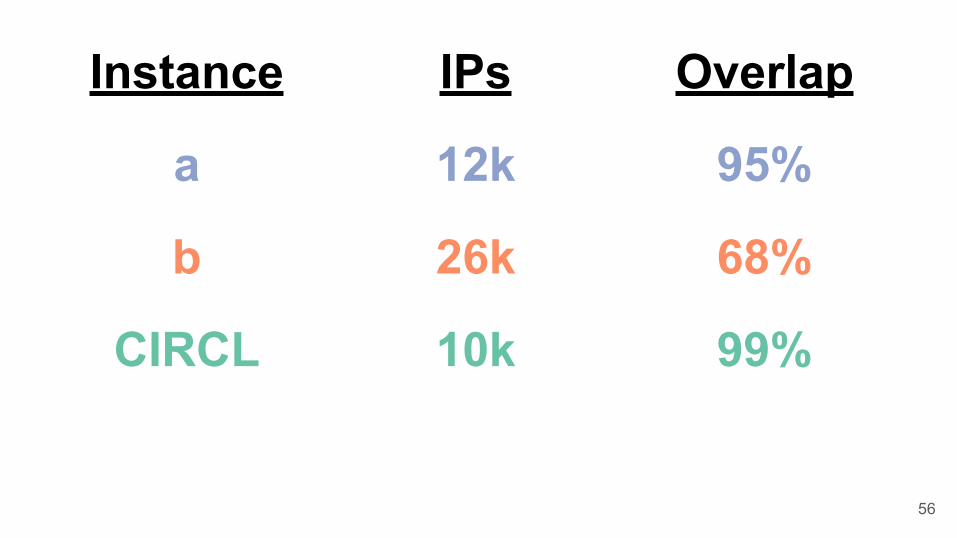
Instance IPs Overlap
a 12k 95%
b 26k 68%
CIRCL 10k 99%
56
57
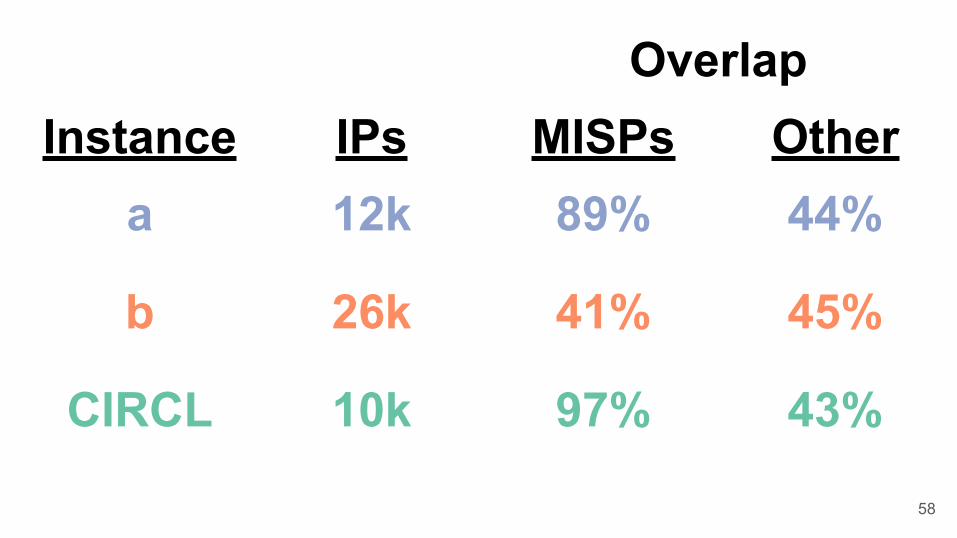
OverlapInstance IPs MISPs Other
a 12k 89% 44%
b 26k 41% 45%
CIRCL 10k 97% 43%
58
Insights● Overlap for threats relevant to the community is higher than for blacklists● Sharing between MISP instances - high (as suspected)● Many indicators confirmed by public / commercial sources
59
60
Code and data to reproduce results:
https://github.com/pp-/feed-evaluation
(only overlap for now)
61
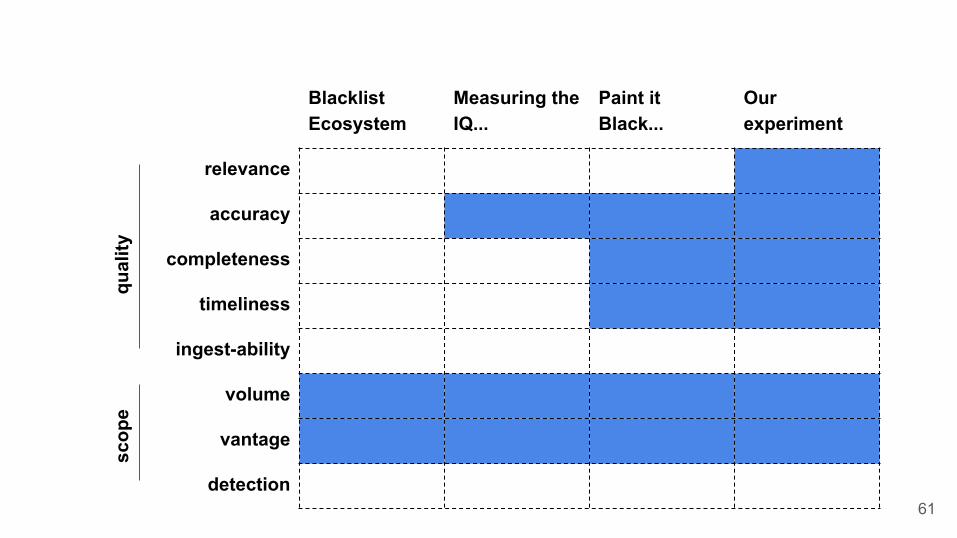
Blacklist Ecosystem
Measuring the IQ...
Paint it Black...
Our experiment
relevance
accuracy
completeness
timeliness
ingest-ability
volume
vantage
detection
qual
itysc
ope

AgendaMotivation
Focus
Previous work
Methodology
Results
Discussion
What’s all this mean, and what’s next?
62

AgendaMotivation
Focus
Previous work
Methodology
Results
Discussion
63
ConclusionsMuch work remains
● Best practice guidance for measurement (this is a start)● Integration of evaluation measurement into tools● Decision-making framework for acquisition decisions
Are there any motivated entrepreneurs out there?
64
Next Steps: Interest in community efforts?Best practice guide (methodology?) for measurement
Catalog of feeds and measurements
Plug-ins for sharing infrastructures
Ideas? Interest?
65

Acknowledgements (1)Part of this research has been supported by the Strategic International Collaborative RD Promotion Project of the Ministry of Internal Affairs and Communication, Japan, and by the European Union Seventh Framework Programme (FP72007--2013) under grant agreement No. 608533 (NECOMA) and co-financed by the Ministry of Science and Higher Education, Poland (grant 3011/7.PR/13/2014/2).
The opinions expressed in this presentation are those of the authors and do not necessarily reflect the views of the Ministry of Internal Affairs and Communications, Japan, of the European Commission, or of the Ministry of Science and Higher Education, Poland.
66
Acknowledgements (2)Part of this material is based upon work funded and supported by Department of Homeland Security under Contract No. FA8721-05-C-0003 with Carnegie Mellon University for the operation of the Software Engineering Institute, a federally funded research and development center sponsored by the United States Department of Defense.
References herein to any specific commercial product, process, or service by trade name, trademark, manufacturer, or otherwise, does not necessarily constitute or imply its endorsement, recommendation, or favoring by Carnegie Mellon University or its Software Engineering Institute.
67


![11th EDITION OF LeV LITERATURA EM VIAGEM ......[ 7 ] in infinity and that feeds on the ghosts of ghosts,’ as Mário Cláudio wrote for the catalogue of another exhibition of Ricardo](https://static.fdocuments.pl/doc/165x107/5e8525973199ab1ec632d254/11th-edition-of-lev-literatura-em-viagem-7-in-infinity-and-that-feeds.jpg)