Mk Project
42
AN EMPIRICAL STUDY ON Risk and return-A case study on Indian stock market Submitted in Partial Fulfillment For the Degree of Bachelor of Business Studies By Meghna Kwatra (Roll No. – 0197- 2010-13) To DEEN DAYAL UPADHYAYA COLLEGE University of Delhi Shivaji Marg, Karampura New Delhi-110015
-
Upload
rajat19915018 -
Category
Documents
-
view
219 -
download
0
Transcript of Mk Project
8/12/2019 Mk Project
http://slidepdf.com/reader/full/mk-project 1/42
AN EMPIRICAL STUDY ON
Risk and return-A case study on Indian stock market
Submitted in Partial Fulfillment
For the
Degree of
Bachelor of Business Studies
By
Meghna Kwatra
(Roll No. – 0197- 2010-13)
To
DEEN DAYAL UPADHYAYA COLLEGE University of Delhi
Shivaji Marg, Karampura New Delhi-110015

8/12/2019 Mk Project
http://slidepdf.com/reader/full/mk-project 2/42

8/12/2019 Mk Project
http://slidepdf.com/reader/full/mk-project 3/42
DECLARATION
I, Meghna Kwatra, student of Bachelor of Business Studies, Deen Dayal
Upadhyaya College, hereby declare that the project entitled “Risk and Return – a
Case study on Indian stock market” is submitted in partial fulfillment of degree of
BBS under Deen Dayal Upadhyaya College, Delhi University under the guidance
of Dr. Rakesh Kumar.
Also all the information used, collected and presented is true and based on actual
facts.
Meghna Kwatra

8/12/2019 Mk Project
http://slidepdf.com/reader/full/mk-project 4/42
CERTIFICATE
This is to certify that Meghna Kwatra, student of BBS, Deen Dayal Upadhyaya
College, University of Delhi has worked under my guidance for the topic titled
“Risk and Return – a Case study on Indian stock market”. To the best of my
knowledge, this piece of work is original and the student has submitted no part
of this project to any other Institute/University earlier.
Dr. Rakesh Kumar

8/12/2019 Mk Project
http://slidepdf.com/reader/full/mk-project 5/42
Abstract
This study attempts to measure the relationship between risk and return in the Indian stock
market by applying the Market Index Model. For the analysis monthly closing prices of
composite portfolio of BSE 100 companies, for a period of January 2001 to December 2011,
have been taken. These hundred companies are divided into ten portfolios on basis of their beta
value. The averages of these ten portfolios are used to arrive at results. The study reports high
positive correlation between portfolio return and portfolio risk. The results so obtained are fully
coinciding with the generalization of market index model, and thereby hold it applicable in the
Indian stock market, in establishing the trade-off between risk and return

8/12/2019 Mk Project
http://slidepdf.com/reader/full/mk-project 6/42
Table of Contents
Chapter Particulars Page no.
Acknowledgement 2
Declaration 3
abstact 8
1 Introduction 9
What are Non-Performing Assets? 9
Objectives of Study 11
Scope of study 11
Limitations of Study 12
2 Conceptual framework 13
Non-Performing Asset 14
Gross and Net NPA 14
Asset Classification 15
Causes of NPA 16
Management of NPA 17
Preventing NPA in banks 20
3 Literature Review and Research Methodology 22
Literature Review 23
Research Methodology 24
Hypothesis 25
4 Empirical Findings 27
5 Conclusion and Implication of study 51
Bibliography 53
Annexure 55

8/12/2019 Mk Project
http://slidepdf.com/reader/full/mk-project 7/42
Chapter-1
Introduction

8/12/2019 Mk Project
http://slidepdf.com/reader/full/mk-project 8/42
Change is constant, and often for the better.
Financial research, market advances and investor awareness have resulted in new and better
ways to invest one‟s hard earned money into profit yielding projects and stocks. Longstanding,
trusted practices are being scrutinized for their failure to produce the economic security that is
essential to our well being. Investors and experts alike are challenging conventional thinking.
Pioneering financial scientists are discovering safer and more effective techniques to promote
personal financial health.
Risk-return analysis is must for investment decisions. The investors in securities consider various
financial instruments according to their investment objectives and risk-bearing capacity. Risk in
financial assets has been classified into two categories, vis-à-vis, systematic risk and
unsystematic risk. While the unsystematic risk is the risk that can be managed by diversification,
the systematic risk is the one which cannot be managed by diversifying the portfolio. Risk and
return have been observed to have a positive correlation with each other. In this way, as the
systematic risk of an investor goes up, the risk-premium component of the return also happens to
move upwards.
Not all the stock exchanges in the world offer similar returns. Different stock exchanges have
been offering different returns. Even in the same stock market, there are securities that have been
outperforming the markets while some others have been underperforming and still some are
performing at par with the index. This research undertakes the study of the risk-return patterns of
the Indian stock markets. The study presents various insights into the return provided by the
stock markets under study and also summarizes the risk behavior of the said stock exchanges.

8/12/2019 Mk Project
http://slidepdf.com/reader/full/mk-project 9/42
The main objectives of the study is to understand the return and risk behavior of Indian
stock markets
Scope of the study
Concept of risk and return
Types of risks
Establishing relationship between risk and return
Portfolio management
Limitations of the study: Since the Indian stock market is so wide so it was not possible for to
cover all individual stocks in the study. There are some data which are available for just 3 years
while the same data for its counterparts were available for 9 years. So the exact comparison was
not possible.

8/12/2019 Mk Project
http://slidepdf.com/reader/full/mk-project 10/42
Chapter 2
Conceptual framework
8/12/2019 Mk Project
http://slidepdf.com/reader/full/mk-project 11/42
2.1 Return: The gain or loss of a security in a particular period. The return consists of the
income and the capital gains relative on an investment. It is usually quoted as a percentage.
2.2 Risk : The chance that an investment's actual return will be different than expected. Risk
includes the possibility of losing some or all of the original investment. Different versions of risk
are usually measured by calculating the standard deviation of the historical returns or average
returns of a specific investment. A high standard deviation indicates a high degree of risk.
A key component of the risk mangement process is risk assessment, which involves the
determination of the risks surrounding a business or investment.
2.3 Types of risks:
Systematic risk : refers to the risk intrinsic to the complete market or the complete market
segment. Systematic risk is also sometimes referred as “market risk” or “un-diversifiable risk”.
Recession, wars, and interest rate represent the sources for systematic risk for they affect the
complete market and are unavoidable through diversification. While this risk type affects a wide
range of securities, unsystematic risk affects quite a particular group of securities or even an
individual security. Moreover, systematic risk can be reduced by just being hedged.
Non-systematic risk : also referred as “specific risk”, “residual risk” or “specific risk”, non-
systematic risk is the industry or company specific risk which is inherent in every investment.
Putting it simple, unlike systematic risk affecting the entire market, it applies only to certain
investments. Moreover, it is the element of price risk which can be eliminated largely through
adequate diversification within a specific asset class. It is, therefore, the individual business risk
related to underlying stock, if the company goes bankrupt, it can be stated as a non-systematic
risk event and usually has little to do with the general recede and flow of the entire market.

8/12/2019 Mk Project
http://slidepdf.com/reader/full/mk-project 12/42
2.4 Modern Portfolio Theory
The Modern Portfolio Theory (MPT) is based on assumptions of “free and perfect information
flow and the notion of dominance”. This means that if the market is able to absorb the
information, fully and efficiently, price reflects the risks involved given the same return, the
investor can choose the scrips with the lowest possible risk. This is possible by diversification
into a number of companies of say 10 to 15, which have diverse characteristics of risk. Thus,
when any two Scrips behave differently to given changes in the economy and industry and when
the co- efficient of correlation between them is less than 1, such scrips can be joined in a
portfolio so as to reduce the combined risk of the portfolio. The notion of dominance tells us that
no investor should invest in one company alone and if there are two or more companies with the
same risk, then he has to choose the one with higher return and if both have the same return he
has to choose the One with lower risk. The investor can reduce the risk by distributing his funds
in a diverse variety of companies with varying risks and returns which do not have much auto
correlation. Thus, the investor has not only to make proper investment decision of what to buy
and when to buy, but has a proper investment strategy through diversification and choice of a
proper „B‟ for the scrips selected so that the total risk of portfolio is the lowest possible.
2.5 Diversification
An investor can reduce portfolio risk simply by holding combinations of instruments that are not
perfectly positively correlated (correlation coefficient ). In other words,
investors can reduce their exposure to individual asset risk by holding a diversified portfolio of
assets. Diversification may allow for the same portfolio expected return with reduced risk. These
ideas have been started with Markowitz and then reinforced by other economists and
mathematicians such as Andrew Brennan who have expressed ideas in the limitation of variance
through portfolio theory.
8/12/2019 Mk Project
http://slidepdf.com/reader/full/mk-project 13/42
2.6 Relationship between risk and return
The relationship between risk and return is a fundamental financial relationship that affects
expected rates of return on every existing asset investment. The Risk-Return relationship is
characterized as being a "positive" or "direct" relationship meaning that if there are expectations
of higher levels of risk associated with a particular investment then greater returns are required
as compensation for that higher expected risk. Alternatively, if an investment has relatively
lower levels of expected risk then investors are satisfied with relatively lower returns.
This risk-return relationship holds for individual investors and business managers. Greater
degrees of risk must be compensated for with greater returns on investment. Since investmentreturns reflects the degree of risk involved with the investment, investors need to be able to
determine how much of a return is appropriate for a given level of risk. This process is referred
to as "pricing the risk". In order to price the risk, we must first be able to measure the risk (or
quantify the risk) and then we must be able to decide an appropriate price for the risk we are
being asked to bear.
2.7 Market index model
The market index model asserts that expected return on security I, i.e., E(R it), in time period t, is
a linear function of market return Xt and an independent factor unique to security I, i.e., e i.
Symbolically it can be written as:
E(R it)=αi+βiXi+eit
Beta(β) can be estimated by regressing the monthly security return to the return of index. It iscalculated as:
Βi=nΣ XR-Σ XΣ R
nΣX2-(ΣX)
2

8/12/2019 Mk Project
http://slidepdf.com/reader/full/mk-project 14/42
alpha (α) is a constant intercept, indicating minimum level of return that is expected from
security i, if market remains flat.
Total risk of a security is the sum of market risk and non market risk.
Symbolically, it can be written as:
σi2=βi
2σ
2xi+еit
2
where, σi2
is the variance of stock I representing total risk, βi2σ
2xi is total market risk, and еit is
total non-market risk.

8/12/2019 Mk Project
http://slidepdf.com/reader/full/mk-project 15/42
Chapter 3
Literature review
8/12/2019 Mk Project
http://slidepdf.com/reader/full/mk-project 16/42
Dhankar and Kumar (2006) applied Market Index model and reported high positive correlation
between portfolio return and risk, also signifying that portfolio non-market risk declines with
diversification.
Selvam & Jeyachitra (2009) measured the relationship between risk and returns by applying
CAPM. The study found that there was high positive correlation between systematic risk and
expected returns and CAPM is very much applicable to Indian Stock Market.
Fama and Macbeth(1973) study included the construction of 20 portfolios of securities to
estimate betas from a pass regression. Then they performed one second pass regression for each
month over the time period 1935 to 1968. By estimating CAPM (in cross-section) for each
month, they studied how the parameters change over time. The study found a significant positive
relationship between realized returns and market risk.
Hakim and Rashidian (2002) investigated the return patterns in Dow Jones Islamic market
index (DJIMI) and Wilshire 5000 Index (W5000). While DJIMI tracks the stocks of US
corporations whose business and activities are compatible with Islamic law, W5000 Index tracks
the price performance of the largest 5000 US companies. The study takes 702 observations for
each of the indices and applies the descriptive statistics. The results show the annualized mean
for DJIMI at -19% and the same for the Wilshire 5000 Index at -12%. The annualized standard
deviation is 22% in the case of DJIMI and 24% in the case of Wilshire 5000 Index. The study
concludes that the Islamic index is less risky than the Wilshire 5000 (based on standard
deviation-22% vs. 24%).
8/12/2019 Mk Project
http://slidepdf.com/reader/full/mk-project 17/42
Bansal and Dahlquist (2002) studied the global liquidity return of the world. They divide the
world into three panels for their study. The first panel is named developed markets which include
21 countries Australia, Austraia, Belgium, Canada, Denmark, Finland, France, Germany, Hong
Kong, Ireland, Italy, Japan, Netherlands, Norway, Singapore, Spain, Sweden, Switzerland, U.K
and US. The panel B named Emerging markets comprise of 25 countries Argentina, Brazil, Chili,
China, Columbia, Greece, Hungary, India, Indonesia, Jordan, Korea, Malaysia, Mexico,
Pakistan, Peru, Philippines, Poland, Portugal, South Africa, Sri Lanka, Taiwan, Thailand,
Turkey, Venezuela and Zimbabwe. The panel C named World which covers the world. These
studies reveal that the average returns across developed and emerging markets are about the
same, 1.32 and 1.34% per month, respectively. However, the average standard deviation ofemerging markets is about twice as high as for the developed markets. It also seems to be greater
dispersion in returns and return volatilities in emerging economies. The correlation with the
world market return is much higher for developed markets than for emerging markets.
Derrabi and Leseure (2005) investigated the return on Emerging Stock Markets from
Argentina, Brazil, Israil, Columbia, Philippines, Taiwan, South Africa, Thailand, Turkey, Korea,
Malysia, Mexico, Hungary, Indonesia, Morocco, Czech Republic, Italy, Germany, Hong Kong,
Australia, Netherlands, Singapore, Spain, UK, USA, Japan, France, Belgium, Canada and
Denmark from January 1997 to November 2001 and study the weekly returns during this period.
The study finds that the market of Hungary has the best weekly mean return of 0.693% with
Morocco 0.663% in the second place. The weekly mean return in the Japanese market is very
low with 0.11%. The Thai market has the worse weekly mean return with -0.549% followed by
the Korean market -0.345%. Standard deviation shows that there is too much dispersion in the
emerging markets. The standard deviation for US market is 1.733 followed by UK 1.786 which
is favorable in comparison to Brazil, 6.387% and Argentina 4.680 of Argentina and 6.387 of
Brazil. Harvey investigates the return pattern of the 20 emerging markets including US, UK,
Argentina, Germany and France. The study observes that annualized mean US dollar returns
range from 71.8% for Argentina to -11.4% for Indonesia. Both Argentina and Turkey have
annualized standard deviation over 75%. Taiwan whose average return is 40.9%, has a standard
deviation of 53.9%.

8/12/2019 Mk Project
http://slidepdf.com/reader/full/mk-project 18/42
Goppl et al. (1996) evaluated the DAFOX (German Stock Price Research Index) to study the
return behavior in German equity market. Taking the data of DAFOX from 1/1974-12/1994 as
the sampling period, the study applies descriptive statistics (Mean, Volatility, Skewness and
Kurtosis) on the whole sample and then on three sub periods (1974-1980, 1981-1987, 1988-
1994). The study unearths that Mean returns are lower in the first and higher in the second and
third sub-period than on average. The same results can be found for the volatilities: They are
above average in sub-periods two and three and lower in sub-period one. Overall, mean returns
show in the same direction as volatilities. A closer look at the numbers reveals that this return
volatility-relationship does not hold in sub-period one. The mean return of the small-cap index is
slightly greater and its volatility smaller than their counterparts. Over the whole period, thedistributions of the three index returns are not symmetric but skewed to the left. From the
kurtosis one can infer fat-tailed return distributions. These statistics differ from (sub-) period to
(sub-) period indicating instable distributions over time.

8/12/2019 Mk Project
http://slidepdf.com/reader/full/mk-project 19/42
Chapter-4
Research Methodology
8/12/2019 Mk Project
http://slidepdf.com/reader/full/mk-project 20/42
4.1 Research Problem
This research project studies the relationship between risk and return on theIndian stock market .
For this purpose India‟s S&P BSE 100 companies are selected. These companies are assumed to
represent the picture of India‟s stock markets. These all are dependent variables.
The Independent variable taken into consideration for the purpose of the project is SENSEX.
The sample data used in the study comprises of monthly net (equity) ranging from 2001-
2011.The concept of ANNOVA, regression, correlation are central to this study.
4.2 Empirical Research
As an exploratory study is conducted with an objective to gain insights and understanding of the
problem situation being confronted under the research study. The information gathered from this
preliminary study forms the foundation for the further detailed descriptive research.
4.3 Sampling Design
• Universe: All the stocks registered with the Indian stock market.
• Sampling Unit: Bombay Stock exchange 100 companies.
Sample Size: Monthly closing data of S&P BSE 100 Companies within the range of January
2001 to December 2011. Data collection Method: The exploratory research is conducted on the basis of secondary
data collected using the Capital line software. However, various literatures, books, journals,
magazines, web links are used.

8/12/2019 Mk Project
http://slidepdf.com/reader/full/mk-project 21/42
4.4 Hypothesis Formulation
1. Null hypothesis (Ho): There is no significant relationship between risk and return
Alternate Hypothesis (H1): There is positive relationship between risk and return
Alternate Hypothesis (H2): There is negative relationship between risk and return
2. Null hypothesis (Ho): There is no significant relationship between portfolio beta and portfolio
return
Alternate Hypothesis (H1): There is positive relationship between portfolio beta and portfolio
return
3. Null hypothesis (Ho): There is no significant relationship between market risk and portfolio
return
Alternate Hypothesis (H1): There is positive relationship between market risk and portfolio
return

8/12/2019 Mk Project
http://slidepdf.com/reader/full/mk-project 22/42
4.5 METHOD OF ANALYSIS
Descriptive analyses, linear regression, correlation, ANOVA model, R Square, Normality Test.
The formulae are as follows:
Stock Return is calculated by the following formula:
Stock return = Stock t-stock t-1 *100Stock t
Where
Stock t= Price of Stock in time period t i.e. closing price of the stock
Stock t-1= Price of Stock in time period t-1 i.e. Opening price of the stock
Sensex Return is calculated as:
Sensex Return= sensext -sensex t-1 * 100
sensext
Where
sensext= sensex in time period t
sensex t-1= sensex in time period t-1
8/12/2019 Mk Project
http://slidepdf.com/reader/full/mk-project 23/42
Regression Analysis: It is a statistical technique for estimating the relationships among
variables. It includes many techniques for modeling and analyzing several variables, when
the focus is on the relationship between a dependent variable and one or more independent
variables. In this study regression analysis is used to understand how the return of a particular
company (dependent variable) changes when Sensex(independent variable) varies, while the
other independent variables are held fixed.
Correlation: Correlations are used in advanced portfolio management. It is used todetermine how two how two securities move in relation to each other. Correlation is
computed into what is known as the correlation coefficient, which ranges between -1 and+1. Perfect positive correlation (a correlation co-efficient of +1) implies that as one security
moves, either up or down, the other security will move in the same direction. Alternatively,
perfect negative correlation means that if one security moves in either direction the security
that is perfectly negatively correlated will move in the opposite direction. If the correlation is0, the movements of the securities are said to have no correlation; they are completely
random.
ANOVA: The analysis of Variance or ANOVA is used to test the hypothesis concerningmeans when there are several populations, under the assumption that the sampled populations
are normally distributed. ANOVA in this project has been used to test the relationship
between Sensex and stock indices.
R Square: A statistical measure that represents the percentage of a security's movements thatcan be explained by movements in sensex. R-squared values range from 0 to 100. An R-squared of 100 means that all movements of a security are completely explained by
movements in the index. A high R-squared (between 85 and 100) indicates the fund's
performance patterns have been in line with the index. A fund with a low R-squared (70 orless) doesn't act much like the index. A higher R-squared value will indicate a more useful beta figure.
Average: Average summarizes or represents the general significance of a set of unequalvalues. It has been used to arrive at an average of variable over a period of years.

8/12/2019 Mk Project
http://slidepdf.com/reader/full/mk-project 24/42
Formulas used for descriptive statistics:
1.) MEAN: The arithmetic mean, or simply the mean or average is the central
tendency of a collection of numbers taken as the sum of the numbers divided by the size
of the collection.
2.) STANDARD DEVIATION: standard deviation (represented by the symbol sigma, σ)
shows how much variation or "dispersion" exists from the average (mean), or expected
value. A low standard deviation indicates that the data points tend to be very close to
the mean; high standard deviation indicates that the data points are spread out over a
large range of values.
3.) SKEWNESS : Skewness is a measure of the asymmetry of the probability distribution of
a real-valued random variable. The skewness value can be positive or negative, or even
undefined.
A zero value indicates that the values are relatively evenly distributed on both sides of the mean,
typically (but not necessarily) implying a symmetric distribution. The normal distribution has a
skewness of zero.

8/12/2019 Mk Project
http://slidepdf.com/reader/full/mk-project 25/42
Where yi =raw score or value
y= mean
n=standard deviation
4.) Kurtosis: In probability theory and statistics, kurtosis is any measure of the "peakedness" of
the probability distribution of a real-valued random variable.
Kurtosis=

8/12/2019 Mk Project
http://slidepdf.com/reader/full/mk-project 26/42
Chapter 5
Empirical Findings
8/12/2019 Mk Project
http://slidepdf.com/reader/full/mk-project 27/42
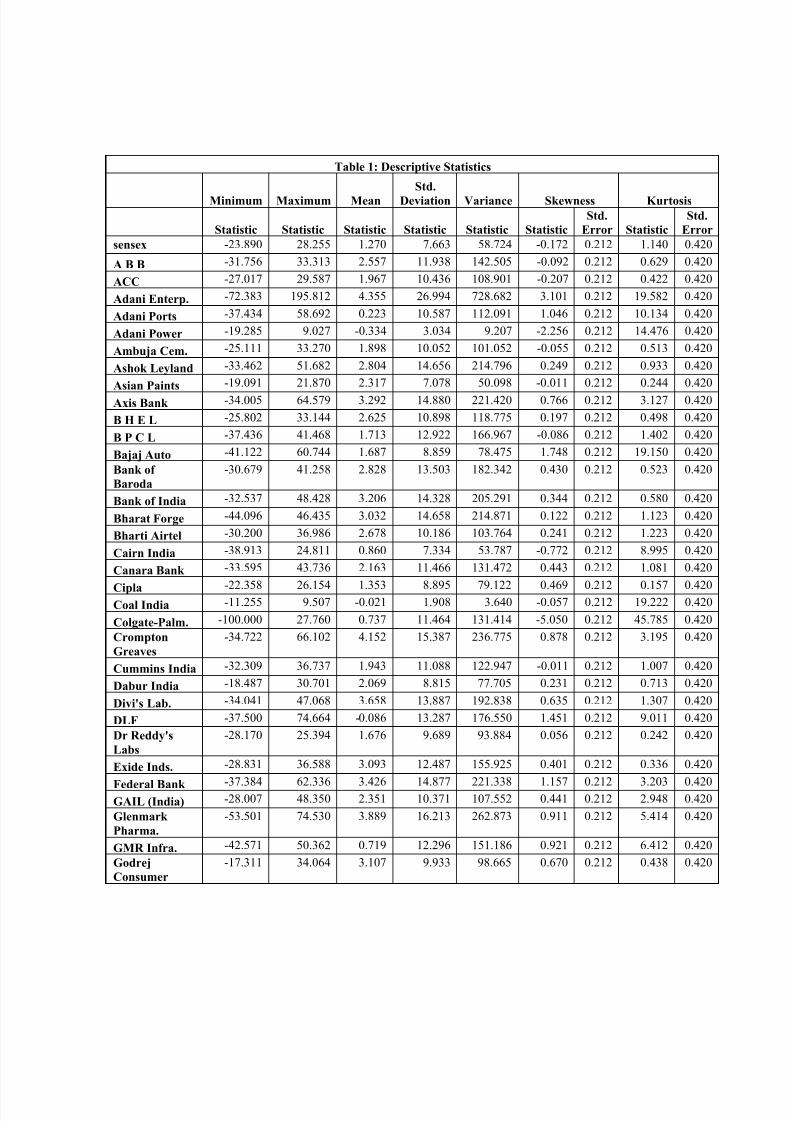
Table 1: Descriptive Statistics
Minimum Maximum MeanStd.
Deviation Variance Skewness Kurtosis
Statistic Statistic Statistic Statistic Statistic Statistic
Std.
Error Statistic
Std.
Error
sensex -23.890 28.255 1.270 7.663 58.724 -0.172 0.212 1.140 0.420
A B B -31.756 33.313 2.557 11.938 142.505 -0.092 0.212 0.629 0.420
ACC -27.017 29.587 1.967 10.436 108.901 -0.207 0.212 0.422 0.420
Adani Enterp. -72.383 195.812 4.355 26.994 728.682 3.101 0.212 19.582 0.420
Adani Ports -37.434 58.692 0.223 10.587 112.091 1.046 0.212 10.134 0.420
Adani Power -19.285 9.027 -0.334 3.034 9.207 -2.256 0.212 14.476 0.420
Ambuja Cem. -25.111 33.270 1.898 10.052 101.052 -0.055 0.212 0.513 0.420
Ashok Leyland -33.462 51.682 2.804 14.656 214.796 0.249 0.212 0.933 0.420
Asian Paints -19.091 21.870 2.317 7.078 50.098 -0.011 0.212 0.244 0.420
Axis Bank -34.005 64.579 3.292 14.880 221.420 0.766 0.212 3.127 0.420
B H E L -25.802 33.144 2.625 10.898 118.775 0.197 0.212 0.498 0.420
B P C L -37.436 41.468 1.713 12.922 166.967 -0.086 0.212 1.402 0.420
Bajaj Auto -41.122 60.744 1.687 8.859 78.475 1.748 0.212 19.150 0.420
Bank of
Baroda
-30.679 41.258 2.828 13.503 182.342 0.430 0.212 0.523 0.420
Bank of India -32.537 48.428 3.206 14.328 205.291 0.344 0.212 0.580 0.420
Bharat Forge -44.096 46.435 3.032 14.658 214.871 0.122 0.212 1.123 0.420
Bharti Airtel -30.200 36.986 2.678 10.186 103.764 0.241 0.212 1.223 0.420
Cairn India -38.913 24.811 0.860 7.334 53.787 -0.772 0.212 8.995 0.420
Canara Bank -33.595 43.736 2.163 11.466 131.472 0.443 0.212 1.081 0.420
Cipla -22.358 26.154 1.353 8.895 79.122 0.469 0.212 0.157 0.420
Coal India -11.255 9.507 -0.021 1.908 3.640 -0.057 0.212 19.222 0.420
Colgate-Palm. -100.000 27.760 0.737 11.464 131.414 -5.050 0.212 45.785 0.420
Crompton
Greaves
-34.722 66.102 4.152 15.387 236.775 0.878 0.212 3.195 0.420
Cummins India -32.309 36.737 1.943 11.088 122.947 -0.011 0.212 1.007 0.420
Dabur India -18.487 30.701 2.069 8.815 77.705 0.231 0.212 0.713 0.420
Divi's Lab. -34.041 47.068 3.658 13.887 192.838 0.635 0.212 1.307 0.420
DLF -37.500 74.664 -0.086 13.287 176.550 1.451 0.212 9.011 0.420
Dr Reddy's
Labs
-28.170 25.394 1.676 9.689 93.884 0.056 0.212 0.242 0.420
Exide Inds. -28.831 36.588 3.093 12.487 155.925 0.401 0.212 0.336 0.420
Federal Bank -37.384 62.336 3.426 14.877 221.338 1.157 0.212 3.203 0.420
GAIL (India) -28.007 48.350 2.351 10.371 107.552 0.441 0.212 2.948 0.420
Glenmark
Pharma.
-53.501 74.530 3.889 16.213 262.873 0.911 0.212 5.414 0.420
GMR Infra. -42.571 50.362 0.719 12.296 151.186 0.921 0.212 6.412 0.420
Godrej
Consumer
-17.311 34.064 3.107 9.933 98.665 0.670 0.212 0.438 0.420
8/12/2019 Mk Project
http://slidepdf.com/reader/full/mk-project 28/42
Grasim Inds -39.189 36.964 2.264 11.668 136.137 -0.436 0.212 1.728 0.420
H D F C -23.617 27.897 2.306 9.172 84.135 0.116 0.212 0.457 0.420
H D I L -46.724 93.461 -0.290 16.998 288.944 2.036 0.212 12.366 0.420
H P C L -38.557 64.341 1.255 14.512 210.588 0.684 0.212 2.488 0.420
HCL
Technologies
-41.626 40.876 1.046 13.303 176.977 -0.128 0.212 1.026 0.420
HDFC Bank -26.185 31.039 2.004 8.658 74.966 0.121 0.212 0.866 0.420
Hero Motocorp -17.904 23.254 2.252 9.095 82.728 0.132 0.212 -0.585 0.420
Hind. Unilever -18.840 24.204 0.845 8.149 66.413 0.192 0.212 -0.404 0.420
Hind.Zinc -41.463 102.829 4.603 18.732 350.878 1.375 0.212 5.412 0.420
Hindalco Inds. -38.383 57.289 1.308 13.319 177.390 0.316 0.212 1.787 0.420
I D F C -29.755 62.982 0.877 11.724 137.461 1.578 0.212 7.205 0.420
I O C L -39.496 50.686 2.025 13.057 170.497 0.558 0.212 2.606 0.420
ICICI Bank -32.658 55.039 2.043 13.668 186.816 0.666 0.212 2.256 0.420
IDBI Bank -38.870 94.318 2.112 17.793 316.596 1.388 0.212 5.311 0.420
Idea Cellular -43.265 43.583 0.307 8.910 79.391 -0.137 0.212 8.862 0.420
Indiabulls Fin. -44.721 92.403 3.138 20.342 413.783 1.596 0.212 5.092 0.420
IndusInd Bank -29.747 75.216 3.030 16.062 257.976 0.909 0.212 2.535 0.420
Infosys -34.762 33.682 1.476 10.512 110.502 -0.410 0.212 1.745 0.420
ITC -19.758 31.293 1.784 8.179 66.888 0.055 0.212 1.131 0.420
Jindal Steel -50.161 129.293 5.167 19.625 385.138 2.050 0.212 12.458 0.420
JP Associates -35.331 64.850 2.117 15.214 231.453 0.834 0.212 2.743 0.420
JSW Steel -100.000 68.116 2.096 21.826 476.388 -0.103 0.212 3.856 0.420
Kotak Mah.
Bank
-39.275 76.408 4.261 16.046 257.482 0.868 0.212 3.244 0.420
Larsen &
Toubro
-100.000 59.809 1.966 15.521 240.908 -1.646 0.212 15.235 0.420
LIC Housing
Fin.
-31.662 62.124 3.717 14.716 216.567 0.858 0.212 2.172 0.420
Lupin -100.000 61.429 2.667 16.116 259.728 -1.267 0.212 13.532 0.420
M & M -34.691 44.098 3.028 13.298 176.839 0.297 0.212 1.008 0.420
Maruti Suzuki -28.929 38.981 1.738 10.067 101.335 0.503 0.212 2.051 0.420
Nestle India -15.498 18.015 1.793 6.307 39.773 -0.131 0.212 0.745 0.420
NHPC Ltd -19.956 9.310 -0.438 3.267 10.676 -2.299 0.212 13.615 0.420
NMDC -100.000 192.509 -1.702 45.820 2099.508 0.727 0.212 5.301 0.420
NTPC -20.856 23.753 0.762 6.673 44.523 0.046 0.212 1.754 0.420
O N G C -35.320 52.599 2.456 11.482 131.836 0.970 0.212 3.993 0.420
Power
Fin.Corpn.
-27.029 30.416 0.531 8.622 74.343 0.439 0.212 3.993 0.420
Power Grid
Corpn
-28.129 24.000 -0.148 5.581 31.153 -0.440 0.212 10.252 0.420
Punjab
Natl.Bank
-30.299 61.820 3.127 13.582 184.467 1.220 0.212 3.659 0.420
Ranbaxy Labs. -52.218 68.002 1.385 13.063 170.644 0.327 0.212 6.207 0.420
Rel. Comm. -42.873 42.266 -0.424 11.645 135.617 0.001 0.212 3.434 0.420
Reliance
Capital
-43.075 91.076 2.291 18.773 352.421 1.295 0.212 5.150 0.420
Reliance Inds. -29.573 28.312 1.594 9.547 91.141 0.040 0.212 0.377 0.420
8/12/2019 Mk Project
http://slidepdf.com/reader/full/mk-project 29/42
Reliance Infra. -42.206 83.667 1.538 16.108 259.452 1.436 0.212 6.093 0.420
Reliance Power -41.997 46.999 -0.568 9.213 84.874 0.081 0.212 9.920 0.420
Rural
Elec.Corp.
-21.699 42.705 0.583 8.025 64.403 1.573 0.212 8.781 0.420
S A I L -33.398 77.342 3.369 18.148 329.349 1.148 0.212 3.126 0.420
Satyam
Computer
-68.234 51.247 0.331 14.555 211.857 -0.454 0.212 4.390 0.420
Sesa Goa -37.019 74.269 4.839 18.856 355.559 0.826 0.212 1.282 0.420
Shriram Trans. -100.000 82.493 3.458 17.117 292.992 -0.905 0.212 12.292 0.420
Siemens -34.409 59.196 3.380 14.610 213.439 0.641 0.212 2.517 0.420
St Bk of India -27.638 46.286 2.191 11.508 132.438 0.289 0.212 1.244 0.420
Sterlite Inds. -100.000 108.656 3.119 21.547 464.254 0.715 0.212 8.616 0.420
Sun
Pharma.Inds.
-23.503 25.848 2.450 7.743 59.947 -0.046 0.212 0.459 0.420
Suzlon Energy -70.805 53.426 -0.356 14.614 213.568 -0.056 0.212 6.739 0.420
Tata Chemicals -31.267 34.640 2.048 11.890 141.364 -0.122 0.212 1.045 0.420
Tata Global -24.597 34.291 1.437 10.325 106.601 0.395 0.212 0.602 0.420
Tata Motors -50.087 44.788 2.807 14.269 203.597 -0.232 0.212 1.257 0.420Tata Power Co. -50.634 70.678 2.290 15.633 244.377 0.454 0.212 2.606 0.420
Tata Steel -31.962 41.675 2.320 12.412 154.060 0.163 0.212 0.604 0.420
TCS -21.115 35.078 1.463 7.481 55.968 0.277 0.212 3.757 0.420
Titan Inds. -38.973 52.910 4.117 15.160 229.831 0.477 0.212 0.710 0.420
UltraTech
Cem.
-32.863 41.548 1.655 10.322 106.537 0.289 0.212 2.669 0.420
Union Bank (I) -31.821 44.307 2.493 11.570 133.870 0.423 0.212 1.356 0.420
Unitech -100.000 122.074 4.523 29.420 865.540 0.616 0.212 5.039 0.420
United Phosp. -100.000 104.225 0.317 28.708 824.168 -0.398 0.212 7.458 0.420
United Spirits -34.450 86.282 3.265 16.145 260.660 1.226 0.212 5.349 0.420
Wipro-47.572 34.795 1.014 11.861 140.674 -0.387 0.212 2.314 0.420
Yes Bank -43.722 62.589 1.684 11.715 137.238 1.204 0.212 9.672 0.420
Zee
Entertainmen
-34.857 49.832 0.989 14.746 217.457 0.307 0.212 0.781 0.420

8/12/2019 Mk Project
http://slidepdf.com/reader/full/mk-project 30/42
Table 1 depicts that over a time period ranging from 2001-2011 United Phosp., Unitech, Sterlite
Inds., Colgate-Palm., JSW Steel, Larsen & Toubro, Lupin, NMDC & Shriram Trans offered the
minimum return whereas Adani Enterp. followed by NMDC has offered the maximum return
with NMDC offering the highest risk level at a standard deviation of 45.820. The average return
offered by Jindal Steel is the highest with a standard deviation of 19.625 quite higher than the
average of 13.188. However the least risky investment would be Coal India as it has the lowest
standard deviation of 1.908 but the mean return is -0.021. Also Colgate-Palm. return is most
negatively skewed at -5.050 whereas Adani Enterp.‟s return is the most positively skewed at
3.101. Thus the probability of negative returns is the highest for colgate palm and that of positive
returns is the highest for Adani Enterp.

8/12/2019 Mk Project
http://slidepdf.com/reader/full/mk-project 31/42
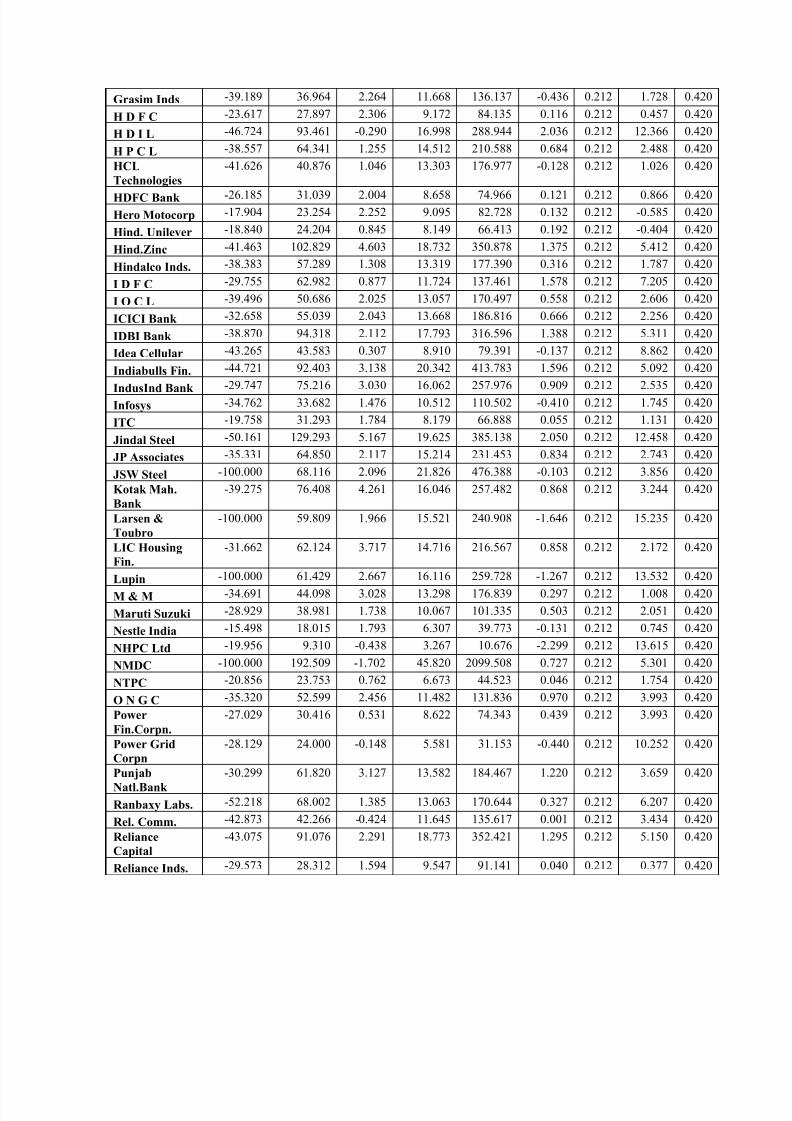
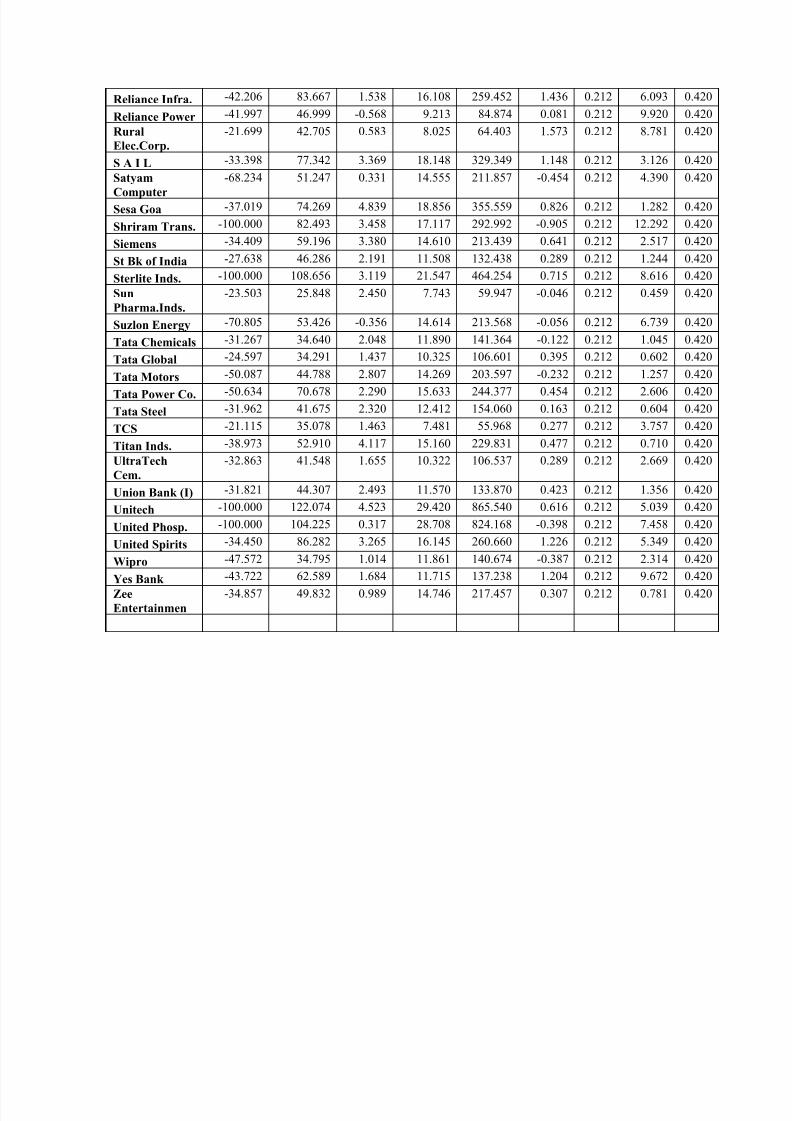
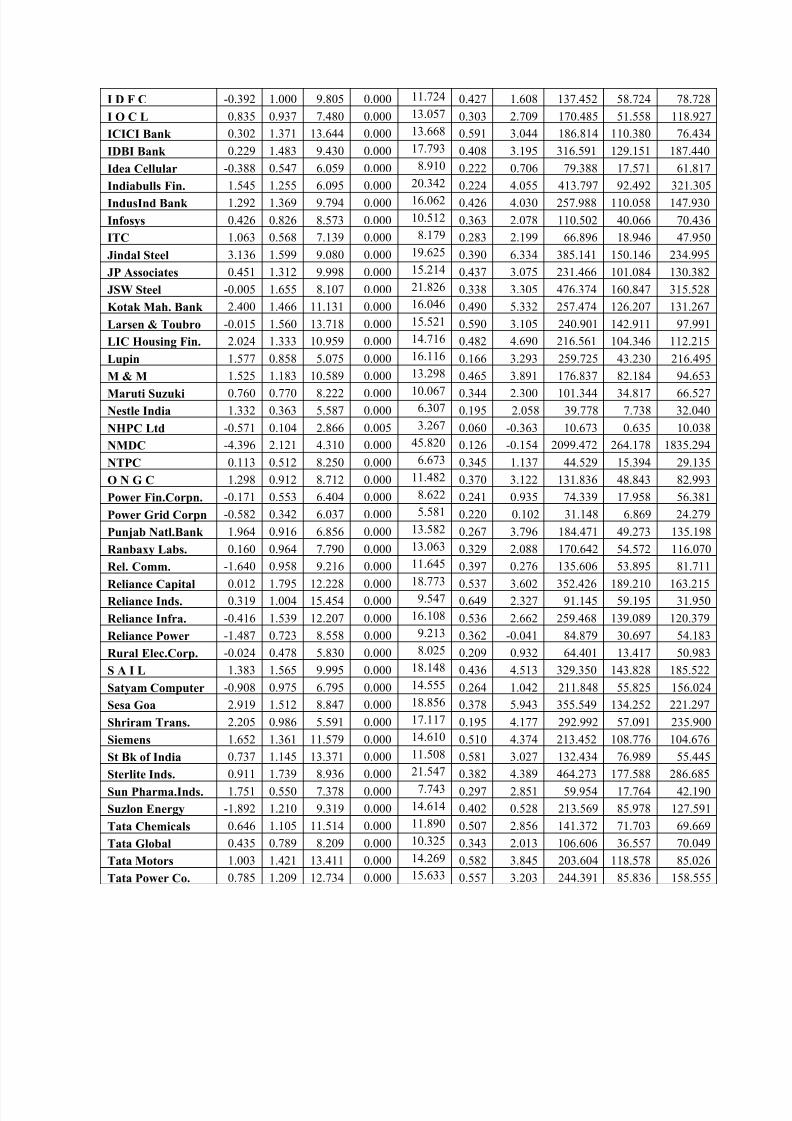
Table 2: Individual security return and risk
Company (α) (β) t Sig. std dev. R 2 Return σ
2 β
2σx
2 е
2
A B B 1.212 1.059 10.532 0.000 11.938 0.462 3.330 142.516 65.858 76.658
ACC 0.851 0.879 9.596 0.000 10.436 0.417 2.609 108.910 45.373 63.538
Adani Enterp. 2.707 1.298 4.502 0.00026.994
0.136 5.303 728.676 98.938 629.738Adani Ports -0.670 0.703 6.708 0.000 10.587 0.259 0.736 112.085 29.022 83.063
Adani Power -0.411 0.061 1.772 0.079* 3.034 0.024 -0.289 9.205 0.219 8.987
Ambuja Cem. 0.779 0.882 10.314 0.000 10.052 0.452 2.543 101.043 45.683 55.360
Ashok Leyland 1.291 1.192 9.052 0.000 14.656 0.388 3.675 214.798 83.439 131.360
Asian Paints 1.762 0.437 6.104 0.000 7.078 0.224 2.636 50.098 11.214 38.884
Axis Bank 1.650 1.294 10.147 0.000 14.880 0.444 4.238 221.414 98.330 123.085
B H E L 1.349 1.006 11.358 0.000 10.898 0.500 3.361 118.766 59.431 59.336
B P C L 0.672 0.820 6.320 0.000 12.922 0.236 2.312 166.978 39.486 127.492
Bajaj Auto 1.045 0.506 5.529 0.000 8.859 0.192 2.057 78.482 15.035 63.446
Bank of Baroda 1.391 1.132 9.519 0.000 13.503 0.413 3.655 182.331 75.250 107.081
Bank of India 1.700 1.186 9.322 0.000 14.328 0.402 4.072 205.292 82.601 122.691Bharat Forge 1.383 1.299 10.503 0.000 14.658 0.461 3.981 214.857 99.091 115.766
Bharti Airtel 1.747 0.733 7.515 0.000 10.186 0.304 3.213 103.755 31.552 72.203
Cairn India 0.291 0.448 6.022 0.000 7.334 0.219 1.187 53.788 11.786 42.001
Canara Bank 1.094 0.841 7.725 0.000 11.466 0.316 2.776 131.469 41.534 89.935
Cipla 0.700 0.514 5.612 0.000 8.895 0.196 1.728 79.121 15.515 63.606
Coal India -0.040 0.015 0.683 0.496* 1.908 0.004 -0.010 3.640 0.013 3.627
Colgate-Palm. 0.240 0.391 3.075 0.003 11.464 0.068 1.022 131.423 8.978 122.446
Crompton Greaves 2.591 1.229 8.789 0.000 15.387 0.375 5.049 236.760 88.699 148.061
Cummins India 0.793 0.905 9.112 0.000 11.088 0.392 2.603 122.944 48.096 74.847
Dabur India 1.356 0.561 6.347 0.000 8.815 0.238 2.478 77.704 18.482 59.223
Divi's Lab. 2.426 0.970 7.198 0.000 13.887 0.287 4.366 192.849 55.253 137.595DLF -1.493 1.108 9.440 0.000 13.287 0.409 0.723 176.544 72.093 104.451
Dr Reddy's Labs 0.866 0.638 6.631 0.000 9.689 0.254 2.142 93.877 23.903 69.973
Exide Inds. 1.831 0.993 8.735 0.000 12.487 0.372 3.817 155.925 57.905 98.020
Federal Bank 1.930 1.178 8.674 0.000 14.877 0.368 4.286 221.325 81.490 139.835
GAIL (India) 1.165 0.934 10.830 0.000 10.371 0.476 3.033 107.558 51.228 56.329
Glenmark Pharma. 2.352 1.211 7.924 0.000 16.213 0.327 4.774 262.861 86.120 176.741
GMR Infra. -0.317 0.815 6.701 0.000 12.296 0.258 1.313 151.192 39.006 112.186
Godrej Consumer 2.501 0.477 4.496 0.000 9.933 0.135 3.455 98.664 13.361 85.303
Grasim Inds 0.994 1.000 9.897 0.000 11.668 0.432 2.994 136.142 58.724 77.418
H D F C 1.109 0.943 14.510 0.000 9.172 0.620 2.995 84.126 52.220 31.905
H D I L -1.881 1.253 7.775 0.000 16.998 0.319 0.625 288.932 92.197 196.735H P C L 0.136 0.881 5.969 0.000 14.512 0.216 1.898 210.598 45.579 165.019
HCL Technologies -0.326 1.081 9.041 0.000 13.303 0.388 1.836 176.970 68.623 108.347
HDFC Bank 0.921 0.853 13.067 0.000 8.658 0.570 2.627 74.961 42.728 32.233
Hero Motocorp 1.403 0.669 7.747 0.000 9.095 0.318 2.741 82.719 26.283 56.436
Hind. Unilever 0.238 0.477 5.707 0.000 8.149 0.202 1.192 66.406 13.361 53.045
Hind.Zinc 2.877 1.359 7.598 0.000 18.732 0.309 5.595 350.888 108.456 242.432
Hindalco Inds. -0.410 1.354 14.101 0.000 13.319 0.607 2.298 177.396 107.660 69.736
8/12/2019 Mk Project
http://slidepdf.com/reader/full/mk-project 32/42
I D F C -0.392 1.000 9.805 0.000 11.724 0.427 1.608 137.452 58.724 78.728
I O C L 0.835 0.937 7.480 0.000 13.057 0.303 2.709 170.485 51.558 118.927
ICICI Bank 0.302 1.371 13.644 0.000 13.668 0.591 3.044 186.814 110.380 76.434
IDBI Bank 0.229 1.483 9.430 0.000 17.793 0.408 3.195 316.591 129.151 187.440
Idea Cellular -0.388 0.547 6.059 0.000 8.910 0.222 0.706 79.388 17.571 61.817
Indiabulls Fin. 1.545 1.255 6.095 0.000 20.342 0.224 4.055 413.797 92.492 321.305IndusInd Bank 1.292 1.369 9.794 0.000 16.062 0.426 4.030 257.988 110.058 147.930
Infosys 0.426 0.826 8.573 0.000 10.512 0.363 2.078 110.502 40.066 70.436
ITC 1.063 0.568 7.139 0.000 8.179 0.283 2.199 66.896 18.946 47.950
Jindal Steel 3.136 1.599 9.080 0.000 19.625 0.390 6.334 385.141 150.146 234.995
JP Associates 0.451 1.312 9.998 0.000 15.214 0.437 3.075 231.466 101.084 130.382
JSW Steel -0.005 1.655 8.107 0.000 21.826 0.338 3.305 476.374 160.847 315.528
Kotak Mah. Bank 2.400 1.466 11.131 0.000 16.046 0.490 5.332 257.474 126.207 131.267
Larsen & Toubro -0.015 1.560 13.718 0.000 15.521 0.590 3.105 240.901 142.911 97.991
LIC Housing Fin. 2.024 1.333 10.959 0.000 14.716 0.482 4.690 216.561 104.346 112.215
Lupin 1.577 0.858 5.075 0.000 16.116 0.166 3.293 259.725 43.230 216.495
M & M 1.525 1.183 10.589 0.000 13.298 0.465 3.891 176.837 82.184 94.653Maruti Suzuki 0.760 0.770 8.222 0.000 10.067 0.344 2.300 101.344 34.817 66.527
Nestle India 1.332 0.363 5.587 0.000 6.307 0.195 2.058 39.778 7.738 32.040
NHPC Ltd -0.571 0.104 2.866 0.005 3.267 0.060 -0.363 10.673 0.635 10.038
NMDC -4.396 2.121 4.310 0.000 45.820 0.126 -0.154 2099.472 264.178 1835.294
NTPC 0.113 0.512 8.250 0.000 6.673 0.345 1.137 44.529 15.394 29.135
O N G C 1.298 0.912 8.712 0.000 11.482 0.370 3.122 131.836 48.843 82.993
Power Fin.Corpn. -0.171 0.553 6.404 0.000 8.622 0.241 0.935 74.339 17.958 56.381
Power Grid Corpn -0.582 0.342 6.037 0.000 5.581 0.220 0.102 31.148 6.869 24.279
Punjab Natl.Bank 1.964 0.916 6.856 0.000 13.582 0.267 3.796 184.471 49.273 135.198
Ranbaxy Labs. 0.160 0.964 7.790 0.000 13.063 0.329 2.088 170.642 54.572 116.070
Rel. Comm. -1.640 0.958 9.216 0.000 11.645 0.397 0.276 135.606 53.895 81.711Reliance Capital 0.012 1.795 12.228 0.000 18.773 0.537 3.602 352.426 189.210 163.215
Reliance Inds. 0.319 1.004 15.454 0.000 9.547 0.649 2.327 91.145 59.195 31.950
Reliance Infra. -0.416 1.539 12.207 0.000 16.108 0.536 2.662 259.468 139.089 120.379
Reliance Power -1.487 0.723 8.558 0.000 9.213 0.362 -0.041 84.879 30.697 54.183
Rural Elec.Corp. -0.024 0.478 5.830 0.000 8.025 0.209 0.932 64.401 13.417 50.983
S A I L 1.383 1.565 9.995 0.000 18.148 0.436 4.513 329.350 143.828 185.522
Satyam Computer -0.908 0.975 6.795 0.000 14.555 0.264 1.042 211.848 55.825 156.024
Sesa Goa 2.919 1.512 8.847 0.000 18.856 0.378 5.943 355.549 134.252 221.297
Shriram Trans. 2.205 0.986 5.591 0.000 17.117 0.195 4.177 292.992 57.091 235.900
Siemens 1.652 1.361 11.579 0.000 14.610 0.510 4.374 213.452 108.776 104.676
St Bk of India 0.737 1.145 13.371 0.000 11.508 0.581 3.027 132.434 76.989 55.445
Sterlite Inds. 0.911 1.739 8.936 0.000 21.547 0.382 4.389 464.273 177.588 286.685
Sun Pharma.Inds. 1.751 0.550 7.378 0.000 7.743 0.297 2.851 59.954 17.764 42.190
Suzlon Energy -1.892 1.210 9.319 0.000 14.614 0.402 0.528 213.569 85.978 127.591
Tata Chemicals 0.646 1.105 11.514 0.000 11.890 0.507 2.856 141.372 71.703 69.669
Tata Global 0.435 0.789 8.209 0.000 10.325 0.343 2.013 106.606 36.557 70.049
Tata Motors 1.003 1.421 13.411 0.000 14.269 0.582 3.845 203.604 118.578 85.026
Tata Power Co. 0.785 1.209 12.734 0.000 15.633 0.557 3.203 244.391 85.836 158.555
8/12/2019 Mk Project
http://slidepdf.com/reader/full/mk-project 33/42
Tata Steel 0.211 1.637 15.284 0.000 12.412 0.644 3.485 154.058 157.367 -3.309
TCS 0.813 0.512 6.991 0.000 7.481 0.275 1.837 55.965 15.394 40.571
Titan Inds. 2.659 1.148 8.094 0.000 15.160 0.337 4.955 229.826 77.393 152.433
UltraTech Cem. 0.769 0.698 6.879 0.000 10.322 0.268 2.165 106.544 28.611 77.933
Union Bank (I) 1.482 0.796 7.052 0.000 11.570 0.278 3.074 133.865 37.208 96.656
Unitech 2.286 1.761 5.865 0.000 29.420 0.210 5.808 865.536 182.110 683.426United Phosp. -0.938 0.988 3.107 0.002 28.708 0.070 1.038 824.149 57.323 766.826
United Spirits 1.908 1.069 6.687 0.000 16.145 0.257 4.046 260.661 67.107 193.554
Wipro -0.310 1.042 10.344 0.000 11.861 0.453 1.774 140.683 63.760 76.923
Yes Bank 0.473 0.954 9.073 0.000 11.715 0.390 2.381 137.241 53.446 83.796
Zee Entertainmen -0.418 1.108 7.997 0.000 14.746 0.331 1.798 217.445 72.093 145.351
(Note: *indicates not significant, level of significance being 0.05)
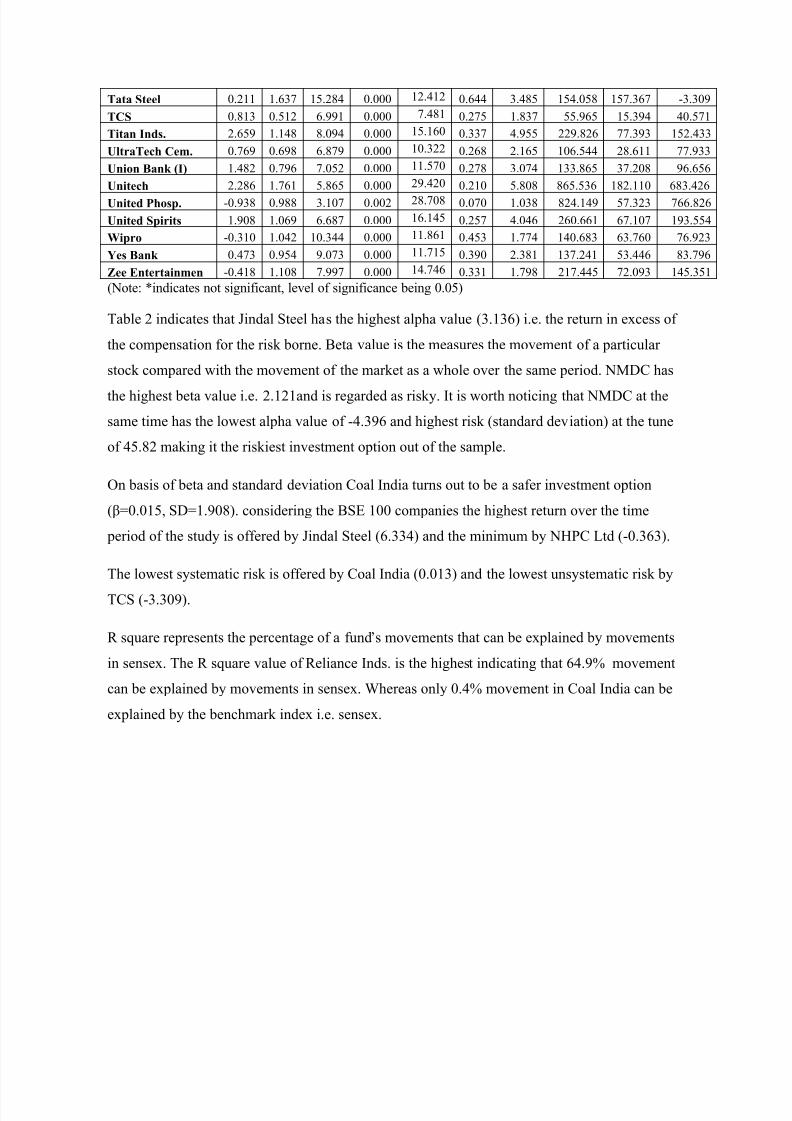
Table 2 indicates that Jindal Steel has the highest alpha value (3.136) i.e. the return in excess of
the compensation for the risk borne. Beta value is the measures the movement of a particular
stock compared with the movement of the market as a whole over the same period. NMDC hasthe highest beta value i.e. 2.121and is regarded as risky. It is worth noticing that NMDC at the
same time has the lowest alpha value of -4.396 and highest risk (standard deviation) at the tune
of 45.82 making it the riskiest investment option out of the sample.
On basis of beta and standard deviation Coal India turns out to be a safer investment option
(β=0.015, SD=1.908). considering the BSE 100 companies the highest return over the time
period of the study is offered by Jindal Steel (6.334) and the minimum by NHPC Ltd (-0.363).
The lowest systematic risk is offered by Coal India (0.013) and the lowest unsystematic risk by
TCS (-3.309).
R square represents the percentage of a fund‟s movements that can be explained by movements
in sensex. The R square value of Reliance Inds. is the highest indicating that 64.9% movement
can be explained by movements in sensex. Whereas only 0.4% movement in Coal India can be
explained by the benchmark index i.e. sensex.
8/12/2019 Mk Project
http://slidepdf.com/reader/full/mk-project 34/42
Table 3: Portfolio formulation on basis of Beta (β) value
Company (α) (β) t Sig. std dev. R 2 Return σ
2 β
2σx
2 е
2
Portfolio 1
Coal India -0.040 0.015 0.683 0.496 1.908 0.004 -0.010 3.640 0.013 3.627
Adani Power -0.411 0.061 1.772 0.079 3.034 0.024 -0.289 9.205 0.219 8.987
NHPC Ltd -0.571 0.104 2.866 0.005 3.267 0.060 -0.363 10.673 0.635 10.038
Power Grid Corpn -0.582 0.342 6.037 0.000 5.581 0.220 0.102 31.148 6.869 24.279
Nestle India 1.332 0.363 5.587 0.000 6.307 0.195 2.058 39.778 7.738 32.040
Colgate-Palm. 0.240 0.391 3.075 0.003 11.464 0.068 1.022 131.423 8.978 122.446Asian Paints 1.762 0.437 6.104 0.000 7.078 0.224 2.636 50.098 11.214 38.884
Cairn India 0.291 0.448 6.022 0.000 7.334 0.219 1.187 53.788 11.786 42.001
Godrej Consumer 2.501 0.477 4.496 0.000 9.933 0.135 3.455 98.664 13.361 85.303
Hind. Unilever 0.238 0.477 5.707 0.000 8.149 0.202 1.192 66.406 13.361 53.045
Averages 0.476 0.312 4.235 0.058 6.406 0.135 1.099 49.482 7.417 42.065
Portfolio 2
Rural Elec.Corp. -0.024 0.478 5.830 0.000 8.025 0.209 0.932 64.401 13.417 50.983
Bajaj Auto 1.045 0.506 5.529 0.000 8.859 0.192 2.057 78.482 15.035 63.446
NTPC 0.113 0.512 8.250 0.000 6.673 0.345 1.137 44.529 15.394 29.135
TCS 0.813 0.512 6.991 0.000 7.481 0.275 1.837 55.965 15.394 40.571
Cipla 0.700 0.514 5.612 0.000 8.895 0.196 1.728 79.121 15.515 63.606
Idea Cellular -0.388 0.547 6.059 0.000 8.910 0.222 0.706 79.388 17.571 61.817
Sun Pharma.Inds. 1.751 0.550 7.378 0.000 7.743 0.297 2.851 59.954 17.764 42.190
Power Fin.Corpn. -0.171 0.553 6.404 0.000 8.622 0.241 0.935 74.339 17.958 56.381
Dabur India 1.356 0.561 6.347 0.000 8.815 0.238 2.478 77.704 18.482 59.223
ITC 1.063 0.568 7.139 0.000 8.179 0.283 2.199 66.896 18.946 47.950
Averages 0.626 0.530 6.554 0.000 8.220 0.250 1.686 68.078 16.548 51.530
Portfolio 3
Dr Reddy's Labs 0.866 0.638 6.631 0.000 9.689 0.254 2.142 93.877 23.903 69.973
Hero Motocorp 1.403 0.669 7.747 0.000 9.095 0.318 2.741 82.719 26.283 56.436
UltraTech Cem. 0.769 0.698 6.879 0.000 10.322 0.268 2.165 106.544 28.611 77.933
Adani Ports -0.670 0.703 6.708 0.000 10.587 0.259 0.736 112.085 29.022 83.063
Reliance Power -1.487 0.723 8.558 0.000 9.213 0.362 -0.041 84.879 30.697 54.183
Bharti Airtel 1.747 0.733 7.515 0.000 10.186 0.304 3.213 103.755 31.552 72.203
Maruti Suzuki 0.760 0.770 8.222 0.000 10.067 0.344 2.300 101.344 34.817 66.527
Tata Global 0.435 0.789 8.209 0.000 10.325 0.343 2.013 106.606 36.557 70.049
Union Bank (I) 1.482 0.796 7.052 0.000 11.570 0.278 3.074 133.865 37.208 96.656
GMR Infra. -0.317 0.815 6.701 0.000 12.296 0.258 1.313 151.192 39.006 112.186
8/12/2019 Mk Project
http://slidepdf.com/reader/full/mk-project 35/42
Averages 0.499 0.733 7.422 0.000 10.335 0.299 1.966 107.686 31.766 75.921
Portfolio 4
B P C L 0.672 0.820 6.320 0.000 12.922 0.236 2.312 166.978 39.486 127.492
Infosys 0.426 0.826 8.573 0.000 10.512 0.363 2.078 110.502 40.066 70.436
Canara Bank 1.094 0.841 7.725 0.000 11.466 0.316 2.776 131.469 41.534 89.935
HDFC Bank 0.921 0.853 13.067 0.000 8.658 0.570 2.627 74.961 42.728 32.233Lupin 1.577 0.858 5.075 0.000 16.116 0.166 3.293 259.725 43.230 216.495
ACC 0.851 0.879 9.596 0.000 10.436 0.417 2.609 108.910 45.373 63.538
H P C L 0.136 0.881 5.969 0.000 14.512 0.216 1.898 210.598 45.579 165.019
Ambuja Cem. 0.779 0.882 10.314 0.000 10.052 0.452 2.543 101.043 45.683 55.360
Cummins India 0.793 0.905 9.112 0.000 11.088 0.392 2.603 122.944 48.096 74.847
O N G C 1.298 0.912 8.712 0.000 11.482 0.370 3.122 131.836 48.843 82.993
Averages 0.855 0.866 8.446 0.000 11.724 0.350 2.586 141.897 44.062 97.835
Portfolio 5
Punjab Natl.Bank 1.964 0.916 6.856 0.000 13.582 0.267 3.796 184.471 49.273 135.198
GAIL (India) 1.165 0.934 10.830 0.000 10.371 0.476 3.033 107.558 51.228 56.329
I O C L 0.835 0.937 7.480 0.000 13.057 0.303 2.709 170.485 51.558 118.927
H D F C 1.109 0.943 14.510 0.000 9.172 0.620 2.995 84.126 52.220 31.905
Yes Bank 0.473 0.954 9.073 0.000 11.715 0.390 2.381 137.241 53.446 83.796
Rel. Comm. -1.640 0.958 9.216 0.000 11.645 0.397 0.276 135.606 53.895 81.711
Ranbaxy Labs. 0.160 0.964 7.790 0.000 13.063 0.329 2.088 170.642 54.572 116.070
Divi's Lab. 2.426 0.970 7.198 0.000 13.887 0.287 4.366 192.849 55.253 137.595
Satyam Computer -0.908 0.975 6.795 0.000 14.555 0.264 1.042 211.848 55.825 156.024
Shriram Trans. 2.205 0.986 5.591 0.000 17.117 0.195 4.177 292.992 57.091 235.900
Averages 0.779 0.954 8.534 0.000 12.816 0.353 2.686 168.782 53.436 115.346
Portfolio 6
United Phosp. -0.938 0.988 3.107 0.002 28.708 0.070 1.038 824.149 57.323 766.826
Exide Inds. 1.831 0.993 8.735 0.000 12.487 0.372 3.817 155.925 57.905 98.020
Grasim Inds 0.994 1.000 9.897 0.000 11.668 0.432 2.994 136.142 58.724 77.418
I D F C -0.392 1.000 9.805 0.000 11.724 0.427 1.608 137.452 58.724 78.728
Reliance Inds. 0.319 1.004 15.454 0.000 9.547 0.649 2.327 91.145 59.195 31.950
B H E L 1.349 1.006 11.358 0.000 10.898 0.500 3.361 118.766 59.431 59.336
Wipro -0.310 1.042 10.344 0.000 11.861 0.453 1.774 140.683 63.760 76.923
A B B 1.212 1.059 10.532 0.000 11.938 0.462 3.330 142.516 65.858 76.658
United Spirits 1.908 1.069 6.687 0.000 16.145 0.257 4.046 260.661 67.107 193.554
HCL Technologies -0.326 1.081 9.041 0.000 13.303 0.388 1.836 176.970 68.623 108.347
Averages 0.565 1.024 9.496 0.000 13.828 0.401 2.613 218.441 61.665 156.776
Portfolio 7Tata Chemicals 0.646 1.105 11.514 0.000 11.890 0.507 2.856 141.372 71.703 69.669
DLF -1.493 1.108 9.440 0.000 13.287 0.409 0.723 176.544 72.093 104.451
Zee Entertainmen -0.418 1.108 7.997 0.000 14.746 0.331 1.798 217.445 72.093 145.351
Bank of Baroda 1.391 1.132 9.519 0.000 13.503 0.413 3.655 182.331 75.250 107.081
St Bk of India 0.737 1.145 13.371 0.000 11.508 0.581 3.027 132.434 76.989 55.445
Titan Inds. 2.659 1.148 8.094 0.000 15.160 0.337 4.955 229.826 77.393 152.433
Federal Bank 1.930 1.178 8.674 0.000 14.877 0.368 4.286 221.325 81.490 139.835

8/12/2019 Mk Project
http://slidepdf.com/reader/full/mk-project 36/42
M & M 1.525 1.183 10.589 0.000 13.298 0.465 3.891 176.837 82.184 94.653
Bank of India 1.700 1.186 9.322 0.000 14.328 0.402 4.072 205.292 82.601 122.691
Ashok Leyland 1.291 1.192 9.052 0.000 14.656 0.388 3.675 214.798 83.439 131.360
Averages 0.997 1.149 9.757 0.000 13.725 0.420 3.294 189.820 77.524 112.297
Portfolio 8
Tata Power Co. 0.785 1.209 12.734 0.000 15.633 0.557 3.203 244.391 85.836 158.555Suzlon Energy -1.892 1.210 9.319 0.000 14.614 0.402 0.528 213.569 85.978 127.591
Glenmark Pharma. 2.352 1.211 7.924 0.000 16.213 0.327 4.774 262.861 86.120 176.741
Crompton Greaves 2.591 1.229 8.789 0.000 15.387 0.375 5.049 236.760 88.699 148.061
H D I L -1.881 1.253 7.775 0.000 16.998 0.319 0.625 288.932 92.197 196.735
Indiabulls Fin. 1.545 1.255 6.095 0.000 20.342 0.224 4.055 413.797 92.492 321.305
Axis Bank 1.650 1.294 10.147 0.000 14.880 0.444 4.238 221.414 98.330 123.085
Adani Enterp. 2.707 1.298 4.502 0.000 26.994 0.136 5.303 728.676 98.938 629.738
Bharat Forge 1.383 1.299 10.503 0.000 14.658 0.461 3.981 214.857 99.091 115.766
JP Associates 0.451 1.312 9.998 0.000 15.214 0.437 3.075 231.466 101.084 130.382
Averages 0.969 1.257 8.779 0.000 17.093 0.368 3.483 305.672 92.876 212.796
Portfolio 9
LIC Housing Fin. 2.024 1.333 10.959 0.000 14.716 0.482 4.690 216.561 104.346 112.215
Hindalco Inds. -0.410 1.354 14.101 0.000 13.319 0.607 2.298 177.396 107.660 69.736
Hind.Zinc 2.877 1.359 7.598 0.000 18.732 0.309 5.595 350.888 108.456 242.432
Siemens 1.652 1.361 11.579 0.000 14.610 0.510 4.374 213.452 108.776 104.676
IndusInd Bank 1.292 1.369 9.794 0.000 16.062 0.426 4.030 257.988 110.058 147.930
ICICI Bank 0.302 1.371 13.644 0.000 13.668 0.591 3.044 186.814 110.380 76.434
Tata Motors 1.003 1.421 13.411 0.000 14.269 0.582 3.845 203.604 118.578 85.026
Kotak Mah. Bank 2.400 1.466 11.131 0.000 16.046 0.490 5.332 257.474 126.207 131.267
IDBI Bank 0.229 1.483 9.430 0.000 17.793 0.408 3.195 316.591 129.151 187.440
Sesa Goa 2.919 1.512 8.847 0.000 18.856 0.378 5.943 355.549 134.252 221.297
Averages 1.429 1.403 11.049 0.000 15.807 0.478 4.235 253.632 115.786 137.845
Portfolio 10
Reliance Infra. -0.416 1.539 12.207 0.000 16.108 0.536 2.662 259.468 139.089 120.379
Larsen & Toubro -0.015 1.560 13.718 0.000 15.521 0.590 3.105 240.901 142.911 97.991
S A I L 1.383 1.565 9.995 0.000 18.148 0.436 4.513 329.350 143.828 185.522
Jindal Steel 3.136 1.599 9.080 0.000 19.625 0.390 6.334 385.141 150.146 234.995
Tata Steel 0.211 1.637 15.284 0.000 12.412 0.644 3.485 154.058 157.367 -3.309
JSW Steel -0.005 1.655 8.107 0.000 21.826 0.338 3.305 476.374 160.847 315.528
Sterlite Inds. 0.911 1.739 8.936 0.000 21.547 0.382 4.389 464.273 177.588 286.685
Unitech 2.286 1.761 5.865 0.000 29.420 0.210 5.808 865.536 182.110 683.426
Reliance Capital 0.012 1.795 12.228 0.000 18.773 0.537 3.602 352.426 189.210 163.215
NMDC -4.396 2.121 4.310 0.000 45.820 0.126 -0.154 2099.472 264.178 1835.294
Averages 0.311 1.697 9.973 0.000 21.920 0.419 3.705 562.700 170.727 391.973

8/12/2019 Mk Project
http://slidepdf.com/reader/full/mk-project 37/42
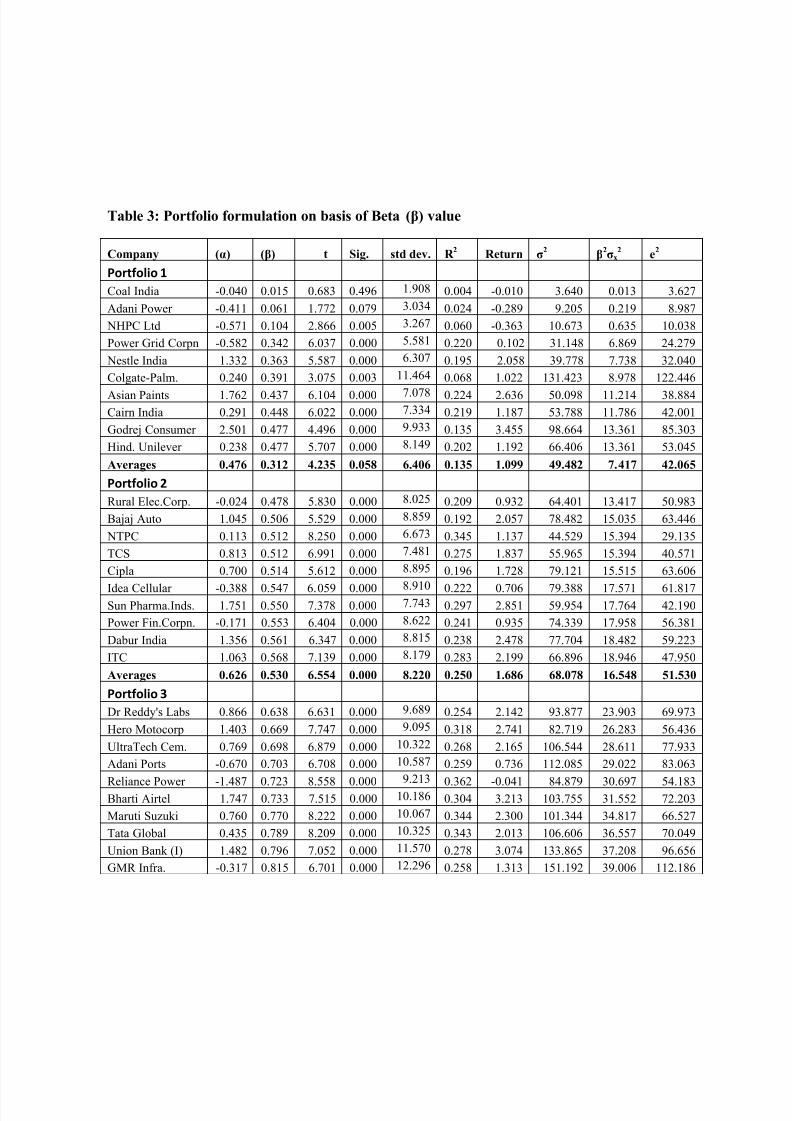
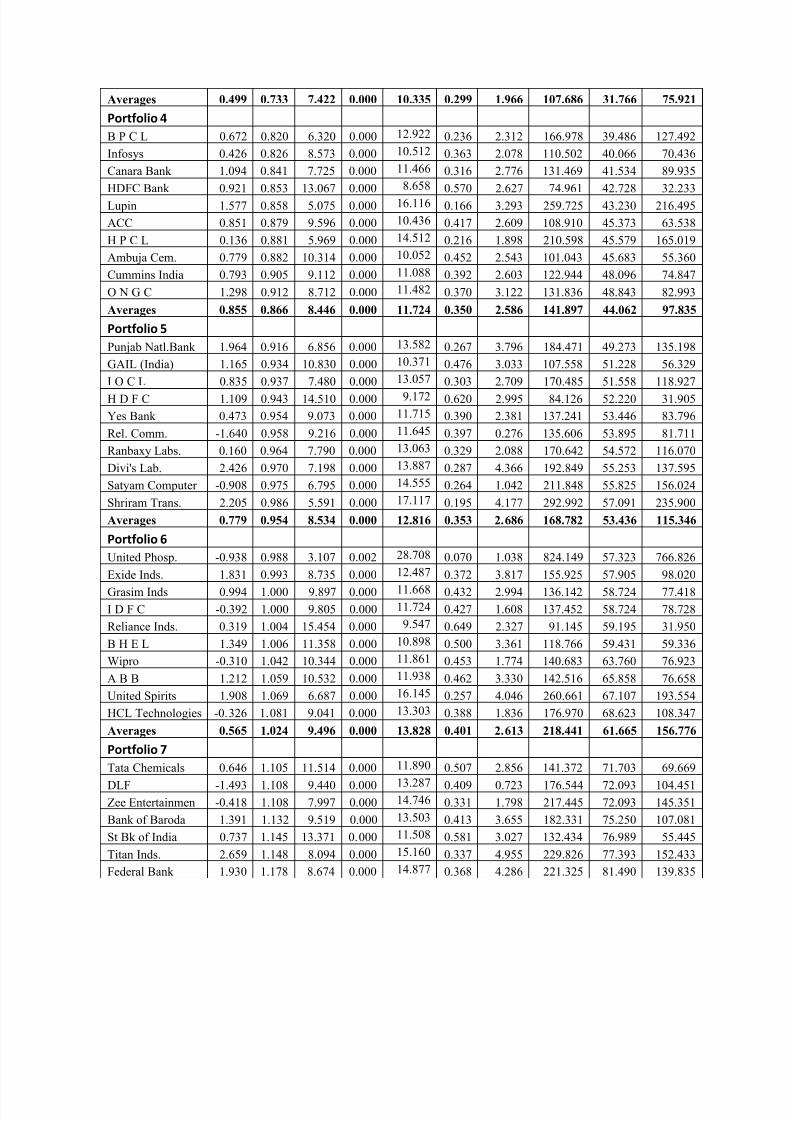
Table 3 aims at establishing the risk and return relationship between stocks. For this purpose all
the securities are arranged in ascending order on the basis of their beta values. Only two out of
the hundred stocks have insignificant beta values. The proposition of the market index model
that high risk yield high return and low risk yields low return holds true in this case. Stocks
falling in the higher rankings can be categorized as less volatile. They remain less responsive to
the market upswings and downswings. Stocks in the lower rankings however are highly volatile
and exihibit high degree of market sensitivity.

8/12/2019 Mk Project
http://slidepdf.com/reader/full/mk-project 38/42
Table 4: Portfolio return and risk
Portfolio (α) (β) t Sig. std dev. R2 Return σ
2 β
2σx
2 е
2
Portfolio 1 0.476 0.312 4.235 0.058* 6.406 0.135 1.099 49.482 7.417 42.065
Portfolio 2 0.626 0.530 6.554 0.000 8.220 0.250 1.686 68.078 16.548 51.530
Portfolio 3 0.499 0.733 7.422 0.000 10.335 0.299 1.966 107.686 31.766 75.921
Portfolio 4 0.855 0.866 8.446 0.000 11.724 0.350 2.586 141.897 44.062 97.835
Portfolio 5 0.779 0.954 8.534 0.000 12.816 0.353 2.686 168.782 53.436 115.346
Portfolio 6 0.565 1.024 9.496 0.000 13.828 0.401 2.613 218.441 61.665 156.776
Portfolio 7 0.997 1.149 9.757 0.000 13.725 0.420 3.294 189.820 77.524 112.297
Portfolio 8 0.969 1.257 8.779 0.000 17.093 0.368 3.483 305.672 92.876 212.796
Portfolio 9 1.429 1.403 11.049 0.000 15.807 0.478 4.235 253.632 115.786 137.845
Portfolio 10 0.311 1.697 9.973 0.000 21.920 0.419 3.705 562.700 170.727 391.973
(Note: *indicates not significant, level of significance being 0.05)
Table 4 depicts the statistical summary of ten portfolios constructed on the basis of beta value of
hundred stocks. All portfolio betas, except the p1 are statistically significant. Portfolio return
tends to be inconsistence with the portfolio beta towards the end as one moves from P1 to P10.
Portfolio return of p10 is less than the portfolio return of p9 whereas the risk increases. The
investors investing in p1have realized 1.099% monthly return whereas those who invested in p10
have got 3.705% monthly return.

8/12/2019 Mk Project
http://slidepdf.com/reader/full/mk-project 39/42
Correlation tables
Table 5: correlation between portfolio beta and
return
beta Return
beta Pearson Correlation 1 .947**
Sig. (2-tailed) .000
N 10 10
Return Pearson Correlation .947**
1
Sig. (2-tailed) .000
N 10 10
The Pearson correlation between portfolio beta and return, and between the return and market
risk of the portfolios is .947 and .883 respectively which means that there is a strong relationship
between these two variables respectively. Changes in one variable are strongly correlated with
changes in the second variable. Correlation coefficient value between portfolio beta and portfolio
return are significant at 5% level of significance and do exhibit a very high positive linear
relationship.
Table 6: correlation between market risk
and return
Return
market
risk
Return Pearson Correlation 1 .883**
Sig. (2-tailed) .001
N 10 10
marketrisk
Pearson Correlation .883**
1
Sig. (2-tailed) .001
N 10 10

8/12/2019 Mk Project
http://slidepdf.com/reader/full/mk-project 40/42
Chapter 6
Conclusion and Implications

8/12/2019 Mk Project
http://slidepdf.com/reader/full/mk-project 41/42
Conclusion
The main objective of the study was to test the relationship between risk and return in the Indian
stock markets by applying the Market Index Model. Variability in the market and non market
factors is necessarily absorbed by the market index. Consequently, stocks return exhibit
corresponding response to market movement. Efficient capital market enables investors to earn
higher return for higher risk. In the study, results so obtained are consistent with the effectivecapital market theory and thereby proves the usefulness of market index model in pricing the
risky securities.
The significant correlation coefficient between market risk and expected return exhibits a linear
and positive relationship. Stocks with high beta values have given higher return to the investors.
Similar is the case with portfolio market risk and expected return.
In conclusion, it can be said that Indian stock market has offered increasing return to those
investors who have invested in high risk portfolios. This tendency validates the efficient market
theory in the Indian stock market. Thus, it can be clearly stated that market index model is
applicable in Indian stock market.
8/12/2019 Mk Project
http://slidepdf.com/reader/full/mk-project 42/42
Implications
The study has wide ranging implications to the investors and policy makers. Risk and return
quantify the attractiveness of capital market. An efficient capital market deters to earn abnormal
profit because of having additional information, and other speculative activities. The positive
relationship between portfolio risk and return validates the efficient market hypothesis in the
Indian stock market. Investors being risk evades, demand high return for high risk.
There are basically 3 classes of investors:
Highly risk evaders:they are mainly interested in regular income instead of capital appreciation
of their investment. They should prefer portfolio with low market risk.
High risk takers: they are mainly interested in capital appreciation of their investment and should
prefer a portfolio with high market risk.
Moderate risk takers: they are invariably interested in both regul;ar income and capital
appreciation of their investment and should prefer a portfolio with moderate market risk.