MECHANIK NR 10/2017 Analysis of mathematical models for ... · 3. Oczoś K.E. „Kształtowanie...
4
MECHANIK NR 10/2017 Analysis of mathematical models for turning the titanium alloy WT3-1 Analiza modeli matematycznych procesu toczenia tytanu WT3-1 JÓZEF ZAWORA RAFAŁ ŚWIERCZ MIECZYSŁAW MARCINIAK LUCJAN DĄBROWSKI* DOI: https://doi.org/10.17814/mechanik.2017.10.128 Mathematical models for longitudinal turning process of the titanium alloy WT3-1 were presented in this paper, both in the exponential and the polynomial form. The experimental design and the multiple stepwise regression analysis were used to develop the mathematical models. KEYWORDS: turning of titanium alloys, experiment- based mathematical models, statistical estimation Titanium and its alloys are hard-to-cut materials. Due to their unique properties, they are increasingly being used in modern aerospace, chemical, naval, and medical applications. In terms of design and manufacturing, they are characterized by: ● high specific strength, ● good strength at elevated temperatures, ● high chemical affinity with materials applied to cutting tool blades, ● tendency to adhere to particles when machining, ● some titanium alloys are heat hardened. Works on new titanium alloys and improvement of manufacturing processes [1-4], including through optimization, are still ongoing [6, 7]. Experimental mathematical models of the output quantities of these processes are needed to optimize the manufacturing processes. In the article, experimental mathematical models were investigated on the titanium WT3-1 turning process. Experimental design Experimental studies were carried out according to the experimental design technique [5]. A five-level experiment plan for three independent variables (v c , f, a p ) and number of experiments N = 20 (Table) were adopted. The following ranges of independent variables were defined: ● v c ∈ <10.0÷40.0> m/min – for the cutting speed, ● f ∈ < 0.05÷03> mm/rev – for feedrate, ● a p ∈ < 1.0÷2.5> mm – for the depth of cut. ___________ * Dr hab. inż. Józef Zawora ([email protected]), dr inż. Rafał Świercz ([email protected]), prof. ndzw. dr hab. inż. Mieczysław Marciniak ([email protected]), prof. ndzw. dr hab. inż. Lucjan Dąbrowski ([email protected]) – Politechnika Warszawska The following dependent variables were used: T – tool edge life in min, R z - roughness parameter in μm, according to the DIN standard, F c - cutting force in N, F f – feed force in N, F n - normal force in N, k c - specific cutting force in N/mm 2 , P c - cutting power in kW, Q v – material removal rate in mm 3 /s. Tests using titanium WT3-1 with a diameter of Ф80 mm and length L = 450 mm were performed. Titanium mechanical properties - according to the certificate; tensile strength R m = 1100 MPa, elongation A 5 = 13%, hardness - 350 HB. TABLE. Plan of the experiment The test stand was arranged on a toolmaker’s lathe. HR171.26-2525.1 was used with H20 tungsten carbide inserts of TNMG160308 type with a rounding radius of the main cutting edge r n = 0.02 mm. Wear criterion for the flank face VB B = 0.3 mm. The wear of the edge VB B was measured on a Zeiss microscope. The R z (DIN) parameter was measured by the light cross section method. Components of cutting forces were measured with a strain gauge, accurate time t – with a timer. i - 1, 2, 3, ...; N - number of experience; j = T, R z , F c , F f , F n , k c , P c , Q v - dependent variables; ρ = 1.682 - the arm of the star radius.
Transcript of MECHANIK NR 10/2017 Analysis of mathematical models for ... · 3. Oczoś K.E. „Kształtowanie...

MECHANIK NR 10/2017
Analysis of mathematical models for turning the titanium alloy WT3-1
Analiza modeli matematycznych procesu toczenia tytanu WT3-1
JÓZEF ZAWORA RAFAŁ ŚWIERCZ MIECZYSŁAW MARCINIAK LUCJAN DĄBROWSKI* DOI: https://doi.org/10.17814/mechanik.2017.10.128
Mathematical models for longitudinal turning process of the titanium alloy WT3-1 were presented in this paper, both in the exponential and the polynomial form. The experimental design and the multiple stepwise regression analysis were used to develop the mathematical models. KEYWORDS: turning of titanium alloys, experiment-based mathematical models, statistical estimation
Titanium and its alloys are hard-to-cut materials. Due to their unique properties, they are increasingly being used in modern aerospace, chemical, naval, and medical applications. In terms of design and manufacturing, they are characterized by: ● high specific strength, ● good strength at elevated temperatures, ● high chemical affinity with materials applied to cutting
tool blades, ● tendency to adhere to particles when machining, ● some titanium alloys are heat hardened.
Works on new titanium alloys and improvement of manufacturing processes [1-4], including through optimization, are still ongoing [6, 7]. Experimental mathematical models of the output quantities of these processes are needed to optimize the manufacturing processes. In the article, experimental mathematical models were investigated on the titanium WT3-1 turning process.
Experimental design Experimental studies were carried out according to the
experimental design technique [5]. A five-level experiment plan for three independent variables (vc, f, ap) and number of experiments N = 20 (Table) were adopted. The following ranges of independent variables were defined: ● vc ∈ <10.0÷40.0> m/min – for the cutting speed,
● f ∈ < 0.05÷03> mm/rev – for feedrate,
● ap ∈ < 1.0÷2.5> mm – for the depth of cut.
___________ * Dr hab. inż. Józef Zawora ([email protected]), dr inż. Rafał Świercz ([email protected]), prof. ndzw. dr hab. inż. Mieczysław Marciniak ([email protected]), prof. ndzw. dr hab. inż. Lucjan Dąbrowski ([email protected]) – Politechnika Warszawska
The following dependent variables were used: T – tool edge life in min, Rz - roughness parameter in μm, according to the DIN standard, Fc - cutting force in N, Ff – feed force in N, Fn - normal force in N, kc - specific cutting force in N/mm2, Pc - cutting power in kW, Qv – material removal rate in mm3/s.
Tests using titanium WT3-1 with a diameter of Ф80 mm and length L = 450 mm were performed. Titanium mechanical properties - according to the certificate; tensile strength Rm = 1100 MPa, elongation A5 = 13%, hardness - 350 HB.
TABLE. Plan of the experiment
The test stand was arranged on a toolmaker’s lathe. HR171.26-2525.1 was used with H20 tungsten carbide inserts of TNMG160308 type with a rounding radius of the main cutting edge rn = 0.02 mm. Wear criterion for the flank face VBB = 0.3 mm. The wear of the edge VBB was measured on a Zeiss microscope. The Rz (DIN) parameter was measured by the light cross section method. Components of cutting forces were measured with a strain gauge, accurate time t – with a timer.
i - 1, 2, 3, ...; N - number of experience; j = T, Rz, Fc, Ff, Fn, kc, Pc, Qv - dependent variables; ρ = 1.682 - the arm of the star radius.
+ MECHANIK NR 10/2017
The VBB blade wear and Rz (DIN) roughness measurements were performed at time interval t as well as the remaining output quantities. It is known that the output quantities depend on the machining time t. Time is also an input variable. In order to introduce it as an input variable, it would be necessary to significantly increase the number of experiments in the experimental plan, which entails significant costs. Consequently, to reduce the cost of testing, time t was not included in the experimental plan, and it was assumed that the experimental mathematical model of the process would represent the average values of output quantities from the cutting edge tool life, apart from the tool life. The effect of time on these output values is taken into account with dimensionless characteristics. The tool edge wear is calculated from the t/T characteristic. The change in the actual output quantities of the turning process ranges between a few and a dozen percent of the mean value. These characteristics are presented in the references [7].
Three types of experimental mathematical models were investigated which were calculated using IBM's standard multiple regression program. These types are represented by the best regression equations that were obtained through statistical tests. The following types (models) were designated: ● exponential (model 1), ● second-order polynomial, defined in logarithmic space
(model 2), ● second-order polynomial (model 3).
Exponential mathematical model of the titanium turning process (model 1)
The exponential experimental model of the titanium
turning process was defined in the traditional form of the product of the constant value and the cutting parameters vc, f, ap raised to the powers defined by the determined values of the exponents. The regression equations were as follows:
Mathematical polynomial model – second-order defined in logarithmic space (model 2)
Mathematical model of the second-order polynomial
was determined in the logarithmic space:
Mathematical model of titanium turning process – second-order polynomial (model 3)
Regression equations of the second-order polynomial
model are as follows:
Analysis of mathematical models The basis for the experientially determined
mathematical models of the titanium turning process is set in Table II of the Fischer-Snedecor set of values, i.e. the F/Fkr ratio, by which the significance of the regression equations in all types of models for the individual output variables of the process was tested, where: ● F - calculated value of Fischer-Snedecor F function, ● Fkr (α, N-K-1, K) - critical F function value, ● α - accepted value of significance level of the
regression function, ● K - number of degrees for freedom of the counter [5]
equal to the number of regression coefficients in a given equation,
● N-K-1 - number of degrees for freedom of the denominator [5], where: N - number of experiment experiments. Table III summarizes the values of the multiple
correlation coefficients R for the selected best regression functions of the individual output quantities of the analyzed mathematical models. Criteria for selecting the
MECHANIK NR 10/2017
best regression function in each model were to obtain at the assumed significance level a < 0.05: ● Fischer-Snedecor F/Fkr ≥ 1 of the possible set of
regression functions, ● the greatest possible values for the set of t-Student
functions (Student's t-test was used for examining the significance of individual regression coefficients) for the individual coefficients of a given regression equation, which may indicate the physical impact of a given parameter on the output quantity of the process,
● as high as possible the multiple correlation coefficient R, and taking into account, where possible, the physical
meaning of the process parameters that are represented by the correlation coefficients.
The method of attaching independent variables was used to find the best regression function.
TABLE II. Fischer-Snedecor test values for three types of mathematical models - F/Fkr (α, N-K-1, K)
TABLE III. Values of multiple correlation coefficients R for three types of mathematical models
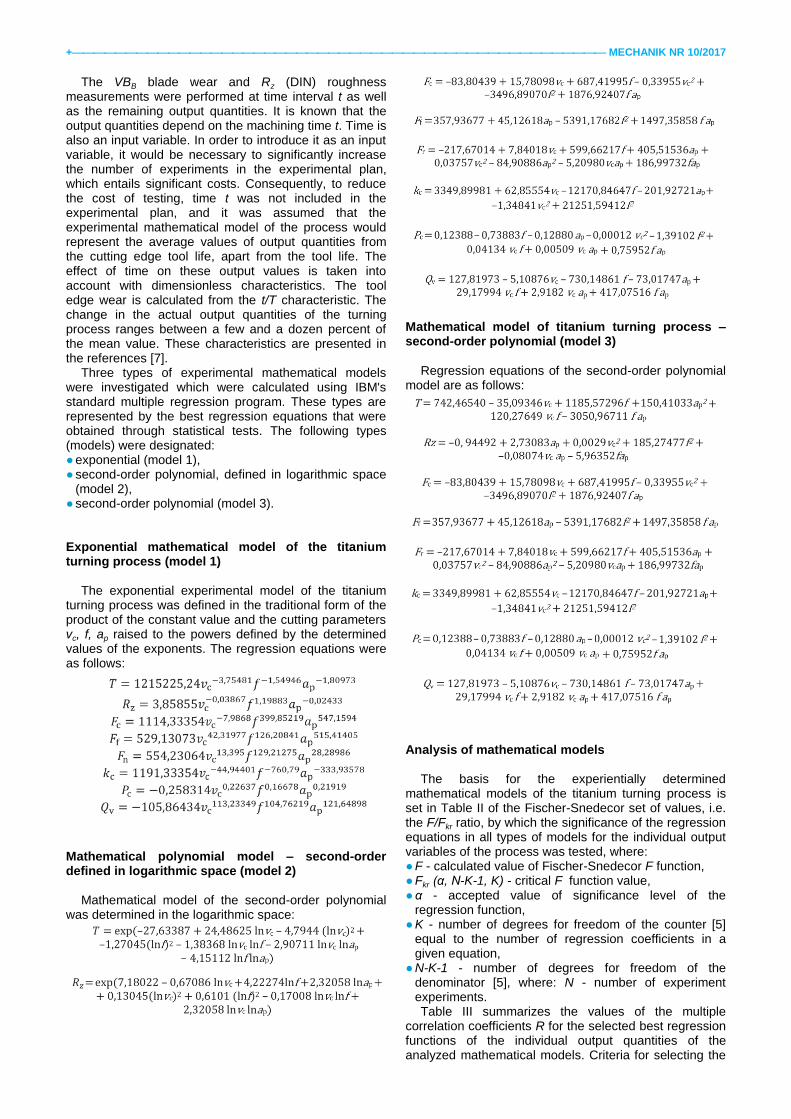
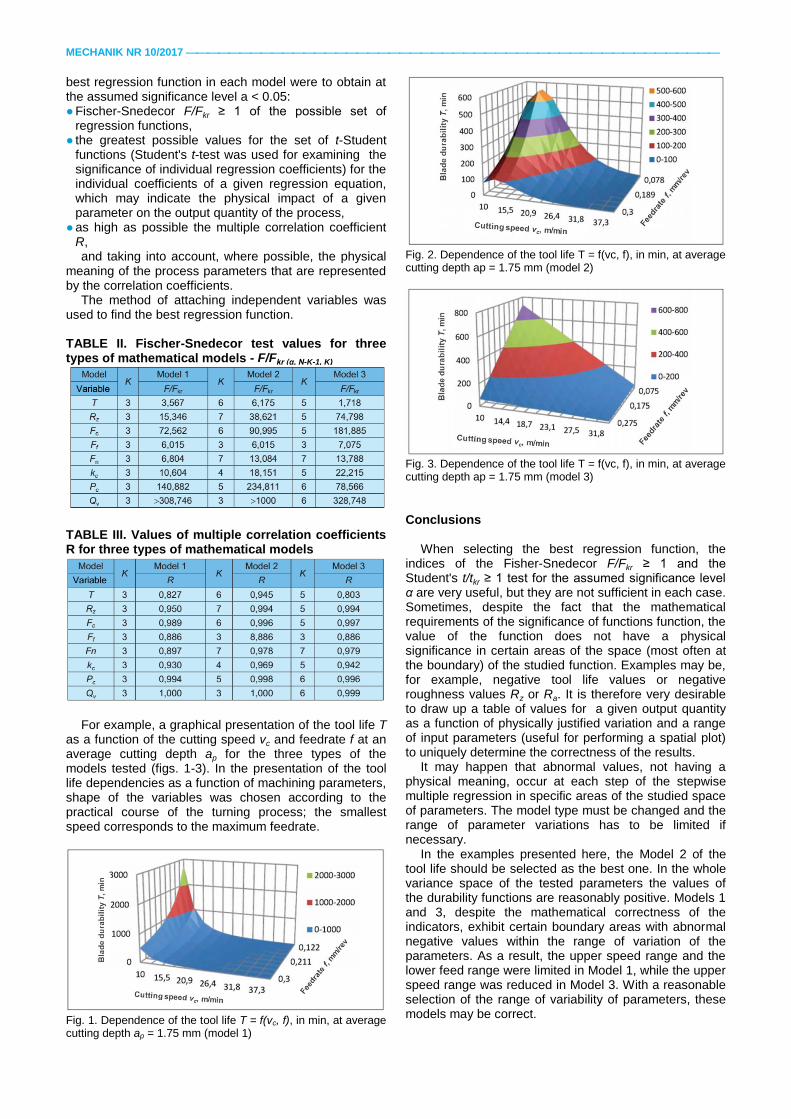
For example, a graphical presentation of the tool life T
as a function of the cutting speed vc and feedrate f at an average cutting depth ap for the three types of the models tested (figs. 1-3). In the presentation of the tool life dependencies as a function of machining parameters, shape of the variables was chosen according to the practical course of the turning process; the smallest speed corresponds to the maximum feedrate.
Fig. 1. Dependence of the tool life T = f(vc, f), in min, at average cutting depth ap = 1.75 mm (model 1)
Fig. 2. Dependence of the tool life T = f(vc, f), in min, at average cutting depth ap = 1.75 mm (model 2)
Fig. 3. Dependence of the tool life T = f(vc, f), in min, at average cutting depth ap = 1.75 mm (model 3)
Conclusions
When selecting the best regression function, the indices of the Fisher-Snedecor F/Fkr ≥ 1 and the Student's t/tkr ≥ 1 test for the assumed significance level α are very useful, but they are not sufficient in each case. Sometimes, despite the fact that the mathematical requirements of the significance of functions function, the value of the function does not have a physical significance in certain areas of the space (most often at the boundary) of the studied function. Examples may be, for example, negative tool life values or negative roughness values Rz or Ra. It is therefore very desirable to draw up a table of values for a given output quantity as a function of physically justified variation and a range of input parameters (useful for performing a spatial plot) to uniquely determine the correctness of the results.
It may happen that abnormal values, not having a physical meaning, occur at each step of the stepwise multiple regression in specific areas of the studied space of parameters. The model type must be changed and the range of parameter variations has to be limited if necessary.
In the examples presented here, the Model 2 of the tool life should be selected as the best one. In the whole variance space of the tested parameters the values of the durability functions are reasonably positive. Models 1 and 3, despite the mathematical correctness of the indicators, exhibit certain boundary areas with abnormal negative values within the range of variation of the parameters. As a result, the upper speed range and the lower feed range were limited in Model 1, while the upper speed range was reduced in Model 3. With a reasonable selection of the range of variability of parameters, these models may be correct.

+ MECHANIK NR 10/2017
REFERENCES
1. Laskowski P., Habrat W., Krupa K., Sieniawski J. „Toczenie wykończeniowe stopu tytanu Ti-Al-4V z zastosowaniem HCP”. Stal, Metale i Nowe Technologie. 11–12 (2013): pages 56–62.
2. Małecka J. „Stopy tytanu na osnowie faz międzymetalicznych TiAl(g) i Ti3Al(α2)”. Mechanik. 10 (2013): pages 888–890.
3. Oczoś K.E. „Kształtowanie ubytkowe tytanu i jego stopów w przemyśle lotniczym i technice medycznej – część I”. Mechanik. 9 (2008): pages 888–890.
4. Oczoś K.E., „Kształtowanie ubytkowe tytanu i jego stopów w przemyśle lotniczym i technice medycznej – część II”. Mechanik. 10 (2008): pages 753–756.
5. Mańczak K. „Technika planowania eksperymentu”. Warszawa: WNT 1976.
6. Pogorzelski W. „Teoria systemów i metody optymalizacji”. Warszawa: OWPW, 1996.
7. Zawora J. „Optymalizacja wielokryterialna procesu toczenia tytanu”. Mechanik. 9 (2016): pages. 1432–1433. ■