
ORIGINAL PAPERS - advances.umed.wroc.pl · Jowita Woźniak 1, Alicja Kędzia , Krzysztof Dudek2...
17
Jowita Woźniak 1 , Alicja Kędzia 1 , Krzysztof Dudek 2 Mathematical Models of Brachial Plexus Development During the Fetal Period: Clinical Aspects Matematyczne modele wzrastania splotu ramiennego w okresie prenatalnym w aspekcie klinicznym 1 Department of Anatomy, Wroclaw Medical University, Wrocław, Poland 2 Institute of Machine Design and Operation, Wrocław Technical University, Wrocław, Poland Abstract Background. The brachial plexus is an important anatomical structure. It can be damaged in both the perinatal and postnatal periods as a result of injury. The available literature does not provide much discussion of the development of the brachial plexus in human fetuses. Objectives. The goal of the study was a mathematical analysis of fetal brachial plexus growth and geometry. Material and Methods. The study examined 220 human brachial plexuses, derived from 110 fetuses (including 50 females – 45.45%) aged 14–32 weeks of fetal life, with a crown-rump length (CRL) ranging from 80 to 233 mm. Anthropological methods, preparation, digital image acquisition, the Image J measurement tool, the Scion Image for Windows program and statistical methods were applied. In each fetus, somatic as well as linear parameters were observed: lengths, diameters and distances between the nerves making up the brachial plexus geometry. Results. In the majority of the linear parameters analyzed, no sexual dimorphism or asymmetry were observed. The following asymmetries and sexual dimorphisms appear to be significant from the clinical point of view: asym- metry in the length of the C 7 and Th 1 nerve left radix, asymmetry in the diameters of the musculocutaneous nerve on the left and the median and ulnar nerves on the right; as well as an increased distance between nerves roots in female fetuses. The weekly growth of individual parts of the plexus varied, as did the correlation ratios among them. The most rapid growth was observed between the 14 th and 18 th weeks, and the slowest between the 24 th and 28 th weeks. Four formulae were used in the mathematical growth model: linear regression, logarithmic function, the von Bertalanffy growth model and the Gompertz curve. Conclusions. The prenatal development of the brachial plexus is not constant. The applied mathematical functions proved useful in describing its growth rate (Adv Clin Exp Med 2012, 2, 151–167). Key words: brachial plexus, anatomy, mathematical models, growth, human fetus. Streszczenie Wprowadzenie. Splot ramienny jest ważną strukturą anatomiczną. Do jego uszkodzeń dochodzi w okresie oko- łoporodowym, jak również w okresie postnatalnym – w wyniku urazów. W dostępnej literaturze prace badające rozwój splotu ramiennego u płodów ludzkich są nieliczne. Cel pracy. Matematyczna analiza geometrii oraz wzrastania splotu ramiennego płodów ludzkich. Materiał i metody. Zbadano 220 splotów ramiennych pochodzących od 110 płodów w wieku 14–32 tygodni życia płodowego, w tym 50 (45,45%) płci żeńskiej, w przedziale v-tub: 80–233 mm. W pracy zastosowano metody: pre- paracyjną, antropologiczną, cyfrową akwizycję obrazów, komputerowe systemy przetwarzania obrazu Image J oraz Scion Image for Windows, a także metody statystyczne. Dla każdego płodu zbadano parametry somatyczne, a także 54 parametry liniowe: długości, średnice i odległości między nerwami, charakteryzujące geometrię splotu ramien- nego. Wyniki. W większości analizowanych parametrów liniowych nie zaobserwowano dymorfizmu płciowego ani asymetrii. Z klinicznego punktu widzenia istotne wydaje się występowanie asymetrii długości lewego korzenia nerwu C 7 i Th 1 czy też średnic nerwów: mięśniowo-skórnego po stronie lewej, pośrodkowego i łokciowego po prawej oraz dymorfizmu płciowego: zwiększonej odległości między korzeniami nerwów rdzeniowych u płodów płci żeńskiej. Przyrosty tygodniowe poszczególnych części splotu były zróżnicowane, podobnie jak współczynniki korelacji między zmiennymi. Najszybszy wzrost obserwowano w 14.–18. tygodniu, wolniejszy w 24.–28. tygodniu. Adv Clin Exp Med 2012, 21, 2, 151–167 ISSN 1899–5276 ORIGINAL PAPERS © Copyright by Wroclaw Medical University
Transcript of ORIGINAL PAPERS - advances.umed.wroc.pl · Jowita Woźniak 1, Alicja Kędzia , Krzysztof Dudek2...
Jowita Woźniak1, Alicja Kędzia1, Krzysztof Dudek2
Mathematical Models of Brachial Plexus Development During the Fetal Period: Clinical AspectsMatematyczne modele wzrastania splotu ramiennego w okresie prenatalnym w aspekcie klinicznym1 Department of Anatomy, Wroclaw Medical University, Wrocław, Poland 2 Institute of Machine Design and Operation, Wrocław Technical University, Wrocław, Poland
AbstractBackground. The brachial plexus is an important anatomical structure. It can be damaged in both the perinatal and postnatal periods as a result of injury. The available literature does not provide much discussion of the development of the brachial plexus in human fetuses.Objectives. The goal of the study was a mathematical analysis of fetal brachial plexus growth and geometry.Material and Methods. The study examined 220 human brachial plexuses, derived from 110 fetuses (including 50 females – 45.45%) aged 14–32 weeks of fetal life, with a crown-rump length (CRL) ranging from 80 to 233 mm. Anthropological methods, preparation, digital image acquisition, the Image J measurement tool, the Scion Image for Windows program and statistical methods were applied. In each fetus, somatic as well as linear parameters were observed: lengths, diameters and distances between the nerves making up the brachial plexus geometry.Results. In the majority of the linear parameters analyzed, no sexual dimorphism or asymmetry were observed. The following asymmetries and sexual dimorphisms appear to be significant from the clinical point of view: asym-metry in the length of the C7 and Th1 nerve left radix, asymmetry in the diameters of the musculocutaneous nerve on the left and the median and ulnar nerves on the right; as well as an increased distance between nerves roots in female fetuses. The weekly growth of individual parts of the plexus varied, as did the correlation ratios among them. The most rapid growth was observed between the 14th and 18th weeks, and the slowest between the 24th and 28th weeks. Four formulae were used in the mathematical growth model: linear regression, logarithmic function, the von Bertalanffy growth model and the Gompertz curve.Conclusions. The prenatal development of the brachial plexus is not constant. The applied mathematical functions proved useful in describing its growth rate (Adv Clin Exp Med 2012, 2, 151–167).
Key words: brachial plexus, anatomy, mathematical models, growth, human fetus.
StreszczenieWprowadzenie. Splot ramienny jest ważną strukturą anatomiczną. Do jego uszkodzeń dochodzi w okresie oko-łoporodowym, jak również w okresie postnatalnym – w wyniku urazów. W dostępnej literaturze prace badające rozwój splotu ramiennego u płodów ludzkich są nieliczne.Cel pracy. Matematyczna analiza geometrii oraz wzrastania splotu ramiennego płodów ludzkich. Materiał i metody. Zbadano 220 splotów ramiennych pochodzących od 110 płodów w wieku 14–32 tygodni życia płodowego, w tym 50 (45,45%) płci żeńskiej, w przedziale v-tub: 80–233 mm. W pracy zastosowano metody: pre-paracyjną, antropologiczną, cyfrową akwizycję obrazów, komputerowe systemy przetwarzania obrazu Image J oraz Scion Image for Windows, a także metody statystyczne. Dla każdego płodu zbadano parametry somatyczne, a także 54 parametry liniowe: długości, średnice i odległości między nerwami, charakteryzujące geometrię splotu ramien-nego.Wyniki. W większości analizowanych parametrów liniowych nie zaobserwowano dymorfizmu płciowego ani asymetrii. Z klinicznego punktu widzenia istotne wydaje się występowanie asymetrii długości lewego korzenia nerwu C7 i Th1 czy też średnic nerwów: mięśniowo-skórnego po stronie lewej, pośrodkowego i łokciowego po prawej oraz dymorfizmu płciowego: zwiększonej odległości między korzeniami nerwów rdzeniowych u płodów płci żeńskiej. Przyrosty tygodniowe poszczególnych części splotu były zróżnicowane, podobnie jak współczynniki korelacji między zmiennymi. Najszybszy wzrost obserwowano w 14.–18. tygodniu, wolniejszy w 24.–28. tygodniu.
Adv Clin Exp Med 2012, 21, 2, 151–167 ISSN 1899–5276
ORIGINAL PAPERS© Copyright by Wroclaw Medical University
J. Woźniak, A. Kędzia, K. Dudek152
Do matematycznego opisu wzrastania użyto czterech funkcji: regresję liniową, logarytmiczną, von Bertalanffy’ego i Gompertza.Wnioski. Rozwój prenatalny splotu ramiennego jest nierównomierny. Zastosowane funkcje matematyczne okazały się przydatne w opisie tempa wzrostu splotu ramiennego (Adv Clin Exp Med 2012, 21, 2, 151–167).
Słowa kluczowe: splot ramienny, anatomia, modele matematyczne, wzrastanie, płody ludzkie.
The fetal period is an extremely important stage of human development. During the course of differentiation, five cellular groups are distin-guished: epithelial tissue, muscular tissue, nervous tissue with glial cells, blood and connective tissue. Fetus development depends on external and inter-nal factors in the mother-fetus bond.
The available literature presenting surveys of limb and nerve development does not provide much information on the development of the brachial plexus in human fetuses. Barregi et al. [1], Gray and Gardner [2], Lewis [3], Sinohara et al. [4], Woźniak and Bruska [5] and Rodriguez-Niedenführ et al. [6–8] investigated the embryonal period. Autopsy tests on fetal material were carried out by Bareggi et al. [1], Castellana and Kosa [9], Pande and Singh [10], Uysal et al. [11] and by Uzmansel [12].
Lewis [3] described human brachium develop-ment. He observed that differentiation of mesen-chymal stem cells started in about the 4th develop-mental week, and detected medullary continuation in this period. The continuation formed the brachial plexus C4, C5, C6, C7, C8, and Th1, but the contours of only three nerve cords could be found in it. At the level of the brachium, there was a split into ven-tral and dorsal branches. Lewis observed that the dorsal branches constituted a continuation of the posterior cord. Then the nerves passed through the dorsal part of the brachium and terminated at the height of the distal end of the brachial bone – in the brachial muscles forming germs sheath. Around the 5th week (when the embryo’s length amounts to 10.5–11 mm), Lewis noted that the size of the in-ferior cervical nerves seemed enormous, and that the C4 nerve root was not part of the plexus. at this point. The neural lamina formed by five medullary nerves underwent a clear division into ventral and dorsal branches. Lewis observed the formation of cords of the supra- and infrascapular nerves, tho-racic long nerve, musculocutaneous nerve, median nerve and ulnar nerve. In the 6th developmental week (when the embryo’s length is 14–16 mm), Lewis noted the nerves’ migration in the caudal direction. In the 7th week (18–20 mm), posterior inclination of the brachial plexus was prevalent. The plexus was already formed up to the height of the first rib, and the three existing cords could not yet be separated. Shinohara et al. [4] examined up-per limb nerve development in eight human em-bryos (Carnegie stages 13–21, day 32 to 52 of fetal
life). On the 32nd day, C5 – Th1 nerve extensions are formed. On the 33rd day, the nerves united, start-ing brachial plexus formation. The median, radial and ulnar nerves reached the palm level on days 39–40. On the 49th and 50th days (Carnegie stages 20 and 21), brachial plexus exposure was found to be similar to that observed in adults.
Rodriguez-Niedenführ et al. [6–8] examined the embryological development of upper limb vas-cularization and described arterial variants. The material consisted of 112 embryos in develop-mental stages 12 to 23 (crown-rump length [CRL]: 3.5–30 mm). At stage 15, arteries differentiate into subclavicular and axillary arteries; at stage 17, the brachial artery is differentiated; at stage 18 the an-tebrachial artery is differentiated; and at stage 21 it is fully formed.
Uysal et al. [11] carried out one of the few studies of human fetal brachial plexuses. The ma-terial consisted of 200 brachial plexuses aged 13–40 weeks of fetal life. In 13th week, the plexus was found to be completely formed.
Due to the scarcity of studies on the fetal bra-chial plexus, the goal of the present study was to formulate mathematical growth models and to analyze the geometry of the brachial plexus in the human fetus.
Material and MethodsThe material consisted of 220 brachial plex-
uses from 110 fetuses (including 50 females and 60 males) aged 14–32 weeks of fetal life; CRL ranged from 80 to 233 mm. All the material was from the collection of the Department of Anatomy at Wro-claw Medical University (Wrocław, Poland). The fetuses used in the survey did not reveal any fea-tures of post-mortem autolysis or external devel-opmental defects.
Anthropological methods, preparation, digi-tal image acquisition, the Image J measurement tool, the Scion Image for Windows program and statistical methods were used. The anthropological methods entailed assessing fetus age on the basis of CRL and the Scammon-Calkins formula [13]. The combination of classical methods (prepara-tion and anthropological methods) with measure-ment by modern computer systems which had not been used in brachial plexus investigations before

Mathematical Models of Brachial Plexus Development 153
was a sort of novelty. Both the Image J and Scion Image for Windows programs include image-pro-cessing functions enabling repeatable measure-ments to within 0.01 mm. The use of such systems prevented damage to the research material.
In the investigations, somatic and linear parameter measurements (describing brachial plexus geometry) were made. For each fetus, so-matic parameters were measured: crown-rump length (CRL), body total length (vertex to plantare – v-pl), head circumference (HC), thorax circum-ference (TC), shoulder girdle circumference (BC), acromion-to-acromion distance (a-a), biparietal dimension (BPD). Clavicle length (CLA) and hu-merus bone length (HUM) were measured as well. The geometrical parameters of every brachial plex-us were designated.
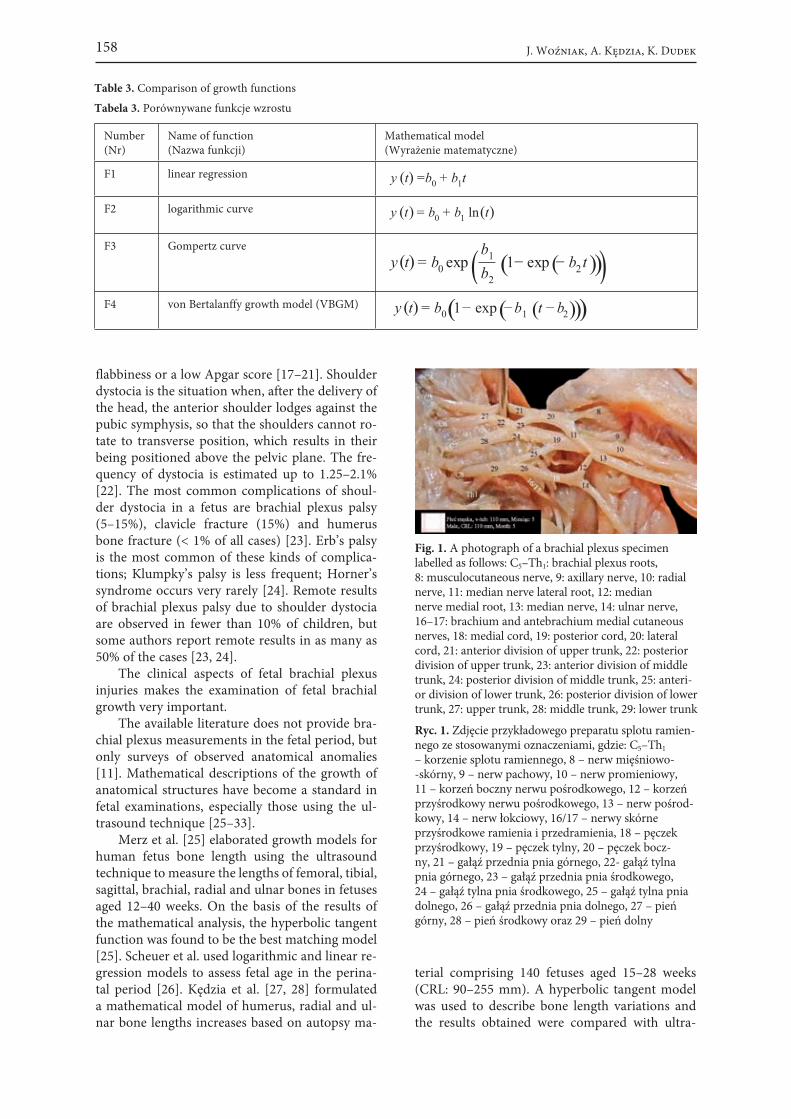
Figure 1 presents the anatomical preparation of a brachial plexus with the features designated. A total of 11,880 measurements were carried out, and 54 linear parameters were marked with the symbols d (diameters), l (lengths) and k (distances). The following bilateral features were examined:
d1: C − 5 nerve root diameter, d2: C − 6 nerve root diameter, d3: C − 7 nerve root diameter, d4: C − 8 nerve root diameter, d5: Th − 1 nerve root diameter, d6: subclavicular artery diameter, −d7: axillary artery diameter, −d8: musculocutaneous nerve diameter, −d9: axillary nerve diameter, −d10: radial nerve diameter, −d11: median nerve lateral root diameter, −d12: median nerve medial root diameter, −d13: median nerve diameter, −d14: ulnar nerve diameter, −d16: brachial medial cutaneous nerve diam- −
eter, d17: antebrachial medial cutaneous nerve −
diameter, d18: medial cord diameter, −d19: posterior cord diameter, −d20: lateral cord diameter, −d21: diameter of the anterior division of the −
upper trunk, d22: diameter of the posterior division of −
the upper trunk, d23: diameter of the anterior division of the −
middle trunk, d24: diameter of the posterior division of −
the middle trunk, d25: diameter of the posterior division of −
the lower trunk, d26: diameter of the anterior division of the −
lower trunk, d27: upper trunk diameter, −
d28: middle trunk diameter and −d29: lower trunk diameter. −
The distances between core nerve roots were assessed:
k1: from C − 5 to C6, k2: from C − 6 to C7, k3: from C − 7 to C8,k4: from C − 8 to Th1, d15: from C − 5 to Th1.
The following lengths were also measured: l1: C − 5 nerve root length, l2: C − 6 nerve root length, l3: C − 7 nerve root length, l4: C − 8 nerve root length, l5: Th − 1nerve root length, l11: median nerve lateral root length, −l12: median nerve medial root length, −l18: medial cord length, −l19: posterior cord length, −l20: lateral cord length, −l21: length of the anterior division of the −
upper trunk, l22: length of the posterior division of the −
upper trunk, l23: length of the anterior division of the −
middle trunk, l24: length of the posterior division of the −
middle trunk, l25: length of the posterior division of the −
lower trunk, l26: length of the anterior division of the −
lower trunk, l27: upper trunk length, −l28: middle trunk length and −l29: lower trunk length. −
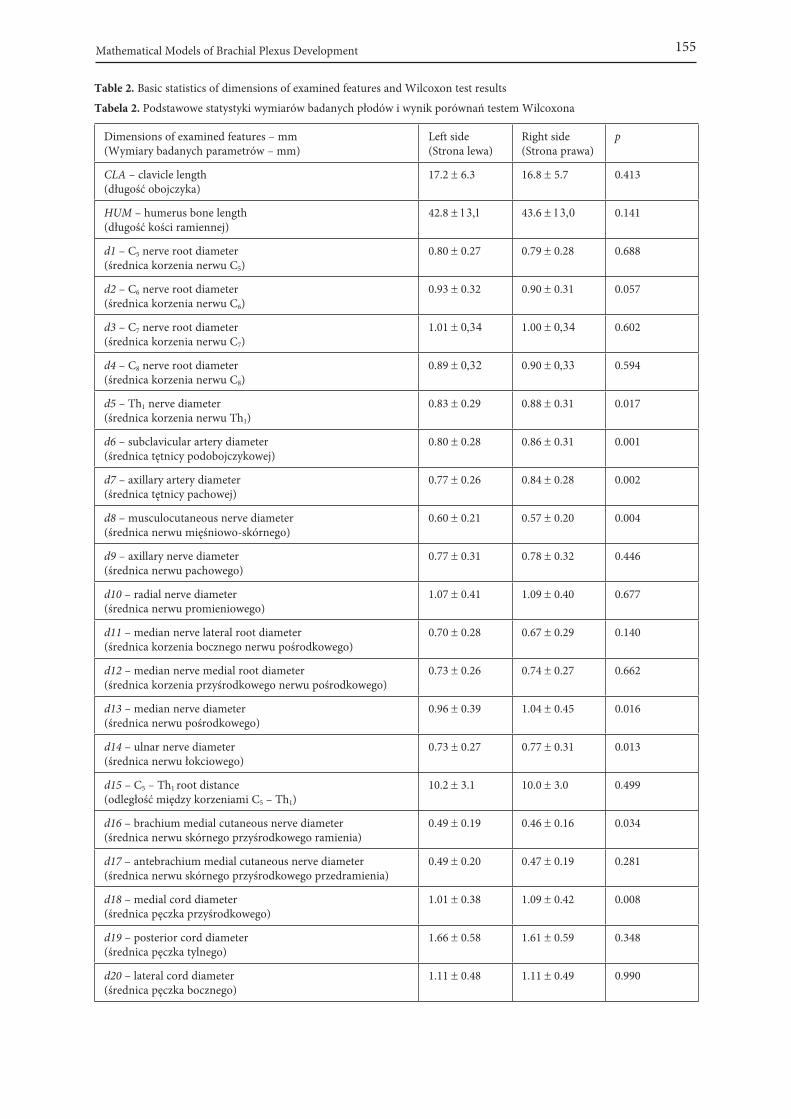
The examined parameters were measured in millimeters. L (left) and R (right) symbols were as-signed to the particular body sides. Symmetry, sex-ual dimorphism and growth rates were analyzed.
ResultsThe basic somatic features of the examined fe-
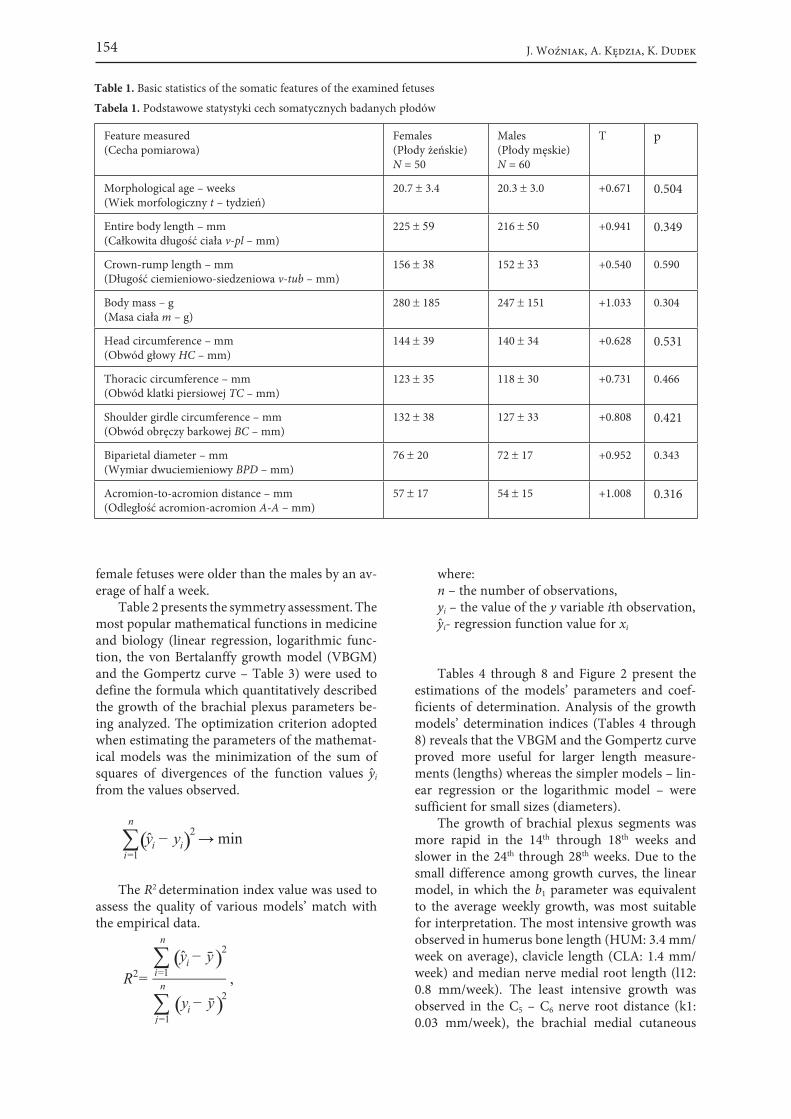
tuses did not differ significantly from normal dis-tribution; this was verified using the Kolmogorov-Smirnov and Shapiro-Wilk test with a significance level of p = 0.05. The average values of male and female fetal features were compared using Stu-dent’s t-test for independent values (Table 1). No sexual dimorphism was observed. No statistically significant difference was observed between male and female fetal brachial plexus geometrical sizes with the exceptions of parameters d15, d22, k1, k4, l1, l26 and l29. On the average, the sizes were larger in female fetuses, which may be related to the significantly larger humerus bone (HUM); the
J. Woźniak, A. Kędzia, K. Dudek154
female fetuses were older than the males by an av-erage of half a week.
Table 2 presents the symmetry assessment. The most popular mathematical functions in medicine and biology (linear regression, logarithmic func-tion, the von Bertalanffy growth model (VBGM) and the Gompertz curve – Table 3) were used to define the formula which quantitatively described the growth of the brachial plexus parameters be-ing analyzed. The optimization criterion adopted when estimating the parameters of the mathemat-ical models was the minimization of the sum of squares of divergences of the function values yi from the values observed.
∑i=1
n
(yi − yi)2 → min
The R2 determination index value was used to assess the quality of various models’ match with the empirical data.
R2=∑i=1
n
(yi − y)2
∑j=1
n
(yi − y)2,
where:n – the number of observations,yi – the value of the y variable ith observation, yi- regression function value for xi
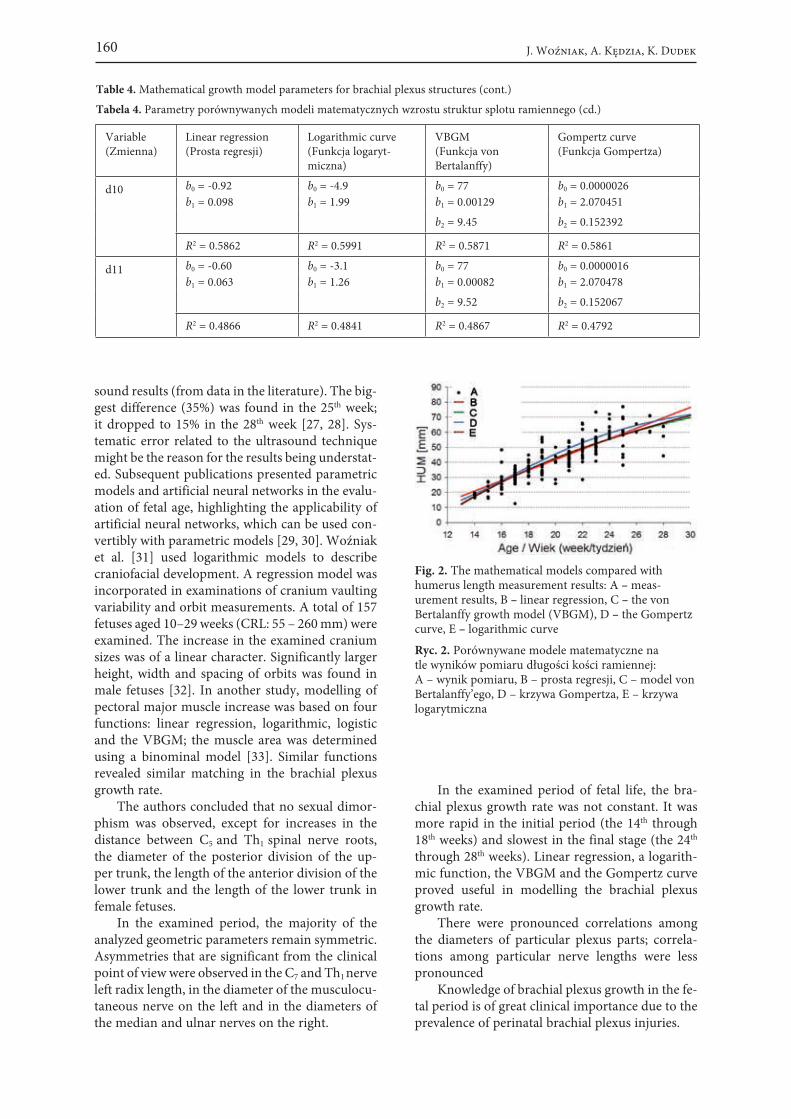
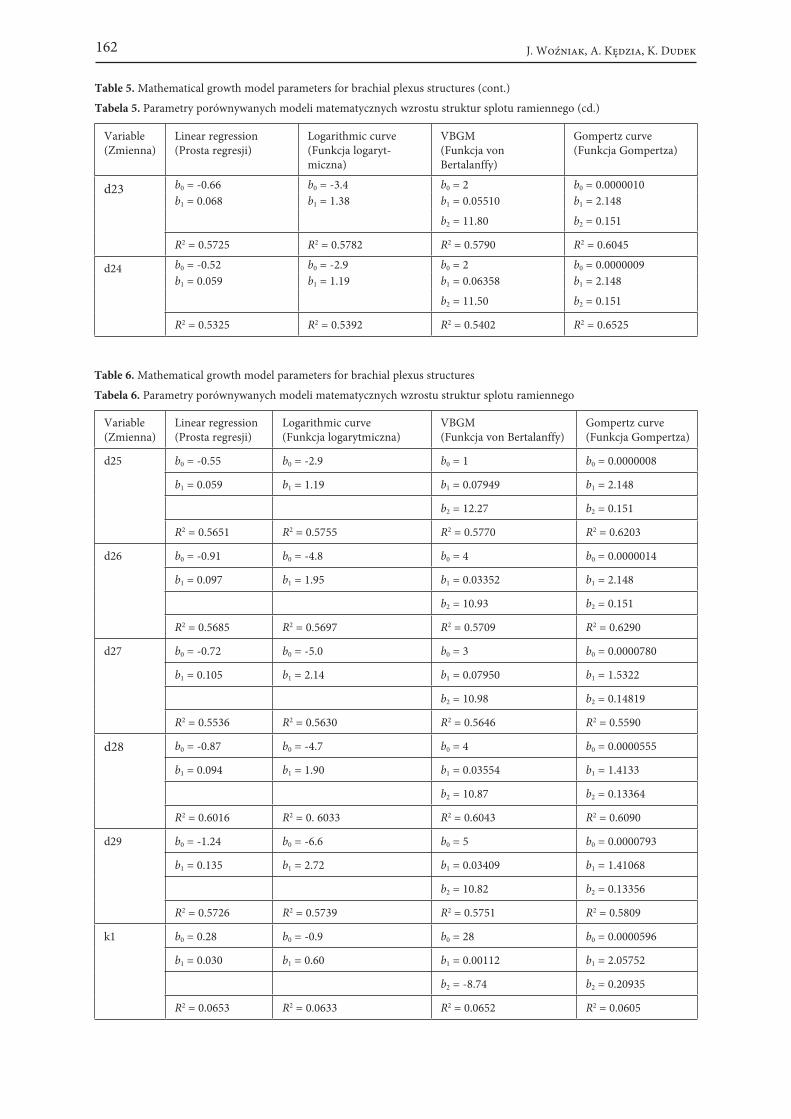
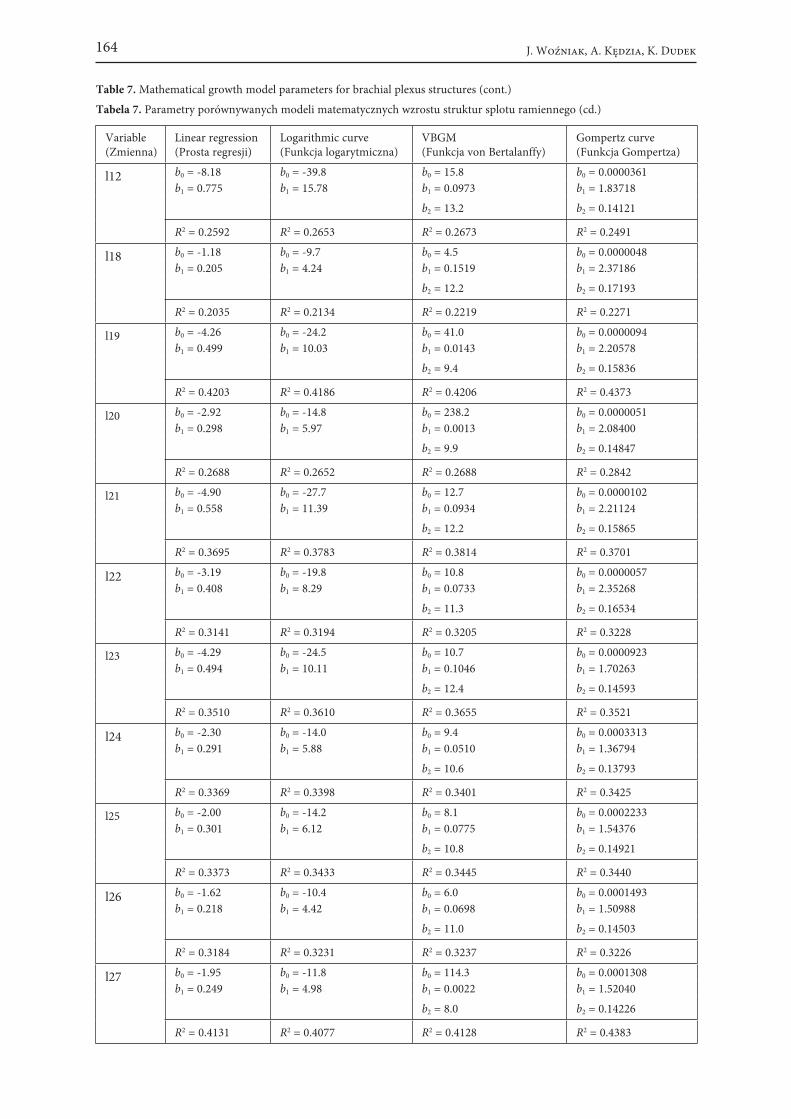
Tables 4 through 8 and Figure 2 present the estimations of the models’ parameters and coef-ficients of determination. Analysis of the growth models’ determination indices (Tables 4 through 8) reveals that the VBGM and the Gompertz curve proved more useful for larger length measure-ments (lengths) whereas the simpler models – lin-ear regression or the logarithmic model – were sufficient for small sizes (diameters).
The growth of brachial plexus segments was more rapid in the 14th through 18th weeks and slower in the 24th through 28th weeks. Due to the small difference among growth curves, the linear model, in which the b1 parameter was equivalent to the average weekly growth, was most suitable for interpretation. The most intensive growth was observed in humerus bone length (HUM: 3.4 mm/week on average), clavicle length (CLA: 1.4 mm/week) and median nerve medial root length (l12: 0.8 mm/week). The least intensive growth was observed in the C5 – C6 nerve root distance (k1: 0.03 mm/week), the brachial medial cutaneous
Table 1. Basic statistics of the somatic features of the examined fetuses
Tabela 1. Podstawowe statystyki cech somatycznych badanych płodów
Feature measured (Cecha pomiarowa)
Females(Płody żeńskie)N = 50
Males (Płody męskie)N = 60
T p
Morphological age – weeks (Wiek morfologiczny t – tydzień)
20.7 ± 3.4 20.3 ± 3.0 +0.671 0.504
Entire body length – mm(Całkowita długość ciała v-pl – mm)
225 ± 59 216 ± 50 +0.941 0.349
Crown-rump length – mm (Długość ciemieniowo-siedzeniowa v-tub – mm)
156 ± 38 152 ± 33 +0.540 0.590
Body mass – g (Masa ciała m – g)
280 ± 185 247 ± 151 +1.033 0.304
Head circumference – mm (Obwód głowy HC – mm)
144 ± 39 140 ± 34 +0.628 0.531
Thoracic circumference – mm (Obwód klatki piersiowej TC – mm)
123 ± 35 118 ± 30 +0.731 0.466
Shoulder girdle circumference – mm (Obwód obręczy barkowej BC – mm)
132 ± 38 127 ± 33 +0.808 0.421
Biparietal diameter – mm (Wymiar dwuciemieniowy BPD – mm)
76 ± 20 72 ± 17 +0.952 0.343
Acromion-to-acromion distance – mm (Odległość acromion-acromion A-A – mm)
57 ± 17 54 ± 15 +1.008 0.316
Mathematical Models of Brachial Plexus Development 155
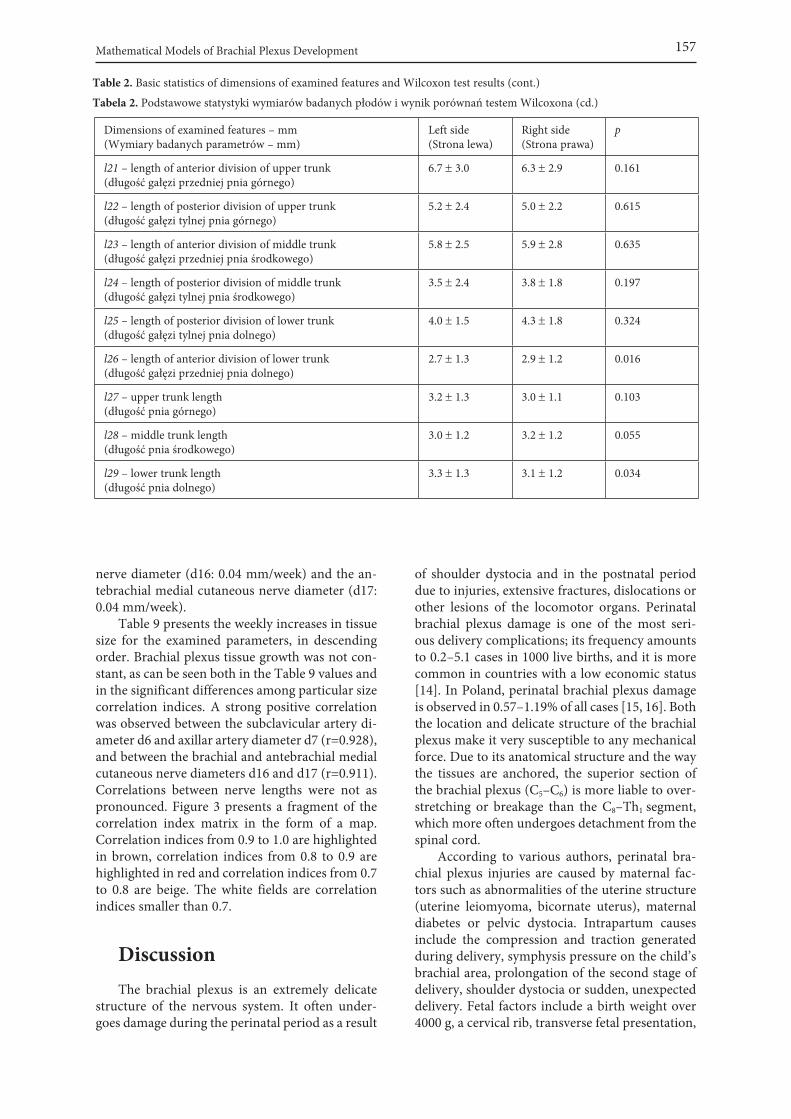
Table 2. Basic statistics of dimensions of examined features and Wilcoxon test results
Tabela 2. Podstawowe statystyki wymiarów badanych płodów i wynik porównań testem Wilcoxona
Dimensions of examined features – mm (Wymiary badanych parametrów – mm)
Left side(Strona lewa)
Right side(Strona prawa)
p
CLA – clavicle length (długość obojczyka)
17.2 ± 6.3 16.8 ± 5.7 0.413
HUM – humerus bone length (długość kości ramiennej)
42.8 ± 13,1 43.6 ± 13,0 0.141
d1 – C5 nerve root diameter(średnica korzenia nerwu C5)
0.80 ± 0.27 0.79 ± 0.28 0.688
d2 – C6 nerve root diameter (średnica korzenia nerwu C6)
0.93 ± 0.32 0.90 ± 0.31 0.057
d3 – C7 nerve root diameter (średnica korzenia nerwu C7)
1.01 ± 0,34 1.00 ± 0,34 0.602
d4 – C8 nerve root diameter (średnica korzenia nerwu C8)
0.89 ± 0,32 0.90 ± 0,33 0.594
d5 – Th1 nerve diameter (średnica korzenia nerwu Th1)
0.83 ± 0.29 0.88 ± 0.31 0.017
d6 – subclavicular artery diameter(średnica tętnicy podobojczykowej)
0.80 ± 0.28 0.86 ± 0.31 0.001
d7 – axillary artery diameter(średnica tętnicy pachowej)
0.77 ± 0.26 0.84 ± 0.28 0.002
d8 – musculocutaneous nerve diameter(średnica nerwu mięśniowo-skórnego)
0.60 ± 0.21 0.57 ± 0.20 0.004
d9 – axillary nerve diameter(średnica nerwu pachowego)
0.77 ± 0.31 0.78 ± 0.32 0.446
d10 – radial nerve diameter(średnica nerwu promieniowego)
1.07 ± 0.41 1.09 ± 0.40 0.677
d11 – median nerve lateral root diameter (średnica korzenia bocznego nerwu pośrodkowego)
0.70 ± 0.28 0.67 ± 0.29 0.140
d12 – median nerve medial root diameter (średnica korzenia przyśrodkowego nerwu pośrodkowego)
0.73 ± 0.26 0.74 ± 0.27 0.662
d13 – median nerve diameter (średnica nerwu pośrodkowego)
0.96 ± 0.39 1.04 ± 0.45 0.016
d14 – ulnar nerve diameter(średnica nerwu łokciowego)
0.73 ± 0.27 0.77 ± 0.31 0.013
d15 – C5 – Th1 root distance (odległość między korzeniami C5 – Th1)
10.2 ± 3.1 10.0 ± 3.0 0.499
d16 – brachium medial cutaneous nerve diameter (średnica nerwu skórnego przyśrodkowego ramienia)
0.49 ± 0.19 0.46 ± 0.16 0.034
d17 – antebrachium medial cutaneous nerve diameter (średnica nerwu skórnego przyśrodkowego przedramienia)
0.49 ± 0.20 0.47 ± 0.19 0.281
d18 – medial cord diameter (średnica pęczka przyśrodkowego)
1.01 ± 0.38 1.09 ± 0.42 0.008
d19 – posterior cord diameter (średnica pęczka tylnego)
1.66 ± 0.58 1.61 ± 0.59 0.348
d20 – lateral cord diameter (średnica pęczka bocznego)
1.11 ± 0.48 1.11 ± 0.49 0.990

J. Woźniak, A. Kędzia, K. Dudek156
Dimensions of examined features – mm (Wymiary badanych parametrów – mm)
Left side(Strona lewa)
Right side(Strona prawa)
p
d21 – diameter of anterior division of upper trunk (średnica gałęzi przedniej pnia górnego)
0.66 ± 0.22 0.64 ± 0.21 0.332
d22 – diameter of posterior division of upper trunk (średnica gałęzi tylnej pnia górnego)
0.90 ± 0.36 0.85 ± 0.34 0.122
d23 – diameter of anterior division of middle trunk (średnica gałęzi przedniej pnia środkowego)
0.72 ± 0.29 0.74 ± 0.28 0.480
d24 – diameter of posterior division of middle trunk (średnica gałęzi tylnej pnia środkowego)
0.70 ± 0.26 0.67 ± 0.26 0.074
d25 – diameter of posterior division of lower trunk (średnica gałęzi tylnej pnia dolnego)
0.66 ± 0.27 0.63 ± 0.23 0.039
d26 – diameter of anterior division of lower trunk (średnica gałęzi przedniej pnia dolnego)
1.01 ± 0.38 1.12 ± 0.43 < 0.001
d27 – upper trunk diameter(średnica pnia górnego)
1.43 ± 0.46 1.42 ± 0.44 0.864
d28 – middle trunk diameter (średnica pnia środkowego)
1.06 ± 0.39 1.06 ± 0.39 0.624
d29 – lower trunk diameter (średnica pnia dolnego)
1.46 ± 0.58 1.56 ± 0.55 0.008
k1 – distance between core nerve roots C5 and C6 (odległość między korzeniami nerwów C5 – C6)
0.83 ± 0.39 0.96 ± 0.35 < 0.001
k2 – distance between core nerve roots C6 – C7 (odległość między korzeniami nerwów C6 – C7)
1.35 ± 0.52 1.39 ± 0.53 0.264
k3 – distance between core nerve roots C7 – C8 (odległość między korzeniami nerwów C7 – C8)
1.11 ± 0.44 1.18 ± 0.48 0.292
k4 – distance between core nerve roots C8 – Th1 (odległość między korzeniami nerwów C8 – Th1)
0.93 ± 0.45 0.96 ± 0.42 0.599
l1 – C5 nerve root length (długość korzenia nerwu C5)
5.1 ± 1.8 5.1 ± 1.6 0.394
l2 – C6 nerve root length (długość korzenia nerwu C6)
3.9 ± 1.4 3.9 ± 1.3 0.827
l3 – C7 nerve root length (długość korzenia nerwu C7)
3.2 ± 1.1 3.0 ± 1.0 0.020
l4 – C8 nerve root length (długość korzenia nerwu C8)
3.7 ± 1.3 3.6 ± 1.3 0.348
l5 – Th1 nerve root length (długość korzenia nerwu Th1)
2.9 ± 1.0 2.8 ± 1.1 0.046
l11 – median nerve lateral root length (długość korzenia bocznego nerwu pośrodkowego)
7.8 ± 4.1 7.4 ± 3.4 0.374
l12 – median nerve medial root length (długość korzenia przyśrodkowego nerwu pośrodkowego)
7.7 ± 5.2 7.6 ± 4.4 0.565
l18 – medial cord lenght(długość pęczka przyśrodkowego)
3.0 ± 1.3 3.1 ± 1.6 0.397
l19 – posterior cord length (długość pęczka tylnego)
5.9 ± 2.4 6.0 ± 2.5 0.829
l20 – lateral cord lenght (długość pęczka bocznego)
2.8 ± 1.5 3.5 ± 2.0 < 0.001
Table 2. Basic statistics of dimensions of examined features and Wilcoxon test results (cont.)
Tabela 2. Podstawowe statystyki wymiarów badanych płodów i wynik porównań testem Wilcoxona (cd.)
Mathematical Models of Brachial Plexus Development 157
nerve diameter (d16: 0.04 mm/week) and the an-tebrachial medial cutaneous nerve diameter (d17: 0.04 mm/week).
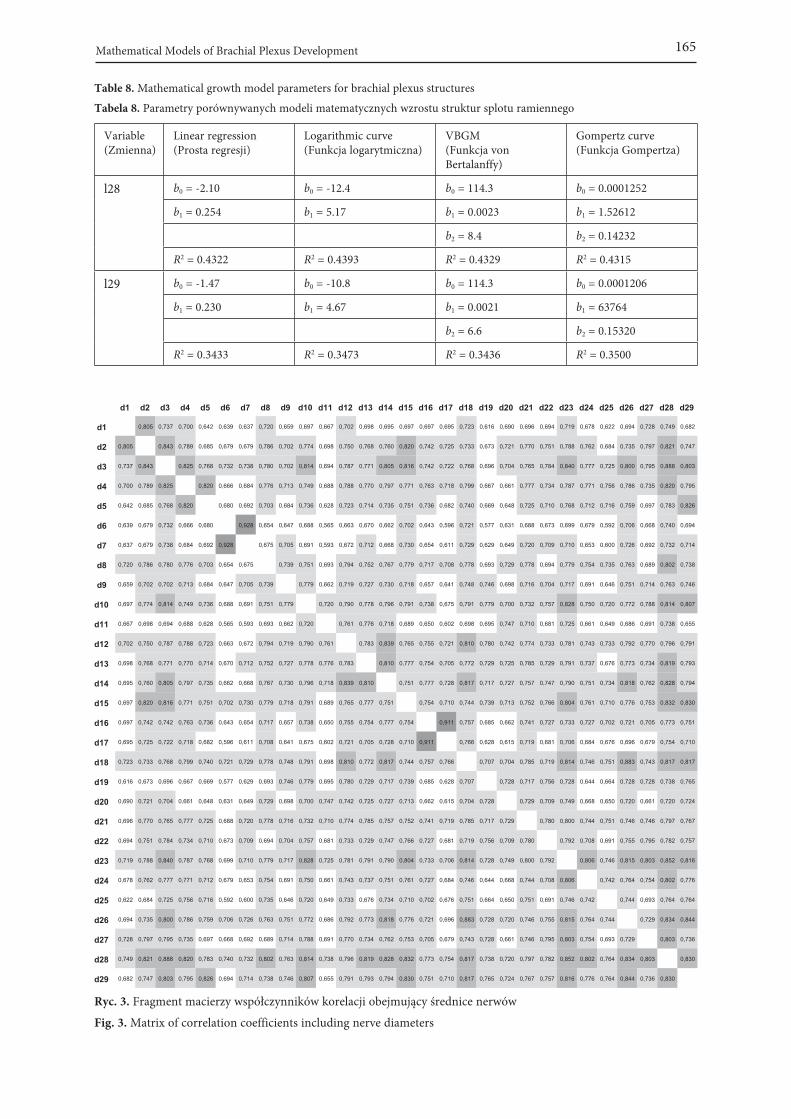
Table 9 presents the weekly increases in tissue size for the examined parameters, in descending order. Brachial plexus tissue growth was not con-stant, as can be seen both in the Table 9 values and in the significant differences among particular size correlation indices. A strong positive correlation was observed between the subclavicular artery di-ameter d6 and axillar artery diameter d7 (r=0.928), and between the brachial and antebrachial medial cutaneous nerve diameters d16 and d17 (r=0.911). Correlations between nerve lengths were not as pronounced. Figure 3 presents a fragment of the correlation index matrix in the form of a map. Correlation indices from 0.9 to 1.0 are highlighted in brown, correlation indices from 0.8 to 0.9 are highlighted in red and correlation indices from 0.7 to 0.8 are beige. The white fields are correlation indices smaller than 0.7.
DiscussionThe brachial plexus is an extremely delicate
structure of the nervous system. It often under-goes damage during the perinatal period as a result
of shoulder dystocia and in the postnatal period due to injuries, extensive fractures, dislocations or other lesions of the locomotor organs. Perinatal brachial plexus damage is one of the most seri-ous delivery complications; its frequency amounts to 0.2–5.1 cases in 1000 live births, and it is more common in countries with a low economic status [14]. In Poland, perinatal brachial plexus damage is observed in 0.57–1.19% of all cases [15, 16]. Both the location and delicate structure of the brachial plexus make it very susceptible to any mechanical force. Due to its anatomical structure and the way the tissues are anchored, the superior section of the brachial plexus (C5–C6) is more liable to over-stretching or breakage than the C8–Th1 segment, which more often undergoes detachment from the spinal cord.
According to various authors, perinatal bra-chial plexus injuries are caused by maternal fac-tors such as abnormalities of the uterine structure (uterine leiomyoma, bicornate uterus), maternal diabetes or pelvic dystocia. Intrapartum causes include the compression and traction generated during delivery, symphysis pressure on the child’s brachial area, prolongation of the second stage of delivery, shoulder dystocia or sudden, unexpected delivery. Fetal factors include a birth weight over 4000 g, a cervical rib, transverse fetal presentation,
Dimensions of examined features – mm (Wymiary badanych parametrów – mm)
Left side(Strona lewa)
Right side(Strona prawa)
p
l21 – length of anterior division of upper trunk(długość gałęzi przedniej pnia górnego)
6.7 ± 3.0 6.3 ± 2.9 0.161
l22 – length of posterior division of upper trunk (długość gałęzi tylnej pnia górnego)
5.2 ± 2.4 5.0 ± 2.2 0.615
l23 – length of anterior division of middle trunk (długość gałęzi przedniej pnia środkowego)
5.8 ± 2.5 5.9 ± 2.8 0.635
l24 – length of posterior division of middle trunk (długość gałęzi tylnej pnia środkowego)
3.5 ± 2.4 3.8 ± 1.8 0.197
l25 – length of posterior division of lower trunk (długość gałęzi tylnej pnia dolnego)
4.0 ± 1.5 4.3 ± 1.8 0.324
l26 – length of anterior division of lower trunk (długość gałęzi przedniej pnia dolnego)
2.7 ± 1.3 2.9 ± 1.2 0.016
l27 – upper trunk length (długość pnia górnego)
3.2 ± 1.3 3.0 ± 1.1 0.103
l28 – middle trunk length (długość pnia środkowego)
3.0 ± 1.2 3.2 ± 1.2 0.055
l29 – lower trunk length (długość pnia dolnego)
3.3 ± 1.3 3.1 ± 1.2 0.034
Table 2. Basic statistics of dimensions of examined features and Wilcoxon test results (cont.)
Tabela 2. Podstawowe statystyki wymiarów badanych płodów i wynik porównań testem Wilcoxona (cd.)
J. Woźniak, A. Kędzia, K. Dudek158
flabbiness or a low Apgar score [17–21]. Shoulder dystocia is the situation when, after the delivery of the head, the anterior shoulder lodges against the pubic symphysis, so that the shoulders cannot ro-tate to transverse position, which results in their being positioned above the pelvic plane. The fre-quency of dystocia is estimated up to 1.25–2.1% [22]. The most common complications of shoul-der dystocia in a fetus are brachial plexus palsy (5–15%), clavicle fracture (15%) and humerus bone fracture (< 1% of all cases) [23]. Erb’s palsy is the most common of these kinds of complica-tions; Klumpky’s palsy is less frequent; Horner’s syndrome occurs very rarely [24]. Remote results of brachial plexus palsy due to shoulder dystocia are observed in fewer than 10% of children, but some authors report remote results in as many as 50% of the cases [23, 24].
The clinical aspects of fetal brachial plexus injuries makes the examination of fetal brachial growth very important.
The available literature does not provide bra-chial plexus measurements in the fetal period, but only surveys of observed anatomical anomalies [11]. Mathematical descriptions of the growth of anatomical structures have become a standard in fetal examinations, especially those using the ul-trasound technique [25–33].
Merz et al. [25] elaborated growth models for human fetus bone length using the ultrasound technique to measure the lengths of femoral, tibial, sagittal, brachial, radial and ulnar bones in fetuses aged 12–40 weeks. On the basis of the results of the mathematical analysis, the hyperbolic tangent function was found to be the best matching model [25]. Scheuer et al. used logarithmic and linear re-gression models to assess fetal age in the perina-tal period [26]. Kędzia et al. [27, 28] formulated a mathematical model of humerus, radial and ul-nar bone lengths increases based on autopsy ma-
terial comprising 140 fetuses aged 15–28 weeks (CRL: 90–255 mm). A hyperbolic tangent model was used to describe bone length variations and the results obtained were compared with ultra-
Table 3. Comparison of growth functions
Tabela 3. Porównywane funkcje wzrostu
Number (Nr)
Name of function (Nazwa funkcji)
Mathematical model (Wyrażenie matematyczne)
F1 linear regression y (t) =b0 + b1t
F2 logarithmic curve y (t)= b0 + b1 ln(t)
F3 Gompertz curve y (t)= b0 exp (b1
b2(1− exp (− b2 t )))
F4 von Bertalanffy growth model (VBGM) y (t)= b0(1− exp(−b1 (t − b2)))
Fig. 1. A photograph of a brachial plexus specimen labelled as follows: C5–Th1: brachial plexus roots, 8: musculocutaneous nerve, 9: axillary nerve, 10: radial nerve, 11: median nerve lateral root, 12: median nerve medial root, 13: median nerve, 14: ulnar nerve, 16–17: brachium and antebrachium medial cutaneous nerves, 18: medial cord, 19: posterior cord, 20: lateral cord, 21: anterior division of upper trunk, 22: posterior division of upper trunk, 23: anterior division of middle trunk, 24: posterior division of middle trunk, 25: anteri-or division of lower trunk, 26: posterior division of lower trunk, 27: upper trunk, 28: middle trunk, 29: lower trunk
Ryc. 1. Zdjęcie przykładowego preparatu splotu ramien-nego ze stosowanymi oznaczeniami, gdzie: C5–Th1 – korzenie splotu ramiennego, 8 – nerw mięśniowo- -skórny, 9 – nerw pachowy, 10 – nerw promieniowy, 11 – korzeń boczny nerwu pośrodkowego, 12 – korzeń przyśrodkowy nerwu pośrodkowego, 13 – nerw pośrod-kowy, 14 – nerw łokciowy, 16/17 – nerwy skórne przyśrodkowe ramienia i przedramienia, 18 – pęczek przyśrodkowy, 19 – pęczek tylny, 20 – pęczek bocz-ny, 21 – gałąź przednia pnia górnego, 22- gałąź tylna pnia górnego, 23 – gałąź przednia pnia środkowego, 24 – gałąź tylna pnia środkowego, 25 – gałąź tylna pnia dolnego, 26 – gałąź przednia pnia dolnego, 27 – pień górny, 28 – pień środkowy oraz 29 – pień dolny
Mathematical Models of Brachial Plexus Development 159
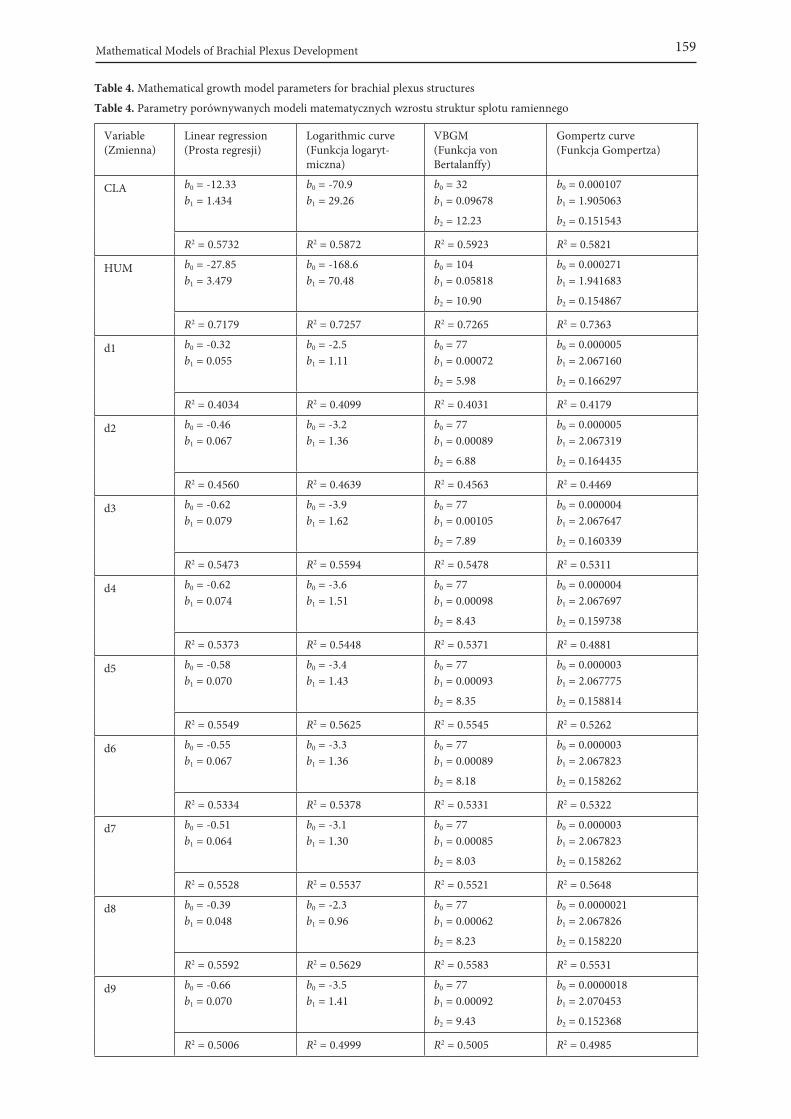
Table 4. Mathematical growth model parameters for brachial plexus structures
Table 4. Parametry porównywanych modeli matematycznych wzrostu struktur splotu ramiennego
Variable (Zmienna)
Linear regression (Prosta regresji)
Logarithmic curve (Funkcja logaryt- miczna)
VBGM (Funkcja von Bertalanffy)
Gompertz curve (Funkcja Gompertza)
CLA b0 = -12.33 b0 = -70.9 b0 = 32 b0 = 0.000107b1 = 1.434 b1 = 29.26 b1 = 0.09678 b1 = 1.905063
b2 = 12.23 b2 = 0.151543
R2 = 0.5732 R2 = 0.5872 R2 = 0.5923 R2 = 0.5821
HUM b0 = -27.85 b0 = -168.6 b0 = 104 b0 = 0.000271b1 = 3.479 b1 = 70.48 b1 = 0.05818 b1 = 1.941683
b2 = 10.90 b2 = 0.154867
R2 = 0.7179 R2 = 0.7257 R2 = 0.7265 R2 = 0.7363
d1 b0 = -0.32 b0 = -2.5 b0 = 77 b0 = 0.000005b1 = 0.055 b1 = 1.11 b1 = 0.00072 b1 = 2.067160
b2 = 5.98 b2 = 0.166297
R2 = 0.4034 R2 = 0.4099 R2 = 0.4031 R2 = 0.4179
d2 b0 = -0.46 b0 = -3.2 b0 = 77 b0 = 0.000005b1 = 0.067 b1 = 1.36 b1 = 0.00089 b1 = 2.067319
b2 = 6.88 b2 = 0.164435
R2 = 0.4560 R2 = 0.4639 R2 = 0.4563 R2 = 0.4469
d3 b0 = -0.62 b0 = -3.9 b0 = 77 b0 = 0.000004b1 = 0.079 b1 = 1.62 b1 = 0.00105 b1 = 2.067647
b2 = 7.89 b2 = 0.160339
R2 = 0.5473 R2 = 0.5594 R2 = 0.5478 R2 = 0.5311
d4 b0 = -0.62 b0 = -3.6 b0 = 77 b0 = 0.000004b1 = 0.074 b1 = 1.51 b1 = 0.00098 b1 = 2.067697
b2 = 8.43 b2 = 0.159738
R2 = 0.5373 R2 = 0.5448 R2 = 0.5371 R2 = 0.4881
d5 b0 = -0.58 b0 = -3.4 b0 = 77 b0 = 0.000003b1 = 0.070 b1 = 1.43 b1 = 0.00093 b1 = 2.067775
b2 = 8.35 b2 = 0.158814
R2 = 0.5549 R2 = 0.5625 R2 = 0.5545 R2 = 0.5262
d6 b0 = -0.55 b0 = -3.3 b0 = 77 b0 = 0.000003b1 = 0.067 b1 = 1.36 b1 = 0.00089 b1 = 2.067823
b2 = 8.18 b2 = 0.158262
R2 = 0.5334 R2 = 0.5378 R2 = 0.5331 R2 = 0.5322
d7 b0 = -0.51 b0 = -3.1 b0 = 77 b0 = 0.000003b1 = 0.064 b1 = 1.30 b1 = 0.00085 b1 = 2.067823
b2 = 8.03 b2 = 0.158262
R2 = 0.5528 R2 = 0.5537 R2 = 0.5521 R2 = 0.5648
d8 b0 = -0.39 b0 = -2.3 b0 = 77 b0 = 0.0000021b1 = 0.048 b1 = 0.96 b1 = 0.00062 b1 = 2.067826
b2 = 8.23 b2 = 0.158220
R2 = 0.5592 R2 = 0.5629 R2 = 0.5583 R2 = 0.5531
d9 b0 = -0.66 b0 = -3.5 b0 = 77 b0 = 0.0000018b1 = 0.070 b1 = 1.41 b1 = 0.00092 b1 = 2.070453
b2 = 9.43 b2 = 0.152368
R2 = 0.5006 R2 = 0.4999 R2 = 0.5005 R2 = 0.4985
J. Woźniak, A. Kędzia, K. Dudek160
Table 4. Mathematical growth model parameters for brachial plexus structures (cont.)
Tabela 4. Parametry porównywanych modeli matematycznych wzrostu struktur splotu ramiennego (cd.)
Variable (Zmienna)
Linear regression (Prosta regresji)
Logarithmic curve (Funkcja logaryt- miczna)
VBGM (Funkcja von Bertalanffy)
Gompertz curve (Funkcja Gompertza)
d10 b0 = -0.92 b0 = -4.9 b0 = 77 b0 = 0.0000026b1 = 0.098 b1 = 1.99 b1 = 0.00129 b1 = 2.070451
b2 = 9.45 b2 = 0.152392
R2 = 0.5862 R2 = 0.5991 R2 = 0.5871 R2 = 0.5861
d11 b0 = -0.60 b0 = -3.1 b0 = 77 b0 = 0.0000016b1 = 0.063 b1 = 1.26 b1 = 0.00082 b1 = 2.070478
b2 = 9.52 b2 = 0.152067
R2 = 0.4866 R2 = 0.4841 R2 = 0.4867 R2 = 0.4792
sound results (from data in the literature). The big-gest difference (35%) was found in the 25th week; it dropped to 15% in the 28th week [27, 28]. Sys-tematic error related to the ultrasound technique might be the reason for the results being understat-ed. Subsequent publications presented parametric models and artificial neural networks in the evalu-ation of fetal age, highlighting the applicability of artificial neural networks, which can be used con-vertibly with parametric models [29, 30]. Woźniak et al. [31] used logarithmic models to describe craniofacial development. A regression model was incorporated in examinations of cranium vaulting variability and orbit measurements. A total of 157 fetuses aged 10–29 weeks (CRL: 55 – 260 mm) were examined. The increase in the examined cranium sizes was of a linear character. Significantly larger height, width and spacing of orbits was found in male fetuses [32]. In another study, modelling of pectoral major muscle increase was based on four functions: linear regression, logarithmic, logistic and the VBGM; the muscle area was determined using a binominal model [33]. Similar functions revealed similar matching in the brachial plexus growth rate.
The authors concluded that no sexual dimor-phism was observed, except for increases in the distance between C5 and Th1 spinal nerve roots, the diameter of the posterior division of the up-per trunk, the length of the anterior division of the lower trunk and the length of the lower trunk in female fetuses.
In the examined period, the majority of the analyzed geometric parameters remain symmetric. Asymmetries that are significant from the clinical point of view were observed in the C7 and Th1 nerve left radix length, in the diameter of the musculocu-taneous nerve on the left and in the diameters of the median and ulnar nerves on the right.
In the examined period of fetal life, the bra-chial plexus growth rate was not constant. It was more rapid in the initial period (the 14th through 18th weeks) and slowest in the final stage (the 24th through 28th weeks). Linear regression, a logarith-mic function, the VBGM and the Gompertz curve proved useful in modelling the brachial plexus growth rate.
There were pronounced correlations among the diameters of particular plexus parts; correla-tions among particular nerve lengths were less pronounced
Knowledge of brachial plexus growth in the fe-tal period is of great clinical importance due to the prevalence of perinatal brachial plexus injuries.
Fig. 2. The mathematical models compared with humerus length measurement results: A – meas-urement results, B – linear regression, C – the von Bertalanffy growth model (VBGM), D – the Gompertz curve, E – logarithmic curve
Ryc. 2. Porównywane modele matematyczne na tle wyników pomiaru długości kości ramiennej: A – wynik pomiaru, B – prosta regresji, C – model von Bertalanffy’ego, D – krzywa Gompertza, E – krzywa logarytmiczna

Mathematical Models of Brachial Plexus Development 161
Table 5. Mathematical growth model parameters for brachial plexus structures
Tabela 5. Parametry porównywanych modeli matematycznych wzrostu struktur splotu ramiennego
Variable (Zmienna)
Linear regression (Prosta regresji)
Logarithmic curve (Funkcja logaryt- miczna)
VBGM (Funkcja von Bertalanffy)
Gompertz curve (Funkcja Gompertza)
d12 b0 = -0.62 b0 = -3.3 b0 = 77 b0 = 0.000016b1 = 0.066 b1 = 1.34 b1 = 0.00087 b1 = 2.070521
b2 = 9.44 b2 = 0.151555
R2 = 0.6355 R2 = 0.6345 R2 = 0.6348 R2 = 0.6489
d13 b0 = -1.05 b0 = -5.0 b0 = 77 b0 = 0.000018b1 = 0.100 b1 = 2.01 b1 = 0.00132 b1 = 2.037869
b2 = 10.51 b2 = 0.145991
R2 = 0.5715 R2 = 0.5657 R2 = 0.5714 R2 = 0.5617
d14 b0 = -0.68 b0 = -3.5 b0 = 77 b0 = 0.000013b1 = 0.070 b1 = 1.41 b1 = 0.00092 b1 = 2.037869
b2 = 9.78 b2 = 0.145991
R2 = 0.5881 R2 = 0.5910 R2 = 0.5880 R2 = 0.6633
d15 b0 = -3.72 b0 = -31.0 b0 = 24 b0 = 0.000176b1 = 0.676 b1 = 13.68 b1 = 0.05040 b1 = 2.403444
b2 = 9.15 b2 = 0.175807
R2 = 0.5084 R2 = 0. 5125 R2 = 0.5124 R2 = 0.5254
d16 b0 = -0.36 b0 = -2.0 b0 = 23 b0 = 0.000008b1 = 0.041 b1 = 0.83 b1 = 0.00183 b1 = 2.403444
b2 = 8.91 b2 = 0.175807
R2 = 0.5178 R2 = 0.5235 R2 = 0.5183 R2 = 0.3348
d17 b0 = -0.38 b0 = -2.1 b0 = 23 b0 = 0.000006b1 = 0.042 b1 = 0.85 b1 = 0.00188 b1 = 2.403471
b2 = 9.10 b2 = 0.171650
R2 = 0.4763 R2 = 0.4811 R2 = 0.4768 R2 = 0.3379
d18 b0 = -0.99 b0 = -5.0 b0 = 7 b0 = 0.000013b1 = 0.100 b1 = 2.01 b1 = 0.01622 b1 = 2.147840
b2 = 10.70 b2 = 0.150821
R2 = 0.6200 R2 = 0.6174 R2 = 0.6207 R2 = 0.6271
d19 b0 = -0.93 b0 = -6.0 b0 = 4 b0 = 0.000021b1 = 0.126 b1 = 2.54 b1 = 0.05132 b1 = 2.147840
b2 = 10.30 b2 = 0.150821
R2 = 0.4649 R2 = 0.4689 R2 = 0.4690 R2 = 0.7038
d20 b0 = -1.01 b0 = -5.1 b0 = 36 b0 = 0.000014b1 = 0.103 b1 = 2.07 b1 = 0.00295 b1 = 2.147840
b2 = 9.89 b2 = 0.150817
R2 = 0.4561 R2 = 0.4511 R2 = 0.4559 R2 = 0.4780
d21 b0 = -0.40 b0 = -2.5 b0 = 36 b0 = 0.0000041b1 = 0.052 b1 = 1.04 b1 = 0.00148 b1 = 1.94522
b2 = 7.94 b2 = 0.15521
R2 = 0.5798 R2 = 0.5821 R2 = 0.5799 R2 = 0.6048
d22 b0 = -0.71 b0 = -3.9 b0 = 2 b0 = 0.0000054b1 = 0.078 b1 = 1.58 b1 = 0.07591 b1 = 1.87786
b2 = 12.04 b2 = 0.14870
R2 = 0.5021 R2 = 0.5100 R2 = 0.5111 R2 = 0.4975
J. Woźniak, A. Kędzia, K. Dudek162
Table 6. Mathematical growth model parameters for brachial plexus structures
Tabela 6. Parametry porównywanych modeli matematycznych wzrostu struktur splotu ramiennego
Variable (Zmienna)
Linear regression (Prosta regresji)
Logarithmic curve (Funkcja logarytmiczna)
VBGM (Funkcja von Bertalanffy)
Gompertz curve (Funkcja Gompertza)
d25 b0 = -0.55 b0 = -2.9 b0 = 1 b0 = 0.0000008
b1 = 0.059 b1 = 1.19 b1 = 0.07949 b1 = 2.148
b2 = 12.27 b2 = 0.151
R2 = 0.5651 R2 = 0.5755 R2 = 0.5770 R2 = 0.6203
d26 b0 = -0.91 b0 = -4.8 b0 = 4 b0 = 0.0000014
b1 = 0.097 b1 = 1.95 b1 = 0.03352 b1 = 2.148
b2 = 10.93 b2 = 0.151
R2 = 0.5685 R2 = 0.5697 R2 = 0.5709 R2 = 0.6290
d27 b0 = -0.72 b0 = -5.0 b0 = 3 b0 = 0.0000780
b1 = 0.105 b1 = 2.14 b1 = 0.07950 b1 = 1.5322
b2 = 10.98 b2 = 0.14819
R2 = 0.5536 R2 = 0.5630 R2 = 0.5646 R2 = 0.5590
d28 b0 = -0.87 b0 = -4.7 b0 = 4 b0 = 0.0000555
b1 = 0.094 b1 = 1.90 b1 = 0.03554 b1 = 1.4133
b2 = 10.87 b2 = 0.13364
R2 = 0.6016 R2 = 0. 6033 R2 = 0.6043 R2 = 0.6090
d29 b0 = -1.24 b0 = -6.6 b0 = 5 b0 = 0.0000793
b1 = 0.135 b1 = 2.72 b1 = 0.03409 b1 = 1.41068
b2 = 10.82 b2 = 0.13356
R2 = 0.5726 R2 = 0.5739 R2 = 0.5751 R2 = 0.5809
k1 b0 = 0.28 b0 = -0.9 b0 = 28 b0 = 0.0000596
b1 = 0.030 b1 = 0.60 b1 = 0.00112 b1 = 2.05752
b2 = -8.74 b2 = 0.20935
R2 = 0.0653 R2 = 0.0633 R2 = 0.0652 R2 = 0.0605
Table 5. Mathematical growth model parameters for brachial plexus structures (cont.)
Tabela 5. Parametry porównywanych modeli matematycznych wzrostu struktur splotu ramiennego (cd.)
Variable (Zmienna)
Linear regression (Prosta regresji)
Logarithmic curve (Funkcja logaryt- miczna)
VBGM (Funkcja von Bertalanffy)
Gompertz curve (Funkcja Gompertza)
d23 b0 = -0.66 b0 = -3.4 b0 = 2 b0 = 0.0000010b1 = 0.068 b1 = 1.38 b1 = 0.05510 b1 = 2.148
b2 = 11.80 b2 = 0.151
R2 = 0.5725 R2 = 0.5782 R2 = 0.5790 R2 = 0.6045
d24 b0 = -0.52 b0 = -2.9 b0 = 2 b0 = 0.0000009b1 = 0.059 b1 = 1.19 b1 = 0.06358 b1 = 2.148
b2 = 11.50 b2 = 0.151
R2 = 0.5325 R2 = 0.5392 R2 = 0.5402 R2 = 0.6525

Mathematical Models of Brachial Plexus Development 163
Table 6. Mathematical growth model parameters for brachial plexus structures (cont.)
Tabela 6. Parametry porównywanych modeli matematycznych wzrostu struktur splotu ramiennego (cd.)
Variable (Zmienna)
Linear regression (Prosta regresji)
Logarithmic curve (Funkcja logarytmiczna)
VBGM (Funkcja von Bertalanffy)
Gompertz curve (Funkcja Gompertza)
k2 b0 = -0.72 b0 = -4.7 b0 = 36 b0 = 0.0000786b1 = 0.102 b1 = 2.04 b1 = 0.00294 b1 = 1.49715
b2 = 7.26 b2 = 0.14511
R2 = 0.3784 R2 = 0.3716 R2 = 0.3778 R2 = 0.3991
k3 b0 = -0.27 b0 = -3.0 b0 = 36 b0 = 0.0001038b1 = 0.069 b1 = 1.39 b1 = 0.00201 b1 = 1.53769
b2 = 4.18 b2 = 0.15822
R2 = 0.2294 R2 = 0.2270 R2 = 0.2291 R2 = 0.2395
k4 b0 = -0.18 b0 = -2.3 b0 = 36 b0 = 0.0000858b1 = 0.055 b1 = 1.09 b1 = 0.00158 b1 = 1.57109
b2 = 3.42 b2 = 0.16215
R2 = 0.1595 R2 = 0.1529 R2 = 0.1591 R2 = 0.1633
l1 b0 = -2.02 b0 = -15.9 b0 = 70 b0 = 0.0004623b1 = 0.347 b1 = 6.97 b1 = 0.00532 b1 = 1.46185
b2 = 6.34 b2 = 0.14930
R2 = 0.4140 R2 = 0.4119 R2 = 0.4138 R2 = 0.4276
l2 b0 = -1.78 b0 = -13.1 b0 = 8 b0 = 0.0003571b1 = 0.278 b1 = 5.64 b1 = 0.06730 b1 = 1.43973
b2 = 10.34 b2 = 0.14670
R2 = 0.4274 R2 = 0.4333 R2 = 0.4340 R2 = 0.4356
l3 b0 = -1.81 b0 = -11.6 b0 = 6.2 b0 = 0.0002649b1 = 0.241 b1 = 4.91 b1 = 0.0799 b1 = 1.40548
b2 = 11.3 b2 = 0.14119
R2 = 0.5020 R2 = 0.5115 R2 = 0.5138 R2 = 0.5090
l4 b0 = -2.29 b0 = -14.0 b0 = 8.1 b0 = 0.0001745b1 = 0.289 b1 = 5.87 b1 = 0.0666 b1 = 1.50293
b2 = 11.1 b2 = 0.14263
R2 = 0.5077 R2 = 0.5148 R2 = 0.5162 R2 = 0.5165
Tabela 7. Parametry porównywanych modeli matematycznych wzrostu struktur splotu ramiennego
Table 7. Mathematical growth model parameters for brachial plexus structures
Variable (Zmienna)
Linear regression (Prosta regresji)
Logarithmic curve (Funkcja logarytmiczna)
VBGM (Funkcja von Bertalanffy)
Gompertz curve (Funkcja Gompertza)
l5 b0 = -1.72 b0 = -10.6 b0 = 11.1 b0 = 0.0001378b1 = 0.223 b1 = 4.49 b1 = 0.0271 b1 = 1.50294
b2 = 9.4 b2 = 0.14285
R2 = 0.4222 R2 = 0.4220 R2 = 0.4234 R2 = 0.4392
l11 b0 = -4.42 b0 = -28.6 b0 = 12.0 b0 = 0.0000863b1 = 0.588 b1 = 12.06 b1 = 0.1403 b1 = 1.84877
b2 = 12.6 b2 = 0.15518
R2 = 0.2480 R2 = 0.2571 R2 = 0.2635 R2 = 0.2496
J. Woźniak, A. Kędzia, K. Dudek164
Table 7. Mathematical growth model parameters for brachial plexus structures (cont.)
Tabela 7. Parametry porównywanych modeli matematycznych wzrostu struktur splotu ramiennego (cd.)
Variable (Zmienna)
Linear regression (Prosta regresji)
Logarithmic curve (Funkcja logarytmiczna)
VBGM (Funkcja von Bertalanffy)
Gompertz curve (Funkcja Gompertza)
l12 b0 = -8.18 b0 = -39.8 b0 = 15.8 b0 = 0.0000361b1 = 0.775 b1 = 15.78 b1 = 0.0973 b1 = 1.83718
b2 = 13.2 b2 = 0.14121
R2 = 0.2592 R2 = 0.2653 R2 = 0.2673 R2 = 0.2491
l18 b0 = -1.18 b0 = -9.7 b0 = 4.5 b0 = 0.0000048b1 = 0.205 b1 = 4.24 b1 = 0.1519 b1 = 2.37186
b2 = 12.2 b2 = 0.17193
R2 = 0.2035 R2 = 0.2134 R2 = 0.2219 R2 = 0.2271
l19 b0 = -4.26 b0 = -24.2 b0 = 41.0 b0 = 0.0000094b1 = 0.499 b1 = 10.03 b1 = 0.0143 b1 = 2.20578
b2 = 9.4 b2 = 0.15836
R2 = 0.4203 R2 = 0.4186 R2 = 0.4206 R2 = 0.4373
l20 b0 = -2.92 b0 = -14.8 b0 = 238.2 b0 = 0.0000051b1 = 0.298 b1 = 5.97 b1 = 0.0013 b1 = 2.08400
b2 = 9.9 b2 = 0.14847
R2 = 0.2688 R2 = 0.2652 R2 = 0.2688 R2 = 0.2842
l21 b0 = -4.90 b0 = -27.7 b0 = 12.7 b0 = 0.0000102b1 = 0.558 b1 = 11.39 b1 = 0.0934 b1 = 2.21124
b2 = 12.2 b2 = 0.15865
R2 = 0.3695 R2 = 0.3783 R2 = 0.3814 R2 = 0.3701
l22 b0 = -3.19 b0 = -19.8 b0 = 10.8 b0 = 0.0000057b1 = 0.408 b1 = 8.29 b1 = 0.0733 b1 = 2.35268
b2 = 11.3 b2 = 0.16534
R2 = 0.3141 R2 = 0.3194 R2 = 0.3205 R2 = 0.3228
l23 b0 = -4.29 b0 = -24.5 b0 = 10.7 b0 = 0.0000923b1 = 0.494 b1 = 10.11 b1 = 0.1046 b1 = 1.70263
b2 = 12.4 b2 = 0.14593
R2 = 0.3510 R2 = 0.3610 R2 = 0.3655 R2 = 0.3521
l24 b0 = -2.30 b0 = -14.0 b0 = 9.4 b0 = 0.0003313b1 = 0.291 b1 = 5.88 b1 = 0.0510 b1 = 1.36794
b2 = 10.6 b2 = 0.13793
R2 = 0.3369 R2 = 0.3398 R2 = 0.3401 R2 = 0.3425
l25 b0 = -2.00 b0 = -14.2 b0 = 8.1 b0 = 0.0002233b1 = 0.301 b1 = 6.12 b1 = 0.0775 b1 = 1.54376
b2 = 10.8 b2 = 0.14921
R2 = 0.3373 R2 = 0.3433 R2 = 0.3445 R2 = 0.3440
l26 b0 = -1.62 b0 = -10.4 b0 = 6.0 b0 = 0.0001493b1 = 0.218 b1 = 4.42 b1 = 0.0698 b1 = 1.50988
b2 = 11.0 b2 = 0.14503
R2 = 0.3184 R2 = 0.3231 R2 = 0.3237 R2 = 0.3226
l27 b0 = -1.95 b0 = -11.8 b0 = 114.3 b0 = 0.0001308b1 = 0.249 b1 = 4.98 b1 = 0.0022 b1 = 1.52040
b2 = 8.0 b2 = 0.14226
R2 = 0.4131 R2 = 0.4077 R2 = 0.4128 R2 = 0.4383
Mathematical Models of Brachial Plexus Development 165
Table 8. Mathematical growth model parameters for brachial plexus structures
Tabela 8. Parametry porównywanych modeli matematycznych wzrostu struktur splotu ramiennego
Variable (Zmienna)
Linear regression (Prosta regresji)
Logarithmic curve (Funkcja logarytmiczna)
VBGM (Funkcja von Bertalanffy)
Gompertz curve (Funkcja Gompertza)
l28 b0 = -2.10 b0 = -12.4 b0 = 114.3 b0 = 0.0001252
b1 = 0.254 b1 = 5.17 b1 = 0.0023 b1 = 1.52612
b2 = 8.4 b2 = 0.14232
R2 = 0.4322 R2 = 0.4393 R2 = 0.4329 R2 = 0.4315
l29 b0 = -1.47 b0 = -10.8 b0 = 114.3 b0 = 0.0001206
b1 = 0.230 b1 = 4.67 b1 = 0.0021 b1 = 63764
b2 = 6.6 b2 = 0.15320
R2 = 0.3433 R2 = 0.3473 R2 = 0.3436 R2 = 0.3500
d1 d2 d3 d4 d5 d6 d7 d8 d9 d10 d11 d12 d13 d14 d15 d16 d17 d18 d19 d20 d21 d22 d23 d24 d25 d26 d27 d28 d29
d1 0,805 0,737 0,700 0,642 0,639 0,637 0,720 0,659 0,697 0,667 0,702 0,698 0,695 0,697 0,697 0,695 0,723 0,616 0,690 0,696 0,694 0,719 0,678 0,622 0,694 0,728 0,749 0,682
d2 0,805 0,843 0,789 0,685 0,679 0,679 0,786 0,702 0,774 0,698 0,750 0,768 0,760 0,820 0,742 0,725 0,733 0,673 0,721 0,770 0,751 0,788 0,762 0,684 0,735 0,797 0,821 0,747
d3 0,737 0,843 0,825 0,768 0,732 0,738 0,780 0,702 0,814 0,694 0,787 0,771 0,805 0,816 0,742 0,722 0,768 0,696 0,704 0,765 0,784 0,840 0,777 0,725 0,800 0,795 0,888 0,803
d4 0,700 0,789 0,825 0,820 0,666 0,684 0,776 0,713 0,749 0,688 0,788 0,770 0,797 0,771 0,763 0,718 0,799 0,667 0,661 0,777 0,734 0,787 0,771 0,756 0,786 0,735 0,820 0,795
d5 0,642 0,685 0,768 0,820 0,680 0,692 0,703 0,684 0,736 0,628 0,723 0,714 0,735 0,751 0,736 0,682 0,740 0,669 0,648 0,725 0,710 0,768 0,712 0,716 0,759 0,697 0,783 0,826
d6 0,639 0,679 0,732 0,666 0,680 0,928 0,654 0,647 0,688 0,565 0,663 0,670 0,662 0,702 0,643 0,596 0,721 0,577 0,631 0,688 0,673 0,699 0,679 0,592 0,706 0,668 0,740 0,694
d7 0,637 0,679 0,738 0,684 0,692 0,928 0,675 0,705 0,691 0,593 0,672 0,712 0,668 0,730 0,654 0,611 0,729 0,629 0,649 0,720 0,709 0,710 0,653 0,600 0,726 0,692 0,732 0,714
d8 0,720 0,786 0,780 0,776 0,703 0,654 0,675 0,739 0,751 0,693 0,794 0,752 0,767 0,779 0,717 0,708 0,778 0,693 0,729 0,778 0,694 0,779 0,754 0,735 0,763 0,689 0,802 0,738
d9 0,659 0,702 0,702 0,713 0,684 0,647 0,705 0,739 0,779 0,662 0,719 0,727 0,730 0,718 0,657 0,641 0,748 0,746 0,698 0,716 0,704 0,717 0,691 0,646 0,751 0,714 0,763 0,746
d10 0,697 0,774 0,814 0,749 0,736 0,688 0,691 0,751 0,779 0,720 0,790 0,778 0,796 0,791 0,738 0,675 0,791 0,779 0,700 0,732 0,757 0,828 0,750 0,720 0,772 0,788 0,814 0,807
d11 0,667 0,698 0,694 0,688 0,628 0,565 0,593 0,693 0,662 0,720 0,761 0,776 0,718 0,689 0,650 0,602 0,698 0,695 0,747 0,710 0,681 0,725 0,661 0,649 0,686 0,691 0,738 0,655
d12 0,702 0,750 0,787 0,788 0,723 0,663 0,672 0,794 0,719 0,790 0,761 0,783 0,839 0,765 0,755 0,721 0,810 0,780 0,742 0,774 0,733 0,781 0,743 0,733 0,792 0,770 0,796 0,791
d13 0,698 0,768 0,771 0,770 0,714 0,670 0,712 0,752 0,727 0,778 0,776 0,783 0,810 0,777 0,754 0,705 0,772 0,729 0,725 0,785 0,729 0,791 0,737 0,676 0,773 0,734 0,819 0,793
d14 0,695 0,760 0,805 0,797 0,735 0,662 0,668 0,767 0,730 0,796 0,718 0,839 0,810 0,751 0,777 0,728 0,817 0,717 0,727 0,757 0,747 0,790 0,751 0,734 0,818 0,762 0,828 0,794
d15 0,697 0,820 0,816 0,771 0,751 0,702 0,730 0,779 0,718 0,791 0,689 0,765 0,777 0,751 0,754 0,710 0,744 0,739 0,713 0,752 0,766 0,804 0,761 0,710 0,776 0,753 0,832 0,830
d16 0,697 0,742 0,742 0,763 0,736 0,643 0,654 0,717 0,657 0,738 0,650 0,755 0,754 0,777 0,754 0,911 0,757 0,685 0,662 0,741 0,727 0,733 0,727 0,702 0,721 0,705 0,773 0,751
d17 0,695 0,725 0,722 0,718 0,682 0,596 0,611 0,708 0,641 0,675 0,602 0,721 0,705 0,728 0,710 0,911 0,766 0,628 0,615 0,719 0,681 0,706 0,684 0,676 0,696 0,679 0,754 0,710
d18 0,723 0,733 0,768 0,799 0,740 0,721 0,729 0,778 0,748 0,791 0,698 0,810 0,772 0,817 0,744 0,757 0,766 0,707 0,704 0,785 0,719 0,814 0,746 0,751 0,883 0,743 0,817 0,817
d19 0,616 0,673 0,696 0,667 0,669 0,577 0,629 0,693 0,746 0,779 0,695 0,780 0,729 0,717 0,739 0,685 0,628 0,707 0,728 0,717 0,756 0,728 0,644 0,664 0,728 0,728 0,738 0,765
d20 0,690 0,721 0,704 0,661 0,648 0,631 0,649 0,729 0,698 0,700 0,747 0,742 0,725 0,727 0,713 0,662 0,615 0,704 0,728 0,729 0,709 0,749 0,668 0,650 0,720 0,661 0,720 0,724
d21 0,696 0,770 0,765 0,777 0,725 0,688 0,720 0,778 0,716 0,732 0,710 0,774 0,785 0,757 0,752 0,741 0,719 0,785 0,717 0,729 0,780 0,800 0,744 0,751 0,746 0,746 0,797 0,767
d22 0,694 0,751 0,784 0,734 0,710 0,673 0,709 0,694 0,704 0,757 0,681 0,733 0,729 0,747 0,766 0,727 0,681 0,719 0,756 0,709 0,780 0,792 0,708 0,691 0,755 0,795 0,782 0,757
d23 0,719 0,788 0,840 0,787 0,768 0,699 0,710 0,779 0,717 0,828 0,725 0,781 0,791 0,790 0,804 0,733 0,706 0,814 0,728 0,749 0,800 0,792 0,806 0,746 0,815 0,803 0,852 0,816
d24 0,678 0,762 0,777 0,771 0,712 0,679 0,653 0,754 0,691 0,750 0,661 0,743 0,737 0,751 0,761 0,727 0,684 0,746 0,644 0,668 0,744 0,708 0,806 0,742 0,764 0,754 0,802 0,776
d25 0,622 0,684 0,725 0,756 0,716 0,592 0,600 0,735 0,646 0,720 0,649 0,733 0,676 0,734 0,710 0,702 0,676 0,751 0,664 0,650 0,751 0,691 0,746 0,742 0,744 0,693 0,764 0,764
d26 0,694 0,735 0,800 0,786 0,759 0,706 0,726 0,763 0,751 0,772 0,686 0,792 0,773 0,818 0,776 0,721 0,696 0,883 0,728 0,720 0,746 0,755 0,815 0,764 0,744 0,729 0,834 0,844
d27 0,728 0,797 0,795 0,735 0,697 0,668 0,692 0,689 0,714 0,788 0,691 0,770 0,734 0,762 0,753 0,705 0,679 0,743 0,728 0,661 0,746 0,795 0,803 0,754 0,693 0,729 0,803 0,736
d28 0,749 0,821 0,888 0,820 0,783 0,740 0,732 0,802 0,763 0,814 0,738 0,796 0,819 0,828 0,832 0,773 0,754 0,817 0,738 0,720 0,797 0,782 0,852 0,802 0,764 0,834 0,803 0,830
d29 0,682 0,747 0,803 0,795 0,826 0,694 0,714 0,738 0,746 0,807 0,655 0,791 0,793 0,794 0,830 0,751 0,710 0,817 0,765 0,724 0,767 0,757 0,816 0,776 0,764 0,844 0,736 0,830
Ryc. 3. Fragment macierzy współczynników korelacji obejmujący średnice nerwów
Fig. 3. Matrix of correlation coefficients including nerve diameters

J. Woźniak, A. Kędzia, K. Dudek166
References[1] Bareggi R, Grill V, Zweyer M, Sandrucci MA, Nardrucci P, Forabosco A: The growth of long bones in human
embryological and fetal upper limb and its relationship to other development patterns. Anat Embryol 1994, 189, 19–24.
[2] Gray DJ, Gardner E: The prenatal development of the human humerus. Am J Anat 1969, 124, 431–446. [3] Lewis WH: The development of the arm in man. Am J Anat 1902, 1(2), 145–183. [4] Shinohara H, Naora H, Hashimoto R, Hatta T, Tanaka O: Development of the innervation pattern in the upper
limb staged human embryos. Acta Anat 1990, 138, 265–269.[5] Woźniak W, Bruska M: The length of the humerus in human embryos at developmental stages 18–23. Folia
Morphol 2006, 65(2), 136–139. [6] Rodriguez-Niedenführ M, Burton GJ, Deu J, Sañudo JR: Development of the arterial pattern in the upper limb
of staged human embryos: normal development and anatomic variations. J Anat 2001, 199, 407–417. [7] Rodriguez-Niedenführ M, Vazquez T, Nearn L, Ferreira B, Parkin I, Sañudo JR: Variations of the arterial pat-
tern in the upper limb revisited: a morphological and statistical study, with a review of the literature. J Anat 2001, 199, 547–566.
[8] Rodriguez-Niedenführ M, Vazquez T, Parkin I, Sañudo JR: Arterial patterns of the human upper limbs: update of anatomical variations and embryological development. Eur J Anat 2003, suppl. 1, 21–28.
[9] Castellana C, Kosa F: Morphology of the cervical vertebrae in fetal-neonatal human skeleton. J Anat 1999, 194, 147–152.
[10] Pande BS, Singh I: One-sided dominance in the upper limbs of human fetuses as evidence by asymmetry in mus-cle and bone weight. J Anat 1997, 109(3), 457–459.
[11] Uysal II, Seker M, Karabulut AK, Büyükmumcu M, Ziylan T: Brachial plexus variations in human fetuses. Neurosurgery 2003, 53(3), 676–684.
[12] Uzmansel D, Kortoğlu Z, Kara A, Öztürk NC: Frequency, anatomical properties and innervation of axillary arch and its relation to the brachial plexus in human fetuses. Surg Radiol Anat 2010, 32(9), 859–863.
[13] Carlson BM: Human embryology and developmental Biology. Mosby, St Louis 1999, 450. [14] Mielcarska M, Chocholska M, Zgorzalewicz-Stachowiak M: Perinatal brachial plexus palsy in children – etiol-
ogy, classification and clinical picture of injuries. Physiotherapy 2009, 17(1), 66–77.[15] Gosk J, Rutowski R: Analiza czynników ryzyka okołoporodowych uszkodzeń splotu ramiennego. Ginekol Pol
2005, 76(4), 270–276.[16] Gosk J, Rutowski R: The injuries of the bone-joint system accompanying the perinatal brachial plexus palsy. Adv
Clin Exp Med 2006, 15(2), 297–230.[17] Parker LA: Part 2. Birth trauma: injuries to the intraabdominal organs, peripheral nerves, and skeletal system. Adv
Neonatal Care 2006, 6(1), 7–14. [18] Sibiński M, Synder M: Obstetric brachial palsy – risk factors and predictors. Ortop Traumatol Rehab 2007, 6(6),
569–576. [19] Piatt JH: Birth injuries of the brachial plexus. Pediatr Clin N Am 2004, 51, 421–440.
Table 9. Weekly increases in brachial plexus tissue size [mm] in descending order
Tabela 9. Przyrosty tygodniowe analizowanych wymiarów tkanek splotu ramiennego w kolejności malejącej [mm]
Parameter (Wymiar)
Growth (Przyrost)
Parameter (Wymiar)
Growth (Przyrost)
Parameter (Wymiar)
Growth (Przyrost)
Parameter (Wymiar)
Growth (Przyrost)
Parameter (Wymiar)
Growth (Przyrost)
HUM 3.48 l20 0.30 d29 0.14 d22 0.08 d11 0.06
CLA 1.43 l24 0.29 d19 0.13 d4 0.07 d24 0.06
l12 0.78 l4 0.29 d27 0.11 d5 0.07 d25 0.06
d15 0.68 l2 0.28 d20 0.10 d9 0.07 d1 0.06
l11 0.59 l28 0.25 k2 0.10 d14 0.07 k4 0.06
l21 0.56 l27 0.25 d13 0.10 k3 0.07 d21 0.05
l19 0.50 l3 0.24 d18 0.10 d23 0.07 d8 0.05
l23 0.49 l29 0.23 d10 0.10 d2 0.07 d17 0.04
l22 0.41 l5 0.22 d26 0.10 d6 0.07 d16 0.04
l1 0.35 l26 0.22 d28 0.09 d12 0.07 k1 0.03
l25 0.30 l18 0.21 d3 0.08 d7 0.06
Mathematical Models of Brachial Plexus Development 167
[20] Radecka G: Rola fizjoterapeuty we wczesnym okresie leczenia następstw okołoporodowego uszkodzenia splotu ramiennego u dzieci. Balneol Pol 1998, 40(1/2), 73–78.
[21] Andersen J, Watt J, Olson J, Aerde van J: Perinatal brachial plexus palsy. Paediatr Child Health 2006, 11(2), 93–100.
[22] Witych G, Poręba R: Intrapartum risk factors for shoulder dystocia. Ann Acad Med Siles 2005, 59(5), 409–410.[23] Bager B: Perinatally acquired brachial plexus palsy a persisting challenge. Acta Paediatr Scand 1997, 86, 1214–
1219.[24] King GD, Binder H, Getson P, O’Donnell R: Obstetrical brachial plexus palsy outcome with conservative man-
agement. Muscle Nerve 1996, 19, 884–891. [25] Merz E, Grüßner A, Kern F: Mathematical modeling of fetal limb growth. J Clin Ultrasound 1989, 17, 179–185.[26] Scheuer JL, Musgrave JH, Evans SP: The estimation of late fetal and perinatal age from limb bone length by linear
and logarithmic regression. Ann Hum Biol 1980, 7(3), 257–265. [27] Kędzia A, Woźniak J, Dudek K, Ziajkiewicz M (abstr.): Foetal age evaluation on the basis of limb lenght, Abstract
Book, 29th Congress of Polish Anatomical Society, Bydgoszcz 2009, 58.[28] Kędzia A, Woźniak J, Ziajkiewicz M, Dudek K: Model matematyczny wzrostu kości długich kończyny górnej
w okresie prenatalnym. Komputerowe Wspomaganie Badań Naukowych, WTN, Wrocław 2008, XV, 209–216. [29] Podgórski P, Kędzia A, Woźniak J: Aplication of artificial neural network to analyzed the age of the fetus on the
basis of long bones of the lower limbs, Abstract Book, 29th Congress of Polish Anatomical Society, Bydgoszcz 2009, 107.
[30] Podgórski P, Kędzia A, Woźniak J, Ziajkiewicz M, Dudek K: Sztuczne sieci neuronowe a modele parametryczne w ocenie wieku płodu. Komputerowe Wspomaganie Badań Naukowych, WTN, Wrocław 2009, XVI, 291–296.
[31] Woźniak J, Kędzia A, Dudek K: Mathematical assessment of foetal facial skeleton development. Arch Perinat Med 2010, 16(4), 211–217.
[32] Kędzia A, Woźniak J, Ziajkiewicz M, Dudek K, Derkowski W: Matematyczna analiza zmienności sklepistości czaszki i wymiarów oczodołów podczas rozwoju prenatalnego człowieka. Komputerowe Wspomaganie Badań Naukowych, WTN, Wrocław, 2009, XVI, 247–256.
[33] Kędzia A, Woźniak J, Tkaczyszyn M, Szkutnik A, Dudek K (abstr.): Mathematical models of pectoral major mus-cle in prenatal period. Materiały Konferencyjne, II Sympozjum PAN Współczesna Myśl Techniczna w Naukach Medycznych i Biologicznych, Wrocław 15–16.04.2011, 33–34.
Address for correspondence:Jowita Woźniak Department of Anatomy Wroclaw Medical UniversityChałubińskiego 6a 50-368 WrocławPolandTel.: +48 71 784 00 80E-mail: [email protected]
Conflict of interest: None declared
Received: 7.11.2011Revised: 20.12.2011Accepted: 29.03.2012