Introduction - vliz.be · S‡owa kluczowe: rozmieszczenie populacji ryb pelagicznych, interpolacja...
8
POLISH ASSOCIATION FOR SPATIAL INFORMATION ANNALS OF GEOMATICS 2008 m VOLUME VI m NUMBER 1 USAGE OF GEOSPATIAL METHODS IN DETERMINATION OF PELAGIC FISH STOCK DISTRIBUTION WYKORZYSTANIE METOD GEOPRZESTRZENNYCH W USTALANIU ROZMIESZCZENIA POPULACJI RYB PELAGICZNYCH Vlado Dadiæ, Vjekoslav TiLina, Damir Ivankoviæ Institute of Oceanography and Fisheries, Split, Croatia Keywords: Pelagic fish stock distribution, geospatial interpolation S‡owa kluczowe: rozmieszczenie populacji ryb pelagicznych, interpolacja geoprzestrzenna Introduction Almost 40% of the area of the Adriatic Sea (57 000 km 2 ), including territorial water and the exclusive economic zone, belongs to the Republic of Croatia. The Croatian coastline of the Adriatic Sea is heavily intended, with 1244 islands, rocks and cliffs. However, the Adriatic Sea is one of the richest seas bordering the Mediterranean, with biological resources that have a great importance for the Croatian economy. One of the important economic activities in the Adriatic Sea is a pelagic fishery, which has a long tradition in Croatia. Because fishing has a direct impact on the fauna and flora of the sea, scientific estimation of the spatial distribution and abundance of pelagic fish in the Adriatic Sea has been undertaken for more then 60 years. Recently, there has been a special effort in Croatia to use a hydro-acoustic methodology, supported by objective analysis and GIS technology, to obtain information about the commercially important pelagic species in the Adriatic Sea, their geographical distribution, abundance estimates and population structures. In this paper is discussed how different segment lengths of integration along measurement transects influences the estimate of the spatial distribution of the pelagic fish stock.
Transcript of Introduction - vliz.be · S‡owa kluczowe: rozmieszczenie populacji ryb pelagicznych, interpolacja...

49USAGE OF GEOSPATIAL METHODS IN DETERMINATION OF PELAGIC FISH STOCK DISTRIBUTIONPOLISH ASSOCIATION FOR SPATIAL INFORMATIONANNALS OF GEOMATICS 2008 m VOLUME VI m NUMBER 1
USAGE OF GEOSPATIAL METHODSIN DETERMINATION
OF PELAGIC FISH STOCK DISTRIBUTION
WYKORZYSTANIE METOD GEOPRZESTRZENNYCHW USTALANIU ROZMIESZCZENIAPOPULACJI RYB PELAGICZNYCH
Vlado Dadiæ, Vjekoslav Tièina, Damir Ivankoviæ
Institute of Oceanography and Fisheries, Split, Croatia
Keywords: Pelagic fish stock distribution, geospatial interpolationS³owa kluczowe: rozmieszczenie populacji ryb pelagicznych, interpolacja geoprzestrzenna
Introduction
Almost 40% of the area of the Adriatic Sea (57 000 km2), including territorial water andthe exclusive economic zone, belongs to the Republic of Croatia. The Croatian coastline ofthe Adriatic Sea is heavily intended, with 1244 islands, rocks and cliffs. However, the AdriaticSea is one of the richest seas bordering the Mediterranean, with biological resources thathave a great importance for the Croatian economy.
One of the important economic activities in the Adriatic Sea is a pelagic fishery, whichhas a long tradition in Croatia. Because fishing has a direct impact on the fauna and flora ofthe sea, scientific estimation of the spatial distribution and abundance of pelagic fish in theAdriatic Sea has been undertaken for more then 60 years. Recently, there has been aspecial effort in Croatia to use a hydro-acoustic methodology, supported by objectiveanalysis and GIS technology, to obtain information about the commercially important pelagicspecies in the Adriatic Sea, their geographical distribution, abundance estimates andpopulation structures.
In this paper is discussed how different segment lengths of integration along measurementtransects influences the estimate of the spatial distribution of the pelagic fish stock.

50 VLADO DADIÆ, VJEKOSLAV TIÈINA, DAMIR IVANKOVIÆ
Methodology
During echo surveying, additional parameters have been collected, including temperatureprofile, salinity, oxygen levels, phytoplankton, zooplankton and fish samples using smallpelagic net at discrete points along the echo surveying transect. Echo surveying was donealong transects, paths of interest, whose length and orientation were defined from previousknowledge about fishing, oceanographic properties and the Adriatic Sea morphology, usingGIS technology.
The definition of shape, size and orientation of the transects and the distance among themin this investigation was controlled by the main objective to gather useful results using thesmallest manpower and monetary cost as possible. This was relatively difficult because theCroatian coastal region of the Adriatic Sea is much intended, with many narrow and longislands and channels (Figure 1). During this process next two facts were taken in account:
1) Biological resources from one side to the other of long, narrow islands, or in twoneighbouring channels, can be very different in spite of the relatively small geographicarea, and
2) As pelagic fish live in big groups and migrate relatively fast from one marine region toanother, the same group can be registered multiple times during measurement by echosounder along long transects and where transects are close together.Objective kriging was used for spatial interpolation of the measured data and generation
of spatial fields of fish stock distribution. For describing and comparing the spatial distributionof small pelagic fish, ordinary kriging method was used, as it presents an optimal method ofinterpolation and provides the best linear unbiased estimate of the variable at a given point(Deutch and Journel, 1992; Journel and Huijbregts, 1993). It is linear because estimate valuesthat are weighted linear combinations of available data; unbiased because the mean of theerror is zero and the best because it minimizes the variance of the errors. Essentially, it isnecessary to know the spatial variation in the data during kriging interpolation. This methodsolves the problem of calculating semi variance as a measure of the degree of spatial dependencebetween samples. It is known that the semi variance value is close to zero where points arevery close, and it increases as the distance increases until it reaches maximum at somecertain distance away from a point. This distance, at which semi variance reaches its maximumvalue, defines the end of spatial homogeneity in the data. Therefore, only the samples in thelocal neighbourhood within the area of homogeneity are used during interpolation. This assumesthat the local means are not necessarily close to the population mean. The kriging method isoften termed BLUE (best linear unbiased estimator). This method has a disadvantage, asthere are no capabilities to recognize barriers, such as narrow islands and channels, of whichthere are many in the coastal area of the Croatian part of the Adriatic Sea.
Kriging method was widely used for interpolation of marine spatial data (Dadiæ, Srdeliæand Ivankoviæ, 2000; Dadiæ, Srdeliæ and Gr�etiæ, 2001).
Graphic presentation of the interpolated fields and variance obtained during the kriginginterpolation enabled evaluation of spatial homogeneity of the fish data (Graff et al., 2003).
The digital map of the Adriatic Sea coastline was created using ArcGIS. All data of relatedoceanographic parameters were stored in MEDAS (Marine environmental database of theAdriatic Sea), developed at the Institute of Oceanography and Fisheries in Split using theORACLE 10i database management system (Dadic and Ivankovic, 2005).
51USAGE OF GEOSPATIAL METHODS IN DETERMINATION OF PELAGIC FISH STOCK DISTRIBUTION
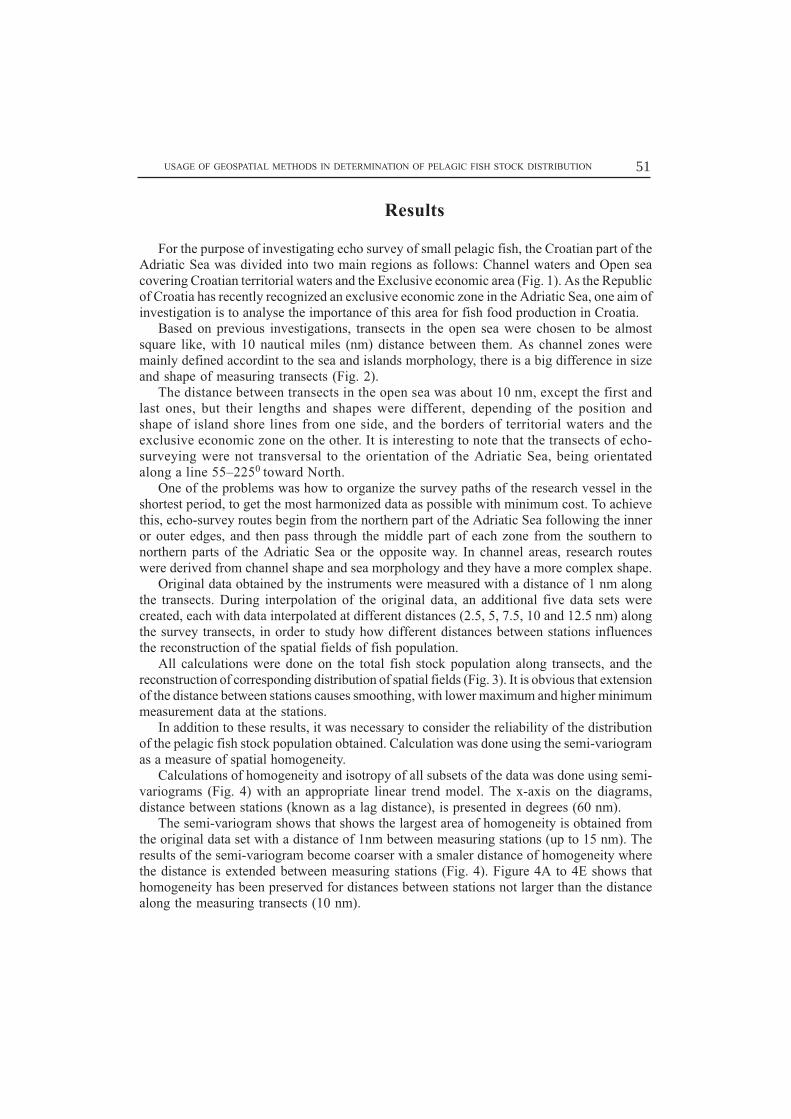
Results
For the purpose of investigating echo survey of small pelagic fish, the Croatian part of theAdriatic Sea was divided into two main regions as follows: Channel waters and Open seacovering Croatian territorial waters and the Exclusive economic area (Fig. 1). As the Republicof Croatia has recently recognized an exclusive economic zone in the Adriatic Sea, one aim ofinvestigation is to analyse the importance of this area for fish food production in Croatia.
Based on previous investigations, transects in the open sea were chosen to be almostsquare like, with 10 nautical miles (nm) distance between them. As channel zones weremainly defined accordint to the sea and islands morphology, there is a big difference in sizeand shape of measuring transects (Fig. 2).
The distance between transects in the open sea was about 10 nm, except the first andlast ones, but their lengths and shapes were different, depending of the position andshape of island shore lines from one side, and the borders of territorial waters and theexclusive economic zone on the other. It is interesting to note that the transects of echo-surveying were not transversal to the orientation of the Adriatic Sea, being orientatedalong a line 55�2250 toward North.
One of the problems was how to organize the survey paths of the research vessel in theshortest period, to get the most harmonized data as possible with minimum cost. To achievethis, echo-survey routes begin from the northern part of the Adriatic Sea following the inneror outer edges, and then pass through the middle part of each zone from the southern tonorthern parts of the Adriatic Sea or the opposite way. In channel areas, research routeswere derived from channel shape and sea morphology and they have a more complex shape.
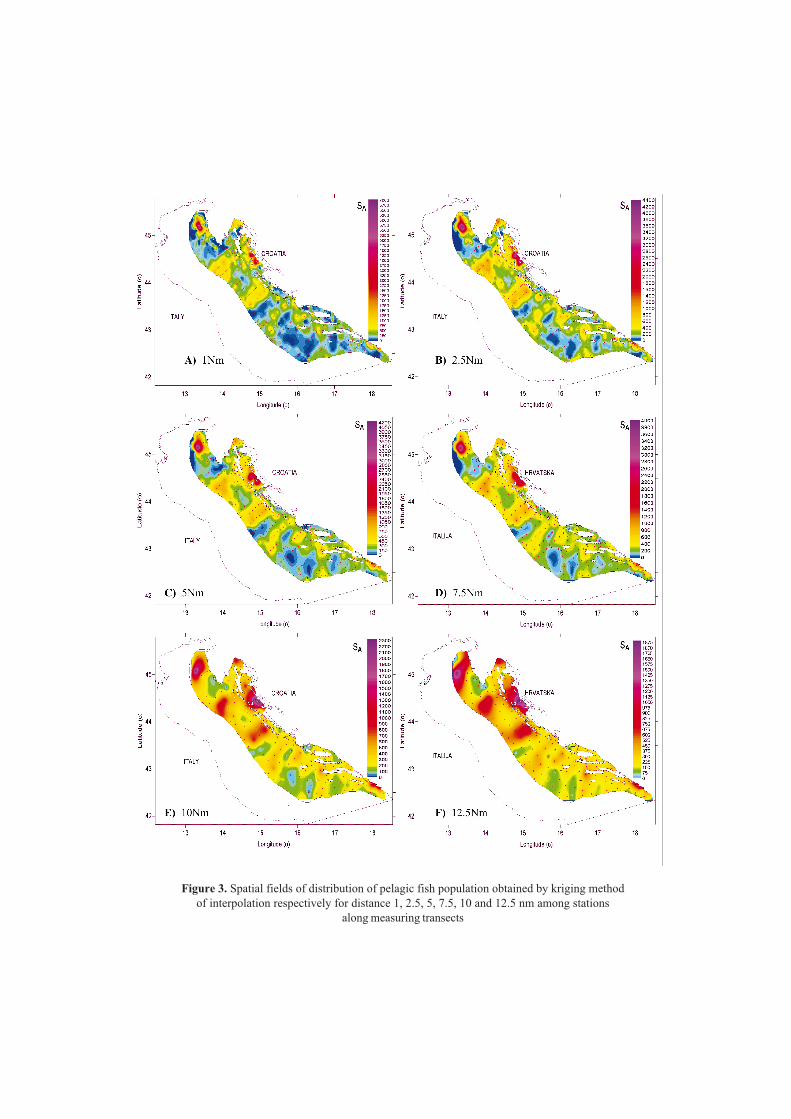
Original data obtained by the instruments were measured with a distance of 1 nm alongthe transects. During interpolation of the original data, an additional five data sets werecreated, each with data interpolated at different distances (2.5, 5, 7.5, 10 and 12.5 nm) alongthe survey transects, in order to study how different distances between stations influencesthe reconstruction of the spatial fields of fish population.
All calculations were done on the total fish stock population along transects, and thereconstruction of corresponding distribution of spatial fields (Fig. 3). It is obvious that extensionof the distance between stations causes smoothing, with lower maximum and higher minimummeasurement data at the stations.
In addition to these results, it was necessary to consider the reliability of the distributionof the pelagic fish stock population obtained. Calculation was done using the semi-variogramas a measure of spatial homogeneity.
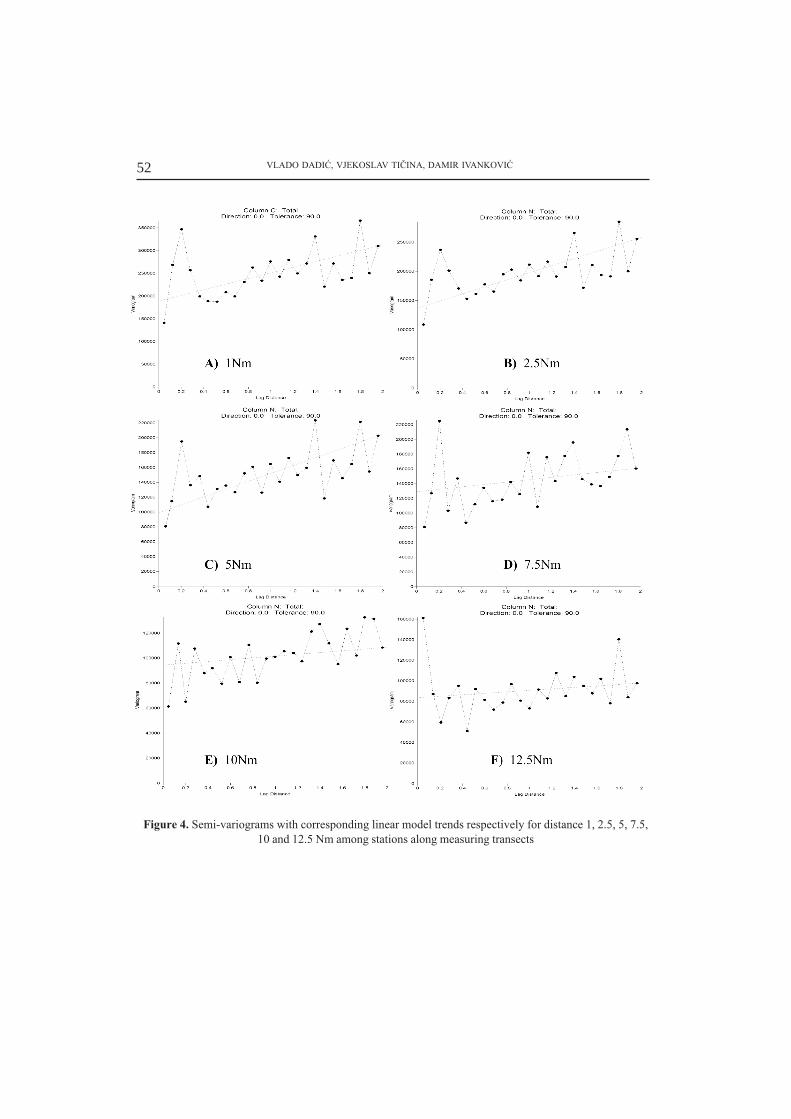
Calculations of homogeneity and isotropy of all subsets of the data was done using semi-variograms (Fig. 4) with an appropriate linear trend model. The x-axis on the diagrams,distance between stations (known as a lag distance), is presented in degrees (60 nm).
The semi-variogram shows that shows the largest area of homogeneity is obtained fromthe original data set with a distance of 1nm between measuring stations (up to 15 nm). Theresults of the semi-variogram become coarser with a smaler distance of homogeneity wherethe distance is extended between measuring stations (Fig. 4). Figure 4A to 4E shows thathomogeneity has been preserved for distances between stations not larger than the distancealong the measuring transects (10 nm).
52 VLADO DADIÆ, VJEKOSLAV TIÈINA, DAMIR IVANKOVIÆ
Figure 4. Semi-variograms with corresponding linear model trends respectively for distance 1, 2.5, 5, 7.5,10 and 12.5 Nm among stations along measuring transects
53USAGE OF GEOSPATIAL METHODS IN DETERMINATION OF PELAGIC FISH STOCK DISTRIBUTION
For distances between stations along transects larger than the distance between transects(Fig. 4F), there was no homogeneity within the data. In this case, objective kriging could notbe used for assessment of the spatial fields of stock population, as the variance of errorsobtained becomes too high and reconstructed fields become artificial.
Where data have been interpolated from measuring stations with a different distancebetween them (from 1nm up to 10nm) along the transects, the resulting spatial field becomesmoother, but total stock of pelagic fish population does not vary significantly and thecorresponding spatial fields of fish stock population are, therefore, realistic.
It can be concluded that the maximum distance between stations for surveying of pelagicfish stock population in the Adriatic Sea can be up to 10 nm, but for larger distances, thespatial fields become unrealistic.
References
Dadiæ V., Ivankovic D., 2007: MEDAS system for archiving, visualisation and validation of oceanographicdata. V. Berghe, E.W. Appeltans, M.J. Costallo, P. Pissierssens (Eds). Proceedings of �Ocean BiodiversityInformatics�: An international conference on marine biodiversity data management Hamburg, Germany,29. Nov. � 1 Dec, 2004. Paris, UNESCO/IOC, VLIZ, BSH, 2007 vi+192pp: 37-48.
Dadiæ V., Srdeliæ M., Gr�etiæ Z., 2001: Analysis of oceanographic properties of the Adriatic Sea by GIStechnique. The 20th international cartographic conference, Beijing, China. Proceedings: 575-584.
Dadiæ V., Srdeliæ M., Ivankoviæ D., 2000: Analysis of Oceanographic properties of the Adraitic Sea by GIStechnique. GIS-Croatia 2000 International Symposium, Zagreb-Osijek, September 27-29, 2000: 8 pp.
Deutch C.V. and A.G. Journel, 1992: GSLIB � Geostatistical software; library and user�s guide. OxfordUniversity Press. 369 pp.
Graaf G., Marttin F., Aguilar-Manjarrez J. and Jenness J., 2003: Geographical information systems in fishe-ries management and planning. Technical manual. FAO fisheries technical paper No. 449. 162 pp + 2 CD.
Journel A.G. and C.J. Huijbregts, 1993. Mining geostatistics. Academic Press. 600 pp.
Abstract
In the framework of the PELMON Project, monitoring of pelagic fish stock was performed over twentydays in September 2007 by the research vessel Bios in the Croatian territorial waters and Exclusiveeconomic zone of the Adriatic Sea. The cruise was performed in transects, organized as square likeprofiles with 10 nautical miles distance between them. Fish stock measured by special type of fish finderecho sounder and, in addition, some other oceanographic parameters. Distance between stationsalong transect was selected from one to twelve and half nautical miles. As pelagic fish migraterelatively fast, in comparison with the bottom fish population, special care was needed in data processingand analysis. Therefore, GIS with objective kriging were useful tools for investigating the assessmentof the spatial distribution of the pelagic fish stock population. It was found that the distance amongstations along measuring transects could have a significant influence on the quality and precision ofthe modelled spatial distribution of the fish population.
Streszczenie
W ramach projektu PELMON, przez ponad dwadzie�cia dni wrze�nia 2007 r., prowadzony by³monitoring populacji ryb pelagicznych za pomoc¹ okrêtu badawczego Bios na wodach terytorialnychChorwacji oraz Wy³¹cznej strefie ekonomicznej Morza Adriatyckiego. Tor rejsu przebiega³ wzd³u¿poprzecznych pasów, zorganizowanych w profile odleg³e od siebie o 10 mil morskich. Populacja rybmierzona by³a za pomoc¹ specjalnego typu hydrolokatora do poszukiwania ryb oraz, dodatkowo,

54 VLADO DADIÆ, VJEKOSLAV TIÈINA, DAMIR IVANKOVIÆ
innych parametrów oceanograficznych. Odleg³o�æ miêdzy stanowiskami w obrêbie jednego pasawybrana zosta³a z zakresu od jednej do dwunastu i pó³ mil morskich. Jako ¿e ryby pelagiczne migruj¹wzglêdnie szybko w porównaniu z populacj¹ ryb dennych, zaistnia³a potrzeba zachowania szczegól-nej uwagi podczas procesów przetwarzania i analizy. Z tego wzglêdu u¿ytecznymi narzêdziami bada-nia oceny przestrzennego rozmieszczenia populacji ryb pelagicznych by³y systemy GIS wraz z krigin-giem przedmiotowym. Odkryto, i¿ odleg³o�æ miêdzy stanowiskami w obrêbie pasów pomiarowychmog³a mieæ znacz¹cy wp³yw na jako�æ i dok³adno�æ wyznaczonego modelu przestrzennego rozmiesz-czenia populacji ryb.
UPOTREBA GEOPROSTORNIH METODA U ODREÐIVANJU
RASPODIJELE STOKA PELAGIÈNIH RIBA
Kljuène rijeèi: Raspodjela stoka pelagiènih riba, geoprostorna interpolacija
Sa�etak
U okviru projekta PELMON istra�ivan je stok pelagiènih riba u hrvatskim teritorijalnim vodama iZERP-u tijekom dvadeset dana u rujnu 2007. godine pomoæu I/B Bios. Kako pelagiène ribe migrirajurelativno brzo u usporedbi s pridnenom ribljom populacijama posebna pozornost je posveæenanaèinu mjerenja, te obradi i analizi prikupljenih podataka. Tako su mjerenja obavljena uzdu� uspo-rednih �kvadratiènih� profila s meðusobnom udaljeno�æu oko 10Nm. Riblji stok je registriran �fishfinder� ehosonderom uz mjerenje nekoliko dodatnih oceanografskih parametara. U svrhu ispitivanjautjecaja razlièitih udaljenosti izmeðu postaja uzdu� mjerenih profila na procjenu ribljeg stoka, tijekommjerenja su podatci interpolirani na 6 razlièitih udaljenosti izmeðu postaja u rasponu od jedne dodvanaest nautièkih milja. U ovu namjenu su kori�teni GIS alati s kriging geoprostornom interpolaci-jom. Ispitivanja su pokazala da izabrana udaljenost izmeðu postaja mo�e znaèajno utjecati na izgledi toènost procijenjenih geoprostornih polja stoka riblje populacije.
Prof. Vlado Dadiæ, PhD. [email protected]: + 385 21 408011
Vjekoslav Tièina, PhD. [email protected]
Damir Ivankoviæ, [email protected]
http//: www.izor.hr
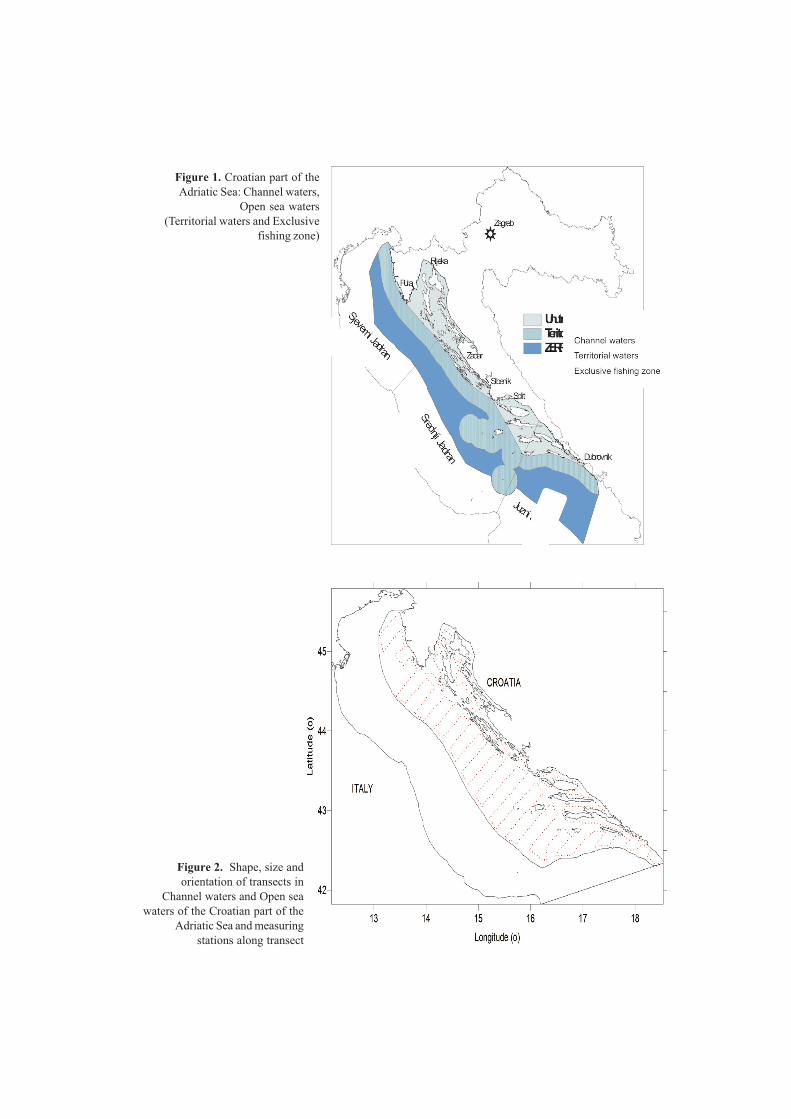
55USAGE OF GEOSPATIAL METHODS IN DETERMINATION OF PELAGIC FISH STOCK DISTRIBUTIONFigure 1. Croatian part of theAdriatic Sea: Channel waters,
Open sea waters (Territorial waters and Exclusive
fishing zone)
Figure 2. Shape, size andorientation of transects in
Channel waters and Open seawaters of the Croatian part of the
Adriatic Sea and measuringstations along transect
56 VLADO DADIÆ, VJEKOSLAV TIÈINA, DAMIR IVANKOVIÆ
Figure 3. Spatial fields of distribution of pelagic fish population obtained by kriging methodof interpolation respectively for distance 1, 2.5, 5, 7.5, 10 and 12.5 nm among stations
along measuring transects