
T:ree communities and human influence the Western Ghats, India
Faculteit Bio-ingenieurswetenschappen
Academiejaar 2013 - 2014
Influence of brewhouse operations on metal ions concentration in the wort
Ynwie Van Ackere Internal mentor:
Prof. Dr. A. Van Landschoot External mentor: Dr. A. Poreda Katedra Technologii Fermentacji, Uniwersytet Rolniczy w Krakowie Poland
Masterproef voorgedragen tot het behalen van de graad van Master of Science in de industriële wetenschappen: biochemie
Master Thesis nominated to obtain the degree of Master of Science in Industrial Sciences: Biochemistry

2
3
Faculteit Bio-ingenieurswetenschappen
Academiejaar 2013 - 2014
Influence of brewhouse operations on metal ions concentration in the wort
Ynwie Van Ackere Internal mentor:
Prof. Dr. A. Van Landschoot External mentor: Dr. A. Poreda Katedra Technologii Fermentacji, Uniwersytet Rolniczy w Krakowie Poland
Masterproef voorgedragen tot het behalen van de graad van Master of Science in de industriële wetenschappen: biochemie
Master Thesis nominated to obtain the degree of
Master of Science in Industrial Sciences: Biochemistry
4
Preface
First of all I would like to thank doctor Aleksander Poreda for all his knowledge and
patience which have helped me bringing this thesis to a successful end. His dedication
and motivation were a source of inspiration and an example. Secondary I would like to
thank the Rolniczy University and the Erasmus organisation giving me the chance to take
part of this exchange project and provide me of knowledge and care and made this
placement possible. Special thanks to Ellen Hollevoet who helped checking and correcting
this thesis, and Maximilian Pyrek for all his support during my stay in Poland.
Furthermore I would like to thank my girlfriend, friends and family for all their help,
support and encouragement.
5
Abstract
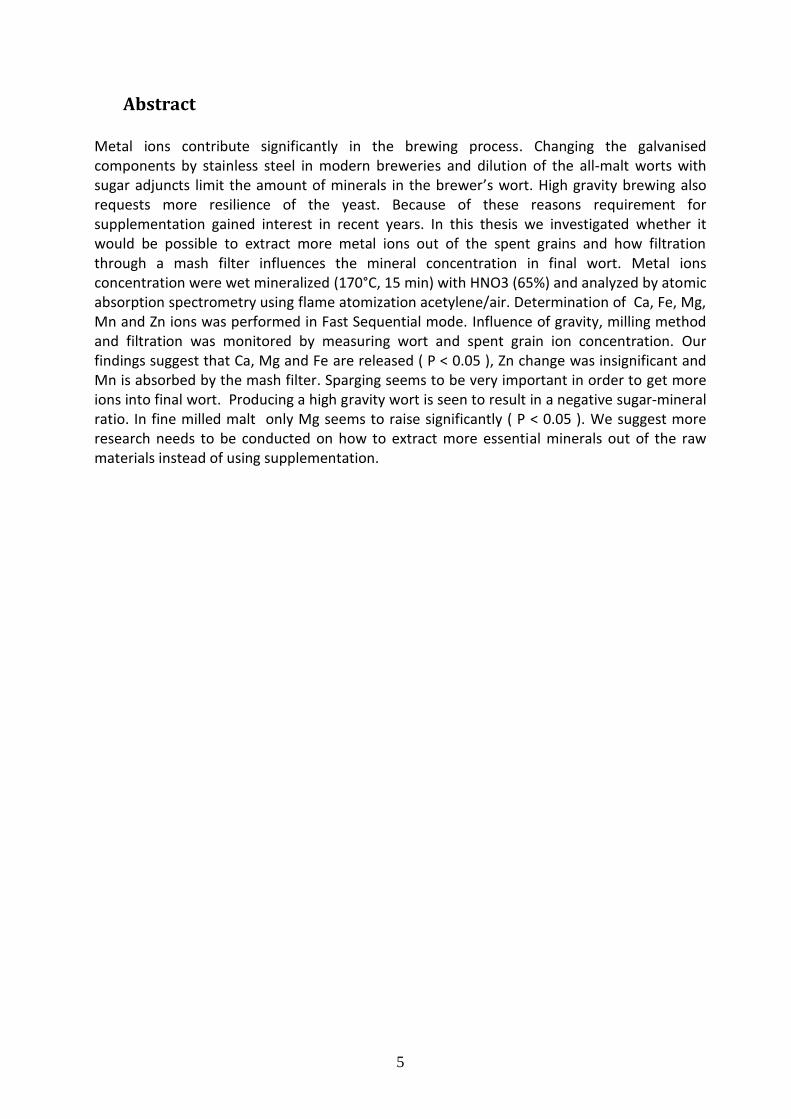
Metal ions contribute significantly in the brewing process. Changing the galvanised components by stainless steel in modern breweries and dilution of the all-malt worts with sugar adjuncts limit the amount of minerals in the brewer’s wort. High gravity brewing also requests more resilience of the yeast. Because of these reasons requirement for supplementation gained interest in recent years. In this thesis we investigated whether it would be possible to extract more metal ions out of the spent grains and how filtration through a mash filter influences the mineral concentration in final wort. Metal ions concentration were wet mineralized (170°C, 15 min) with HNO3 (65%) and analyzed by atomic absorption spectrometry using flame atomization acetylene/air. Determination of Ca, Fe, Mg, Mn and Zn ions was performed in Fast Sequential mode. Influence of gravity, milling method and filtration was monitored by measuring wort and spent grain ion concentration. Our findings suggest that Ca, Mg and Fe are released ( P < 0.05 ), Zn change was insignificant and Mn is absorbed by the mash filter. Sparging seems to be very important in order to get more ions into final wort. Producing a high gravity wort is seen to result in a negative sugar-mineral ratio. In fine milled malt only Mg seems to raise significantly ( P < 0.05 ). We suggest more research needs to be conducted on how to extract more essential minerals out of the raw materials instead of using supplementation.
6
Content 1 Introduction ..................................................................................................................................... 11
2 Literary study ................................................................................................................................... 11
2.1 Use of metal ions in brewing process ..................................................................................... 11
2.2 Sources of metal ions in brewing process .............................................................................. 11
2.2.1 Malt .................................................................................................................... 12
2.2.2 Yeast ................................................................................................................... 12
2.2.3 Hop ..................................................................................................................... 12
2.2.4 Water .................................................................................................................. 12
2.3 Effects of metal ions in brewing process ................................................................................ 13
2.3.1 Magnesium ......................................................................................................... 13
2.3.2 Calcium .............................................................................................................. 14
2.3.3 Zinc ..................................................................................................................... 15
2.3.4 Manganese .......................................................................................................... 16
2.3.5 Iron ..................................................................................................................... 17
3 Materials and methods .................................................................................................................... 18
3.1 Mashing ................................................................................................................................... 18
3.1.1 Preparation of malt ............................................................................................. 18
3.1.2 Mashing procedure ............................................................................................. 19
3.1.3 Standardization of mashing ................................................................................ 20
3.2 Filtration .................................................................................................................................. 20
3.3 Measurement of haze ............................................................................................................. 21
3.4 Measurement of color ............................................................................................................ 21
3.5 Measurement of gravity ......................................................................................................... 22
3.6 Digestion and mineralisation .................................................................................................. 22
3.6.1 Preparation of samples ....................................................................................... 23
3.6.2 Use of Mars Microwave ..................................................................................... 24
3.6.3 Standardization of samples ................................................................................. 24
3.7 Determination of metal ion concentration using AAS ............................................................ 25
3.7.1 Standard curve .................................................................................................... 25
3.8 Sampling .................................................................................................................................. 26
3.8.1 Sampling of wort ................................................................................................ 26
3.8.2 Sampling of spent grains .................................................................................... 26
7
3.9 Measurement of dry matter ................................................................................................... 26
3.10 Specific experimental set-ups ................................................................................................. 26
3.11 Data processing ....................................................................................................................... 27
4 Results.............................................................................................................................................. 28
4.1 Aim of the experiments .......................................................................................................... 28
4.2 Metal ions in raw material ...................................................................................................... 30
4.3 Metal ions uptake ................................................................................................................... 31
4.4 Correlation between metal ions and gravity .......................................................................... 32
4.5 Correlation between metal ions and haze .............................................................................. 35
4.6 Correlation between metal ions and color ............................................................................. 36
4.7 Metal ions in husk and solubility ............................................................................................ 37
4.8 Effect of filtration on metal ion concentration in wort .......................................................... 37
4.8.1 Concentration of metal ions in filtered wort during filtration ........................... 37
4.8.2 Concentration of metal ions in wort on top of the filter during filtration .......... 38
4.8.3 Influence of filtration on metal ion concentration in wort ................................. 39
4.8.4 Metal ions in spent grains after filtration ........................................................... 41
4.8.5 Metal ion concentration in wort after repetitive filtrations ................................ 42
4.9 Influence of milling method .................................................................................................... 43
4.10 Influence of cooking and hop addition to wort metal ion concentration .............................. 43
5 Discussion ........................................................................................................................................ 45
5.1 Raw material ........................................................................................................................... 45
5.2 Filtration .................................................................................................................................. 46
5.3 Haze, Color and Gravity .......................................................................................................... 47
5.4 Milling method ........................................................................................................................ 48
5.5 Cooking ................................................................................................................................... 48
6 Conclusion ....................................................................................................................................... 49
7 References ....................................................................................................................................... 50
8 Appendices ...................................................................................................................................... 51
8.1 Appendix 1: Checklist for using Varian AA240FS .................................................................... 51
8.2 Appendix 2 Method for digestion of organic compounds with Mars Microwave .................. 56
8
Figures
Figure 1: Alcohol dehydrogenase[11] ----------------------------------------------------------------------- 15
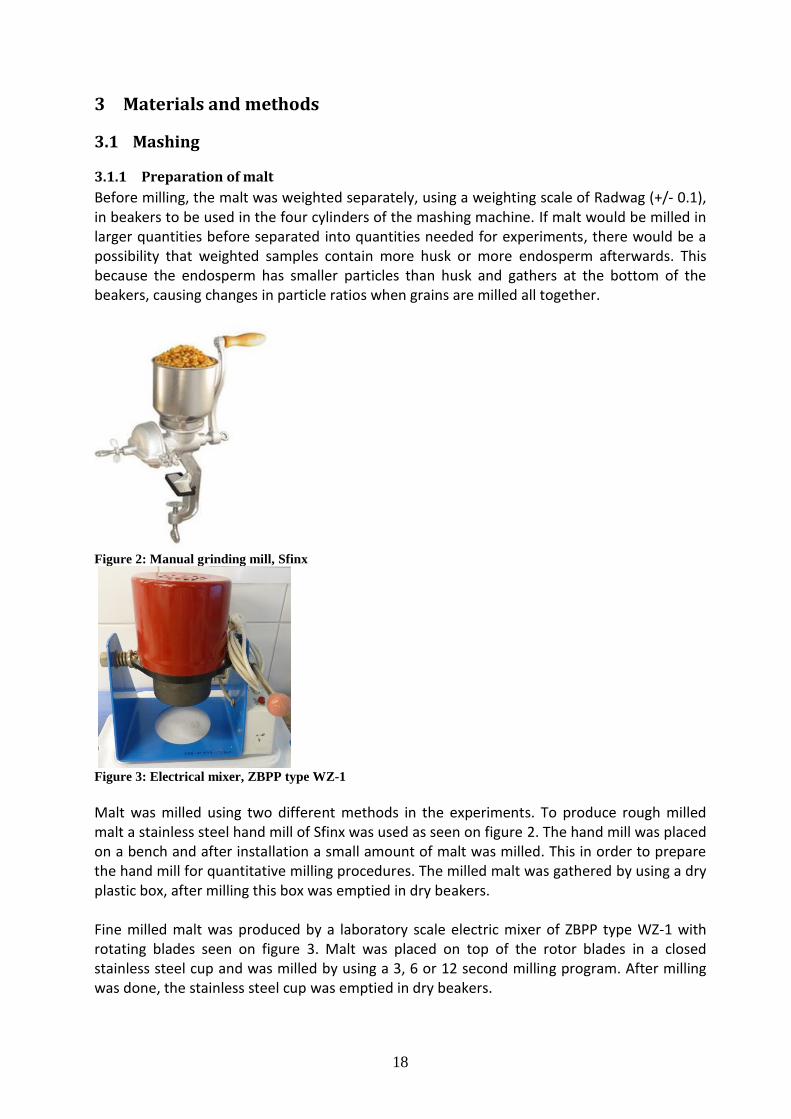
Figure 2: Manual grinding mill, Sfinx ------------------------------------------------------------------------- 18
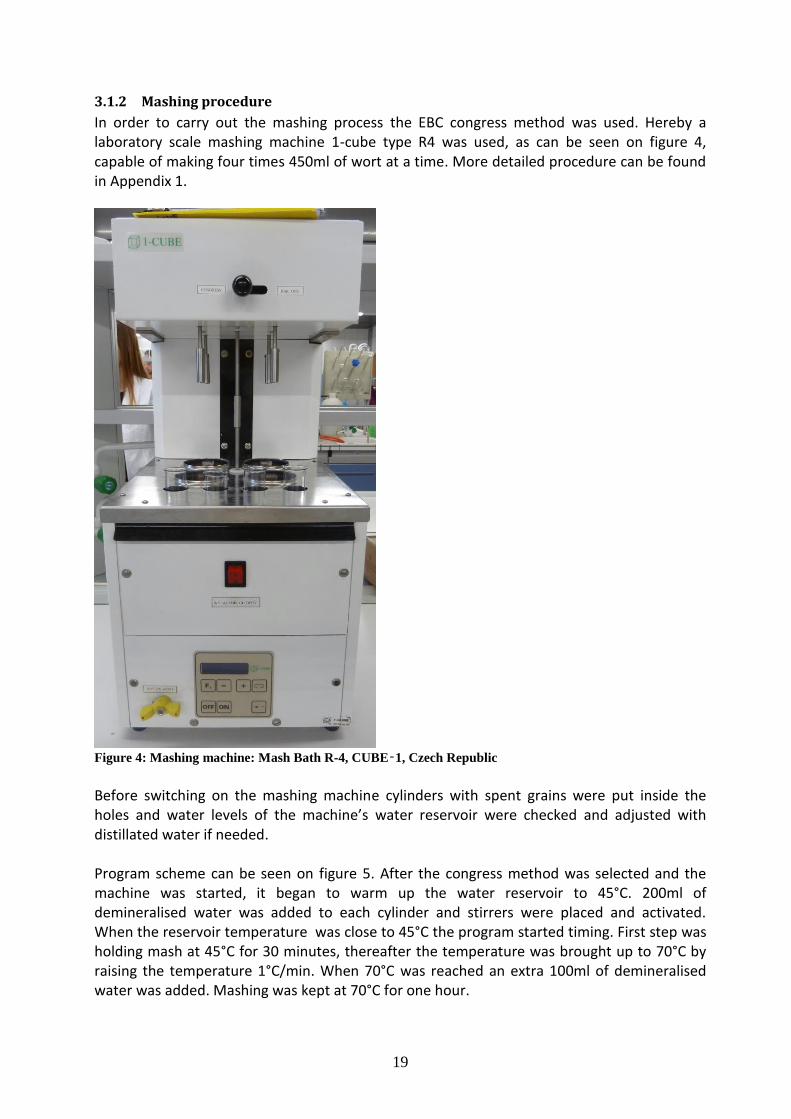
Figure 3: Electrical mixer, ZBPP type WZ-1 ----------------------------------------------------------------- 18
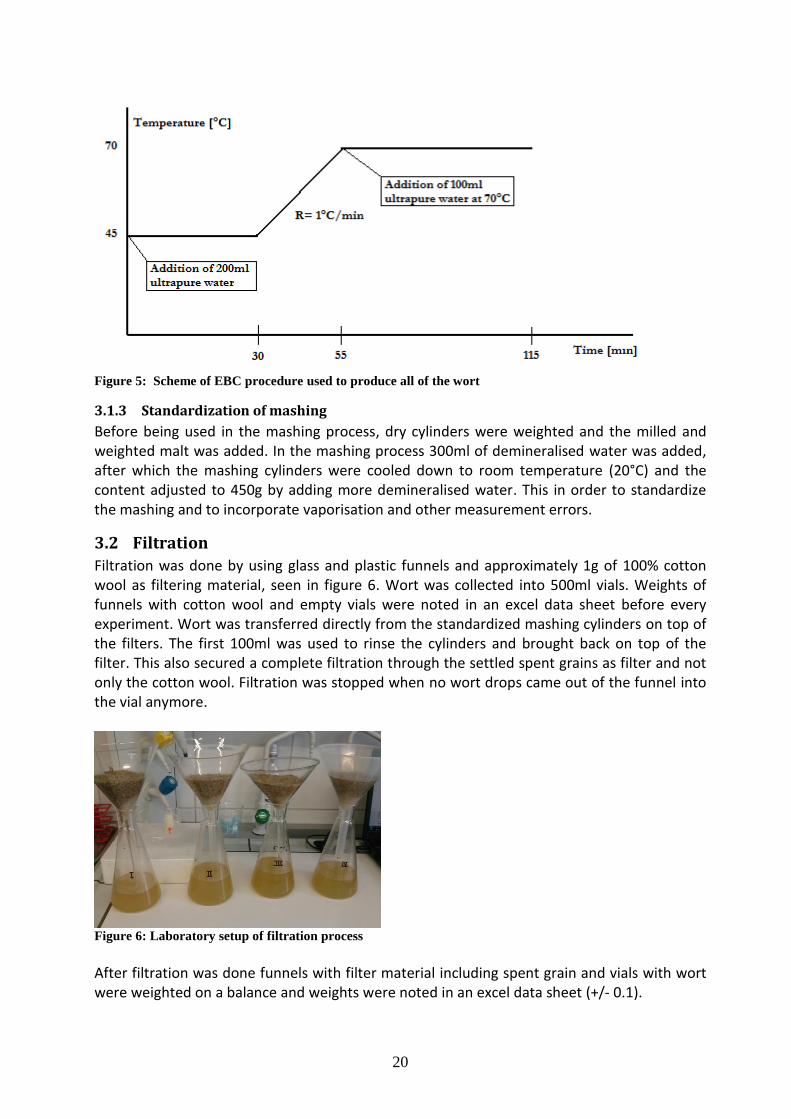
Figure 4: Mashing machine: Mash Bath R-4, CUBE‑1, Czech Republic ------------------------------ 19
Figure 5: Scheme of EBC procedure used to produce all of the wort ------------------------------- 20
Figure 6: Laboratory setup of filtration process ----------------------------------------------------------- 20
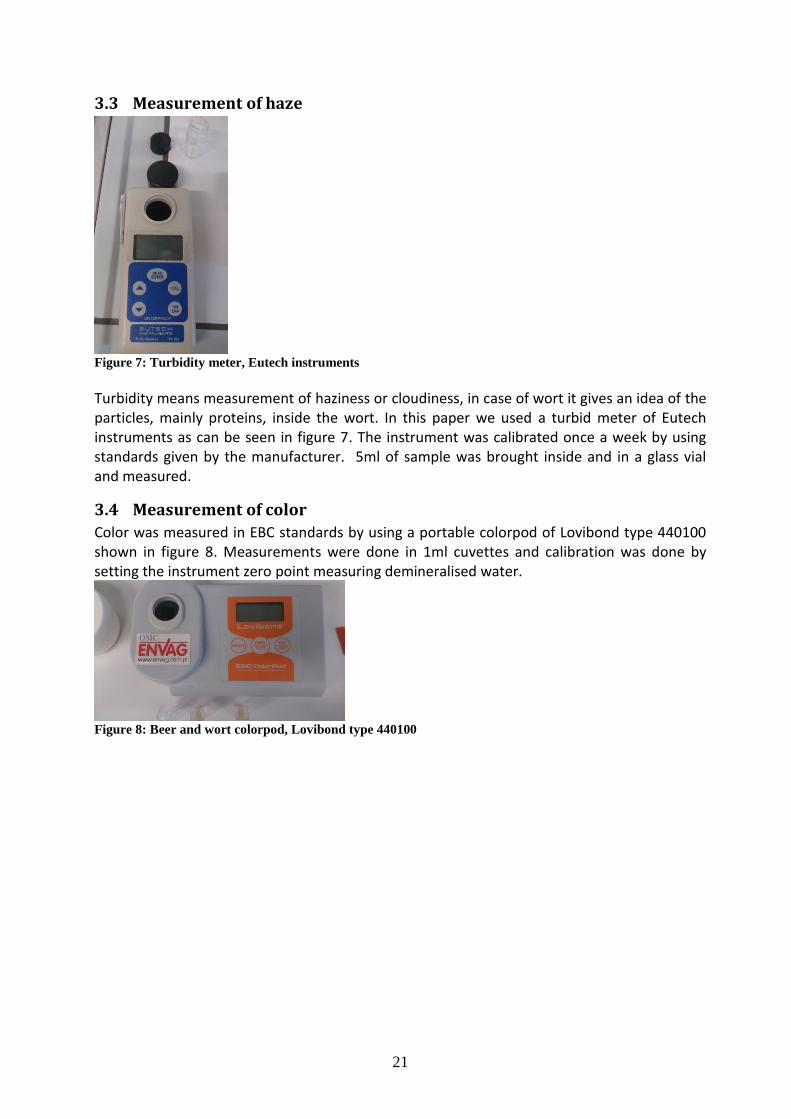
Figure 7: Turbidity meter, Eutech instruments ------------------------------------------------------------ 21
Figure 8: Beer and wort colorpod, Lovibond type 440100---------------------------------------------- 21
Figure 9: Fefractometer, Hanna instruments type HI 96801 ------------------------------------------- 22
Figure 10: Mars Microwave ------------------------------------------------------------------------------------ 22
Figure 11: Tubes for digestion of organic compound with Mars Microwave ----------------------- 23
Figure 12: Tubes for use in Mars Microwave -------------------------------------------------------------- 23
Figure 13: Rack for tubes of Mars Microwave ------------------------------------------------------------- 24
Figure 14: Experiment 1: Metal ion concentration of Mn, Fe and Zn in different sections of the
malt measured with AAS technique ------------------------------------------------------------------------- 30
Figure 15: Experiment 1: Metal ion concentration of Ca and Mg in different sections of the
malt measured with AAS technique ------------------------------------------------------------------------- 30
Figure 16: Experiment 3: Metal ion concentration of Ca and Mg in worts of different gravities
----------------------------------------------------------------------------------------------------------------------- 32
Figure 17: Experiment 3: Metal ion concentration of Mn, Fe and Zn in wort of different
gravities ------------------------------------------------------------------------------------------------------------ 32
Figure 18: Experiment 3: Metal ion concentration of Mn, Fe and Zn per 1°P in worts produced
of different gravities --------------------------------------------------------------------------------------------- 33
Figure 19: Experiment 3: Metal ion concentration of Ca and Mg per 1°P in worts produced of
different gravities ------------------------------------------------------------------------------------------------ 33
Figure 20: Linear regression graph of gravity [°P] verus metal ion concentrations [mg/l] of Mn,
Fe and Zn ----------------------------------------------------------------------------------------------------------- 34
Figure 21:Linear regression graph of gravity [°P] verus metal ion concentrations [mg/l] of total
ions, Ca and Mg --------------------------------------------------------------------------------------------------- 34
Figure 22: Linear regression graph of haze [NTU] versus metal ion concentrations [mg/l] of
Mn, Fe and Zn ----------------------------------------------------------------------------------------------------- 35
Figure 23: Linear regression graph of haze [NTU] versus metal ion concentrations [mg/l] of
total ions, Ca and Mg -------------------------------------------------------------------------------------------- 35
Figure 24: Linear regression graph of color [EBC standards] versus metal ion concentrations
[mg/l] of Mn, Fe and Zn ----------------------------------------------------------------------------------------- 36
Figure 25: Linear regression graph of color [EBC standards] versus metal ion concentrations
[mg/l] of total ions, Ca and Mg-------------------------------------------------------------------------------- 36
9
Figure 26: Experiment 4: influence of temperature on extractability of Ca and Mg ions in husk
----------------------------------------------------------------------------------------------------------------------- 37
Figure 27: Experiment 5: concentration of calcium in filtered wort during filtration ------------ 37
Figure 28: Experiment 5: Concentration of magnesium in 40ml batches of filtered wort during
filtration ------------------------------------------------------------------------------------------------------------ 38
Figure 29: Experiment 5: Concentration of Mn, Fe and Zn in 40ml batches of filtered wort
during filtration --------------------------------------------------------------------------------------------------- 38
Figure 30: Experiment 5: Concentration of Mn, Fe and Zn in wort on top of filter during
filtration in time -------------------------------------------------------------------------------------------------- 39
Figure 31: Experiment 5: Concentration of Ca and Mg in wort on top of filter during filtration
in time -------------------------------------------------------------------------------------------------------------- 39
Figure 32: Experiment 5: Concentration of calcium ions before and after filtration N = amount
of replicates ------------------------------------------------------------------------------------------------------- 39
Figure 33:Experiment 5: Concentration of Mn, Fe and Zn ions before and after filtration N =
amount of replicates -------------------------------------------------------------------------------------------- 40
Figure 34: Experiment 5: Concentration of magnesium ions before and after filtration N =
amount of replicates -------------------------------------------------------------------------------------------- 40
Figure 35: Experiment 6: Concentration of magnesium during sparging process of spent grains
with demineralised water, samples taken per 15ml of rinsing water used and calculated to
concentration per degree Plato [mg/l*°P] ----------------------------------------------------------------- 41
Figure 36: Experiment 6: Concentration of calcium during sparging process of spent grains
with demineralised water, samples taken per 15ml of rinsing water used and calculated to
concentration per degree Plato [mg/l*°P] ----------------------------------------------------------------- 41
Figure 37: Experiment 6: Concentration of Mn, Fe and Zn during sparging process of spent
grains with demineralised water, samples taken per 15ml of rinsing water used and calculated
to concentration per degree Plato [mg/l*°P] -------------------------------------------------------------- 42
Figure 38: Experiment 9: Concentration of Ca and Mg ions measured during repetitive
filtrations of the same wort over the same mash filter ------------------------------------------------- 42
Figure 39: Experiment 9: Concentration of Mn and Zn ions measured during repetitive
filtrations of the same wort over the same mash filter ------------------------------------------------- 43
Figure 40: Experiment 10: Concentration [mg/l] of Ca and Mg ions before and after addition of
hops and cooking------------------------------------------------------------------------------------------------- 44
Figure 41: Experiment 10: Concentration [mg/l] of Mn, Fe and Zn ions before and after
addition of hops and cooking --------------------------------------------------------------------------------- 44
10
Tables
Table 1: Specific concentration of ions reported in yeast and wort ---------------------------------- 11
Table 2: Requirements for service water according to M. Eumann and S. Schildbach.[8] ------ 13
Table 4: Wort and yeast program of Mars Microwave -------------------------------------------------- 24
Table 5: Concentrations of metal ions in bulk standard used for AAS measurements ----------- 25
Table 6: Concentrations used to make the standard curves in AAS ---------------------------------- 25
Table 7: Wave lengths used for measuring ions in AAS ------------------------------------------------- 25
Table 8: EXPERIMENT 7: Concentration of metal ions in old and new malt and in wort and
spent grains derived from these malts. --------------------------------------------------------------------- 31
Table 9: Concentration of metal ions in spent grains, wort and complete grains measured
throughout all experiments ------------------------------------------------------------------------------------ 31
Table 10: Absolute amount of metal ions [mg] in spent grains and wort measured throughout
all experiments --------------------------------------------------------------------------------------------------- 31
Table 11: Concentration [mg/l] of metal ions in wort obtained using different milling methods
before and after filtration -------------------------------------------------------------------------------------- 43
Table 12: Concentration of metal ions in dry hop pellets in [mg/kg] -------------------------------- 44
Abbreviations
SIPS : Sample Introduction System AAS : Atomic Absorption Spectrometry
11
1 Introduction
Increased competition within the brewing industry as well as the need to maximize the yield of raw materials and minimize energy expenditure has led to process optimizing. A lot of brewers are looking at high gravity brewing in order to save expenses. New and higher demands of the yeast arise. Production problems such as slow or stuck fermentations and poor yeast viability are more common in this process. Ethanol toxicity has been cited as the main cause, as brewers' yeasts are reported to tolerate only 7 to 9% (vol/vol) ethanol[1]. The inhibitory effect of high osmotic pressure has also been implicated. In the brewing industry it is believed that some metal ions contribute significantly in a lot of different ways in the brewing process. Though supplementation of metal ions in the brew house is not been fully introduced yet, there already are possibilities to buy or make metal enriched yeast strains[2]. It is believed that these enriched yeast strains are more viable because of higher resistance to stress factors, more vital, That they grow faster and have a higher metabolic yield. Reports have been made of supplementations of metal ions in propagation step and directly in wort[3]. This study will try to find out which concentration come out of the malt in the mashing process and how concentration is influenced by filtration and boiling. Samples were measured by AAS or Atomic Absorption Spectrometry, ions treated were calcium, manganese, iron, zinc and magnesium.
2 Literary study
2.1 Use of metal ions in brewing process
Years have past without really knowing about the evolvement of metal ions in the brewing process. As the industrialisation still grows the interest in optimizing the brewery process increases. The actual goal for doing this: creating optimal process conditions for brewing a repetitive and precise beer. It is known that fermentation medium should, apart from carbon, nitrogen and phosphorus, also contain minerals and growing factors. Among the many cations present in yeast and wort, magnesium, calcium, zinc, manganese, potassium and copper are the most involved in the regulation of structure and metabolic activity of the cells during growth and fermentation[4], while other ions are not desirable in the process or final beer.
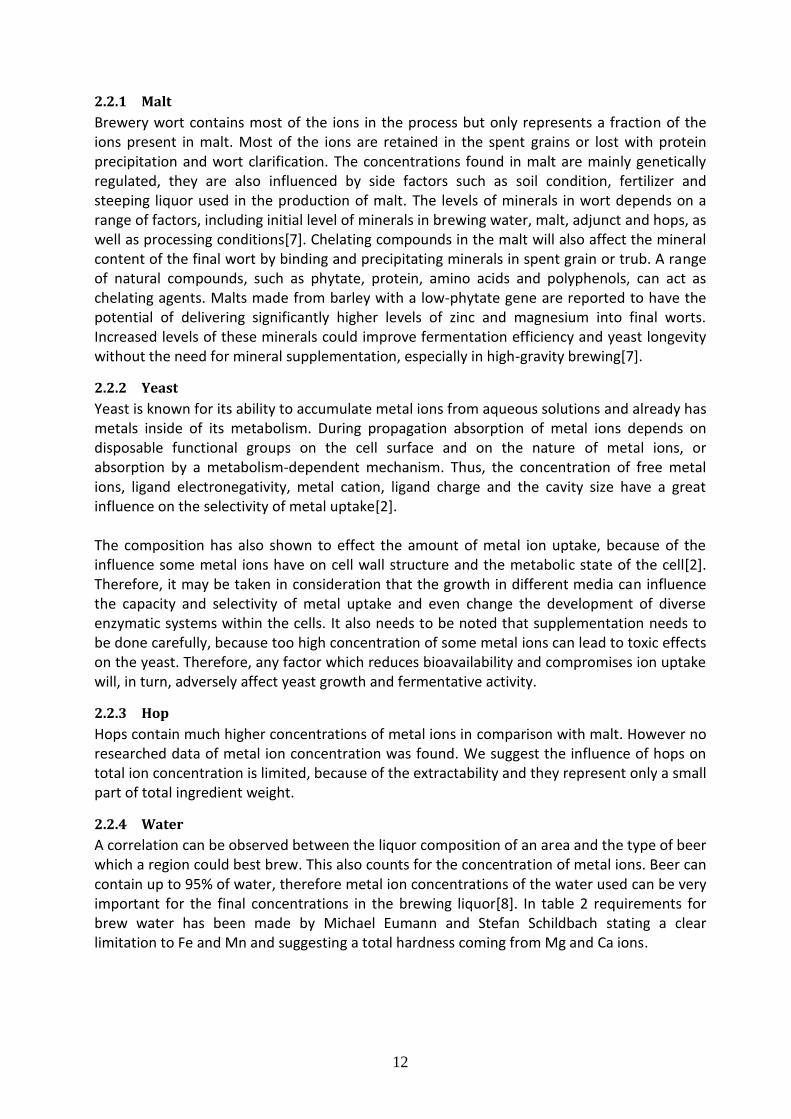
2.2 Sources of metal ions in brewing process Table 1 gives us a quick view on metal ion concentrations found in several studies.
Element Ion concentration Article
Zinc (wort) 0.1-5ppm [1, 5]
Magnesium (wort) 50-182ppm [1, 5]
Calcium (wort) 15-100ppm [1, 5]
Manganese (wort) 0.2 -0.32ppm [5, 6]
Zinc (yeast, growth) 5-15ppm [2]
Manganese (yeast, growth) 2-10ppm [2]
Iron (yeast, growth) 0.1-1ppm
Calcium (malt gris) 180-1600ppm [1] Table 1: Specific concentration of ions reported in yeast and wort
12
2.2.1 Malt
Brewery wort contains most of the ions in the process but only represents a fraction of the ions present in malt. Most of the ions are retained in the spent grains or lost with protein precipitation and wort clarification. The concentrations found in malt are mainly genetically regulated, they are also influenced by side factors such as soil condition, fertilizer and steeping liquor used in the production of malt. The levels of minerals in wort depends on a range of factors, including initial level of minerals in brewing water, malt, adjunct and hops, as well as processing conditions[7]. Chelating compounds in the malt will also affect the mineral content of the final wort by binding and precipitating minerals in spent grain or trub. A range of natural compounds, such as phytate, protein, amino acids and polyphenols, can act as chelating agents. Malts made from barley with a low-phytate gene are reported to have the potential of delivering significantly higher levels of zinc and magnesium into final worts. Increased levels of these minerals could improve fermentation efficiency and yeast longevity without the need for mineral supplementation, especially in high-gravity brewing[7].
2.2.2 Yeast
Yeast is known for its ability to accumulate metal ions from aqueous solutions and already has metals inside of its metabolism. During propagation absorption of metal ions depends on disposable functional groups on the cell surface and on the nature of metal ions, or absorption by a metabolism-dependent mechanism. Thus, the concentration of free metal ions, ligand electronegativity, metal cation, ligand charge and the cavity size have a great influence on the selectivity of metal uptake[2]. The composition has also shown to effect the amount of metal ion uptake, because of the influence some metal ions have on cell wall structure and the metabolic state of the cell[2]. Therefore, it may be taken in consideration that the growth in different media can influence the capacity and selectivity of metal uptake and even change the development of diverse enzymatic systems within the cells. It also needs to be noted that supplementation needs to be done carefully, because too high concentration of some metal ions can lead to toxic effects on the yeast. Therefore, any factor which reduces bioavailability and compromises ion uptake will, in turn, adversely affect yeast growth and fermentative activity.
2.2.3 Hop
Hops contain much higher concentrations of metal ions in comparison with malt. However no researched data of metal ion concentration was found. We suggest the influence of hops on total ion concentration is limited, because of the extractability and they represent only a small part of total ingredient weight.
2.2.4 Water
A correlation can be observed between the liquor composition of an area and the type of beer which a region could best brew. This also counts for the concentration of metal ions. Beer can contain up to 95% of water, therefore metal ion concentrations of the water used can be very important for the final concentrations in the brewing liquor[8]. In table 2 requirements for brew water has been made by Michael Eumann and Stefan Schildbach stating a clear limitation to Fe and Mn and suggesting a total hardness coming from Mg and Ca ions.
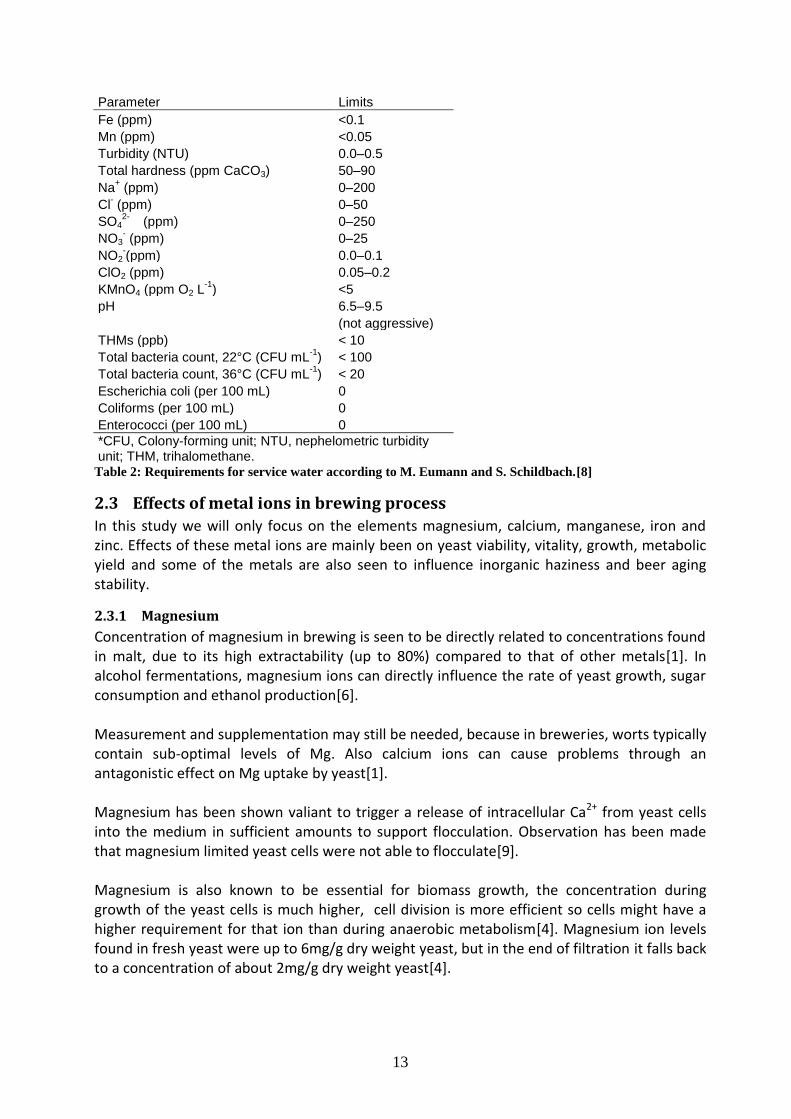
13
Parameter Limits
Fe (ppm) <0.1
Mn (ppm) <0.05
Turbidity (NTU) 0.0–0.5
Total hardness (ppm CaCO3) 50–90
Na+ (ppm) 0–200
Cl- (ppm) 0–50
SO42-
� (ppm) 0–250
NO3- (ppm) 0–25
NO2-(ppm) 0.0–0.1
ClO2 (ppm) 0.05–0.2
KMnO4 (ppm O2 L-1
) <5
pH 6.5–9.5
(not aggressive)
THMs (ppb) < 10
Total bacteria count, 22°C (CFU mL-1
) < 100
Total bacteria count, 36°C (CFU mL-1
) < 20
Escherichia coli (per 100 mL) 0
Coliforms (per 100 mL) 0
Enterococci (per 100 mL) 0
*CFU, Colony-forming unit; NTU, nephelometric turbidity unit; THM, trihalomethane.
Table 2: Requirements for service water according to M. Eumann and S. Schildbach.[8]
2.3 Effects of metal ions in brewing process
In this study we will only focus on the elements magnesium, calcium, manganese, iron and zinc. Effects of these metal ions are mainly been on yeast viability, vitality, growth, metabolic yield and some of the metals are also seen to influence inorganic haziness and beer aging stability.
2.3.1 Magnesium
Concentration of magnesium in brewing is seen to be directly related to concentrations found in malt, due to its high extractability (up to 80%) compared to that of other metals[1]. In alcohol fermentations, magnesium ions can directly influence the rate of yeast growth, sugar consumption and ethanol production[6]. Measurement and supplementation may still be needed, because in breweries, worts typically contain sub-optimal levels of Mg. Also calcium ions can cause problems through an antagonistic effect on Mg uptake by yeast[1]. Magnesium has been shown valiant to trigger a release of intracellular Ca2+ from yeast cells into the medium in sufficient amounts to support flocculation. Observation has been made that magnesium limited yeast cells were not able to flocculate[9]. Magnesium is also known to be essential for biomass growth, the concentration during growth of the yeast cells is much higher, cell division is more efficient so cells might have a higher requirement for that ion than during anaerobic metabolism[4]. Magnesium ion levels found in fresh yeast were up to 6mg/g dry weight yeast, but in the end of filtration it falls back to a concentration of about 2mg/g dry weight yeast[4].
14
Increased uptake of oxygen and increased ethanol production also suggested an increase in respire-fermentative activity in yeast cultures incubated with increased magnesium. Standard (12°P) and high gravity (20°P) wort supplemented with 500ppm magnesium resulted in higher fermentation rates, increased production of ethanol (5ml ethanol a litre extra) in both ale and lager strains[1]. This extra ethanol production can be caused directly by a higher resistant in ethanol toxicity, more of this in 2.3.2, 2.3.3 and 2.3.4. An alternative to wort supplementation can be pre-conditioning the yeast cells by propagation in Mg rich medium. This pre-conditioning step can increase cellular magnesium levels by several-fold. These pre-conditioned yeast cells have shown a greater ethanol productivity in subsequent wort fermentations than their ‘non-conditioned’ counterparts[1].
2.3.2 Calcium
Calcium is mostly involved in the flocculation process. In fermentation processes the timing of flocculation is important. It should not take place too early, before the wort is completely attenuated, because premature flocculation causes sluggish or stuck fermentation and final beers with high residual sugars and unsatisfactory flavour characteristics. Strong and virtually complete flocculation is desired at the end of fermentation. Calcium can here provide a cheap, effective and environmental friendly way to remove most of the yeast cells out of the green beer. It has been suggested that Ca2+ binds to flocculin proteins and provides them with the correct structural confirmation to form carbohydrate bindings[9]. This has been referred to as the so called ‘calcium bridging’ hypothesis. Flocculation with calcium is a reversible phenomenon: cell flocks can be dissociated again by adding a chelating agent that removes the calcium ions or by adding mannose, which competitively displaces cell wall mannose residues from flocculin binding sites[9], or otherwise bring the flocculated yeast cells in a new medium by inoculation. In non-complex media calcium ions are also seen to have a role in protecting cells against the toxic effects of ethanol just as Magnesium. However any positive effects of Ca supplementation on yeast growth is compromised by its antagonistic effect on Mg uptake and function. The physiological demand for Mg in yeast cells is larger than that for Ca and an increased concentration of wort Ca is likely to worsen Mg deficiency through antagonistic interactions[1]. This is the reason why Ca supplementation needs to be done with care. It can only be beneficial under certain circumstances, if Ca is supplemented in high concentrations it might replace Mg in a number of biochemical pathways which can lead to the general detriment of the cell. There has also been noted that Ca supplementation of mash or sparge water has a buffering effect which prevents a rise in pH of wort. A consistently low pH reduces the extraction of polyphenolic compounds and silica and positively influences beer characteristics such as haze formation and foam stability. The potential negative effects on cell growth and fermentation potential need to be taken into account[1].
15
2.3.3 Zinc
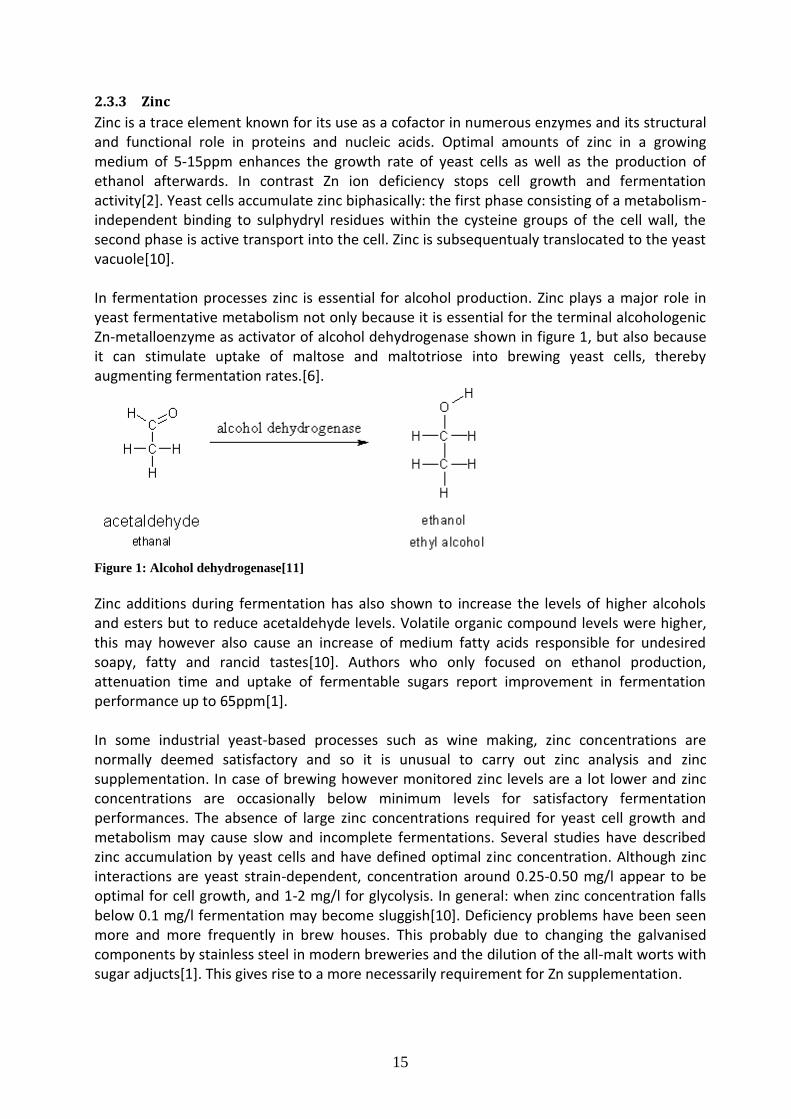
Zinc is a trace element known for its use as a cofactor in numerous enzymes and its structural and functional role in proteins and nucleic acids. Optimal amounts of zinc in a growing medium of 5-15ppm enhances the growth rate of yeast cells as well as the production of ethanol afterwards. In contrast Zn ion deficiency stops cell growth and fermentation activity[2]. Yeast cells accumulate zinc biphasically: the first phase consisting of a metabolism-independent binding to sulphydryl residues within the cysteine groups of the cell wall, the second phase is active transport into the cell. Zinc is subsequentualy translocated to the yeast vacuole[10]. In fermentation processes zinc is essential for alcohol production. Zinc plays a major role in yeast fermentative metabolism not only because it is essential for the terminal alcohologenic Zn-metalloenzyme as activator of alcohol dehydrogenase shown in figure 1, but also because it can stimulate uptake of maltose and maltotriose into brewing yeast cells, thereby augmenting fermentation rates.[6].
Figure 1: Alcohol dehydrogenase[11]
Zinc additions during fermentation has also shown to increase the levels of higher alcohols and esters but to reduce acetaldehyde levels. Volatile organic compound levels were higher, this may however also cause an increase of medium fatty acids responsible for undesired soapy, fatty and rancid tastes[10]. Authors who only focused on ethanol production, attenuation time and uptake of fermentable sugars report improvement in fermentation performance up to 65ppm[1]. In some industrial yeast-based processes such as wine making, zinc concentrations are normally deemed satisfactory and so it is unusual to carry out zinc analysis and zinc supplementation. In case of brewing however monitored zinc levels are a lot lower and zinc concentrations are occasionally below minimum levels for satisfactory fermentation performances. The absence of large zinc concentrations required for yeast cell growth and metabolism may cause slow and incomplete fermentations. Several studies have described zinc accumulation by yeast cells and have defined optimal zinc concentration. Although zinc interactions are yeast strain-dependent, concentration around 0.25-0.50 mg/l appear to be optimal for cell growth, and 1-2 mg/l for glycolysis. In general: when zinc concentration falls below 0.1 mg/l fermentation may become sluggish[10]. Deficiency problems have been seen more and more frequently in brew houses. This probably due to changing the galvanised components by stainless steel in modern breweries and the dilution of the all-malt worts with sugar adjucts[1]. This gives rise to a more necessarily requirement for Zn supplementation.
16
In the brewing process, malt wort boiling reduces zinc bioavailability as the metal may form complexes and precipitates with proteins, such as cysteine groups of peptides and amino acids. Supplementation of zinc to the medium has shown to improve flocculation and decrease the average size of the yeast flocks[9], probably due to both a partly exchange of Calcium in yeast cells and binding of zinc to yeast cell walls. Other effects on flocculation could not be seen in concentration used in the brew house. Taylor and Orton have shown inhibition of flocculation but only with a very high concentration of Zn in solution(6,540ppm)[1]. Yeast cells can however undergo zinc toxicity when no manganese is in the medium, more of this in 2.3.4. Zinc has also been seen to act as a stress protectant. Improvement in ethanol production with increasing Zn supplementation may suggest that Zn has a role in protecting cells against ethanol toxicity. Cells grown in zinc supplemented media have shown to resist an ethanol shock of 18% (v/v) for 30 minutes with an optimal concentration of 8ppm. This improvement in ethanol resistance can be associated with increased production of trehalose and ergosterol, which are known to protect membranes against ethanol enduced damage. Because the resistance occurs on membrane level the cells are automatically also more resistant to heat shocks[1]. Zn deficiency in yeast cells is also known to result in oxidative stress through the intracellular production of reactive oxygen species[1], potentially resulting in DNA damage, necessitating an antioxidant response in the yeast cell. In the search of bioavailability of zinc, additioning zinc during acid washing did not improve fermentation performance, also addition to hot wort was also not effective since bioavailable zinc would be lost by chelation to the trub. Physiologically speaking, the best time proposed for any zinc supplementations would be at pitching, where bioavailability would be higher[6]. Given the relatively low concentrations of naturally-occurring Zn in wort and its low level of redox activity compared with other metal ions such as Cu and Fe, it is unlikely that Zn ions will have significant direct effects on beer flavour[1].
2.3.4 Manganese
Yeast cells require manganese as an essential trace element at a concentration of 2-10ppm for optimal yeast growth. This element is reported to have an important role in the metabolism of the cell as part of some enzymes, for exp. Pyruvate carboxylase, glutamine synthetase and arginase. It is reported essential for the bud growth, enhancing the yeast growth, especially in aerobic conditions. Manganese is also present in the Golgi, where it activates glycosyltransferases, which are involved in the process of secreting proteins[2]. Presence of manganese ions are reported to be required for yeast to tolerate levels of zinc above 2 ppm[6], the zinc tolerance of yeast is however strain dependent, which mains that supplementation of manganese is difficult to estimate. Mn superoxide dismutase is also reported to play an important role in protecting cells against ethanol toxicity[1].
17
On the other hand manganese in final beer is reported to be of decisive importance for beer ageing. Like iron and copper it can catalyze the formation of radicals in beer without the influence of oxygen (e.g. in the formation of fatty acid radicals). This free radical formation results in a deterioration of flavour during storage. And in contrast to iron and copper, manganese ions are not removed from wort or beer to any great extent during the process[12]. Which makes of manganese an important parameter to choose raw materials in case long storage is desirable.
2.3.5 Iron
Only some research on iron has yet been conducted, iron seems to be of importance to growth of cells. Minoo S.E. et al. found that cells grown in low iron medium exhibited slower growth, with a 20% increase in doubling time compared with optimal-iron medium at the end of the culture period, confirming that iron was a limiting factor for growth in this medium. Cells grown in high iron medium also exhibited slower growth, with a 40% increase in doubling time, confirming that high iron cells were exposed to iron toxicity. Although respiration yields far more energy than fermentation, it also requires large quantities of iron, as respiratory complexes contain numerous enzymes with Fe-S clusters. Yeast can only use carbon sources to grow and these can only be metabolized through respiration. This is however not possible under conditions of iron deficiency. Iron deficiency has also been seen to cause metabolic adjustment indicated by the changes in mRNA transcript levels on redistribution of iron away from some non-essential biosynthetic pathways towards other, essential iron-requiring pathways[13]. As previously mentioned in 2.3.4 iron also plays an important part in beer aging. Radical formation is even faster than it was the case with manganese resulting in a faster deterioration of flavour during storage. That is why final iron concentration is important to monitor and why only minimal requirement for the yeast should be inside the brewing liquor.
18
3 Materials and methods
3.1 Mashing
3.1.1 Preparation of malt
Before milling, the malt was weighted separately, using a weighting scale of Radwag (+/- 0.1), in beakers to be used in the four cylinders of the mashing machine. If malt would be milled in larger quantities before separated into quantities needed for experiments, there would be a possibility that weighted samples contain more husk or more endosperm afterwards. This because the endosperm has smaller particles than husk and gathers at the bottom of the beakers, causing changes in particle ratios when grains are milled all together.
Figure 2: Manual grinding mill, Sfinx
Figure 3: Electrical mixer, ZBPP type WZ-1
Malt was milled using two different methods in the experiments. To produce rough milled malt a stainless steel hand mill of Sfinx was used as seen on figure 2. The hand mill was placed on a bench and after installation a small amount of malt was milled. This in order to prepare the hand mill for quantitative milling procedures. The milled malt was gathered by using a dry plastic box, after milling this box was emptied in dry beakers. Fine milled malt was produced by a laboratory scale electric mixer of ZBPP type WZ-1 with rotating blades seen on figure 3. Malt was placed on top of the rotor blades in a closed stainless steel cup and was milled by using a 3, 6 or 12 second milling program. After milling was done, the stainless steel cup was emptied in dry beakers.
19
3.1.2 Mashing procedure
In order to carry out the mashing process the EBC congress method was used. Hereby a laboratory scale mashing machine 1-cube type R4 was used, as can be seen on figure 4, capable of making four times 450ml of wort at a time. More detailed procedure can be found in Appendix 1.
Figure 4: Mashing machine: Mash Bath R-4, CUBE‑1, Czech Republic
Before switching on the mashing machine cylinders with spent grains were put inside the holes and water levels of the machine’s water reservoir were checked and adjusted with distillated water if needed. Program scheme can be seen on figure 5. After the congress method was selected and the machine was started, it began to warm up the water reservoir to 45°C. 200ml of demineralised water was added to each cylinder and stirrers were placed and activated. When the reservoir temperature was close to 45°C the program started timing. First step was holding mash at 45°C for 30 minutes, thereafter the temperature was brought up to 70°C by raising the temperature 1°C/min. When 70°C was reached an extra 100ml of demineralised water was added. Mashing was kept at 70°C for one hour.
20
Figure 5: Scheme of EBC procedure used to produce all of the wort
3.1.3 Standardization of mashing
Before being used in the mashing process, dry cylinders were weighted and the milled and weighted malt was added. In the mashing process 300ml of demineralised water was added, after which the mashing cylinders were cooled down to room temperature (20°C) and the content adjusted to 450g by adding more demineralised water. This in order to standardize the mashing and to incorporate vaporisation and other measurement errors.
3.2 Filtration
Filtration was done by using glass and plastic funnels and approximately 1g of 100% cotton wool as filtering material, seen in figure 6. Wort was collected into 500ml vials. Weights of funnels with cotton wool and empty vials were noted in an excel data sheet before every experiment. Wort was transferred directly from the standardized mashing cylinders on top of the filters. The first 100ml was used to rinse the cylinders and brought back on top of the filter. This also secured a complete filtration through the settled spent grains as filter and not only the cotton wool. Filtration was stopped when no wort drops came out of the funnel into the vial anymore.
Figure 6: Laboratory setup of filtration process
After filtration was done funnels with filter material including spent grain and vials with wort were weighted on a balance and weights were noted in an excel data sheet (+/- 0.1).
21
3.3 Measurement of haze
Figure 7: Turbidity meter, Eutech instruments
Turbidity means measurement of haziness or cloudiness, in case of wort it gives an idea of the particles, mainly proteins, inside the wort. In this paper we used a turbid meter of Eutech instruments as can be seen in figure 7. The instrument was calibrated once a week by using standards given by the manufacturer. 5ml of sample was brought inside and in a glass vial and measured.
3.4 Measurement of color
Color was measured in EBC standards by using a portable colorpod of Lovibond type 440100 shown in figure 8. Measurements were done in 1ml cuvettes and calibration was done by setting the instrument zero point measuring demineralised water.
Figure 8: Beer and wort colorpod, Lovibond type 440100
22
3.5 Measurement of gravity
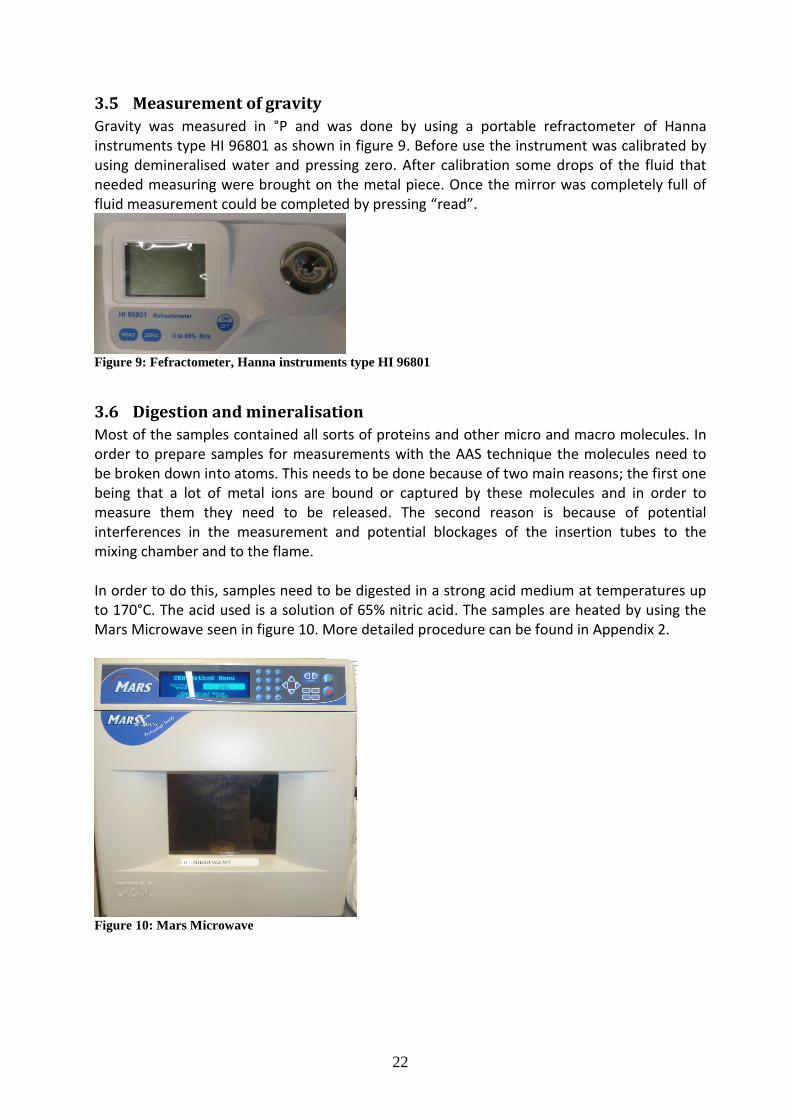
Gravity was measured in °P and was done by using a portable refractometer of Hanna instruments type HI 96801 as shown in figure 9. Before use the instrument was calibrated by using demineralised water and pressing zero. After calibration some drops of the fluid that needed measuring were brought on the metal piece. Once the mirror was completely full of fluid measurement could be completed by pressing “read”.
Figure 9: Fefractometer, Hanna instruments type HI 96801
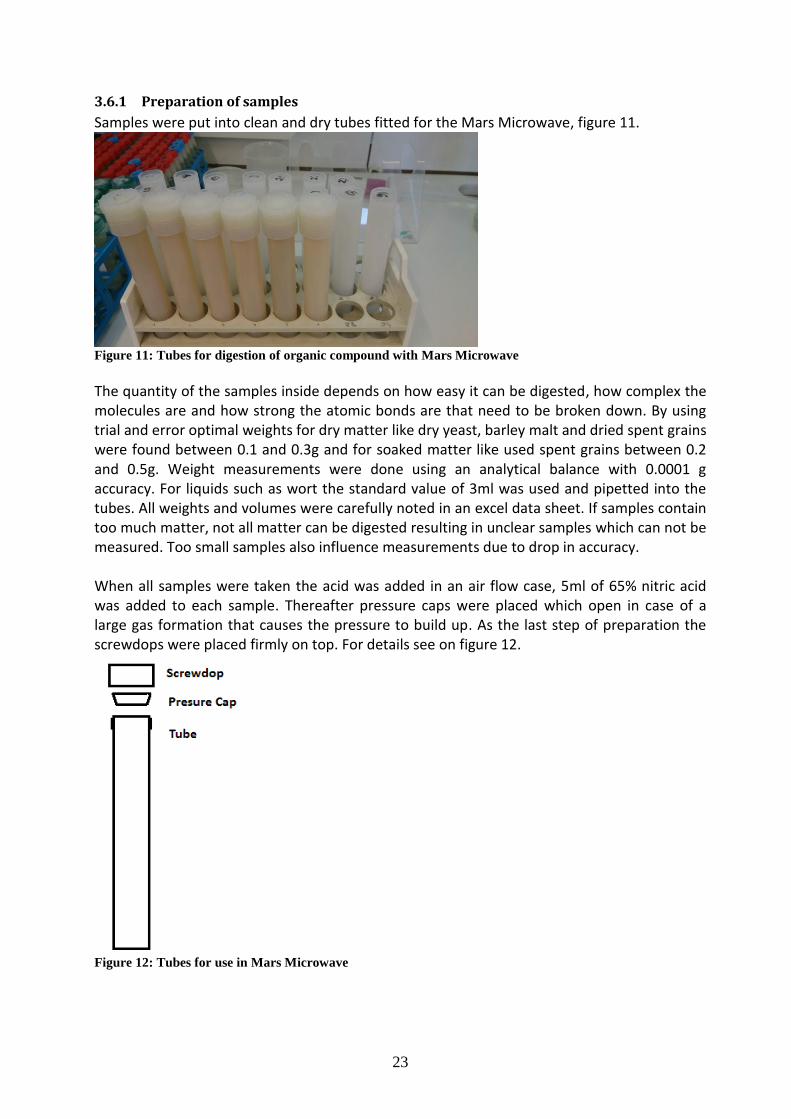
3.6 Digestion and mineralisation
Most of the samples contained all sorts of proteins and other micro and macro molecules. In order to prepare samples for measurements with the AAS technique the molecules need to be broken down into atoms. This needs to be done because of two main reasons; the first one being that a lot of metal ions are bound or captured by these molecules and in order to measure them they need to be released. The second reason is because of potential interferences in the measurement and potential blockages of the insertion tubes to the mixing chamber and to the flame. In order to do this, samples need to be digested in a strong acid medium at temperatures up to 170°C. The acid used is a solution of 65% nitric acid. The samples are heated by using the Mars Microwave seen in figure 10. More detailed procedure can be found in Appendix 2.
Figure 10: Mars Microwave
23
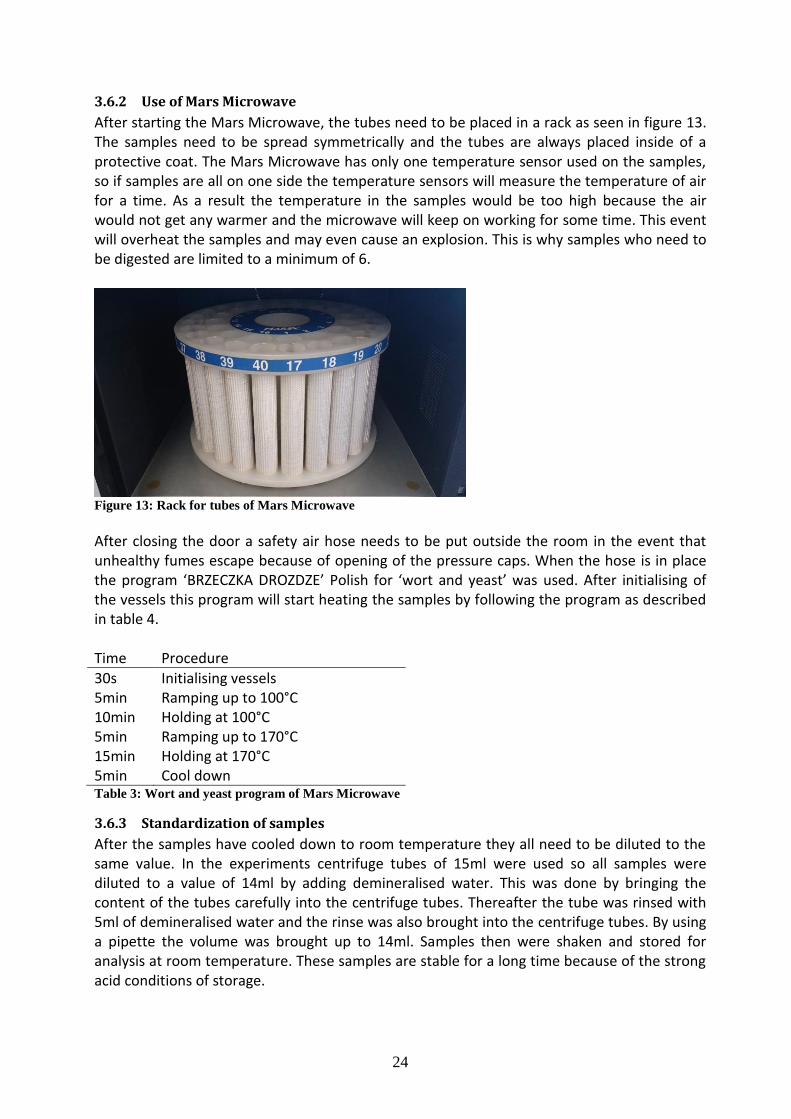
3.6.1 Preparation of samples
Samples were put into clean and dry tubes fitted for the Mars Microwave, figure 11.
Figure 11: Tubes for digestion of organic compound with Mars Microwave
The quantity of the samples inside depends on how easy it can be digested, how complex the molecules are and how strong the atomic bonds are that need to be broken down. By using trial and error optimal weights for dry matter like dry yeast, barley malt and dried spent grains were found between 0.1 and 0.3g and for soaked matter like used spent grains between 0.2 and 0.5g. Weight measurements were done using an analytical balance with 0.0001 g accuracy. For liquids such as wort the standard value of 3ml was used and pipetted into the tubes. All weights and volumes were carefully noted in an excel data sheet. If samples contain too much matter, not all matter can be digested resulting in unclear samples which can not be measured. Too small samples also influence measurements due to drop in accuracy. When all samples were taken the acid was added in an air flow case, 5ml of 65% nitric acid was added to each sample. Thereafter pressure caps were placed which open in case of a large gas formation that causes the pressure to build up. As the last step of preparation the screwdops were placed firmly on top. For details see on figure 12.
Figure 12: Tubes for use in Mars Microwave
24
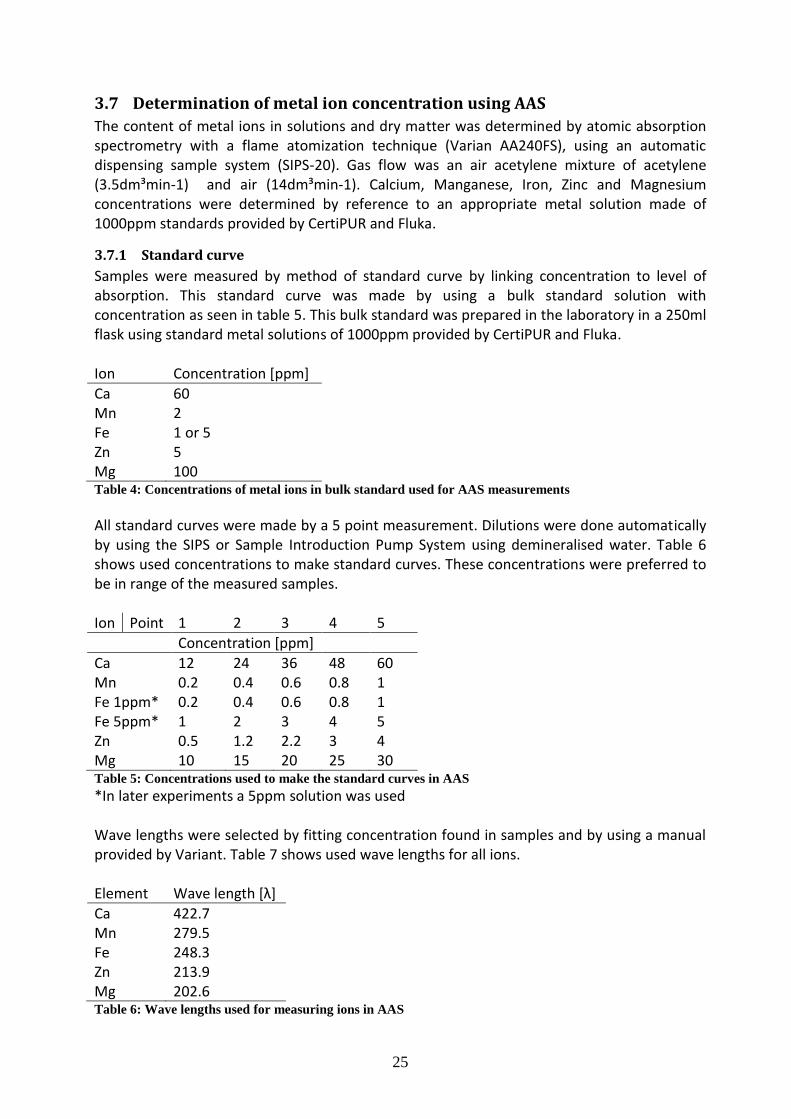
3.6.2 Use of Mars Microwave
After starting the Mars Microwave, the tubes need to be placed in a rack as seen in figure 13. The samples need to be spread symmetrically and the tubes are always placed inside of a protective coat. The Mars Microwave has only one temperature sensor used on the samples, so if samples are all on one side the temperature sensors will measure the temperature of air for a time. As a result the temperature in the samples would be too high because the air would not get any warmer and the microwave will keep on working for some time. This event will overheat the samples and may even cause an explosion. This is why samples who need to be digested are limited to a minimum of 6.
Figure 13: Rack for tubes of Mars Microwave
After closing the door a safety air hose needs to be put outside the room in the event that unhealthy fumes escape because of opening of the pressure caps. When the hose is in place the program ‘BRZECZKA DROZDZE’ Polish for ‘wort and yeast’ was used. After initialising of the vessels this program will start heating the samples by following the program as described in table 4. Time Procedure
30s Initialising vessels 5min Ramping up to 100°C 10min Holding at 100°C 5min Ramping up to 170°C 15min Holding at 170°C 5min Cool down Table 3: Wort and yeast program of Mars Microwave
3.6.3 Standardization of samples
After the samples have cooled down to room temperature they all need to be diluted to the same value. In the experiments centrifuge tubes of 15ml were used so all samples were diluted to a value of 14ml by adding demineralised water. This was done by bringing the content of the tubes carefully into the centrifuge tubes. Thereafter the tube was rinsed with 5ml of demineralised water and the rinse was also brought into the centrifuge tubes. By using a pipette the volume was brought up to 14ml. Samples then were shaken and stored for analysis at room temperature. These samples are stable for a long time because of the strong acid conditions of storage.
25
3.7 Determination of metal ion concentration using AAS
The content of metal ions in solutions and dry matter was determined by atomic absorption spectrometry with a flame atomization technique (Varian AA240FS), using an automatic dispensing sample system (SIPS-20). Gas flow was an air acetylene mixture of acetylene (3.5dm³min-1) and air (14dm³min-1). Calcium, Manganese, Iron, Zinc and Magnesium concentrations were determined by reference to an appropriate metal solution made of 1000ppm standards provided by CertiPUR and Fluka.
3.7.1 Standard curve
Samples were measured by method of standard curve by linking concentration to level of absorption. This standard curve was made by using a bulk standard solution with concentration as seen in table 5. This bulk standard was prepared in the laboratory in a 250ml flask using standard metal solutions of 1000ppm provided by CertiPUR and Fluka. Ion Concentration [ppm]
Ca 60 Mn 2 Fe 1 or 5 Zn 5 Mg 100 Table 4: Concentrations of metal ions in bulk standard used for AAS measurements
All standard curves were made by a 5 point measurement. Dilutions were done automatically by using the SIPS or Sample Introduction Pump System using demineralised water. Table 6 shows used concentrations to make standard curves. These concentrations were preferred to be in range of the measured samples. Ion Point 1 2 3 4 5
Concentration [ppm]
Ca 12 24 36 48 60 Mn 0.2 0.4 0.6 0.8 1 Fe 1ppm* 0.2 0.4 0.6 0.8 1 Fe 5ppm* 1 2 3 4 5 Zn 0.5 1.2 2.2 3 4 Mg 10 15 20 25 30 Table 5: Concentrations used to make the standard curves in AAS
*In later experiments a 5ppm solution was used Wave lengths were selected by fitting concentration found in samples and by using a manual provided by Variant. Table 7 shows used wave lengths for all ions. Element Wave length [λ]
Ca 422.7 Mn 279.5 Fe 248.3 Zn 213.9 Mg 202.6 Table 6: Wave lengths used for measuring ions in AAS
26
3.8 Sampling
3.8.1 Sampling of wort
After mashing cylinders were standardized to 450g and thoroughly mixed. Until experiment 9 sampling of wort before filtration was done by waiting till spent grains settle down after standardization and mixing, clear wort was then on top of the cylinder. Out of this clear solution 3ml was pipetted into tubes for digestion, all samples were taken in twofold . After experiment 9 a 40ml sample was taken directly after standardisation and mashing. This 40ml samples was centrifuged for 5 minutes at 5 000 min-1. Thereafter 3ml was sampled into tubes for digestion in twofold. Sampling of wort after filtration was done when filtrations were ended. 3ml of wort was pipetted into tubes for digestion in twofold.
3.8.2 Sampling of spent grains
After filtration was ended spent grains were stirred upon the filter to get a homogenised sample. This needed to be done because on top of the spent grains a dens layer small gray particles who slowly precipitate during filtration. By using an analytical balance samples of spent grains between 0.2 and 0.5g were taken and brought inside the digestion tubes. When the spent grains were dry samples around 0.2g was taken. Weights were noted in an excel data sheet.
3.9 Measurement of dry matter
Dry matter was measured by using an analytical balance with induction furnace and temperature sensor of RADWAG type MAC 50. Each sample was introduced on an aluminium scale and weighted. After closing the hatch the oven starts to heat up to 120°C. At this temperature all free water is vaporised and the vapour is removed from the balance. Lose of weight is measured until no more weight loss can be detected. Results are shown on the display by percentage of water in original wet material.
3.10 Specific experimental set-ups
In EXPERIMENT 1, grains were roughly milled and sorted by hand into similar portions and weighted on an analytical balance (+/- 0.0001). Weights were noted in an excel data sheet. Afterwards samples were digested and concentration of metal ions (Ca, Mn, Fe, Zn and Mg) were measured using AAS. In EXPERIMENT 2 wort was produced by using the congress method as described in 3.1. Each time 50g of malt was roughly milled and added to the mashing cylinders. Samples were taken from complete grains, wort after filtration and spent grains to be digested and the same five metal ions were measured using AAS. Wort in EXPERIMENT 3 was produced and measured as in the previous experiment however in this experiment different gravities were produced using 50, 60, 70 and 80g of malt.
In EXPERIMENT 4 around 0.05g husk was sorted manually out of a roughly milled batch of malt and putted into Ephendorp tubes of 1.5ml. These tubes were filled up to the maximum volume of 1.5ml and stored at 20, 56 or 100°C in water baths. After one hour 1ml of the solution was put into centrifuge tubes of 15ml which were diluted to 10ml using
27
demineralised water. These samples were clear and hereby measured directly with the AAS technique without digestion. In EXPERIMENT 5 tests were divided into three sections. First the changes of ion concentrations in wort during filtration was measured by collecting each 15ml of filtered wort in separate beakers. 3ml of each of these beakers was sampled in twofold, digested and metal ion concentrations were measured using AAS. The secondary approach was ion concentration upon the filter in time. During filtration 3ml of sample was taken from upon the filter at registered times as can be seen in 4.8.2. After sampling these were digested and measured using AAS. A third approach was the concentration of metal ions before and after filtration. Here samples of wort were taken as previously described in 3.8.1. Of all filtered worts gravity, haze and color was measured as described in 3.4, 3.5 and 3.6.
Rinsing of the filter made of spent grains in EXPERIMENT 6 was done by adding 15ml of demineralised water and collecting the rinse water. This was repeated several times till a gravity lower than 3 degrees Plato was measured. Of each sample 3ml was taken for digestion in twofold and measurement of ion concentration were done using AAS. In EXPERIMENT 7 the same routine as in EXPERIMENT 2 was used, this time however two different batches of malt were used. In order to produce wort using two different milling methods as was the setup of EXPERIMENT 8 wort was produced using 50g of rough malt several times and simultaneously produce wort of 50g of fine milled malt. We used a hand mill for rough malt and an electrical mixer at the 12 seconds program to produce fine malt as mentioned in 3.1.1. In EXPERIMENT 9 repetitive filtrations were done in threefold by putting the filtered wort back on the same filter after sampling. These samples were digested and measured using AAS.
After production of standard wort made of 50 grams of malt as previously described, haze, color and gravity were measured and wort was sampled before cooking in EXPERIMENT 10. 200 ml of the wort was boiled in a round bottom flask equipped with a reflux condenser for 75 minutes with two hops added: bitter hops (0,2 g) 5 minutes after bringing to boil and aromatic hops (0.1 g) 20 minutes before ending the boiling. The content of the bottom flask was brought into a small whirlpool. After cooling down to room temperature 3ml of final wort was sampled in twofold, digested and measured using AAS.
3.11 Data processing
Metal contents and concentrations of water, wort, spent grains and complete malt were analyzed in several replicates according to the experiments. Data were analysed using STATISTICA 10 (StatSoft, Poland) a statistical software package using ANOVA followed by the Duncan Test to evaluate significant differences at level of P≤0.05 and lower.
28
4 Results
4.1 Aim of the experiments
In the paragraph down below the aim of the different experiments is shown. The experiments start with a global research of metal ions in the raw materials and how the number varied throughout the brewing process. However the complete brewing process made the project too wide and was therefore narrowed down to research on the level of filtration.
EXPERIMENT 1: Research on metal ion concentration in different sections of the malt. - Examine concentration of metal ions (Ca, Mn, Fe, Zn, Mg) in different sections of
the malt. - Examine the influence of these section.
EXPERIMENT 2: Research on metal ion concentration in wort.
- Measure concentration of metal ions (Ca, Mn, Fe, Zn, Mg) in wort produced by the EBC congress method using roughly milled malt.
- Examine how much of the total ion concentration of malt can be extracted into produced wort.
- Measure ion concentration of metal ions (Ca, Mn, Fe, Zn, Mg) in spent grains after filtration.
EXPERIMENT 3: Research on metal ion concentration in worts produced with different amounts of malt.
- Measure concentration of metal ions (Ca, Mn, Fe, Zn, Mg) in wort and spent grains produced by the EBC congress method using roughly milled malt.
- Check if the amount of metal ions (Ca, Mn, Fe, Zn, Mg) in wort has a linear relation with amounts of malt used.
- Measure influence of gravity on available metal ion in produced worts.
EXPERIMENT 4: Metal ion concentration in husk, what brings them in solution. - Check if ions of separated husk are able to come into solution in demineralised
water without influence of enzymes that occur in the endosperm to break the cell walls.
- Check if temperature has any influence on the release of metal ions in the husk. - Measure if there is any difference between metal ions in release by temperature or
by brewing process.
EXPERIMENT 5: Effects of filtration on concentration of metal ions in wort. - Check if any changes can be seen in metal ion concentration due to filtration by
measuring wort before and after filtration. - Look if the filtration process absorbs or releases some of the metal ions. - Check if absorption or release is similar for all ions in the same way. - See if ion concentration changes during stages of filtration, as well in on top wort
of the filter as in filtered wort metal ion concentrations.
29
EXPERIMENT 6: Rinsing of spent grains after filtration. - Investigate the importance of rinsing in order to not only get a larger amount of
sugar but also get more or less metal ions. - See how many ions are still available in spent grains.
EXPERIMENT 7: Metal ion concentration of two different batches of malt.
- Check if metal ion concentration is similar in the two different batches of malt.
EXPERIMENT 8: Influence of milling method on metal ion concentration in wort and spent grains.
- Examine if different milling methods influence metal ion concentration in wort and spent grains.
- Measure if there is a difference in release or absorption of metal ion concentration between filters of spent grains made with different milling methods.
EXPERIMENT 9: Influence of repetitive filtrations on metal ion concentration in wort.
- Examine if there is a bigger absorption or release when the same wort is passed through the same filter material several times.
EXPERIMENT 10: Influence of boiling on metal ion concentration in wort and influence of hops.
- Measure metal ion concentration in dry hops. - Examine if there is a difference in metal ion concentration in the wort before and
after cooking. - Measure concentration of metal ions in hot trap.
30
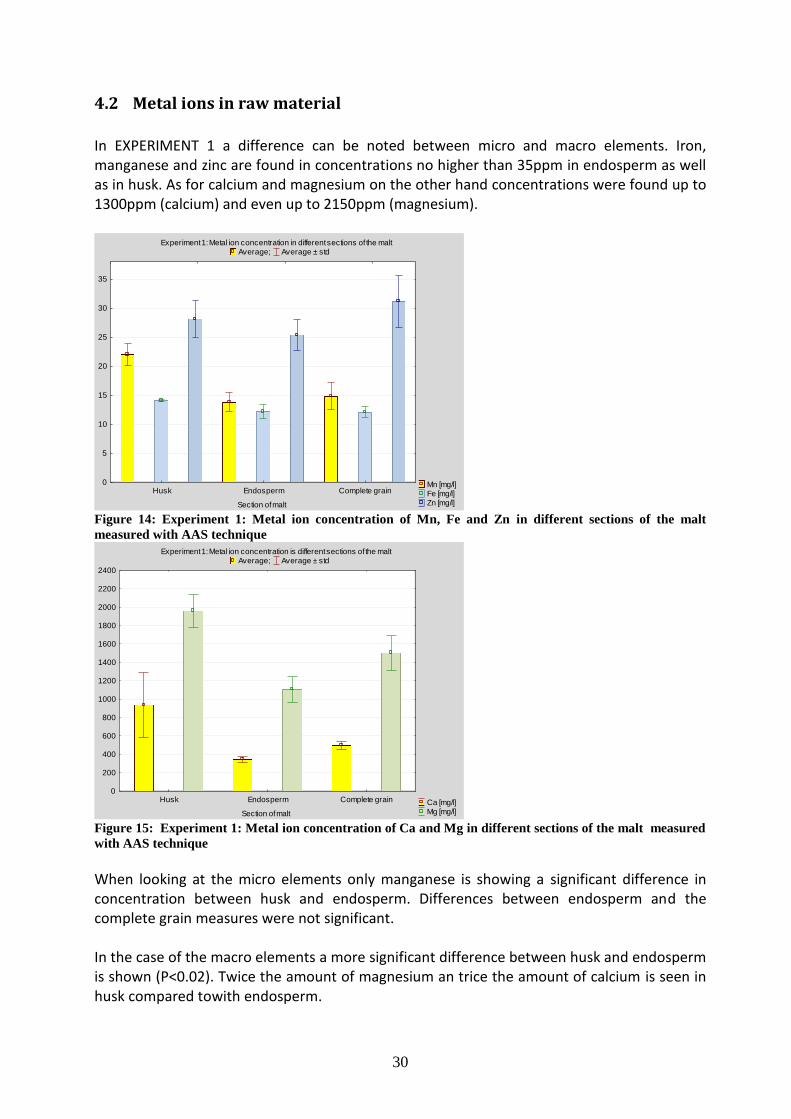
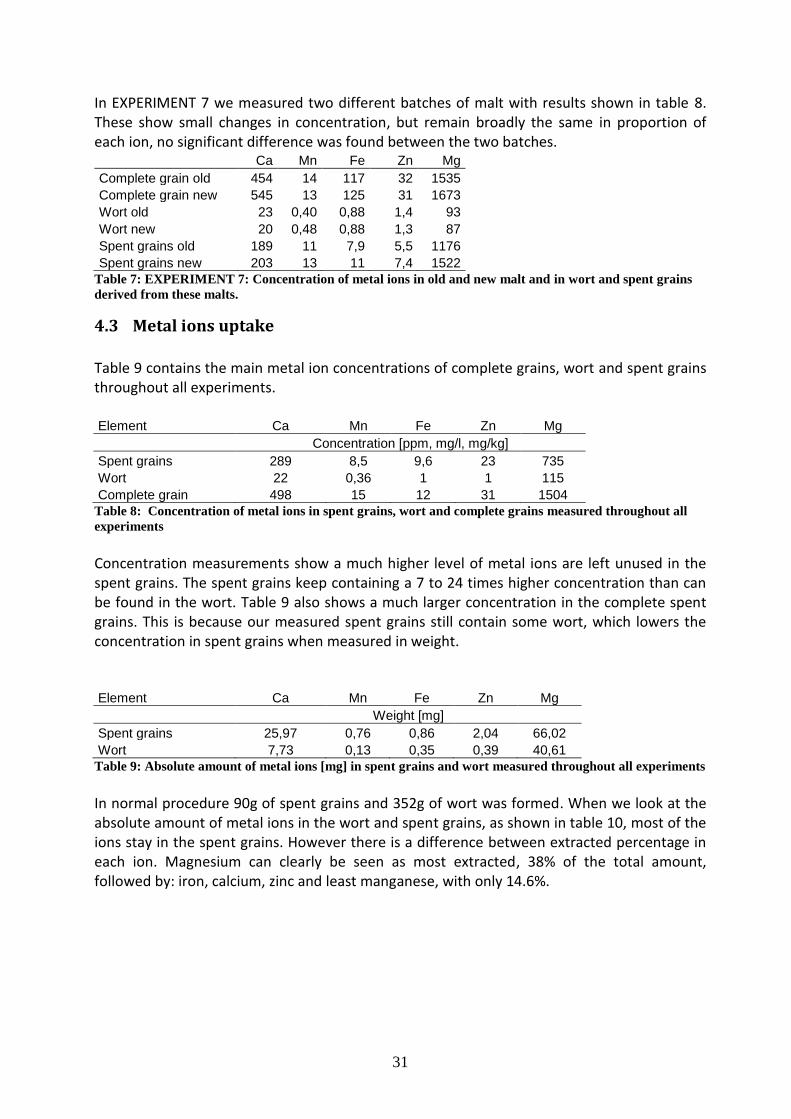
4.2 Metal ions in raw material
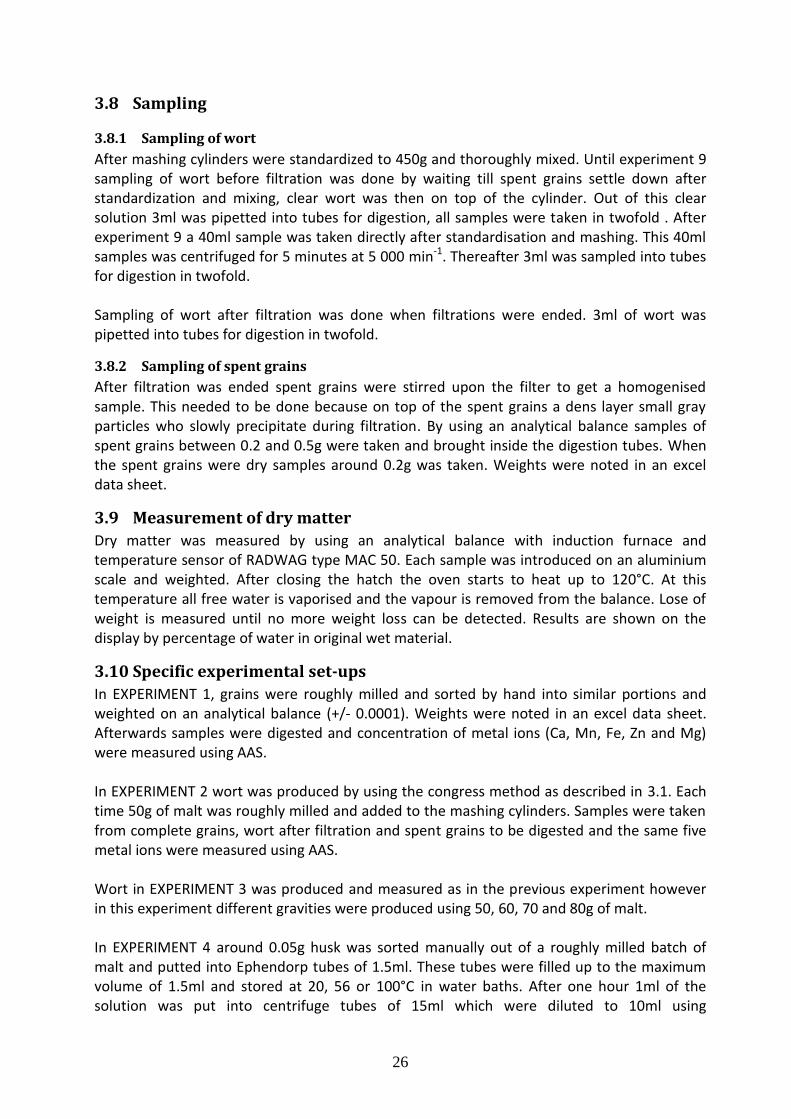
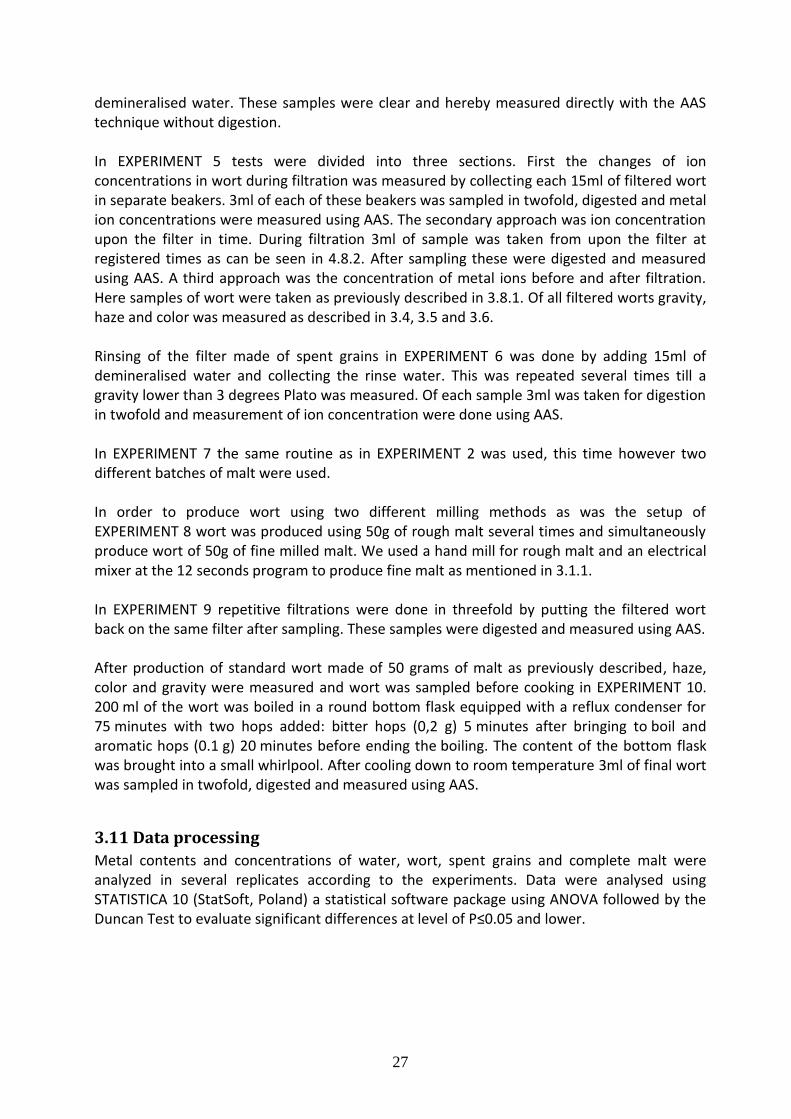
In EXPERIMENT 1 a difference can be noted between micro and macro elements. Iron, manganese and zinc are found in concentrations no higher than 35ppm in endosperm as well as in husk. As for calcium and magnesium on the other hand concentrations were found up to 1300ppm (calcium) and even up to 2150ppm (magnesium).
Experiment 1: Metal ion concentration in different sections of the malt Average; Average ± std
Mn [mg/l] Fe [mg/l] Zn [mg/l]
Husk Endosperm Complete grain
Section of malt
0
5
10
15
20
25
30
35
Figure 14: Experiment 1: Metal ion concentration of Mn, Fe and Zn in different sections of the malt
measured with AAS technique Experiment 1: Metal ion concentration is different sections of the malt
Average; Average ± std
Ca [mg/l] Mg [mg/l]
Husk Endosperm Complete grain
Section of malt
0
200
400
600
800
1000
1200
1400
1600
1800
2000
2200
2400
Figure 15: Experiment 1: Metal ion concentration of Ca and Mg in different sections of the malt measured
with AAS technique
When looking at the micro elements only manganese is showing a significant difference in concentration between husk and endosperm. Differences between endosperm and the complete grain measures were not significant. In the case of the macro elements a more significant difference between husk and endosperm is shown (P<0.02). Twice the amount of magnesium an trice the amount of calcium is seen in husk compared towith endosperm.
31
In EXPERIMENT 7 we measured two different batches of malt with results shown in table 8. These show small changes in concentration, but remain broadly the same in proportion of each ion, no significant difference was found between the two batches.
Ca Mn Fe Zn Mg
Complete grain old 454 14 117 32 1535
Complete grain new 545 13 125 31 1673
Wort old 23 0,40 0,88 1,4 93
Wort new 20 0,48 0,88 1,3 87
Spent grains old 189 11 7,9 5,5 1176
Spent grains new 203 13 11 7,4 1522
Table 7: EXPERIMENT 7: Concentration of metal ions in old and new malt and in wort and spent grains
derived from these malts.
4.3 Metal ions uptake
Table 9 contains the main metal ion concentrations of complete grains, wort and spent grains throughout all experiments. Element Ca Mn Fe Zn Mg
Concentration [ppm, mg/l, mg/kg]
Spent grains 289 8,5 9,6 23 735
Wort 22 0,36 1 1 115
Complete grain 498 15 12 31 1504
Table 8: Concentration of metal ions in spent grains, wort and complete grains measured throughout all
experiments
Concentration measurements show a much higher level of metal ions are left unused in the spent grains. The spent grains keep containing a 7 to 24 times higher concentration than can be found in the wort. Table 9 also shows a much larger concentration in the complete spent grains. This is because our measured spent grains still contain some wort, which lowers the concentration in spent grains when measured in weight. Element Ca Mn Fe Zn Mg
Weight [mg]
Spent grains 25,97 0,76 0,86 2,04 66,02
Wort 7,73 0,13 0,35 0,39 40,61
Table 9: Absolute amount of metal ions [mg] in spent grains and wort measured throughout all experiments
In normal procedure 90g of spent grains and 352g of wort was formed. When we look at the absolute amount of metal ions in the wort and spent grains, as shown in table 10, most of the ions stay in the spent grains. However there is a difference between extracted percentage in each ion. Magnesium can clearly be seen as most extracted, 38% of the total amount, followed by: iron, calcium, zinc and least manganese, with only 14.6%.
32
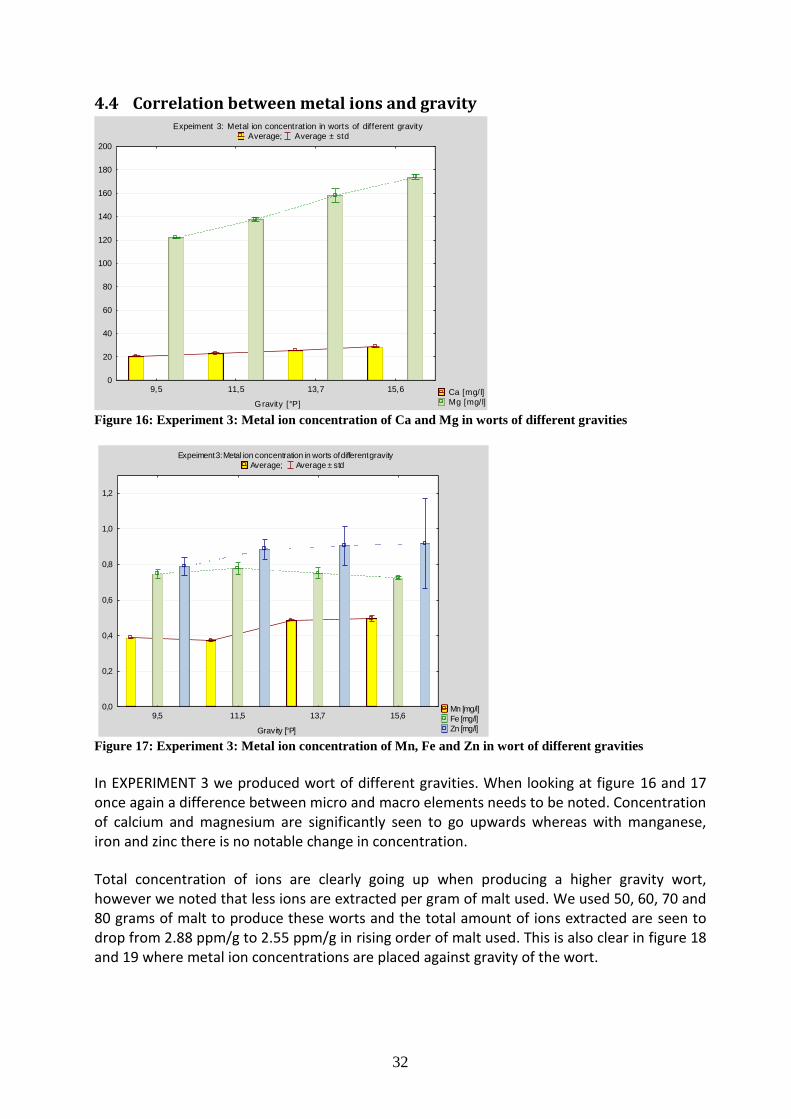
4.4 Correlation between metal ions and gravity Expeiment 3: Metal ion concentration in worts of different gravity
Average; Average ± std
Ca [mg/l] Mg [mg/l]
9,5 11,5 13,7 15,6
Gravity [°P]
0
20
40
60
80
100
120
140
160
180
200
Figure 16: Experiment 3: Metal ion concentration of Ca and Mg in worts of different gravities
Expeiment 3: Metal ion concentration in worts of different gravity
Average; Average ± std
Mn [mg/l]
Fe [mg/l]
Zn [mg/l]
9,5 11,5 13,7 15,6
Gravity [°P]
0,0
0,2
0,4
0,6
0,8
1,0
1,2
Figure 17: Experiment 3: Metal ion concentration of Mn, Fe and Zn in wort of different gravities
In EXPERIMENT 3 we produced wort of different gravities. When looking at figure 16 and 17 once again a difference between micro and macro elements needs to be noted. Concentration of calcium and magnesium are significantly seen to go upwards whereas with manganese, iron and zinc there is no notable change in concentration.
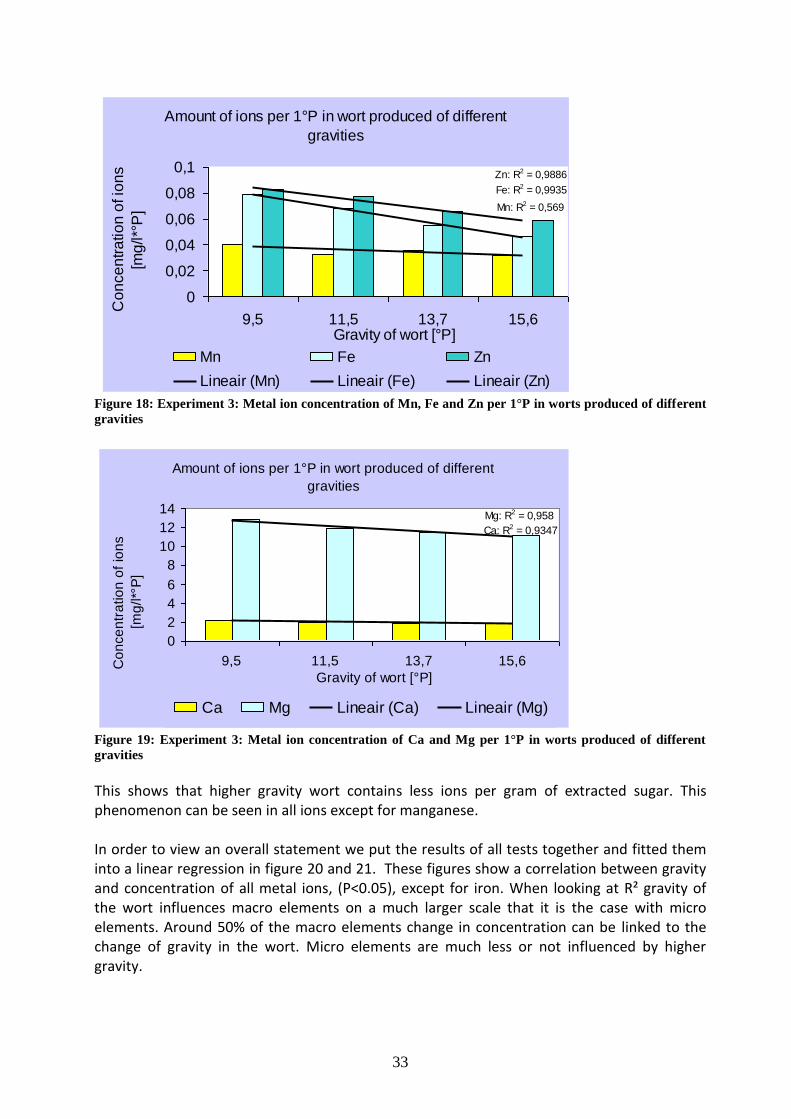
Total concentration of ions are clearly going up when producing a higher gravity wort, however we noted that less ions are extracted per gram of malt used. We used 50, 60, 70 and 80 grams of malt to produce these worts and the total amount of ions extracted are seen to drop from 2.88 ppm/g to 2.55 ppm/g in rising order of malt used. This is also clear in figure 18 and 19 where metal ion concentrations are placed against gravity of the wort.
33
Amount of ions per 1°P in wort produced of different
gravities
Mn: R2 = 0,569
Fe: R2 = 0,9935
Zn: R2 = 0,9886
0
0,02
0,04
0,06
0,08
0,1
9,5 11,5 13,7 15,6Gravity of wort [°P]
Co
nce
ntr
atio
n o
f io
ns
[mg
/l*°
P]
Mn Fe Zn
Lineair (Mn) Lineair (Fe) Lineair (Zn)
Figure 18: Experiment 3: Metal ion concentration of Mn, Fe and Zn per 1°P in worts produced of different
gravities
Amount of ions per 1°P in wort produced of different
gravities
Ca: R2 = 0,9347
Mg: R2 = 0,958
0
2
4
6
8
10
12
14
9,5 11,5 13,7 15,6
Gravity of wort [°P]
Co
nce
ntr
atio
n o
f io
ns
[mg
/l*°
P]
Ca Mg Lineair (Ca) Lineair (Mg)
Figure 19: Experiment 3: Metal ion concentration of Ca and Mg per 1°P in worts produced of different
gravities
This shows that higher gravity wort contains less ions per gram of extracted sugar. This phenomenon can be seen in all ions except for manganese. In order to view an overall statement we put the results of all tests together and fitted them into a linear regression in figure 20 and 21. These figures show a correlation between gravity and concentration of all metal ions, (P<0.05), except for iron. When looking at R² gravity of the wort influences macro elements on a much larger scale that it is the case with micro elements. Around 50% of the macro elements change in concentration can be linked to the change of gravity in the wort. Micro elements are much less or not influenced by higher gravity.
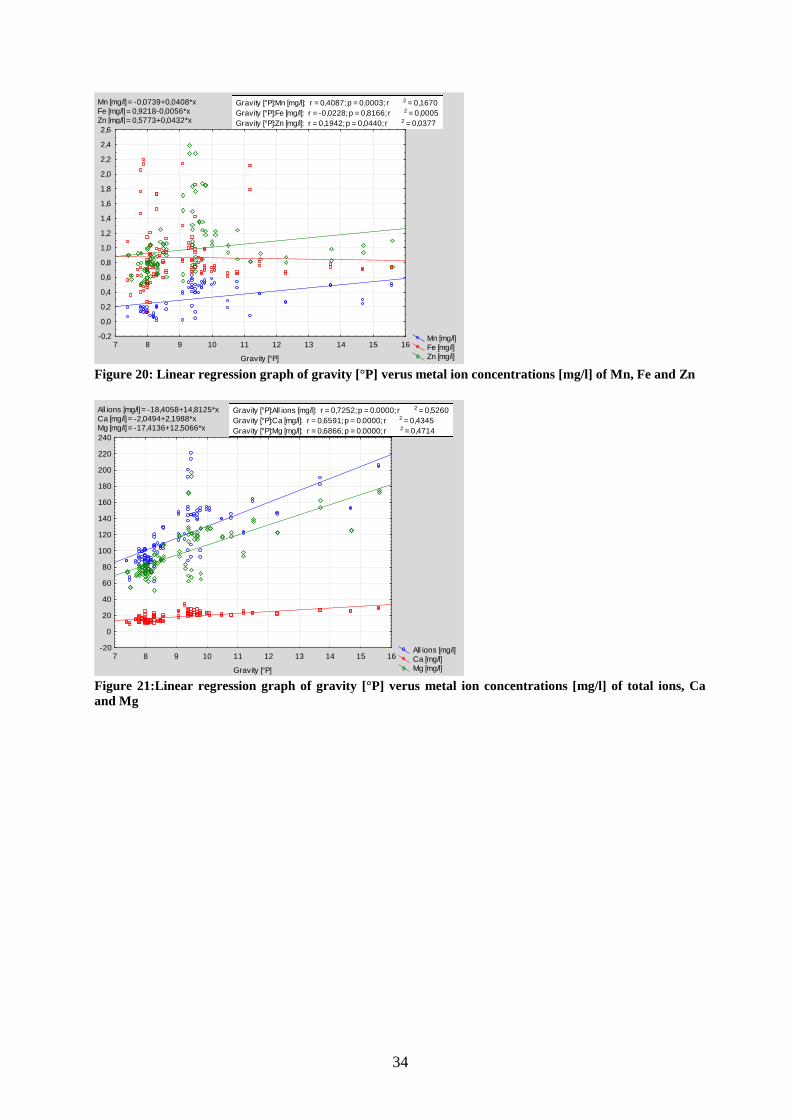
34
Mn [mg/l] = -0,0739+0,0408*x
Fe [mg/l] = 0,9218-0,0056*x
Zn [mg/l] = 0,5773+0,0432*x
Mn [mg/l]
Fe [mg/l]
Zn [mg/l]
7 8 9 10 11 12 13 14 15 16
Gravity [°P]
-0,2
0,0
0,2
0,4
0,6
0,8
1,0
1,2
1,4
1,6
1,8
2,0
2,2
2,4
2,6
Gravity [°P]:Mn [mg/l]: r = 0,4087; p = 0,0003; r 2 = 0,1670
Gravity [°P]:Fe [mg/l]: r = -0,0228; p = 0,8166; r 2 = 0,0005
Gravity [°P]:Zn [mg/l]: r = 0,1942; p = 0,0440; r 2 = 0,0377
Figure 20: Linear regression graph of gravity [°P] verus metal ion concentrations [mg/l] of Mn, Fe and Zn
All ions [mg/l] = -18,4058+14,8125*xCa [mg/l] = -2,0494+2,1988*xMg [mg/l] = -17,4136+12,5066*x
All ions [mg/l] Ca [mg/l] Mg [mg/l]
7 8 9 10 11 12 13 14 15 16
Gravity [°P]
-20
0
20
40
60
80
100
120
140
160
180
200
220
240
Gravity [°P]:All ions [mg/l]: r = 0,7252; p = 0.0000; r 2 = 0,5260
Gravity [°P]:Ca [mg/l]: r = 0,6591; p = 0.0000; r 2 = 0,4345
Gravity [°P]:Mg [mg/l]: r = 0,6866; p = 0.0000; r 2 = 0,4714
Figure 21:Linear regression graph of gravity [°P] verus metal ion concentrations [mg/l] of total ions, Ca
and Mg
35
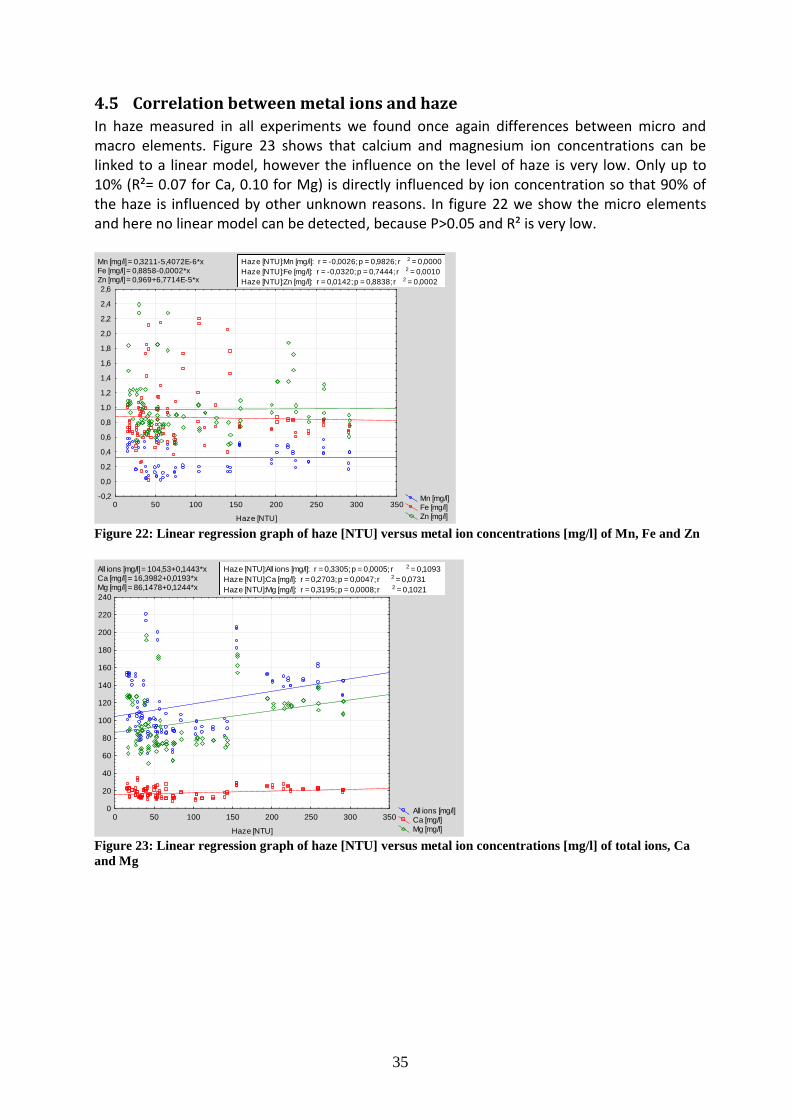
4.5 Correlation between metal ions and haze
In haze measured in all experiments we found once again differences between micro and macro elements. Figure 23 shows that calcium and magnesium ion concentrations can be linked to a linear model, however the influence on the level of haze is very low. Only up to 10% (R²= 0.07 for Ca, 0.10 for Mg) is directly influenced by ion concentration so that 90% of the haze is influenced by other unknown reasons. In figure 22 we show the micro elements and here no linear model can be detected, because P>0.05 and R² is very low. Mn [mg/l] = 0,3211-5,4072E-6*xFe [mg/l] = 0,8858-0,0002*xZn [mg/l] = 0,969+6,7714E-5*x
Mn [mg/l]
Fe [mg/l]
Zn [mg/l]
0 50 100 150 200 250 300 350
Haze [NTU]
-0,2
0,0
0,2
0,4
0,6
0,8
1,0
1,2
1,4
1,6
1,8
2,0
2,2
2,4
2,6
Haze [NTU]:Mn [mg/l]: r = -0,0026; p = 0,9826; r 2 = 0,0000
Haze [NTU]:Fe [mg/l]: r = -0,0320; p = 0,7444; r 2 = 0,0010
Haze [NTU]:Zn [mg/l]: r = 0,0142; p = 0,8838; r 2 = 0,0002
Figure 22: Linear regression graph of haze [NTU] versus metal ion concentrations [mg/l] of Mn, Fe and Zn
All ions [mg/l] = 104,53+0,1443*xCa [mg/l] = 16,3982+0,0193*xMg [mg/l] = 86,1478+0,1244*x
All ions [mg/l] Ca [mg/l] Mg [mg/l]
0 50 100 150 200 250 300 350
Haze [NTU]
0
20
40
60
80
100
120
140
160
180
200
220
240
Haze [NTU]:All ions [mg/l]: r = 0,3305; p = 0,0005; r 2 = 0,1093
Haze [NTU]:Ca [mg/l]: r = 0,2703; p = 0,0047; r 2 = 0,0731
Haze [NTU]:Mg [mg/l]: r = 0,3195; p = 0,0008; r 2 = 0,1021
Figure 23: Linear regression graph of haze [NTU] versus metal ion concentrations [mg/l] of total ions, Ca
and Mg
36
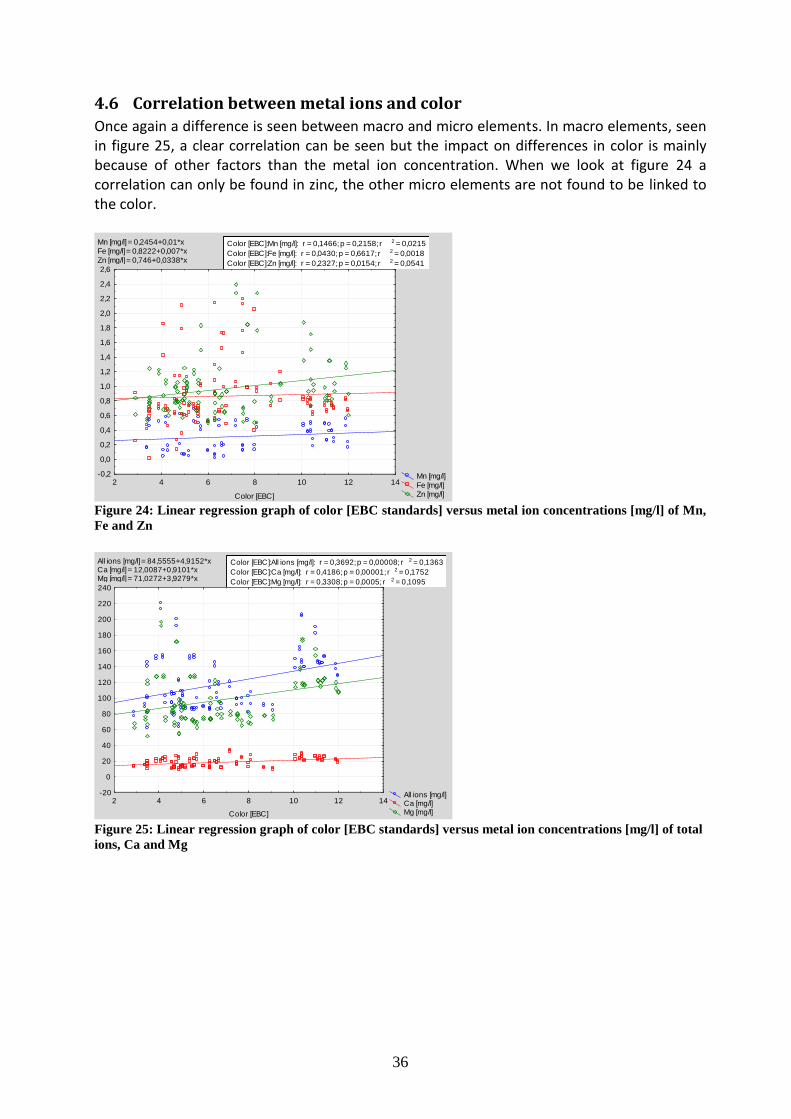
4.6 Correlation between metal ions and color
Once again a difference is seen between macro and micro elements. In macro elements, seen in figure 25, a clear correlation can be seen but the impact on differences in color is mainly because of other factors than the metal ion concentration. When we look at figure 24 a correlation can only be found in zinc, the other micro elements are not found to be linked to the color. Mn [mg/l] = 0,2454+0,01*x
Fe [mg/l] = 0,8222+0,007*x
Zn [mg/l] = 0,746+0,0338*x
Mn [mg/l]
Fe [mg/l]
Zn [mg/l]
2 4 6 8 10 12 14
Color [EBC]
-0,2
0,0
0,2
0,4
0,6
0,8
1,0
1,2
1,4
1,6
1,8
2,0
2,2
2,4
2,6
Color [EBC]:Mn [mg/l]: r = 0,1466; p = 0,2158; r 2 = 0,0215
Color [EBC]:Fe [mg/l]: r = 0,0430; p = 0,6617; r 2 = 0,0018
Color [EBC]:Zn [mg/l]: r = 0,2327; p = 0,0154; r 2 = 0,0541
Figure 24: Linear regression graph of color [EBC standards] versus metal ion concentrations [mg/l] of Mn,
Fe and Zn
All ions [mg/l] = 84,5555+4,9152*xCa [mg/l] = 12,0087+0,9101*xMg [mg/l] = 71,0272+3,9279*x
All ions [mg/l] Ca [mg/l] Mg [mg/l]
2 4 6 8 10 12 14
Color [EBC]
-20
0
20
40
60
80
100
120
140
160
180
200
220
240
Color [EBC]:All ions [mg/l]: r = 0,3692; p = 0,00008; r 2 = 0,1363
Color [EBC]:Ca [mg/l]: r = 0,4186; p = 0,00001; r 2 = 0,1752
Color [EBC]:Mg [mg/l]: r = 0,3308; p = 0,0005; r 2 = 0,1095
Figure 25: Linear regression graph of color [EBC standards] versus metal ion concentrations [mg/l] of total
ions, Ca and Mg
37
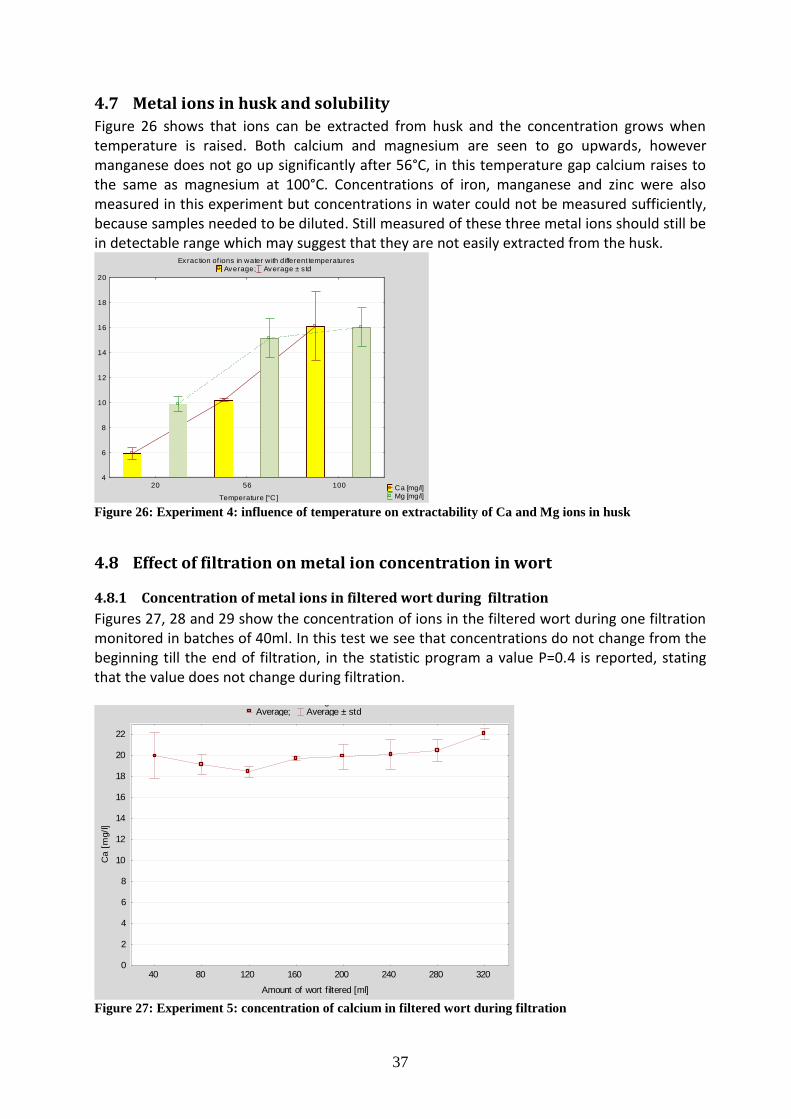
4.7 Metal ions in husk and solubility
Figure 26 shows that ions can be extracted from husk and the concentration grows when temperature is raised. Both calcium and magnesium are seen to go upwards, however manganese does not go up significantly after 56°C, in this temperature gap calcium raises to the same as magnesium at 100°C. Concentrations of iron, manganese and zinc were also measured in this experiment but concentrations in water could not be measured sufficiently, because samples needed to be diluted. Still measured of these three metal ions should still be in detectable range which may suggest that they are not easily extracted from the husk.
Exrac tion of ions in water with different temperatures Average; Average ± s td
Ca [mg/l] Mg [mg/l]
20 56 100
Temperature [°C]
4
6
8
10
12
14
16
18
20
Figure 26: Experiment 4: influence of temperature on extractability of Ca and Mg ions in husk
4.8 Effect of filtration on metal ion concentration in wort
4.8.1 Concentration of metal ions in filtered wort during filtration
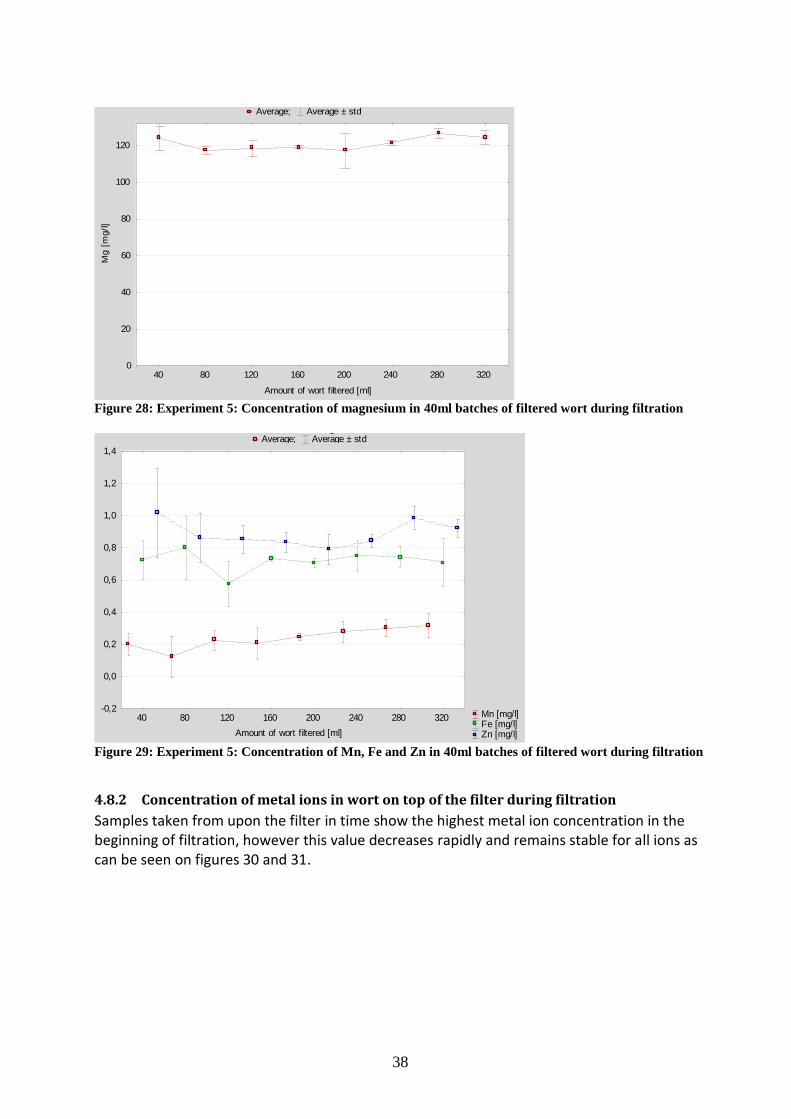
Figures 27, 28 and 29 show the concentration of ions in the filtered wort during one filtration monitored in batches of 40ml. In this test we see that concentrations do not change from the beginning till the end of filtration, in the statistic program a value P=0.4 is reported, stating that the value does not change during filtration. Concentration of ions in wort troughout the filtration
Average; Average ± std
40 80 120 160 200 240 280 320
Amount of wort filtered [ml]
0
2
4
6
8
10
12
14
16
18
20
22
Ca [
mg/l]
Figure 27: Experiment 5: concentration of calcium in filtered wort during filtration
38
Concentration of ions in wort troughout the filtration Average; Average ± std
40 80 120 160 200 240 280 320
Amount of wort filtered [ml]
0
20
40
60
80
100
120
Mg [
mg/l]
Figure 28: Experiment 5: Concentration of magnesium in 40ml batches of filtered wort during filtration
Concentration of ions in wort troughout the filtration Average; Average ± std
Mn [mg/l] Fe [mg/l] Zn [mg/l]
40 80 120 160 200 240 280 320
Amount of wort filtered [ml]
-0,2
0,0
0,2
0,4
0,6
0,8
1,0
1,2
1,4
Figure 29: Experiment 5: Concentration of Mn, Fe and Zn in 40ml batches of filtered wort during filtration
4.8.2 Concentration of metal ions in wort on top of the filter during filtration
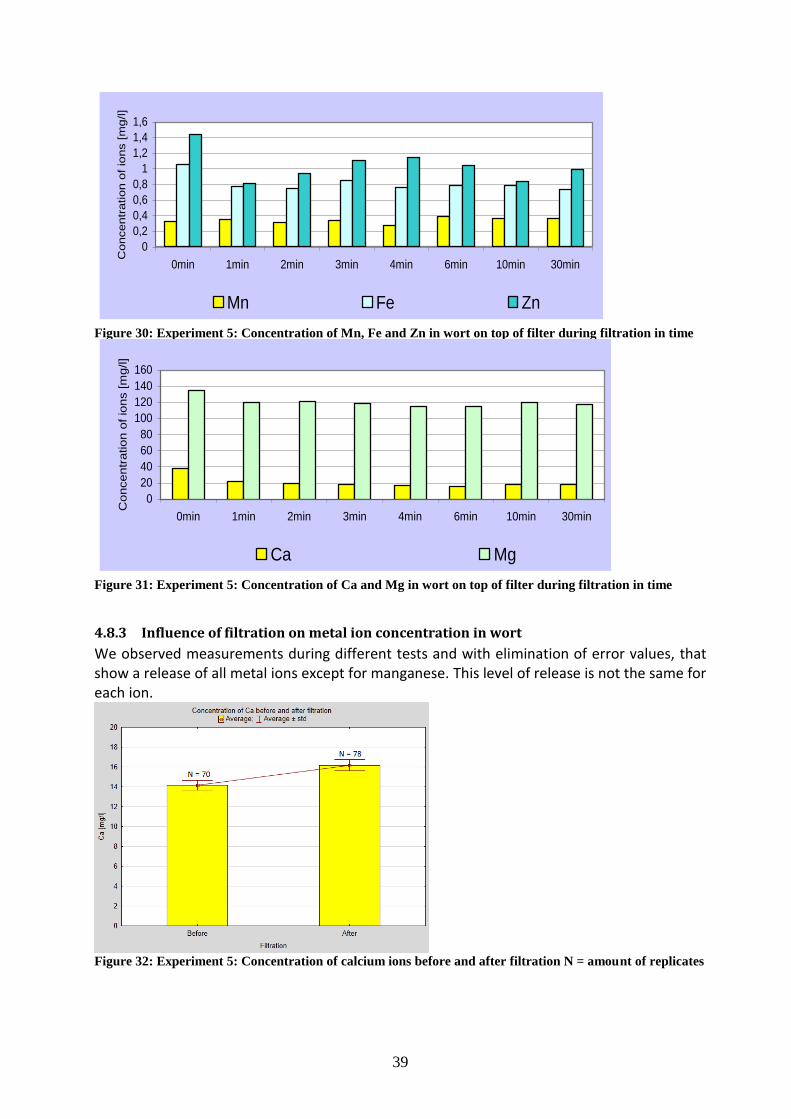
Samples taken from upon the filter in time show the highest metal ion concentration in the beginning of filtration, however this value decreases rapidly and remains stable for all ions as can be seen on figures 30 and 31.
39
Concentration of ions in wort ontop of the filter during filtration
0
0,2
0,4
0,6
0,8
1
1,2
1,4
1,6
0min 1min 2min 3min 4min 6min 10min 30min
Concentr
ation o
f io
ns [
mg/l]
Mn Fe Zn
Figure 30: Experiment 5: Concentration of Mn, Fe and Zn in wort on top of filter during filtration in time Concentration of ions in wort ontop of the filter during filtration
0
20
40
60
80
100
120
140
160
0min 1min 2min 3min 4min 6min 10min 30min
Co
ncentr
ation o
f io
ns [m
g/l]
Ca Mg
Figure 31: Experiment 5: Concentration of Ca and Mg in wort on top of filter during filtration in time
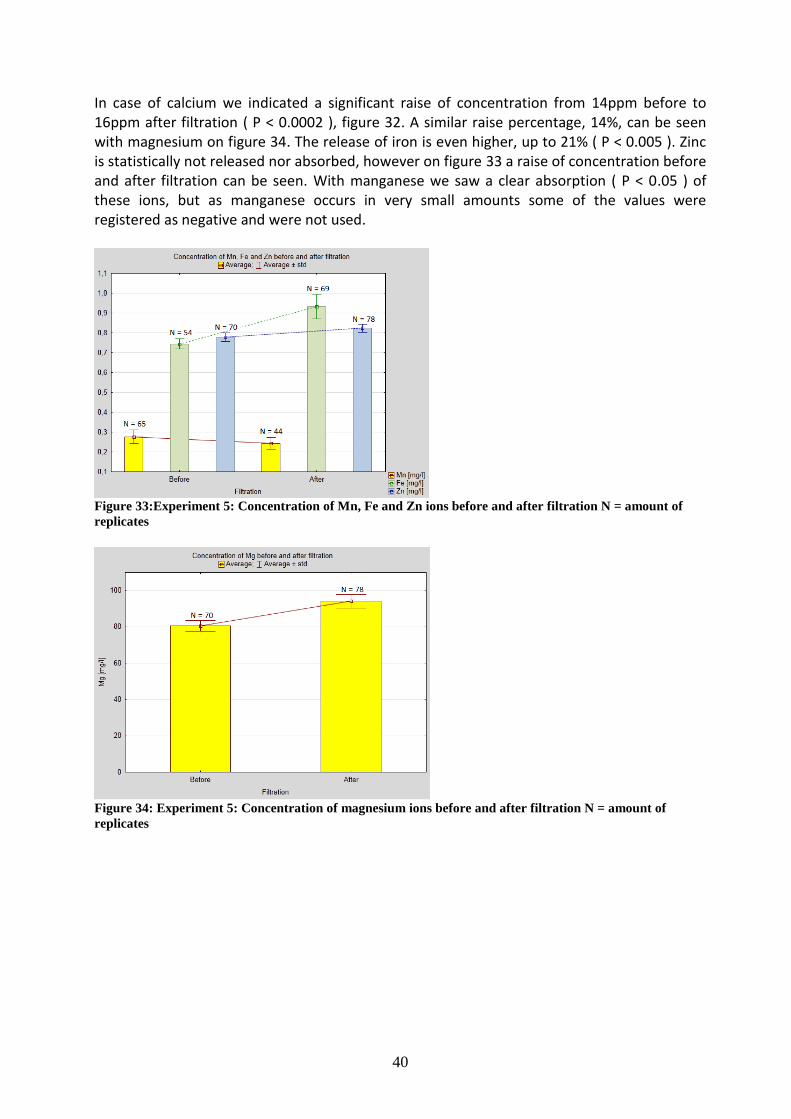
4.8.3 Influence of filtration on metal ion concentration in wort
We observed measurements during different tests and with elimination of error values, that show a release of all metal ions except for manganese. This level of release is not the same for each ion.
Figure 32: Experiment 5: Concentration of calcium ions before and after filtration N = amount of replicates
40
In case of calcium we indicated a significant raise of concentration from 14ppm before to 16ppm after filtration ( P < 0.0002 ), figure 32. A similar raise percentage, 14%, can be seen with magnesium on figure 34. The release of iron is even higher, up to 21% ( P < 0.005 ). Zinc is statistically not released nor absorbed, however on figure 33 a raise of concentration before and after filtration can be seen. With manganese we saw a clear absorption ( P < 0.05 ) of these ions, but as manganese occurs in very small amounts some of the values were registered as negative and were not used.
Figure 33:Experiment 5: Concentration of Mn, Fe and Zn ions before and after filtration N = amount of
replicates
Figure 34: Experiment 5: Concentration of magnesium ions before and after filtration N = amount of
replicates
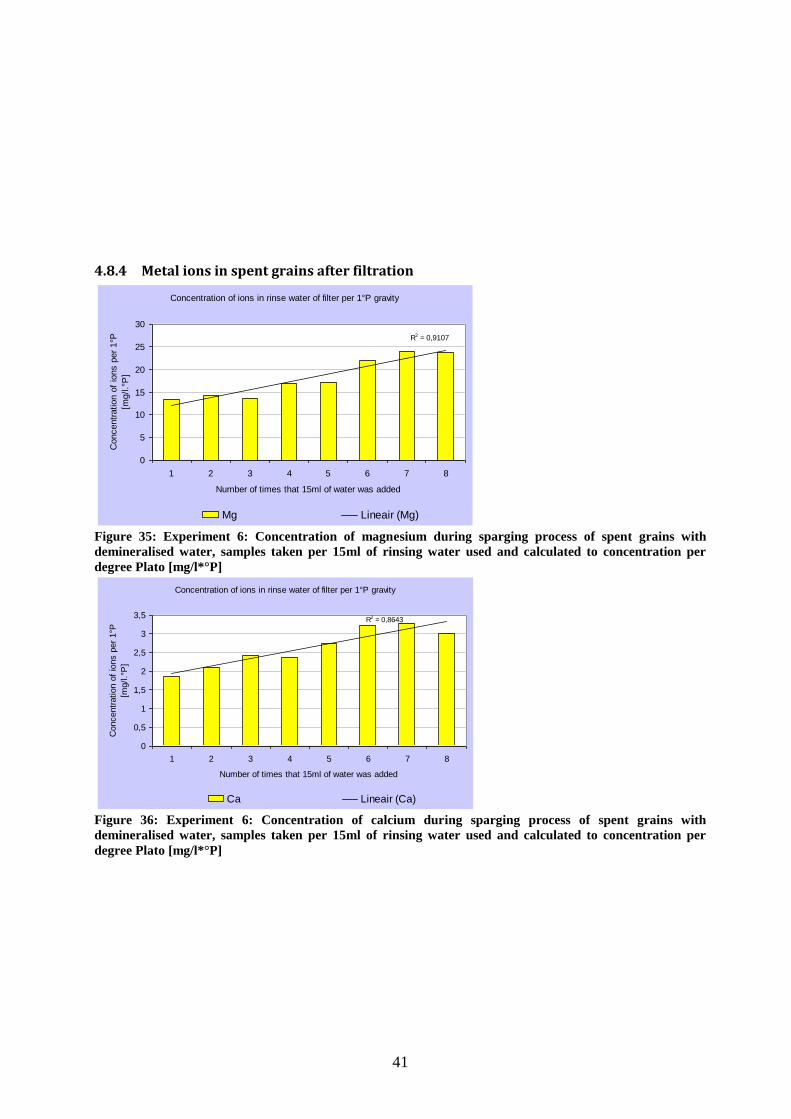
41
4.8.4 Metal ions in spent grains after filtration
Concentration of ions in rinse water of filter per 1°P gravity
R2 = 0,9107
0
5
10
15
20
25
30
1 2 3 4 5 6 7 8
Number of times that 15ml of water was added
Concentr
ation o
f io
ns p
er
1°P
[mg/l.°
P]
Mg Lineair (Mg)
Figure 35: Experiment 6: Concentration of magnesium during sparging process of spent grains with
demineralised water, samples taken per 15ml of rinsing water used and calculated to concentration per
degree Plato [mg/l*°P]
Concentration of ions in rinse water of filter per 1°P gravity
R2 = 0,8643
0
0,5
1
1,5
2
2,5
3
3,5
1 2 3 4 5 6 7 8
Number of times that 15ml of water was added
Concentr
ation o
f io
ns p
er
1°P
[mg/l.°
P]
Ca Lineair (Ca)
Figure 36: Experiment 6: Concentration of calcium during sparging process of spent grains with
demineralised water, samples taken per 15ml of rinsing water used and calculated to concentration per
degree Plato [mg/l*°P]
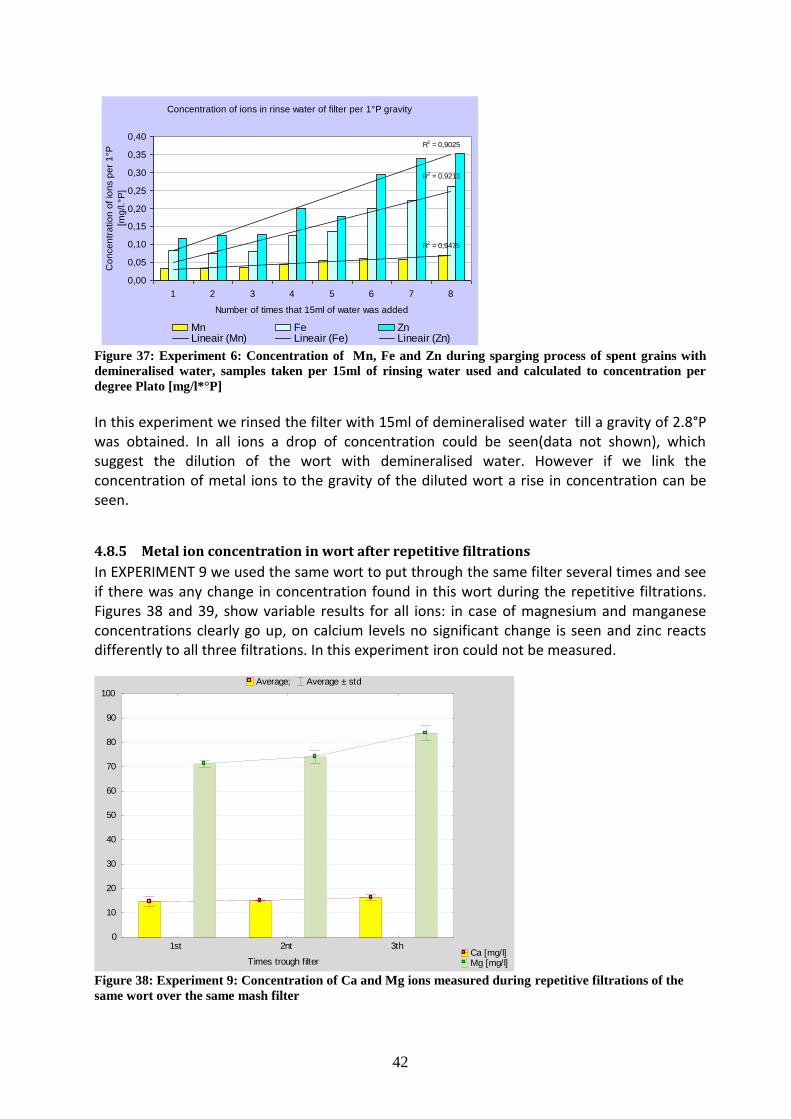
42
Concentration of ions in rinse water of filter per 1°P gravity
R2 = 0,9475
R2 = 0,9213
R2 = 0,9025
0,00
0,05
0,10
0,15
0,20
0,25
0,30
0,35
0,40
1 2 3 4 5 6 7 8
Number of times that 15ml of water was added
Co
nce
ntr
atio
n o
f io
ns p
er
1°P
[mg
/l.°
P]
Mn Fe ZnLineair (Mn) Lineair (Fe) Lineair (Zn)
Figure 37: Experiment 6: Concentration of Mn, Fe and Zn during sparging process of spent grains with
demineralised water, samples taken per 15ml of rinsing water used and calculated to concentration per
degree Plato [mg/l*°P]
In this experiment we rinsed the filter with 15ml of demineralised water till a gravity of 2.8°P was obtained. In all ions a drop of concentration could be seen(data not shown), which suggest the dilution of the wort with demineralised water. However if we link the concentration of metal ions to the gravity of the diluted wort a rise in concentration can be seen.
4.8.5 Metal ion concentration in wort after repetitive filtrations
In EXPERIMENT 9 we used the same wort to put through the same filter several times and see if there was any change in concentration found in this wort during the repetitive filtrations. Figures 38 and 39, show variable results for all ions: in case of magnesium and manganese concentrations clearly go up, on calcium levels no significant change is seen and zinc reacts differently to all three filtrations. In this experiment iron could not be measured.
Concentration of ions in wort trough repetitieve filtrations Average; Average ± std
Ca [mg/l] Mg [mg/l]
1st 2nt 3th
Times trough filter
0
10
20
30
40
50
60
70
80
90
100
Figure 38: Experiment 9: Concentration of Ca and Mg ions measured during repetitive filtrations of the
same wort over the same mash filter
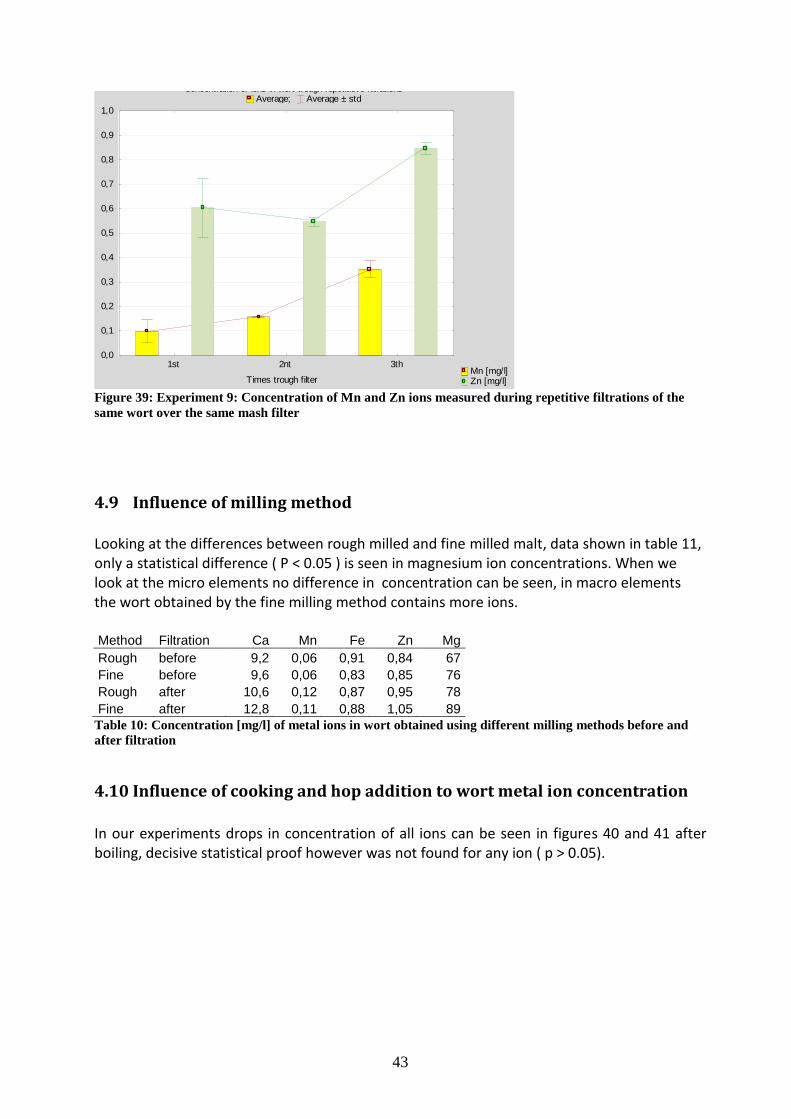
43
Concentration of ions in wort trough repetitieve filtrations Average; Average ± std
Mn [mg/l] Zn [mg/l]
1st 2nt 3th
Times trough filter
0,0
0,1
0,2
0,3
0,4
0,5
0,6
0,7
0,8
0,9
1,0
Figure 39: Experiment 9: Concentration of Mn and Zn ions measured during repetitive filtrations of the
same wort over the same mash filter
4.9 Influence of milling method
Looking at the differences between rough milled and fine milled malt, data shown in table 11, only a statistical difference ( P < 0.05 ) is seen in magnesium ion concentrations. When we look at the micro elements no difference in concentration can be seen, in macro elements the wort obtained by the fine milling method contains more ions. Method Filtration Ca Mn Fe Zn Mg
Rough before 9,2 0,06 0,91 0,84 67
Fine before 9,6 0,06 0,83 0,85 76
Rough after 10,6 0,12 0,87 0,95 78
Fine after 12,8 0,11 0,88 1,05 89
Table 10: Concentration [mg/l] of metal ions in wort obtained using different milling methods before and
after filtration
4.10 Influence of cooking and hop addition to wort metal ion concentration
In our experiments drops in concentration of all ions can be seen in figures 40 and 41 after boiling, decisive statistical proof however was not found for any ion ( p > 0.05).
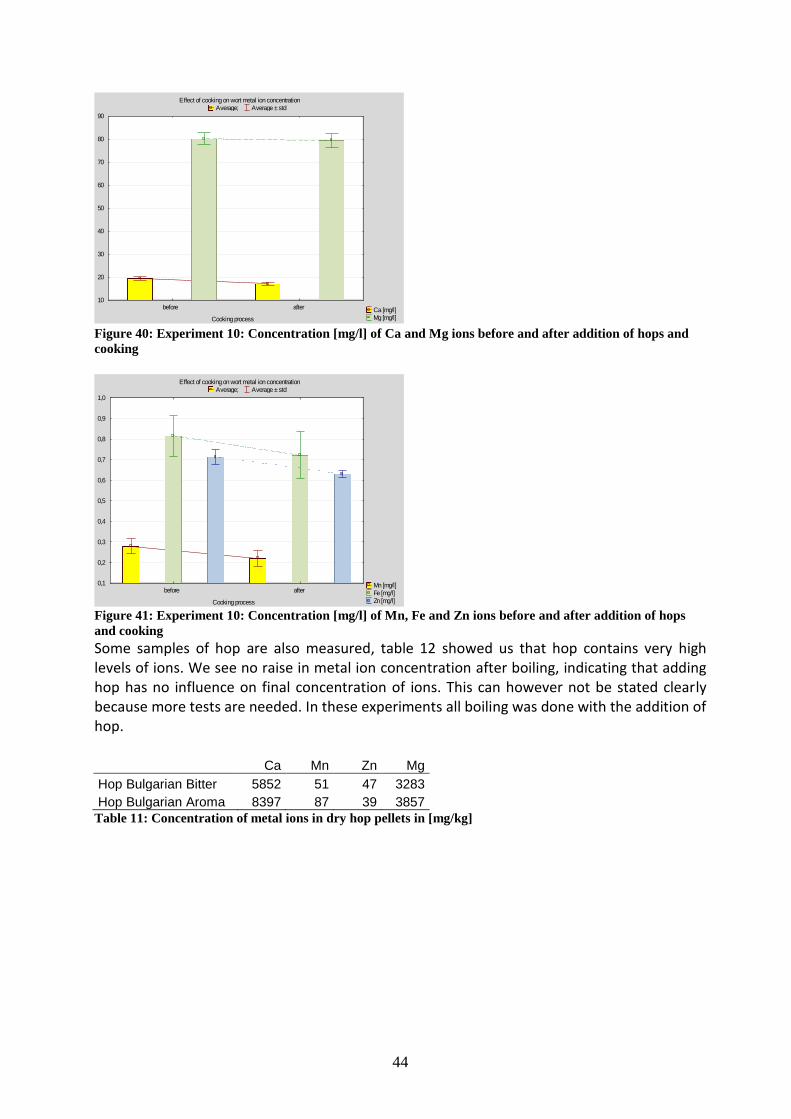
44
Effect of cooking on wort metal ion concentration Average; Average ± std
Ca [mg/l] Mg [mg/l]
before after
Cooking process
10
20
30
40
50
60
70
80
90
Figure 40: Experiment 10: Concentration [mg/l] of Ca and Mg ions before and after addition of hops and
cooking
Effect of cooking on wort metal ion concentration
Average; Average ± std
Mn [mg/l]
Fe [mg/l]
Zn [mg/l]
before after
Cooking process
0,1
0,2
0,3
0,4
0,5
0,6
0,7
0,8
0,9
1,0
Figure 41: Experiment 10: Concentration [mg/l] of Mn, Fe and Zn ions before and after addition of hops
and cooking
Some samples of hop are also measured, table 12 showed us that hop contains very high levels of ions. We see no raise in metal ion concentration after boiling, indicating that adding hop has no influence on final concentration of ions. This can however not be stated clearly because more tests are needed. In these experiments all boiling was done with the addition of hop. Ca Mn Zn Mg
Hop Bulgarian Bitter 5852 51 47 3283
Hop Bulgarian Aroma 8397 87 39 3857
Table 11: Concentration of metal ions in dry hop pellets in [mg/kg]
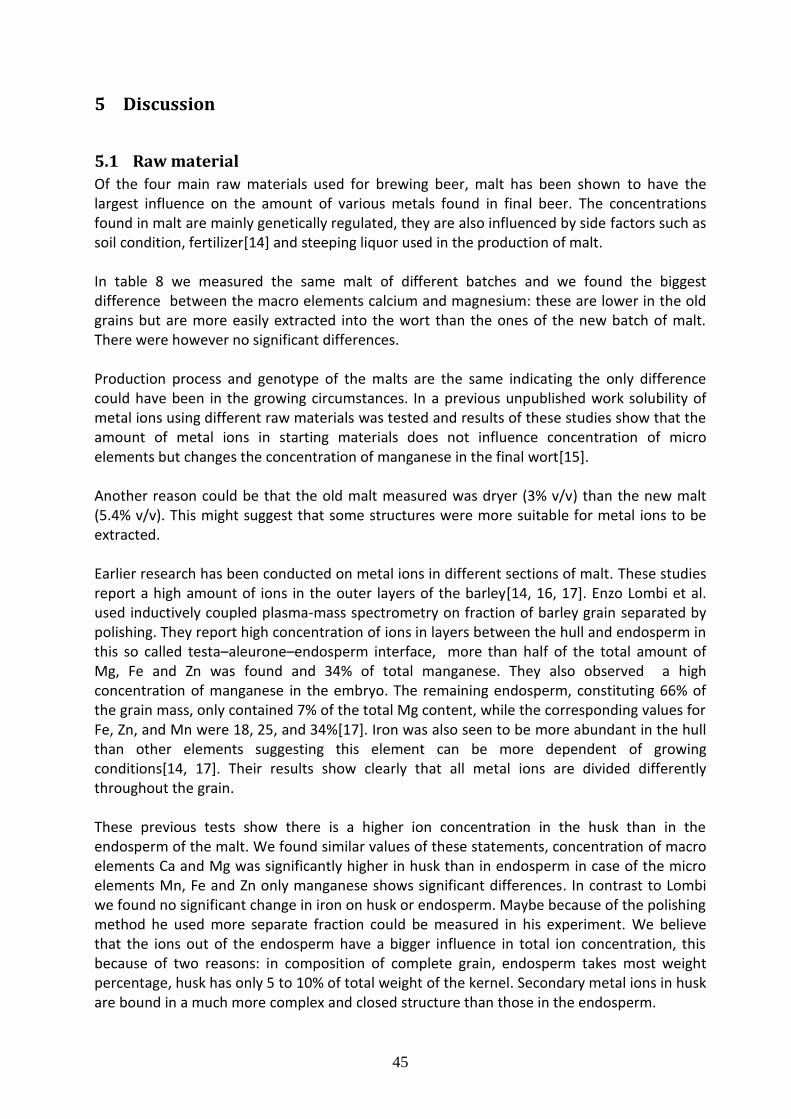
45
5 Discussion
5.1 Raw material
Of the four main raw materials used for brewing beer, malt has been shown to have the largest influence on the amount of various metals found in final beer. The concentrations found in malt are mainly genetically regulated, they are also influenced by side factors such as soil condition, fertilizer[14] and steeping liquor used in the production of malt. In table 8 we measured the same malt of different batches and we found the biggest difference between the macro elements calcium and magnesium: these are lower in the old grains but are more easily extracted into the wort than the ones of the new batch of malt. There were however no significant differences. Production process and genotype of the malts are the same indicating the only difference could have been in the growing circumstances. In a previous unpublished work solubility of metal ions using different raw materials was tested and results of these studies show that the amount of metal ions in starting materials does not influence concentration of micro elements but changes the concentration of manganese in the final wort[15]. Another reason could be that the old malt measured was dryer (3% v/v) than the new malt (5.4% v/v). This might suggest that some structures were more suitable for metal ions to be extracted. Earlier research has been conducted on metal ions in different sections of malt. These studies report a high amount of ions in the outer layers of the barley[14, 16, 17]. Enzo Lombi et al. used inductively coupled plasma-mass spectrometry on fraction of barley grain separated by polishing. They report high concentration of ions in layers between the hull and endosperm in this so called testa–aleurone–endosperm interface, more than half of the total amount of Mg, Fe and Zn was found and 34% of total manganese. They also observed a high concentration of manganese in the embryo. The remaining endosperm, constituting 66% of the grain mass, only contained 7% of the total Mg content, while the corresponding values for Fe, Zn, and Mn were 18, 25, and 34%[17]. Iron was also seen to be more abundant in the hull than other elements suggesting this element can be more dependent of growing conditions[14, 17]. Their results show clearly that all metal ions are divided differently throughout the grain. These previous tests show there is a higher ion concentration in the husk than in the endosperm of the malt. We found similar values of these statements, concentration of macro elements Ca and Mg was significantly higher in husk than in endosperm in case of the micro elements Mn, Fe and Zn only manganese shows significant differences. In contrast to Lombi we found no significant change in iron on husk or endosperm. Maybe because of the polishing method he used more separate fraction could be measured in his experiment. We believe that the ions out of the endosperm have a bigger influence in total ion concentration, this because of two reasons: in composition of complete grain, endosperm takes most weight percentage, husk has only 5 to 10% of total weight of the kernel. Secondary metal ions in husk are bound in a much more complex and closed structure than those in the endosperm.
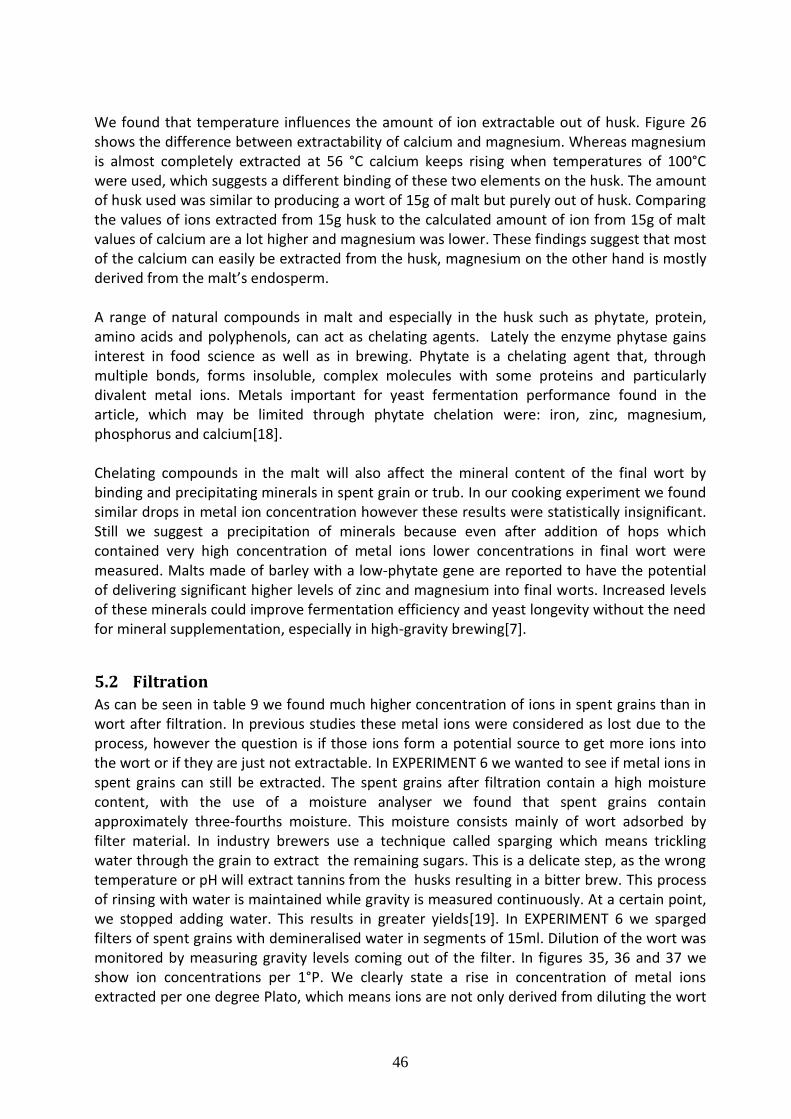
46
We found that temperature influences the amount of ion extractable out of husk. Figure 26 shows the difference between extractability of calcium and magnesium. Whereas magnesium is almost completely extracted at 56 °C calcium keeps rising when temperatures of 100°C were used, which suggests a different binding of these two elements on the husk. The amount of husk used was similar to producing a wort of 15g of malt but purely out of husk. Comparing the values of ions extracted from 15g husk to the calculated amount of ion from 15g of malt values of calcium are a lot higher and magnesium was lower. These findings suggest that most of the calcium can easily be extracted from the husk, magnesium on the other hand is mostly derived from the malt’s endosperm. A range of natural compounds in malt and especially in the husk such as phytate, protein, amino acids and polyphenols, can act as chelating agents. Lately the enzyme phytase gains interest in food science as well as in brewing. Phytate is a chelating agent that, through multiple bonds, forms insoluble, complex molecules with some proteins and particularly divalent metal ions. Metals important for yeast fermentation performance found in the article, which may be limited through phytate chelation were: iron, zinc, magnesium, phosphorus and calcium[18]. Chelating compounds in the malt will also affect the mineral content of the final wort by binding and precipitating minerals in spent grain or trub. In our cooking experiment we found similar drops in metal ion concentration however these results were statistically insignificant. Still we suggest a precipitation of minerals because even after addition of hops which contained very high concentration of metal ions lower concentrations in final wort were measured. Malts made of barley with a low-phytate gene are reported to have the potential of delivering significant higher levels of zinc and magnesium into final worts. Increased levels of these minerals could improve fermentation efficiency and yeast longevity without the need for mineral supplementation, especially in high-gravity brewing[7].
5.2 Filtration
As can be seen in table 9 we found much higher concentration of ions in spent grains than in wort after filtration. In previous studies these metal ions were considered as lost due to the process, however the question is if those ions form a potential source to get more ions into the wort or if they are just not extractable. In EXPERIMENT 6 we wanted to see if metal ions in spent grains can still be extracted. The spent grains after filtration contain a high moisture content, with the use of a moisture analyser we found that spent grains contain approximately three-fourths moisture. This moisture consists mainly of wort adsorbed by filter material. In industry brewers use a technique called sparging which means trickling water through the grain to extract the remaining sugars. This is a delicate step, as the wrong temperature or pH will extract tannins from the husks resulting in a bitter brew. This process of rinsing with water is maintained while gravity is measured continuously. At a certain point, we stopped adding water. This results in greater yields[19]. In EXPERIMENT 6 we sparged filters of spent grains with demineralised water in segments of 15ml. Dilution of the wort was monitored by measuring gravity levels coming out of the filter. In figures 35, 36 and 37 we show ion concentrations per 1°P. We clearly state a rise in concentration of metal ions extracted per one degree Plato, which means ions are not only derived from diluting the wort
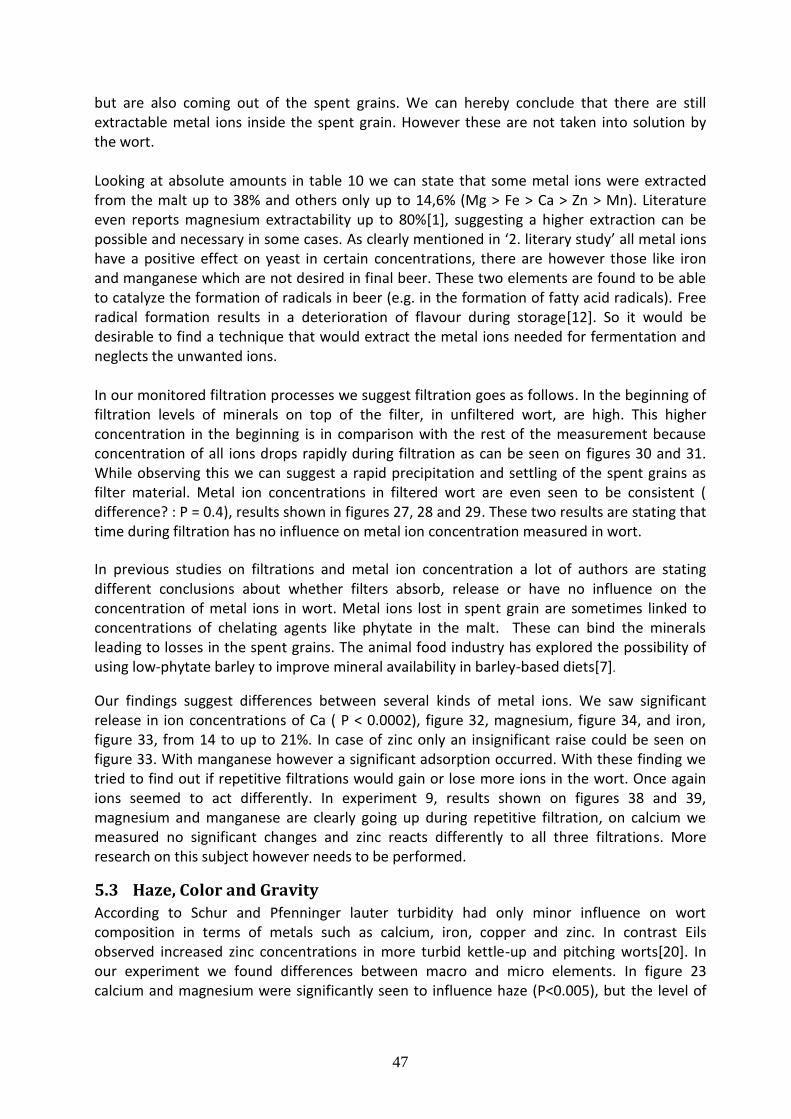
47
but are also coming out of the spent grains. We can hereby conclude that there are still extractable metal ions inside the spent grain. However these are not taken into solution by the wort. Looking at absolute amounts in table 10 we can state that some metal ions were extracted from the malt up to 38% and others only up to 14,6% (Mg > Fe > Ca > Zn > Mn). Literature even reports magnesium extractability up to 80%[1], suggesting a higher extraction can be possible and necessary in some cases. As clearly mentioned in ‘2. literary study’ all metal ions have a positive effect on yeast in certain concentrations, there are however those like iron and manganese which are not desired in final beer. These two elements are found to be able to catalyze the formation of radicals in beer (e.g. in the formation of fatty acid radicals). Free radical formation results in a deterioration of flavour during storage[12]. So it would be desirable to find a technique that would extract the metal ions needed for fermentation and neglects the unwanted ions. In our monitored filtration processes we suggest filtration goes as follows. In the beginning of filtration levels of minerals on top of the filter, in unfiltered wort, are high. This higher concentration in the beginning is in comparison with the rest of the measurement because concentration of all ions drops rapidly during filtration as can be seen on figures 30 and 31. While observing this we can suggest a rapid precipitation and settling of the spent grains as filter material. Metal ion concentrations in filtered wort are even seen to be consistent ( difference? : P = 0.4), results shown in figures 27, 28 and 29. These two results are stating that time during filtration has no influence on metal ion concentration measured in wort.
In previous studies on filtrations and metal ion concentration a lot of authors are stating different conclusions about whether filters absorb, release or have no influence on the concentration of metal ions in wort. Metal ions lost in spent grain are sometimes linked to concentrations of chelating agents like phytate in the malt. These can bind the minerals leading to losses in the spent grains. The animal food industry has explored the possibility of using low-phytate barley to improve mineral availability in barley-based diets[7].
Our findings suggest differences between several kinds of metal ions. We saw significant release in ion concentrations of Ca ( P < 0.0002), figure 32, magnesium, figure 34, and iron, figure 33, from 14 to up to 21%. In case of zinc only an insignificant raise could be seen on figure 33. With manganese however a significant adsorption occurred. With these finding we tried to find out if repetitive filtrations would gain or lose more ions in the wort. Once again ions seemed to act differently. In experiment 9, results shown on figures 38 and 39, magnesium and manganese are clearly going up during repetitive filtration, on calcium we measured no significant changes and zinc reacts differently to all three filtrations. More research on this subject however needs to be performed.
5.3 Haze, Color and Gravity
According to Schur and Pfenninger lauter turbidity had only minor influence on wort composition in terms of metals such as calcium, iron, copper and zinc. In contrast Eils observed increased zinc concentrations in more turbid kettle-up and pitching worts[20]. In our experiment we found differences between macro and micro elements. In figure 23 calcium and magnesium were significantly seen to influence haze (P<0.005), but the level of
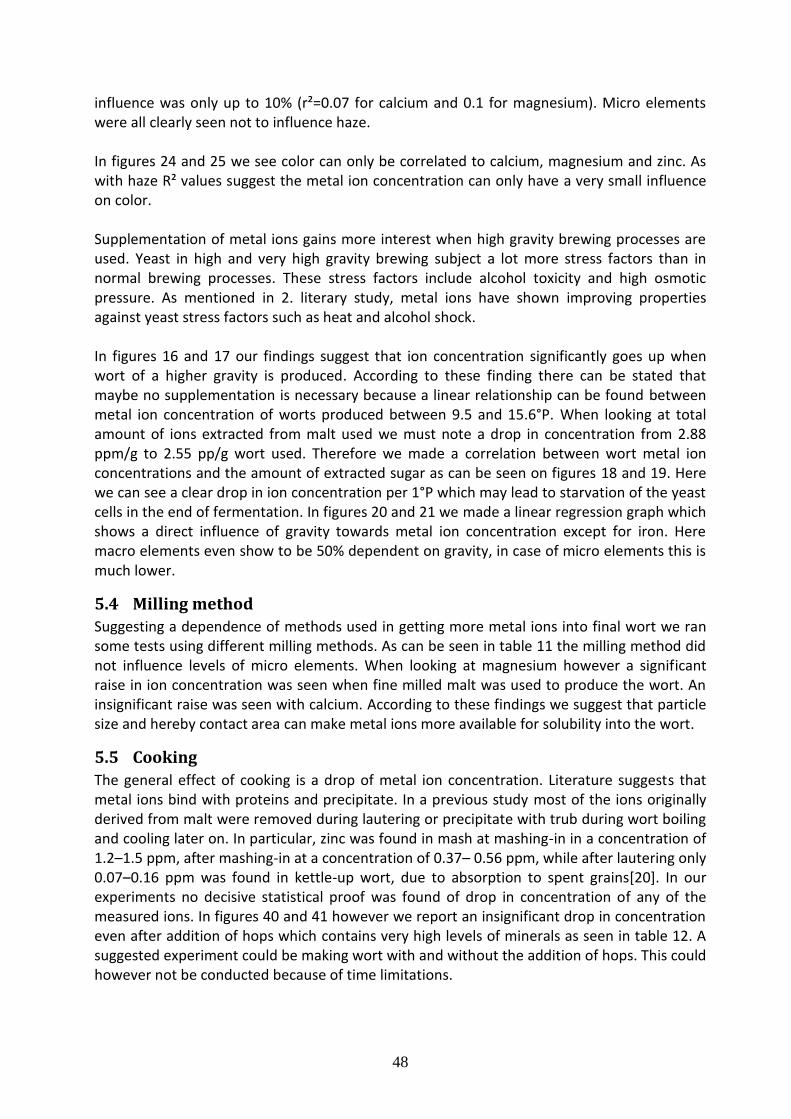
48
influence was only up to 10% (r²=0.07 for calcium and 0.1 for magnesium). Micro elements were all clearly seen not to influence haze. In figures 24 and 25 we see color can only be correlated to calcium, magnesium and zinc. As with haze R² values suggest the metal ion concentration can only have a very small influence on color. Supplementation of metal ions gains more interest when high gravity brewing processes are used. Yeast in high and very high gravity brewing subject a lot more stress factors than in normal brewing processes. These stress factors include alcohol toxicity and high osmotic pressure. As mentioned in 2. literary study, metal ions have shown improving properties against yeast stress factors such as heat and alcohol shock. In figures 16 and 17 our findings suggest that ion concentration significantly goes up when wort of a higher gravity is produced. According to these finding there can be stated that maybe no supplementation is necessary because a linear relationship can be found between metal ion concentration of worts produced between 9.5 and 15.6°P. When looking at total amount of ions extracted from malt used we must note a drop in concentration from 2.88 ppm/g to 2.55 pp/g wort used. Therefore we made a correlation between wort metal ion concentrations and the amount of extracted sugar as can be seen on figures 18 and 19. Here we can see a clear drop in ion concentration per 1°P which may lead to starvation of the yeast cells in the end of fermentation. In figures 20 and 21 we made a linear regression graph which shows a direct influence of gravity towards metal ion concentration except for iron. Here macro elements even show to be 50% dependent on gravity, in case of micro elements this is much lower.
5.4 Milling method
Suggesting a dependence of methods used in getting more metal ions into final wort we ran some tests using different milling methods. As can be seen in table 11 the milling method did not influence levels of micro elements. When looking at magnesium however a significant raise in ion concentration was seen when fine milled malt was used to produce the wort. An insignificant raise was seen with calcium. According to these findings we suggest that particle size and hereby contact area can make metal ions more available for solubility into the wort.
5.5 Cooking
The general effect of cooking is a drop of metal ion concentration. Literature suggests that metal ions bind with proteins and precipitate. In a previous study most of the ions originally derived from malt were removed during lautering or precipitate with trub during wort boiling and cooling later on. In particular, zinc was found in mash at mashing-in in a concentration of 1.2–1.5 ppm, after mashing-in at a concentration of 0.37– 0.56 ppm, while after lautering only 0.07–0.16 ppm was found in kettle-up wort, due to absorption to spent grains[20]. In our experiments no decisive statistical proof was found of drop in concentration of any of the measured ions. In figures 40 and 41 however we report an insignificant drop in concentration even after addition of hops which contains very high levels of minerals as seen in table 12. A suggested experiment could be making wort with and without the addition of hops. This could however not be conducted because of time limitations.
49
6 Conclusion
Metal ions govern several important parameters including the rate of sugar conversion to ethanol, the degree of attenuation/final ethanol yield, the amount of yeast produced, cell viability and stress tolerance, extent of foaming and yeast flocculation behaviour. Mineral-enriched yeasts have potential in addressing the problem of insufficient bioavailable metal ions. In our research however we focused on possibilities of extracting more metal ions out of the raw materials used in the brewing process. The largest losses on input output ratios were seen in the use of malt as a lot of the ions stay in spent grains. Metal ions inside are still extractable but not easily taken up by wort. We indicate sparging of the spent grains one of the key factors to extract more metal ions out of the spent grains. In the factors of gravity, haze and color only gravity seemed to be linked to concentration in final wort. But high gravity means a lower extracted fraction of metal ions out of the malt. The filtration process was seen to have various effects on the metal ions, Ca, Mg and Fe were released, Zn practically stayed the same and Mn was adsorbed. The use of different milling methods showed us that a smaller particle size raises the final metal ion concentration. These results were however only significant in the case of magnesium. Cooking results in a drop of concentration when no raise of hop addition would be preformed.
50
7 References
1. Gibson, B.R., 125th Anniversary Review: Improvement of higher gravity brewery fermentation via wort
enrichment and supplementation. J. Inst. Brew., 2011. 117(3): p. 268-284.
2. Stehlik-Tomas, V., et al., Zinc, Copper and Manganese Enrichment in Yeast Saccharomyces cerevisae.
Food Technol. Biotechnol., 2004. 42(2): p. 115-120.
3. Nicola, R.D. and G.M. Walker, Zinc Interactions with Brewing Yeast: Impact on Fermentation
Performance. J. Am. Soc. Brew. Chem., 2011. 69(4): p. 214-219.
4. Aleksander, P., et al., Accumulation an Release of Metal Ions by Brewer's Yeast During Successive
Fermentations. Inst. Brew., 2009. 115(1): p. 78-83.
5. Lima, L., et al., Comparing the Impact of Environmental Factors During Very High Gravity Brewing
Fermentations. J. Inst. Brew, 2011. 117(3): p. 359-367.
6. Walker, G.M., et al., Yeast-metal interaction: impact on brewing and distilling fermentation. 2006: p. 19.
7. Edney, M.J., B.G. Rossnagel, and V. Raboy, Effect of Low-Phytate Barley on Malt Quality, Including
Mineral Loss, During Fermentation. J. Am. Soc. Brew. Chem, 2007. 65(2): p. 81-85.
8. Eumann, M. and S. Schildbach, 125th Anniversary Review: Water sources and treatment in brewing. J.
Inst. Brew, 2012. 118: p. 12-21.
9. Vidgren, V. and J. Londesborough, 125th Anniversary Review: Yeast Flocculation and Sedimentation in
Brewing. J. Inst. Brew., 2011. 117(4): p. 475-487.
10. Nicola, R.D., et al., Influence of zinc on distillers's yeast: cellular accumulation of zinc and impact on spirit
congeners. J. Inst. Brew., 2009. 115(3): p. 265-271.
11. Brune, K. Alcohol dehydrogenase enzym. Registery of standard biological parts 2009; Available from:
http://parts.igem.org/Part:BBa_K273001.
12. Zufall, C. and T. Tyrell, The Influence of Heavy Metal Ions on Beer Flavour Stability. J. Inst. Brew, 2012.
114(2): p. 134-142.
13. Shakoury-Elizeh, M., et al., Metabolic Response to Iron Deficiency in Saccharomyces
cerevisiae. THE JOURNAL OF BIOLOGICAL CHEMISTRY, 2010. 285(19): p. 14823-14833.
14. CAKMAK, I., et al., Biofortification and Localization of Zinc in Wheat Grain. Journal of Agricultural and
Food Chemistry, 2010. 58: p. 9092-9102.
15. Poreda, A., et al., Effect of wheat malt on metal ions concentration in wort and brewhouse by-products,
2013.
16. LIU, K., K.L. PETERSON, and V. RABOY, Comparison of the Phosphorus and Mineral Concentrations
in Bran and Abraded Kernel Fractions of a Normal Barley (Hordeum vulgare) Cultivar versus Four Low
Phytic Acid Isolines. Journal of Agricultural and Food Chemistry, 2007. 55: p. 4453-4460.
17. Lombi, E., et al., Megapixel imaging of (micro)nutrients in mature barley grains. Journal of Experimental
Botany, 2011. 62(1): p. 273-282.
18. Kruger, J., et al., Potential for improvement in yeast nutrition in raw whole grain sorghum and maize lager
brewing and bioethanol production through grain genetic modification and phytase treatment. J. Inst.
Brew, 2012. 118: p. 70-75.
19. Palmer, J., How to brew: Everything You Need To Know To Brew Beer Right The First Time. Brewers
Publications, 2006: p. 347.
20. Kühbeck, F., W. Back, and M. Krottenthaler, Influence of Lauter Turbidity on Wort Composition,
Fermentation Performance and Beer Quality - A Review. J. Inst. Brew, 2006. 112(3): p. 215–221.
51
8 Appendices
8.1 Appendix 1: Checklist for using Varian AA240FS
1. Start the Pc and login 2. Before turning on software, put the machine on by putting the switch in position
І, green light will burn
3. Open the software SpectrAA
4. Click on Worksheet and select New
5. Chose the instrument you want to work with
Instrument 1: Furnace Instrument 2: Flame
6. Select a folder where you want to save the worksheet, preferred is DANE (E:) 7. Give your file a name 8. You start on the Develop screen
a. Add method
52
i. Select correct method type ii. Select the elements you want to analyse and click Ok
b. Edit method
i. Type/mode : Put in manual and activate Use Sips
ii. Optical: Put in the right wave length
53
iii. Standard: Fill in bulk standard conc. in PPM + Standard count
iv. You can adjust the values manually by going to Sips screen and
click on manually Entered Standards
c. Fast sequence Wizard (in order to create the right order and continue
measurement)
i. Go through all screens by clicking Next and end with Finish
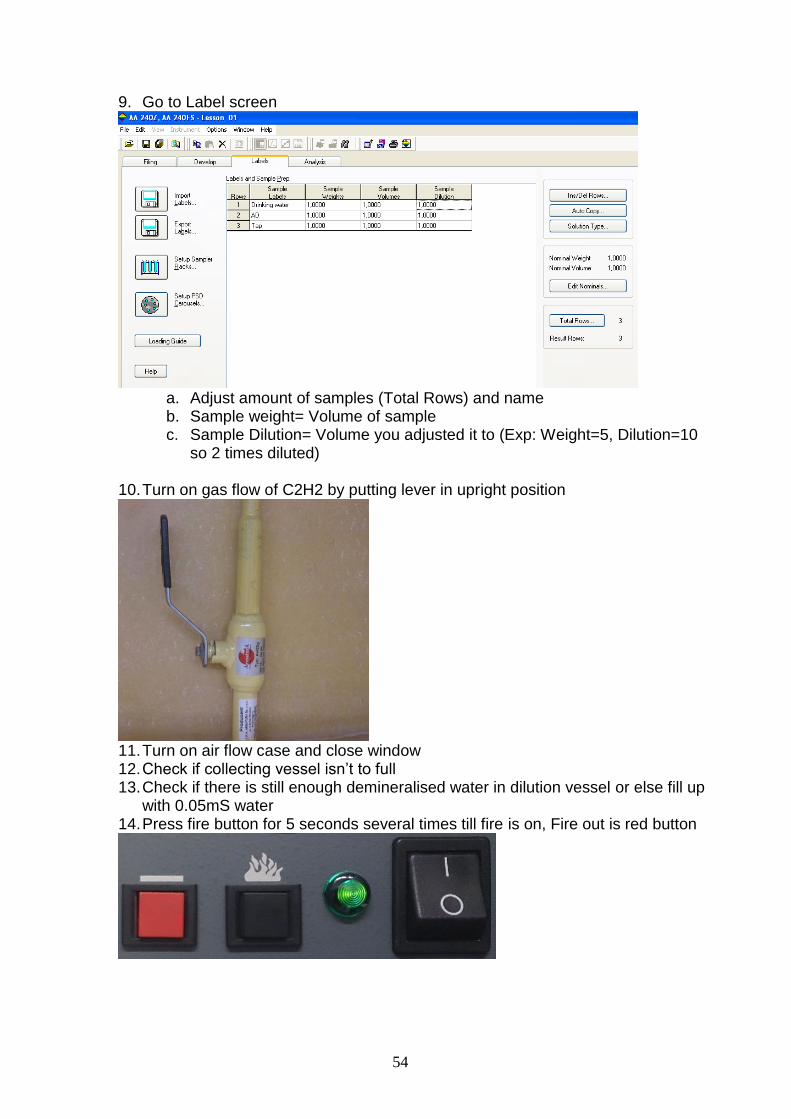
54
9. Go to Label screen
a. Adjust amount of samples (Total Rows) and name b. Sample weight= Volume of sample c. Sample Dilution= Volume you adjusted it to (Exp: Weight=5, Dilution=10
so 2 times diluted)
10. Turn on gas flow of C2H2 by putting lever in upright position
11. Turn on air flow case and close window 12. Check if collecting vessel isn’t to full 13. Check if there is still enough demineralised water in dilution vessel or else fill up
with 0.05mS water 14. Press fire button for 5 seconds several times till fire is on, Fire out is red button
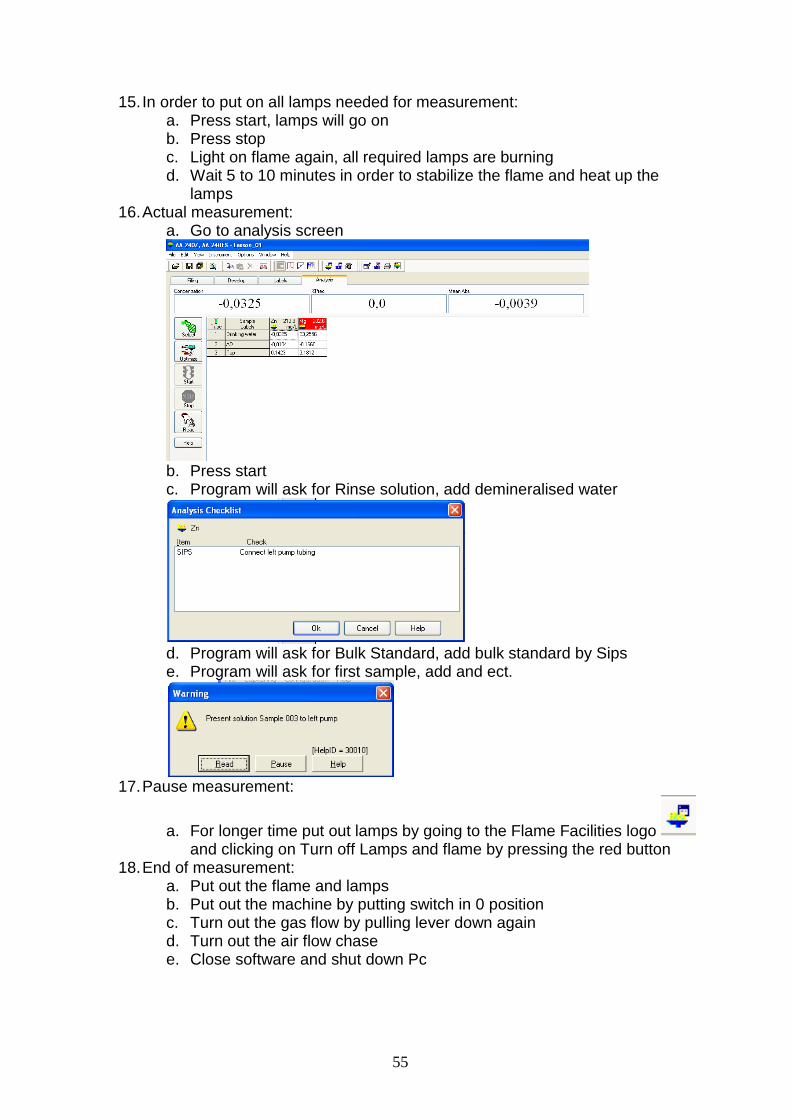
55
15. In order to put on all lamps needed for measurement: a. Press start, lamps will go on b. Press stop c. Light on flame again, all required lamps are burning d. Wait 5 to 10 minutes in order to stabilize the flame and heat up the
lamps 16. Actual measurement:
a. Go to analysis screen
b. Press start c. Program will ask for Rinse solution, add demineralised water
d. Program will ask for Bulk Standard, add bulk standard by Sips e. Program will ask for first sample, add and ect.
17. Pause measurement:
a. For longer time put out lamps by going to the Flame Facilities logo and clicking on Turn off Lamps and flame by pressing the red button
18. End of measurement: a. Put out the flame and lamps b. Put out the machine by putting switch in 0 position c. Turn out the gas flow by pulling lever down again d. Turn out the air flow chase e. Close software and shut down Pc
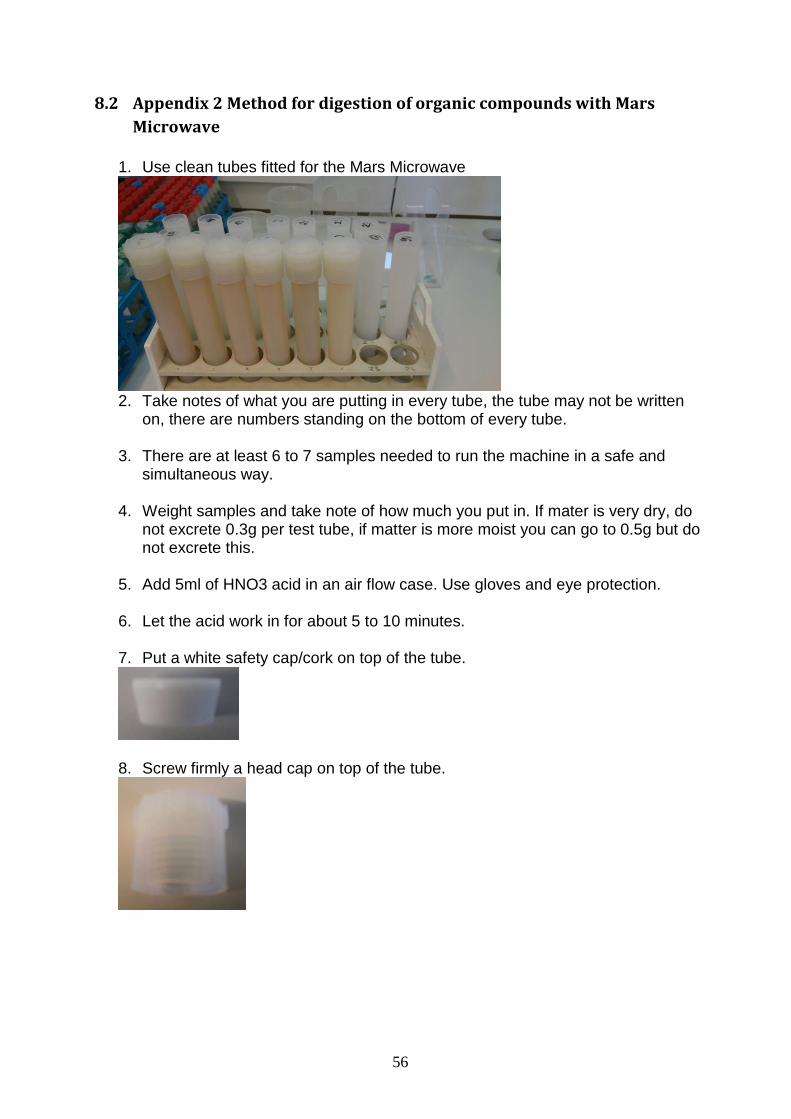
56
8.2 Appendix 2 Method for digestion of organic compounds with Mars
Microwave
1. Use clean tubes fitted for the Mars Microwave
2. Take notes of what you are putting in every tube, the tube may not be written
on, there are numbers standing on the bottom of every tube.
3. There are at least 6 to 7 samples needed to run the machine in a safe and simultaneous way.
4. Weight samples and take note of how much you put in. If mater is very dry, do
not excrete 0.3g per test tube, if matter is more moist you can go to 0.5g but do not excrete this.
5. Add 5ml of HNO3 acid in an air flow case. Use gloves and eye protection.
6. Let the acid work in for about 5 to 10 minutes.
7. Put a white safety cap/cork on top of the tube.
8. Screw firmly a head cap on top of the tube.
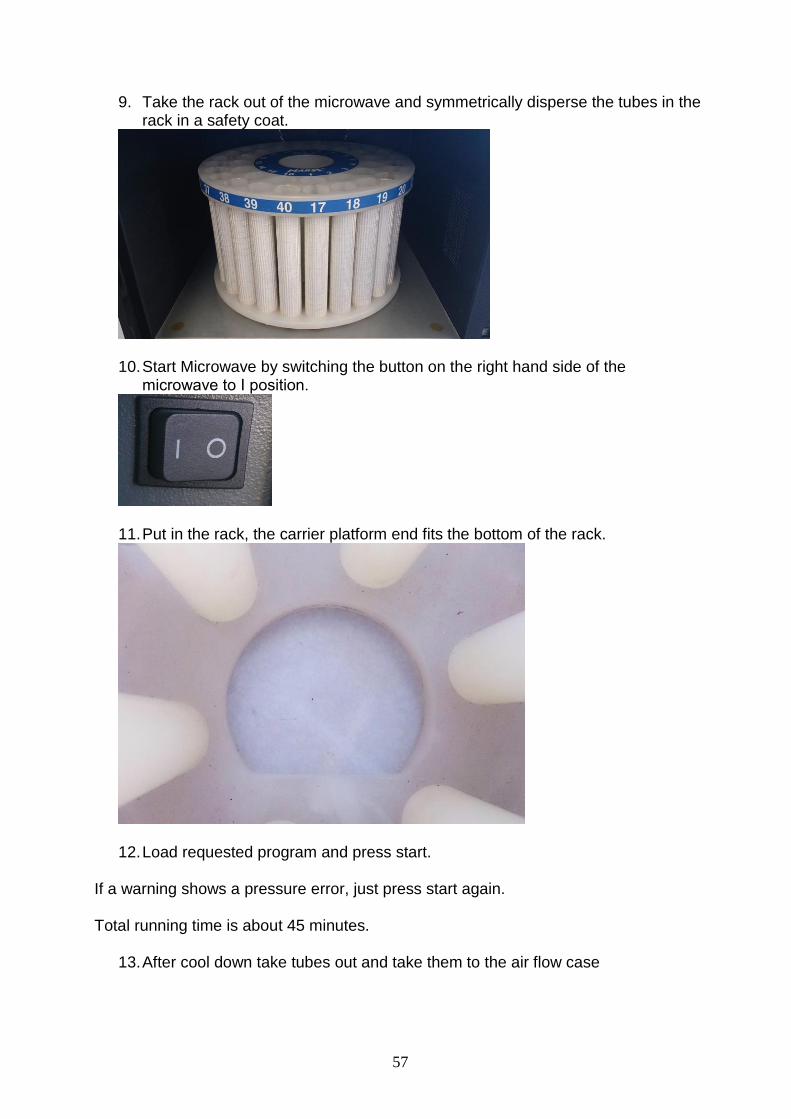
57
9. Take the rack out of the microwave and symmetrically disperse the tubes in the rack in a safety coat.
10. Start Microwave by switching the button on the right hand side of the microwave to І position.
11. Put in the rack, the carrier platform end fits the bottom of the rack.
12. Load requested program and press start.
If a warning shows a pressure error, just press start again. Total running time is about 45 minutes.
13. After cool down take tubes out and take them to the air flow case

58
14. Open very slowly the screw cap and let the pressurised gasses escape 15. Bring the content of the tube into a vial
16. Rinse the tube with 5ml of 0.05mS water and bring rinse in same vial 17. Rinse tube again, take care you do not cross the maximum volume of the vial
18. Make sure vial is closed and control if all particles are digested


![Szanghajska Organizacja Współpracy i jej wpływ na kształtowanie globalnego zarządzania [Shanghai Cooperation Organization and its Influence on the Global Governance]](https://static.fdocuments.pl/doc/165x107/58ac3cfa1a28ab145e8b66d9/szanghajska-organizacja-wspolpracy-i-jej-wplyw-na-ksztaltowanie-globalnego.jpg)


![Human body - gijyuku.634tv.comgijyuku.634tv.com/pdf/English/Human-body.pdf · waste molecules and excess ions and water out of the body.[26] Human anatomy is the study of the shape](https://static.fdocuments.pl/doc/165x107/5ed289dbaf2f306b9a013d53/human-body-gijyuku634tvcomgijyuku634tvcompdfenglishhuman-bodypdf-waste.jpg)