T:ree communities and human influence the Western Ghats, India
17
J. indian lnst. Sci., Nov.-Dec. 2000, 80,553-569. © Indian hstitute of Science T:ree communities and human influence Western Ghats, India the K. P. ACHAR 1 , SHONIL BHAGWAT 2 , DAYANAND BHAT 3 , HARISH BHAT, K. GOPALKRISHNA BHAT 4 , P. ISHWARA BHAT\ PUSHPALATHA BHAT 5 , G. K. BHATTA 6 , M. D. S. CHANDRAN 7 , YOGESH GOKHALE 2 , VIVEK GOUR BROOME 2 , A. E. DULIP DANIELS 8 , K. N. DEVIPRASAD 9 , V. ARAVINDA HEBBAR 10 , M. R. JAMES 11 , G. S. JAYADEVA 12 , K. KRISHNA 1 , J. I. NIRMALKUMAR 13 , N. A. MADHYASTHA 4 , K. MEENAKSHr 9 , PARVATI MENON 14 , K. MURUGAN 15 , R.AMKRISHNA PAY AT 16 PRAKASH PANDIT 7 R p p T1L 17 c K p 18 p p 19 v s L ' l ' . . A • ' . . OOJARI , . RAMOD ' . . RAM CHANDRAN 2 ° K s M H RA 10 v \ 7 s 21 s s w· , T 11 A - , . . AD AV 0 , . . IVAN , . RINIDHI, IN FRED HOMAS , GHATE UTKARSH 211 AND R. WELANKAR 2 Centre for Ecological Sciences, Indian Institute of Science, Bangalore 560 012. emails: g.utkarsh@frlht·india.org/[email protected]; Phones: 91-80-3434465/3336909; Fax: 91-80-3334167. Received on July 20, 2000. Abstract We studied distribution of 17,220 trees belonging to 424 species along 247 transects each measuring 0.12 ha. These represent 8 natural and man-made vegetation types from 20 localities along the Western Ghats, below 1200 m. Human ini1uence appears to result in loss of biomass, reduction in species diversity and loss of rare species. Particularly, it enhances spatial heterogeneity in structure and species composition. Human influence also seems to favour more dis- tinctive set of species. Keywords: Biomass, species diversity, tropical forests, disturbance, plantations, rarity. 1. Introduction Inventorying and monitoring of the biological diversity is a prerequisite to its sustainable use and conservation. This is an important challenge in mountain areas like the Western Ghats, which is identified as one of the 18 global hot spots of biodiversity . 1 A hot spot is characterised with high species diversity, high endemicity as well as alarming rate of its destruction. Western Ghats harbour some 5000 species of flowering plants 2 of which nearly 800 are trees. 3 The com- ·-#Author for correspondence !. Bhuvanendra College, Karkala 574104; 2. RANWA, C-26/l, Ketan Heights, Kothrud, Pune 411 029; 3. M. M. College, Sirsi 581402; 4. Poomaprajna College, Udupi 576101; 5. Sringeri Nature and Adventure Club, Sringeti 577139; 6. J.C.B.M. College, Sringeri 577139; 7. A. V. Baliga College, Kumta 581343; 8. Scott Christian College, Nagercoil 624601; 9. Nehru Mem01ial College, Sullia 574239; 10. M.G.M. College, Udupi 576102; 11. American College, Madurai 625018; 12. J.S.S. College, Chamrajnagar 571313; 13. Jai Hind College, Dhule 424002; 14. Ma- hatma Gandhi College, Trivandrum 695004; 15. Govt. Victoria College, Palghat 678001; 16. Govt. Arts and Science College, Calicut 678018; 17. P.V.P. College, Loni 413713; 18. M.V. Govt. Science College, Bhadrawati 577301; 19. Jawaharlal Nehm Centre for Advanced Scientific Research, Bangalore, 560054; 20. Kongunadu College, Coimbatore 641029; and 21. Integrated Rural Technology Centre, Mundur 678592.
Transcript of T:ree communities and human influence the Western Ghats, India
J. indian lnst. Sci., Nov.-Dec. 2000, 80,553-569. © Indian hstitute of Science
T:ree communities and human influence Western Ghats, India
the
K. P. ACHAR1, SHONIL BHAGWAT
2, DAYANAND BHAT3
, HARISH BHAT, K. GOPALKRISHNA
BHAT4
, P. ISHWARA BHAT\ PUSHPALATHA BHAT5, G. K. BHATTA6
, M. D. S. CHANDRAN7,
YOGESH GOKHALE2
, VIVEK GOUR BROOME2, A. E. DULIP DANIELS8
, K. N. DEVIPRASAD9, V.
ARAVINDA HEBBAR10
, M. R. JAMES11
, G. S. JAYADEVA12, K. KRISHNA 1
, J. I. NIRMALKUMAR13,
N. A. MADHYASTHA4
, K. MEENAKSHr9
, PARVATI MENON14, K. MURUGAN15
, R.AMKRISHNA
PA Y AT16
PRAKASH PANDIT7 R p p T1L17 c K p 18 p p 19 v s L ' l ' . . A • ' . . OOJARI , . RAMOD ' . . RAM CHANDRAN2° K s M H RA 10 v \7 s 21 s s w· , T 11 A - , . . AD A V 0 , . . IV AN , . RINIDHI, IN FRED HOMAS , GHATE UTKARSH211 AND R. WELANKAR2
Centre for Ecological Sciences, Indian Institute of Science, Bangalore 560 012. emails: g.utkarsh@frlht·india.org/[email protected]; Phones: 91-80-3434465/3336909; Fax: 91-80-3334167.
Received on July 20, 2000.
Abstract
We studied distribution of 17,220 trees belonging to 424 species along 247 transects each measuring 0.12 ha. These represent 8 natural and man-made vegetation types from 20 localities along the Western Ghats, below 1200 m. Human ini1uence appears to result in loss of biomass, reduction in species diversity and loss of rare species. Particularly, it enhances spatial heterogeneity in structure and species composition. Human influence also seems to favour more distinctive set of species.
Keywords: Biomass, species diversity, tropical forests, disturbance, plantations, rarity.
1. Introduction
Inventorying and monitoring of the biological diversity is a prerequisite to its sustainable use and conservation. This is an important challenge in mountain areas like the Western Ghats, which is identified as one of the 18 global hot spots of biodiversity .1 A hot spot is characterised with high species diversity, high endemicity as well as alarming rate of its destruction. Western Ghats harbour some 5000 species of flowering plants2 of which nearly 800 are trees. 3 The com-
·-#Author for correspondence !. Bhuvanendra College, Karkala 574104; 2. RANWA, C-26/l, Ketan Heights, Kothrud, Pune 411 029; 3. M. M. College, Sirsi 581402; 4. Poomaprajna College, Udupi 576101; 5. Sringeri Nature and Adventure Club, Sringeti 577139; 6. J.C.B.M. College, Sringeri 577139; 7. A. V. Baliga College, Kumta 581343; 8. Scott Christian College, Nagercoil 624601; 9. Nehru Mem01ial College, Sullia 574239; 10. M.G.M. College, Udupi 576102; 11. American College, Madurai 625018; 12. J.S.S. College, Chamrajnagar 571313; 13. Jai Hind College, Dhule 424002; 14. Mahatma Gandhi College, Trivandrum 695004; 15. Govt. Victoria College, Palghat 678001; 16. Govt. Arts and Science College, Calicut 678018; 17. P.V.P. College, Loni 413713; 18. M.V. Govt. Science College, Bhadrawati 577301; 19. Jawaharlal Nehm Centre for Advanced Scientific Research, Bangalore, 560054; 20. Kongunadu College, Coimbatore 641029; and 21. Integrated Rural Technology Centre, Mundur 678592.
554 K. P. A CHAR et al.
plex mosaics of habitats here created through a variety of human interventions give rise to very intricate patterns of distribution of organisms. With a view to understand these intricate patterns, the Indian Institute of Sciences (IISc) has been coordinating a research network since 1994. Comprising 20 colleges, this network is termed as Western Ghats Biodiversity Network (WGBN). 1 Each college team comprises a couple of biology teachers and a few of their students. Each team has been inventorying and monitoring biodiversity from a nearby village landscape measuring approximately 25 sq km. HSc provides technical and financial
support.
As most of the Western Ghats are tree clad, an understanding of the distribution of tree species and their assemblages is fundamental to elucidating the larger patterns of distribution of biodiversity. These distributions are govemed by factors such as rainfall, slope, aspect and soils; by biotic interactions such as grazing by herbivores, besides a variety of human interventions like biomass harvests, fire and planting of economic species. The resultant distributions of the tree species have been classically described in terms of the assemblages assigned to a few classes termed as vegetation types.4 We do have qualitative information like lists of species characteristic of different classes.4
' 5 However, there have been inadequate systematic and
. . . . . I quantltatlve mvest1gatwns.
Champion and Seth5 provided the first comprehensive vegetation classification framework based on structure and phenology. However, they dealt with only the forest and scrub vegetation, leaving aside the more human-influenced vegetation types like orchards. Further. they assigned some of the vegetation types of higher elevation to subtropical and temperate climatic zone, a view which is no longer widely held.4 French Institute, in particular Pascal,4 has carefully identified various human-impacted categories of natural vegetation, and we use some of them. However, within each structural category he proposed several geographically separated series of plant communities, identified on the basis of dominant species of the potential climax. We have not adopted such a fine classification as the species composition changes continuously even in adjacent localities within a given structural type. Potential climax forests are restricted to a very small area. Thus, it is best to design a practicable system to classify the vegetation that actually and commonly exists, as permitted by human inf1uence. Utkarsh et a/. 6 reviewed these earlier systems and proposed another one, based on structure and phenology. They also provided equivalence between types proposed under various systems, including the UNESCO system followed worldwide. Their typology resembles that of Champion and Scth5
for the forest types, but avoids redundant geographical qualifiers like 'west coast'. Scrub/ savanna type of vegetation is adapted from Pascal.4 We employ this typology with the addition of man-made vegetation types.
In this investigation, we attempt to explore the patterns of distribution of diversity of tree species along the increasing gradient of human impact, as defined by the various types of natural and man-made vegetation. We also reflect on the implications of these distribution patterns on the conservation potential of these vegetation types.
2. Materials and methods
Western Ghats is a hill chain 1600 km in length running parallel to the West Coast of the Indian peninsula, with a width between 5 and 150 km and elevations rising up to 2800 m.'1 The
TREES OF WESTERN GHATS 555
higher elevations support a few exclusive vegetation types such as stunted evergreen forests locally called as 'sholas' .3 However, most of these are extensively distributed at lower elevations. Our sample consists of 247 transects, each confined to a relatively homogeneous patch of a single vegetation type, from 20 localities at elevations ranging from sea level to 1200 m. For our purpose, we distinguish 8 vegetation types on the basis of structure, i.e. physiognomic and phenological attributes .of the trees. The typology we propose is modified after Utkarsh et al} roughly in the increasing order of human influence. The order of natural vegetation types, such as various forest types and scrub/savanna, also reflects increasing microclimatic aridity. 4 But the moisture levels in the planted vegetation types vary a lot. These may often exceed the moisture levels amongst drier natural vegetation like deciduous forests and scrub/ savanna.
a) Evergreen forests comprise 25-30 m tall trees, with erect, closed, dense canopy covering nearly 80-90% of the ground. Trees belonging to evergreen species constitute 80% or more trees having thick, dark or blackish green and shining leaves. Many trees have smooth bark. Trees with large buttresses are common. Lianas, i.e. woody climbers are not uncommon. Undergrowth is almost devoid of herb species. Thorny species are few and mainly include canes (Calamus spp.) and screwpine (Pandanus spp.), which are represented by many individuals. Human impact may include cane harvest and in the past, limited selective felling of a few large trees of timber/ plywood species.4
b) Semi-evergreen forests have a mixture of evergreen and deciduous trees, 15-20 m in height, and closed (60-80% cover), dense canopy. Between 40% and 80% trees are evergreen. Unlike the evergreen forests, many trees have crooked boles and irregular canopy. Herbaceous species are not uncommon on the forest floor and climbers grow in profusion. Lianas are common. Canes are uncommon and screwpine are rare. Human impact here currently includes lopping of leafy branches as fmm manure, occasional tree felling for local demand and rarely fires. It is likely that many of the present-day semievergreen forests could be the result of heavy commercial tree felling in the past.4 This view stems from the fact that deciduous species currently comprising the canopy rarely regenerate under such dense canopy. However, deciduous species do regenerate under canopy gaps and more commonly under the light shade in the deciduous forests. Evergreen species however regenerate well under their own shade as well as that of the deciduous species. Thus, with protection from human influence, canopy gaps reduce over decades, increasing the shade. This helps evergreen species to gradually wipe out the deciduous species, in the process of ecological succession.4
c) Moist deciduous forests have moderately tall trees, 10-20 rn in height and closed but not very dense canopy (40-70%). Up to 40% trees are evergreen. The deciduous species tend to shed their leaves early, around January. Trees have rough bark; and mostly thin, pale green leaves. Buttressed stems are rare. Undergrowth contains many herbaceous species. Occasionally, there is extensive growth of weeds like Lantana (L. camara) or Eupatorium (E. odoratum). Lianas are very few, but herbaceous climbers are common. Thorny species are not uncommon but canes and screwpine are absent. Human harvest currently includes lopping of branches and occasional forest fires. Past impacts include heavy commercial tree felling especially of timber species like teak (Tectona grandis).4
556 K. P. ACHAR et al.
d) Drv deciduous forests consist of 10-15 m tall trees with a rather open (40-60%) canopy. Ev~r(J"reen and buttressed trees are absent. Lianas are rare. Thorny species are common, but cane; and screwpine are absent. Herbaceous and grassy undergrowth is plentiful and often
includes weeds.
e) Scrub/Savanna are nonforest formations having shrubby (scrub) or grassy (savanna) undergrowth with a scattered tree canopy (0-40%). Trees are 5 to 15m high. Proportion of evergreen trees varies from place to place, depending upon the climate and successional status. However, deciduous trees are generally more common. Lianas are absent. Thorny species and herbs, including weeds, are common. Human influence includes heavy lopping and grazing, besides frequent fires. Many of these patches were also subjected to clcarfelling of trees in the past for commercial reasons.
4
f) Forestry plantations: These comprise plantations primarily on forest land and even some social forestry plantations. The forestry plantations are made up of evergreen trees like white dammar (Ailanthus triphysa), mahogany (Switenia mahogany), or deciduous trees like teak (Tectona grandis). A given patch usually comprises a single species but there may be regeneration of natural trees, varying in degree and composition from place to place. Canopy cover in plantations surveyed was high ranging from 60 to 95%. Tree heights were uniform within and vruiable across plantations. Human harvests are ctmently confined to limited lopping. Many of these plantations were raised by felling the earlier forests. This explains considerable regeneration amidst the plantations from the rootstocks of natural species. There is occasionally profuse regeneration from seeds arising from neighbouring natural forests. Such natural regeneration is assisted by protection against fire and grazing.
g) Orchards: These are also monoculture plantations but primarily raised on private lands and much more intensively managed. Thus, vegetation of natural trees is seldom allowed in the orchards. The orchards we surveyed consisted of evergreen trees with a shady canopy such as ru·ecanut (Areca catechue), coconut (Cocos nucifera) or semi-evergreen canopy like rubber (Hevea brasilensis). Human harvest includes fmits or seeds as in the case of arecanut and coconut, while bark latex secretion as with rubber. Orchards differ from forestry plantations as the former are intensively kept free of any natural regeneration.
h) Home gardens: These harbour a heterogeneous vegetation structure in terms of canopy cover (40-90%), evergreenness (40-80%) and tree heights. Human influence is confined to maintenance of planted trees and rarely, harvests of flowers or fmits. Natural regeneration is discouraged as in the orchards unlike forestry plantations.
We aimed at sampling trees with GBH, i.e. girth at breast height (130 em above ground) of 30 em or more within 12 quadrats measuring 10 x 10m each. These quadrats were distributed alternatively on either side of a 560 m-long transect line, with an interquadrat distance of 40 m. Thus, each transect sampled 1200 sq m, i.e. 0.12 ha. The total area sampled is 27 ha. The number of trees sampled per transect ranged from 30 to 247 (mean 70, SD 36). The field sampling was conducted by the college teams with the guidance of experts from liSe and local villagers. The 17,220 trees so enumerated were assigned to 424 species belonging to 221 genera and 74 families. The field identification was primarily based on vegetative characters.7 There is a possibility that a few of the morphospecies may each correspond to some localised species that are difficult to discriminate on the basis of vegetative characters alone. Unfortunately, their flow-
TREES OF WESTERN GHATS 557
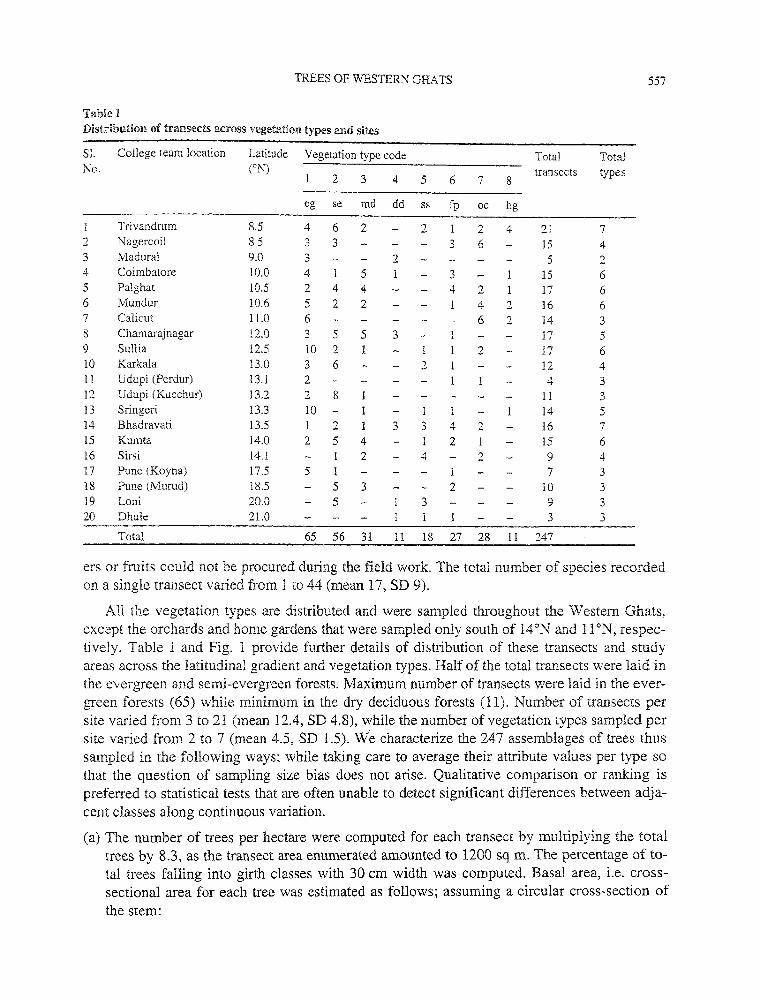
Tabie I Distribution of transects across vegetation types and sites
Sl. College team location Latit:;.de Vegetation type code Total Total No. (oN) transects types
2 3 4 5 6 7 8
eg se md dd ss fp oc hg
Trivandrum 8.5 4 6 2 2 2 4 21 7 2 Nagercoil 8.5 3 3 3 6 15 4 3 Madurai 9.0 3 2 5 2 4 Coimbatore 10.0 4 5 3 15 6 5 Pal ghat 10.5 2 4 4 4 2 17 6 6 Mundur 10.6 5 2 2 4 2 16 6 7 Calicut ll.O 6 6 2 14 3 8 Chamarajnagar !2.0 3 5 5 3 17 5 9 Sullia 12.5 10 2 2 17 6 10 Karkala 13.0 3 6 2 12 4 11 Udupi (Perdur) 13.1 2 4 3 12 Udupi (Kucchur) 13.2 2 8 11 3 13 Sringeri 13.3 10 1 14 5 14 Bhadravati 13.5 1 2 3 3 4 2 16 7 15 Kumta 14.0 2 5 4 2 1 15 6 16 Sirsi 14.1 2 4 2 9 4 17 Pune (Koyna) 17.5 5 1 7 3 18 Pune (Murud) 18.5 5 3 2 10 3 19 Loni 20.0 5 3 9 3 20 Dhule 21.0 3 3
Total 65 56 31 11 18 27 28 11 247
ers or fruits could not be procured during the field work. The total number of species recorded on a single transect varied from 1 to 44 (mean 17, SD 9).
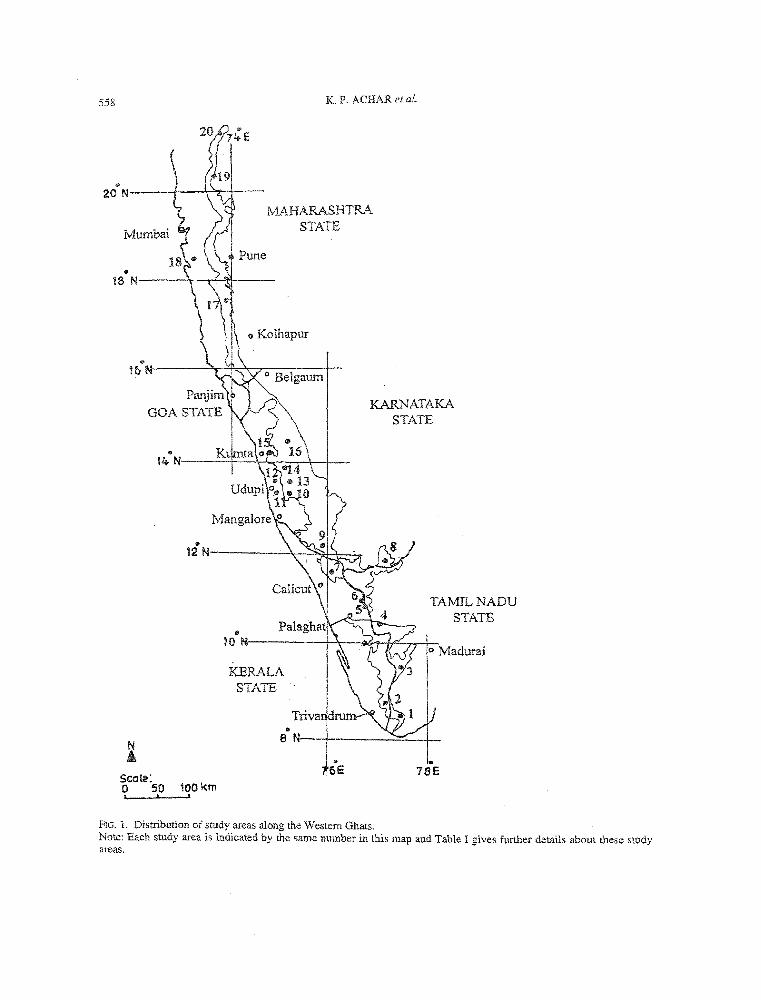
All the vegetation types are distributed and were sampled throughout the Western Ghats, except the orchards and home gardens that were sampled only south of l4°N and 11 °N, respectively. Table I and Fig. 1 provide further details of distribution of these transects and study areas across the latitudinal gradient and vegetation types. Half of the total transects were laid in the evergreen and semi-evergreen forests. Maximum number of transects were laid in the evergreen forests (65) while minimum in the dry deciduous forests (11). Number of transects per site varied from 3 to 21 (mean 12.4, SD 4.8), while the number of vegetation types sampled per site varied from 2 to 7 (mean 4.5, SD 1.5). We characterize the 247 assemblages of trees thus sampled in the following ways; while taking care to average their attribute values per type so that the question of sampling size bias does not arise. Qualitative comparison or ranking is preferred to statistical tests that are often unable to detect significant differences between adjacent classes along continuous variation.
(a) The number of trees per hectare were computed for each transect by multiplying the total trees by 8.3, as the transect area enumerated amounted to 1200 sq m. The percentage of to-:tal trees falling into girth classes with 30 em width was computed. Basal area, i.e. crosssectional area for each tree was estimated as follows; assuming a circular cross-section of the stem:
558
Mumbai
Scote; 0 50 100km
K. P. ACHAR etal.
M.f\.HARASHTRA STATE
o Kolhapur
KERALA STATE
..
KARNATAKA STATE
TAMJLNADU STATE
8 NI--t----=--+-
., 78E
FIG. 1. Distribution of study areas along the Western Ghats. Note: Each study area is indicated by the same number in this map and Table I gives further details about these study areas.
TREES OF WESTERN GHATS
2
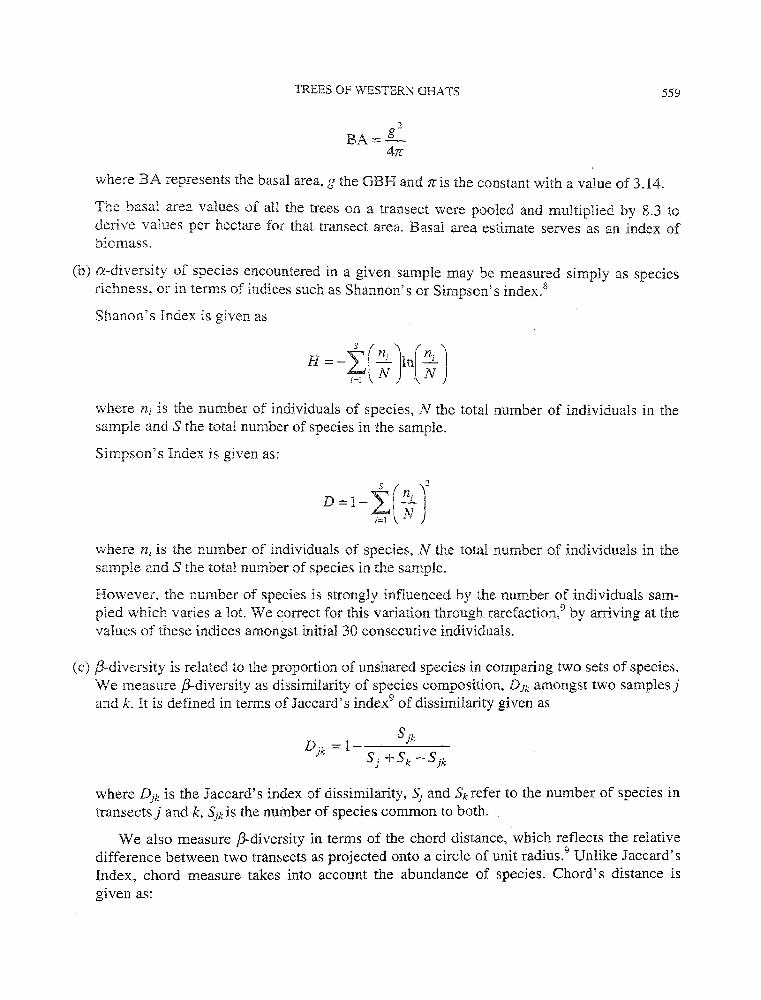
BA=L 4rr
559
where BA represents the basal area, g the GBH and ;ris the constant with a value of 3.14.
The basal area values of all the trees on a transect were pooled and multiplied by 8.3 to derive values per hectare for that transect area. Basal area estimate serves as an index of biomass.
(b) a-diversity of species encountered in a given sample may be measured simply as species richness, or in terms of indices such as Shannon's or Simpson's index.8
Shanon's Index is given as
where n; is the number of individuals of species, N the total number of individuals in the sample and S the total number of species in the sample.
Simpson's Index is given as:
D = 1- f.(!!.L)2
i=r N
where n; is the number of individuals of species, N the total number of individuals in the sample and S the total number of species in the sample.
However, the number of species is strongly influenced by the number of individuals sampled which varies a lot. We correct for this variation through rarefaction,9 by arriving at the values of these indices amongst initial 30 consecutive individuals.
(c) /3-diversity is related to the proportion of unshared species in comparing two sets of species. We measure /3-diversity as dissimilarity of species composition, D1k amongst two samplesj and k. It is defined in terms of Jaccard's index9 of dissimilarity given as
where D1k is the Jaccard's index of dissimilarity, S1 and Skrefer to the number of species in transects j and k, s1k is the number of species common to both.
We also measure f:J-diversity in terms of the chord distance, which reflects the relative difference between two transects as projected onto a circle of unit radius.9 Unlike Jaccard's Index, chord measure takes into account the abundance of species. Chord's distance is given as:
560 K. P. A CHAR et al.
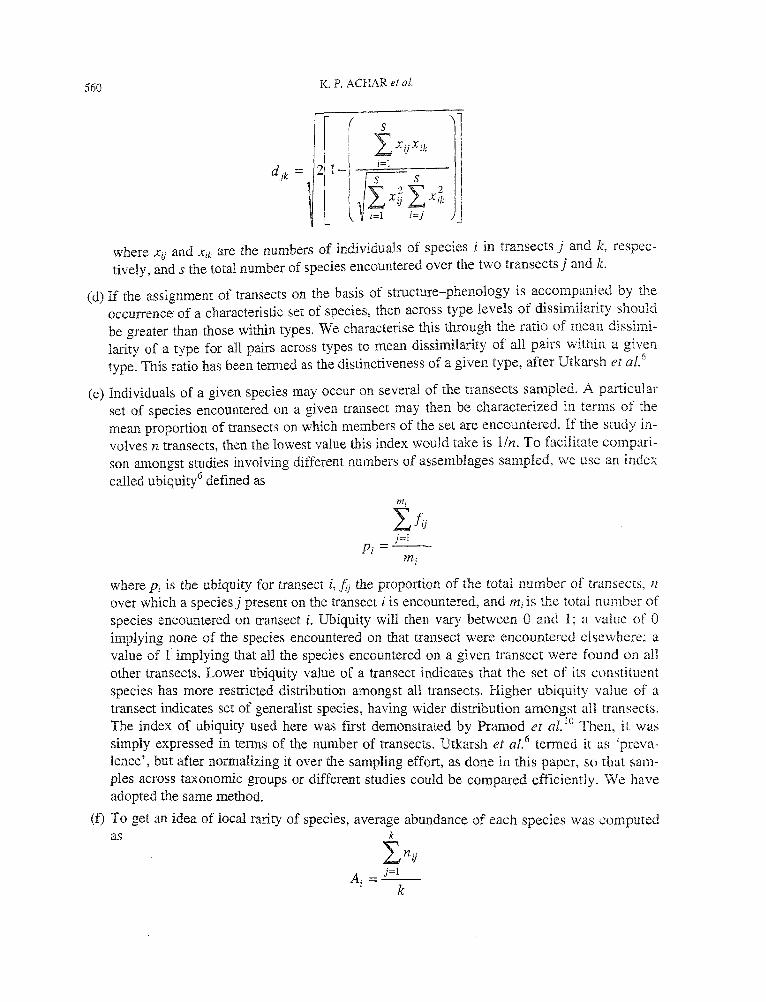
djk = 2 1-
where xu and x;k are the numbers of individuals of species i in transects j and k, respectively, and s the total number of species encountered over the two transects j and k.
(d) If the assignment of transects on the basis of structure-phenology is accompanied by the occurrence of a characteristic set of species, then across type levels of dissimilarity should be greater than those within types. We characterise this through the ratio of mean dissimilarity of a type for all pairs across types to mean dissimilarity of all pairs within a given type. This ratio has been tem1ed as the distinctiveness of a given type, after Utkarsh et al.
6
(e) Individuals of a given species may occur on several of the transects sampled. A particular set of species encountered on a given transect may then be characterized in terms of the mean proportion of transects on which members of the set are encountered. If the study involves n transects, then the lowest value this index would take is 1/n. To facilitate comparison amongst studies involving different numbers of assemblages sampled, we use an index
called ubiquity6 defined as
where p; is the ubiquity for transect i, fij the proportion of the total number of transects, n over which a species j present on the transect i is encountered, and m; is the total number of species encountered on transect i. Ubiquity will then vary between 0 and 1; a value of 0 implying none of the species encountered on that transect were encountered elsewhere; a value of 1 implying that all the species encountered on a given transect were found on all other transects. Lower ubiquity value of a transect indicates that the set of its constituent species has more restricted distribution amongst all transects. Higher ubiquity value of a transect indicates set of generalist species, having wider distribution amongst all transects. The index of ubiquity used here was first demonstrated by Pramod et al. 10 Then, it was simply expressed in terrns of the number of transects. Utkarsh et al.6 termed it as 'prevalence', but after normalizing it over the sampling effort, as done in this paper, so that samples across taxonomic groups or different studies could be compared efficiently. We have adopted the same method.
(f) To get an idea of local rarity of species, average abundance of each species was computed as k
Lnii A.== .l2__
I k
TREES OF WESTERN GHATS 561
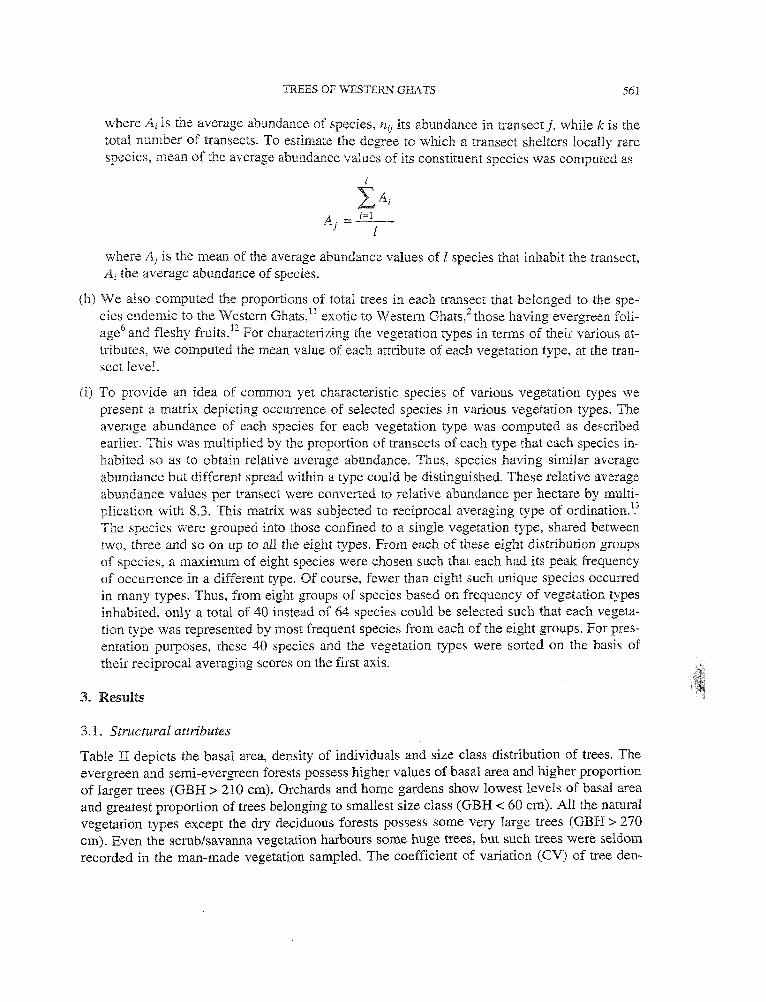
where A; is the average abundance of species, nij its abundance in transect j, while k is the total number of transects. To estimate the degree to which a transect shelters locally rare species, mean of the average abundance values of its constituent species was computed as
l
LA; A-= .i=l._
J l
where Aj is the mean of the average abundance values of l species that inhabit the transect, A; the average abundance of species.
(h) We also computed the proportions of total trees in each transect that belonged to the species endemic to the Western Ghats, 11 exotic to Western Ghats,2 those having evergreen foliage6 and fleshy fruits. 12 For characterizing the vegetation types in terms of their various attributes, we computed the mean value of each attribute of each vegetation type, at the transect leveL
(i) To provide an idea of common yet characteristic species of various vegetation types we present a matrix depicting occurrence of selected species in various vegetation types. The average abundance of each species for each vegetation type was computed as described earlier. This was multiplied by the proportion of transects of each type that each species inhabited so as to obtain relative average abundance. Thus, species having similar average abundance but different spread within a type could be distinguished. These relative average abundance values per transect were converted to relative abundance per hectare by multiplication with 8.3. This matrix was subjected to reciprocal averaging type of ordination. 1
•3
The species were grouped into those confined to a single vegetation type, shared between two, three and so on up to all the eight types. From each of these eight distribution groups of species, a maximum of eight species were chosen such that each had its peak frequency of occurrence in a different type. Of course, fewer than eight such unique species occurred in many types. Thus, from eight groups of species based on frequency of vegetation types inhabited, only a total of 40 instead of 64 species could be selected such that each vegetation type was represented by most frequent species from each of the eight groups. For presentation purposes, these 40 species and the vegetation types were sorted on the basis of their reciprocal averaging scores on the first axis.
3. Results
3 .I. Structural attributes
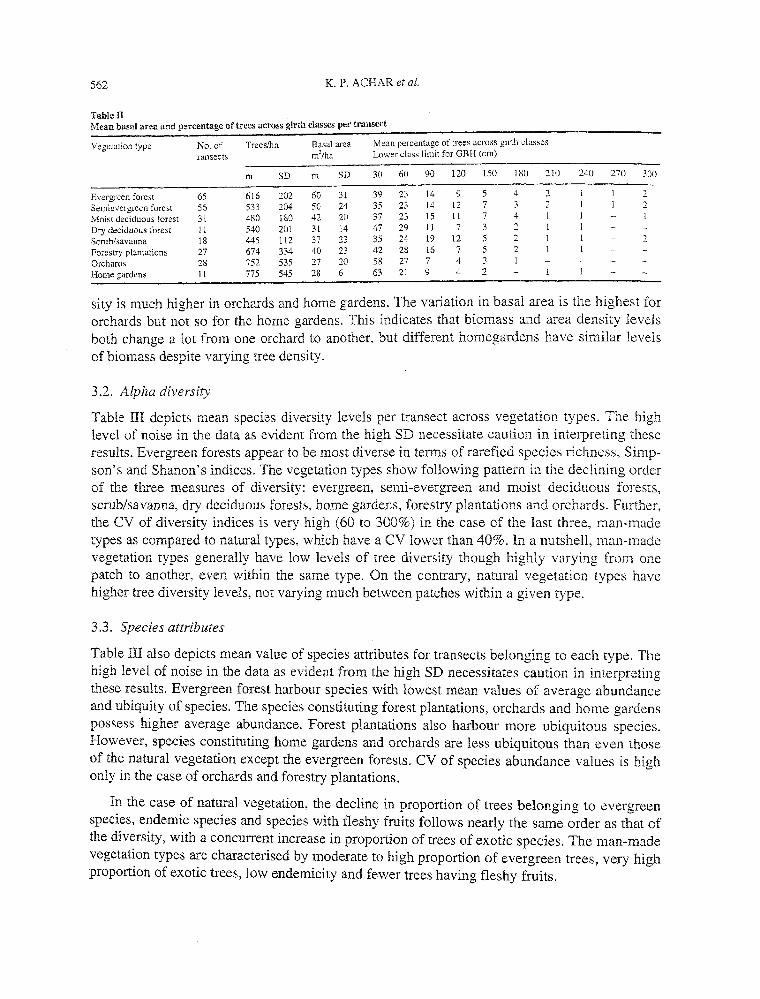
Table II depicts the basal area, density of individuals and size class distribution of trees. The evergreen and semi-evergreen forests possess higher values of basal area and higher proportion of larger trees (GBH > 210 em). Orchards and home gardens show lowest levels of basal area and greatest proportion of trees belonging to smallest size class (GBH < 60 em). All the natural vegetation types except the dry deciduous forests possess some very large trees (GBH > 270 em). Even the scrub/savanna vegetation harbours some huge trees, but such trees were seldom recorded in the man-made vegetation sampled. The coefficient of variation (CV) of tree den-
562 K. P. ACHAR et al.
Table ll Mean basal area and percentage of trees acrClss girth classes per transect
Vegetation type No. of Treeslha Basal area Mean percentage of trees across girth classes
ransects m2/ha Lower class limit for GBH (em)
m SD m SD 30 60 90 \20 150 180 210 240 270 300
Evergreen forest 65 616 202 60 31 39 23 14 9 5 4 2 2
Sernievergreen forest 56 533 204 50 24 35 23 14 12 7 3 2 2 Moist deciduous forest 31 480 180 42 20 37 23 15 11 7 4
Dry deciduous forest 11 540 201 31 14 47 29 11 7 3 2
Scrub/savunna 18 445 112 37 23 35 24 19 i2 5 2 2
Forestry plantations 27 674 334 40 23 42 28 16 7 5 2
Orchards 28 752 535 27 20 58 27 7 4 3 Home gardens ll 775 545 28 6 63 21 9 4 2
sity is much higher in orchards and home gardens. The variation in basal area is the highest for orchards but not so for the home gardens. This indicates that biomass and area density levels both change a lot from one orchard to another, but different homegardens have similar levels of biomass despite varying tree density.
3.2. Alpha diversity
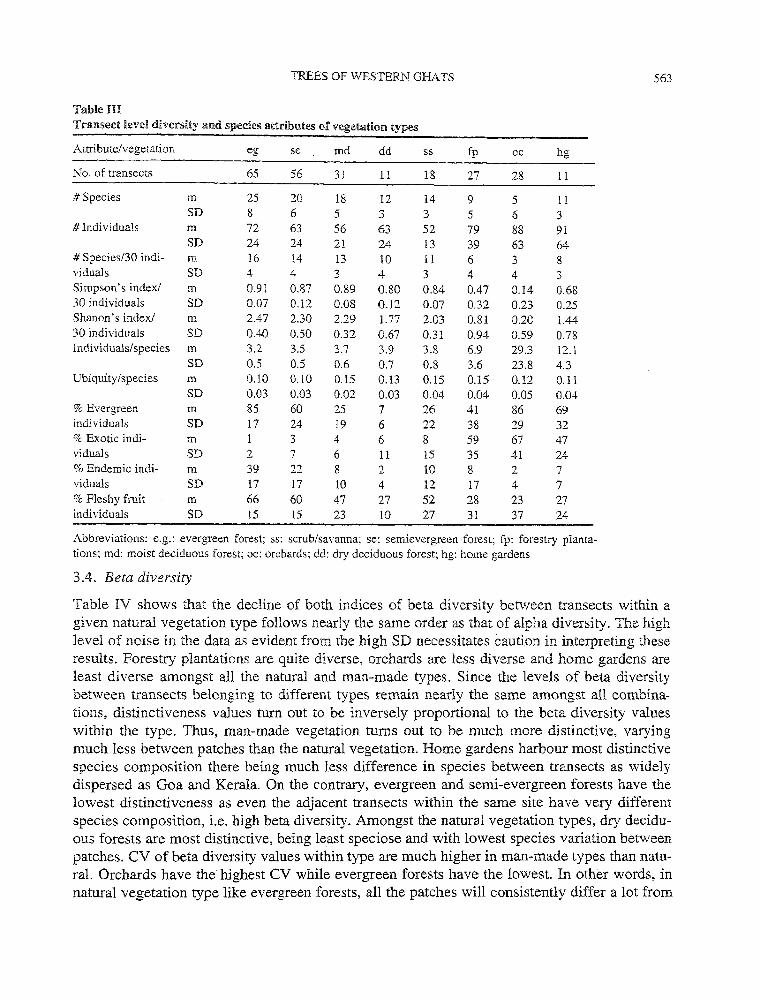
Table III depicts mean species diversity levels per transect across vegetation types. The high level of noise in the data as evident from the high SD necessitate caution in interpreting these results. Evergreen forests appear to be most diverse in terms of rarefied species richness, Simpson's and Shanon's indices. The vegetation types show following pattern in the declining order of the three measures of diversity: evergreen, semi-evergreen and moist deciduous forests, scrub/savanna, dry deciduous forests, home gardens, forestry plantations and orchards. Further, the CV of diversity indices is very high (60 to 300%) in the case of the last three, man-made types as compared to natural types, which have a CV lower than 40%. In a nutshell, man-made vegetation types generally have low levels of tree diversity though highly varying from one patch to another, even within the same type. On the contrary, natural vegetation types have higher tree diversity levels, not varying much between patches within a given type.
3.3. Species attributes
Table III also depicts mean value of species attributes for transects belonging to each type. The high level of noise in the data as evident from the high SD necessitates caution in interpreting these results. Evergreen forest harbour species with lowest mean values of average abundance and ubiquity of species. The species constituting forest plantations, orchards and home gardens possess higher average abundance. Forest plantations also harbour more ubiquitous species. However, species constituting home gardens and orchards are less ubiquitous than even those of the natural vegetation except the evergreen forests. CV of species abundance values is high only in the case of orchards and forestry plantations.
In the case of natural vegetation, the decline in proportion of trees belonging to evergreen species, endemic species and species with fleshy fruits follows nearly the same order as that of the diversity, with a concurrent increase in proportion of trees of exotic species. The man-made vegetation types are characterised by moderate to high proportion of evergreen trees, very high proportion of exotic trees, low endemicity and fewer trees having fleshy fruits.
TREES OF WESTERN GHATS 563
Table UI Transect level di.versi.ty and species attributes of vegetation types
Attribute/vegetation eg se md dd ss fp oc hg
No. of transects 65 56 3! 11 18 27 28 11
#Species m 25 20 18 12 14 9 5 11 SD 8 6 5 3 3 5 6 3
#Individuals m 72 63 56 63 52 79 88 91 SD 24 24 21 24 13 39 63 64
# Species/30 indi- m 16 14 13 10 11 6 3 8 vi duals SD 4 4 3 4 3 4 4 3 Simpson's index/ m 0.91 0.87 0.89 0.80 0.84 0.47 0.14 0.68 30 individuals SD 0.07 0.12 0.08 0.12 0.07 0.32 0.23 0.25 Shanon's index/ m 2.47 2.30 2.29 1.77 2.03 0.81 0.20 1.44 30 individuals SD 0.40 0.50 0.32 0.67 0.31 0.94 0.59 0.78 Individuals/species m 3.2 3.5 3.7 3.9 3.8 6.9 29.3 12.1
SD 0.5 0.5 0.6 0.7 0.8 3.6 23.8 4.3 Ubiquity /species m 0.10 0.10 0.15 0.13 0.15 0.15 0.12 0.11
SD 0.03 0.03 0.02 0.03 0.04 0.04 0.05 0.04 %Evergreen m 85 60 25 7 26 41 86 69 individuals SD 17 24 19 6 22 38 29 32 % Exotic indi- m 1 3 4 6 8 59 67 47 vi duals SD 2 7 6 11 15 35 41 24 %Endemic indi- m 39 22 8 2 10 8 2 7 vi duals SD 17 17 10 4 12 17 4 7 % Fleshy fruit m 66 60 47 27 52 28 23 27 individuals SD 15 15 23 lO 27 31 37 24
Abbreviations: e.g.: evergreen forest; ss: scrub/savanna; se: semievergreen forest; fp: forestry planta-tions; md: moist deciduous forest; oc: orchards; dd: dry deciduous forest; hg: home gardens
3.4. Beta diversity
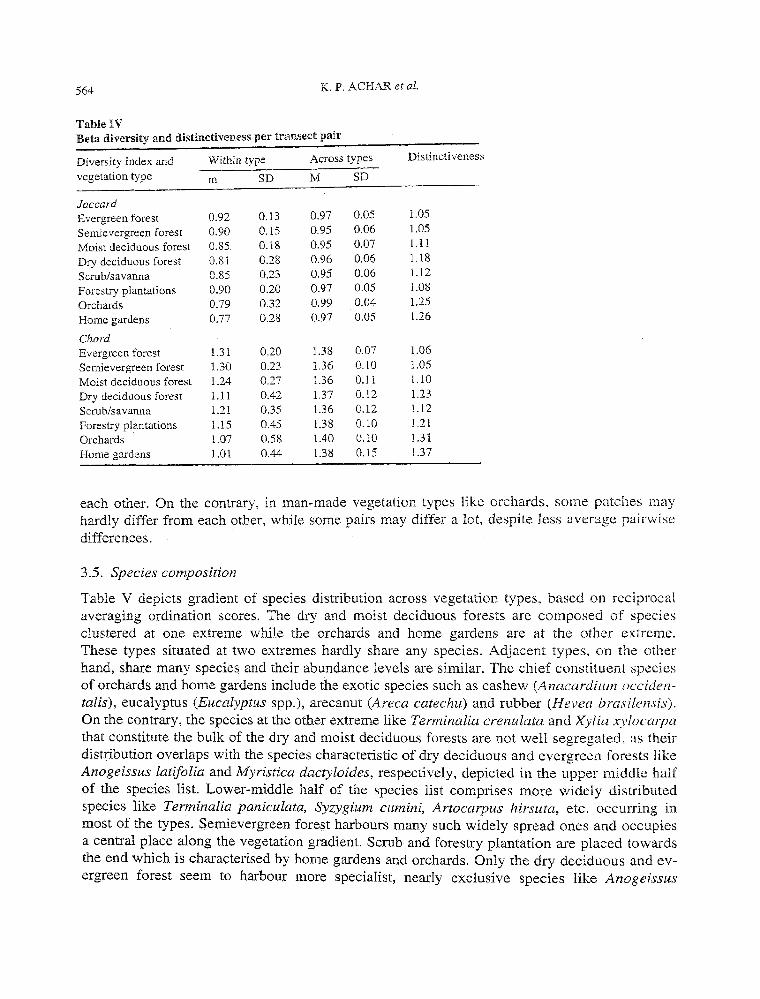
Table IV shows that the decline of both indices of beta diversity between transects within a given natural vegetation type follows nearly the same order as that of alpha diversity. The high level of noise in the data as evident from the high SD necessitates caution in interpreting these results. Forestry plantations are quite diverse, orchards are less diverse and home gardens are least diverse amongst all the natural and man-made types. Since the levels of beta diversity between transects belonging to different types remain nearly the same amongst all combinations, distinctiveness values tum out to be inversely proportional to the beta diversity values within the type. Thus, man-made vegetation turns out to be much more distinctive, varying much less between patches than the natural vegetation. Home gardens harbour most distinctive species composition there being much less difference in species between transects as widely dispersed as Goa and Kerala. On the contrary, evergreen and semi-evergreen forests have the lowest distinctiveness as even the adjacent transects within the same site have very different species composition, i.e. high beta diversity. Amongst the natural vegetation types, dry deciduous forests are most distinctive, being least speciose and with lowest species variation between patches. CV of beta diversity values within type are much higher in man-made types than natural. Orchards have the highest CV while evergreen forests have the lowest. In other words, in natural vegetation type like evergreen forests, all the patches will consistently differ a lot from
564 K. P. A CHAR et al.
Table IV Beta diversity and distinctiveness per transect pair
Diversity index and Within type Across types Distinctiveness
vegetation type m SD M SD
Jaccard Evergreen forest 0.92 0.13 0.97 0.05 1.05
Semievergreen forest 0.90 0.15 0.95 0.06 1.05
Moist deciduous forest 0.85 0.18 0.95 om 1.11
Dry deciduous forest 0.81 0.28 0.96 0.06 1.18
Scrub/savanna 0.85 0.23 0.95 0.06 1.12
Forestry plantations 0.90 0.20 0.97 0.05 1.08
Orchards 0.79 0.32 0.99 0.04 1.25
Home gardens 0.77 0.28 0.97 0.05 1.26
Chord Evergreen forest 1.31 0.20 1.38 0.07 1.06
Semievergreen forest 1.30 0.23 1.36 0.10 1.05
Moist deciduous forest 1.24 0.27 1.36 0.11 l.JO
Dry deciduous forest 1.11 0.42 1.37 0.12 1.23
Scrub/savanna 1.21 0.35 1.36 0.12 1.12
Forestry plantations 1.15 0.45 1.38 0.10 1.21
Orchards 1.07 0.58 1.40 0.10 1.31
Home gardens 1.01 0.44 1.38 0.15 1.37
each other. On the contrary, in man-made vegetation types like orchards, some patches may hardly differ from each other, while some pairs may differ a lot, despite less average pairwise differences.
3.5. Species composition
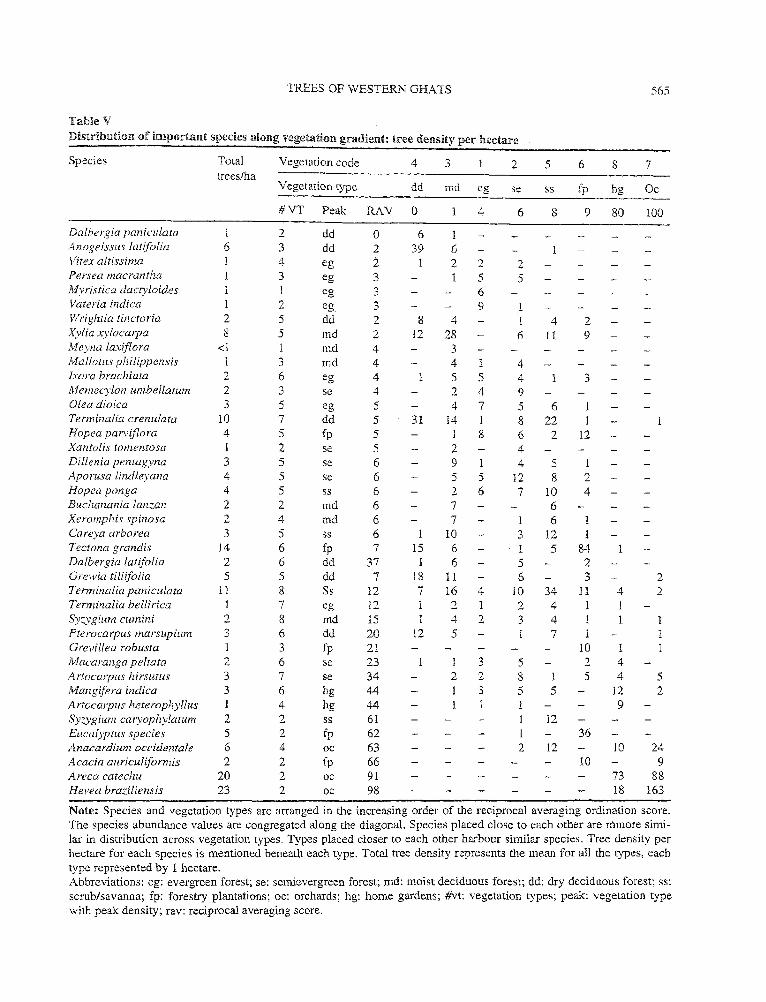
Table V depicts gradient of species distribution across vegetation types, based on reciprocal averaging ordination scores. The dry and moist deciduous forests are composed of species clustered at one extreme while the orchards and home gardens are at the other extreme. These types situated at two extremes hardly share any species. Adjacent types, on the other hand, share many species and their abundance levels are similar. The chief constituent species of orchards and home gardens include the exotic species such as cashew (Anacardiwn occidenc talis), eucalyptus (Eucalyptus spp.), arecanut (Areca catechu) and rubber (Hevea brasilensis). On the contrary, the species at the other extreme like Terminalia crenulata and Xylia .t-y!ocarpa that constitute the bulk of the dry and moist deciduous forests are not well segregated, as their distribution overlaps with the species characteristic of dry deciduous and evergreen forests like Anogeissus latifolia and Myristica dactyloides, respectively, depicted in the upper middle half of the species list. Lower-middle half of the species list comprises more widely distributed species like Terminalia paniculata, Syzygium cumini, Artocarpus hirsuta, etc. occutTing in most of the types. Semievergreen forest harbours many such widely spread ones and occupies a central place along the vegetation gradient. Scrub and forestry plantation are placed towards the end which is characterised by home gardens and orchards. Only the dry deciduous and evergreen forest seem to harbour more specialist, nearly exclusive species like Anogeissus
TREES OF WESTERN GHATS 565
Table V
Distribution of important species along vegetation gradient: tree density per hectare
Species Total Vegetation code 4 3 2 5 6 8 7 trees/ha
Vegetation type dd md eo-"'
se ss fp hg Oc
#VT Peak RAY 0 1 4 6 8 9 80 100
Dalbergia paniculata l 2 dd 0 6 1 Anogeissus latjfolia 6 3 dd 2 39 6 Vitex altissima 4 eg 2 2 2 2 Persea macrantha 3 eg 3 5 5 Myristica dacty/oides eg 3 6 Vateria indica 2 eg 3 9 1 Wrightia tinctoria 2 5 dd 2 8 4 1 4 2 Xylia xylocarpa 8 5 md 2 12 28 6 ll 9 Meyna laxiflora <1 md 4 3 Mal lotus philippensis 1 3 md 4 4 1 4 lxora brachiata 2 6 eg 4 1 5 5 4 3 Memecylon umbellatum 2 3 se 4 2 4 9 Olea dioica 3 5 eg 5 4 7 5 6 Terminalia crenulata 10 7 dd 5 31 !4 1 8 22 Hopea parviflora 4 5 fp 5 8 6 2 12 Xantolis tomentosa 1 2 se 5 2 4 Dil!enia pentag_yna 3 5 se 6 9 1 4 5 1 Aporusa lindleyana 4 5 se 6 5 5 12 8 2 Hopea ponga 4 5 ss 6 2 6 7 10 4 Buchanania lanzan 2 2 md 6 7 6 Xeromphis spinosa 2 4 md 6 7 6 1 Careya arborea 3 5 ss 6 1 10 3 12 I Tectona grandis 14 6 fp 7 15 6 1 5 84 Dalbergia latifolia 2 6 dd 37 1 6 5 2 Grewia tili(folia 5 5 dd 7 18 11 6 3 2 Tenninalia paniculata 11 8 Ss 12 7 16 4 10 34 11 4 2 Terminalia bellirica 1 7 eg 12 1 2 1 2 4 Syz.ygium cwnini 2 8 md 15 4 2 3 4 1 Pterocarpus marsupium 3 6 dd 20 12 5 7 1 1 Grevillea robusta 3 fp 21 10 1 Maca rang a pelrata 2 6 se 23 3 5 2 4 Artocarpus hirsutus 3 7 se 34 2 2 8 1 5 4 5 Mangifera indica 3 6 hg 44 3 5 5 12 2 Artocarpus heterophyllus 1 4 hg 44 1 9 Syzygium caryophylatum 2 2 ss 61 12 Eucalyptus species 5 2 fp 62 l 36 A.nacardium occidentale 6 4 oc 63 2 12 10 24 ,1cacia auriculifomJis 2 2 fp 66 10 9 Areca catechu 20 2 oc 91 73 88 Hevea braziliensis 23 2 oc 98 18 163
Note: Species and vegetation types are arranged in the increasing order of the reciprocal averaging ordination score. The species abundance values are congregated along the diagonal. Species placed close to each other are mmore simi-lar in distribution across vegetation types. Types placed closer to each other harbour similar species. Tree density per hectare for each species is mentioned beneath each type. Total tree density represents the mean for all the types, each type represented by 1 hectare. Abbreviations: eg: evergreen forest; se: semievergreen forest; md: moist deciduous forest; dd: dry deciduous forest; ss: scrub/savanna; fp: forestry plantations; oc: orchards; hg: home gardens; #vt: vegetation types; peale vegetation type with peak density; rav: reciprocal averaging score.
566 K. P. ACHAR et al.
latifolia and Myristica dactyloides, respectively. Dry deciduous forests, home gardens and orchards also harbour fewer of the total species depicted in the table.
4. Discussion
The decline in biomass with increasing human influence as well as climatic aridity, observed by us especially amidst natural vegetation, has also been reported earlier. For instance. Daniels et al. 18 estimate a loss of 45% of biomass over the last 4-5 decades due to human impact. The values of basal area and tree density depicted here are within the range of values reported earlier for natural vegetation types4
· 14--
16 and forestry plantations. 16'
17 The presence of a few large trees with high biomass is a remarkable feature of savanna vegetation, resulting in high biomass levels despite the lowest tree density amongst all types.
The diversity levels reported here for the natural types are within the reported range.4
· 14
' 15
However, in the case of evergreen forests, the average value of Shanon's and Simpson's indices reported here are slightly lower than the average values from the literature.4
' 14
The progressive decline in the tree species diversity along the aridity and disturbance gradient is known in the literature, though exceptions exist. For instance, Daniels et al. 18 did not detect any significant decline in alpha and beta diversity levels due to human impact on humid forests of Uttara Kannada in the central Western Ghats. On the contrary, Utkarsh et al. 6 reported higher levels of tree diversity in the semi-evergreen forests with moderate human impact, than in the evergreen forests having low levels of human impact though without any tests of statistical significance. Such an increase in the species diversity owing to moderate levels of disturbance is a more widely reported phenomenon, including the case of birds of the Western Ghats. 19
The lowest value of species ubiquity of the evergreen forest and higher values of the dry deciduous forest reported here contrast the results by Utkarsh et al. 6 However, they have hinted at the possible bias resulting from their inadequate sample size. We face similar constraints and have to treat these results with caution. Nevertheless, Utkarsh et al. 6 also mention that the evergreen forest type actually harboured least ubiquitous species as per the rarefaction method to correct for unequal sample size across transects. Since we have used the same procedure, it is not surprising that our results are similar. Daniels et al. 18
' 19 have also reported replacement of
narrow niched, specialist species by widespread, generalist species due to human intervention.
The evergreen forests harbour rarest species as seen from their low mean abundance, distribution across fewer transects and higher endemicity. Blasco3 also assigned higher endemicity to the evergreen forest, only slightly lower than the montane evergreen forests, i.e. shola. As we have not sampled shola forest, our results are consistent with the literature, Ramesh et al. 11
' 20 mention that 63% of the evergreen tree species of the Western Ghats are endemic.
However, the proportion of endemic species and their individuals among our samples is only around 40% in the evergreen forest transects. This may suggest that many of these endemic species could be too rare to be detected with the given sampling effort. Secondly, additional sampling efforts may be required in higher elevation zones to detect many more endemics. The declining proportion of endemic species and their individuals with the decline in the evergreen character of natural vegetation is reported by Chandran from Uttara Kannada. 14 Concurrent increase in the proportion of exotic species is intuitively obvious and qualitatively documented.2 Interestingly, a very high proportion of trees in the man-made landscape are ever-
TREES OF WESTERN GHATS 567
green, though exotic. This is facilitated by higher rainfall, spread over much longer period (6 to 8 months) than most parts of India (3 to 4 months).4
The synchrony between levels of alpha and beta diversity levels within vegetation types is apparent from studies by Utkarsh et al. ,6 who also indicate the inverse relationship of these diversity attributes with the distinctiveness of species composition. The significance of classification system becomes thus evident, as emphasised by Utkarsh et al} besides Nagendra and Gadgil.21
Ubiquitous nature of species constituting semi-evergreen forests, scrub/savanna and forest plantations is further reflected in the ordination analysis. These types result from substantial human impact on other natural vegetation types and are thus termed 'secondary'. These types comprise a large proportion of pioneering species, primarily inhabitants of the moist deciduous forests. The deciduous forests probably serve as the 'source' of the pioneer species while the secondary vegetation types form the 'sink'. Few naturally dispersed deciduous species like Terminalia paniculata and T. bellirica invade almost all the vegetation types. Conversely, a few of the species from evergreen forests also have pioneering nature and invade the deciduous forests, though at much lower densities, as evident from Tables III and V. These species include Aporosa lindleyana, Hopea ponga and Olea dioica, amongst others. Besides, some natural inhabitants of the evergreen forests such as the mango (Mangifera indica), jackfruit (Artocarpus heterophyllus) and jamun (Syzygium cumini) are widely cultivated and dispersed by humans.
Human intervention appears to generally result in the loss of up to nearly half the biomass, as evident from the differences in the basal area values of evergreen forests and orchards. The difference between extreme values could however be much more such as between a very dense evergreen forest and extremely denuded scrub. Notably, considerable levels of biomass are maintained even in the man-made landscape, as humidity in the Western Ghats area makes it suitable for tree crops.
The human influence seems to reduce both alpha and beta diversity. Further, the reduction of species diversity levels in human-influenced types renders them more distinctive in terms of species composition. Though characterised by a constant set of species, the diversity and biomass levels as well as species attributes in man-made types undergo much more spatial change than the more natural types. The higher CV due to human intervention in the natural vegetation is also evident in the case of diversity, biomass levels and species attributes of scrub/savanna. Human influence thus seems to increase spatial heterogeneity in structure and composition besides reduction in overall luxuriance of vegetation.
Adopting the conservation evaluation logic advocated by Pramod et al.,22 our study suggests that evergreen forests deserve highest conservation priority as these harbour highest levels of species diversity, highest proportion of rare and endemic species. Though Pramod et al. 22
assign highest conservation value to the montane evergreen forests, i.e. 'shola' on the basis of bird census, we have not sampled sholas at this stage.
Our study enables us to elucidate some community-level patterns at the scale of Western Ghats, unlike earlier studies that were more localised and often ignored man-made ecosystems. Some of the patterns reported here, especially in the case of natural vegetation, could partly
568 K. P. ACHAR et al.
result from the climatic aridity. Nevertheless, human intervention also appears to explain many patterns, as the vegetation typology does reflect a gradient of human impact. These studies must be complemented by detailed locality specific analysis of impact of disturbance to avoid any possible confusion with the climatic impact. Exploration of patterns ~cross various organismic groups could also prove interesting. For instance, Daniels et al. 19
'2
-' report higher levels of bird diversity in more disturbed areas, though lower proportion of specialist and fruit-eating birds. Incidentally, we report here decline in fruit resources with increasing human impact. No doubt, more specific studies on fruit species such as figs (Ficus spp.) which are preferred by birds are needed to velify these results. For a better understanding of human impact on various organismic groups, analysis of spatially correlated sites is also necessary. The data collected by the network regarding birds, butterflies, ants, mosses, aquatic insects, mollusca, amphibia, etc. would be useful in this context. 1 In fact, Kunte et al. 24 have pointed out the lack of coherence between patterns of distribution of diversity amongst butterflies, birds and trees.
The data generated through the network approach would permit us to explore many more relevant issues, such as of human impact on tree regeneration, sampling bias resulting from classification methods and the inter-observer variation, relationship between patterns detected at the level of species with that of the genus and family, appropriate sampling strategy for further monitoring of diversity. It will be our endeavour to undertake these investigations in the future.
Acknowledgement
We are grateful to all the members of the Western Ghats Biodiversity Network, involving some 300 students and over 30 local villagers, without whose assistance the data collection would have been impossible. We are also thankful to all college authorities for encouraging this initiative. We thank the Ministry of Environment and Forests as well as the Department of Biotechnology, Government of India, the local forest department officials and the PEW Foundation for their support. We are indebted to Prof. Madhav Gadgil for leading this initiative. Prof. N. V. Joshi obliged us by providing critical analytical inputs. Secretarial assistance from Ms R. Revathi and Mrs M. Sunitha is acknowledged.
References
1. GADGIL, M.
2. NAIR, N. C. AKD DANIELS, P.
3. BLASCO, F.
4. PASCAL, J.P.
5. CHAMPION, H. G. AND SETH, S. K.
6. UTKARSH, G., JOSHI, N. V. AND
GADGIL, M.
Documenting diversity: An experiment, Curr. Sci., 1996, 70, 36-44.
Floristic diversity of the Western Ghats, Proc. Indian Acad. Sci. (Anim. Sci./Plant Sci.) Suppl., 1986,95, 127-163.
Montagues du sud de I' Inde-Forests, savanes, eco/ogie, Institut Francais, Pondichery. 1971.
Wet evergreen forests of the Western Ghats of India, Institut Francais, Pondicherry, 1988.
A revised survey of forest types in India & Burma, Manager of Publications, Government of India, New Delhi, 1968.
On the patterns of tree diversity in the Western Ghats, India, Curr. Sci., 1998, 75, 594-603.
7. PASCAL, J.P. AND RAMESH, B. R.
8. MAGURRAK. A. E.
9. LUD'h1G, J. A. AND REYNOLDS, J. F.
10. PRAMOD, P., JoSHI, N.Y., GHATE, U. AND GADGIL, M.
11. RAMESH, B. R., PASCAL, J. P. AND NOUGUIER, C.
12. SOMASUNDARAM, T. R.
13. GAUCHE. H. G. JR,
14. CHANDRAN, M. D. S.
15. RAI, S. N. AND PROCTOR, J.
16. SWAMY, H. R.
17. CHANDRASHEKHARA, U. M.
18. DANIELS, R. 1. R., GADGIL, M. AND JOSHI, N. v.
19. DANIELS, R. J. R., HEGDE, M., JOSHI, N. V. AND GADGIL, M.
20. RAMESH, B. R., DE FRANCESCHI, D.
AND PASCAL, J.P.
21. NAGENDRA, H. AND GADGJL, M.
22. PRAMOD, P., DANIELS, R. J. R., JOSHI, N. V. AND GADGJL, M.
23. DANIELS, R. J. R., HEGDE, M., AND GADGIL, M.
24. KUNTE, K., JOGLEKAR, A., UTK.."'-RSH, G. AND PRAMOD, P.
TREES OF WESTERN GHATS 569
A field key to the trees and lianas of the evergreen forests of the Western Ghats, Institut Francais, Pondicheny, 1987.
Ecological diversity and its measurement, Princeton University Press, New York, 1988.
Statistical ecology, Wiley, 1988.
On the hospitality of the Western Ghats habitats for the bird communities, Curr. Sci., 1996, 73, 122-127.
An atlas of the endemics of the Western Ghats (India), Institut Francais, Pondicherry, 1987.
A Handbook on the identification and description of trees, shrubs and some important herbs of the forests of the southern states, Southern Forests Rangers College, Coimbatore and Manager of Publications, Government of India, New Delhi, 1967.
Multivariare analysis in community ecology, Cambridge University Press, Cambridge, 1982.
On the ecological history of the Western Ghats, Curr. Sci., 1997, 73, 146-155.
Ecological studies in four rainforests in Karnataka, India- I: Environment, structure, floristics and biomass, J. Eco/., 1986, 74, 439-459.
Study afforests & soils under different types of landuse in Sringeri Taluk, Chikmangalur district, Karnataka, Dept. of Ecology and Environment, Karnataka and J. C. B. M. College, Sringeri, 1990.
Studies on growth and architecture of tree species of homegarden agroforestry systems of Kerala, Report No. 101, Kerala Forest Research Institute, Peechi, 1996.
Impact of human extraction on tropical humid forests in the Western Ghats in Uttara Kannada, South India, J. Appl. Ecol., 1995, 32, 866-874.
Assigning conservation values: a case study from India, Conservation Biol., 1991, 5, 464-475.
Distribution of endemic, arborscent evergreen species in the Western Ghats. In Proc. Symp. on Rare, Endangered and Endemic plants of Western Ghats, Kerala Forest Department, 1991.
Biodiversity assessment at multiple scales: Linking remotely sensed data with field information, Proc. Natn. Acad. Sci. USA, 1999, 96, 5154-5158.
Evaluating the bird communities of the Western Ghats to plan for a biodiversity friendly development, Curr. Sci., 1996,73, 156-162.
Birds of the manmade ecosystems: the plantations, Proc. Indian Acad. Sci. (Anim. Sci.), 1990, 99, 79-89.
Patterns of butterfly, bird and tree diversity in the Western Ghats, Curr. Sci., 1999, 77, 577-586.