ERP 1949 January
176
The Economic Report of the President TRANSMITTED TO THE CONGRESS January 1949 Digitized for FRASER http://fraser.stlouisfed.org/ Federal Reserve Bank of St. Louis
-
Upload
fraser-federal-reserve-archive -
Category
Documents
-
view
234 -
download
11
Transcript of ERP 1949 January
The Economic Reportof the President
TRANSMITTED TO THE CONGRESS
January 1949
Digitized for FRASER http://fraser.stlouisfed.org/ Federal Reserve Bank of St. Louis

Digitized for FRASER http://fraser.stlouisfed.org/ Federal Reserve Bank of St. Louis
THE ECONOMIC REPORTOF THE PRESIDENT
To the Congress, January 7, 1949
Together with a report
THE ANNUAL ECONOMIC REVIEWJANUARY 1949
by the
COUNCIL OF ECONOMIC ADVISERS
UNITED STATES GOVERNMENT PRINTING OFFICE
WASHINGTON : 1949
Digitized for FRASER http://fraser.stlouisfed.org/ Federal Reserve Bank of St. Louis

Digitized for FRASER http://fraser.stlouisfed.org/ Federal Reserve Bank of St. Louis
LETTER OF TRANSMITTAL
THE WHITE HOUSE,Washington, D. C v January 7,1949.
The Honorable the PRESIDENT OF THE SENATE,The Honorable the SPEAKER OF THE HOUSE OF REPRESENTATIVES.
SIRS: I am presenting herewith my Economic Report to the Congress,as required under the Employment Act of 1946.
In preparing this report, I have had the advice and assistance of theCouncil of Economic Advisers, members of the Cabinet, and heads of in-dependent agencies.
Together with this report, I am transmitting a report, the Annual Eco-nomic Review: January 1949, prepared for me by the Council of EconomicAdvisers in accordance with section 4 (c) (2) of the Employment Actof 1946.
Respectfully,
tpL
III
Digitized for FRASER http://fraser.stlouisfed.org/ Federal Reserve Bank of St. Louis

Digitized for FRASER http://fraser.stlouisfed.org/ Federal Reserve Bank of St. Louis
ContentsT H E ECONOMIC REPORT OF THE PRESIDENT.
Sources of our economic strength.High points in the economic situation.Guides to economic policy.Legislative recommendations.
T H E ANNUAL ECONOMIC REVIEW: JANUARY 1949 (a report to the Presidentby the Council of Economic Advisers).
Digitized for FRASER http://fraser.stlouisfed.org/ Federal Reserve Bank of St. Louis

Digitized for FRASER http://fraser.stlouisfed.org/ Federal Reserve Bank of St. Louis
To the Congress of the United States:
THE people of the United States have just enjoyed another year ofbountiful prosperity. This has enabled us further to strengthen our
economy at home, and further to supplement the recovery of freedom-loving peoples elsewhere who seek lasting peace.
The resourcefulness of American business, the skill of our labor force,and the productivity of our agriculture have lifted our standards of livingbeyond any prewar expectation. We have achieved these blessings throughthe happy combination of our free institutions, our system of private enter-prise upon which we primarily rely for economic results, our vigorousGovernment, and the mutual respect and trust that we all hold for oneanother. My pledge to all elements in our economic system is that theirGovernment will continue to steer a course guided by full recognition ofthese values. Toward this end, I ask of all the cooperation and confidenceupon which our way of life depends.
Let us all remember that our unparalleled prosperity has not been main-tained by chance, and that we can lose it if we leave the future to chance.Courageous and positive action has contributed to our progress, and someof the most serious difficulties still confronting us exist because our thoughtand action have not been sufficiently clear and vigorous.
As we work together in 1949 to combat the remaining dangers of postwarinflation, we should bear always in mind that our purpose is at the same timeto build strong bulwarks against deflation and depression, and thus to con-solidate our past gains and move forward to new levels of sustained prosper-ity for all.
This third annual Economic Report, under the Employment Act of 1946,affords not only the President but also the Congress and the whole countrystill another occasion to look to our current economic position, to drawcourage from our progress, and to benefit by our mistakes. Now is thetime to formulate and execute a practical program of immediate andlong-range economic measures pointed toward stability and growth.
Sources of Our Economic Strength
THE year just ended has tested the strength of our economy, and chal-lenged our ability and willingness to act to protect our prosperity.
When 1948 opened, the inflation which had attained threatening propor-tions in the preceding months was continuing unchecked. Prices were risingeverywhere. They brought higher but uneasy profits to business firms.They squeezed the family budget of workers, who in turn sought to press
Digitized for FRASER http://fraser.stlouisfed.org/ Federal Reserve Bank of St. Louis
wages upward as the cost of living advanced. The rising spiral createdmore and more maladjustment among prices, wages, and other incomes.
Early in 1948, a sharp break in grain prices spread concern throughoutthe economy. Commodity speculation, fed by a world demand of unprece-dented magnitude and intensified by our own short corn crop, had carriedthe prices of wheat and corn to levels which could not be sustained. Themarket structure collapsed of its own weight. On February 13, the priceof cash wheat was 25 percent or 74 cents a bushel lower than it had been amonth earlier.
But this break did not set off a train of consequences similar to those which,following World War I, had turned the boom into a deflation of unusualdepth and rapidity in 1920-1922. In 1948, the decline of the speculativegrain market did not bring unemployment, cutbacks in production, generalunloading of inventories, or abandonment of plans for capital investment.Our economy showed strength sufficient to withstand shock of a kind whichhad ended earlier inflations with collapse.
The reasons for this were not just that we were luckier in 1948 than we hadbeen in 1920. Affirmative national policies and greater caution in the busi-ness community combined with other developments to make the economymore shock-resistant. The farm price support program guaranteed thatthe collapse of grain prices would not go far enough to impoverish thefarmers, to curtail the farmers' demand for the products of industry, or tobring about a chain reaction of price breaks in other markets. As theprice drop was localized, it did not cause cancellation of the buying andinvestment plans of businessmen and consumers.
Nor was the farm price support policy the only source of our strength.Our whole financial and banking structure was stronger and more resilientthan in the early twenties. Our businessmen, having become better in-formed, were more prudent. Our working groups were better suppliedwith current income and accumulated savings. Our social security andrelated policies added to the feeling of stability. The Government had soemployed a large budget surplus as to prevent the inflation from becoming ashectic as it otherwise would have been; and such policies served to moderatethe extent of the reaction. This combination of private and Governmentaction helped us to avoid serious trouble last year, although it was noteffective enough to terminate the inflationary trend which was soon aug-mented by the defense program and by the reduction in taxes. Nor did wedevelop an adequate protective program against hurtful deflation in thefuture. We must now look to an improved combination of basic privateaction and supplementary government action to develop still better remediesand safeguards.
Our escape from the danger of a general recession in the spring of1948 does not mean that no further dangers will appear, or that we canwait until they descend upon us in full force before taking wise preventivemeasures. We have been granted a breathing spell, but we have not been
Digitized for FRASER http://fraser.stlouisfed.org/ Federal Reserve Bank of St. Louis
granted lasting prosperity without further effort and vigilance. So longas the rising course of incomes and activity continues, there will be inoperation many of the forces which have been responsible for the long-sustained advance of prices. There are a few sectors of our economy wheredangerous inflationary forces continue to be predominant. For example,the shortages of steel and electric power, and the steadily mounting costsof public utility services, add further to the higher costs of production whichup to now have been rather readily passed on to the consuming public.
The recent appearance of wider areas in the economy where supply con-ditions have improved, where the pressure of demand has been reduced, andwhere price inflation has been halted or reversed, should be looked upon as adesirable development to be welcomed rather than feared. It marks thebeginning of the process by which a more stable condition can be reachedafter a long period of rising prices. But these adjustments have not pro-ceeded far enough to justify a cessation of concern about inflation. Besides,a sharp and uneven adjustment of prices downward may cause dislocationsquite as serious as the sharp and uneven movement of prices upward.Since both factors may be at work in different parts of the economy at thesame time or in rapid sequence, we need to have available a range of gov-ernmental measures which can be applied as brake or as accelerator accord-ing to the need.
While the prosperity of the postwar years has been great, it has restedin considerable part on somewhat temporary factors which were the after-math of war. In 1949, we are entering a period of harder tests. Themomentum of war-created demand and war-created purchasing power haswaned, and we must now rely more fully on currently generated purchasingpower to absorb a full output of goods and services. We must be morethan ever on the alert, to make sure that withdrawal or lessening of tem-porary demand factors is not accompanied by a reduction of productiveactivity and the mounting unemployment to which this would lead.
I believe that prosperity can be continued and that, with proper action,the prospective volume of business investment, consumer spending, andgovernmental transactions should promote ample employment opportunitiesfor the coming year. But many adjustments in price and income relationsneed to be made, and these must flow mainly from the wise action of theleaders in our enterprise economy. These leaders should draw sustainingconfidence from the fact that it is the policy of the Government under theEmployment Act of 1946 to use all its resources to avoid depression and tomaintain continuous prosperity.
These favorable prospects will not be realized automatically. Thestrength of our economy, the strength of our great Nation, depends uponour capacity and willingness to adopt the salutary policies which are requiredby changing circumstances and to put them into effect.
Digitized for FRASER http://fraser.stlouisfed.org/ Federal Reserve Bank of St. Louis
In this Economic Report, drawing upon the more* detailed informa-tion and analysis furnished to me by the Annual Economic Review of theCouncil of Economic Advisers (transmitted to the Congress herewith), Ishall first cover the high points in the current and prospective economicsituation, and then propose both policy guides and a program to deal withthe situation as I evaluate it.
High Points in the Economic SituationEmployment in 1948 ranged from 57 to nearly 62 million civilian workers
and averaged more than 59 million. This included over a million workerswho were added to the labor force. Unemployment remained at the lowlevel of around 2 million.
Production for the economy as a whole was between 3 and 4 percenthigher than in 1947. With bumper crops, agricultural output increasedabout 9 percent. Industrial output increased 3 percent, while employmentin the service businesses rose 3 percent and in government 4 percent.
Prices ceased the broad upward movement which had persisted withfew interruptions ever since the removal of price controls. The trends ofprices became more irregular and more selective. Metals and metal prod-ucts, building materials, fuel and lighting materials, and most durablegoods moved upward, while some other groups weakened, with farm prod-ucts leading the decline. Lower food prices brought the consumer priceindex down a little in the late months of the year, although other com-ponents of the index continued to rise throughout most of the year.
This halt in the upward march of prices has been a welcome sign inthe battle against inflation. I hope that it proves more enduring thansimilar pauses during the past two years. But the sharply divergent move-ments of prices—both up and down—confront us with urgent problems ofadjustment to sustain maximum employment and production throughoutthe economy.
Wages went up during 1948, but there was considerable disparity in theincreases obtained by workers in different lines. While some groupsmanaged to keep ahead of rising living costs, others fell behind.
Work stoppages in 1948 were at about the same level as in 1947. Inmost industries, settlements were obtained without prolonged negotiationsor strikes. Nevertheless, considerable loss of production resulted directlyand indirectly from strikes, especially in coal mining and in east coast andwest coast shipping and trucking.
Profits in 1948 again surpassed all previous records and were risingthroughout the year. Corporate profits after taxes amounted to about 21billion dollars, contrasted with a record level of about 18 billion dollars in1947. With sales booming, the ratio of profits to sales was again main-tained at around 5 percent after taxes. As I pointed out a year ago, such
Digitized for FRASER http://fraser.stlouisfed.org/ Federal Reserve Bank of St. Louis
profits are in excess of the levels needed to furnish incentives and equityfunds for industrial expansion and to promote sustained economic health,although some businesses have not thrived nearly so well as others.
The supply of money and credit, which increased enormously during thewar, continued to expand thereafter. During 1948, however, partly as aresult of restrictive actions adopted by governmental authorities and volun-tary restraints observed by banks, and partly because of a decline in thedemand for short-term capital, the expansion of bank credit was sub-stantially slowed. A large Government surplus used to retire bank-helddebt, together with the slackened growth of credit, resulted in a slightdecrease in the amount of privately held bank deposits and currency.While bank loan expansion was less in 1948 than in 1947, this was in goodpart offset by increased lending by other financial institutions.
Credit expansion has been an important element in the process ofinflation. In the first months of 1948, it was offset by the large Treasurysurplus. When that surplus disappeared, the Government did not haveauthority to take other action which would effectively restrain inflationaryexpansion of bank credit and at the same time assure the maintenance of anorderly market for the vast public debt.
Consumer income in 1948 increased per capita about in proportion to theincrease in consumer prices, which meant that consumers had no appre-ciable gain in real incomes despite an increase of 3 to 4 percent in totalnational output. Income from most major sources was greater than in1947. But in the latter half of 1948, income from farming fell relative tothe normal seasonal pattern and that from other unincorporated businessand from rents ceased to rise, while that from dividend payments increasedsharply. Income distribution is less unequal than it was in prewar years,but this improvement has probably been halted as a result of inflation andof changes in income taxes in 1948.
Consumption expenditure went up less than income in 1948. Whilepersonal saving increased, this was not reflected in the rate at which peopleaccumulated liquid assets—currency and bank deposits, insurance policies,and securities. A larger proportion of saving was invested in housing,unincorporated businesses, and farms.
Business investment continued at a high level throughout 1948. Plantand equipment outlays by businesses other than farms totaled about 19 billiondollars, slightly above the level reached in the latter half of 1947, althoughwith higher costs the physical volume of such investment was not quitemaintained. Expansion to catch up with postwar demands appeared tobe nearing completion in some lines, but substantial further increases incapacity are planned in a number of industries—chemicals, petroleum,metals, utilities, and transportation. Even where expansion goals have beenmet, modernization to reduce costs and improve products should continueto require substantial investment, though at a rate of growth lower than thatof the past two years.
Digitized for FRASER http://fraser.stlouisfed.org/ Federal Reserve Bank of St. Louis
Inventories of nonfarm businesses likewise continued to increase in valuethroughout the year, the increase amounting to about 7 billion dollars.Of this amount, 4 billion was accounted for by price increases. Restockingafter wartime shortages appears to have been virtually completed exceptfor metals and some building materials.
Corporate financing of investment in plant and equipment, inventories,and customer credit required 26 billion dollars in 1948, 2 billion less thanin 1947, but that part of new investment which went into plant and equip-ment increased. Of the total, 65 percent was internally financed. Forthe part externally financed, bonds were a more important source, andbank loans and stock issues less important sources, than in 1947. Whilestock market financing has been less important during the postwar yearsthan in the late 1920's, this has been offset by greater retained earningsso that equity-debt ratios are generally more favorable now than in thelast two decades.
The housing supply was increased by well over a million residential unitsduring 1948. But since last May the number of new housing starts hasbeen falling off rapidly. This does not mean that the housing shortagehas been overcome. Rather it means, as I have pointed out in previousreports, that the construction industry has been pricing itself out of themarket for all but expensive homes. A continued decline in home build-ing would constitute a threat, not only to the improvement of living stand-ards for millions of low-income families who are still inadequately housed,but also to the maintenance of maximum employment over the years.
The housing shortage is one that calls for prompt and bold action byGovernment and by industry—action by Government that will producelow-rent public housing, slum clearance, and rural housing for families oflow incomes; action by industry to reduce costs so that decent homes canbe built at prices that wage earners with moderate incomes can afford.
The major portion of the housing job must be done by private industry.Here the bottleneck is cost. At this time of national stock-taking I urgeall elements of the building industry substantially to lower costs so thathousing production may reach new record levels. The present decline inhousing starts points up the danger that inflated building costs can bringdown upon the industry. If housing costs are lowered and the consumergets better value, builders will be able to continue to build in volume andthe building industry need not fear a continued downward trend.
Municipalities can perform a major role in reducing costs by modernizingtheir obsolete building codes, which add to costs unnecessarily.
The surplus of exports of goods and services in 1948 was substantiallyless than in 1947, being 6 billion dollars compared with 11 billion. Thisreflected in part an increase in imports, a necessary development for placingour international transactions on a sustainable basis. It reflected evenmore a decrease in exports, because foreign purchasers lacked dollars withwhich to buy from us, and because of increased supplies of needed goods
Digitized for FRASER http://fraser.stlouisfed.org/ Federal Reserve Bank of St. Louis
produced abroad. The impact of this decline has been selective. Foreigncountries have continued to buy products which they consider essential, likewheat, petroleum, agricultural and industrial machinery, and chemicals.Other items have been cut very drastically.
As shipments under the European Recovery Program continue to ex-pand, some increase in the level of exports can be anticipated. For certainproducts, especially those for which the domestic market is tight, countriesare being authorized to use European Recovery Program funds for purchasesoutside the United States. This will not reduce total export demand, sincethe sellers of such goods will generally spend here the dollars they receive.However, the expansion of exports under this program will, it is hoped, beoffset in part by further increases in imports.
Government fiscal transactions were again a strong anti-inflationary fac-tor in the early part of 1948, due to the excess of receipts over expenditures.But this factor declined substantially during the year. Federal receipts fromthe public exceeded cash payments by about 6 billion dollars in the calen-dar year 1947. Measured after adjustment for seasonal factors, the excessran at an annual rate of 12.5 billion dollars in the first half of 1948, andonly at a rate of 4 billion dollars in the second half. One of the mainsupports of an anti-inflation policy is a large Treasury surplus. As a resultof the tax reduction of last year and the necessary increase in Governmentexpenditures, this powerful weapon is not now available. Tax receipts, it istrue, have been rising but this has been largely due to the inflationary rise inincomes, profits, and pay rolls. This inflationary rise, in turn, was aggra-vated by the effects of the tax reduction. Rising expenditures of State andlocal governments are expected to add to deficits in 1949, and these deficitsincrease the general inflationary pressure.
In the Nation's Economic Budget, retained earnings of business and busi-ness investments showed the largest percentage increase from 1947 to 1948.Among the other components, consumer incomes and expenditures increasedless, government payments rose only moderately, and net foreign investmentdeclined substantially. Expectations of continued inflation have added tothe incentives for business investment, while the price rise has acted as abrake on the demand of consumers with relatively fixed incomes. Theproportion of consumer expenditures in the total national product hasnever been lower in any peacetime year for which statistics are available.This is not an immediate problem so long as the sum of government expendi-tures, business expenditures, and net foreign investment is still rising. Itcould become a critical problem as these other factors begin to turn downor even to assume a declining relative importance in a constantly growingtotal economy. This situation calls for a vigorous anti-inflation programnow, while at the same time we must pursue those policies of adjustment andexpansion which will be needed to promote balanced economic growthover the years.
Digitized for FRASER http://fraser.stlouisfed.org/ Federal Reserve Bank of St. Louis
Guides to Economic Policy
AS WE turn from consideration of the facts of our economic situation. to a program of action, there are several broad principles which I
believe should guide us. These principles should help us to keep clearly inmind where we want to go and how certain roads rather than others are thesurest and quickest way of getting there.
First. We should remember that the goal we seek is the greatest prosper-ity for the whole country and not the special gain of any particular group.That is why the Employment Act of 1946 calls upon the President to presentan economic program aimed at continuous "maximum employment, produc-tion, and purchasing power." I firmly believe that this goal is attainable.
Maximum employment for 1949 means that nearly 1 million additionaljob opportunities should be provided for the growing labor force. Maxi-mum production means that our increased labor force and modernized plantshould strive for a 3 to 4 percent increase in total output. Maximum pur-chasing power means that the sum total of market demand by government,business, and consumers, domestic and foreign, should be proportionate toour productive capacity. It must not be more or we shall suffer inflation.It must not be less or we shall suffer unemployment and under-utilizationof our resources.
Second. We should think and work with a reasonably long look ahead,not keeping cur eyes just on the problems of the moment. Our immediatetasks must be placed in the perspective of our long-range national objectives.While we must deal promptly with the problem of inflation, we mustnot unduly hold back undertakings that are needed to preserve anddevelop our employment opportunities and our productivity in later years.Policies needed to develop our resources and to prevent depression in thelong run must be reconciled with policies needed to curb inflation in theshort run.
We must pursue affirmative programs for housing and health, for edu-cation and resource development. Yet the fight against inflation preventsus from undertaking these long-range programs with the speed and on a scalethat would otherwise be desirable. In the recommendations made in thisEconomic Report and in the Budget which will be transmitted to the Con-gress in a few days, I have sought to reconcile these objectives in a way thatstrikes the safest balance.
Third. In order to have a yardstick for appraising strength and weak-nesses in our economy and the adequacy of Government programs, we needconcrete objectives for economic growth, and particularly standards for abetter balance between production and consumption, income and invest-ment, and prices, profits, and wages which will be conducive to sustainedeconomic progress. In the Annual Economic Review of the Council of
Digitized for FRASER http://fraser.stlouisfed.org/ Federal Reserve Bank of St. Louis
Economic Advisers, transmitted herewith, there is a detailed treatment ofour growth possibilities over the next few years. This shows how our employ-ment, our output, and our standards of living can rise if we encourage andplace major reliance upon our free enterprise system, conserve and developour natural and human resources, retain our faith in responsible Govern-ment, and do not relax our efforts.
This study by the Council of Economic Advisers shows that action isnow needed on the long range programs which I set forth in the concludingsection of this Economic Report.
Fourth, We are dedicated to the principle that economic stability andeconomic justice are compatible ends. The fact that our total purchasingpower is now at record levels cannot blind us to the equally important factthat the incomes of many people have not risen apace with the cost of livingand that they have become the victims of inflation. A prosperity that is toouneven in the distribution of its fruits cannot last.
Fifth. We must fulfill the requirements of our essential programs—national defense, international reconstruction, and domestic improvementsand welfare—even if doing so may require the temporary exercise of selec-tive controls in our economy. We want the greatest amount of economicfreedom that is consistent with the security and welfare of the people; but wedo not want to sacrifice that security and welfare because of narrow andselfish concepts as to the acceptable limits of government action. If wecould have the amount of national defense that we need, make the contribu-tion to international reconstruction to which we are committed, and at thesame time maintain and expand our standards of living now and in the futurewithout any kind of selective controls over the economy, that would bemost highly desirable. And it is possible that we may not, in fact, be fercedto use such controls. But we would rather have these relatively unpleasantrestrictions on our freedom of action for a while than imperil our secu-rity or allow our human and material resources to deteriorate.
Sixth. The vigorous commitment by the Government to an anti-inflationpolicy should not obscure the fact that the Government is equally committedto an anti-depression policy. In fact, curbing inflation is the first steptoward preventing depression. And in times like the present, when theeconomic situation has mixed elements, the Government needs both anti-inflationary weapons and anti-deflationary weapons so that it will be readyfor either contingency. It may even be necessary to employ both types ofmeasures concurrently in some combination, for some prices or incomescould rise too rapidly while others could be falling dangerously. The samedictates of prudent policy which call for higher taxes in a period of inflationwould call for tax adjustments designed to counteract any serious reces-sionary movement.
Digitized for FRASER http://fraser.stlouisfed.org/ Federal Reserve Bank of St. Louis

Legislative RecommendationsWith these principles as a guide, I turn now to the recommendations
which I am presenting to a new Congress invested by the American peoplewith enormous responsibility for their welfare and security. We arepledged to prompt action when needed. We must not wait to act only inthe eleventh hour of crisis. Moderate measures, taken in time, can save usfrom drastic action later on.
1. POLICIES TO COMBAT INFLATION AND TO PROMOTE PRODUCTION IN
CERTAIN INDUSTRIES
Fiscal policyIt is essential to sound fiscal policy to have a budget surplus now. This is
our most effective weapon against inflation. It will enable us to reduce ourdebt now; it would be much more difficult to do so in less prosperous times.
I recommend legislation to increase the Government revenue from tax-ation by 4 billion dollars a year. The principal source of additional revenueshould be additional taxes upon corporate profits, which can be appliedwithout unduly interfering with prospects for continued business expansionand with assurance that profits, after taxes and dividends, will be sufficientfor investments and contingencies.
Another source of additional revenue should be the tax upon estatesand gifts. The already small yield from this tax was reduced by one-thirdby the Revenue Act of 1948. Careful study should also be directed to theincrease of rates of individual income taxes in the upper and middlebrackets. Some additional excise taxes may be desirable, but some excisetaxes, particularly on oleomargarine, should be repealed.
I also recommend an increase in social security contributions underexisting and extended social insurance programs. This would exert ananti-inflation effect in addition to that of the 4 billion dollar increase intaxes which I have recommended above.
The national tax policy should be flexible and should be promptlyadjusted to the changing needs of business and consumers in the course ofevolving economic events.
Increased taxation is only one of the means by which we can accumulatea budget surplus. The other is a careful limitation of Federal expenditures.It is essential that our fiscal policy under present circumstances contemplatenot only a surplus of revenues over expenditures, but also a surplus achievedat the lowest level of expenditures which is consistent with our needs.The implications of this policy requirement will be discussed at length in myBudget Message.
10
Digitized for FRASER http://fraser.stlouisfed.org/ Federal Reserve Bank of St. Louis
Debt management
The public debt will continue to be managed in a manner that will makea maximum contribution to the stability of the economy. An importantfactor in this program will continue to be the maintenance of stability in theGovernment bond market.
Such stability in the Government bond market has been a most significantelement in the smooth reconversion from a wartime economy to a civilianpeacetime economy. It contributes to the underlying strength of the finan-cial structure of the country. It engenders business confidence. It hasmade it easier for business and industry to obtain the capital funds necessaryfor their reconversion and expansion projects.
The stability of the Government bond market was maintained through-out 1948 by the joint effort of the Treasury Department and the FederalReserve System. Despite the necessity for market support at times duringthe year, there was only moderate increase in the total Government securityholdings of the System as a result of the support program. There wereoccasions, however, when the bond price support policy proved its valuein stabilizing the market and the need for continuance of the policy wasdemonstrated.
Only during the last few years have we had experience in dealing withthe problems of managing a public debt of the size the country now bears.The policy of supporting the price of long-term Government bonds at the 2/4percent yield level has been eminently successful.
Through its vigorous promotion of savings bond sales during the year,the Treasury has placed a large volume of bonds in the hands of individuals,who have thereby aided in the battle against inflation by adding to theirsavings. The most gratifying aspect of this situation is that the amount ofSeries E bonds outstanding was brought to the new high level of 32 billiondollars, and that this was accomplished with the cooperation of the banksof the country, thousands of business firms and their employees, and anarmy of patriotic volunteer workers.
Credit policy
On previous occasions I have recommended that adequate means be pro-vided in order that monetary authorities may at all times be in a position tocarry out their traditional function of exerting effective restraint upon exces-sive credit expansion in an inflationary period and conversely of easing creditconditions in a time of deflationary pressures. The temporary authorityto increase reserve requirements of member banks of the Federal ReserveSystem, granted by the Congress last August, will expire on June 30, 1949.The expiration of this authority without further action of the Congresswould automatically release a substantial volume of bank reserves irre-
II
Digitized for FRASER http://fraser.stlouisfed.org/ Federal Reserve Bank of St. Louis
spective of credit needs at the time. The Congress should promptly providecontinuing authority to the Board of Governors of the Federal ReserveSystem to require banks to hold supplemental reserves up to the limitsrequested last August, 10 percent against demand deposits and 4 percentagainst time deposits. This authority to the Board of Governors shouldnot be confined to member banks of the Federal Reserve System but shouldbe applicable to all banks insured by the Federal Deposit InsuranceCorporation.
Authority for the regulation of consumer installment credit, which like-wise expires under present law on June 30, 1949, should be continued inorder to exert a stabilizing influence on the economy.Promotion of supply and production
There are shortages of supply in certain critical areas which are so seriousas to impede maximum production in an expanding economy and to limitprograms related to national security.
I recommend immediate legislation to deal with this problem of capacityand supply. It should impose upon the Government the specific responsi-bility and provide the funds to make careful surveys of future supply needsand productive capacity. It should further require that these specific studiesbe correlated with the general requirements of an economy operating at max-imum employment, production, and purchasing power. To the extent thatfacts reveal the need, it should provide additional authority to deal moreeffectively with inadequacy of capacity and supply.Allocation powers
In my Economic Report of last year, I stressed the need for the supple-mentation of voluntary action with mandatory controls over key materialsin short supply. The need for mandatory controls still exists. I propose thetemporary extension of the law under which voluntary agreements are nowpermitted. However, there is grave danger that the problems of acute short-age cannot be adequately met by voluntary agreements. I therefore recom-mend that the use of mandatory allocation powers be authorized so that theymay be employed on a selective basis without delay where they prove to beneeded.
I also recommend that the Congress continue the priorities and allocationauthority in the field of railroad transportation.Selective price and related wage controls
I recommend that selective price control authority should promptly bemade available to the Government. My reasons for this have repeatedlybeen set before the Congress and the country. I have not earlier and donot now propose general or over-all price control of the wartime variety.But we are still in a situation where the prices of certain critical materialsor commodities of vital industrial or consumer importance are movingupward for the third consecutive year or longer. Sharp rises in the pricesof essential products may be harmful to the economy even when the general
12
Digitized for FRASER http://fraser.stlouisfed.org/ Federal Reserve Bank of St. Louis
price level is fairly stable. Further, we cannot be certain that anotherupsurge of general inflation will not reappear this year under the compositepressures which are at work throughout the economy.
Legislation to authorize selective price control should encourage volun-tary adjustments without the actual imposition of price control. It isin this spirit that I would administer the authority. But I am firmlyconvinced that such voluntary efforts, which have been tried with partialbut insufficient results since the middle of 1946, cannot meet the problemunless the Government possesses the authority to act firmly. With suchauthority available, however, its actual application might not be re-quired. It should be supplemented with a provision permitting the Gov-ernment to order the withholding of price advances for a reasonable periodwhile public inquiry into their justification is being made.
In my message to the special session of the Congress in July 1948, Isaid: "Where the Government imposes a price ceiling, wage adjustmentswhich can be absorbed within the price ceiling should not be interferedwith by the Government. The Government should have the authority,however, to limit wage adjustments which would force a break in a priceceiling, except where wage adjustments are essential to remedy hardship,to correct inequities, or to prevent an actual lowering of living standards."I then stated my belief, which I still firmly hold, that wage increases basedupon productivity and designed to provide a rising standard of living em-body the American way. The facts show some current situations wherenon-inflationary wage increases can be granted by employers without priceincreases. I firmly believe that the normal processes of collective bargainingwill result in sound wage adjustments without the actual application of anygovernmental authority related to wages if business and Government makegenuine efforts to hold down excessive prices and profits and to reduce thecost of living.
Rent control
The present housing shortage makes it necessary to continue rent controlfor at least two years, and to strengthen its enforcement. I recommend thatthis be done.
Even if the most optimistic interpretation is placed upon the slight re-duction in the cost of living in recent months, it would be unwise to liftliving costs again by rent increases even larger than the moderate onestaking place under the present system of control. Such a course wouldinflict further hardship upon the families who have already been the primevictims of inflation, and would make it harder to exercise moderation inwage demands.
Export controls
In view of the large volume of exports required to carry out ourprogram of aiding economic reconstruction abroad, it is essential that thoseexports be controlled, both to minimize their adverse impact on the domes-
13
Digitized for FRASER http://fraser.stlouisfed.org/ Federal Reserve Bank of St. Louis
tic economy and to make them most fully conformable to our foreignpolicies. I therefore recommend that the existing powers of control overexports be extended, and that the machinery for enforcement bestrengthened.
Commodity exchanges
Excessive speculation in grains, cotton, and other agricultural commodi-ties results in wide and harmful fluctuations in prices. The experience inthe fall of 1947, and in the winter and spring of 1948, demonstrated theneed for more effective governmental supervision over speculative tradingon the commodity exchanges. I recommend that the Congress grant morespecific and more adequate authority to prevent excessive speculation orthe manipulation of prices.
2. POLICIES TO PROTECT THE VICTIMS OF INFLATION
While we are fighting further inflation, we should recognize that severehardship has already been imposed on those whose incomes have laggedfar behind the increase in the cost of living. Whatever is feasible to al-leviate this hardship should be accomplished without delay. I recommendspecifically:
That the benefits under the old-age and survivors insurance be sub-stantially increased in order to bring them in line with the increase inthe cost of living;
That the coverage of the Fair Labor Standards Act be broadenedand the minimum wage increased from the present 40 cents an hour—a figure determined in 1938—to at least 75 cents an hour. It should bepermissible to provide higher minima by tripartite action of employers,unions, and the Government on an industry basis;
That the public assistance program for relief be improved to meetthe basic human needs of the less fortunate.
The housing program which I recommend will make a start toward pro-viding decent housing for those whose low incomes confine them to slumsin these days of grossly inflated housing prices.
3. POLICIES TO PROMOTE BALANCED ECONOMIC GROWTH
While alleviating the hardships of inflation and overcoming maladjust-ments which threaten our future prosperity, we must continue to develop ourresources for healthy growth. We should press forward at once withsome programs of high priority needed now to conserve and increase thestrength of our Nation. In addition, we should be prepared with fullyformulated plans for others. We cannot accept the dangerous idea thatinflation's end will automatically bring about a period of stable prosperity.The continuing need for prudence in Government expenditures must notbe translated into false economy.
14
Digitized for FRASER http://fraser.stlouisfed.org/ Federal Reserve Bank of St. Louis
Natural resources
The Federal Government has an important role in the development of ournatural resources which is essential to the achievement of programs to relieveshortages which threaten economic development. These shortages includemany of our most essential minerals and metals, our energy resources, espe-cially electric power and oil, and some chemicals and fertilizers.
Present shortages of electric power in many areas are not temporary; ourlong-range needs require enormous expansion of existing capacity. It isessential that public power programs be expanded this year, even where thisrequires use of scarce materials for construction of dams and generators.Such expansion should include the construction of transmission lines whereneeded. A start on the St. Lawrence River waterway and power projectshould be made immediately. The programs in the important river basinsshould be examined and prompt action taken where needed to provideimproved coordinated development plans.
Agriculture
With certain abnormal postwar demands for farm products diminishing,problems of adjustment to longer-range conditions are becoming more press-ing. We need to fit a prosperous and equitably treated agriculture con-sistently into an economy seeking to operate continuously at maximum levelsof employment, production, and purchasing power.
We must make sure that our long-range price-support legislation movestoward the goal of farm living standards comparable to those of the restof the population. We need farm production even more abundant than wehave yet attained to supply the industrial and consumer needs of a fullemployment economy. But at the same time, we need measures to en-courage shifts in the composition of farm output realistically adjusted toour domestic and export needs. We should supplement such measureswith others, including the provision of adequate storage facilities, the im-provement of distribution, and adequate credit facilities.
Even with farm production and national income at their present highlevels, many families lack adequate diets. We should assure main-tenance in the future of a level of consumption consistent with real foodneeds. This will help to stabilize domestic markets for farm products.
To stabilize foreign markets, consultations are already under way towardpreparing a new International Wheat Agreement.
I urge the Congress to reexamine existing and proposed farm legislationin the light of all these objectives.
International economic relations
The European Recovery Program is designed to further world recoveryand reconstruction. It must be continued. Its success will facilitate areturn to reasonable freedom of world trade. The proposed Charter of
Digitized for FRASER http://fraser.stlouisfed.org/ Federal Reserve Bank of St. Louis
the International Trade Organization, which was signed by 54 nations lastyear, lays the foundation for this return.
The present inadequate authority for the conclusion of reciprocal tradeagreements expires June 30, 1949. I urge that immediate action be takento restore the Trade Agreements Act to full effectiveness and to extendit for three years.
Housing
The steady decline in new housing starts since last May adds fresh evidenceof the need for housing legislation. I again recommend immediate passageof the unenacted portions of the comprehensive housing bill; and the needhas now become so great that its meager quota of 500,000 units of low-renthousing over 5 years should be increased to provide for 1,000,000 unitswithin 7 years.
If we are to achieve levels of housing production adequate to our needs,construction materials in the necessary volume must be available continu-ously and in balanced proportions. If it proves necessary, I shall nothesitate to use the allocation authority, which I have requested, to channelsuch materials into home building.
Urban redevelopment and community facilities
The comprehensive housing bill includes substantial Federal aid to theStates and localities to enable them to make more rapid progress in clearingslums and in assembling land for balanced redevelopment. Such actioncan be taken now without adding significantly to inflationary pressures, andit is an essential basis for future progress.
While the Annual Economic Review of the Council of Economic Ad-visers this year does not deal at length with programs, such as education,health, and social security, which are directed toward the improvement ofour human resources, my Economic Report last January stressed the inti-mate connection between the conservation and improvement of these re-sources and the prosperity and productivity of our economy. The Councilthis year firmly reiterates this principle.
Because the programs flowing from this analysis have not yet been au-thorized, I submit the following recommendations.
Education
The crisis facing education must be met, and the basis for the continuedimprovement of our system of education made firm. Only with Federalresources can we meet adequately the increased cost imposed by expandingenrollments and the general rise in expenditures for maintenance andoperation. I recommend that a Federal program for aid to elementaryand secondary education be initiated. We should make plans whereby theopportunities for higher education would be expanded through cooperation
Digitized for FRASER http://fraser.stlouisfed.org/ Federal Reserve Bank of St. Louis
between the Federal Government and public agencies and privateinstitutions, including a system of general scholarships and fellowships.And a study should be initiated to determine authoritatively our nationalneeds for educational facilities and the most feasible methods of providingthem.
Health
The high percentage of rejections under the military recruitment programshas provided striking evidence of the unsatisfactory state of the Nation'shealth. National health insurance is the only workable way to assure thatall individuals have access to the medical care they need. I recommendthe enactment of such a program this year. Federal grants in support ofhospital construction are an indispensable support to such a program. Wealso need to augment the number of doctors, dentists, and nurses in orderto overcome the present serious national shortage of medical personnel.
Old age, disability, and unemployment insurance
Millions of workers are excluded from the benefits of our old age andunemployment insurance systems. Such exclusion denies to individualsprotection to which they are entitled by every consideration of equity. Iurge that the coverage of these systems be widened this year and the benefitsmade more adequate.
Few of our workers enjoy systematic protection against loss of incomethrough temporary or permanent disability. We should inaugurate a sys-tem of insurance against such loss.
I have included in this Economic Report only those legislative recom-mendations which have large significance for maintaining maximum em-ployment, production, and purchasing power and which require the immedi-ate attention of the Congress. There are a number of other importantprojects on which we should make further progress this year. Our conserva-tion practices in many areas require improvement, including the regulationof timber cutting, the protection of public range lands, and the develop-ment of our tidelands oil resources. We should press forward with ourprograms of basic research and exploration. We should seek continuallyto encourage the bargaining of labor and management along lines mostconsistent with national progress and stability.
This is a period in which our ability to master our affairs in our own waywill be rigorously tested. Abundant resources and rapidly advancing tech-nology are both a blessing and a responsibility. Our strength lies, however,Jess in these resources themselves than in our will to use them effectively.This task requires adapting our private and Government institutions tochanging circumstances.
Digitized for FRASER http://fraser.stlouisfed.org/ Federal Reserve Bank of St. Louis
We are committed to working out our economic problems in a waythat combines economic and social progress with democratic self-responsi-bility. This is the spirit in which the Employment Act of 1946 wasconceived and in which we shall attempt to live up to its high purpose.
18
Digitized for FRASER http://fraser.stlouisfed.org/ Federal Reserve Bank of St. Louis
THE ANNUAL ECONOMIC REVIEWJANUARY 1949
A REPORT TO THE PRESIDENT
BY THE
COUNCIL OF ECONOMIC ADVISERS
Digitized for FRASER http://fraser.stlouisfed.org/ Federal Reserve Bank of St. Louis

Digitized for FRASER http://fraser.stlouisfed.org/ Federal Reserve Bank of St. Louis
LETTER OF TRANSMITTAL
COUNCIL OF ECONOMIC ADVISERS,
Washington, D. C, January 331949.The PRESIDENT:
SIR: The Council of Economic Advisers herewith submits a report, theAnnual Economic Review: January 1949, in accordance with section4 (c) (2) of the Employment Act of 1946.
Respectfully,
Chairman.
Vice Chairman.
fW
Til
Digitized for FRASER http://fraser.stlouisfed.org/ Federal Reserve Bank of St. Louis

Digitized for FRASER http://fraser.stlouisfed.org/ Federal Reserve Bank of St. Louis
ContentsPage
I. ECONOMIC TRENDS DURING 1948 1
The course of employment and production 1Employment 1Production 1
Prices, wages, and profits 4Prices 4Wages and labor relations 8Profits 9
Money and credit 10The flow of goods and purchasing power 12
Consumer income, spending, and saving 12Business investment and finance 17International transactions 21Government transactions 25Summary: The Nation's Economic Budget 30
II. GOALS AND MEANS OF APPROACHING THEM IN 1949 36
Basic economic objectives 36Maximum employment 36Maximum production 36Maximum purchasing power 36
Needed adjustments 38Fiscal policy 38Credit policy 40Voluntary adjustments in prices and wages 43Treatment of critical shortages and capacity expansion. 46Selective controls 46Rent control 47Farm price supports 47
III . BASIC OBJECTIVES FOR BALANCED ECONOMIC GROWTH 50
Production objectives 52Mining and manufacturing production 53Agricultural production 54Energy production 54
Investment objectives 55Needed investment in manufacturing 55Needed investment in electric utilities 56Needed investment in mining facilities 56Railroad investment 58
Digitized for FRASER http://fraser.stlouisfed.org/ Federal Reserve Bank of St. Louis
III . BASIC OBJECTIVES FOR BALANCED ECONOMIC GROWTH—Con.
Investment objectives—Continued PageHighways 59Agricultural investment 59Forest investment 60Commercial construction 60
Objectives for consumption and living standards. 61Balancing production and consumption 62
Promoting economic growth 63Research and information 63Financing business expansion 64Promoting competition 65Agricultural growth 66
Conserving and developing the Nation's resources 67Water resources and power 67Land resources 68Forests '. 68Petroleum and other minerals 68The need for program review 69Housing 70Human resources 72
International economic relations 72From inflation to stability 74
Fundamental strength of the economy 74Vulnerability of the economy 75Preventive measures 75
APPENDIXES
A. The Nation's Economic Budget 79B. The Distribution of Family Income, Before and After Federal
Income Tax 91G. Statistical Tables Relating to Employment, Production, and
Purchasing Power 97
VI
Digitized for FRASER http://fraser.stlouisfed.org/ Federal Reserve Bank of St. Louis
I. Economic Trends During 1948THE COURSE OF EMPLOYMENT AND PRODUCTION
Employment
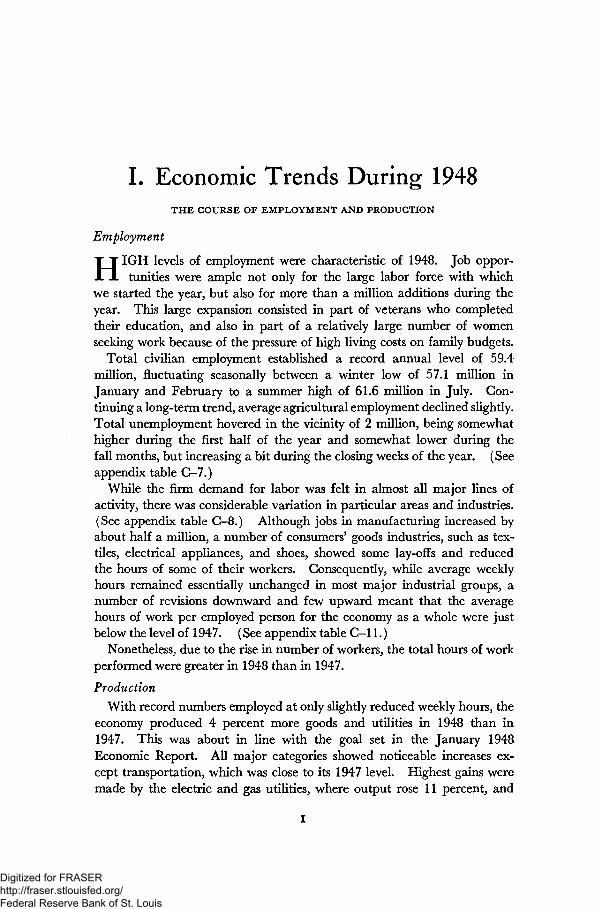
H IGH levels of employment were characteristic of 1948. Job oppor-tunities were ample not only for the large labor force with which
we started the year, but also for more than a million additions during theyear. This large expansion consisted in part of veterans who completedtheir education, and also in part of a relatively large number of womenseeking work because of the pressure of high living costs on family budgets.
Total civilian employment established a record annual level of 59.4million, fluctuating seasonally between a winter low of 57.1 million inJanuary and February to a summer high of 61.6 million in July. Con-tinuing a long-term trend, average agricultural employment declined slightly.Total unemployment hovered in the vicinity of 2 million, being somewhathigher during the first half of the year and somewhat lower during thefall months, but increasing a bit during the closing weeks of the year. (Seeappendix table C-7.)
While the firm demand for labor was felt in almost all major lines ofactivity, there was considerable variation in particular areas and industries.(See appendix table G—8.) Although jobs in manufacturing increased byabout half a million, a number of consumers' goods industries, such as tex-tiles, electrical appliances, and shoes, showed some lay-offs and reducedthe hours of some of their workers. Consequently, while average weeklyhours remained essentially unchanged in most major industrial groups, anumber of revisions downward and few upward meant that the averagehours of work per employed person for the economy as a whole were justbelow the level of 1947. (See appendix table G-l 1.)
Nonetheless, due to the rise in number of workers, the total hours of workperformed were greater in 1948 than in 1947.
Production
With record numbers employed at only slightly reduced weekly hours, theeconomy produced 4 percent more goods and utilities in 1948 than in1947. This was about in line with the goal set in the January 1948Economic Report. All major categories showed noticeable increases ex-cept transportation, which was close to its 1947 level. Highest gains weremade by the electric and gas utilities, where output rose 11 percent, and
Digitized for FRASER http://fraser.stlouisfed.org/ Federal Reserve Bank of St. Louis
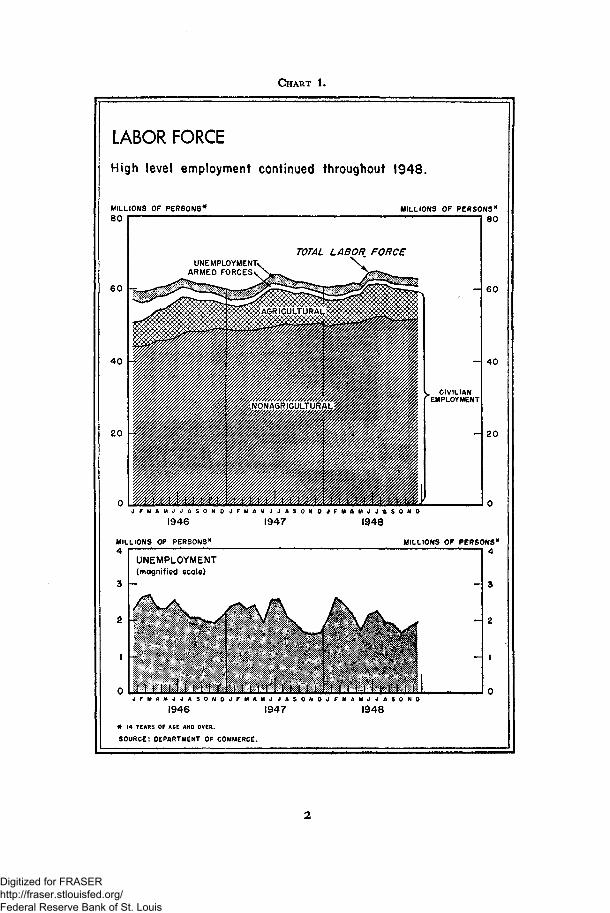
CHART 1.
LABOR FORCEHigh level employment continued throughout 1948.
MILLIONS OF PERSONS*8 0
6 0
MILLIONS OF PERSONS*8 0
TOTAL LABOR FORCEUNEMPLOYMENT.
ARMED FORCES
. CIVILIANEMPLOYMENT
6 0
4 0
2 0
1946
MILLIONS OF PERSONS'*
1947 1948
MILLIONS OF PERSONS*
UNEMPLOYMENT(magnified scale)
N O J F M A M J J A S O N O O F M A M J J A S O N O
1946 1947 1948* 14 YEARS OF AGE AND OVER.
SOURCE: DEPARTMENT OF COMMERCE.
Digitized for FRASER http://fraser.stlouisfed.org/ Federal Reserve Bank of St. Louis
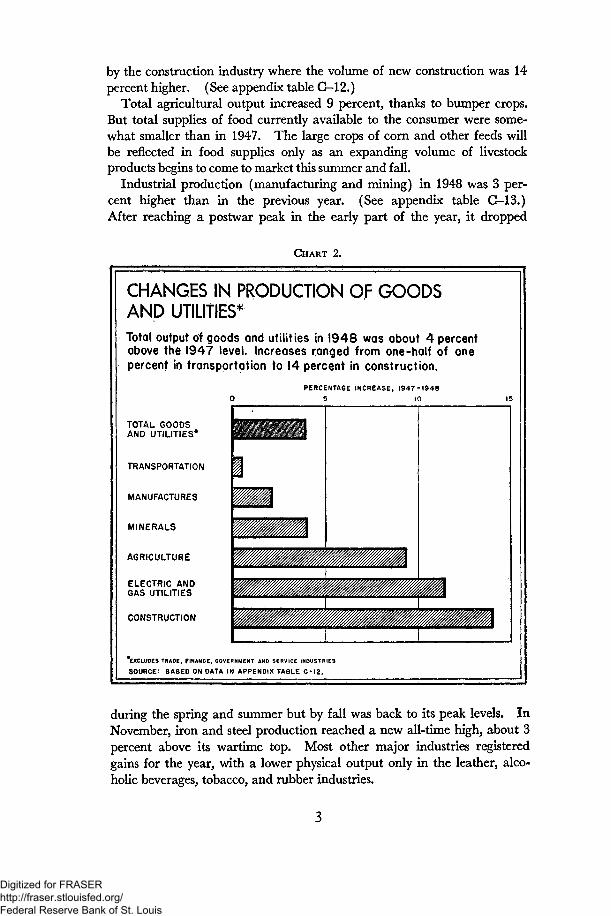
by the construction industry where the volume of new construction was 14percent higher. (See appendix table C-l2.)
Total agricultural output increased 9 percent, thanks to bumper crops.But total supplies of food currently available to the consumer were some-what smaller than in 1947. The large crops of corn and other feeds willbe reflected in food supplies only as an expanding volume of livestockproducts begins to come to market this summer and fall.
Industrial production (manufacturing and mining) in 1948 was 3 per-cent higher than in the previous year. (See appendix table C-l3.)After reaching a postwar peak in the early part of the year, it dropped
CHART 2.
CHANGES IN PRODUCTION OF GOODSAND UTILITIES*Total output of goods and utilities in 1948 was about 4 percentabove the 1947 level. Increases ranged from one-half of onepercent in transportation to 14 percent in construction.
PERCENTAGE INCREASE, 1947-19480 5 10
TOTAL GOODSAND UTILITIES*
TRANSPORTATION
MANUFACTURES
MINERALS
AGRICULTURE
ELECTRIC ANDGAS UTILITIES
CONSTRUCTION
) SERVICE INDUSTRIES"EXCLUDES TRADE, FINANCE, GOVERNMI
SOURCE: BASED ON DATA IN APPENDIX TABLE C-12.
during the spring and summer but by fall was back to its peak levels. InNovember, iron and steel production reached a new all-time high, about 3percent above its wartime top. Most other major industries registeredgains for the year, with a lower physical output only in the leather, alco-holic beverages, tobacco, and rubber industries.
Digitized for FRASER http://fraser.stlouisfed.org/ Federal Reserve Bank of St. Louis
For services (trade, finance, and Government), quantitative measurementof output is difficult. Roughly measured by the volume of employment,the year's total activity in trade increased by about 3 percent, in financeand service by 2 percent, and in government by 4 percent.
With the output of goods up 4 percent, and with employment in servicesup somewhat less, it appears that the total output of goods and servicestogether increased between 3 and 4 percent in 1948.
PRICES, WAGES, AND PROFITS
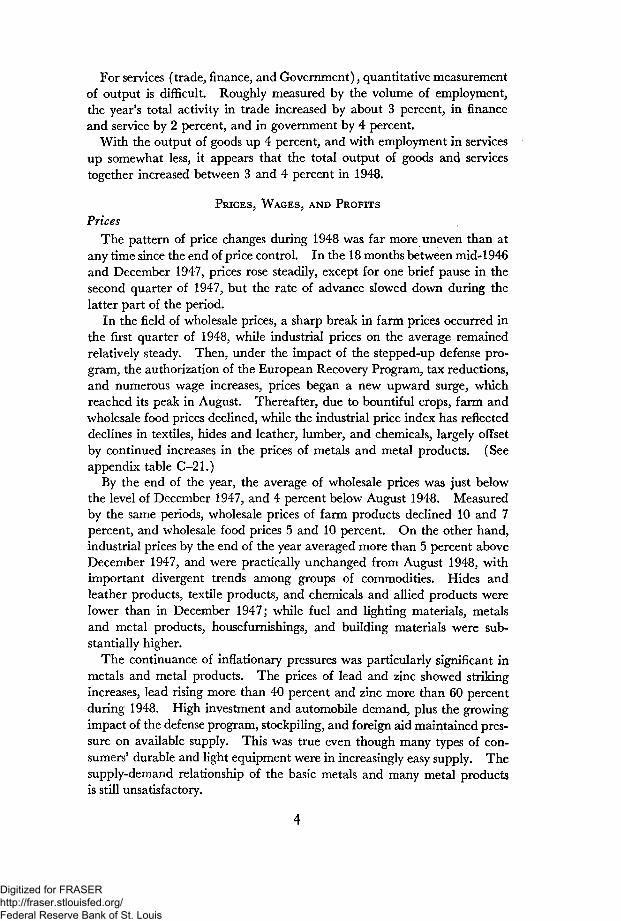
PricesThe pattern of price changes during 1948 was far more uneven than at
any time since the end of price control. In the 18 months between mid-1946and December 1947, prices rose steadily, except for one brief pause in thesecond quarter of 1947, but the rate of advance slowed down during thelatter part of the period.
In the field of wholesale prices, a sharp break in farm prices occurred inthe first quarter of 1948, while industrial prices on the average remainedrelatively steady. Then, under the impact of the stepped-up defense pro-gram, the authorization of the European Recovery Program, tax reductions,and numerous wage increases, prices began a new upward surge, whichreached its peak in August. Thereafter, due to bountiful crops, farm andwholesale food prices declined, while the industrial price index has reflecteddeclines in textiles, hides and leather, lumber, and chemicals, largely offsetby continued increases in the prices of metals and metal products. (Seeappendix table C-21.)
By the end of the year, the average of wholesale prices was just belowthe level of December 1947, and 4 percent below August 1948. Measuredby the same periods, wholesale prices of farm products declined 10 and 7percent, and wholesale food prices 5 and 10 percent. On the other hand,industrial prices by the end of the year averaged more than 5 percent aboveDecember 1947, and were practically unchanged from August 1948, withimportant divergent trends among groups of commodities. Hides andleather products, textile products, and chemicals and allied products werelower than in December 1947; while fuel and lighting materials, metalsand metal products, housefurnishings, and building materials were sub-stantially higher.
The continuance of inflationary pressures was particularly significant inmetals and metal products. The prices of lead and zinc showed strikingincreases, lead rising more than 40 percent and zinc more than 60 percentduring 1948. High investment and automobile demand, plus the growingimpact of the defense program, stockpiling, and foreign aid maintained pres-sure on available supply. This was true even though many types of con-sumers' durable and light equipment were in increasingly easy supply. Thesupply-demand relationship of the basic metals and many metal productsis still unsatisfactory.
Digitized for FRASER http://fraser.stlouisfed.org/ Federal Reserve Bank of St. Louis
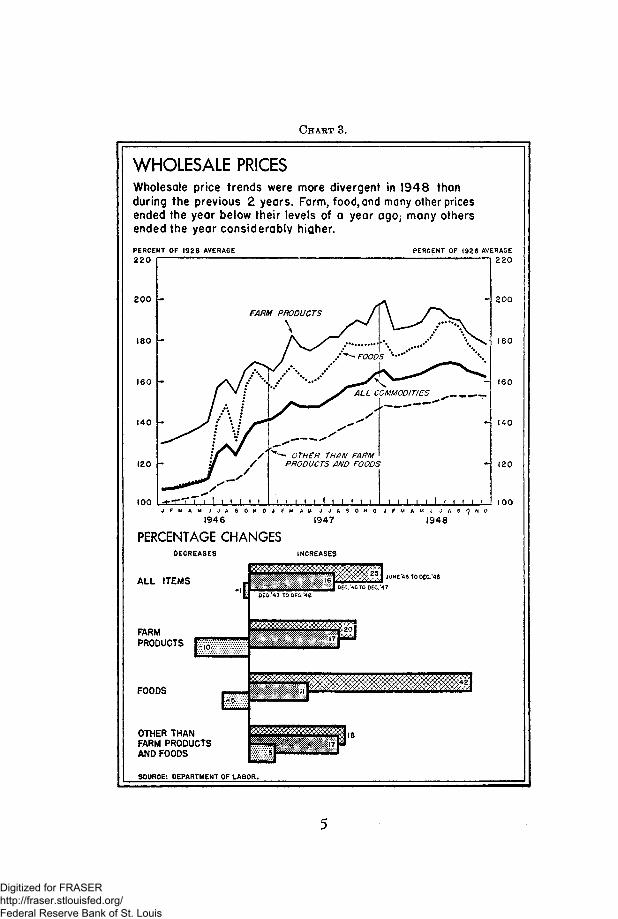
CHART 3.
WHOLESALE PRICESWholesale price trends were more divergent in 1948 thanduring the previous 2 years. Farm, food, and many other pricesended the year below their levels of a year ago; many othersended the year considerably higher.
PERCENT OF 1 9 2 6 AVERAGE
220
2 0 0
180
160
140
(20
100
FARM PRODUCTS
\
A. / V.--
PERCENT OF 1926 AVERAGE220
2 0 0
180
160
1 4 0
120
100
19471946
PERCENTAGE CHANGESDECREASES INCREASES
1948
ALL ITEMS
FARMPRODUCTS
FOODS
OTHER THANFARM PRODUCTSAND FOODS
E:
OEC'47 TO DEC.'48
SOURCE: DEPARTMENT OF LABOR.
Digitized for FRASER http://fraser.stlouisfed.org/ Federal Reserve Bank of St. Louis
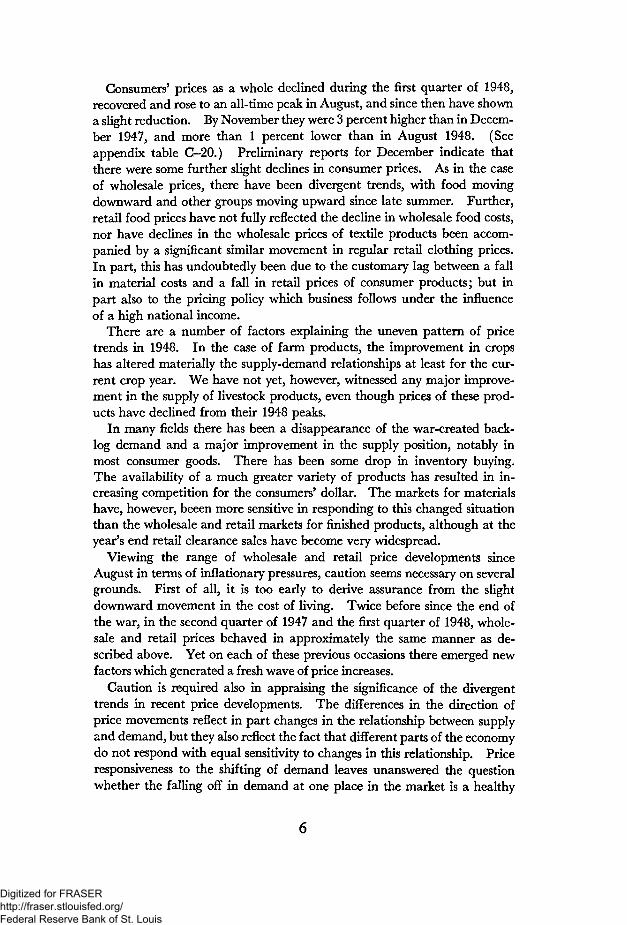
Consumers' prices as a whole declined during the first quarter of 1948,recovered and rose to an all-time peak in August, and since then have showna slight reduction. By November they were 3 percent higher than in Decem-ber 1947, and more than 1 percent lower than in August 1948. (Seeappendix table C-20.) Preliminary reports for December indicate thatthere were some further slight declines in consumer prices. As in the caseof wholesale prices, there have been divergent trends, with food movingdownward and other groups moving upward since late summer. Further,retail food prices have not fully reflected the decline in wholesale food costs,nor have declines in the wholesale prices of textile products been accom-panied by a significant similar movement in regular retail clothing prices.In part, this has undoubtedly been due to the customary lag between a fallin material costs and a fall in retail prices of consumer products; but inpart also to the pricing policy which business follows under the influenceof a high national income.
There are a number of factors explaining the uneven pattern of pricetrends in 1948. In the case of farm products, the improvement in cropshas altered materially the supply-demand relationships at least for the cur-rent crop year. We have not yet, however, witnessed any major improve-ment in the supply of livestock products, even though prices of these prod-ucts have declined from their 1948 peaks.
In many fields there has been a disappearance of the war-created back-log demand and a major improvement in the supply position, notably inmost consumer goods. There has been some drop in inventory buying.The availability of a much greater variety of products has resulted in in-creasing competition for the consumers' dollar. The markets for materialshave, however, beeen more sensitive in responding to this changed situationthan the wholesale and retail markets for finished products, although at theyear's end retail clearance sales have become very widespread.
Viewing the range of wholesale and retail price developments sinceAugust in terms of inflationary pressures, caution seems necessary on severalgrounds. First of all, it is too early to derive assurance from the slightdownward movement in the cost of living. Twice before since the end ofthe war, in the second quarter of 1947 and the first quarter of 1948, whole-sale and retail prices behaved in approximately the same manner as de-scribed above. Yet on each of these previous occasions there emerged newfactors which generated a fresh wave of price increases.
Caution is required also in appraising the significance of the divergenttrends in recent price developments. The differences in the direction ofprice movements reflect in part changes in the relationship between supplyand demand, but they also reflect the fact that different parts of the economydo not respond with equal sensitivity to changes in this relationship. Priceresponsiveness to the shifting of demand leaves unanswered the questionwhether the falling off in demand at one place in the market is a healthy
6
Digitized for FRASER http://fraser.stlouisfed.org/ Federal Reserve Bank of St. Louis
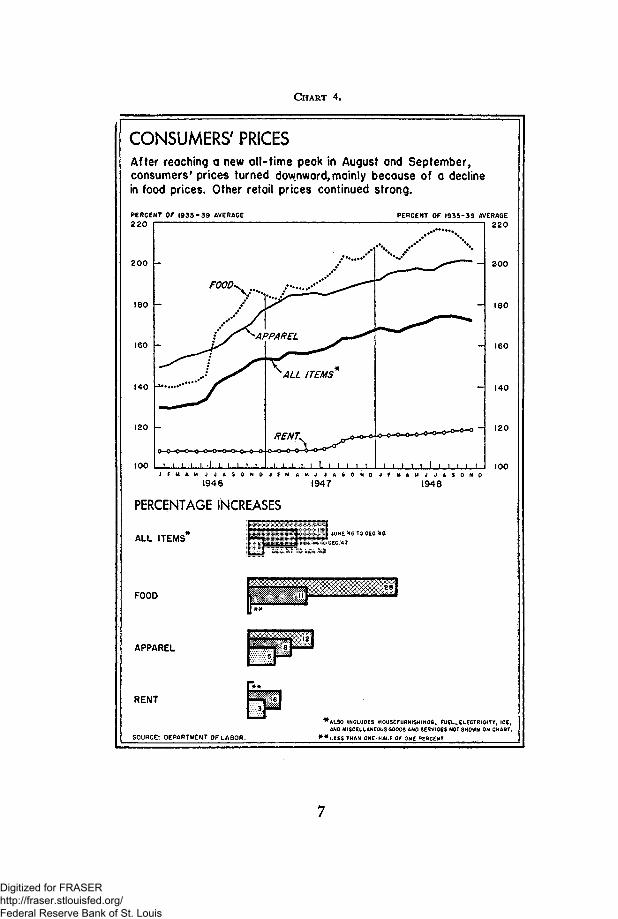
CHART 4.
CONSUMERS' PRICESAfter reaching a new all-time peak in August and September,consumers' prices turned downward, mainly because of a declinein food prices. Other retail prices continued strong.
PERCENT Of ( 935*39 AVERAGE
220
2 0 0
180
160
140
too
PERCENT OF 1935-39 AVERAGE
2 2 0
200
180
160
140
120
100
1946 1947
PERCENTAGE INCREASES
1948
ALL ITEMS
FOOD
APPAREL
RENT
SOURCE: DEPARTMENT OF LABOR.
IE'46 TO OEC'46
ALSO INCLUDES HOUSCFURNISHINGS. fUCL,,ELeCTRIClTY, ICE,ANO MISCELLANEOUS GOODS AND SERVICES NOT SHOWN ON CHART.
* L E S S THAN ONE-HALF OF ONE PERCENT.
Digitized for FRASER http://fraser.stlouisfed.org/ Federal Reserve Bank of St. Louis
reaction to the satisfaction of accumulated needs or an unhealthy reactionto a growing discrepancy between continuing need and declining ability tobuy. In short, we are moving into a period where much more highlyselective efforts will be needed to achieve workable price relationships for themaintenance of economic stability. Analysis shedding light upon thisparamount problem is developed in other sections of this report.
Wages and labor relations
When 1948 opened, most union workers and sizeable groups of nonunionworkers had received two postwar wage increases, and some had receivedthree or more. But these increases, in many instances, had been more thanoffset by rising living costs during the previous 2 years.
The price drop in the commodity markets early in 1948 changed the wageoutlook. A widespread hope was raised that food prices might be reduced,and that there would not be further increases in industrial prices. Underthese circumstances, the major electrical companies maintained a strongstand against wage increases. The United States Steel Corporation rejectedproposals for a substantial increase and moderately reduced the prices of fin-ished steel products, following previous price increases. A number of majorautomobile companies opposed wage increases, and negotiations in someother branches of industry were suspended.
Very quickly, however, the uncertainty engendered by the price breakin the commodity markets was overcome. Price declines in these marketshad not spread, and in fact these markets had partially recovered. Theannouncement of an expanded defense program in late March added newimpetus to inflationary forces. Tax reduction created the expectationof added billions of dollars in the spending stream. Living costs resumedtheir rise, and it appeared that the passing on of wage increases in higherprices leading to even higher profits would continue to be feasible. Withprofit prospects good so long as strikes could be avoided, the stage was setby late May for further wage increases.
Since then, the contracts that have come up for renewal and renegotia-tion have in most cases been peaceably settled. The increases have variedwidely from industry to industry. Although they have ranged from only anegligible increase to as much as 35 cents an hour, a large proportion havebeen in the neighborhood of 10 cents, which represented an average increaseof about 8 percent. Generally, such settlements have tended to reflect therise in the cost of living during the life of the prior contract. It is estimatedthat the annual rate of wage and salary payments by the end of the yearwas 7 to 8 billion dollars above the level that would have prevailed withoutthe rate increases. About one-half of this amount was actually realized byworkers during the year. In addition to the increases in wages, there wassome enlargement of fringe benefits such as health and welfare funds, paidholidays, and paid vacations.
8
Digitized for FRASER http://fraser.stlouisfed.org/ Federal Reserve Bank of St. Louis
After adjusting for price increases, there was no significant change in theaverage weekly earnings of workers in manufacturing industries duringthe year. (See appendix tables C-9 and C-20.) This does not mean, how-ever, that no workers were either better off or worse off at the end of the year.Some have suffered declines in their real earnings, while others have suc-ceeded in keeping ahead of rising living costs. But those who negotiatedwage increases early have seen much of their gains subsequently dissipated byincreases in the cost of living. Prices in manufacturing industry increased,in general, more than the increase in costs, including wages, during the year.In some cases wage increases forced prices up. In other instances theyserved as an excuse for raising prices unnecessarily, thus resulting in evenwider profit margins.
The instances where wage settlements were reached only after prolongednegotiations and strikes were somewhat fewer in 1948 than in 1947. Yetthey were of some significance. In the March-May period, several majorstrikes (affecting coal mining, meat packing, and one large automobilecompany), together with numerous smaller strikes, caused considerableloss of time. Since June, the month-by-month losses directly caused bystrikes have not been more than about one-third of one percent of estimatedavailable working time. A few major stoppages have had sizeable indirecteffects—including those in east and west coast shipping and in trucking inNew York.
While most work stoppages involved wage issues, there were a numberthat stemmed from other considerations. The strike of west coast long-shoremen, for example, was at least made more difficult of solution becauseof the hiring-hall and Communist-affidavit issues. Some other stoppagesarose from grievances not associated with wage questions.
Profits
The achievement of new peak records in production and sales, coupledwith higher prices for manufactured goods, led to a new peak record in thedollar volume of profits (see chart 11). Corporate profits, before taxes, rosefrom 30 billion dollars in 1947 to an estimated 34 billion in 1948; after taxes,corporate profits rose from about 18 billion dollars in 1947 to an estimated21 billion in 1948. In the third quarter of 1948 corporate profits were atthe rate of 35 billion dollars before taxes and 22 billion after taxes. Thenet income of unincorporated business and the professions rose from 24billion dollars to 26 billion, and net farm income, allowing for the largeincrease in farmers' stocks of corn and other crops, rose from almost 16billion dollars to about 18 billion.
Corporate profits after taxes in 1948 represented over 5 percent on salesand about 10 percent on net worth, compared with about 5 percent on salesand about 9.5 percent on net worth in 1947. Since the return on sales appliedto a higher price level than in 1947, net dollar margins per unit of goods soldhave increased. Thus during two years of peak and growing production
Digitized for FRASER http://fraser.stlouisfed.org/ Federal Reserve Bank of St. Louis
there has been little change in over-all profit ratios, and an enlarging phys-ical volume of sales has resulted in enlarged profits, rather than in lowerprofits er unit of goods sold in an expanding market. (See chart 11, page39, and appendix tables O-3 and C-28 through C-33 for data on profits.)
There has been much discussion as to whether the volume of reportedprofits overstates the actual position of business. This point was recognizedin the January 1948 Economic Report, which said: "In appraising profittrends, allowance should be made for the fact that business, like every othergroup, finds that the purchasing power of money has declined considerably.To maintain the same physical volume of inventories requires large addi-tional amounts of capital funds. Furthermore, replacement costs haverisen substantially, while profits are usually calculated by basing depreciationallowances on original costs rather than replacement costs. Although aportion of the large profits earned during 1947 merely compensated forchanges in prices, profits on the whole were above the levels necessary tofurnish incentives and funds for the expansion of business and to promotethe sustained health of the economy."
How applicable is that judgment one year later? A review of the profitsituation shows that corporate profits after taxes in 1948 were 15 percenthigher than in 1947. On the other hand, the total corporate requirementsfor new capital funds were 7 percent lower in 1948 than in 1947 becauseof a considerable decline in the requirements for new working capital.(See appendix table C-34.) The rate of investment in plant and equipmentwas only slightly higher in 1948 than in the second half of 1947, whilethere was an increase in corporate allowances for depreciation. In par-ticular, the need of corporations for additional funds to maintain the samephysical volume of inventories amounted, at an annual rate, to only 1.5billion dollars in the fourth quarter of 1948 compared witfi 3.3 billiondollars for 1948 as a whole and 5.1 billion dollars for 1947. In the light ofthese developments, the conclusion reached last year is still valid.
The foregoing comment should not mask the fact that widely varyingprofit situations and trends exist, and that any proposed policies on thepart of business, labor, and government should take account of these varia-tions. The over-all ratios of profits to sales and net worth have declinedsomewhat for a number of the nondurable goods industries, while the metalindustries have shown increases. And the smallest manufacturing cor-porations, with assets of $250,000 or less, are reporting average profit ratioswell below their 1947 levels, while the largest manufacturing corporations,with assets above $100,000,000, are running well ahead. The intermediategroups are showing profit ratios somewhat below their 1947 levels.
MONEY AND CREDIT
The very large wartime expansion of the public debt led to a greatenlargement of the money supply and of the buying power of the people.
10
Digitized for FRASER http://fraser.stlouisfed.org/ Federal Reserve Bank of St. Louis
The inflationary result of this situation was aggravated after the end ofthe war by the increase of bank credit, which reached dangerous proportionsin the last half of 1947.
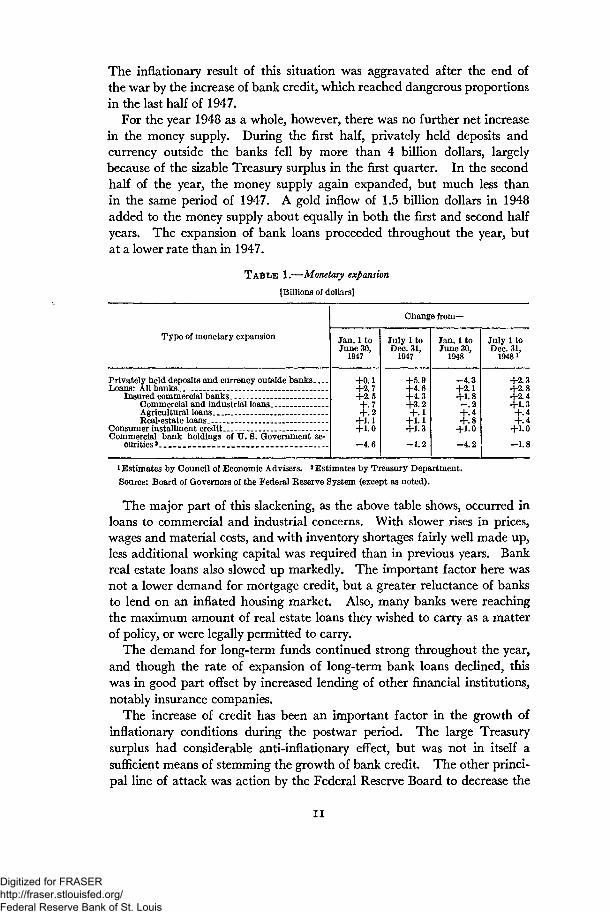
For the year 1948 as a whole, however, there was no further net increasein the money supply. During the first half, privately held deposits andcurrency outside the banks fell by more than 4 billion dollars, largelybecause of the sizable Treasury surplus in the first quarter. In the secondhalf of the year, the money supply again expanded, but much less thanin the same period of 1947. A gold inflow of 1.5 billion dollars in 1948added to the money supply about equally in both the first and second halfyears. The expansion of bank loans proceeded throughout the year, butat a lower rate than in 1947.
T A B L E 1.—Monetary expansion
[Billions of dollars]
Type of monetary expansion
Privately held deposits and currency outside banksLoans: All banks
Insured commercial banks . -Commercial and industrial loans__Agricultural loans -- _- -- --Real-estate loans _
Consumer installment creditCommercial bank holdings of U. S. Government se-
curities3 _ _-
Change from—
Jan. 1 toJune 30,
1947
+0.1+2.7+2.5+.7+.2
+1.1+1.0
-4.6
July 1 toDec. 31,
1947
+5.9+4.6+4.3+3.2+.1
+1.1+1.3
-1.2
Jan. 1 toJune 30,
1948
-4.3+2.1
t1:!+.4+.8
+1.0-4.2
July 1 toDec. 31,
1948 *
+2.3+2.8+2.4
+1 0
-1.8
1 Estimates by Council of Economic Advisers. * Estimates by Treasury Department.Source: Board of Governors of the Federal Reserve System (except as noted).
The major part of this slackening, as the above table shows, occurred inloans to commercial and industrial concerns. With slower rises in prices,wages and material costs, and with inventory shortages fairly well made up,less additional working capital was required than in previous years. Bankreal estate loans also slowed up markedly. The important factor here wasnot a lower demand for mortgage credit, but a greater reluctance of banksto lend on an inflated housing market. Also, many banks were reachingthe maximum amount of real estate loans they wished to carry as a matterof policy, or were legally permitted to carry.
The demand for long-term funds continued strong throughout the year,and though the rate of expansion of long-term bank loans declined, thiswas in good part offset by increased lending of other financial institutions,notably insurance companies.
The increase of credit has been an important factor in the growth ofinflationary conditions during the postwar period. The large Treasurysurplus had considerable anti-inflationary effect, but was not in itself asufficient means of stemming the growth of bank credit. The other princi-pal line of attack was action by the Federal Reserve Board to decrease the
I I
Digitized for FRASER http://fraser.stlouisfed.org/ Federal Reserve Bank of St. Louis
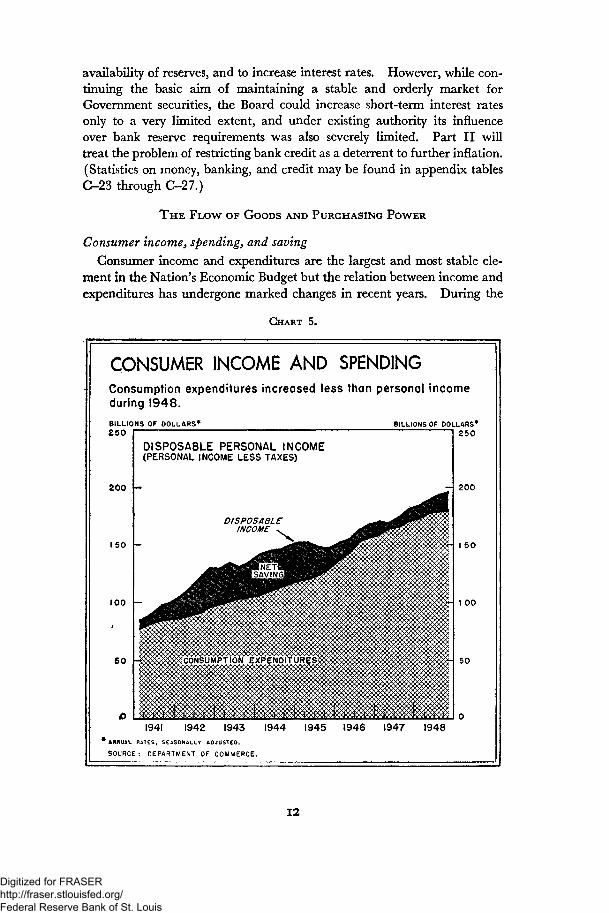
availability of reserves, and to increase interest rates. However, while con-tinuing the basic aim of maintaining a stable and orderly market forGovernment securities, the Board could increase short-term interest ratesonly to a very limited extent, and under existing authority its influenceover bank reserve requirements was also severely limited. Part II willtreat the problem of restricting bank credit as a deterrent to further inflation.(Statistics on money, banking, and credit may be found in appendix tablesC-23 through C-27.)
T H E FLOW OF GOODS AND PURCHASING POWER
Consumer income, spending, and saving
Consumer income and expenditures are the largest and most stable ele-ment in the Nation's Economic Budget but the relation between income andexpenditures has undergone marked changes in recent years. During the
CHART 5.
CONSUMER INCOME AND SPENDINGConsumption expenditures increased less than personal incomeduring 1948.
BILLIONS OF DOLLARS*250
2 0 0
100
60
BILLIONS OF DOLLARS*250
DISPOSABLE PERSONAL INCOME(PERSONAL INCOME LESS TAXES)
DISPOSABLEINCOME
2 0 0
I 50
I 00
1941 1942 1943 1944 1945 1946 1947 1948• AWNBAL RATES, SEASONALLY ADJUSTED.
SOURCE: DEPARTMENT OF COMMERCE.
12
Digitized for FRASER http://fraser.stlouisfed.org/ Federal Reserve Bank of St. Louis

period of wartime shortages and restrictions, consumers spent an unusuallylow portion and saved an unusually high portion of their rapidly increasingincomes. Large backlog demands were built up for all kinds of durablegoods. After 1945, people set about earnestly to raise their levels ofconsumption, and especially sought houses and furnishings, electric appli-ances and automobiles. Despite the high level of incomes, many consumersdrew on wartime savings; others borrowed. The saved portion of personalincome shrank rapidly.
Price and rationing controls were removed before the goods and servicesbecame available to meet this pent-up demand, and prices soared. Indollars, the increase in consumption expenditures since prewar has accountedfor two-thirds of the increase in total gross national expenditure, althoughconsumption expenditures have gone up much less percentagewise thanprivate domestic investment.
During 1948 there were indications that some of the extraordinary con-sumer demands were tapering off. Consumption expenditure ceased to goup faster than disposable personal income. The rapid rate of increase inconsumer credit was slowed. A larger portion of personal income appearedto be going into investment in housing and farms and other unincorpo-rated businesses. And the portion going into personal bank balances,securities, and other liquid assets appeared to have ceased declining.
Consumer income. Aggregate personal income increased continuouslythroughout 1948. For the year as a whole, it amounted to more than 211billion dollars before taxes; in 1947 it was 195 billion. Disposable personalincome (income after taxes) amounted to 190 billion dollars; in 1947 it was174 billion. Adjusted for changes in consumer prices, however, disposablepersonal income per capita was substantially the same for both years.
The increase in personal incomes from 1947 to 1948 was roughly propor-tionate among major sources: wages and salaries, proprietors' and rentalincome, dividends and interest. But in the latter half of 1948 net farmincome fell off, relative to the normal seasonal pattern, while rental incomeof persons and business and professional income ceased to rise. Dividendpayments, on the other hand, increased at an accelerated rate. An ap-preciable decrease occurred during the year in transfer payments toindividuals—chiefly veterans' benefits. (Data relating to personal incomeare shown in appendix tables G-4, G-5, and G-6.)
Income distribution. As compared to prewar, there has been an improve-ment in the real purchasing power of families in all income ranges. Whilethe dollar increases are larger in the higher income groups, percentagewisethe lower-income groups have enjoyed the larger gains. (See table 2 andchart 6.)
Digitized for FRASER http://fraser.stlouisfed.org/ Federal Reserve Bank of St. Louis
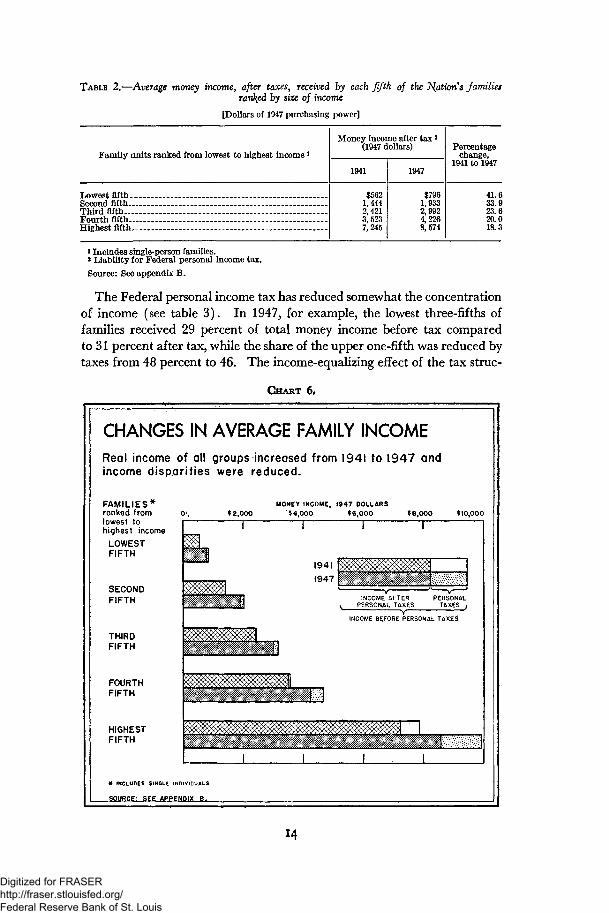
TABLE 2.—Average money income, after taxes, received by each fifth of the Nation's familiesran\ed by size of income
[Dollars of 1947 purchasing power]
Family units ranked from lowest to highest income *
Money income after t ax 3
(1947 dollars)
1941
$5621,4442,4213,5237,245
1947
$7961,9332,9924,2268,574
Percentagechange,
1941 to 1947
41.633.923.620.018.3
Lowest fifth_.Second fifth-Third fifth—.Fourth fifth-Highest fifth..
i Includes single-person families.* Liability for Federal personal income tax.Source: See appendix B .
The Federal personal income tax has reduced somewhat the concentrationof income (see table 3). In 1947, for example, the lowest three-fifths offamilies received 29 percent of total money income before tax comparedto 31 percent after tax, while the share of the upper one-fifth was reduced bytaxes from 48 percent to 46. The income-equalizing effect of the tax struc-
CHART
CHANGES IN AVERAGE FAMILY INCOMEReal income of all groups increased from 1941 to 1947 andincome disparities were reduced.
FAMILIES*ranked fromlowest tohighest income
LOWESTFIFTH
SECONDFIFTH
THIRDFIFTH
FOURTHFIFTH
HIGHESTFIFTH
$2,000MONEY INCOME, 1947 DOLLARS
$4,000 $6,000 $8,000 $10,000
T T
19411947
INCOME AFTERPERSONAL TAXES
* v 'PERSONAL
TAXES j
INCOME BEFORE PERSONAL TAXES
JJ
* INCLUDES SINGLE INDIVIDUALS
SOURCE: SEE APPENDIX B.
Digitized for FRASER http://fraser.stlouisfed.org/ Federal Reserve Bank of St. Louis
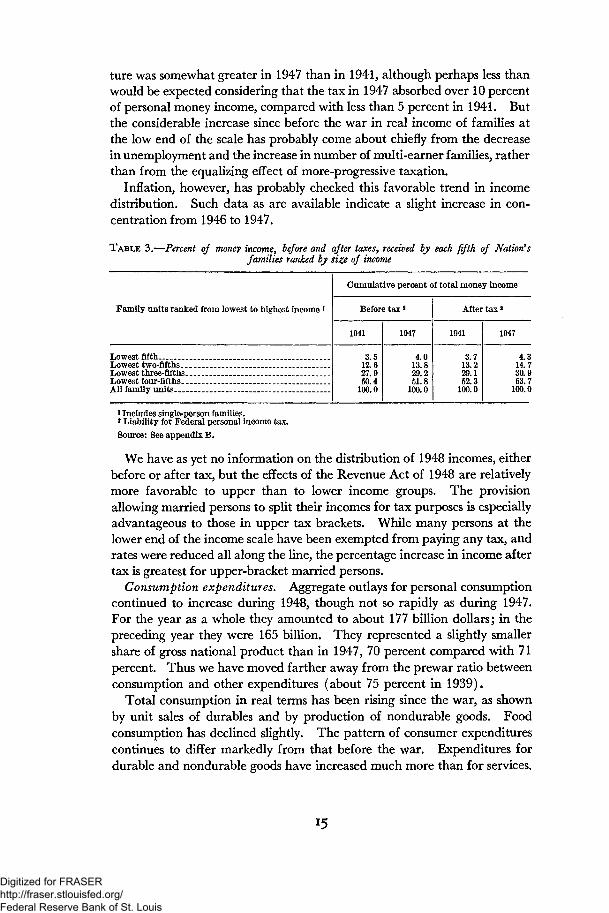
ture was somewhat greater in 1947 than in 1941, although perhaps less thanwould be expected considering that the tax in 1947 absorbed over 10 percentof personal money income, compared with less than 5 percent in 1941. Butthe considerable increase since before the war in real income of families atthe low end of the scale has probably come about chiefly from the decreasein unemployment and the increase in number of multi-earner families, ratherthan from the equalizing effect of more-progressive taxation.
Inflation, however, has probably checked this favorable trend in incomedistribution. Such data as are available indicate a slight increase in con-centration from 1946 to 1947.
T A B L E 3.—Percent of money income, before and after taxes, received by each fifth of Nation'sfamilies ranked by size of income
Family units ranked from lowest to highest income ]
Lowest fifthLowest two-fifthsLowest three-fifthsLowest four-fifthsAll family units
Cumulative percent of total money income
Before tax 2
1941
3.512.627 950.4
100.0
1947
4.013.829.251.8
100.0
After tax a
1941
3.713.229.152.3
100.0
1947
4.314.730.953.7
100.0
1 Includes single-person families.2 Liability for Federal personal income tax.Source: See appendix B .
We have as yet no information on the distribution of 1948 incomes, eitherbefore or after tax, but the effects of the Revenue Act of 1948 are relativelymore favorable to upper than to lower income groups. The provisionallowing married persons to split their incomes for tax purposes is especiallyadvantageous to those in upper tax brackets. While many persons at thelower end of the income scale have been exempted from paying any tax, andrates were reduced all along the line, the percentage increase in income aftertax is greatest for upper-bracket married persons.
Consumption expenditures. Aggregate outlays for personal consumptioncontinued to increase during 1948, though not so rapidly as during 1947.For the year as a whole they amounted to about 177 billion dollars; in thepreceding year they were 165 billion. They represented a slightly smallershare of gross national product than in 1947, 70 percent compared with 71percent. Thus we have moved farther away from the prewar ratio betweenconsumption and other expenditures (about 75 percent in 1939).
Total consumption in real terms has been rising since the war, as shownby unit sales of durables and by production of nondurable goods. Foodconsumption has declined slightly. The pattern of consumer expenditurescontinues to differ markedly from that before the war. Expenditures fordurable and nondurable goods have increased much more than for services.
Digitized for FRASER http://fraser.stlouisfed.org/ Federal Reserve Bank of St. Louis
Outstanding is the purchase of automobiles, expenditure for which con-tinues to increase faster than for almost any other major type of purchase.The increase in other durable goods expenditure appears to have tapered off.
In the case of nondurable goods, the higher level of food outlays is thechief factor in the great increase since prewar; higher clothing expendituresis second in importance. Spending for both these items, however, has goneup less than proportionately to total consumer expenditure during 1948.
The less-than-average increase since before the war in spending forservices reflects the relatively low level of rents, and of outlays for householdoperation, in which utilities and domestic service are the largest items.During 1948, expenditures for services increased about as rapidly as fordurable goods.
Saving and consumer credit. The percentage of disposable income notspent for consumption was higher in 1948 than in 1947, contrary to thetrend ever since the war. This additional personal saving, however, ispredominantly in the form of investment in family dwellings, farms (andfarm inventories), and other unincorporated businesses. The rate of indi-viduals' net saving in liquid form—bank deposits, savings and loan asso-ciations, insurance policies, and government and corporate securities, lessnet personal borrowing—continued to decrease at least through the firsthalf of 1948. This was in accordance with the trend reported in the Januaryand midyear reports for 1948.
Preliminary data on net liquid saving in the third quarter of the yearsuggest that this downward trend may have been checked, but show nosubstantial reversal of the trend. There appeared to be an increased flowof funds into personal checking accounts and United States savings bondsand a smaller flow into corporate securities than had occurred earlier in theyear. The high level of liquid saving in the third quarter probably camein part from many consumers not spending the money they received as aresult of the reduction of income taxes.
Few recent data are available on the relative volumes of gross saving anddissaving by individuals. The most recent figures on consumer credit showa slower rate of expansion of installment credit last fall than in the fall of1947.
The use of consumer credit, greatly cut down during the war, expandedrapidly after wartime controls were removed and when durable goods be-came available. While the current volume of consumer credit—16 billiondollars at the end of 1948—is substantially larger than anything we haveknown before, nevertheless in comparison with present income and vol-ume of retail sales it is lower than in many prewar years. For example,the amount of consumer credit outstanding at the end of 1939 was nearly12 percent of consumption expenditures during the year; in 1948 it was onlyabout 9 percent. (See appendix table C-23.)
16
Digitized for FRASER http://fraser.stlouisfed.org/ Federal Reserve Bank of St. Louis
Nonetheless, the great expansion in consumer credit after the war unques-tionably added appreciably to inflationary pressure in the economy, and itwas for this reason that Regulation W restricting its use was reinstated lastSeptember. It is not yet possible to determine to what extent this reimpo-sition of control was responsible for the recen* slowing of the increase involume of consumer credit. However, Regulation W probably has tendedto restrict additional instalment credit for certain purposes, including thepurchase of automobiles and some other durable goods.
Outlook for consumption and saving. The limited and imperfect dataon consumer income, expenditure, and saving give an incomplete picture.They indicate that many consumers have been spending less freely, especiallyduring the latter part of 1948. This appears to reflect three developments:(1) a substantial fulfillment of backlog demands for many goods that con-sumers had not been able to get during the war; (2) a limitation of con-sumption by those for whom investment in homes and in private businesseshas become a more urgent use of funds; and (3) the using up of past savingsand feasible credit resources by people who have been unable to make endsmeet during inflation. All three elements are implied, but withoutadequate basis for appraising their relative importance.
Such a picture reinforces the concern expressed in previous reports thatwe are still far from obtaining the amount and distribution of consumerincome in relation to the other component parts of the economy whichseem essential for balanced economic growth.
Business investment and finance
The high investment outlays of business during the past two years havecontributed an unusually large portion of the total flow of spending. Thishas been a natural aftermath of the wartime deferral of most lines of facili-ties expansion and improvement, accompanied by acute depletion of in-ventories. To undertake this investment, business emerged from the warwith large accumulated reserves of liquid assets, elaborate postwar plans,and a relatively reduced burden of debt charges.
In many fields, including nearly all nondurable goods lines, the expan-sion of capacity to catch up with postwar markets, the replenishment ofinventories, and the reduction of order backlogs to reasonably normal pro-portions has now been accomplished; further investment will take largelythe form of cost-cutting improvements and new products. In a few im-portant industries, expansion of facilities and inventories has still not over-taken obvious current needs.
Plant and equipment outlays. Total nonfarm business outlays on newplant and equipment rose rapidly after the war to reach an annual rateof 18.2 billion dollars in the latter half of 1947. Thereafter they increasedonly slightly, with a seasonal dip in the first quarter of last year. The
Digitized for FRASER http://fraser.stlouisfed.org/ Federal Reserve Bank of St. Louis
continued rise has been due entirely to rising construction costs and equip-ment prices; the physical volume of such investment has not quite main-tained its late 1947 peak. (See appendix table G-15.)
A recent sample survey by Government agencies indicates that dollaroutlays on plant and equipment in the first quarter of 1949 are expectedto run about 12 percent below those of the fourth quarter of 1948, whichis roughly in line with normal seasonal behavior. Compared with thefirst quarter of last year, planned outlays for the first quarter of this yearare up about 5 percent, which is substantially less than the increase incosts in the interval.
Plant and equipment outlays during and since the war have greatlyexpanded productive capacity in many industries. A survey by a privateagency indicates that manufacturing industry as a whole has increased itscapacity by more than one half since 1939 and by perhaps as much as aquarter since the end of 1945. To keep pace with a normal growth trendin total demand, as will be indicated in Part III , the recent over-all rate ofincrease in manufacturing capacity would not need to be maintained indefi-nitely. However, in connection with two prominent areas of current short-age, it should be noted that electric utility generating capacity has increasedonly about 45 percent since 1939 and 12 percent in the past three years,and steel furnace capacity about 16 percent since 1939 and about 3 5/2 per-cent in the past three years.
While there is some indication of prospective softening of investmentin various manufacturing lines, plans for expansion and modernization arestill strong in chemicals, petroleum, and metals. In some major nonmanu-facturing lines also—particularly utilities and transportation—the programof expansion and improvement is still active, and the outlook is for continuedhigh expenditure. It is quite possible that investment in utilities and trans-portation may rise still further, to the extent that increases in the supplyof steel and essential equipment items are not absorbed by other private orpublic investment programs.
The fact that many expansion goals have been met should not portend,therefore, an abrupt slackening of investment. Higher materials and laborcosts and a sharpening of competitive pressure have provided powerfulincentives for modernization programs designed to cut costs. Many business-men feel that they must devote all available funds to improvements of thistype in order to preserve their competitive position.
Business investment has entered a phase in which added investment willbe largely determined by the effort to reduce costs and to improve product,rather than by the purpose to expand capacity. Recent surveys in themetal-working and other industries indicate that equipment is being replacedonly when the replacement will pay off in 4 or 5 years, or in many cases aneven shorter time. Considerably longer pay-off periods would be consistentwith reasonable investment incentives.
Digitized for FRASER http://fraser.stlouisfed.org/ Federal Reserve Bank of St. Louis
Business inventories. Of the 6.7 billion dollar increase in value of non-farm business inventories during 1948, 4.1 billion was attributable to pricerises. Adjusting for these rises, the physical increase during the year wasonly 2.6 billion dollars, which was registered largely in the first quarter.In the second half, total nonfarm inventories increased only 0.8 billiondollars after allowance for price rises and normal seasonal variation. (Seeappendix tables C-16, G-17, and C-18 for additional inventory data.)
In the summer and fall, some accumulation of nondurable products in-ventories in the hands of both manufacturers and distributors reflectedfailure of sales to meet earlier expectations. Inventory policies were cau-tious, and adjustments were initiated fairly promptly. Present inventoriescould become burdensome in a period of falling sales.
The dollar value of durable-goods inventories rose rather steadily throughthe year. Restocking after wartime shortages appears now to have beenvirtually completed except for metals and some building materials.
Over-all ratios of inventories to sales remained roughly constant in 1948,and there appears to be no basis for substantial further increases. Anygeneral slackening of sales would produce temporary involuntary accumu-lation followed by sloughing off of excess inventories. This occurred insome sectors of business in early 1947 and again in 1948, but has not ap-peared on a general scale since the war.
Corporate financing. Total corporate expenditure on plant and equip-ment and for expansion of inventories and customer receivables was 26billion dollars in 1948, or 2 billion dollars less than in 1947. A rise in plantand equipment expenditures was more than offset by the decline in fundsused to extend credit to customers, and to finance additional investment ininventories. (See chart 15 on page 64 and appendix table C-34.)
The major part of capital funds in 1948, as in 1947, came from internalsources, chiefly undistributed profits and depreciation allowances. Internalsources provided 65 percent of corporate funds in 1948, compared with 53percent in the previous year. The rise in the importance of internal financ-ing in 1948 was due to a higher level of corporate profits and a less-than-equivalent increase in dividends. Corporate profits after taxes totaledabout 21 billion dollars, 15 percent more than in 1947. During the pastyear corporations paid out 36 percent of their profits in dividends, comparedwith 38 percent in 1947.
In external financing, security issues played a more important and bankloans a less important role than in 1947. In the first half of 1948, for thefirst time since the war, outstanding business bank loans declined slightly;and in the second half of the year, though such loans showed a seasonal in-crease, the increase was much smaller than in the corresponding period of1947. The bulk of the new security issues were bonds; stock issues wereresponsible for only about 19 percent of the total volume, compared with30 percent in 1947.
Digitized for FRASER http://fraser.stlouisfed.org/ Federal Reserve Bank of St. Louis
One reason for the higher percentage of bond financing in 1948 was thatpublic utility financing occupied a relatively more important position in thetotal volume of security issues. Companies in this industry usually raise ahigh proportion of their capital through bonds. Another important factorin the high proportion of debt financing in the whole postwar period, andespecially in recent months, has been its low cost relative to financing bystock issues. The spread between bond and stock yields was considerableduring the whole period and has further increased in recent months. An-other general factor which has favored debt financing is the tax advantage;interest payments are deductible expenses in computing taxable income.
The small amount of common stock issued in recent years, compared withthe late 1920's, has given rise to concern in some quarters that there is aserious general shortage of equity capital. While it is true that outsideequity capital is difficult to obtain on terms as favorable as those availablefor loan capital, it does not appear that, so long as profits remain large, therewill be any general lack of sufficient total equity capital for desirable levelsof business investment. Although detailed figures for the 1920's are notavailable, preliminary investigations show that a markedly smaller percent-age of business capital needs has been financed by debt in the postwar periodthan was the case in the 1920's.
Housing. The volume of residential construction accelerated rapidlyafter the war. (See appendix table C-14.) From a low of about 142,000in 1944, the number of permanent nonfarm units started in new structuresrose to an estimated 925,000 in 1948. Adding to this the units providedby conversions and remodeling, it appears that well over a million com-pleted residential units were added to the housing supply in 1948. Theprovision of adequate plumbing, heating, and other facilities and of majorrepairs further increased the availability of dwellings meeting a reasonablestandard of comfort.
In the latter half of 1948, however, there appeared a pronounced declinein new housing starts. (See chart 16 on page 70.) This does not mean thatthe housing shortage is no longer acute. Instead, as previous reportsclearly foresaw, it reflected the approaching saturation of the housing marketrelated to the demands of families who can buy or rent expensive quarters,and the inability of the industry thus far to produce housing in quantity forthe bulk of the population whose incomes are moderate or low. It nowtakes the average home owner about one-third more of his working time toearn the money to pay for a comparable house #than it took before WorldWar I, and about one-fifth more than in 1925-29. Neither food nor cloth-ing nor any of the other necessities of life has risen comparably to the cost ofbuilding houses over the past two or three decades.
From the strictly economic viewpoint, we cannot be complacent aboutthe rapid decline in housing starts on the ground that the manpower andother resources thereby released are being absorbed by the other demands
20
Digitized for FRASER http://fraser.stlouisfed.org/ Federal Reserve Bank of St. Louis
of the economy; for some of these other demands are temporary in char-acter and within a few years will need to be supplanted by a much largervolume of residential construction than can be supported at anywhere nearpresent costs. In fact, if the rate of decline in house building continues,its ramifying effects could cause substantial unemployment and generaldeterioration in business conditions even before the temporary factors inpostwar demand are reduced.
The need for a comprehensive housing program in its fundamental aspectsis treated in Part III .
International transactions
The only major component of the Nation's Economic Budget which didnot increase between 1947 and 1948 was net foreign investment; it de-clined from 8.9 billion dollars to approximately 1.8 billion. Net foreigninvestment represents the portion of our excess of exports over imports ofgoods and services that is financed by loans and investments and by netliquidation of foreign dollar assets and gold. It does not include the portionfinanced by grants, gifts and other unilateral transfers made by the UnitedStates Government and by private citizens. Part of the drastic decline innet foreign investment has resulted merely from a shift in the form offoreign aid from loans to grants, the increase in which is reflected in theGovernment-goods-and-services component of the Nation's EconomicBudget.
Decline in the export surplus. To appraise the effect of internationaltransactions upon the domestic economy, it is necessary to examine thetotal export surplus, which takes into account government grants andprivate gifts as well as net foreign investment. The total export surplusfell from 11.3 billion dollars in 1947 to 6.5 billion in 1948, a decline of4.8 billion. This decline began in mid-1947, after the export surplus hadreached an annual rate of 12.5 billion, and continued through the autumnof 1948, when it was only 5.2 billion.
The 4.8 billion dollar decline in the export surplus was primarily theresult of a 3.4 billion dollar reduction in the liquidation of gold and dollarassets by foreign countries, made necessary by the rapid depletion of theseassets in 1947. Aid extended by the United States Government also wasless than in 1947. Although the European Recovery Program got underway during 1948, aid extended under early postwar programs was virtuallyexhausted early in the year. These changes are shown in table 4, anddetails of the balance of international payments and the foreign aid programare shown in appendix tables G-35 and C-36.
21
Digitized for FRASER http://fraser.stlouisfed.org/ Federal Reserve Bank of St. Louis
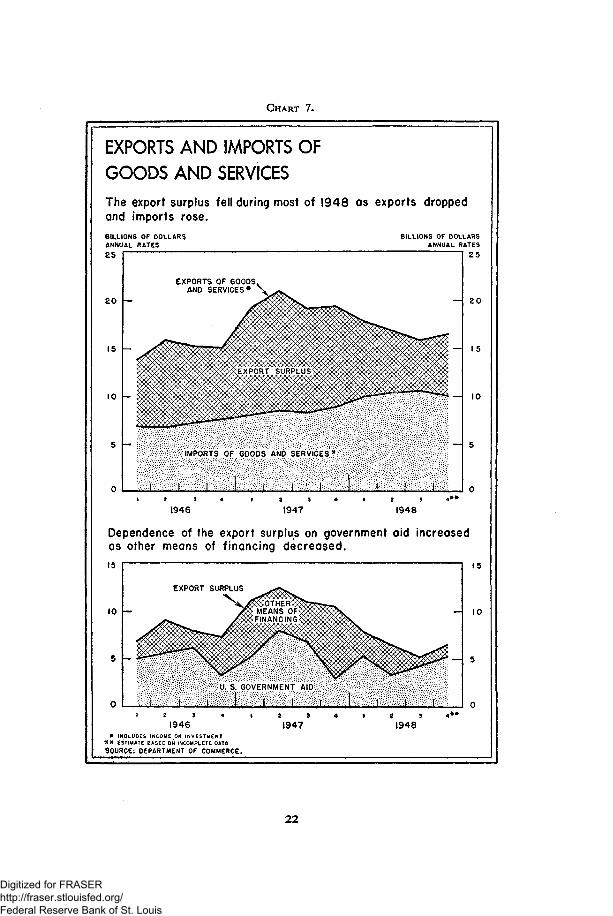
CHART 7.
EXPORTS AND IMPORTS OFGOODS AND SERVICESThe export surplus fell during most of 1948 as exportsand imports rose.
BILLIONS OF DOLLARSANNUAL RATES
25
20
15
10
5
0
EXPORTS OF GOODS.AND SERVICES* \ ^ s .
1 2 3 4 f 2 3 4 1
1946 1947
Dependence of the export surplus on governmentas other means of financing decreased.
15
10
5
0
EXPORT SURPLUS ^ $ ^
- y^EA^SOF^^^V
U S . GOVERNMENT AID
.. i ) . . . . ) 1 . \ I . r . 1 t1 2 3 4 I 2 5 4 1
1946 1947* INCLUDES INCOME ON INVESTMENT
# * ESTIMATE BASED ON INCOMPLETE DATA
SOURCE: DEPARTMENT OF COMMERCE.
dropped
BILLIONS OF DOLLARSANNUAL RATES
:•;•.VV-V .vv.-..';.
• • • . • • . • . • • ; • • . • • . • • . • • • • • • : • • • • • •
2 3
1948
-
us4 * *
25
2 0
15
10
5
0
aid increased
t .
Z 3
1948
—
I
15
10
5
O
4 * *
22
Digitized for FRASER http://fraser.stlouisfed.org/ Federal Reserve Bank of St. Louis
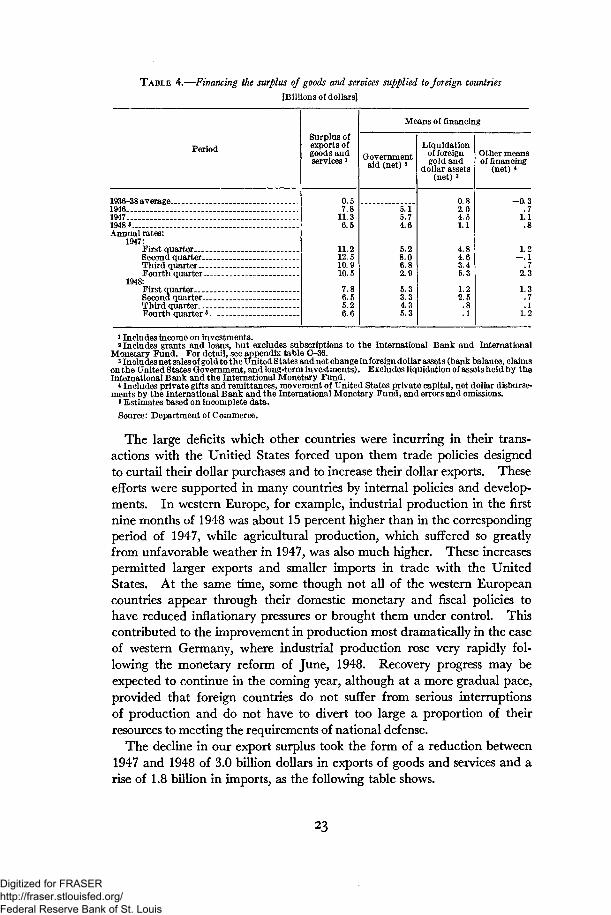
TABLE 4.—Financing the surplus of goods and services supplied to foreign countries[Billions of dollars]
PeriodSurplus ofexports ofgoods andservices l
Means of financing
Governmentaid (net) *
Liquidationof foreigngold and
dollar assets(net) 3
Other meansof financing
(net) *
1936-38 average19461947.1948»Annual rates:
1947:First quarterSecond quarter-Third quarterFourth quarter.—
1948:First quarterSecond quarter...Third quarterFourth quarter5.
0.57.8
11.36.5
11.212.510.910.57.86.55.26.6
5.15.74.6
5.28.06.82.9
5.33.34.35.3
0.82.04.51.1
4.84.63.45.3
1.22.5.8.1
-0.3.7
1.1
1.2- . 1
.72.3
1.3.7.1
1.2
1 Includes income on investments.2 Includes grants and loans, but excludes subscriptions to the International Bank and International
Monetary Fund. For detail, see appendix table C-36.3 Includes net sales of gold to the United States and net change in foreign dollar assets (bank balance, claims
on the United States Government, and long-term investments). Excludes liquidation of assets held by theInternational Bank and the International Monetary Fund.
* Includes private gifts and remittances, movement of United States private capital, net dollar disburse-ments by the International Bank and the International Monetary Fund, and errors and omissions.
* Estimates based on incomplete data.Source: Department of Commerce.
The large deficits which other countries were incurring in their trans-actions with the Unitied States forced upon them trade policies designedto curtail their dollar purchases and to increase their dollar exports. Theseefforts were supported in many countries by internal policies and develop-ments. In western Europe, for example, industrial production in the firstnine months of 1948 was about 15 percent higher than in the correspondingperiod of 1947, while agricultural production, which suffered so greatlyfrom unfavorable weather in 1947, was also much higher. These increasespermitted larger exports and smaller imports in trade with the UnitedStates. At the same time, some though not all of the western Europeancountries appear through their domestic monetary and fiscal policies tohave reduced inflationary pressures or brought them under control. Thiscontributed to the improvement in production most dramatically in the caseof western Germany, where industrial production rose very rapidly fol-lowing the monetary reform of June, 1948. Recovery progress may beexpected to continue in the coming year, although at a more gradual pace,provided that foreign countries do not suffer from serious interruptionsof production and do not have to divert too large a proportion of theirresources to meeting the requirements of national defense.
The decline in our export surplus took the form of a reduction between1947 and 1948 of 3.0 billion dollars in exports of goods and services and arise of 1.8 billion in imports, as the following table shows.
Digitized for FRASER http://fraser.stlouisfed.org/ Federal Reserve Bank of St. Louis
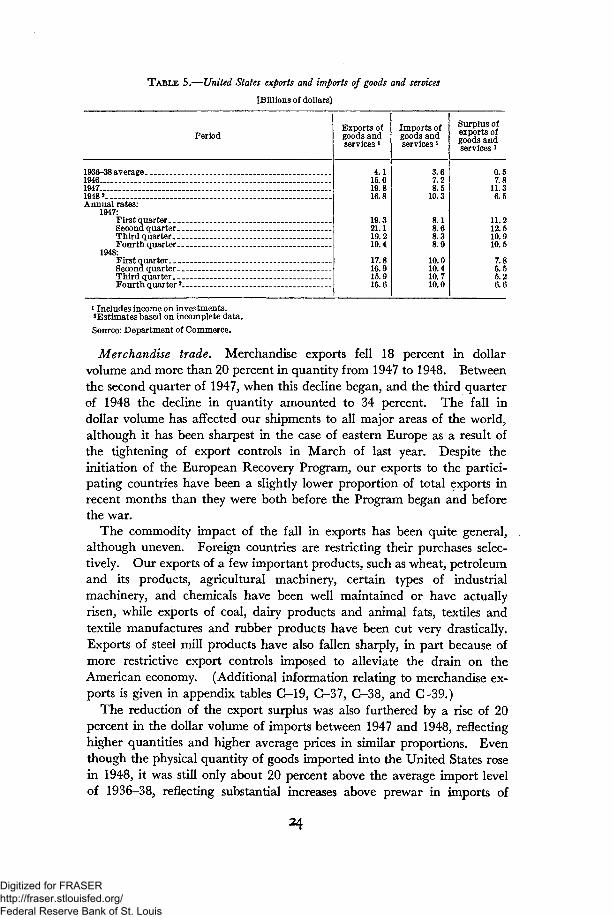
TABLE 5.—United States exports and imports of goods and services
[Billions of dollars]
PeriodExports ofgoods andservices *
4.115.019.816.8
19.321.119.219.4
17.816.915.916.6
Imports ofgoods andservices *
3.67.28.5
10.3
8.18.68.38.9
10.010.410.710.0
Surplus ofexports ofgoods andservices *
1936-38 average1946 —1947 -19483 - —Annual rates:
1947:First quarterSecond quarter-Third quarter ._Fourth quarter..
1948:First quarterSecond quarter.Third quarter. _Fourth quarter2
0.57.8
11.36.5
11.212.510.910.5
7.86.55.26.6
1 Includes income on investments.2Estimates based on incomplete data.
Source: Department of Commerce.
Merchandise trade. Merchandise exports fell 18 percent in dollarvolume and more than 20 percent in quantity from 1947 to 1948. Betweenthe second quarter of 1947, when this decline began, and the third quarterof 1948 the decline in quantity amounted to 34 percent. The fall indollar volume has affected our shipments to all major areas of the world,although it has been sharpest in the case of eastern Europe as a result ofthe tightening of export controls in March of last year. Despite theinitiation of the European Recovery Program, our exports to the partici-pating countries have been a slightly lower proportion of total exports inrecent months than they were both before the Program began and beforethe war.
The commodity impact of the fall in exports has been quite general,although uneven. Foreign countries are restricting their purchases selec-tively. Our exports of a few important products, such as wheat, petroleumand its products, agricultural machinery, certain types of industrialmachinery, and chemicals have been well maintained or have actuallyrisen, while exports of coal, dairy products and animal fats, textiles andtextile manufactures and rubber products have been cut very drastically.Exports of steel mill products have also fallen sharply, in part because ofmore restrictive export controls imposed to alleviate the drain on theAmerican economy. (Additional information relating to merchandise ex-ports is given in appendix tables C-19, C-37, C-38, and C-39.)
The reduction of the export surplus was also furthered by a rise of 20percent in the dollar volume of imports between 1947 and 1948, reflectinghigher quantities and higher average prices in similar proportions. Eventhough the physical quantity of goods imported into the United States rosein 1948, it was still only about 20 percent above the average import levelof 1936-38, reflecting substantial increases above prewar in imports of
Digitized for FRASER http://fraser.stlouisfed.org/ Federal Reserve Bank of St. Louis
crude materials and semimanufactured goods, but no increase in imports offoods and finished manufactures. Our demand for some commodities fromabroad can now be fully met, but our greatly enlarged need for many othersremains far from satisfied. Further increases are to be expected andwelcomed in a prosperous economy. (For additional information regardingthe source and character of our merchandise imports see appendix tablesC-40, C-41, and 0 4 2 . )
European Recovery Program. Last spring Congress provided 5 billiondollars for the European Recovery Program, including a public debt authori-zation of 1 billion dollars. The 4 billion dollars of appropriated funds wereto be used over the 15-month period ending June 30, 1949, unless thePresident, after recommendation by the Administrator for Economic Coop-eration, found it necessary to use them in 12 months. After a careful reviewit was decided in November that this more rapid use of the funds would benecessary. By the end of 1948, after the Program had been in operation ninemonths, procurement of 4 billion dollars had been authorized. At the out-set of the program these authorizations were primarily for food and agricul-tural commodities, but the emphasis has been shifting away from these com-modities toward an increasing proportion of industrial products, especiallymachinery and equipment. In the case of certain products for which thedomestic market situation is tight, a major share of authorizations has beenfor procurement outside the United States. Through November 1948 such"offshore" procurement has constituted 40 percent of the total for all com-modities and much larger proportions for petroleum products, nonferrousmetals, fertilizer, and some other products.
The procurement of such commodities in other countries relieves theUnited States of the burden of supplying them. But the exporting countriesreceive dollars in payment and, with some exceptions, they may be expectedto spend those dollars in the United States. To the extent that they do,offshore procurement will affect the distribution rather than the totalamount of foreign purchases in the United States.
As shipments under the European Recovery Program increase, the declinein United States exports may be expected, on the basis of existing programs,to give way to a rise from the levels reached in the second half of 1948. Ifthe expansion in imports continues, as there is reason to expect, any rise ofthe export surplus will be moderate.
Government transactions
Needs engendered by war and its aftermath of international tensioncontinued during 1948 to overshadow the civil programs of government andto exert crucial influence throughout the economy. It was necessary tohold back government programs urgently needed for peacetime growth andprogress, while extraordinary activities to meet world responsibilities pro-longed and strengthened the general forces of inflation. The enlargedexpenditures for national security and foreign aid authorized in 1948 will
25
Digitized for FRASER http://fraser.stlouisfed.org/ Federal Reserve Bank of St. Louis
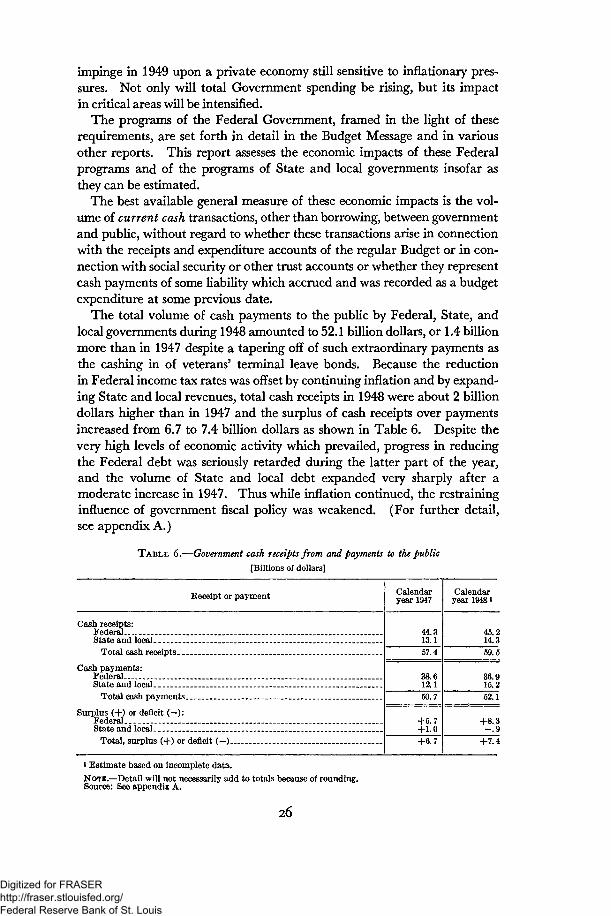
impinge in 1949 upon a private economy still sensitive to inflationary pres-sures. Not only will total Government spending be rising, but its impactin critical areas will be intensified.
The programs of the Federal Government, framed in the light of theserequirements, are set forth in detail in the Budget Message and in variousother reports. This report assesses the economic impacts of these Federalprograms and of the programs of State and local governments insofar asthey can be estimated.
The best available general measure of these economic impacts is the vol-ume of current cash transactions, other than borrowing, between governmentand public, without regard to whether these transactions arise in connectionwith the receipts and expenditure accounts of the regular Budget or in con-nection with social security or other trust accounts or whether they representcash payments of some liability which accrued and was recorded as a budgetexpenditure at some previous date.
The total volume of cash payments to the public by Federal, State, andlocal governments during 1948 amounted to 52.1 billion dollars, or 1.4 billionmore than in 1947 despite a tapering off of such extraordinary payments asthe cashing in of veterans' terminal leave bonds. Because the reductionin Federal income tax rates was offset by continuing inflation and by expand-ing State and local revenues, total cash receipts in 1948 were about 2 billiondollars higher than in 1947 and the surplus of cash receipts over paymentsincreased from 6.7 to 7.4 billion dollars as shown in Table 6. Despite thevery high levels of economic activity which prevailed, progress in reducingthe Federal debt was seriously retarded during the latter part of the year,and the volume of State and local debt expanded very sharply after amoderate increase in 1947. Thus while inflation continued, the restraininginfluence of government fiscal policy was weakened. (For further detail,see appendix A.)
TABLE 6.—Government cash receipts from and payments to the public[Billions of dollars]
Receipt or payment
Cash receipts:FederalState and local
Total cash receipts
Cash payments:Federal _ _. _State and local. _ _ _
Total cash payments _.
Surplus (+) or deficit (—):Federal. _ _._State and local-. _
Total, surplus (+) or deficit ( - ) _
Calendaryear 1947
44.313.157.4
38.612.150.7
+5.7+1.0+6.7
Calendaryear 19481
45.214.359.5
36.915.252.1
+8.3- . 9
+7.4
i Estimate based on incomplete data.NOTE.—Detail will not necessarily add to totals because of rounding.Source: See appendix A.
26
Digitized for FRASER http://fraser.stlouisfed.org/ Federal Reserve Bank of St. Louis
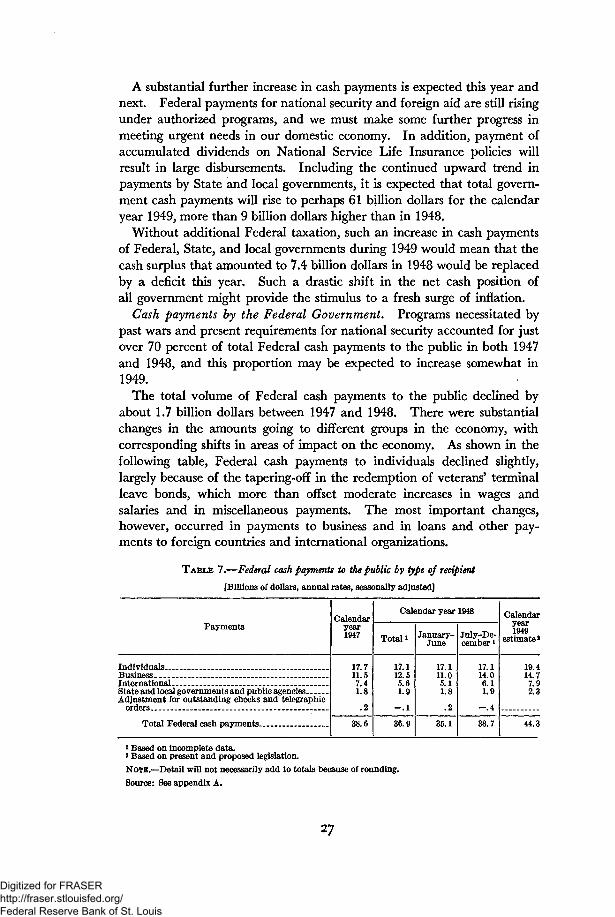
A substantial further increase in cash payments is expected this year andnext. Federal payments for national security and foreign aid are still risingunder authorized programs, and we must make some further progress inmeeting urgent needs in our domestic economy. In addition, payment ofaccumulated dividends on National Service Life Insurance policies willresult in large disbursements. Including the continued upward trend inpayments by State and local governments, it is expected that total govern-ment cash payments will rise to perhaps 61 billion dollars for the calendaryear 1949, more than 9 billion dollars higher than in 1948.
Without additional Federal taxation, such an increase in cash paymentsof Federal, State, and local governments during 1949 would mean that thecash surplus that amounted to 7.4 billion dollars in 1948 would be replacedby a deficit this year. Such a drastic shift in the net cash position ofall government might provide the stimulus to a fresh surge of inflation.
Cash payments by the Federal Government. Programs necessitated bypast wars and present requirements for national security accounted for justover 70 percent of total Federal cash payments to the public in both 1947and 1948, and this proportion may be expected to increase somewhat in1949.
The total volume of Federal cash payments to the public declined byabout 1.7 billion dollars between 1947 and 1948. There were substantialchanges in the amounts going to different groups in the economy, withcorresponding shifts in areas of impact on the economy. As shown in thefollowing table, Federal cash payments to individuals declined slightly,largely because of the tapering-off in the redemption of veterans' terminalleave bonds, which more than offset moderate increases in wages andsalaries and in miscellaneous payments. The most important changes,however, occurred in payments to business and in loans and other pay-ments to foreign countries and international organizations.
T A B L E 7.—Federal cash payments to the public by type of recipient[Billions of dollars, annual rates, seasonally adjusted]
Payments
IndividualsBusiness «International- _ _ _. - _ _State and local governments and public agencies-Adjustment for outstanding checks and telegraphic
orders
Total Federal cash payments.
Calendaryear1947
17.711.67.41.8
.2
38.6
Calendar year 1948
Total i
17.112.65.61.9
- . 1
36.9
January-June
17.111.05.11.8
.2
35.1
July-De-cember l
17.114.06.11.9
- . 4
38.7
Calendaryear1949
estimate3
19.414.77.92.3
44.3
1 Based on incomplete data.
NOTE.—Detail will not necessarily add to totals because of rounding.
Source: See appendix A.
27
Digitized for FRASER http://fraser.stlouisfed.org/ Federal Reserve Bank of St. Louis
The total payments to business increased by about 1 billion dollarsbetween 1947 and 1948, and are expected to increase further by about 2billion dollars in 1949. Most of this increase is accounted for by expandingpayments in support of national security, especially for the aircraft pro-curement and the stockpiling programs. This expansion may be expectedto intensify specific shortages in labor and certain critical materials. In-deed, rising metals prices already reflect in part the effect of present andplanned stockpiling.
Federal public works have been held to a low level. They increased onlyabout 14 percent in 1948 over 1947, to a total of 1.3 billion dollars—roughly the same dollar value as in 1940 despite a doubling of constructioncosts. The continuation of projects already under way will require somefurther increase in 1949. More widely dispersed will be the effect ofincreases in consumer income that will result from disbursements of NationalService Life Insurance dividends and proposed increases in social securitybenefits and other payments to individuals.
Cash payments by State and local governments. While a number ofStates have granted bonuses to veterans of World War II, more of whichwill be paid during 1949, the very great proportion of the transactions ofState and local governments are in support of normal civilian programs,such as education, community facilities, police and fire protection. Risingcosts and expanding needs account for the sharply rising trend of Stateand local expenditures. The hiring of teachers and construction of newschools cannot be deferred in the face of the currently large and still grow-ing numbers of school children, nor can the laying of streets and sewersand the enlargement of water systems be postponed when the new housingdevelopments requiring them are being built. The need for recruiting newstaff while living costs are rising has required substantial increases in Stateand local pay scales, and other aspects of activity are suffering from theimpact of generally rising costs.
Total cash payments to the public by State and local governments in1948 were about 15 billion dollars, 25 percent higher than in 1947, anda further substantial rise is in prospect for 1949. Despite deliberate post-ponements by many States and localities in the hope of lower costs, con-struction activities have been rising at a very rapid rate and will continueto do so. The dollar value of State and local construction activities, whichexpanded much more slowly than private construction immediately afterthe war, was more than 37 percent higher in 1948 than in 1947, comparedwith a little more than 30 percent increase for private construction andonly a 14 percent increase in Federal construction. Costs have risen sharply,and the rise in physical volume has been substantially less than shown bythe dollar figures. While the number of people on relief rolls hasremained relatively low, increased assistance has become essential, and inmany cases it has been found necessary to supplement inadequate old-ageinsurance benefits with relief payments.
28
Digitized for FRASER http://fraser.stlouisfed.org/ Federal Reserve Bank of St. Louis
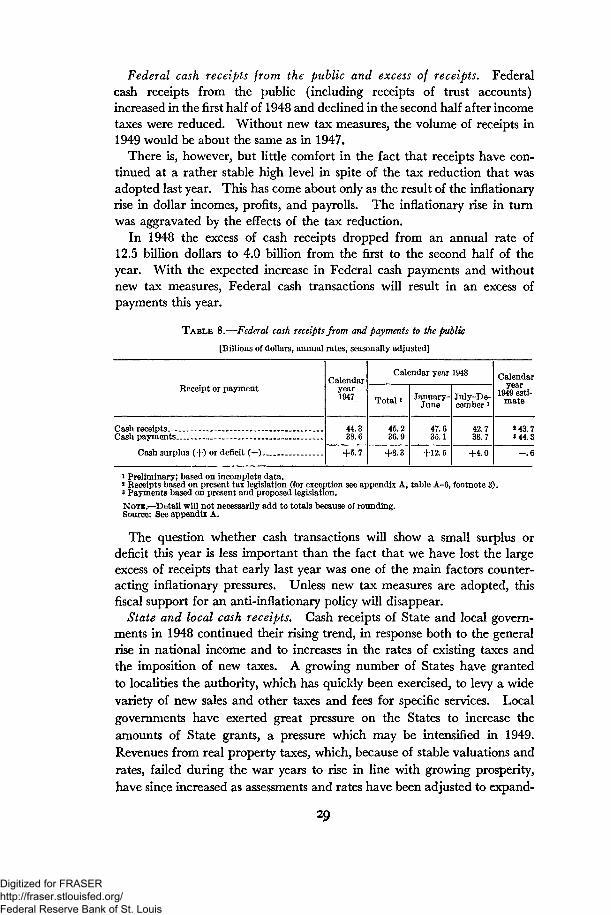
Federal cash receipts from the public and excess of receipts. Federalcash receipts from the public (including receipts of trust accounts)increased in the first half of 1948 and declined in the second half after incometaxes were reduced. Without new tax measures, the volume of receipts in1949 would be about the same as in 1947.
There is, however, but little comfort in the fact that receipts have con-tinued at a rather stable high level in spite of the tax reduction that wasadopted last year. This has come about only as the result of the inflationaryrise in dollar incomes, profits, and payrolls. The inflationary rise in turnwas aggravated by the effects of the tax reduction.
In 1948 the excess of cash receipts dropped from an annual rate of12.5 billion dollars to 4.0 billion from the first to the second half of theyear. With the expected increase in Federal cash payments and withoutnew tax measures, Federal cash transactions will result in an excess ofpayments this year.
T A B L E 8.—Federal cash receipts from and payments to the public
[Billions of dollars, annual rates, seasonally adjusted]
Receipt or payment
Cash receipts.. _Cash payments _
Cash surplus (+) or deficit (—) _
Calendaryear1947
44.338.6
+5.7
Calendar year 1948
Total i
45.236.9
+8.3
January-June
47.635.1
+12.5
July-De-cember 1
42.738.7
+4.0
Calendaryear
1949 esti-mate
2 43.78 44.3
- . 6
i Preliminary; based on incomplete data.* Receipts based on present tax legislation (for exception see appendix A, table A-6, footnote 3).3 Payments based on present and proposed legislation.
NOTE.—Detail will not necessarily add to totals because of rounding.Source: See appendix A.
The question whether cash transactions will show a small surplus ordeficit this year is less important than the fact that we have lost the largeexcess of receipts that early last year was one of the main factors counter-acting inflationary pressures. Unless new tax measures are adopted, thisfiscal support for an anti-inflationary policy will disappear.
State and local cash receipts. Cash receipts of State and local govern-ments in 1948 continued their rising trend, in response both to the generalrise in national income and to increases in the rates of existing taxes andthe imposition of new taxes. A growing number of States have grantedto localities the authority, which has quickly been exercised, to levy a widevariety of new sales and other taxes and fees for specific services. Localgovernments have exerted great pressure on the States to increase theamounts of State grants, a pressure which may be intensified in 1949.Revenues from real property taxes, which, because of stable valuations andrates, failed during the war years to rise in line with growing prosperity,have since increased as assessments and rates have been adjusted to expand-
29
Digitized for FRASER http://fraser.stlouisfed.org/ Federal Reserve Bank of St. Louis
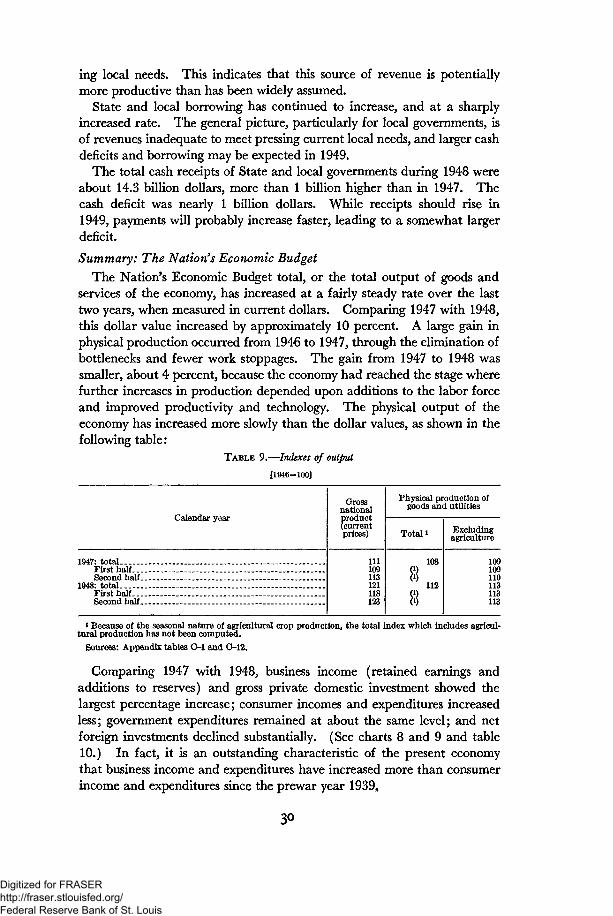
ing local needs. This indicates that this source of revenue is potentiallymore productive than has been widely assumed.
State and local borrowing has continued to increase, and at a sharplyincreased rate. The general picture, particularly for local governments, isof revenues inadequate to meet pressing current local needs, and larger cashdeficits and borrowing may be expected in 1949.
The total cash receipts of State and local governments during 1948 wereabout 14.3 billion dollars, more than 1 billion higher than in 1947. Thecash deficit was nearly 1 billion dollars. While receipts should rise in1949, payments will probably increase faster, leading to a somewhat largerdeficit.
Summary: The Nation's Economic Budget
The Nation's Economic Budget total, or the total output of goods andservices of the economy, has increased at a fairly steady rate over the lasttwo years, when measured in current dollars. Comparing 1947 with 1948,this dollar value increased by approximately 10 percent. A large gain inphysical production occurred from 1946 to 1947, through the elimination ofbottlenecks and fewer work stoppages. The gain from 1947 to 1948 wassmaller, about 4 percent, because the economy had reached the stage wherefurther increases in production depended upon additions to the labor forceand improved productivity and technology. The physical output of theeconomy has increased more slowly than the dollar values, as shown in thefollowing table:
TABLE 9.—Indexes of output[1946=100]
Calendar year
1947: totalFirst halfSecond, half
1948* totalFirst halfSecond half
Grossnationalproduct(currentprices)
111109113121118123
Physical production ofgoods and utilities
Total i
108
8112
8
Excludingagriculture
109109110113113113
i Because of the seasonal nature of agricultural crop production, the total index which includes agricul-tural production has not been computed.
Sources: Appendix tables O-l and 0-12.
Comparing 1947 with 1948, business income (retained earnings andadditions to reserves) and gross private domestic investment showed thelargest percentage increase; consumer incomes and expenditures increasedless; government expenditures remained at about the same level; and netforeign investments declined substantially. (See charts 8 and 9 and table10.) In fact, it is an outstanding characteristic of the present economythat business income and expenditures have increased more than consumerincome and expenditures since the prewar year 1939*
30
Digitized for FRASER http://fraser.stlouisfed.org/ Federal Reserve Bank of St. Louis
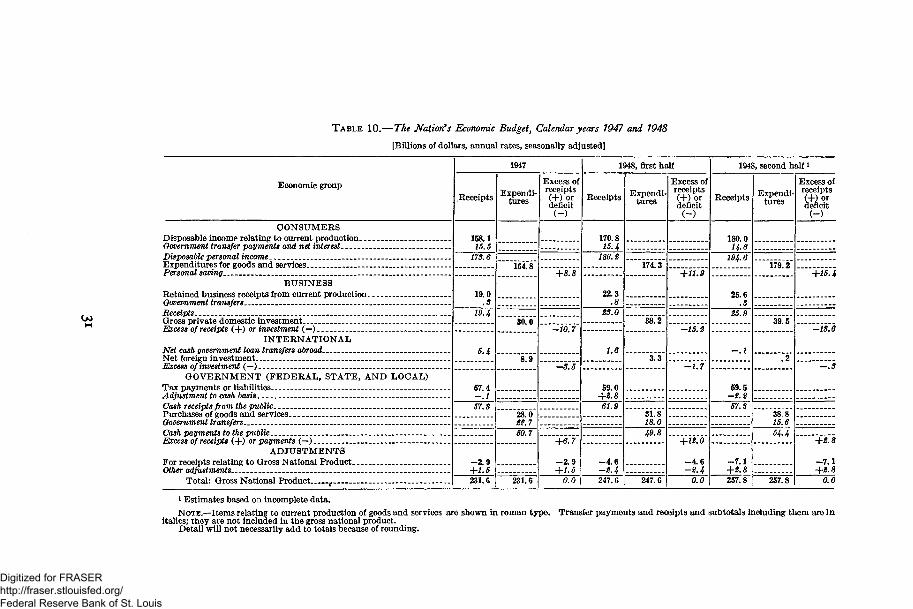
T A B L E 10.—The Nation's Economic Budget, Calendar years 1947 and 1948
[Billions of dollars, annual rates, seasonally adjusted]
Economic group
CONSUMERSDisposable income relating to current productionGovernment transfer payments and net interestDisposable personal income . _.Expenditures for goods and servicesPersonal saving..
BUSINESSRetained business receipts from current productionGovernment transfers. _ _Receipts _Gross private domestic investmentExcess of receipts (+) or investment (—)
INTERNATIONALNet cash government loan transfers abroadNet foreign investmentExcess of investment (—)
GOVERNMENT (FEDERAL, STATE, AND LOCAL)Tax payments or liabilitiesAdjustment to cash basisCash receipts from the public _Purchases of goods and servicesGovernment transfersCash payments to the publicExcess of receipts (+) or payments (—)
ADJUSTMENTSFor receipts relating to Gross National ProductOther adjustments. _
Total: Gross National Product
1947
:Receipts
158.115.5
173.6
19.0.3
19.4
57.4-.157.3
—2 9+1.5231.6
Expendi-tures
164 8
30 0
8.9
28.0tft.l60.7
231.6
Excess ofreceipts(+)ordeficit(-)
+8.8
—10.7
—3.5
+6.7
- 2 . 9
+1.50.0
1948, first half
Receipts
170.815.4
186.2
22.3.8
23.0
1.6
59.0+2.861.9
- 4 . 6-2.4247.6
Expendi-tures
174.3
38.2
3.3
31.818.049.8
247.6
Excess ofreceipts(+)ordeficit(-)
+11.9
—15.2
—1.7
+12.0
- 4 . 6-2.4
0.0
1948, second half i
Receipts
180.014.6
194.6
25.6.3
25.9
—.1
59.5-2.267.3
- 7 . 1+2.8257.8
Expendi-tures
179.2
39 5
.2
38.815.664-4
257.8
Excess ofreceipts(+)ordeficit(-)
+15.4
-13.6
- . 3
+2.8
- 7 . 1+2.8
0.0
1 Estimates based on incomplete data.
NOTE.—Items relating to current production of goods and services are shown in roman type. Transfer payments and receipts and subtotals including them are initalics; they are not included in the gross national product.
Detail will not necessarily add to totals because of rounding.
Digitized for FRASER http://fraser.stlouisfed.org/ Federal Reserve Bank of St. Louis
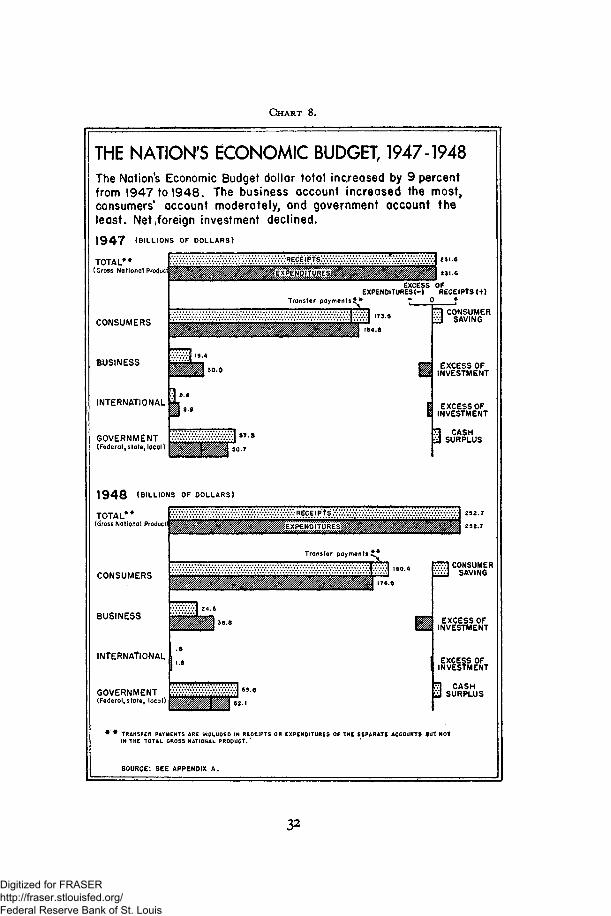
CHART 8.
THE NATION'S ECONOMIC BUDGET, 1947-1948The Nations Economic Budget dollar total increased by 9 percentfrom 1947 to 1948. The business account increased the most,consumers1 account moderately, and government account theleast. Net/foreign investment declined.
1 9 4 7 {BILLIONS OF DOLLARS)
TOTAL**(Gross National Product
CONSUMERS
BUSINESS
INTERNATIONAL
GOVERNMENT(Federal, state, local)
vRECEIPfsX 231.6
291.6
Transfer p a y m e n t s ^
EXCESS OFEXPENDITURES(-) RECEIPTS (+)
0 +
=£1 CONSUMERv j SAVING
EXCESS OFINVESTMENT
EXCESS OFINVESTMENT
A=| CASH£ SURPLUS
1 9 4 3 (BILLIONS OF OOLLARS)
TOTAL**(Gross National Product)
CONSUMERS
BUSINESS
INTERNATIONAL
GOVERNMENT(Federol,state, local)
•Xv:%%XvXv:v:::v::vXX\<\\\\Xv:v:v:v:v RECE i p t s :v:x-:ovX\vX^<\:\\\v>x^vXvX-X'X-: •*•:•»
Transfer payments £ *
VAVI CONSUMERvXvi SAVING
EXCESS OFINVESTMENT
EXCESS OFINVESTMENT
Ivl CASHi l SURPLUS
• ' * TRANSFER PAYMENTS ARE INCLUOED IN RECEIPTS OR EXPENDITURES OF THE SEPARATE ACCOUNTS BUT NOTIN THE TOTAL CROSS NATIONAL PRODUCT.'
SOURCE: SEE APPENDIX A.
Digitized for FRASER http://fraser.stlouisfed.org/ Federal Reserve Bank of St. Louis
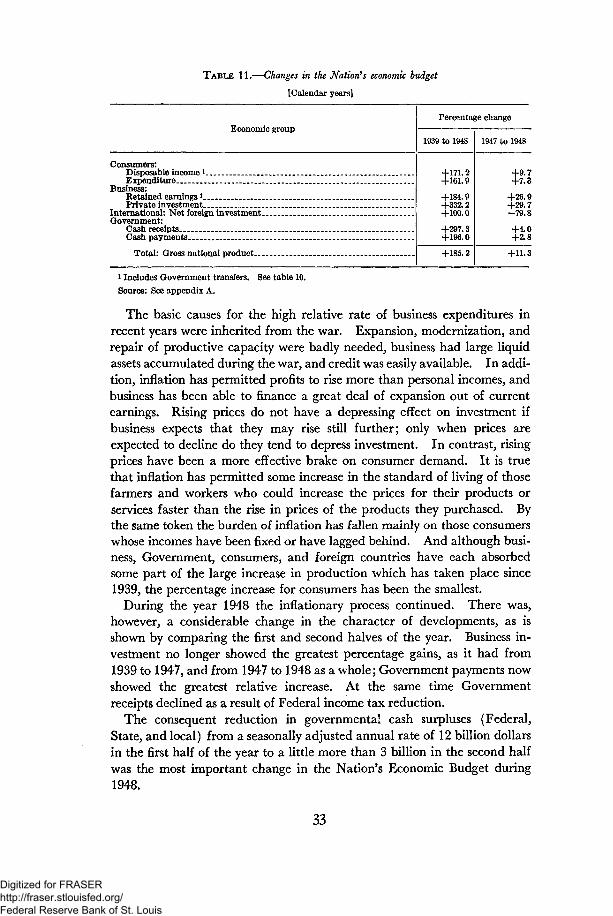
TABLE 11.—Changes in the Nation*s economic budget
[Calendar years]
Economic group
Consumers:Disposable income *Expenditure _
Business:Retained earnings *Private investment
International: Net foreign investment..Qovernment:
Cash receiptsCash payments
Total: Gross national product.. +11.3
* Includes Government transfers. See table 10.Source: See appendix A.
The basic causes for the high relative rate of business expenditures inrecent years were inherited from the war. Expansion, modernization, andrepair of productive capacity were badly needed, business had large liquidassets accumulated during the war, and credit was easily available. In addi-tion, inflation has permitted profits to rise more than personal incomes, andbusiness has been able to finance a great deal of expansion out of currentearnings. Rising prices do not have a depressing effect on investment ifbusiness expects that they may rise still further; only when prices areexpected to decline do they tend to depress investment. In contrast, risingprices have been a more effective brake on consumer demand. It is truethat inflation has permitted some increase in the standard of living of thosefarmers and workers who could increase the prices for their products orservices faster than the rise in prices of the products they purchased. Bythe same token the burden of inflation has fallen mainly on those consumerswhose incomes have been fixed or have lagged behind. And although busi-ness, Government, consumers, and foreign countries have each absorbedsome part of the large increase in production which has taken place since1939, the percentage increase for consumers has been the smallest.
During the year 1948 the inflationary process continued. There was,however, a considerable change in the character of developments, as isshown by comparing the first and second halves of the year. Business in-vestment no longer showed the greatest percentage gains, as it had from1939 to 1947, and from 1947 to 1948 as a whole; Government payments nowshowed the greatest relative increase. At the same time Governmentreceipts declined as a result of Federal income tax reduction.
The consequent reduction in governmental cash surpluses (Federal,State, and local) from a seasonally adjusted annual rate of 12 billion dollarsin the first half of the year to a little more than 3 billion in the second halfwas the most important change in the Nation's Economic Budget during1948.
33
Digitized for FRASER http://fraser.stlouisfed.org/ Federal Reserve Bank of St. Louis
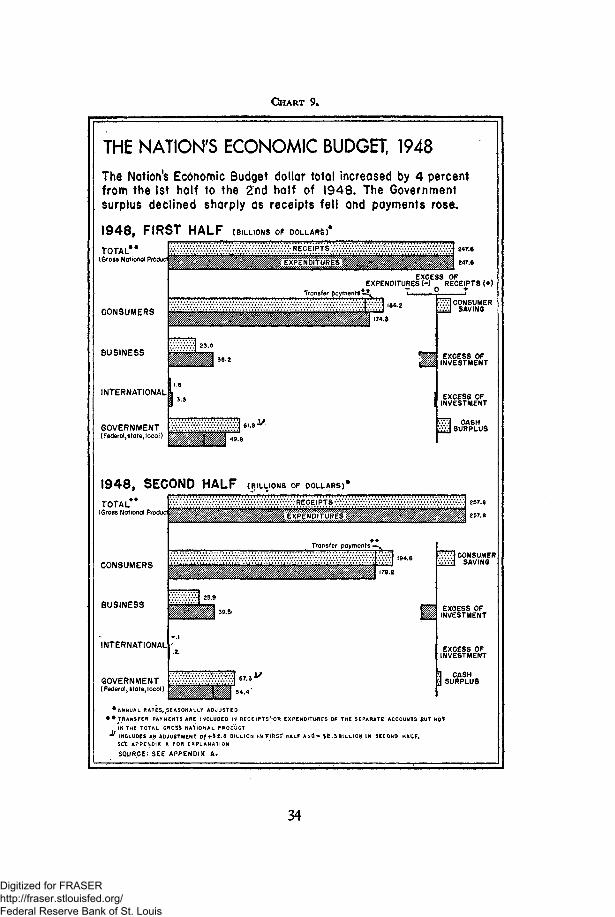
CHART 9.
THE NATION'S ECONOMIC BUDGET, 1948The Nation's Economic Budget dollar total increased by 4 percentfrom the 1st half to the 2nd half of 1948. The Governmentsurplus declined sharply as receipts fell and payments rose.
1948, FIRST HALF (BILLIONS OF DOLLARS)*
TOTAL**(Gross National Product
>X\vXv>x%v:vX£^
CONSUMERS
BUSINESS
INTERNATIONAL
GOVERNMENT(Federal,state, local)
EXCESS OFEXPENDITURES H RECEIPTS (+)
7 0 t
1948, SECOND HALF (BILLIONS OF DOLLARS)0
TOTAL< Gross Notional Produd
CONSUMERS
BUSINESS
INTERNATIONAL
GOVERNMENT(Federal j state, local)
Transfer payments -
•ANNUAL RATES,,SEASOWALLY ADJUSTED
vlvi CONSUMER.X.I SAVING
EXCESS OFINVESTMENT
EXCESS OFINVESTMENT
£v| CASH::A SURPLUS
W~Z\ CONSUMER•v.v.l SAVING
EXCESS OFINVESTMENT
EXCESS OFINVESTMENT
CASHSURPLUS
IN THE TOTAL GROSS NATIONAL PRODUCT
INCLUDES AN ADJUSTMENT OF+.$2-8 BILLION IN FIRSf HALF AN(5- $2 .3B ILL ION IN SECOND HALF.
SEt APPENDIX A FOR EXPLANATION
SOURCE: SEE APPENDIX A ,
34
Digitized for FRASER http://fraser.stlouisfed.org/ Federal Reserve Bank of St. Louis
This rise in governmental payments and reduction in Federal taxes, com-bined with price and wage increases, added to consumer incomes and busi-ness earnings. The inflationary impetus of these developments was some-what mitigated by the fact that consumer expenditures increased less thanconsumer incomes, and business investment less than business earnings.Also, net foreign investment declined, partly because Federal grants, whichare recorded in the Government account, took the place of foreign invest-ments. Thus the 9-billion-dollar drop in the combined Federal, State, andlocal surpluses was, as shown in table 10 and chart 9, offset by an increase innet saving and a reduction in the excess of domestic and foreign invest-ment. The new balance was brought about only through another turn inthe inflationary spiral. Most of the gains obtained through increases inincomes and reduction of taxes were lost through price increases.
The analysis of the Nation's Economic Budget suggests two conclusions.It demonstrates the essential role that a Government surplus plays in aperiod of inflationary pressures and the dangers that would result if lastyear's surplus should disappear entirely or be replaced by a deficit. Adjust-ments that may be needed to deal with such a situation will be discussed inPart II of this report.
From the longer-run aspect, the most important item is the reduction inthe role consumption has recently played in the economy relative to businessinvestment and Government expenditures. Adjustments which may be-come necessary as the special conditions of the postwar period graduallydisappear will be discussed in Part III of this report.
35
Digitized for FRASER http://fraser.stlouisfed.org/ Federal Reserve Bank of St. Louis
II. Goals and Means of ApproachingThem in 1949
BASIC ECONOMIC OBJECTIVES
THE Employment Act of 1946 stated the needs of our economy admir-ably when it set the objectives of "maximum employment, production,
and purchasing power." In terms of these objectives, the immediate tasksthat loom largest in 1949 may conveniently be stated.
Maximum employment
It is estimated that the labor force will increase by nearly one millionduring 1949. This increase will reflect not only the increase in the popula-tion of working age but also the large number of students under the GI pro-gram who will complete their training and education. The civilian employ-ment goal for 1949 should include provision of useful work opportunities forthe net increase in the labor force. Maximum employment means steadywork at customary hours, not work sharing. While some temporary fric-tional unemployment is inevitable in a fluid economy, its volume should bekept as near as possible to the present low level.
Maximum productionAn increase in the total production of goods and services of 3 to 4 percent,
or 8 to 10 billion dollars measured in 1948 prices, should be regarded as areasonable objective for this year. In agriculture, the improvement inplant and the abundance of last year's feed crops promise a continued hightotal output with an increase in livestock products which would somewhatimprove consumption standards for our people. On the industrial side,about 50 billion dollars have been invested in expansion and modernizationsince the end of the war. Hence the slight increase in output per man-hourwhich occurred last year should be enlarged upon this year. In spite ofthese improvements in industrial productivity, there will still be several bot-tlenecks where there are persistent shortages of capacity for producingelectric power and critical materials, particularly certain metals. Industryand government should press their efforts to overcome these shortages.
Maximum purchasing power
The basic concept underlying "maximum purchasing power" is that theincome generated by productive effort should flow to groups and individualsthroughout the economy in a manner that will provide adequate funds and
36
Digitized for FRASER http://fraser.stlouisfed.org/ Federal Reserve Bank of St. Louis
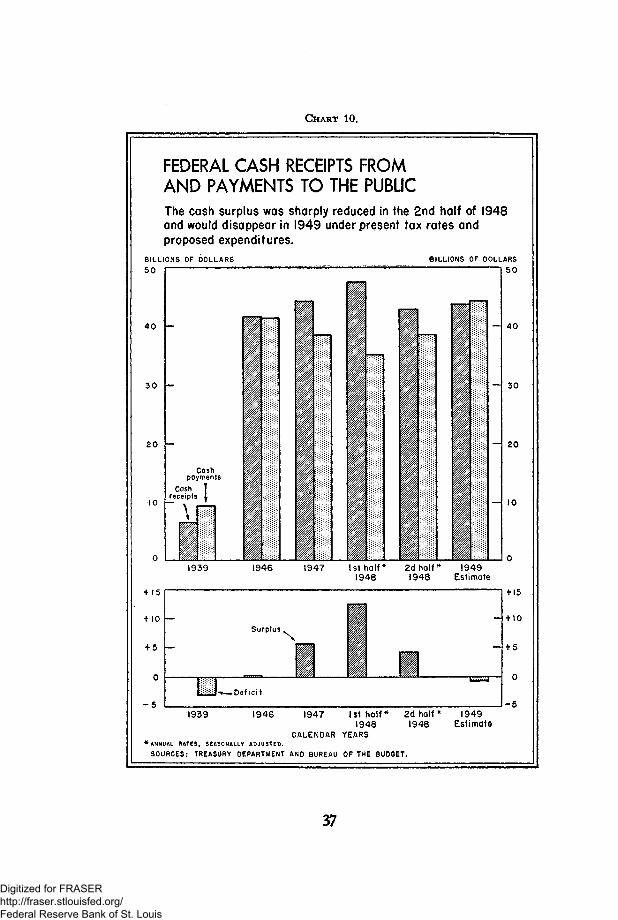
CHART 10.
FEDERAL CASH RECEIPTS FROMAND PAYMENTS TO THE PUBLICThe cash surplus was sharply reduced in the 2nd half of 1948and would disappear in 1949 under present tax rates andproposed expenditures.
BILLIONS OF DOLLARS5 0
BILLIONS OF DOLLARS50
10 — - 10
1939 1949Estimate
+ 15
10
+ 5
- 5
Surplus ,
-De f i c i t
+ 15
+ 10
+ 5
1939 1946 1947 1st half* 2dhalf*1948 1948
CALENDAR YEARS* ANNUAL RATES, SEASONALLY AOJUSTEO.
SOURCES: TREASURY DEPARTMENT AND BUREAU OF THE BUDGET.
1949Estimate
37
Digitized for FRASER http://fraser.stlouisfed.org/ Federal Reserve Bank of St. Louis
incentives for maximum production in the factory and on the farm, andfurnish buying power to consumers and business sufficient to take promptlyoff the market the goods available for their use. Broadly conceived, itrequires the balanced allocation of resources and manpower in accord withthe interests of the economy as a whole. These interests must includesupport for basic national policies such as national defense and welfare.
Since prices and wages are the main mediums through which purchasingpower is distributed, price and wage movements and relationships decisivelyaffect the outlook for stable prosperity. Most economic policies are directedin one way or another toward this problem of balanced purchasing power inorder to bring the pattern of production and consumption into better align-ment so as to attain economic stability at the highest feasible levels. Inaddition to price and wage adjustments, there is need for a proper balancebetween total money purchasing power and the supply of goods if inflationor deflation are to be avoided.
The goal for 1949 should be to make as much progress as we can withinone year toward achieving adjustments which will maintain purchasingpower on a stable basis.
NEEDED ADJUSTMENTS
Fulfillment of our 1949 goals for maximum employment, production, andpurchasing power will not come by chance. It will require wise economicadjustments, toward which some progress was made during 1948. Yetmuch remains to be done. There are seven areas of adjustment which seemto us of signal importance.
Fiscal policy
The large excess of cash revenues over expenditures, running at an annualrate of more than 12 billion dollars in the first half of last year, was the mainbulwark of our anti-inflationary policy. The review of Governmenttransactions in Part I indicates that this surplus will disappear andchange into a deficit unless new tax legislation is adopted. It is well-nighaxiomatic that the Government should operate at a substantial surplusduring a period of unparalleled prosperity when inflationary pressurespersist. This is essential not only to deal sensibly with the current situation,but also to permit fiscal policy to be reversed if recessionary trends shouldlater develop which might call both for tax reductions to stimulate businessand markets and for additional public expenditure.
On general economic grounds, tax measures should be devised to resultin an increase of at least 4 billion dollars. However, the range of primeconsiderations in matters of tax policy extends so far beyond purely eco-nomic analysis that ultimate decisions must be made within that widerperspective.
In formulating a tax program for 1949, the following principles seemparamount: The additional tax measures should (a) provide a budgetary
38
Digitized for FRASER http://fraser.stlouisfed.org/ Federal Reserve Bank of St. Louis
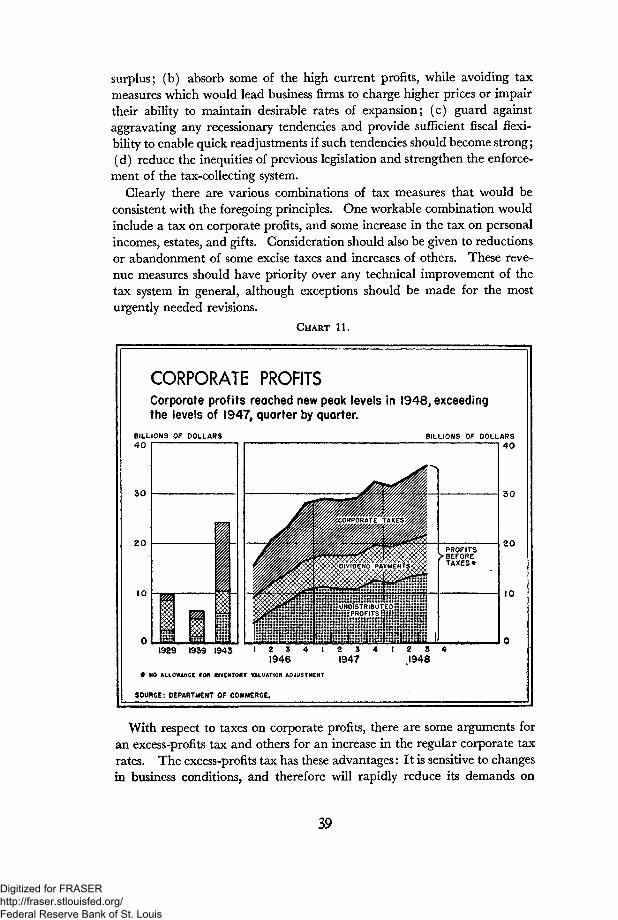
surplus; (b) absorb some of the high current profits, while avoiding taxmeasures which would lead business firms to charge higher prices or impairtheir ability to maintain desirable rates of expansion; (c) guard againstaggravating any recessionary tendencies and provide sufficient fiscal flexi-bility to enable quick readjustments if such tendencies should become strong;(d) reduce the inequities of previous legislation and strengthen the enforce-
ment of the tax-collecting system.Clearly there are various combinations of tax measures that would be
consistent with the foregoing principles. One workable combination wouldinclude a tax on corporate profits, and some increase in the tax on personalincomes, estates, and gifts. Consideration should also be given to reductionsor abandonment of some excise taxes and increases of others. These reve-nue measures should have priority over any technical improvement of thetax system in general, although exceptions should be made for the mosturgently needed revisions.
CHART 11.
CORPORATE PROFITSCorporate profits reached new peak levels in 1948, exceedingthe levels of 1947, quarter by quarter.
BILLIONS OF DOLLARS40
3 0
2 0
10
BILLIONS OF DOLLARS40
PROFITS•BEFORETAXES*
30
10
1929 1939 1943
• NO ALLOWANCE FOH INVENTORY VALUATION ADJUSTMENT
SOURCE: DEPARTMENT OP COMMERCE.
3 4 1 2 31947 1948
With respect to taxes on corporate profits, there are some arguments foran excess-profits tax and others for an increase in the regular corporate taxrates. The excess-profits tax has these advantages: It is sensitive to changesin business conditions, and therefore will rapidly reduce its demands on
39
Digitized for FRASER http://fraser.stlouisfed.org/ Federal Reserve Bank of St. Louis
taxpayers in the event of a recession; it is difficult to shift to the consumer; itreduces incentives to increase prices; it may reduce the pressure for increasesin wages of a kind that would be inflationary. An increase in regularcorporation rates has certain advantages, provided the increase is moderate;it has administrative simplicity; it avoids the high marginal rate that wouldexist in some concerns under an excess-profits tax and that might lead to arelaxation of managerial efficiency; it avoids some of the inequities whichmight result under the excess-profits tax. In any event, the noneconomicelements involved in the choice between these two types of taxes or in acombination of the two make it clear that the decision should rest on thebroadest grounds of policy.
Under present conditions increases in the tax on personal incomesshould be limited to the middle and upper brackets, primarily on groundsof equity. However, a further substantial increase in defense and militaryaid budgets would call for an increase in personal income taxes in allbrackets.
With respect to estate and gift taxes, these taxes can be more easilyadministered than an income tax with very high marginal rates, and suchtaxes have the minimum adverse economic effects.
Gash receipts could be increased further by advancing the date of thestatutory increase in pay-roll taxes. Early expansion in the social securityprogram would strengthen anti-inflationary factors now and provide foradditional purchasing power cushions later.
Credit policyIn addition to the use of fiscal policy, it is necessary that monetary author-
ities at all times be in position to carry out their traditional function ofexerting effective restraint upon excessive credit expansion in an inflation-ary period and conversely of easing credit conditions in a time of deflationarypressures.
In view of the problem of managing our huge war debt, the FederalReserve Board has only limited power to curb effectively any substantialpressure towards credit expansion. Maintaining a stable and orderly mar-ket for Government securities means, in effect, that the Reserve banks mustpurchase long-time marketable Government securities offered for sale bybank and nonbank holders and not taken by other investors. These Fed-eral Reserve purchases create an equivalent quantity of bank reserves uponwhich a multiple expansion of credit can be based. Without power to im-mobilize these reserves, the Board's ability to restrain credit creation isseverely limited since commercial banks, insurance companies, and mutualsavings banks still hold Government securities in an amount of 95 billiondollars, and individuals and corporations also hold large amounts, whichcould be readily transformed into bank reserves.
40
Digitized for FRASER http://fraser.stlouisfed.org/ Federal Reserve Bank of St. Louis
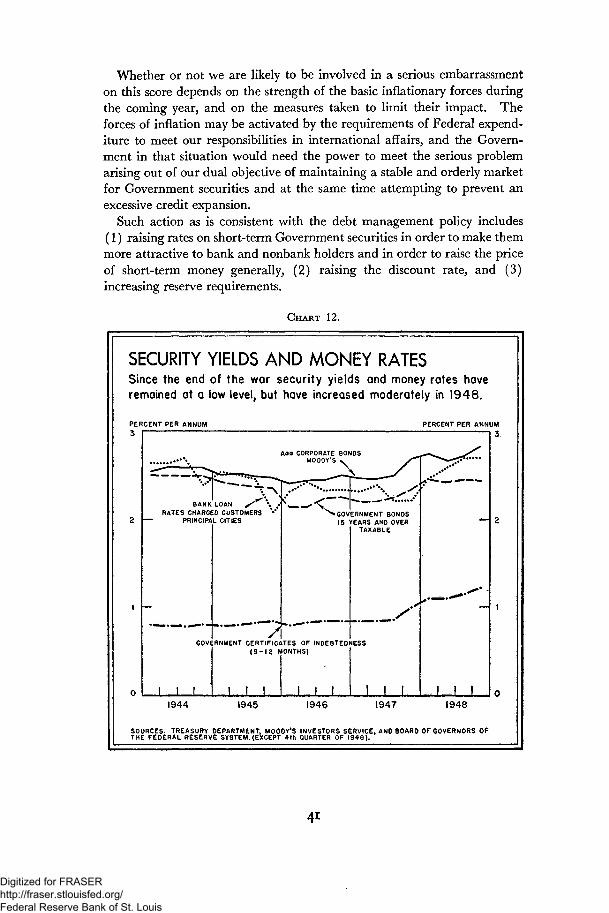
Whether or not we are likely to be involved in a serious embarrassmenton this score depends on the strength of the basic inflationary forces duringthe coming year, and on the measures taken to limit their impact. Theforces of inflation may be activated by the requirements of Federal expend-iture to meet our responsibilities in international affairs, and the Govern-ment in that situation would need the power to meet the serious problemarising out of our dual objective of maintaining a stable and orderly marketfor Government securities and at the same time attempting to prevent anexcessive credit expansion.
Such action as is consistent with the debt management policy includes(1) raising rates on short-term Government securities in order to make themmore attractive to bank and nonbank holders and in order to raise the priceof short-term money generally, (2) raising the discount rate, and (3)increasing reserve requirements.
CHART 12.
SECURITY YIELDS AND MONEY RATESSince the end of the war security yields and money rates haveremained at a low level, but have increased moderately in 1948.
PERCENT PER ANNUM3
PERCENT PER ANNUM
3
Aaa CORPORATE BONOSMOODY'S .
BANK LOANRATES CHARGED CUSTOMERS
PRINCIPAL CITIES
I I 1
GOVERNMENT BONOS15 YEARS AND OVER
TAXABLE
— . — . .*—•«--,.—.-—• —"• "J- .—~
WMENT CERTIFICATES OF INDEBTEDNESS( 9 - 1 2 MONTHS)
J I1944 1945 1946 1947 1948
SOURCES: TREASURY DEPARTMENT, MOODY'S INVESTORS SERVICE, AND BOARD Of GOVERNORS OFTHE FEDERAL RESERVE SYSTEM. (EkCEPT 4th QUARTER OF 1948).
Digitized for FRASER http://fraser.stlouisfed.org/ Federal Reserve Bank of St. Louis
Rates on Government short-term securities were raised in July 1947 andAugust 1948, bringing the yield on Treasury certificates from about % to1J4 percent. The immediate effect was a pronounced rise in short-terminterest rates generally and a moderate rise in corporate bond yields. Theseactions in conjunction with developing conditions had some deterrent effecton the willingness of bankers to lend and on the demand for funds. Al-though a much more pronounced rise in short-term rates than has occurredin the past might be somewhat more effective in deterring credit expansion,there are limitations on the possibilities of exerting effective restraintthrough such action.
The discount rate was raised from 1 to 1*4 percent in January 1948,and from 1*4 to l*/£ percent in August. Under prevailing conditions, thisaction also can have but limited effectiveness, since with their enormousholdings of Government securities most banks can readily obtain any neededfunds by selling securities rather than by borrowing from the Reserve banks.
At the present time the Board's power to increase bank reserves is limitedto an increase of 2 percentage points against demand deposits for all memberbanks and 2 additional percentage points against demand deposits for cen-tral reserve city banks. Under the temporary authority granted by the Con-gress in August 1948, which expires June 30, 1949, the Board had powerto raise reserves against demand deposits by 4 percentage points and againsttime deposits by V/2 points. Raising requirements by the last two per-centage points allowed under temporary authority would increase totalreserves that banks have to keep against deposits by about 1J/2 billion dollars.Though this might help to restrain credit expansion by placing banks underpressure to obtain additional reserves or by absorbing any additional reservesthat banks may obtain from gold imports or Federal Reserve purchases ofUnited States securities, it could not have much effect considering theability of the banks to obtain additional reserves. The lapse of the presenttemporary authority would add several billion dollars to their reserves.
One proposed method to restore the power of the Reserve System toinfluence the volume of bank credit is to give up our aim of maintaining astable and orderly market for Government securities. The immediateimpact of such a step, however, is highly uncertain. Indeed, it is entirelyconceivable that, in some circumstances, the unsettling of financial marketsfollowing complete removal of the peg would contribute to a serious busi-ness downturn. Another method might be the continuance of support butat a lower level, in the hope that this would discourage existing holdersfrom selling, or bring new buyers into the market to take advantage ofhigher yields. There is no promise that such a policy would provide adefinite solution to the problem. A moderate reduction of the peg mightcreate the expectation of a further reduction and increase the volume ofpurchases required to support the market. Or, if the inflationary pressures
42
Digitized for FRASER http://fraser.stlouisfed.org/ Federal Reserve Bank of St. Louis
were substantial, the only effect might be a general rise in the structure ofinterest rates, with the Federal Reserve banks obliged to continue a sizeablevolume of support purchases at the lower peg.
The stability of the Government bond market has been a significant ele-ment in the smooth postwar reconversion. This stability has contributedto the underlying strength of the financial structure of the country. Itwould be a serious error to introduce new elements of uncertainty andpossible financial disburbances which would follow a change of the policywith respect to the support of bond prices.
A constructive approach would be the granting of additional powers tothe Federal Reserve Board to vary the level of reserve requirements. This,together with use of other powers available to the System, would provide aflexible mechanism of credit restraint under current monetary conditions.The process would be more effective if applied to all banks insured by theFederal Deposit Insurance Corporation.
Authority for the regulation of consumer instalment credit expires onJune 30, 1949. This authority has had gradually increasing influence inchecking credit extension of an inflationary character. To abandon thisrestraining influence at this time would increase our vulnerability toinflationary strain.
Voluntary adjustments in prices and wages
Since the end of the war we have been faced with an inflationary spiralof prices and wages which at times has appeared to be burning itself out,only to flame up again under the impetus of new factors. At the momentwe are witnessing a welcome abatement of inflationary pressures in sub-stantial parts of the economy, while other areas are still subject to stronginflationary pressures. Much as we may hope that the present relaxationsof inflationary pressures will continue and spread to the rest of the economy,it would be foolhardy to count on it. This is no time to relax our vigilanceagainst the dangers of a possible spurt in the inflationary spiral. We needto be prepared to deal with that possibility as well as to make the adjust-ments required when markets weaken.
An essential part of the process of adjustment depends upon the voluntarybehavior of business, labor, and other groups. Indeed, it is upon the volun-tary pursuit of sound economic policies that we rely mainly for the strengthand progress of our economy. The forces of competition, however, arenever wholly adequate to bring about all the adjustments required. In afull-employment economy beset by inflationary pressures, and vexed by in-ternational as well as domestic complications, the need is greater than everfor restraint and foresight, for appreciation of the interests of the wholeeconomy and of how its various sectors interact upon one another.
Price adjustments. It is the natural inclination of businessmen to gainwhatever profits they can. Profits in fact are the central and legitimatepurpose of their undertaking. In an inflationary period, higher costs, actual
43
Digitized for FRASER http://fraser.stlouisfed.org/ Federal Reserve Bank of St. Louis
or anticipated, impel them to protect themselves by higher prices. And theirapprehension of a possible recession at some later date may impel them tomake hay while the sun shines and to make maximum improvement in theirfinancial and physical position while profits are high.
At the same time, the case for a moderate and restrained price policyrests on the law of self-preservation, once the conditions of self-preservationare fully perceived. For businessmen know that maximum profits in thelong run depend upon sustained prosperity. They know, too, that thisprosperity is endangered when prices are pushed so high or needed adjust-ments so long delayed as to culminate in a choice between the equally un-desirable alternatives of slashing prices too rapidly or attempting to meet asoftening of demand through cutbacks in employment and production. Thehope that businessmen actually will set their prices below the highest levelsthat a lush market will temporarily sustain is supported by the fact thatmany of them have already done so.
The postwar level of demand has been compounded of many factors: thereconversion needs of business, the extraordinary character of some govern-ment programs, the use of wartime savings, and generally high levels ofincome. Wise management recognizes that prices geared to such a com-pound demand cannot be maintained when the temporary elements disap-pear. The great danger in a situation of this sort is that management,feeling a decline in the pressure of demand, will respond by lowering therate of production rather than by attempting to maintain it by makingdownward adjustments in prices.
Recent price trends have been running in two directions. For a con-siderable range of commodities, they have been moving downward orleveling out. For another range of commodities, the demand continuesvery strong in relation to the supply, and upward pressure on prices stillcontinues. These divergent trends indicate an over-all market situationwhich makes it more risky than* a year ago to cling shortsightedly or obsti-nately to prices beyond those yielding a reasonable return. Increasingly,month by month, there is need for discernment and discrimination inpricing policy.
In those industrial areas in which supply has caught up with demand, oreven exceeded it at present price levels, downward price adjustments tomaintain a high level of production become essential. Moreover, whereprice cuts are made at initial stages of production, they should be passedthrough promptly at subsequent stages of production and distribution so asto pass the price benefits on to the consumer.
The discriminating and prudent price adjustments which we have beendiscussing would reinvigorate demand where it may lag and would help tosustain continuous maximum production. They would assist the market inavoiding the drastic general slashes in prices which would mark the advent
44
Digitized for FRASER http://fraser.stlouisfed.org/ Federal Reserve Bank of St. Louis
of a serious recession or depression. We should not expect the process ofprice adjustment to bring us back to the preinflationary price level, sinceincomes, costs, and prices have become interrelated at a higher level ofprices.
It does not lie within the scope of this Report to point to exactly whatindividual price adjustments are required. But the enunciation of theprinciple is worthwhile even though its specific application must be left tothose on the scene of action.
Wage adjustments. Labor's interest in the maintenance of stable pros-perity transcends even that of management, because while profits may fallmore than wages in a period of depression, workers and their families bearthe real brunt of hard times. Pushing for the highest possible wage ad-vance is dangerous to the economy in a period when that advance necessi-tates even higher prices. It is more dangerous if this course is followedwhen rising labor costs lead to reduction in employment. Wage advancesthat contribute to inflation are undesirable; but wage advances that maycontribute to serious deflation are more so. With the balance betweeninflation and deflation more closely drawn than it was a year ago, a re-strained wage policy is now even more urgent in the interest of labor aswell as management.
This admonition should not lead to the assumption that wage principlesand profit principles are identical. Profits become unreasonable when theyyield more than the amounts which support adequate incentives for pro-duction and growth; but there is no upper limit to wages in exactly thatsense. Certainly an objective of the American economy is to provide con-stantly higher real wages and a constantly improving standard of livingas rapidly as our resources will permit. Money wages may, however, be-come too high when they run ahead of the supply of goods so that theylead only to more inflation instead of more consumer enjoyment; or whenthey attempt to yield to a particular group a larger share of the nationaloutput than can be theirs without undue deprivation of others; or whenthey induce unemployment.
There is, however, sound ground for wage increases which are in linewith productivity trends. Further, substantial wage increases are still calledfor in a number of instances where wages are substandard. The postwarinflation has led to a permanently higher level of prices (though not neces-sarily as high as the present level), and it would be intolerable to leave itsworst victims without relief. The adjustments required for this purposewould not interfere with the movement of the economy toward greaterstability, but would in fact contribute toward stability in the long run.
It should be emphasized that the above discussion of wages is related toa broad anti-inflation program and is based on the assumption that otherGovernment and business policies will effectively contribute to stabilizingthe cost of living.
45
Digitized for FRASER http://fraser.stlouisfed.org/ Federal Reserve Bank of St. Louis
Treatment of critical shortages and capacity expansion
While the supply situation relative to demand has greatly improved inmost segments of the economy, this is not the case in a number of highlyimportant areas. There are serious deficiencies of supply in the case oflead, copper, and a few other materials which are of vital importance to thedefense plans of the country. These shortages appear likely to persist forsome time under circumstances of maximum employment and productionthroughout the economy. Steel has presented the outstanding shortageproblem since the war, and would present grave danger in case of the needfor a much enlarged defense program. It is, therefore, necessary to givespecial attention to policies which may be needed in these fields.
Expansion of capacity and production. Under developmental contractsin connection with the stockpiling program, substantial progress is expectedto be made toward overcoming some critical deficiencies of supply. Butthis attack upon the problem alone is too restricted. There is need todetermine the extent to which serious shortages will persist for essentialproducts and to determine what special measures may be needed to stimulatethe increase of capacity and production. While accelerated expansion inbottleneck areas would require materials already in critically short supply,this effort on a selective basis can and should move forward.
Voluntary allocation agreements. The shortage situation led to theenactment of Public Law 395 authorizing the President to approve voluntaryagreements which he finds will "aid in stabilizing the economy of the UnitedStates * * * in curbing inflationary tendencies, to promote the orderlyand equitable distribution of goods and facilities, and to aid in preventingmaldistribution of goods and facilities which basically affect the cost ofliving or industrial production." The allocations under this law have beenconfined to steel, pig iron, and petroleum. In addition, the National Mili-tary Establishment, in fulfilling the stockpiling objectives for critical andstrategic materials, has recently made an informal arrangement with thecopper industry to furnish several thousand tons of copper each month, andis discussing similar arrangements with other industries.
There can be no doubt that, even with this limited application, the volun-tary cooperative efforts between business and Government have producedimportant results in directing scarce commodities to their more essentialuses. However, as the proportion of a scarce commodity which is allocatedincreases, orderly distribution to the priority programs tends to be at theexpense of the rest of the economy and strong inflationary pressures tendto appear.
Selective controls
The easing of demand in some sectors of the economy cannot hide thefact that for other commodities inflationary forces are still strong andmay increase. The existence of serious shortages of supply, which interfere
Digitized for FRASER http://fraser.stlouisfed.org/ Federal Reserve Bank of St. Louis
with essential programs and which continue inflationary pressures, has beennoted at earlier points. This problem will present itself in a more acuteform if it should become necessary to withdraw substantial minor fractionsof essential materials from the civilian market as a priority for security pro-grams. There is some prospect that the problems which these shortagespresent can be met by improvement in the supply situation and by the use ofvoluntary allocation agreements. This would be the most satisfactorysolution. But attention should be given to the possibility that the utiliza-tion of mandatory allocation controls might be called for on short notice atpoints where the present voluntary programs are found inadequate. Sincethe shortages also carry the threat of serious further price inflation, selectiveprice controls also call for consideration.
The authorization of selective allocations and price controls would notneed to rest upon the conviction that they would have to be used. It wouldrest, instead, upon the proposition that the Government should be providedwith the weapons which may be needed in the carrying out of public pro-grams and in the battle against inflation.
Rent control
The extreme housing shortage has caused us to continue rent control longafter other wartime controls have been dropped. Continuation of thesecontrols has held down one important item in the cost of living in the midstof general inflation. They are not rigid, however, since they do not apply tonew housing, and the Housing Expediter has substantial power to permitincreases to allow for landlords' expenditures on improvements or to grantrelief in cases of demonstrable hardship.
It is true that those who own property subject to rent control have earnedless profit than those who have sold commodities in short supply not subjectto control, but the vacancy ratio in most rental properties is still so lowthat incomes of landlords, in spite of increases in cost, are as good as, orbetter than, earnings before the war. In addition, removal of rent controlwould bear most heavily on families with fixed incomes. At this juncture,it would also quite possibly stiffen demands for wage increases. Reasonsfor extending this control outweigh reasons for terminating it. If extendedfor a year or two, we might hope that return to free market conditions couldbe effected at a time when other items in the cost of living had eased.
Farm price supports
Long-range farm price support policies and programs are being widelydiscussed. The immediate concern over them stems partly from the dropin farm prices (see appendix table C-22) and farmers' net incomes during1948, partly from the associated expansion of Government loan and pur-chase operations, and partly from certain adjustments in support levels*provided in the Agricultural Act of 1948, to take effect on January 1, 1950.
The current concern with price-support measures should not blind us to
47
Digitized for FRASER http://fraser.stlouisfed.org/ Federal Reserve Bank of St. Louis
the fact that they are only a part—although an important part—of a broadagricultural program. Three criteria for a sound farm price support pro-gram are relevant within the framework of an economy seeking to operatecontinuously at maximum levels of employment, production, and purchas-ing power. First, the program must contribute to maintaining adequatelevels of farm income. Second, it must simultaneously promote sound pricerelationships among individual farm products and between agricultural andindustrial prices. And third, it must be implemented with a variety ofmeasures adequate to give real effect to the support commitments that aremade.
Farm income, to be adequate, must suffice—and must be sufficientlyassured—to encourage farmers to continue a high level of production com-mensurate with the Nation's needs. Furthermore, it must enable farmerswhile doing this to maintain the fertility of their farms, and in generalmust justify the continuing investment in farm plant necessary for achievingour longer-range production objectives. Finally, farm incomes must providefarmers the purchasing power to share fully as consumers in the output of amaximum-production economy.
Intercommodity price relationships must be kept consistent with basictrends in demand and supply conditions. To the maximum extent pos-sible, parity-price relationships and support-price programs should encour-age shifts to those commodities that are most wanted. Rigid systems ofsupport, in violation of this principle, can only lead to rigid systems forrestricting output that violate our tenets of economic freedom, that workagainst our objectives of maximum production, and that in the end takeaway from farmers' incomes through decreased volume as much as, or morethan, they add through increased prices.
The Agricultural Act of 1948 represents an important step forward inrecognizing the difficulties associated with over-rigid supports. But whileretaining this essential improvement, the precise formulas for adjustmentsin support levels, including standards for discretionary action, need carefulreview and further testing against the criteria both of adequate farm incomeand of adaptability to meet specific commodity situations.
A grave defect in recent agricultural legislation is its failure adequatelyto implement the declared support intentions with concrete measures formaking supports effective. It denies authority for the Commodity CreditCorporation to provide necessary storage facilities. Methods of assigningacreage allotments for basic crops likewise need the most careful examina-tion. There is danger that the rigidity of present methods may in somecases hinder farmers from making needed adjustments in production thatthe support programs should encourage.
From a* broader standpoint, if price supports are to fulfill their properrole of encouraging the adjustment of farm production to our needs, they
Digitized for FRASER http://fraser.stlouisfed.org/ Federal Reserve Bank of St. Louis
also should be supplemented by measures to assure consumption at theneeded levels. This implies examination of the adequacy of the schoollunch program and development of measures wider in scope for assuringthat proper diets will be continuously available to all our people.
It likewise implies more aggressive action to broaden the utilization offarm products, to reduce the costs of processing and distributing them, toeliminate destabilizing speculative influences from commodity exchangesand other markets, and generally to assure that retail prices are properlyproportional to the prices that farmers receive. And it would require re-newed efforts generally to devise trade mechanisms for making our farmproducts available in other countries where they are so sorely needed.
The gains that agriculture has made since the initiation of broadly con-structive legislation in 1933 should not be jeopardized in the process ofadjustment to conditions of the peacetime economy. Rather, we mustestablish the basis for continued progress. Price supports alone cannot berelied upon to achieve this. They do not, for example, solve the underlyingproblems of small farmers who have too little to sell. Other programs arenecessary to deal with their problems. Price supports make their greatestcontribution in stabilizing farm incomes against economic downturn. Indoing so they contribute significantly also to general economic stabilization.
Price supports and all the other parts of the broad agricultural programmust be directed toward this over-all goal: that all farmers shall haveopportunity comparable to that enjoyed by other groups for realizing thehigh standard of living that our maximum-production economy makespossible.
49
Digitized for FRASER http://fraser.stlouisfed.org/ Federal Reserve Bank of St. Louis
III. Basic Objectives for BalancedEconomic Growth
DURING the nineteen thirties the country fell into a tremendousunder-use of its productive resources. This led to a dominating fear
of surpluses in capacities and in goods. The real problem, however, washow to restore full use of our productive resources and initiate a furtherprocess of growth. During the war years, full employment and phenomenallevels of production were achieved, but there remained doubts in the mindsof many whether we would be able to maintain full and effective use ofour resources after the return of peace.
The Employment Act of 1946 is based on the conviction that our economicsystem can sustain high and steady levels of employment and production.But such an outcome is not automatic. It will be achieved only if business,workers, farmers, and the Government are guided less by the records of thepast than by the possibilities of the future. The Employment Act thereforecalls for estimates of the levels of employment, production, and purchasingpower needed to accomplish the purposes of the law.
This part of our report continues the effort begun last year to formulateneeded levels for the American economy in a somewhat longer perspectivethan that of Parts I and II, which deal with conditions in 1948 and adjust-ments for 1949.
Such a formulation does not substitute distant dreaming for immediatepractical action. It simply recognizes that the decisions affecting the wholeeconomy which we make from year to year will be more intelligent if wetake a longer look ahead. The intent is to keep our objectives responsive tocurrent experience by reviewing them annually. The aid of experts inbusiness, labor, and agriculture, and in Government and independent re-search has been sought. Success in the venture of defining commonobjectives should promote success in the task of furthering cooperative actionin the solution of common problems.
Such economic objectives are not to be confused with economic blueprintsor plans used in regulated economies. They are conceived simply as benchmarks for the orientation of private enterprise and public policies. Norare they forecasts of what would be likely to happen without special effort.They depend upon success in accomplishing the objectives of the Employ-ment Act. We present them as an attempt to integrate governmental andprivate thinking in a way that is essential for making rational decisions.
50
Digitized for FRASER http://fraser.stlouisfed.org/ Federal Reserve Bank of St. Louis
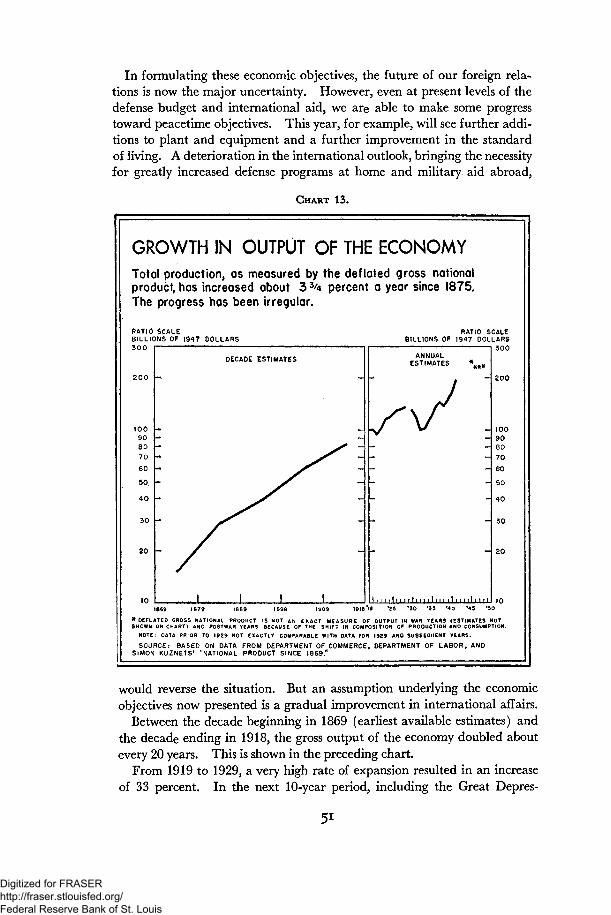
In formulating these economic objectives, the future of our foreign rela-tions is now the major uncertainty. However, even at present levels of thedefense budget and international aid, we are able to make some progresstoward peacetime objectives. This year, for example, will see further addi-tions to plant and equipment and a further improvement in the standardof living. A deterioration in the international outlook, bringing the necessityfor greatly increased defense programs at home and military aid abroad,
CHART 13.
GROWTH IN OUTPUT OF THE ECONOMYTotal production, as measured by the deflated gross nationalproduct, has increased about 33/4 percent a year since 1875.The progress has been irregular.
RATIO SCALEBILLIONS OF 1947 DOLLARS300
RATIO SCALEBILLIONS OF 1947 DOLLARS
100908070605Q.40
10
OECADE ESTIMATES
J I
ANNUALESTIMATES
1111 p 111 > i l 111 i i i
1009080
70
60
50
40
1869 1879 1889 1899 1909 1918*19 '25 '30 '35 '40 '45 '50
* DEFLATED GROSS NATIONAL PRODUCT IS NOT AN EXACT MEASURE OF OUTPUT IN WAR YEARS (ESTIMATES NOT
929 NOT EXACTLY
4 AND CONSUMPTION.
RABLE WITH DATA FOR
SOURCE: BASED ON DATA FROM DEPARTMENT OF COMMERCE, DEPARTMENT OF LABOR, ANDSIMON KUZNETS* "NATIONAL PRODUCT SINCE 1869."
would reverse the situation. But an assumption underlying the economicobjectives now presented is a gradual improvement in international affairs.
Between the decade beginning in 1869 (earliest available estimates) andthe decade ending in 1918, the gross output of the economy doubled aboutevery 20 years. This is shown in the preceding chart.
From 1919 to 1929, a very high rate of expansion resulted in an increaseof 33 percent. In the next 10-year period, including the Great Depres-
Digitized for FRASER http://fraser.stlouisfed.org/ Federal Reserve Bank of St. Louis
sion, but little gain was registered. A visitor from Mars looking atthe national production chart would have imagined that one-quarter ofthe arable land had been destroyed by a flood, over one-quarter of thepopulation wiped out by plague, and one-quarter of the industrial plantsdestroyed by earthquake. From 1939 to 1948, including the war years, theincrease in output was resumed and a rise of more than 50 percent wasaccomplished. Thus, from 1919 to 1948 the output of the economy againdoubled.
In addition to the increase in output, the number of leisure hours hasrisen substantially. In the last century, the hours worked were frequentlyas high as 70 or more per week. In manufacturing industries, the averageweekly hours of work have dropped more than 20 percent since 1909.
PRODUCTION OBJECTIVES
A reasonable development for the next few years would be an annualincrease in output of about 3 percent. This target depends upon severalfactors, chief among them being the growth in the labor force, the lengthof the average work-week, and the output per man-hour.
It is estimated that our population will increase less than 1 percentannually over the next decade, compared with about 2 percent in theperiod 1870 to 1919. Since the proportion of the population withinage brackets seeking work will increase slightly more, the increase in thelabor force is estimated at about 1 percent a year. This increase allowsfor about a million and a half net immigration over the next 10 years. Itassumes that expanded social security legislation will enable more old peopleto retire somewhat earlier. Young people may enjoy longer educations butwill engage in considerable summer and part-time work.
Although average hours worked per week are now at a level consistent withhealth and reasonable leisure, some reduction in annual working time wouldresult from continuation of the present trend toward additional holidaysand paid vacations. Such reductions would partially offset the increase inthe labor force. Under these circumstances, economic growth over thenext few years would depend to a considerable extent on the rise in outputper man-hour.
As far as conclusions can be derived from deficient statistics, it appearsthat output per man-hour has increased on the average by nearly 2 percentper year for a half century or more. The rate of increase for manufactur-ing industries has been about 3 percent. Over the next few years, a produc-tivity increase for the whole economy averaging somewhat more than 2]/^percent a year should be possible. This rate of productivity increase isbased on the assumption that Government, labor, and management cooper-ate fully in achieving maximum productive efficiency. To achieve itrequires continued large investment in labor-saving plant and equipment,
52
Digitized for FRASER http://fraser.stlouisfed.org/ Federal Reserve Bank of St. Louis
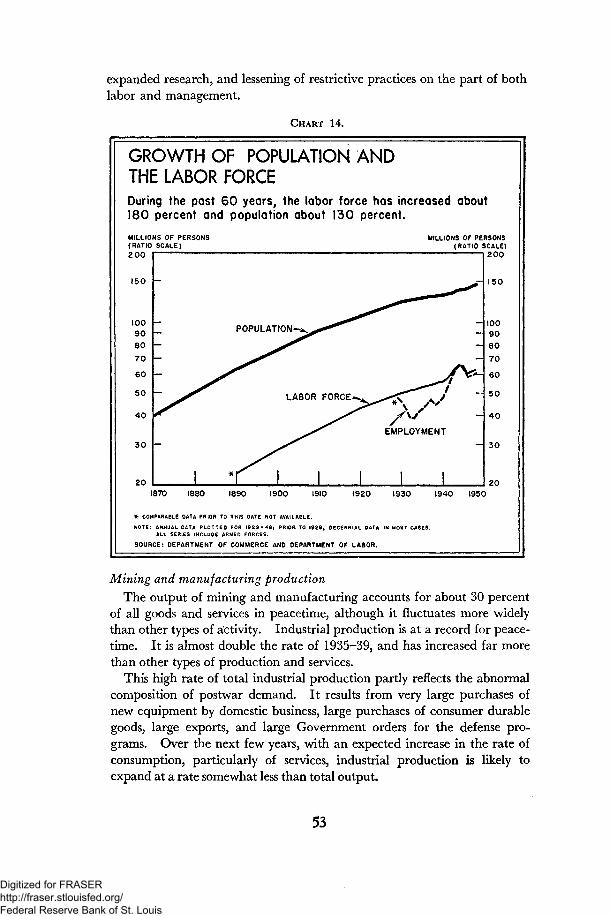
expanded research, and lessening of restrictive practices on the part of bothlabor and management.
CHART 14.
GROWTH OF POPULATION ANDTHE LABOR FORCEDuring the past 60 years, the labor force has increased about180 percent and population about 130 percent.
MILLIONS OF PERSONS(RATIO SCALE)200
150
100
90
80
70
60
50
40
30
20
_ P O P U L A T I O N - ^ ^ * " * * ^
"~ ^ ^ ^ LABOR F O R C E ^
1 T 1 1 1
EMPLOYMENT
1
MILLIONS OF PERSONS(RATIO SCALE)
200
150
100
90
80
70
60
50
40
30
201870 1880 1890 1900 1910 1920 1930 1940 1950
ALL SERIES INCLUDE ARMED FORCES.
SOURCE: DEPARTMENT OF COMMERCE AND DEPARTMENT OF LABOR.
Mining and manufacturing production
The output of mining and manufacturing accounts for about 30 percentof all goods and services in peacetime, although it fluctuates more widelythan other types of activity. Industrial production is at a record for peace-time. It is almost double the rate of 1935-39, and has increased far morethan other types of production and services.
This high rate of total industrial production partly reflects the abnormalcomposition of postwar demand. It results from very large purchases ofnew equipment by domestic business, large purchases of consumer durablegoods, large exports, and large Government orders for the defense pro-grams. Over the next few years, with an expected increase in the rate ofconsumption, particularly of services, industrial production is likely toexpand at a rate somewhat less than total output.
53
Digitized for FRASER http://fraser.stlouisfed.org/ Federal Reserve Bank of St. Louis
Agricultural production
Agriculture and fishing, not counting processing of food and other farmproducts, account for about one-tenth of the total output of the economy.In 1948, we produced enough food to maintain per capita consumptionat 12 percent above the 1935-39 average, and to ship abroad three to fourtimes as much food as in that prewar period. Assuming peacetime condi-tions in the world, we do not expect to continue to ship abroad the largequantities of foods that have been required in the last few years. On theother hand, exports and domestic industrial use of nonfood agriculturalproducts may be expected to increase.
It should be our aim to increase further the per capita domestic foodconsumption, in order to provide adequate diets for the many millions offamilies whose consumption is considerably below a desirable standard.Even so, the increase in the over-all production goals for agriculture doesnot need to be as large as in those for other industries. Allowing for reducedfood exports, it is estimated that a 1 to V/2 percent annual rise in agricul-tural output would provide adequate nutrition for an increasing population.Because of improvement in farm productivity, it should be possible toaccomplish this objective with a somewhat reduced labor force inagriculture.
Energy production
Half our nonhuman energy now comes from coal, about one-third fromoil, one-seventh from natural gas, and 4 percent from water power. Prac-tically all the water power and an increasing proportion of the fuels areconverted to electricity. It is not regarded as likely that such potentialfurther sources as atomic energy, sunlight, wind and tides will play asignificant role within the next few years, although they deserve continuingexploration and development in view of the exhaustible character ofmineral fuels.
Historically, the trend of increasing reliance on nonhuman energy hasbeen partially offset by increased efficiency of energy utilization. Neverthe-less, the demands on primary energy sources (fuels and water power) haveincreased nearly in proportion to total national output. It may be ex-pected that the total need for mineral fuels will continue to increase atabout the same rate as total output.
It is impossible to predict what expansion will take place in the develop-ment of power through the use of coal, oil, natural gas and water power,respectively. Competition among these rival sources is sharp, and technicaldevelopments still in the making will play a large part in shaping relativegrowth trends. A sound conservation policy should encourage the use ofwater power and coal as against the more quickly exhaustible oil andnatural gas.
The use of electric power has increased tremendously since the war, andthere is no sign of any tapering-off in the development of expanded and new
54
Digitized for FRASER http://fraser.stlouisfed.org/ Federal Reserve Bank of St. Louis
uses for this most convenient form of energy. The wider use of light metalsand other electro-metallurgical and electro-chemical products, in additionto the further mechanization of industry in general and the rapid growthin rural electrification, promises a continued increase in the demand forelectric energy.
INVESTMENT OBJECTIVES
The unprecedentedly heavy investment of the past few years has broughtcapacity in most lines of business up to a reasonable relationship to cur-rent demand. Utilization rates are high, but no longer excessively so interms of what might be expected under sustained high employment. In afew industries which were greatly expanded during the war, such as air-craft, shipbuilding, and magnesium production, excess capacity prevails.On the other hand, remaining bottlenecks in production of metals and elec-tricity, the transmission of gas, and in transportation indicate areas wherewe have not caught up and where provisions should be made to restore anadequate reserve margin.
A more difficult question~concerns the quality or condition of our presentproductive facilities. Whether they are now in better or worse conditionthan at some previous time, they are less modern and less efficient than theycould be. The newest and best types of facilities in any industry are superiorto the bulk of those in use, and still better types are generally in the offingawaiting development and introduction. This situation is a normal andnecessary consequence of the progress of technology and the durability ofcapital goods. Technology is always in the lead. If technical developmentwere to cease tomorrow, American industry could still go on for many yearsmodernizing its plants up to present attainable standards, with large invest-ment outlays and large gains in efficiency.
Needed investment in manufacturingSome indication of gross investment requirements in manufacturing
industry may be gained from a study of the relation between gross investmentoutlays and capacity expansion during the past three decades.
Contrasting 1919 with 1929 (both years of reasonably high utilization ofindustrial capacity), the Federal Reserve Board index number of manu-facturing output rose by 38 points (on the 1935-39 base). This is a roughmeasure of the expansion in industrial capacity achieved in that interval.From 1929 to the spring of 1941, again taking an interval between two dateswith reasonably high utilization of capacity, the production index roseanother 40 points. In 1948, with high utilization, the index was another48 points higher.
In these three periods of industrial growth, the gross outlays for newnonwar manufacturing facilities—in 1947 prices—were almost precisely inproportion to the amounts of apparent expansion in capacity. The recordof thirty years thus puts an approximate price tag on expansion and moderni-
55
Digitized for FRASER http://fraser.stlouisfed.org/ Federal Reserve Bank of St. Louis
zation—somewhat below 1 billion dollars (1947) for each point of capacityexpansion in terms of the Federal Reserve index.
This analysis of the record of production under conditions of full employ-ment suggests that to maintain adequate manufacturing facilities the futureratio of new investment to total production may be below that of 1948.
Needed investment in electric utilities
Electric utilities is another important field in which it is possible to ven-ture a projection of gross investment requirements. Consistent with ourestimate of an increase of 3 percent annually in total production, an ac-ceptable estimate of the annual increase in electric utility output is 20 to25 billion kilowatt-hours. To provide for this output at reasonable ratiosof plant-use with allowance for restoration of that normal margin of reservecapacity which is now lacking in many parts of the country, we should needto increase capacity each year by approximately 5J4 million kilowatts. Al-lowing l/2 million kilowatts for further retirements of obsolete capacity assoon as the present tightness of reserve capacity is alleviated, the necessarygross addition of capacity would be 6 million kilowatts each year. Capitaloutlays per kilowatt of capacity for generation, transmission, and distribu-tion facilities are estimated to run between $400 and $500, depending partlyon the proportions of steam and hydroelectric capacity built. The annualaddition to capacity of about 6 million kilowatts would involve an outlayof 2/2 to 3 billion dollars per year.
This rate of expansion is substantially higher than that attained in 1948.Privately and publicly owned utility systems have reported plans for addi-tions of about 18 million kilowatts of capacity over the next three years. Itappears altogether likely that, assuming sustained growth and activity inthe whole economy, the electric utility expansion program would have tocontinue at better than 1948 rates. For the next two or three years therate of expansion is limited by the capacity of equipment producers; thatcapacity is itself being increased, but no substantial margin of reserve forpossible military requirements is in sight.
Needed investment in mining facilities
In mining, a major proportion of the foreseeable expansion will un-doubtedly come in mineral fuels, now supplying 96 percent of our energy.As noted in the discussion of production objectives, the total requirementsfor mineral fuels are unlikely to increase more than the 3 percent per annumset for national output as a whole. There is some reason to expect, however,that more capital investment might be involved in relation to capacityexpansion than in the past. The sharp competition which is in prospectamong coal, oil, gas, and electricity will speed certain technical develop-ments, all of which require relatively large amounts of capital. These are:(1) further mechanization of coal mining; (2) gasification of coal; (3)synthetic oil; (4) further substitution of electricity for direct use of fuels.
56
Digitized for FRASER http://fraser.stlouisfed.org/ Federal Reserve Bank of St. Louis
In the coal mining industry, there are great potentialities for furthermechanization of mining, handling and cleaning operations. With sus-tained high employment, the demand for coal should increase substantially,though the amount of increase will depend mainly on the development ofliquefaction and gasification of coal, and other new uses. However, expan-sion of markets may not automatically call forth corresponding outlays onfacilities. In relation to output, coal mining requires a large capital invest-ment which is only slowly recovered in earnings. The inducement to makemajor capital outlays hinges on the competitive outlook far into the future.This means that within the next few years we may have to face a majoradjustment problem. Investment in coal mining and handling facilitiesmay be checked, even prematurely, by uncertainty concerning the possiblecompetition of atomic energy.
The petroleum industry spent about a billion and a half dollars in 1948for wells and other facilities for production of crude oil in the UnitedStates, and probably almost as much for domestic facilities for transporta-tion, refining, and marketing. The need for continued expansion is clear,but all estimates of future investment must be conditioned upon the rate ofdevelopment of new oil reserves.
In 19473 2.7 billion barrels were added to visible reserves of petroleum,and in 1948 about 3 billion barrels. Since only 2 billion barrels were with-drawn in 1948, our known reserves have expanded roughly in line with thetrend of increase in production. In the interests of national security, weshould attempt to maintain or improve the relationship between reservesand production. If new reserves could hereafter be added at the 1948 rate,capital outlays at about the 1948 scale would have to be maintained. Anyincrease in the difficulty of development of new reserves would be reflectedin larger outlays in relation to accomplishment. At the same time, higherprices resulting from such higher costs would have the offsetting effect ofencouraging substitution of imports, synthetics, or other fuel sources.
The rapid expansion of natural gas production and transmission accountsfor the bulk of current capital outlays in the whole gas industry. The nat-ural gas utility companies spent 427 million dollars on pipelines in 1948 anda further 234 million on other facilities. The industry association has esti-mated the current expansion program outlays at 2,650 million dollars overthe five-year period 1948-52, which implies a large decline from presentrates of expenditure. The program figures for the later years are almostcertainly too low, if only because plans are not fully made so far in advance.On the other hand, the expansion of long-distance natural gas pipelinesseems unlikely to continue at present rates for as long as a decade. Thepresent market advantage of gas over other fuels in some industrial regionswill be reduced somewhat as higher field prices and pipeline constructioncosts are reflected in delivered gas prices. Moreover, more rigorous appli-cation of public policies which encourage the use of natural gas in the areas
57
Digitized for FRASER http://fraser.stlouisfed.org/ Federal Reserve Bank of St. Louis
of its production rather than transmission to other areas may limit theinvestment requirements of the gas industry.
Another mineral industry which we know will require large capital out-lays in the near future is iron ore mining. Depletion of the high-gradeMesabi ore makes necessary the immediate development of alternativesources. Whether this takes the form primarily of exploitation of newsources in Labrador and elsewhere, with heavy transportation facilities out-lays in addition to the mining development proper, or whether it involvesprimarily the construction of beneficiation plants for low-grade domestic ore,the new investment outlay will be enormous. Development of foreignsources will involve international investment by United States companies.
Railroad investment
Although transportation as a whole is increasingly important in the na-tional economy, much traffic has shifted from railroads to other carriers.It is anticipated that, in line with trends of the past two decades, furtherfreight traffic will be shifted to trucks, pipelines and waterways, and pas-senger traffic to air lines, automobiles, and busses. Rail freight traffic wouldcontinue to increase, though slowly, while rail passenger traffic would sub-stantially diminish.
The need for freight cars is conditioned by the expansion of traffic (whichwe may assume to be partly offset by continued improvement in efficiencyof car use) and the abnormally heavy replacement requirements arisingfrom war and postwar conditions of heavy traffic and steel shortage. It isestimated that the average service life of new freight cars now being built willbe about 30 years with allowance for the normal proportion of rebuilding.To provide a 1 percent annual increase in cars in use and reduce the averageage of cars from 32% in 1947 to 30 years by ten years from now, wouldrequire car purchases at the rate of 120,000 a year; or just the number forwhich steel has been allocated under the present voluntary program. Withappropriate allowance for car rebuilding, such a freight-car program wouldcost about 500 million dollars a year at 1947 prices. Any acceleration of thisprogram for rehabilitation and expansion of our freight-car fleet, fornational security reasons, would require a car-building schedule substantiallylarger than the present one.
Because of the expected loss in passenger business and its small importanceas compared with freight, only a small part of the necessary equipment out-lays should be for passenger cars. The annual average rate of outlays shouldbe about 80 million dollars at 1947 prices, or roughly the same as in 1947.
Railroad motive power is in process of Dieselization. In 1947, less than4 percent of all locomotive units ordered were powered by steam. In viewof the superior operating efficiency of Diesel locomotives, any projection mustassume a continued upward trend in traffic handled per locomotive. Withallowance for this factor and the age of present locomotives, the projected
Digitized for FRASER http://fraser.stlouisfed.org/ Federal Reserve Bank of St. Louis
traffic level would call for about 1,800 new units per year. An annual out-lay of about 450 million dollars (1947 prices) is entailed. This analysismakes no allowance for the possible substitution of gas turbine locomotiveson a substantial scale, which is still uncertain.
In view of the trend to higher speeds and heavier trains, substantial ex-penditures on permanent way will be needed to reduce grades and curvesand lay heavier rail. Rail replacement needs are closely related to theamount of freight traffic. Total outlays on roadway and structures, in keep-ing with the other projections, should average annually about 300 milliondollars, a rate slightly in excess of the current rate.
Total capital requirements of the railroads would amount to about 1.3to 1.4 billion dollars (1947 prices) annually, representing a rate about one-sixth higher than in 1948. Actual outlays will, of course, depend largely onearnings, rates, construction and equipment costs, and the availability ofexternal financing.
Highways
Highway traffic has increased faster than total production, populationgrowth, or highway capacity. An annual 3 percent increase in output andtransportation would require an annual expenditure of at least 4 billiondollars for maintenance, repair, and new construction of our road system.About one-third of this should be assigned to city streets and expressways,one-third to primary rural roads, and one-third to secondary and localroads. Expenditures in 1949, including maintenance and repair, are notexpected to equal even half our annual long-run needs. Present activitiesin relation to need are much lower than they were either in the 1920's or inthe 1930's and far less than what is needed for the future. Provision for theflow of traffic implied in our production goals calls for an increase in theseexpenditures as labor and materials are released from other uses. It alsoimplies a balanced and economical use of both railroads and highways.
Agricultural investment
The amount of investment that will be required in agriculture to expandoutput in line with consumption requirements will depend considerablyupon the nature of future technological developments. Over the 30 yearsprior to the war there was little change in the combined value, measured inconstant dollars, of farm horses and mules and farm machinery. The sub-stitution of tractor and tractor-drawn machinery for animal power has,however, been an important factor in the substantial increase in farmproduction. The reduction in feed requirements for horses and mules hasfreed many acres for other production. Great increases in productivityhave likewise arisen, without any corresponding increase in capital, fromdevelopments like hybrid corn and improvements in animal breeding andfeeding.
During the war, the pressure for rapid expansion of production, high laborcosts, and increased farm income combined to bring about a rapid increase
59
Digitized for FRASER http://fraser.stlouisfed.org/ Federal Reserve Bank of St. Louis
of investment in tractors and other machinery. This increase has beenaccelerated since the war as such equipment has become more readily avail-able. From January 1, 1940, to January 1, 1948, the number of tractorson farms, and the volume of other machinery and equipment, more thandoubled. Farmers' purchases of motor vehicles, machinery, and equipmentfor use in production and their expenditures on farm buildings totalednearly 10 billion dollars from 1940 through 1945—an average gross in-vestment of more than 1.5 billion dollars a year in current prices, equivalentto 2 to 2 J/2 billion in 1947 prices. Since the war, however, these outlayshave averaged around 4 billion dollars annually (1947 prices). Over thenext few years, an annual gross investment would be desirable at least equalto that during the war years.
Another form of agricultural investment that will be needed is in breed-ing-herds of livestock. The consumption goals that have been outlinedinclude, along with the increase in total production, a substantial shift infavor of livestock products, which are favored both nutritionally and intaste preferences of consumers. Since the war, however, livestock numbershave been decreasing. To attain and maintain the level of output of live-stock products that appears desirable, over 1 billion dollars (1947 prices)should be invested within the next few years in building up herds andflocks. Adding this to the investment in farm power and machinery givesaround 3 billion dollars as an annual farm investment goal.
In addition to the investments just discussed, a substantial amountshould go into land improvements for conserving the soil and maintainingor increasing its fertility. It is difficult to separate farmers' outlays of thiskind between capital investment and current expenses. In addition tofarmers' private outlays, substantial public expenditures are needed for irri-gation, drainage, land retirement, and for encouraging the widespreadadoption of conservation practices in farming and grazing. Publicmeasures in this field are discussed in a subsequent section.
Forest investment
To establish adequate forest growing stocks and otherwise to put ourforests in shape to yield the increased timber growth needed by oureconomy will call for substantial investment in access road constructionin our national forests and in privately-owned timberland, in planting andtimber stand improvement, and in protection of forests from fire, insects, anddisease. Forest investment needs are not limited to the objective of timbergrowing but also include expanding needs for watershed development,forest recreation, forest range, and wildlife.
Commercial construction
New commercial facilities, including stores, restaurants, and other serviceestablishments, follow the growth and redistribution of population. Urbanredevelopment programs and expansion of suburban residential areas will
6o
Digitized for FRASER http://fraser.stlouisfed.org/ Federal Reserve Bank of St. Louis
create the need for commercial construction. In addition, there is need forexpansion of trade facilities even in many areas of stable population, sincesales and activity are now much higher than at the time these areas weredeveloped. Office space is also scarce at the present time, vacancy ratiosbeing less than 1 percent. The volume of construction of stores, restaurants,and garages is currently running at about the levels needed to serve aneconomy growing at the rate ours should expand. However, building foroffices and warehouses is very low and will need to increase from a third to ahalf to take care of present and future needs.
In the immediate future, there is need for restraint in commercial con-struction in order to channel materials into housing. Over the longerrange, however, commercial and private institutional construction shouldincrease somewhat as a proportion of the total, and account for 2 billiondollars or more per year.
The foregoing analysis suggests that the proportion of resources currentlybeing devoted to productive facilities as a whole is somewhat higher thanthe level that will be required on a sustained basis over the next few years tomeet maximum production objectives in a self-sustaining and steadily grow-ing economy. Additions to capital equipment in the past were accom-plished in spurts, and periods in which they exceeded long-run requirementswere followed by periods in which they fell far short. These violent fluctua-tions in private capital outlays have been a major factor in generatingbooms and depressions.
OBJECTIVES FOR CONSUMPTION AND LIVING STANDARDS
In an economy of steady growth moving from postwar to peacetime con-ditions, the output of consumer goods and services should increase not onlyin absolute amounts but also in ratio to total production. In 1948, con-sumers were receiving about 70 percent of gross output, compared with 76percent in 1929 and 75 percent in 1939. Even allowing for the contingencythat Government expenditures and net exports may hereafter account for alarger portion of the Nation's Economic Budget than in previous periods ofhigh employment, it is felt that final consumers should absorb at least 75percent of all goods and services within a few years. Coupling this with thegrowth of the economy as a whole, the result would increase total consump-tion per year by about 4 percent and per capita consumption by about 3percent above present levels.
This higher consumption pattern must be brought about by a substantiallyequivalent increase in total consumer income. It will require improve-ments in the distribution of that income not only to avoid areas of want ina land of plenty, but also to avoid higher saving than is necessary to permitthe expansion of investment needed for stable growth.
Changes in consumption patterns would flow from these desirable develop-
6i
Digitized for FRASER http://fraser.stlouisfed.org/ Federal Reserve Bank of St. Louis
ments. We have already witnessed great strides forward in standards ofconsumption of food and other goods, although here the standards of manylow-income families leave much to be desired. On a national basis, wehave fallen behind in terms of housing accommodations, medical and otherhealth care, and the provision of educational facilities. Assuming higherand better distributed incomes, and adequate governmental programs, rela-tively greater increases may be expected in these areas. Increased leisurewill presumably result also in more travel and higher recreational expendi-tures in general.
Periods of high income and employment are also usually associated witha high proportion of expenditures for durable consumer goods. To someextent in the past this has been the result of the fact that in years of depres-sion such purchases have been postponed. Still, there is little doubt thatan enormous potential market exists for the durable appliances which havecontributed so much to the convenience and comfort of modern life. Serv-ices and durable goods may hereafter absorb a higher proportion of con-sumers' budgets than they did before the war. Nevertheless, there wouldalso be some increase in food consumption, especially in the variety andinterest of the diets of lower income groups, and in other types of non-durable consumption. New frontiers will be provided for the developmentof private initiative by the rise in living standards. The enlargement ofmany community and governmental services will also be required.
Balancing production and consumption
At present, private capital expenditures are running at 15 percent of theNation's Economic Budget, reflecting in part the need to make up for war-time and some prewar deficiencies. The shift to more sustainable long-runpatterns will require a relative decline to about 11 or 12 percent of theNation's Economic Budget, though perhaps a moderate increase in abso-lute amounts. In addition, certain other elements of the Nation's EconomicBudget, such as the Government's foreign-aid program and expansion ofbusiness inventories, will decline in absolute or relative importance. Tosome extent, urgently needed domestic programs of the Government willtake their place. Nevertheless, to reach sustainable patterns of growthwill require that personal consumption increase by considerably more thantotal output and assume a larger relative share in the Nation's EconomicBudget. This means that the general standard of living can and shouldrise substantially.
In the immediate situation there may appear to be a conflict between theincrease in consumption needed to attain long-run objectives, and the actual-ity of inflationary forces to which largely increased consumer demandwould further contribute. The more fundamental danger is that the auto-matic forces of the market tending to increase consumption are of uncertainand perhaps insufficient strength to bring about needed changes in thepatterns of income and expenditure when the temporary factors in demanddecline.
62
Digitized for FRASER http://fraser.stlouisfed.org/ Federal Reserve Bank of St. Louis
One of the great dangers ahead is that the process of adjusting to thesechanged patterns will lead us into a depression through failure of consump-tion to rise sufficiently. But to be forewarned is to be partly, though notwholly, forearmed. Major reliance should be placed upon, and full en-couragement given to, those free automatic forces within the economy whichbring about adjustments. We must get from privately organized activitiesas much handling of the Nation's economic problems as they are capableof achieving. But we should be prepared to supplement them when neededthrough appropriate Government policies directed toward economic balanceat the highest feasible levels of activity. In this, we should not neglect theproblems of those whose living standards have lagged seriously even duringpast and present periods of high prosperity.
PROMOTING ECONOMIC GROWTH
The Government has played an historic role in stimulating the growthof private industry. In earlier times, this aid took the form of grants andprotective tariffs. Present-day conditions require new methods. One ofthese, developed in recent decades and particularly during the war, is Gov-ernment scientific research and development.
Research and information
Progress in this field for military purposes indicates the tremendous bene-fits that may result from scientific research for peacetime application. Re-search in managerial techniques and market information can also be ofgreat value, particularly to small business. The fact-gathering and statis-tical services of the Government are of enormous value to business managers,farmers, and others. There are many gaps in this service which will needto be filled in future years at the same time that care is exercised to see thatduplication is avoided and economies are effected. Standardization andgrading of commercial products and regulation of containers and practiceshave also promoted equitable and economical commerce.
The Government can make a signal contribution to the steady expansionof private industry by accepting responsibility for promoting maximumlevels of employment, production, and purchasing power. When businesshas confidence in the determination to exercise this responsibility vigorously,investment planning will be guided more by long-range objectives of eco-nomic growth and will be influenced less by fear of impending downswingand depression. The major task of such investment planning would thenbe to gauge correctly the impact that an expansion in national incomewill have on the demand for specific products, instead of guessing whethergeneral economic activity is going to expand, shrink, or collapse. The Eco-nomic Reports under the Employment Act should progressively help inthis task.
Digitized for FRASER http://fraser.stlouisfed.org/ Federal Reserve Bank of St. Louis
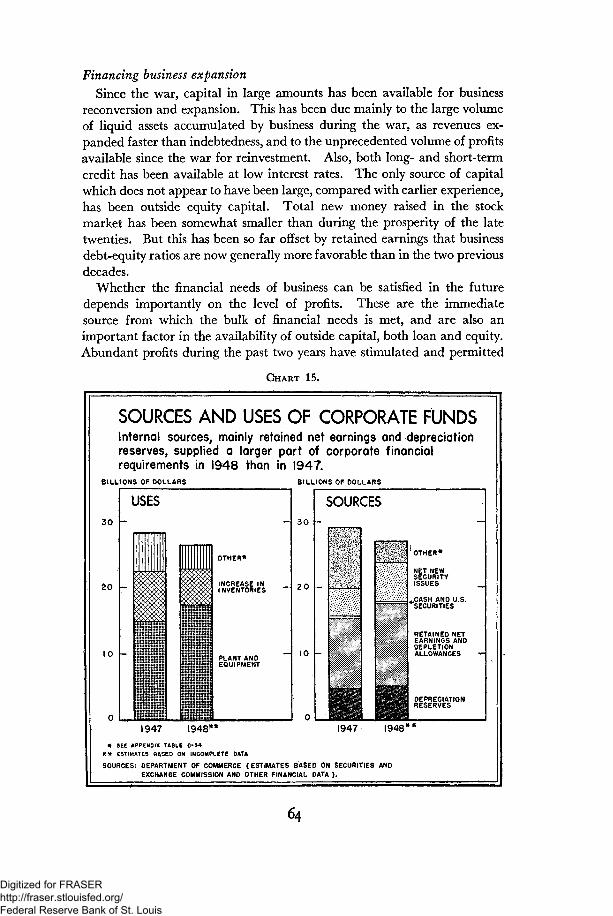
Financing business expansion
Since the war, capital in large amounts has been available for businessreconversion and expansion. This has been due mainly to the large volumeof liquid assets accumulated by business during the war, as revenues ex-panded faster than indebtedness, and to the unprecedented volume of profitsavailable since the war for reinvestment. Also, both long- and short-termcredit has been available at low interest rates. The only source of capitalwhich does not appear to have been large, compared with earlier experience,has been outside equity capital. Total new money raised in the stockmarket has been somewhat smaller than during the prosperity of the latetwenties. But this has been so far offset by retained earnings that businessdebt-equity ratios are now generally more favorable than in the two previousdecades.
Whether the financial needs of business can be satisfied in the futuredepends importantly on the level of profits. These are the immediatesource from which the bulk of financial needs is met, and are also animportant factor in the availability of outside capital, both loan and equity.Abundant profits during the past two years have stimulated and permitted
CHART 15.
SOURCES AND USES OF CORPORATE FUNDSInternal sources, mainly retained net earnings and depreciationreserves, supplied a larger part of corporate financialrequirements in 1948 than in 1947-
BILLIONS OF DOLLARS
30 -
to -
10 -
BILLIONS OF DOLLARS
USES
-
• 1m
r ^
-OTHER*
• , - •
888< INCREASE INW INVENTORIES ~~
« PLANT AND ~~t EQUIPMENT
""!
3 0
2 0
10
0
SOURCES-
.. \..
Hi_am
'OTHER*
NET NEWSECURITYISSUES __
«.CASH AND U.S.SECURITIES
RETAINED NETEARNINGS ANDDEPLETIONALLOWANCES •>-
DEPRECIATIONRESERVES
1947 1948** 1947 1948*
* SEE APPENDIX TABLE C-34
K * ESTIMATES 8ASE0 ON INCOMPLETE DATA
SOURCES: DEPARTMENT OF COMMERCE (ESTIMATES BASED ON SECURITIES ANDEXCHANGE COMMISSION AND OTHER FINANCIAL DATA ) .
64
Digitized for FRASER http://fraser.stlouisfed.org/ Federal Reserve Bank of St. Louis
business investment so large in proportion to total national income that itis probable that investment of a lower proportion in the future will meetour long-term peacetime needs. The general level of profits should con-tinue to be ample so long as we are successful in maintaining high produc-tion and employment.
It should not be assumed, however, that financial resources will be ade-quate for all types of business, or that a higher share of equity investmentwould not be desirable. Difficulties arise, particularly, for small and newbusiness enterprises, which often find it difficult to obtain long-term bankloans and practically impossible to secure outside equity capital. It isundoubtedly true that certain features of our tax system bear particularlyon equity financing. When a reduction in taxes becomes possible, the taxsystem should be revised to strike the best balance between the objectives ofmaintaining adequate consumer markets and of providing capital of theneeded character in adequate amounts.
Important also are the long-range changes that have taken place in thedistribution of income and in the saving habits of the people. Economicpolicy should recognize that the bulk of saving will come from people inthe middle income brackets, who are rightly more concerned with the safetyof their investment than with gains that involve high risks. This calls forfinancial institutions that transform these savings into venture capital.Study should be made of the experience of Nation-wide or local invest-ment companies which can extend venture capital with diversificationof risks. The possibilities of developing other types of organization whichcould effectively channel private savings into venturesome fields of invest-ment and the extent to which the Government can promote them requirethorough exploration. Also, the legal and economic problems of investmentof insurance reserves require continuing study in the light of the change insaving habits of the people and the changing demand for industry financing.The Council of Economic Advisers will continue its work upon theseproblems.
Promoting competition
The problem of achieving a steady rate of growth of our economy is inti-mately bound up with the way the price mechanism operates. If it operatesso as to promote balance among prices, wages, and profits, the role whichGovernment will be called upon to play in seeking to maintain high levelsof employment is thereby reduced. A healthy competition among sellersis an indispensable prerequisite for the proper functioning of the price mecha-nism in promoting a balanced growth in the rates of consumption andinvestment.
In this connection, the role of the antitrust policy is of fundamental im-portance. It is designed to hold in check private monopolistic control, toencourage the competitive forces which induce improvement and expansion,and to maintain freedom of entry for new and enterprising firms. The im-
65
Digitized for FRASER http://fraser.stlouisfed.org/ Federal Reserve Bank of St. Louis
portance of strengthening the antitrust laws has been repeatedly emphasizedin earlier Economic Reports.
Healthy competition, however, cannot be kept adequately in play simplyby legal prohibitions. It must rest upon the attitudes and motivation ofbusiness managements. If they were generally to prefer monopoly to compe-tition, restrictionism to expansion, high profit margins on low production tolower profit margins on high production, security to innovation, then theessential basis of the private enterprise economy could be undermined.
Whether competition is effective now lies substantially within the con-trol of business itself. In highly concentrated industries, there is a choicebetween two roads to profits. One lies in the direction of exploring allavenues of reducing costs and prices and expanding sales, the other in thedirection of exploring all avenues of avoiding price competition with one'srivals. The latter, if dominant, could greatly retard growth even thoughheld short of practices and agreements in violation of the antitrust laws.
If the Government uses the fiscal and other powers at its disposal to mod-erate the swings in general business activity, effective competition shouldkeep cost-price margins down to the levels of reasonable necessity and adjustcapacities to the expectation of greater stability. The extent to which thiseffective competition in large-scale industry is forthcoming will do muchto determine what kind and degree of Government action will be needed topromote economic stability and growth.
Agricultural growth
Our production goals require not only continued expansion of total agri-cultural output but also particular adjustments to the anticipated domesticand foreign demand pattern for foods and other farm products. In addition,shifts in types of output and in farming practices are needed to sustain thefertility of our land. Increased agricultural investment, both public andprivate, is needed in order to support these changes and to make the mostefficient use of our labor.
Achievement of these goals will require rapid advancement of farm tech-nology and its practical application. This means emphasis on research,education, and other programs to aid farmers in carrying out shifts in pro-duction and management practices. These programs should include specialtechnical assistance and adequate credit facilities.
Long-term programs for supporting farm prices and incomes, because oftheir immediacy, are discussed somewhat more fully in Part II of this report.
The long-run downward trend in the proportion of our total labor forceneeded for farm production requirements will continue. It is essential tobroaden the educational opportunities for farm children, and to planvocational training that will help a part of the farm population to qualifyfor profitable off-farm pursuits.
It is one of the unfortunate but salient phenomena of our economy thatcountless families have incomes too low to maintain adequate diets even in
66
Digitized for FRASER http://fraser.stlouisfed.org/ Federal Reserve Bank of St. Louis
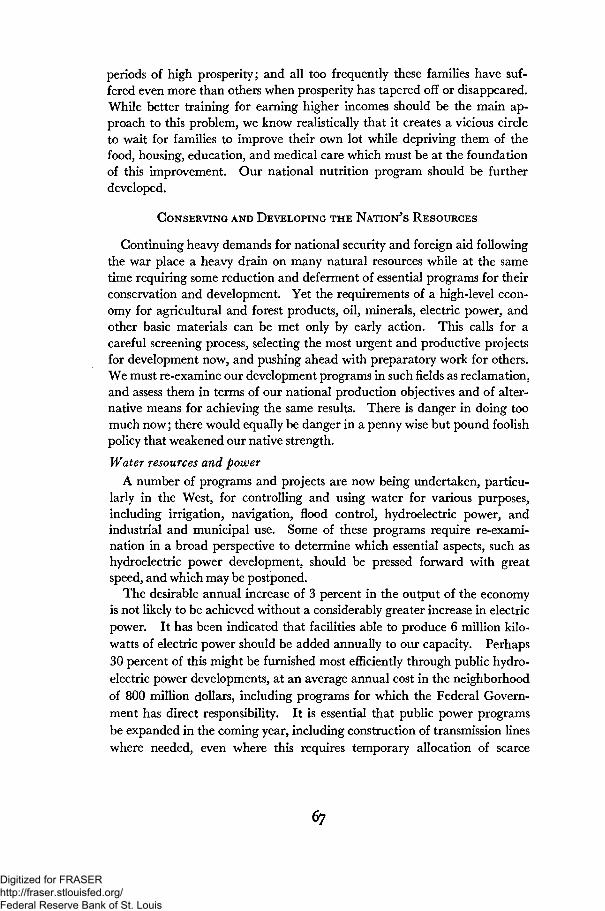
periods of high prosperity; and all too frequently these families have suf-fered even more than others when prosperity has tapered off or disappeared.While better training for earning higher incomes should be the main ap-proach to this problem, we know realistically that it creates a vicious circleto wait for families to improve their own lot while depriving them of thefood, housing, education, and medical care which must be at the foundationof this improvement. Our national nutrition program should be furtherdeveloped.
CONSERVING AND DEVELOPING THE NATION'S RESOURCES
Continuing heavy demands for national security and foreign aid followingthe war place a heavy drain on many natural resources while at the sametime requiring some reduction and deferment of essential programs for theirconservation and development. Yet the requirements of a high-level econ-omy for agricultural and forest products, oil, minerals, electric power, andother basic materials can be met only by early action. This calls for acareful screening process, selecting the most urgent and productive projectsfor development now, and pushing ahead with preparatory work for others.We must re-examine our development programs in such fields as reclamation,and assess them in terms of our national production objectives and of alter-native means for achieving the same results. There is danger in doing toomuch now; there would equally be danger in a penny wise but pound foolishpolicy that weakened our native strength.
Water resources and power
A number of programs and projects are now being undertaken, particu-larly in the West, for controlling and using water for various purposes,including irrigation, navigation, flood control, hydroelectric power, andindustrial and municipal use. Some of these programs require re-exami-nation in a broad perspective to determine which essential aspects, such ashydroelectric power development, should be pressed forward with greatspeed, and which may be postponed.
The desirable annual increase of 3 percent in the output of the economyis not likely to be achieved without a considerably greater increase in electricpower. It has been indicated that facilities able to produce 6 million kilo-watts of electric power should be added annually to our capacity. Perhaps30 percent of this might be furnished most efficiently through public hydro-electric power developments, at an average annual cost in the neighborhoodof 800 million dollars, including programs for which the Federal Govern-ment has direct responsibility. It is essential that public power programsbe expanded in the coming year, including construction of transmission lineswhere needed, even where this requires temporary allocation of scarce
Digitized for FRASER http://fraser.stlouisfed.org/ Federal Reserve Bank of St. Louis
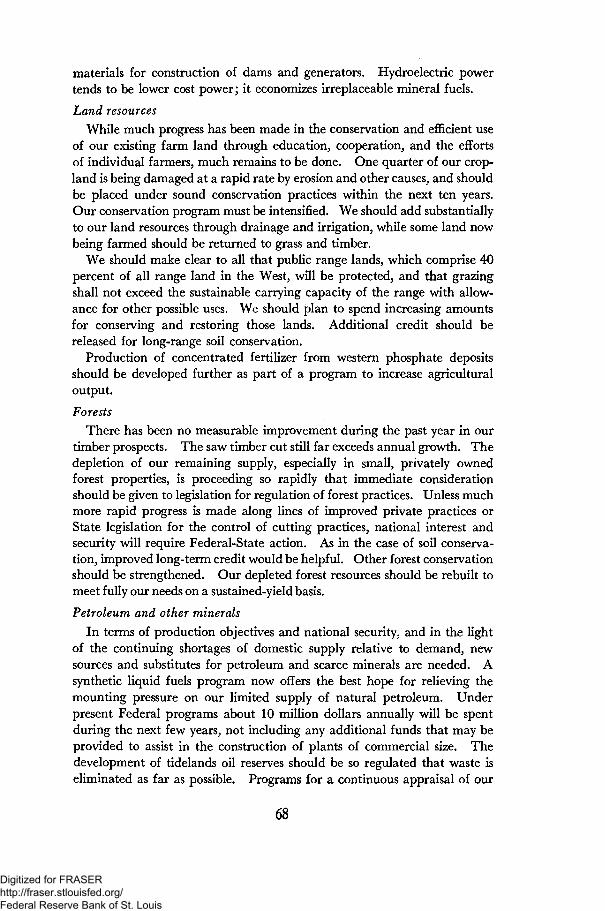
materials for construction of dams and generators. Hydroelectric powertends to be lower cost power; it economizes irreplaceable mineral fuels.
Land resources
While much progress has been made in the conservation and efficient useof our existing farm land through education, cooperation, and the effortsof individual farmers, much remains to be done. One quarter of our crop-land is being damaged at a rapid rate by erosion and other causes, and shouldbe placed under sound conservation practices within the next ten years.Our conservation program must be intensified. We should add substantiallyto our land resources through drainage and irrigation, while some land nowbeing farmed should be returned to grass and timber.
We should make clear to all that public range lands, which comprise 40percent of all range land in the West, will be protected, and that grazingshall not exceed the sustainable carrying capacity of the range with allow-ance for other possible uses. We should plan to spend increasing amountsfor conserving and restoring those lands. Additional credit should bereleased for long-range soil conservation.
Production of concentrated fertilizer from western phosphate depositsshould be developed further as part of a program to increase agriculturaloutput.
Forests
There has been no measurable improvement during the past year in ourtimber prospects. The saw timber cut still far exceeds annual growth. Thedepletion of our remaining supply, especially in small, privately ownedforest properties, is proceeding so rapidly that immediate considerationshould be given to legislation for regulation of forest practices. Unless muchmore rapid progress is made along lines of improved private practices orState legislation for the control of cutting practices, national interest andsecurity will require Federal-State action. As in the case of soil conserva-tion, improved long-term credit would be helpful. Other forest conservationshould be strengthened. Our depleted forest resources should be rebuilt tomeet fully our needs on a sustained-yield basis.
Petroleum and other minerals
In terms of production objectives and national security, and in the lightof the continuing shortages of domestic supply relative to demand, newsources and substitutes for petroleum and scarce minerals are needed. Asynthetic liquid fuels program now offers the best hope for relieving themounting pressure on our limited supply of natural petroleum. Underpresent Federal programs about 10 million dollars annually will be spentduring the next few years, not including any additional funds that may beprovided to assist in the construction of plants of commercial size. Thedevelopment of tidelands oil reserves should be so regulated that waste iseliminated as far as possible. Programs for a continuous appraisal of our
68
Digitized for FRASER http://fraser.stlouisfed.org/ Federal Reserve Bank of St. Louis
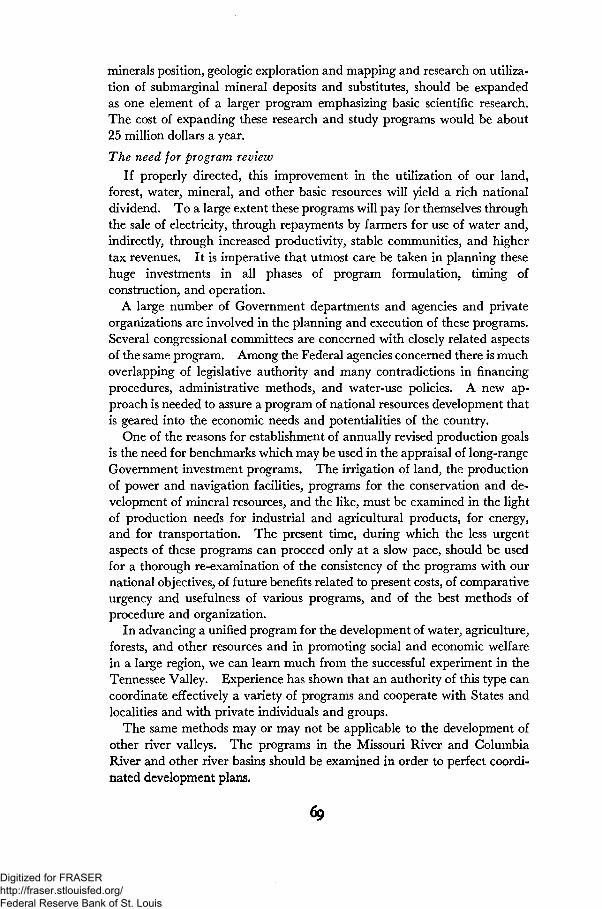
minerals position, geologic exploration and mapping and research on utiliza-tion of submarginal mineral deposits and substitutes, should be expandedas one element of a larger program emphasizing basic scientific research.The cost of expanding these research and study programs would be about25 million dollars a year.
The need for program review
If properly directed, this improvement in the utilization of our land,forest, water, mineral, and other basic resources will yield a rich nationaldividend. To a large extent these programs will pay for themselves throughthe sale of electricity, through repayments by farmers for use of water and,indirectly, through increased productivity, stable communities, and highertax revenues. It is imperative that utmost care be taken in planning thesehuge investments in all phases of program formulation, timing ofconstruction, and operation.
A large number of Government departments and agencies and privateorganizations are involved in the planning and execution of these programs.Several congressional committees are concerned with closely related aspectsof the same program. Among the Federal agencies concerned there is muchoverlapping of legislative authority and many contradictions in financingprocedures, administrative methods, and water-use policies. A new ap-proach is needed to assure a program of national resources development thatis geared into the economic needs and potentialities of the country.
One of the reasons for establishment of annually revised production goalsis the need for benchmarks which may be used in the appraisal of long-rangeGovernment investment programs. The irrigation of land, the productionof power and navigation facilities, programs for the conservation and de-velopment of mineral resources, and the like, must be examined in the lightof production needs for industrial and agricultural products, for energy,and for transportation. The present time, during which the less urgentaspects of these programs can proceed only at a slow pace, should be usedfor a thorough re-examination of the consistency of the programs with ournational objectives, of future benefits related to present costs, of comparativeurgency and usefulness of various programs, and of the best methods ofprocedure and organization.
In advancing a unified program for the development of water, agriculture,forests, and other resources and in promoting social and economic welfarein a large region, we can learn much from the successful experiment in theTennessee Valley. Experience has shown that an authority of this type cancoordinate effectively a variety of programs and cooperate with States andlocalities and with private individuals and groups.
The same methods may or may not be applicable to the development ofother river valleys. The programs in the Missouri River and ColumbiaRiver and other river basins should be examined in order to perfect coordi-nated development plans.
69
Digitized for FRASER http://fraser.stlouisfed.org/ Federal Reserve Bank of St. Louis
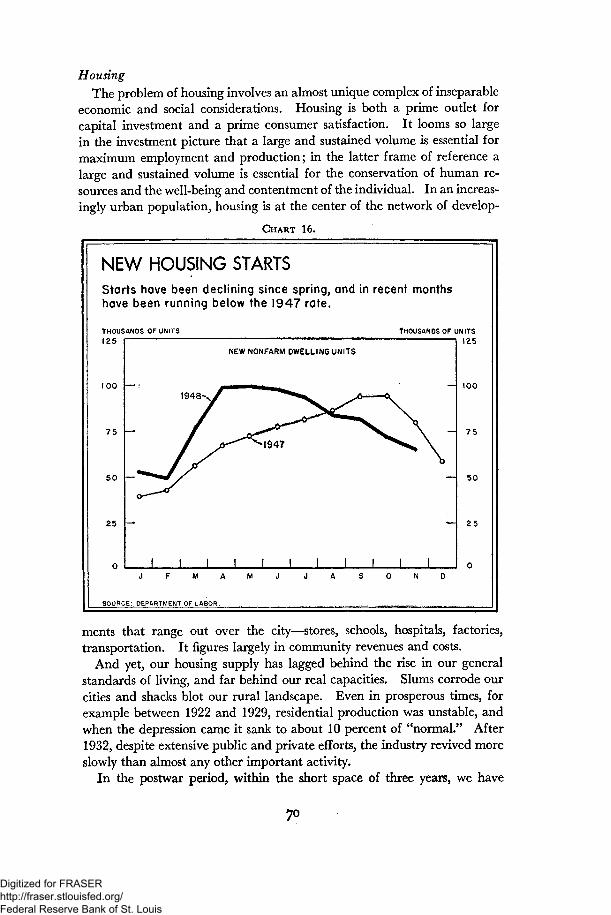
HousingThe problem of housing involves an almost unique complex of inseparable
economic and social considerations. Housing is both a prime outlet forcapital investment and a prime consumer satisfaction. It looms so largein the investment picture that a large and sustained volume is essential formaximum employment and production; in the latter frame of reference alarge and sustained volume is essential for the conservation of human re-sources and the well-being and contentment of the individual. In an increas-ingly urban population, housing is at the center of the network of develop-
CHART 16.
NEW HOUSING STARTSStarts have been declining since spring, and in recent monthshave been running below the 1947 rate.
THOUSANDS OF UNITS
125
100
75
5 0
25
0
—
-
I
NEW NONFARM DWELLING UNITS
J ^
I I I !
\
—
1 1 1 1 I
THOUSANDS OF UNITS
125
100
75
50
25
SOURCE: DEPARTMENT OF LABOR.
ments that range out over the city—stores, schools, hospitals, factories,transportation. It figures largely in community revenues and costs.
And yet, our housing supply has lagged behind the rise in our generalstandards of living, and far behind our real capacities. Slums corrode ourcities and shacks blot our rural landscape. Even in prosperous times, forexample between 1922 and 1929, residential production was unstable, andwhen the depression came it sank to about 10 percent of "normal." After1932, despite extensive public and private efforts, the industry revived moreslowly than almost any other important activity.
In the postwar period, within the short space of three years, we have
70
Digitized for FRASER http://fraser.stlouisfed.org/ Federal Reserve Bank of St. Louis
already witnessed a substantial expansion in home building, which cut intothe acute shortage but has served the population very unevenly. Startshave commenced recently to decline. This decline has been taking place,not because of shortages of manpower or materials, not because the housingneeds of the country have been met, and not because "backlogs" in anyreal sense have disappeared. It is occurring because the housing product,more conspicuously than any other, has priced itself out of any reasonablydefined market. This is not a mere inflationary phenomenon, but ratherthe resumption of a long prewar trend. It reflects the technological back-wardness of the housing industry and a host of related conditions such asland use and local taxation.
Analyses based on the assumption of continued full employment and highnational income indicate that our housing needs cannot even be approachedwithout a comprehensive program. Against an estimated annual need of amillion or more new dwelling units in urban areas for a 10-year period,analysis shows that perhaps one-fifth or more can be provided at workablerent-income relationships only through subsidized low-rent housing. Avery substantial part of the balance of the need will require large-scaleprivate institutional investment quite different in its nature from the small-scale home building that has typified the industry.
Most of the houses built since the war, high in price, have either servedthe needs of the high income groups, or, with the aid of very high publicguarantees to private investors, have been sold to people of low or moderatemeans at costs which might involve losses both to them and to the Govern-ment in the long run. About 80 percent of the housing now being builtis for sale, although veterans and others with families of uncertain futuresize and jobs of uncertain tenure would much prefer to rent. And nowthe decline in starts has set in, before achieving even for one year a rateof new construction as high as the estimated annual need for ten years.
Vigorous efforts to reduce housing costs are an essential part of a long-range program, but cannot be expected to produce prompt enough resultsto meet pressing current needs. Such efforts should recognize that a largeand assured volume is the best foundation for achieving economy in produc-tion, or for working out changes in hourly wage rates consistent with fairannual earnings and reasonable security for the workers involved.
Enactment of the remaining portions of the comprehensive housing pro-gram already before the Congress would be a starting operation toward themore effective solution of the housing problem. It would provide facilitiesfor research and better community planning directed toward lower costs;it would aid in the assembly of land areas suitable for redevelopment; itwould provide a modest flow of rental housing for families of low andmoderate income in urban areas; and it would directly tackle the insuffi-ciency and inadequacy of rural housing.
But these proposals are inadequate. For example, the provision of
Digitized for FRASER http://fraser.stlouisfed.org/ Federal Reserve Bank of St. Louis
1005000 units a year of low-rent housing in urban areas should be sub-stantially increased. If this were accompanied by a more rigorous screeningof Federal aid in the form of insurance or guarantees for high-priced hous-ing, it would not lead to a higher total volume than should be undertakenimmediately in view of competing demands upon the economy* In fact,less materials per house would be used, and the composition of houseproduction would be more in accord with sustainable patterns for the future.The increase in the Federal financial burden imposed by a more adequateprogram would be moderate. While every additional dollar in the Budgetmakes it larger, the inflationary impact should be measured by the effect onthe housing industry as a whole. The amount of housing generated by thisexpanded program would absorb less critical materials and manpower thanan equal number of units built for the higher-priced trade.
Human resources
The end objective of our economic and political system is to provide theindividual with the means for a high standard of living and with wideropportunities for cultural pursuits. These aims will be furthered by thededication of more of our resources to education, to health, to housing, andto the enrichment of the whole physical environment—both urban andrural—in which people live and work and play. The specific programsdirected toward these ends, and their intimate relationships to a healthyeconomic structure, have been identified in the Economic Report of thePresident last year and in subsequent messages. It is therefore unnecessaryto spell them out in detail again here. But this does not imply any abate-ment of interest on the part of the Council of Economic Advisers in theirfulfillment. As our continuing studies shed more light upon how these pro-grams may be even more closely integrated with the maintenance of a highlevel of economic activity, or how improvement in them may have generaleconomic significance, we shall treat of them again.
INTERNATIONAL ECONOMIC RELATIONS
Balanced economic growth will require large increases in our imports ofraw materials and many other goods and services. Our own interests re-quire that we concentrate domestic productive efforts in those fields wherewe can produce most efficiently and not draw down our reserves of exhaust-ible resources unduly. We need large imports to strengthen our conserva-tion policy and increase the stock piles of critical materials; our imports alsoprovide exchange to purchasers of our exports.
The main lines of international economic policy for balanced economicgrowth have already been laid out, and great progress has been made inimplementing them. The initiation of the European Recovery Program wasthe main additional step taken during 1948 in pursuit of the goal of worldrecovery and reconstruction. Further progress was also made towardcreating conditions for the post-recovery exgansion of world trade on a
72
Digitized for FRASER http://fraser.stlouisfed.org/ Federal Reserve Bank of St. Louis
nondiscriminatory and multilateral basis. The proposed charter for anInternational Trade Organization was accepted, after difficult negotiations,by 54 countries; and the General Agreement on Tariffs and Trade cameinto effect. These measures are important steps in the direction of reducingthe barriers to world trade.
Another aspect in the development of international economic policy isthe better coordination of our international trade policies with policies incertain other areas of the economy. The present situation of prosperityat home and of extensive American participation in economic affairs abroadoffers a favorable opportunity for progress in this field.
Conflicts between our foreign and domestic programs lie less in generalpolicy than in specific actions. The most serious of these arise out ofprograms designed to protect domestic producers of specific commodities.While these conflicts tend to be submerged in periods of intense demand andinflationary pressure, they may be expected to appear in acute form whensome markets ease. The best time to resolve these conflicts is now.
The basic approach in readjusting these domestic programs to our inter-national policy should be similar to that involved in the improvement offarm price support policies: namely, to provide the necessary degree ofdomestic support in periods when it may be needed, but at the same time toencourage adjustment of production in line with the basic supply anddemand conditions throughout the world. Existing programs adopted toprotect less productive industries indefinitely not only are contrary to ourbasic international policy, but also impede our efforts at home to make fulland efficient use of our resources. They are a hangover from a period offear of inadequate market and employment opportunities.
Even with the maximum feasible level of imports, substantial foreigninvestment will be needed to maintain a level of exports sufficiently high toavoid a painful readjustment in certain areas of domestic agricultural andindustrial production. Furthermore, such investment will probably berequisite if Western Europe is to relax its restrictive policies and still balanceits international payments at a high level after the European RecoveryProgram is over.
In the international field, the inseparability of economic and politicalobjectives is particularly apparent; and it is not only in Western Europethat our economic policy must serve a dual purpose. Major areas of theworld have emerged from the prewar and war years with a determinationto develop their own economic resources by improving their industrial andagricultural equipment. This determination reflects a basic popular aspira-tion on the part of hundreds of millions throughout the world towards higherstandards of living and economic progress after centuries of grindingpoverty. The United States cannot maintain its world position of moralprestige and political leadership unless it positively supports thoseaspirations.
23
Digitized for FRASER http://fraser.stlouisfed.org/ Federal Reserve Bank of St. Louis
Our abundant stock of capital and large savings enable us to do thisby making both capital goods and our knowledge of technology andproduction methods available abroad. This function is now being per-formed in a small degree by private capital, either directly or through theInternational Bank for Reconstruction and Development. It is to be hopedthat it can be done more fully by private capital rather than Governmentaid as foreign countries bent on capital development give reasonable assur-ance of safety to private investors. This they must do if they wish to securecapital in large amounts.
FROM INFLATION TO STABILITY
Stabilization policy for the immediate future is still concerned mainlywith restraining inflationary forces, breaking bottlenecks, and selectively ad-justing the markets and prices of some commodities. Yet this report hasdesignated some basic longer run maladjustments concealed under cover ofthe inflationary boom. Since the war, increases in consumption have beenlimited by the very high demands of business for reconversion and moderni-zation after the war, and by requirements for national defense and foreignaid. Our analysis shows that over the ensuing years consumer income andexpenditure should be increased both absolutely and relatively.
The fundamental issue is: Will this increase result automatically throughthe interplay of prices and costs in the market place? Or will a depressionappear when the gap between potential output and effective demand ofconsumers and business becomes unmanageable as has happened in thepast? Or can affirmative policies, as envisaged in the Employment Act,close or bridge this gap before it becomes a chasm?
Fundamental strength of the economy
It is true that the economy today is in much better position to withstandshock than in the twenties. Business has become better informed and moreprudent, particularly in its inventory policies. There has been less specu-lation generally. The so-called "built-in flexibilities", such as the socialsecurity system, veterans' programs, and the farm price-support programwould all have a cushioning effect in case of a downswing. In general,large Government budgets make an economy more resistant to shock, and onthe revenue side the progressive income tax increases flexibility. War-cre-ated liquid assets, in the hands of business, State and local governments, andindividuals could act as an immediate shock absorber even though their realvalue has been reduced by inflation. Federal deposit insurance wouldoperate against large-scale withdrawals of funds such as occurred duringthe last depression, and the Reconstruction Finance Corporation could exertsome mitigating influence. Finally, with a tight labor market, more bread-winners per family, and more progressive taxation, the distribution of in-come has improved since the prewar period, although these gains have beenhalted by inflation,
74
Digitized for FRASER http://fraser.stlouisfed.org/ Federal Reserve Bank of St. Louis
Vulnerability of the economy
These improvements, however, probably do not outweigh the fact that avery high-level economy, which has been supported by an investment boomand permeated with inflation, is vulnerable to sharp declines. Moreover, interms of the basic problems of lifting consumption to higher levels in theyears ahead, we cannot rely on a simple reversal of the inflationary processwith its accompanying lag in consumption. When price weakness becomeswidespread, businessmen tend to become pessimistic and often curtail in-vestment and production; consumer purchases are deferred. The stickinessof many prices enhances the shrinking of production as demand falls off.Consumers' real incomes are cut by unemployment more quickly than theygain by price declines. The slack thus develops into a downward spiral.
Preventive measures
More important than the preparation of measures to combat a depressionafter its advent, are those measures which reduce the likelihood of a seriousdownturn in the economy by correcting maladjustments in time.
The long-term problem of a shift in the balance between investment andconsumption depends for its solution largely upon an improved working ofthe market mechanism. Adjustments in prices and in wages, or some com-bination of the two, are the primary tools. In general, these adjustmentsentail an upward movement of wages relative to prices. But these adjust-ments require the drawing of some very delicate lines. It is not easy todetermine the exact point at which price decreases which increase salesbecome price decreases which impair business confidence or income and thusreduce production. It is not easy to determine the exact point at whichwage increases which add to purchasing power become deflationary becausethey add too much to costs. It is difficult through the market mechanismalone to solve the problem of timing, to determine just when the shifts inthe composition of national income and spending should be encouragedwithout being either excessively inflationary or excessively deflationary.Furthermore, these shifts involve the interests of powerful organized groupsand also involve competing social priorities or values, so that agreementsare frequently not easy to reach.
The problem of inflation is not limited to the peculiar conditions of the"postwar boom." There is a continuing possibility of increases in pricesand wages in an economy sustained at high levels of activity. Here lies aproblem of long-range wage and price policies that must be solved within thecontext of general labor-management relations. The important organizedgroups within the economy, such as business, labor and agriculture, needboth the economic analysis and the practical machinery which will enablethem better to harmonize their separate interests with the common goodand to compose even if not completely agree upon those matters whichfrom a narrower perspective might seem irreconcilable. The work under
75
Digitized for FRASER http://fraser.stlouisfed.org/ Federal Reserve Bank of St. Louis
the Employment Act of 1946, boldly conceived and faithfully exercised, canhelp to improve the economic analysis and to stimulate the cooperationrequired for this central aspect of stabilization in a free enterprisedemocracy.
Experience teaches that Government policies are also necessary. Onetype of public policy, the expansion of social security programs, is particularlyappropriate now because it would strengthen mass purchasing power andmarkets in the long run, while contributing immediately to the restraintof inflationary pressures. By increasing the coverage and benefits of unem-ployment and old age insurance, by introducing disability and health insur-ance, and by providing more adequate public assistance, we would thus con-tribute towards that reconciliation of immediate and longer-run needs whichis so difficult to achieve through the market mechanism.
To have the optimum immediate anti-inflationary effect, payroll taxesshould be increased by more than the increase in benefit payments. Tohave the optimum long-range stabilizing effect, the expansion of these pro-grams should not be financed exclusively by payroll taxes. It should drawsome support in future years from general budget sources.
A minimum wage realistically adjusted to present price levels also helpsto maintain a floor under wage incomes.
Future tax revisions should also take account of the need to strengthenconsumer markets, even while they should not neglect the need for stimu-lating investments, especially in areas which offer both great rewards andheavy risks.
These social security programs, minimum wage laws, and tax revisionsare recommended on the ground of social objectives. These same programs,however, have an important economic impact and may help to maintain orincrease the purchasing power of a considerable sector of the people.
Balanced growth. The upward adjustment of consumer incomes rela-tively to prices will be essential in the future to establish sustainable pat-terns of balanced economic growth. It is important that these adjustmentsbe made. But we cannot be sure that these adjustments alone will insure anincrease in consumption and the maintenance of a high level of activity.Decreases in prices or increases in costs may lead to a recession if they occurat a time when markets are weak and aggregate demand is shrinking.Therefore it is essential that, during threatening times, adequate support begiven to demand while fundamental adjustments are going on.
Such support may be provided by stepping up these basic governmentalprograms which are essential to economic growth. At times it may becomenecessary to supplement these programs by specific measures to insurestability. Without adjustments in the price-wage-profit relationship, weshall not be able to place the economy on a basis of continuing stability.Without the simultaneous adoption of policies designed to promote economic
Digitized for FRASER http://fraser.stlouisfed.org/ Federal Reserve Bank of St. Louis
growth, we may not safely rely on the adjustments. It is necessary tocombine measures that promote growth with those that support stabilityin an integrated program.
We should adapt our policies accordingly. In schools, housing, healthand community facilities, resource development and conservation, trans-portation and other fields, there are enormous discrepancies between thework now being done and the needs of a growing economy. Advanceplanning on all these fronts should go forward in larger magnitudes thanpresent programs can be pushed. With careful timing, these programsshould be stepped up sufficiently so that adjustments in costs, prices andprofits can be made on a strong underpinning which prevents adjustmentsfrom turning into a downswing.
77
Digitized for FRASER http://fraser.stlouisfed.org/ Federal Reserve Bank of St. Louis

Digitized for FRASER http://fraser.stlouisfed.org/ Federal Reserve Bank of St. Louis
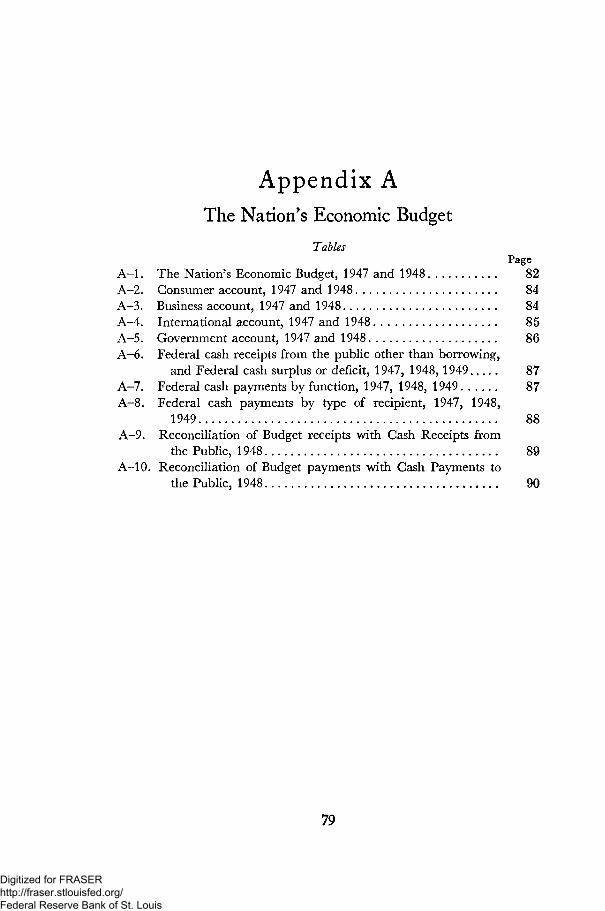
Appendix AThe Nation's Economic Budget
TablesPage
A-l . The Nation's Economic Budget, 1947 and 1948 82A-2. Consumer account, 1947 and 1948 84A-3. Business account, 1947 and 1948 84A-4. International account, 1947 and 1948 85A-5. Government account, 1947 and 1948 86A-6. Federal cash receipts from the public other than borrowing,
and Federal cash surplus or deficit, 1947, 1948,1949 87A-7. Federal cash payments by function, 1947, 1948, 1949 87A-8. Federal cash payments by type of recipient, 1947, 1948,
1949 88A-9. Reconciliation of Budget receipts with Cash Receipts from
the Public, 1948 89A—10. Reconciliation of Budget payments with Cash Payments to
the Public, 1948 90
79
Digitized for FRASER http://fraser.stlouisfed.org/ Federal Reserve Bank of St. Louis
The Nation's Economic Budget
The Nation's Economic Budget is designed to show significant changesin the economy as indicated by the receipts and expenditures of consumers,business, and government, and by international transactions. The net addi-tions to and absorption of saving of these groups are also shown in theBudget. The total of the Nation's Economic Budget measures the grossnational product, i. e., total current production of goods and services.On the receipts side the total consists of wages and salaries, retainedbusiness earnings, and other incomes relating to current production, andon the expenditure side of purchases of current output.
Besides expenditures for current output and the corresponding receiptsthere are transfers of purchasing power, such as government payments tosocial security beneficiaries and veterans' pensions. While governmentaltransfers are not derived from current production, as a source of purchasingpower they do not differ from any of the payments that are so derived.They have an important bearing on production and prices and are includedin the Nation's Economic Budget. Omitting transfers from governmentaccounts would understate the size and impact of government budgets onincomes and expenditures of consumers, business and foreign trade. In aneconomic analysis, transactions directly related to current production andgovernmental transfers must both be taken into consideration.
In the presentation of the Nation's Economic Budget in previous economicreports, transfers were accordingly included with the other governmentaltransactions on the expenditure side, and the receipt of such transfers intotal receipts of consumers. The sum of receipts and expenditures, includ-ing both transfers and transactions related to current production, is, ofcourse, in excess of the gross national product. In order to reconcile withthe gross national product, which is the magnitude used to measure eco-nomic activity, an adjustment was made to deduct the transfer items. Thislarge adjustment item gave rise to many questions.
In the present revised presentation of the Nation's Economic Budget anattempt has been made to limit the "adjustment" item to corrections of astatistical character. Government transfers are shown separately from ex-penditures for goods and services in the government expenditure accountand also shown as separate items of receipts in the accounts of consumers,business, and foreign countries and international organizations. Thesetransfer items and subtotals including transfer items are shown in italics,while the flows relating to current production are shown in roman type.
80
Digitized for FRASER http://fraser.stlouisfed.org/ Federal Reserve Bank of St. Louis
Only the latter figures are added to arrive at the total. This total thenneeds no major adjustments to make it equal to the gross national product.
Since the transfers of the government augment the income of consumers,business, or foreign countries, the transfer expenditures and receipts areconceptually equal. The small discrepancy between the totals is due tostatistical problems of measurement. (See note to line 22 of table A-l.)
Tables A-2 through A-5 contain the accounts of consumers, business,international transactions, and the government. They indicate how thereceipts and expenditures in each account have been derived, and presentsome break-down of the totals where this has been feasible. Some textualexplanatory material relating to the consumer, business, and internationalaccounts may be found in the Midyear Economic Report of the President ofJuly 1948. Table V, the government account, is new in its present form.It shows the reconciliation between taxes estimated on a payment or aliability basis (personal and indirect business tax payments, liabilities oncorporate income) and cash receipts from the public, and between ex-penditures for goods and services and cash payments to the public. (TableA-5 takes the place of tables 5, 12, 13, and 14 of appendix A in the MidyearEconomic Report, July 1948.)
Following the government account, table A-5, there are three supple-mentary tables on Federal cash receipts and payments. These tables show(a) Federal cash receipts by major tax sources, (b) Federal cash paymentsby major governmental function, and (c) payments according to the typeof recipient who initially receives the payment, whether consumers, busi-ness, foreign countries, or State and local governments. (Tables A-6,A-7, and A-8.) These tables are designed to give an insight into the impactof the government on the economy. To aid in analysis, advance estimatesare given for calendar 1949 in addition to actual data for 1947 and lateestimates for 1948. The 1949 estimates of payments are based on thePresident's program and are consistent with the proposed Budget of theUnited States for fiscal 1950. The estimates of tax receipts, however, arebased in general on present tax legislation.
Tables A-9 and A-10 show the reconciliation of Budget receipts with cashreceipts from the public, and Budget expenditures with cash payments tothe public. A brief explanation of these reconciliations is contained in theMidyear Economic Report, page 56.
8i
Digitized for FRASER http://fraser.stlouisfed.org/ Federal Reserve Bank of St. Louis
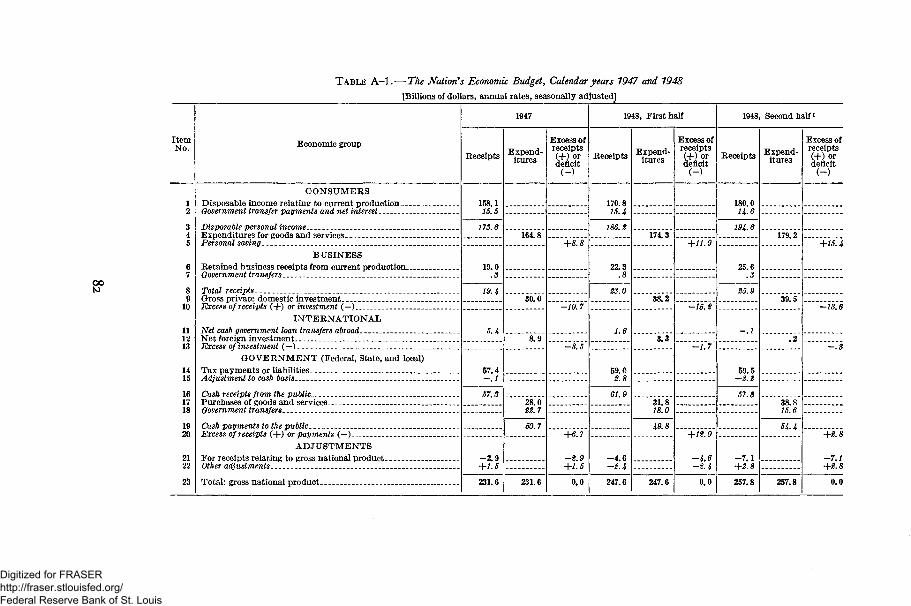
TABLE A - l . — The Nation's Economic Budget, Calendar years 1947 and 1948
[Billions of dollars, annual rates, seasonally adjusted]
ItemNo.
12
345
67
89
10
111213
1415
161718
1920
2122
23
Economic group
CONSUMERSDisposable income relating to current productionGovernment transfer payments and net interest
Disposable personal incomeExpenditures for goods and services . .Personal saving.
BUSINESSRetained business receipts from current productionGovernment transfers __ . ._. __. _
Total receipts _ _Gross private domestic investment.Excess of receipts (+) or investment (—) _
INTERNATIONALNet cash government loan transfers abroad _Net foreign investmentExcess of investment (—)
GOVERNMENT (Federal, State, and local)Tax payments or liabilities __ __Adjustment to cash basis __ __ _
Cash receipts from the publicPurchases of goods and services..Government transfers _
Cash payments to the public _Excess of receipts (+) or payments (—)
ADJUSTMENTSFor receipts relating to gross national product.-Other adjustments
Total: gross national product _ _
1947
Receipts
158.115.5
173.6
19.0.3
19.4
5 4
57.4—. 1
57.3
- 2 . 9+1 5
231.6
Expend-itures
164.8
30.0
8.9
28.022.7
50.7
231.6
Excess ofreceipts(+)ordeficit
+8.8
—10.7
—3.5
+6 ?
-2.9+1 5
0.0
1948, First half
Receipts
170.815.4
186.2
22.3.8
23.0
1.6
59.02.8
61.9
- 4 . 6—2 4
247.6
Expend-itures
174.3
38.2
3.3
31.818.0
49.8
247.6
Excess ofreceipts(+)ordeficit
+11.9
—15.2
—1.7
+12 0
-4.6-2.4
0.0
1948, Second half i
Receipts
180.014.6
194.6
25.6.3
25.9
-.1
59.5—2.2
57. S
- 7 . 1+2,8257.8
Expend-itures
179.2
39.5
.2
38.815.6
54.4
257.8
Excess ofreceipts(+)ordeficit
+15.4
-13.6
-.3
+2.8
-7.1+2.8
0.0
Digitized for FRASER http://fraser.stlouisfed.org/ Federal Reserve Bank of St. Louis
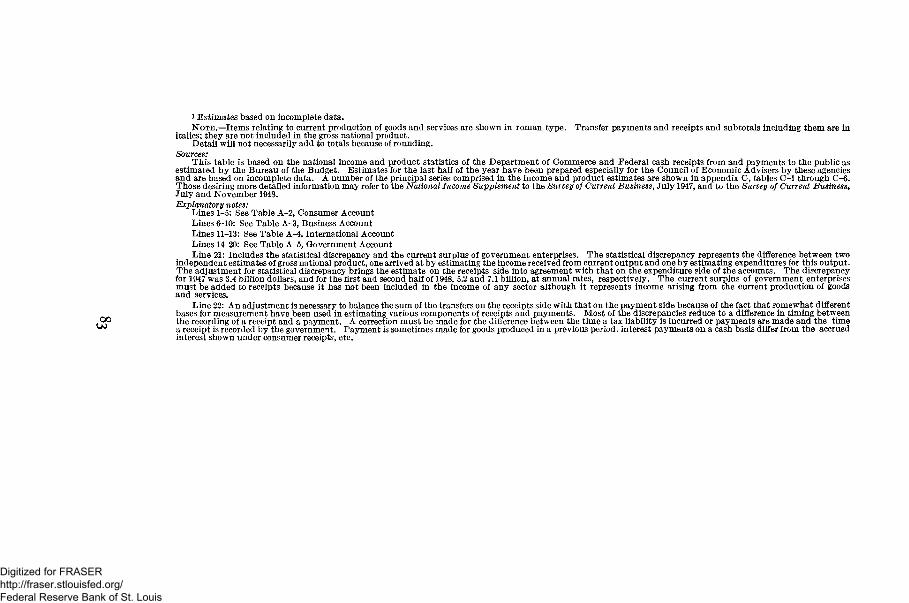
1 Estimates based on incomplete data.NOTE.—Items relating to current production of goods and services are shown in roman type. Transfer payments and receipts and subtotals including them are in
italics; they are not included in the gross national product.Detail will not necessarily add to totals because of rounding.
Sources:This table is based on the national income and product statistics of the Department of Commerce and Federal cash receipts from and payments to the public as
estimated by the Bureau of the Budget. Estimates for the last half of the year have been prepared especially for the Council of Economic Advisers by these agenciesand are based on incomplete data. A number of the principal series comprised in the income and product estimates are shown in appendix C, tables C-l through C-6.Those desiring more detailed information may refer to the National Income Supplement to the Survey of Current Business, July 1947, and to the Survey of Current Business,July and November 1948.Explanatory notes:
Lines 1-5: See Table A-2, Consumer AccountLines 6-10: See Table A-3, Business AccountLines 11-13: See Table A-4, International AccountLines 14-20: See Table A-5, Government AccountLine 21: Includes the statistical discrepancy and the current surplus of government enterprises. The statistical discrepancy represents the difference between two
independent estimates of gross national product, one arrived at by estimating the income received from current output and one by estimating expenditures for this output.The adjustment for statistical discrepancy brings the estimate on the receipts side into agreement with that on the expenditure side of the accounts. The discrepancyfor 1947 was 3.4 billion dollars, and for the first and second half of 1948, 5.2 and 7.1 billion, at annual rates, respectively. The current surplus of government enterprisesmust be added to receipts because it has not been included in the income of any sector although it represents income arising from the current production of goodsand services.
Line 22: An adjustment is necessary to balance the sum of the transfers on the receipts side with that on the payment side because of the fact that somewhat differentbases for measurement have been used in estimating various components of receipts and payments. Most of the discrepancies reduce to a difference in timing betweenthe recording of a receipt and a payment. A correction must be made for the difference between the time a tax liability is incurred or payments are made and the timea receipt is recorded by the government. Payment is sometimes made for goods produced in a previous period, interest payments on a cash basis differ from the accruedinterest shown under consumer receipts, etc.
Digitized for FRASER http://fraser.stlouisfed.org/ Federal Reserve Bank of St. Louis
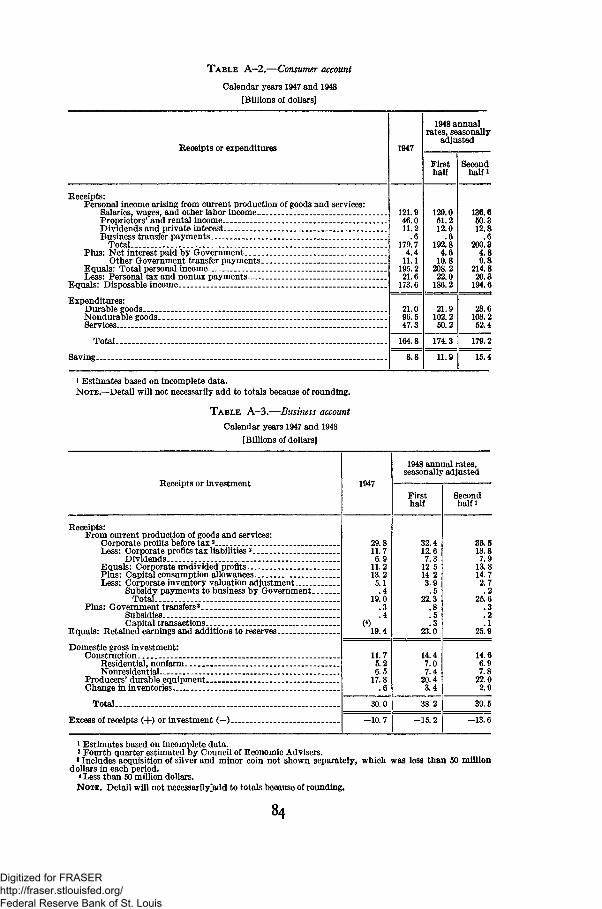
T A B L E A—2.—Consumer account
Calendar years 1947 and 1948
[Billions of dollars]
Receipts or expenditures 1947
1948 annualrates, seasonally
adjusted
Firsthalf
Secondhalf i
Receipts:Personal income arising from current production of goods and services:
Salaries, wages, and other labor incomeProprietors' and rental income _ _Dividends and private interest _ _Business transfer payments _._
TotalPlus: Net interest paid by Government
Other Government transfer paymentsEquals: Total personal incomeLess: Personal tax and nontax payments—
Equals: Disposable income
Expenditures:Durable goodsNondurable goodsServices _
Total
Saving _
121.946.011.2
.6179.7
4.411.1
195.221.6
173.6
129.051.212.0
.6192.8
4.610.8
208.222.0
186.2
136.650.312.8
.6200.3
4.89.8
214.820.3
194.6
21.096.547.3
21.9102.250.2
23.6103.252.4
164.8 174.3 179.2
8.8 11.9 15.4
i Estimates based on incomplete data.NOTE.—Detail will not necessarily add to totals because of rounding.
TABLE A—3.—Business account
Calendar years 1947 and 1948
[Billions of dollars]
Receipts or investment
Receipts:From current production of goods and services:
Corporate profits before tax2
Less: Corporate profits tax liabilities 3 .Dividends
E quals: C orporate undivided profitsPlus: Capital consumption allowancesLess: Corporate inventory valuation adjustment _.
Subsidy payments to business by GovernmentTotal
Plus: Government transfers8
Subsidies _Capital transactions
Equals: Retained earnings and additions to reserves
Domestic gross investment:Construction .._ . .
Residential, nonfannNonresidential
Producers'durable equipmentChange in inventories _ __
Total .
Excess of receipts (+) or investment (—) .
1947
29.811.76.9
11.213.25.1.4
19.0.3.4
(4)19.4
11.75.26.5
17.8.6
30.0
-10.7
1948 annual rates,seasonally adjusted
Firsthalf
32.412.67 3
12.514.23.9.5
22 3.8.5.3
23.0
14.47.07.4
20.43.4
38.2
—15.2
Secondhalfi
35.513.87.9
13.814.72.7.2
25.6.3.2.1
25.9
14.66.97.8
22.02.9
39.5
-13.6
1 Estimates based on incomplete data.2 Fourth quarter estimated by Council of Economic Advisers.*Includes acquisition of silver and minor coin not shown separately, which was less than 50 million
dollars in each period.< Less than 50 million dollars.NOTE. Detail will not necessarily^add to totals because of rounding.
Digitized for FRASER http://fraser.stlouisfed.org/ Federal Reserve Bank of St. Louis
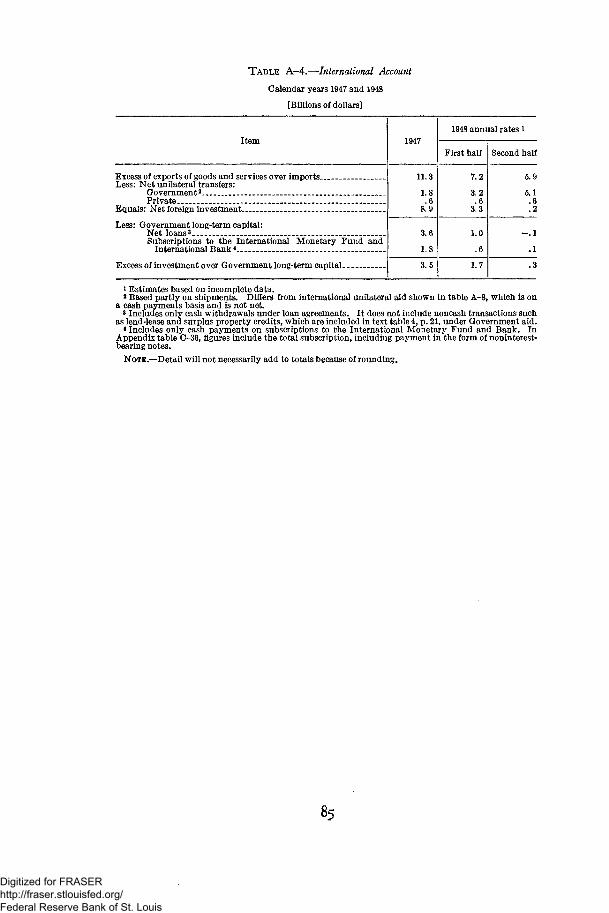
TABLE A-4.—International Account
Calendar years 1947 and 1948
[Billions of dollars]
Item
Excess of exports of goods and services over importsLess: Net unilateral transfers:
Government3 .Private _ _
Equals: Net foreign investment—
Less: Government long-term capital:Net loans3 _ _Subscriptions to the International Monetary Fund and
International Bank * _
Excess of investment over Government long-term capital
1947
11.3
1.8.6
8.9
3.6
1.8
3.5
1948 annual rates i
First half
7.2
3.2.6
3.3
1.0
.6
1.7
Second half
5.9
5.1.6.2
- . 1
.1
.3
1 Estimates based on incomplete data.* Based partly on shipments. Differs from international unilateral aid shown in table A-8, which is on
a cash payments basis and is not net.* Includes only cash withdrawals under loan agreements. I t does not include noncash transactions such
as lend-lease and surplus property credits, which are included in text table 4, p. 21, under Government aid.* Includes only cash payments on subscriptions to the International Monetary Fund and Bank. In
Appendix table C-36, figures include the total subscription, including payment in the form of noninterest-bearing notes.
NOTE.—Detail will not necessarily add to totals because of rounding.
Digitized for FRASER http://fraser.stlouisfed.org/ Federal Reserve Bank of St. Louis
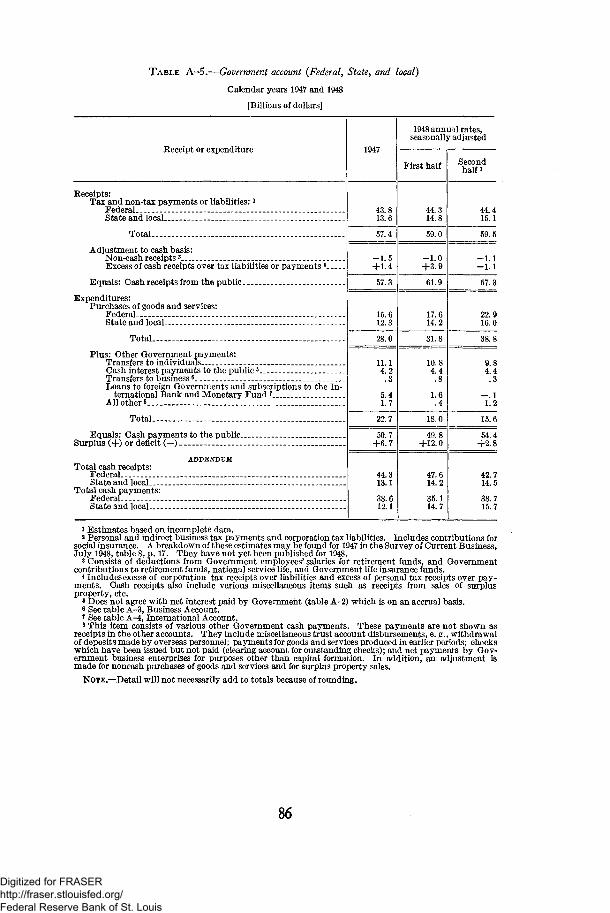
T A B L E A—5.—Government account {Federal, State, and local)
Calendar years 1947 and 1948
[Billions of dollars]
Receipt or expenditure
Receipts:Tax and non-tax payments or liabilities:2
FederalState and local .- -
Total
Adjustment to cash basis:Non-cash receipts3 .Excess of cash receipts over tax liabilities or payments 4
Equals: Cash receipts from the public
Expenditures:Purchases of goods and services:
Federal .State and local
Total
Plus: Other Government payments:Transfers to individualsCash interest payments to the public5
Transfers to business6
Loans to foreign Governments and subscriptions to the In-ternational Bank and Monetary Fund 1
All other 8
Total
Equals: Cash payments to the public.Surplus (+) or deficit (—)
ADDENDUMTotal cash receipts:
Federal . _ _. ___State and local
Total cash payments:Federal . _State and local
1947
43.813.6
57.4
- 1 . 5+1.4
57.3
15.612.3
28.0
11.14.2.3
5.41.7
22.7
50.7+6.7
44.313.1
38.612.1
1948 annual rates,seasonally adjusted
First half
44.314.8
59.0
-1 .0+3.9
61.9
17.614.2
31.8
10.84.4.8
1.6.4
18.0
49.8+12.0
47.614.2
35.114.7
Secondhalf i
44.415.1
59.5
- 1 . 1—1.1
57.3
22.916.0
38.8
9.84.4.3
- . 11.2
15.6
54.4+2.8
42.714.5
38.715.7
1 Estimates based on incomplete data.2 Personal and indirect business tax payments and corporation tax liabilities. Includes contributions for
social insurance. A breakdown of these estimates may be found for 1947 in the Survey of Current Business,July 1948, table 8, p. 17. They have not yet been published for 1948.
3 Consists of deductions from Government employees' salaries for retirement funds, and Governmentcontributions to retirement funds, national service life, and Government life insurance funds.
4 Includes excess of corporation tax receipts over liabilities and excess of personal tax receipts over pay-ments. Cash receipts also include various miscellaneous items such as receipts from sales of surplusproperty, etc.
« Does not agree with net interest paid by Government (table A-2) which is on an accrual basis.6 See table A-3, Business Account.? See table A-4, International Account.s This item consists of various other Government cash payments. These payments are not shown as
receipts in the other accounts. They include miscellaneous trust account disbursements, e. g., withdrawalof deposits made by overseas personnel; payments for goods and services produced in earlier periods; checkswhich have been issued but not paid (clearing account for outstanding checks); and net payments by Gov-ernment business enterprises for purposes other than capital formation. In addition, an adjustment ismade for noncash purchases of goods and services and for surplus property sales.
NOTE.—Detail will not necessarily add to totals because of rounding.
86
Digitized for FRASER http://fraser.stlouisfed.org/ Federal Reserve Bank of St. Louis
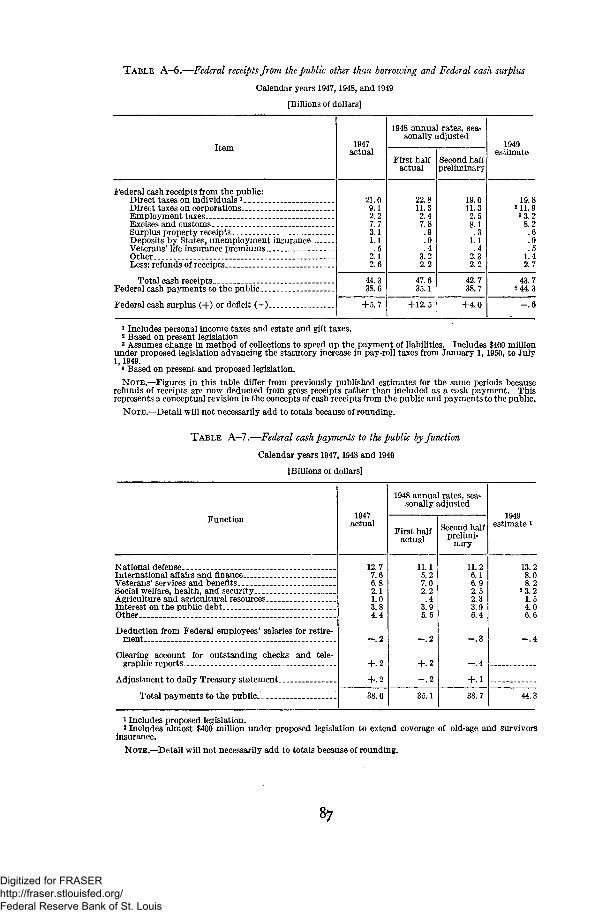
T A B L E A-6.—Federal receipts from the public other than borrowing and Federal cash surplus
Calendar years 1947,1948, and 1949
[Billions of dollars]
Item
Federal cash receipts from the public:Direct taxes on individuals 1
Direct taxes on corporations -Employment taxesExcises and customsSurplus property receiptsDeposits by States, unemployment insurance.Veterans' life insurance premiumsOtherLess: refunds of receipts
Total cash receiptsFederal cash payments to the public
Federal cash surplus (+) or deficit (—)
1947actual
21.09.12.27.73.11.1.5
2.12.6
44.338.6
+5.7
1948 annual rates, sea-sonally adjusted
First halfactual
22.811.32.47.8
.43.22.2
47.635.1
+12.5
Second halfpreliminary
19.011.32.58.1.3
1.1.4
2.32.2
42.738.7
+4.0
1949estimate
19.82 11.93 3.2
8.2.6.9.5
1.42.7
43.74 44. 3
1 Includes personal income taxes and estate and gift taxes.2 Based on present legislation.3 Assumes change in method of collections to speed up the payment of liabilities. Includes $400 million
under proposed legislation advancing the statutory increase in pay-roll taxes from January 1,1950, to July1,1949.
4 Based on present and proposed legislation.
NOTE.—Figures in this table differ from previously published estimates for the same periods becauserefunds of receipts are now deducted from gross receipts rather than included as a cash payment. Thisrepresents a conceptual revision in the concepts of cash receipts from the public and payments to the public.
NOTE.—Detail will not necessarily add to totals because of rounding.
T A B L E A—7.—Federal cash payments to the public by function
Calendar years 1947,1948 and 1949
[Billions of dollars]
Function
National defense.- .International affairs and financeVeterans'services and benefits _Social welfare, health, and securityAgriculture and agricultural resourcesInterest on the public debtOther
Deduction from Federal employees' salaries for retire-ment
Clearing account for outstanding checks and tele-graphic reports
Adjustment to daily Treasury statement
Total payments to the public. _
1947actual
12.77.66.82.11.03.84.4
-.2
+.2+.238.6
1948 annual rates, sea-sonally adjusted
First halfactual
11.15.27.02.2.4
3.95.5
- . 2
+.2- . 2
35.1
Second halfprelimi-
nary
11.26.16.92.52.33.96.4
- . 3
- . 4
+.138.7
1949estimate *
13.28.08.2
2 3.21.54.06.6
- . 4
44.3
1 Includes proposed legislation.2 Includes almost $400 million under proposed legislation to extend coverage of old-age and survivors
insurance.
NOTE.—Detail will not necessarily add to totals because of rounding.
Digitized for FRASER http://fraser.stlouisfed.org/ Federal Reserve Bank of St. Louis
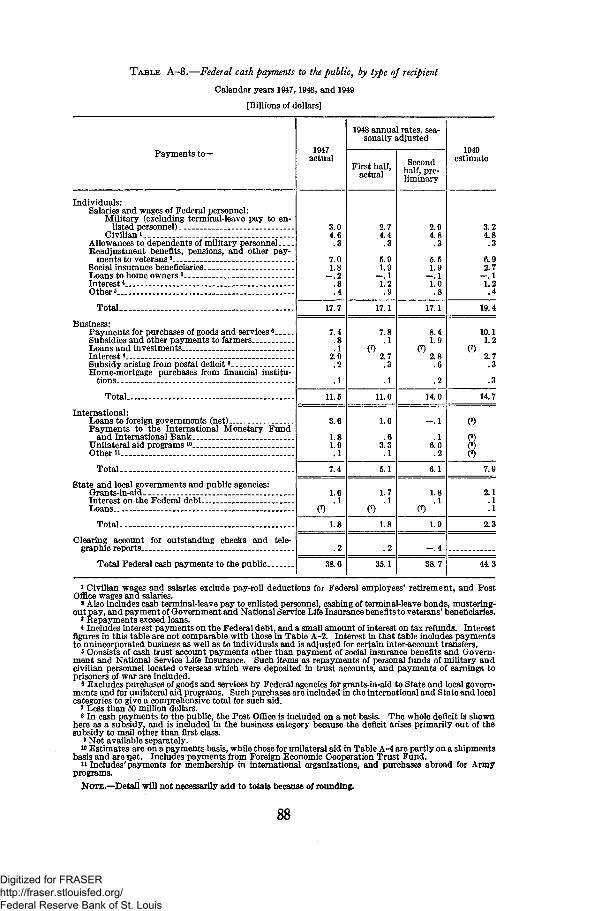
T A B L E A—8.—Federal cash payments to the public, by type of recipient
Calendar years 1947,1948, and 1949
[Billions of dollars]
Payments to—
Individuals:Salaries and wages of Federal personnel:
Military (excluding terminal-leave pay to en-listed personnel) - _
Civilian iAllowances to dependents of military personnelReadjustment benefits, pensions, and other pay-
ments to veterans2
Social insurance beneficiaries _Loans to home owners3 _ _Interest4
Other5
Total
Business:Payments for purchases of goods and services•Subsidies and other payments to farmersLoans and investmentsInterest4
Subsidy arising from postal deficit »Home-mortgage purchases from financial institu-
tions
Total
International:Loans to foreign governments (net)Payments to the International Monetary Fund
and International Bank _Unilateral aid programs10
Other11
Total
State and local governments and public agencies:Grants-in-aidInterest on the Federal debtLoans «
Total
Clearing account for outstanding checks and tele-graphic reports
Total Federal cash payments to the public
1947actual
3.04.6.3
7.01.8
- . 2.8.4
17.7
7.4.8.1
2.9.2
.1
11.5
3.6
1.81.9.1
7.4
1.6.1
1.8
.2
38.6
1948 annual rates, sea-sonally adjusted
First half,actual
2.74.4.3
5.91.9
—.11.2.9
17.1
7.8.1
2.7.3
.1
11.0
1.0
.63.3.1
5.1
1.7.1
1.8
.2
35.1
Secondhalf, pre-liminary
2.94.8.3
5.51.9
- . 11.0.8
17.1
8.41.9
2.8.6
.2
14.0
- . 1
.16.0.2
6.1
1.8
(7)
1.9
- . 4
38.7
1949estimate
3.24.8.3
6.92.7
—.11.2.4
19.4
10.11.2
2.7.3
.3
14.7
333
37.9
2.1.1.1
2.3
44.3
1 Civilian wages and salaries exclude pay-roll deductions for Federal employees' retirement, and PostOffice wages and salaries.
2 Also includes cash terminal-leave pay to enlisted personnel, cashing of terminal-leave bonds, mustering-out pay, and payment of Government and National Service Life Insurance benefits to veterans' beneficiaries.
3 Repayments exceed loans.* Includes interest payments on the Federal debt, and a small amount of interest on tax refunds. Interest
figures in this table are not comparable with those in Table A-2. Interest in that table includes paymentsto unincorporated business as well as to individuals and is adjusted for certain inter-account transfers.
« Consists of cash trust account payments other than payment of social insurance benefits and Govern-ment and National Service Life Insurance. Such items as repayments of personal funds of military andcivilian personnel located overseas which were deposited in trust accounts, and payments of earnings toprisoners of war are included.
6 Excludes purchases of goods and services by Federal agencies for grants-in-aid to State and local govern-ments and for unilateral aid programs. Such purchases are included in the international and State and localcategories to give a comprehensive total for such aid.
* Less than 50 million dollars.8 In cash payments to the public, the Post Office is included on a net basis. The whole deficit is shown
here as a subsidy, and is included in the business category because the deficit arises primarily out of thesubsidy to mail other than first class.
9 Not available separately.10 Estimates are on a payments basis, while those for unilateral aid in Table A-4 are partly on a shipments
basis and are net. Includes payments from Foreign Economic Cooperation Trust Fund." Includes'payments for membership in international organizations, and purchases abroad for Army
programs.
NOTE.—Detail will not necessarily add to totals because of rounding.
Digitized for FRASER http://fraser.stlouisfed.org/ Federal Reserve Bank of St. Louis
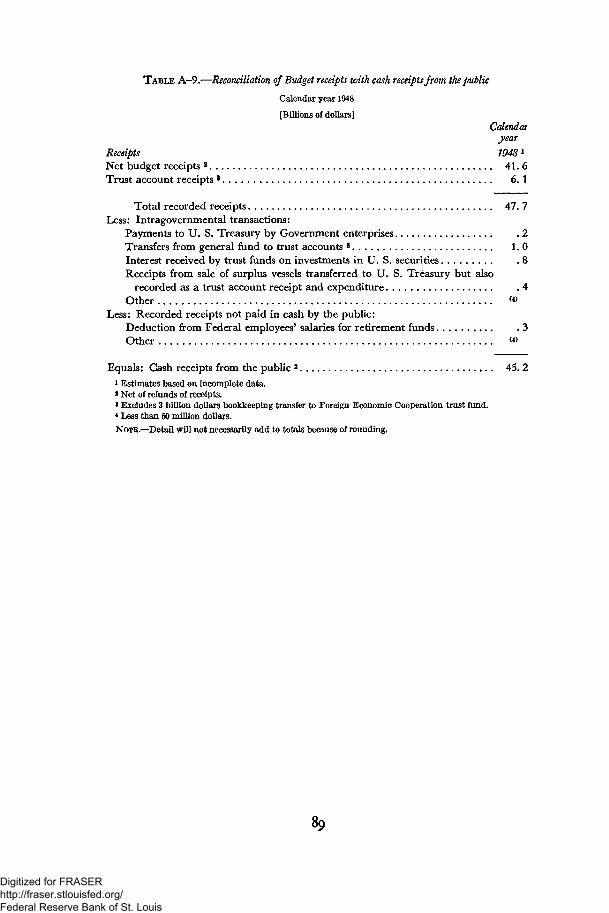
T A B L E A-9.—Reconciliation of Budget receipts with cash receipts from the public
Calendar year 1948
[Billions of dollars]Calendar
year
Receipts 1948*
Net budget receipts 2 41. 6Trust account receipts 3 6.1
Total recorded receipts 47. 7Less: Intragovernmental transactions:
Payments to U. S. Treasury by Government enterprises .2Transfers from general fund to trust accounts 8 1.0Interest received by trust funds on investments in U. S. securities .8Receipts from sale of surplus vessels transferred to U. S. Treasury but also
recorded as a trust account receipt and expenditure .4Other «>
Less: Recorded receipts not paid in cash by the public:Deduction from Federal employees' salaries for retirement funds .3Other «>
Equals: Cash receipts from the public 2 45. 2i Estimates based on incomplete data.* Net of refunds of receipts.8 Excludes 3 billion dollars bookkeeping transfer to Foreign Economic Cooperation trust fund.< Less than 60 million dollars.
NOTE.—Detail will not necessarily add to totals because of rounding.
Digitized for FRASER http://fraser.stlouisfed.org/ Federal Reserve Bank of St. Louis
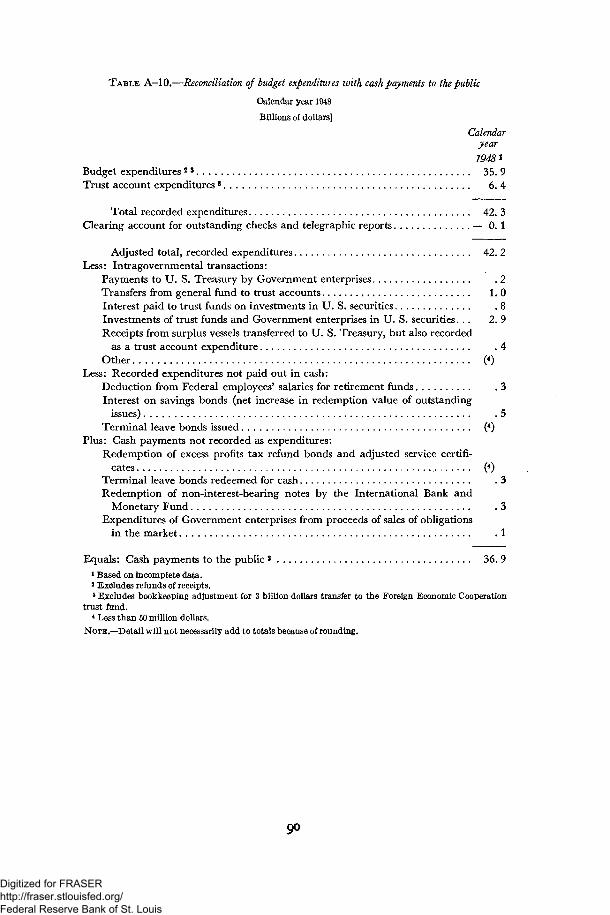
TABLE A-10.—Reconciliation of budget expenditures with cask payments to the public
Calendar year 1948
Billions of dollars]
Calendaryear
79481Budget expenditures 2 3 35. 9Trust account expenditures 3 6. 4
Total recorded expenditures 42. 3Clearing account for outstanding checks and telegraphic reports — 0. 1
Adjusted total, recorded expenditures 42. 2Less: Intragovernmental transactions:
Payments to U. S. Treasury by Government enterprises .2Transfers from general fund to trust accounts 1.0Interest paid to trust funds on investments in U. S. securities .8Investments of trust funds and Government enterprises in U. S. securities... 2.9Receipts from surplus vessels transferred to U. S. Treasury, but also recorded
as a trust account expenditure .4Other (*)
Less: Recorded expenditures not paid out in cash:Deduction from Federal employees' salaries for retirement funds .3Interest on savings bonds (net increase in redemption value of outstanding
issues) .5Terminal leave bonds issued (4)
Plus: Cash payments not recorded as expenditures:Redemption of excess profits tax refund bonds and adjusted service certifi-
cates (4)Terminal leave bonds redeemed for cash .3Redemption of non-interest-bearing notes by the International Bank and
Monetary Fund .3Expenditures of Government enterprises from proceeds of sales of obligations
in the market .1
Equals: Cash payments to the public2 36. 91 Based on incomplete data.2 Excludes refunds of receipts.3 Excludes bookkeeping adjustment for 3 billion dollars transfer to the Foreign Economic Cooperation
trust fund.* Less than 50 million dollars.
NOTE.—Detail will not necessarily add to totals because of rounding.
9°
Digitized for FRASER http://fraser.stlouisfed.org/ Federal Reserve Bank of St. Louis
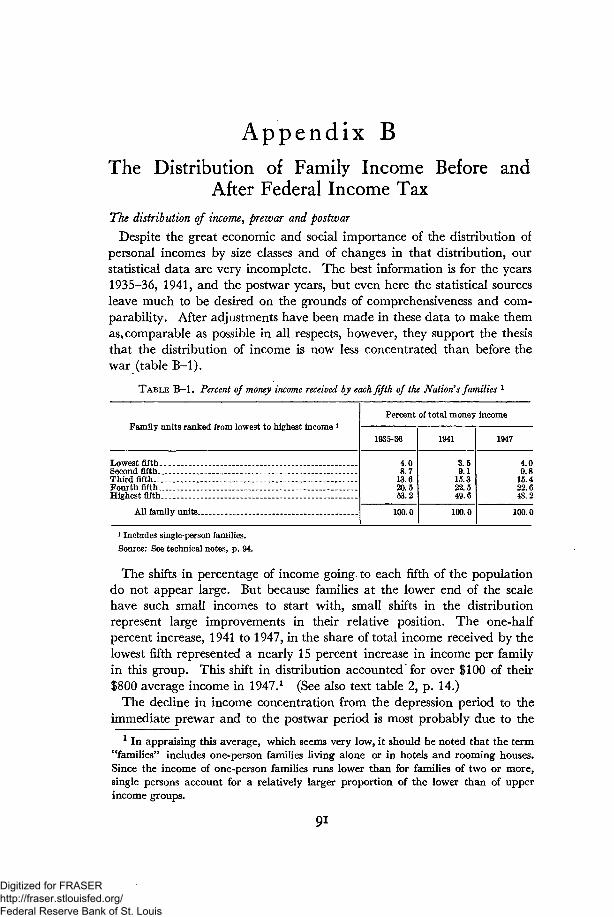
Appendix BThe Distribution of Family Income Before and
After Federal Income TaxThe distribution of income, prewar and postwar
Despite the great economic and social importance of the distribution ofpersonal incomes by size classes and of changes in that distribution, ourstatistical data are very incomplete. The best information is for the years1935-36, 1941, and the postwar years, but even here the statistical sourcesleave much to be desired on the grounds of comprehensiveness and com-parability. After adjustments have been made in these data to make themas* comparable as possible in all respects, however, they support the thesisthat the distribution of income is now less concentrated than before thewar (table B-l).
TABLE B - l . Percent of money income received by each fifth of the Nation's families l
Family units ranked from lowest to highest income 1
Lowest fifthSecond fifthThird fifthFourth fifthHighest fifth
All family units
Percent of total money income
1935-36
4.08.7
13.620.563.2
100.0
1941
3.59.1
15.322.549.6
100.0
1947
4.09.8
15.422.648.2
100.0
1 Includes single-person families.
Source: See technical notes, p. 94.
The shifts in percentage of income going to each fifth of the populationdo not appear large. But because families at the lower end of the scalehave such small incomes to start with, small shifts in the distributionrepresent large improvements in their relative position. The one-halfpercent increase, 1941 to 1947, in the share of total income received by thelowest fifth represented a nearly 15 percent increase in income per familyin this group. This shift in distribution accounted for over $100 of their$800 average income in 1947.1 (See also text table 2, p. 14.)
The decline in income concentration from the depression period to theimmediate prewar and to the postwar period is most probably due to the
In appraising this average, which seems very low, it should be noted that the term"families" includes one-person families living alone or in hotels and rooming houses.Since the income of one-person families runs lower than for families of two or more,single persons account for a relatively larger proportion of the lower than of upperincome groups.
91
Digitized for FRASER http://fraser.stlouisfed.org/ Federal Reserve Bank of St. Louis
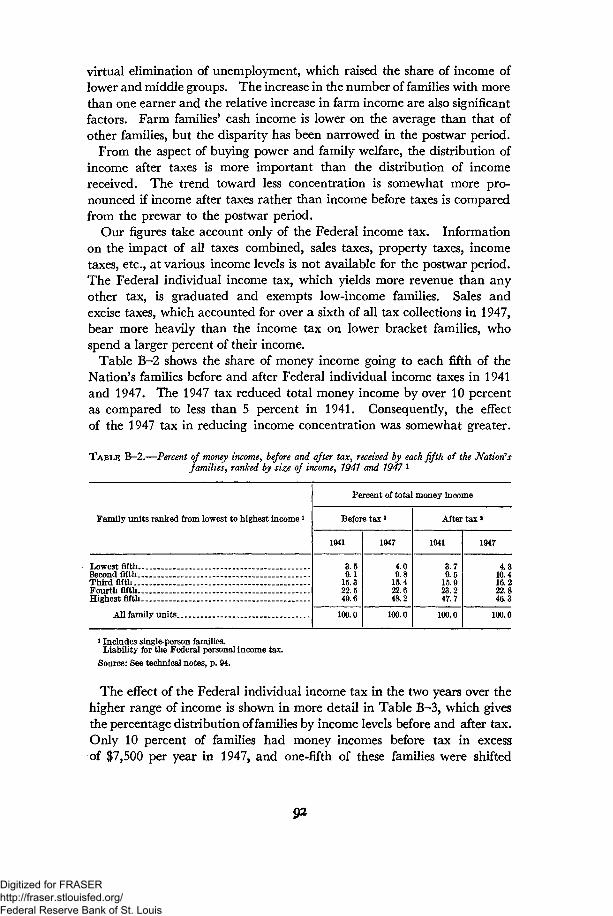
virtual elimination of unemployment, which raised the share of income oflower and middle groups. The increase in the number of families with morethan one earner and the relative increase in farm income are also significantfactors. Farm families' cash income is lower on the average than that ofother families, but the disparity has been narrowed in the postwar period.
From the aspect of buying power and family welfare, the distribution ofincome after taxes is more important than the distribution of incomereceived. The trend toward less concentration is somewhat more pro-nounced if income after taxes rather than income before taxes is comparedfrom the prewar to the postwar period.
Our figures take account only of the Federal income tax. Informationon the impact of all taxes combined, sales taxes, property taxes, incometaxes, etc., at various income levels is not available for the postwar period.The Federal individual income tax, which yields more revenue than anyother tax, is graduated and exempts low-income families. Sales andexcise taxes, which accounted for over a sixth of all tax collections in 1947,bear more heavily than the income tax on lower bracket families, whospend a larger percent of their income.
Table B-2 shows the share of money income going to each fifth of theNation's families before and after Federal individual income taxes in 1941and 1947. The 1947 tax reduced total money income by over 10 percentas compared to less than 5 percent in 1941. Consequently, the effectof the 1947 tax in reducing income concentration was somewhat greater.
TABLE B—2.—Percent of money income, before and after tax, received by each fifth of the Nation'sfamilies, ranked by size of income, 1941 and 1947 l
Family units ranked from lowest to highest income *
Lowest fifthSecond fifth _.Third fifthFourth fifthHighest fifth
All family units . _ ^ _
Percent of total money income
Before tax *
1941
3.59.1
15.322.549.6
100.0
1947
4.09.8
15.422.648.2
100.0
After tax *
1941
3.79.5
15.923.247.7
100.0
1947
4 310.416.222.846.3
100.0
1 Includes single-person families.Liability for the Federal personal income tax.
Source: See technical notes, p. 94.
The effect of the Federal individual income tax in the two years over thehigher range of income is shown in more detail in Table B-3, which givesthe percentage distribution of families by income levels before and after tax.Only 10 percent of families had money incomes before tax in excessof $7,500 per year in 1947, and one-fifth of these families were shifted
Digitized for FRASER http://fraser.stlouisfed.org/ Federal Reserve Bank of St. Louis
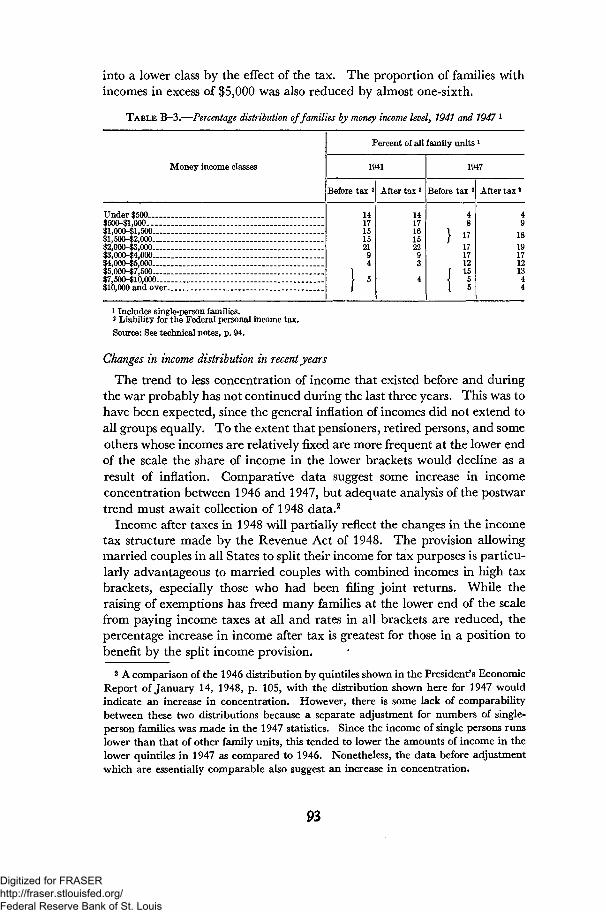
into a lower class by the effect of the tax. The proportion of families withincomes in excess of $5,000 was also reduced by almost one-sixth.
T A B L E B—3.—Percentage distribution of families by money income level, 7947 and 7947 1
Money income classes
Before tax 2 After tax 2
Percent of all family units *
1941 1947
Before tax 2 After t ax 8
Under $500$500-$l,000$1,000-$1,500$l,500-$2,000$2,000-$3,000$3,000-$4,000$4,000-$5,000$5,000-$7,500$7,500-$10,000—_.$10,000 and over..
49
181917121344
1 Includes single-person families.2 Liability for the Federal personal income tax.Source: See technical notes, p. 94.
Changes in income distribution in recent years
The trend to less concentration of income that existed before and duringthe war probably has not continued during the last three years. This was tohave been expected, since the general inflation of incomes did not extend toall groups equally. To the extent that pensioners, retired persons, and someothers whose incomes are relatively fixed are more frequent at the lower endof the scale the share of income in the lower brackets would decline as aresult of inflation. Comparative data suggest some increase in incomeconcentration between 1946 and 1947, but adequate analysis of the postwartrend must await collection of 1948 data.2
Income after taxes in 1948 will partially reflect the changes in the incometax structure made by the Revenue Act of 1948. The provision allowingmarried couples in all States to split their income for tax purposes is particu-larly advantageous to married couples with combined incomes in high taxbrackets, especially those who had been filing joint returns. While theraising of exemptions has freed many families at the lower end of the scalefrom paying income taxes at all and rates in all brackets are reduced, thepercentage increase in income after tax is greatest for those in a position tobenefit by the split income provision.
2 A comparison of the 1946 distribution by quintiles shown in the President's EconomicReport of January 14, 1948, p. 105, with the distribution shown here for 1947 wouldindicate an increase in concentration. However, there is some lack of comparabilitybetween these two distributions because a separate adjustment for numbers of single-person families was made in the 1947 statistics. Since the income of single persons runslower than that of other family units, this tended to lower the amounts of income in thelower quintiles in 1947 as compared to 1946. Nonetheless, the data before adjustmentwhich are essentially comparable also suggest an increase in concentration.
93
Digitized for FRASER http://fraser.stlouisfed.org/ Federal Reserve Bank of St. Louis
TECHNICAL NOTES
Sources of data
1935-36.—For 1935-36 use has been made of unpublished distributionsprepared by the Research Division of the Office of Price Administration,based on the National Resources Committee's study, "Consumer Incomesin the United States." An explanation of the procedures used in analyzingthese data may be found on p. 103 of the Economic Report of the President,January 1948.
1941.—These distributions were derived from the "Study of FamilySpending and Saving in Wartime" (Bureau of Labor Statistics, Bulletin822) and the "Statistics of Income, 1941" (Bureau of Internal Revenue,Treasury Department). "Family Spending and Saving in Wartime" wasbased on a sample survey of family incomes conducted jointly by the Bureauof Human Nutrition and Home Economics and the Bureau of Labor Sta-tistics. The "Statistics of Income, 1941" contains tabulations of Federalindividual income tax returns for that year.
1947.—The estimates for 1947 are based on the 1948 "Survey of Con-sumer Finances," conducted for the Board of Governors of the FederalReserve System by the Survey Research Center of the University of Mich-igan. The estimate of the tax liability was not based directly on informa-tion obtained in the interviews concerning tax returns or on tax returnsthemselves, but on comprehensive data concerning family composition andincome assembled in connection with the "Survey of Consumer Finances."Special tabulations from this Survey were made available to the Councilof Economic Advisers through the courtesy of the Board of Governors andthe Survey Research Center. The methods used in the "Survey of Con-sumer Finances" are described in the "Federal Reserve Bulletin," June1948, p. 643.
Definition of the family
Only the civilian noninstitutional population are included in the esti-mates. A family unit consists of related persons living in one dwelling.A single person living alone is considered as a separate family unit. Theestimate of the number of family units in 1935-36 is 38.4 million; in 1941,41.4 million; and in 1947, 44.6 million.
Definition of money income
Money income refers to income of the civilian noninstitutional popula-tion. Income in kind, such as imputed rent of owner-occupied dwellings,or food and fuel produced and consumed on farms is not included. Theestimate of civilian noninstitutional cash income is 58.9 billion dollars in1935-36, 86.9 billion in 1941, and 184.2 billion in 1947.
94
Digitized for FRASER http://fraser.stlouisfed.org/ Federal Reserve Bank of St. Louis
Definition of the tax
The tax included here is the estimated liability for Federal income taxfor the year indicated. Taxes on capital gains, and estate and gift taxesare excluded as well as State income taxes.
Conversion of 1941 income into 1947 dollars
The estimates of average income for each quintile in 1941 (text table 2,p. 14) were adjusted to dollars of 1947 purchasing power according to theincrease in the Consumers' Price Index adjusted for wartime changes incomposition of output. (See table C-6.)
Comparability with estimates contained in previous Economic Reports of the President1941.—The estimates of 1941 income before tax included in this report rep-
resent a refinement of the estimates contained in the Economic Report ofJanuary 14, 1948. The estimates of the amounts of income received byupper income groups and by single individuals have been improved by useof data from "Statistics of Income, 1941." A detailed discussion of the pro-cedure used to estimate the 1941 distributions will be presented at the 1949Annual Conference of the Committee on Income and Wealth of theNational Bureau of Economic Research.
1947.—The 1947 estimate of the distribution of families by income levelbefore tax represents a minor revision of the estimates contained in table2-a, p. 69, of the Midyear Economic Report, July 1948. The survey datafor 1947 income after tax were also presented in the Midyear Report,table 2. The present estimates are based on these survey data but are ad-justed for population coverage and to agree with an independently esti-mated aggregate of money income before tax. The estimates for 1947 arestill preliminary. A need for revisions in the distribution may be in-dicated by the 1947 Statistics of Income, which has not yet become avail-able. The distributions for 1935-36 and 1941 have been adjusted in thelight of the Statistics of Income for those years.
95
Digitized for FRASER http://fraser.stlouisfed.org/ Federal Reserve Bank of St. Louis

Digitized for FRASER http://fraser.stlouisfed.org/ Federal Reserve Bank of St. Louis
Appendix CStatistical Tables Relating to Employment,
Production, and Purchasing PowerCONTENTS
National Income: PageC-l. Gross national product or expenditure, 1929-48 99G-2. Disposition of gross national product, 1939-48 100G-3. National income by distributive shares, 1929-48 101G-4. Personal income, 1929-48 102C-5. Disposition of personal income, 1929-48 103C-6. Per capita disposable income in current and 1947 dollars, 1929-48. 104
Employment and Wages:G-7. Labor force, 1929-48 105C-8. Number of wage and salary workers in nonagricultural establishments,
1929-48 106G-9. Average gross weekly earnings in selected industries, 1929-48 107G-10. Average hourly earnings in selected industries, 1929-48 108C-ll . Average weekly hours in selected industries, 1929-48 109
Production and Business Activity:G-12. Physical production index of goods and utilities, 1929-48 110C-13. Industrial production index, 1929-48 I l lG-14. New construction activity, 1929-48 112C—15. Business expenditures for new plant and equipment, 1929—49 113C-l6. Inventories and sales in manufacturing and trade, 1939-48 114C—17. Inventories and sales, by durable and nondurable goods, in manu-
facturing and trade, 1939-48 115C-l 8. Sales, stocks, and outstanding orders at 296 department stores, 1939-
48 116C-l 9. Distribution of selected agricultural products moving into consumption
channels, 1939 and 1946-48 117Prices:
C-20. Consumers' price index, 1929-48 119C-21. Wholesale price index, 1929-48 120C-22. Indexes of prices received and prices paid by farmers and parity
ratio, 1929-48 121Money, Banking, and Credit:
G-23. Consumer credit outstanding, 1929-48 122C-24. Loans and investments of all commercial banks, 1929-48 123C—25. Adjusted deposits of all banks and currency outside banks, 1929—48. 124C-26. Estimated ownership of Federal securities, 1939-48 125C-27. Bond yields, long and short term interest rates, and commercial
loan rates, selected years, 1929-48 126
97
Digitized for FRASER http://fraser.stlouisfed.org/ Federal Reserve Bank of St. Louis
Corporate Profits and Finance: PageC-28. Profits before and after taxes, all private corporations, 1929-48 127G—29. Profits after taxes, 629 large private industrial corporations, by indus-
try groups, 1939-48 128C-30. Relation of profits before and after taxes to sales, private corporations
excluding finance, insurance, and real estate, 1946-48 128G—31. Relation of profits before and after taxes to investment, private manu-
facturing corporations, by industry groups, 1947—48 129C—32. Relation of profits before and after taxes to sales, private manufacturing
corporations, by industry groups, 1947-48 130C-33. Relation of profits before and after taxes to investment and to sales,
all private manufacturing corporations, by size classes, 1947-48.... 131C-34. Sources and uses of corporate funds, 1947-48 131
International Transactions:C-35. The international transactions of the United States, 1946-48 132C-36. United States Government aid to foreign countries, 1946-48 133G-37. United States merchandise exports, including reexports, by areas,
1936-38 quarterly average, 1947 and 1948 134C-38. United States domestic merchandise exports, by economic classes,
1936-38 quarterly average, 1947 and 1948 135C-39. Indexes of quantity and unit value of United States domestic merchan-
dise exports, by economic classes, 1936-38 quarterly average, 1947and 1948 136
C-40. United States general merchandise imports, by areas, 1936-38quarterly average, 1947 and 1948 137
G-41. United States merchandise imports for consumption, by economicclasses, 1936-38 quarterly average, 1947 and 1948 138
G-42. Indexes of quantity and unit value of United States merchandise im-ports for consumption, by economic classes, 1936-38 quarterlyaverage, 1947 and 1948 139
Summary:C-43. Changes in selected economic series since 1939 and 1947 139
Digitized for FRASER http://fraser.stlouisfed.org/ Federal Reserve Bank of St. Louis
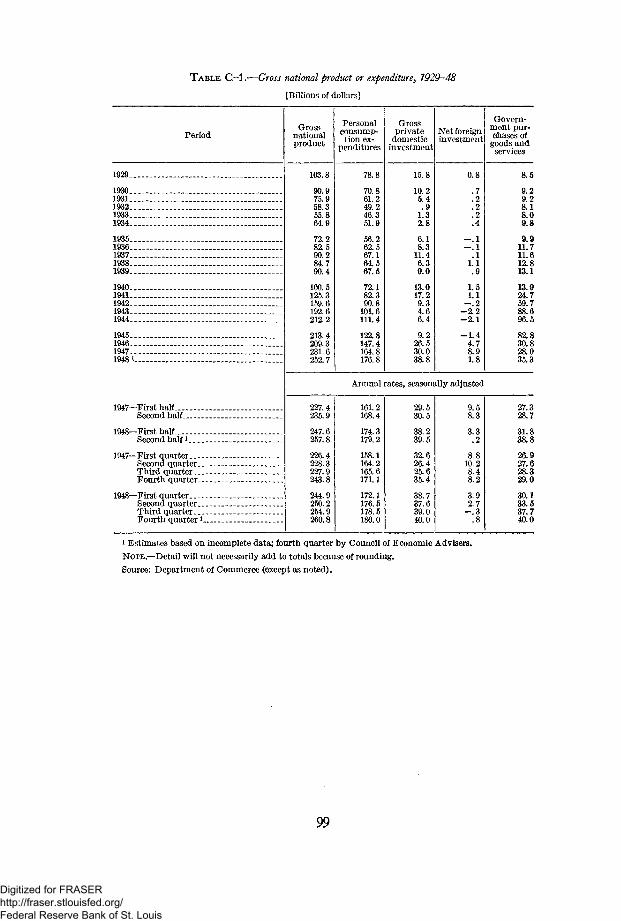
TABLE C-l.—Gross national product or expenditure, 1929-48
{Billions of dollars]
PeriodGross
nationalproduct
Personalconsump-tion ex-
penditures
Grossprivate
domesticinvestment
Net foreigninvestment
Govern-ment pur-chases of
goods andservices
1929.
19301931193219331934
19351936193719381939
19401941194219431944
1945194619471948
1947—First half..Second half
1948—First halfSecond half i
1947—First quarterSecond quarter. .Third quarter.. .Fourth quarter-.
1948—First quarterSecond quarter..Third quarter...Fourth quarter V
103.8
90.975.958.355.864.9
72.282.590.284.790.4
100.5125.3159.6192.6212.2
213.4209.3231.6252.7
227.4235.9
247.6257.8
226.4228.3227.9243.8
244.9250.2254.9260.8
78.8
70.861.249.246.351.9
56.262.567.164.567.5
72.182.390.8
101.6111.4
122.8147.4164.8176.8
15.8
10.25.4.9
1.32.8
6.18.3
11.46.39.0
13.017.29.34.66.4
9.226.530.038.8
0.8
.7
.2
.2
.2
.4
- . 1—.1
.11.1
1.51.1
- . 2- 2 . 2- 2 . 1
- 1 . 44.78.91.8
Annual rates, seasonally adjusted
161.2168.4
174.3179.2
158.1164.2165.6171.1
172.1176.5178.5180.0
29.530.5
38.239.5
32.626.425.635.4
38.737.639.040.0
9.58.3
3.3.2
8.810.28.48.2
3.92.7
- . 3
8.5
9.29.28.18.09.8
9.911.711.612.813.1
13.924.759.788.696.5
82.830.828.035.3
27.328.7
31.838.8
26.927.628.329.0
30.133.537.740.0
i Estimates based on incomplete data; fourth quarter by Council of Economic Advisers.
NOTE.—Detail will not necessarily add to totals because of rounding.
Source: Department of Commerce (except as noted).
99
Digitized for FRASER http://fraser.stlouisfed.org/ Federal Reserve Bank of St. Louis
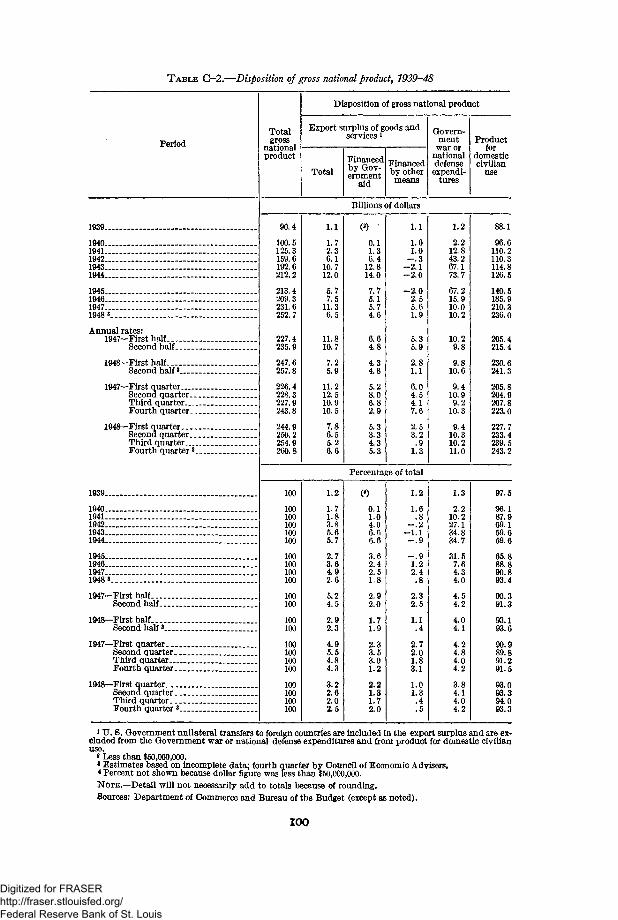
T A B L E C—2.—Disposition of gross national product, 1939—48
PeriodTotalgross
nationalproduct
Disposition of gross national product
Export surplus of goods andservices 1
TotalFinancedby Gov-ernment
aid
Financedby othermeans
Govern-ment
war ornationaldefense
expendi-tures
Productfor
domesticcivilian
use
1939..
1940...1941..1942..1943..1944..
1945..1946..1947..1948 s.
Annual rates:1947—First half....
Second half..
1948—First halfSecond half *_.
1947—First quarterSecond quarter..Third quarter...Fourth quarter.
1948—First quarterSecond quarter. _.Third quarterFourth quarter8..
Billions of dollars
90.4
100.5125.3159.6192.6212.2
213.4209.3231.6252.7
227.4235.9
247.6257.8
226.4228.3227.9243.8
244.9250.2254.9260.8
1.1
1.72.36.1
10.712.0
5.77.5
11.36.5
11.810.7
7.25.9
11.212.510.910.5
7.86.55.26.6
(2) -
0.11.36.4
12.814.0
7.75.15.74.6
6.64.8
4.34.8
5.28.06.82.9
5.33.34.35.3
1.1
1.61.0
- . 3- 2 . 1-2 .0
- 2 . 02.55.61.9
5.35.9
2.81.1
6.04.54.17.6
2.53.2.9
1.3
1.2
2.212.843.267.173.7
67.215.910.010.2
10.29.8
9.810.6
9.410.99.2
10.3
9.410.310.211.0
1939
1940.1941.194219431944
194519461947.1948 3
1947—First halfSecond half
1948—First halfSecond half a...
1947—First quarter. _Second quarter.Third quarter..Fourth quarter
1948—First quarter. _Second quarter.Third quarter.Fourth quarter
100
100100100100100
100100100100
100100
100100
100100100100
100100100100
Percentage of total
1.2
1.71.83.85.65.7
2.73.64.92.6
5.24.5
2.92.3
4.95.54.84.3
3.22.62.02.5
(*)
0.11.04.06.66.6
3.62.42.51.8
2.92.0
1.71.9
2.33.53.01.2
2.21.31.72.0
1.2
1.6.8
- . 2-1 .1- . 9
- . 91.22.4.8
2.32.5
1.1.4
2.72.01.83.1
1.01.3.4.5
1.3
2.210.227.134.834.7
31.57.64.34.0
4.54.2
4.04.1
4.24.84.04.2
3.84.14.04.2
88.1
96.6110.2110.3114.8126.5
140.5185.9210.3236.0
205.4215.4
230.6241.3
205.8204.9207.8223.0
227.7233.4239.5243.2
97.5
96.187.969.159.659.6
65.888.890.893.4
90.391.3
93.193.6
90.989.891.291.5
93.093.394.093.3
i U. S. Government unilateral transfers to foreign countries are included in the export surplus and are ex-cluded from the Government war or national defense expenditures and from product for domestic civilianuse.
a Less than $50,000,000.* Estimates based on incomplete data; fourth quarter by Council of Economic Advisers.* Percent not shown because dollar figure was less than $50,000,000.NOTE.—Detail will not necessarily add to totals because of rounding.Sources: Department of Commerce and Bureau of the Budget (except as noted).
IOQ
Digitized for FRASER http://fraser.stlouisfed.org/ Federal Reserve Bank of St. Louis
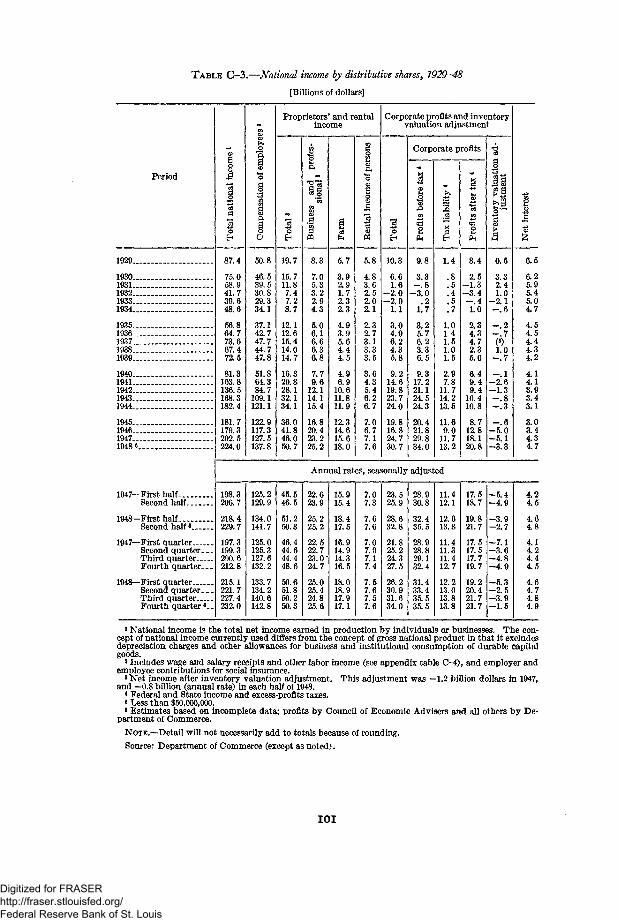
TABLE C—3.—National income by distributive shares, 7929-48
[Billions of dollars]
Period
1929___
1930—1931...1932...1933...1934...
1935...1936...1937..,1938___1939._.
1940—1941...1942...1943...1944...
1945...1946...1947...1948 8..
1947—First halfSecond half
1948—First halfSecond half •
1947—First quarterSecond quarter.Third quarterFourth quarter.
1948—First quarterSecond quarter-Third quarterFourth quarter
87.4
75.058.941.739.648.6
56.864.773.667.472.5
81.3103.8136. 5168.3182.4
181.7179.3202.5224.0
8
f em
ploy
eti
on
o:
3
1Q
50.8
46.539.530.829.334.1
37.142.747.744.747.8
51.864.384.7
109.1121.1
122.9117.3127.5137.8
Proprietors' and rentalincome
CO
119.7
15.711.87.47.28.7
12.112.615.414.014.7
16.320.828.132.134.1
36.041.846.050.7
iii
1m
8.3
7.05.33.22.94.3
5.06.16.66.36.8
7.79.6
12.114.115.4
16.820.423.225.2
gC3
5.7
3.92.91.72.32.3
4.93.95.64.44.5
4.96.9
10.611.811.9
12.314.615.618.0
ft
11s5.8
4.83. 62.52.02.1
2.32.73.13.33.5
3.64.35.46.26.7
7.06.77.17.6
Corporate profits and inventoryvaluation adjustment
OEH
10.3
6.61.6
- 2 . 0-2 .0
1.1
3.04.96.24.35.8
9.214.619.823.724.0
19.816.824.730.7
Corporate profits
1
11£9.8
3.3- . 8
- 3 . 0.2
1.7
3.25.76.23.36.5
9.317.221.124.524.3
20.421.829.834.0
o3EH
1.4
.8
.5
.4
.5
.7
1.01 41.51.01.5
2.97.8
11.714.213.5
11.69.0
11.713.2
i118.4
2.5- 1 . 3-3 .4- . 41.0
2.34.34.72.35.0
6.49.49.4
10.410.8
8.712.818.120.8
i
11p |
°'*>
0.5
3.32.41.0
- 2 . 1- . 6
- . 2- . 7
1.0- . 7
- . 1-2 .6-1 .3- . 8- . 3
- . 6-5 .0- 5 . 1- 3 . 3
6.5
6.25.95.45.04.7
4.54.54.44.34.2
4.14.13.93.43.1
3.03.44.34.7
Annual rates, seasonally adjusted
198.3206.7
218.4229.7
197.3199.3200.6212.8
215.1221.7227.4232.0
125.2129.9
134.0141.7
125.0125.3127.6132.2
133.7134.2140.6142.8
45.546.5
51.250.3
46.444.644.448.6
50.651.850.250.3
22.623.9
25.225.2
22.522.723.0"24.7
25.025.424.825.6
15.915.4
18.417.5
16.914.914.316.5
18.018.917.917.1
7.07.3
7.67.6
7.07.07.17.4
7.57.67.57.6
23.525.9
28.632.8
21.825.224.327.5
26.230.931.634.0
28.930.8
32.435.5
28.928.829.132.4
31.433.435.535.5
11.412.1
12.613.8
11.411.311.412.7
12.213.013.813.8
17.518.7
19.821.7
17.517.517.719.7
19.220.421.721.7
-5 .4-4 .9
-3 .9- 2 . 7
- 7 . 1-3 .6-4 .8-4 .9
- 5 . 3- 2 . 5-3 .9- 1 . 5
4.24.5
4.64.8
4.14.24.44.5
4.64.74.84.9
1 National income is the total net income earned in production by individuals or businesses. The con-cept of national income currently used differs from the concept of gross national product in that it excludesdepreciation charges and other allowances for business and institutional consumption of durable capitalgoods.
2 Includes wage and salary receipts and other labor income (see appendix table C-4), and employer andemployee contributions for social insurance.
3 Net income after inventory valuation adjustment. This adjustment was -1.2 billion dollars in 1947,and —0.8 billion (annual rate) in each half of 1948.
* Federal and Stato income and excess-profits taxes.«Less than $50,000,000.8 Estimates based on incomplete data; profits by Council of Economic Advisers and all others by De-
partment of Commerce.
NOTE.—Detail will not necessarily add to totals because of rounding.
Source: Department of Commerce (except as noted).
IOI
Digitized for FRASER http://fraser.stlouisfed.org/ Federal Reserve Bank of St. Louis
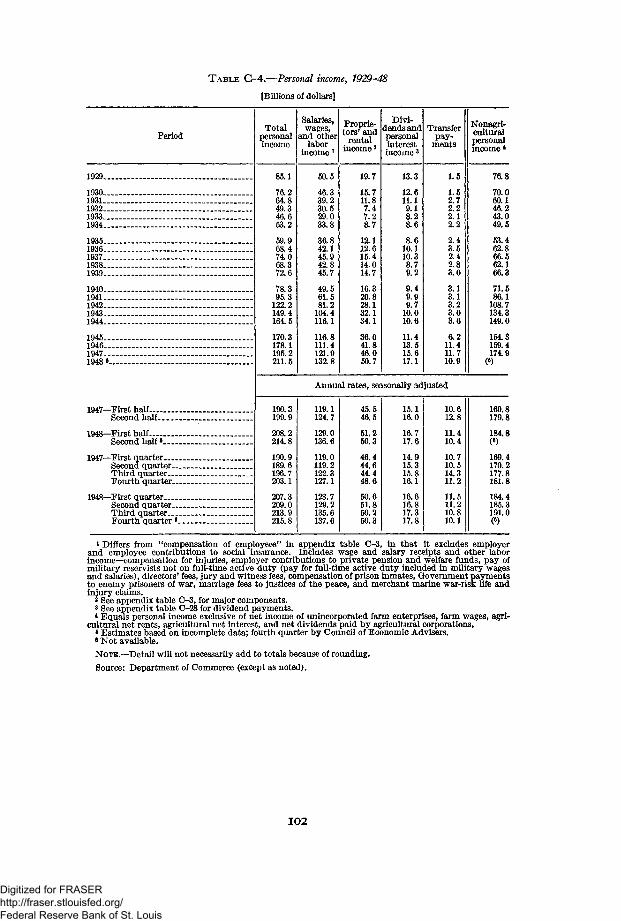
TABLE C-4.—Personal income, 1929-48
[Billions of dollars]
PeriodTotal
personalincome
Salaries,wages,
and otherlabor
income
Proprie-tors' and
rentalincome2
Divi-dendsandpersonalinterestincome3
Transferpay-
ments
Nonagri-cultural
income *
1929..
1930-1931-_1932-1933..1934..
1935..1936-1937-1938-1939-
1940-1941-1942-1943-1944-
1945-1946-1947-1948».
1947—First half.Second half
1948—First half—Second halffi
1947—First quarterSecond quarter..Third quarter.._Fourth quarter—
1948—First quarterSecond quarter-Third quarter...Fourth quarter 8.
85.1
76.264.849.346.653.2
68.474.068.372.6
78.395.3
122.2149.4164.5
170.3178.1195.2211.5
50.5
46.339.230.529.033.8
36.842.145.942.845.7
49.561.581.2
104.4116.1
116.8111.4121.9132.8
19.7
15.711.87.47.28.7
12.112.615.414.014.7
16.320.828.132.134.1
36.041.846.050.7
13.3
12.611.19.18.28.6
8.610.110.38.79.2
9.49.99.7
10.010.6
11.413.515.617.1
1.5
1.52.72.22.12.2
2.43.52.42.83.0
3.13.13.23.03.6
6.211.411.710.9
76.8
70.060.146.243.049.5
53.462.866.562.166.3
71.586.1
108.7134.3149.0
154.3159.4174.9
CO
Annual rates, seasonally adjusted
190.3199.9
208.2214.8
190.9189.6196.7203.1
207.3209.0213.9215.8
119.1124.7
129.0136.6
119.0119.2122.3127.1
128.7129.2135.6137.6
45.546.5
51.250.3
46.444.644.448.6
50.651.850.250.3
15.116.0
16.717.6
14.915.315.816.1
16.616.817.317.8
10.612.8
11.410.4
10.710.514.311.2
11.511.210.810.1
169.8179.8
184.8(6)
169.4170.2177.8181.8
184.4185.3191.0(6)
1 Differs from "compensation of employees" in appendix table C-3, in that it excludes employerand employee contributions to social insurance. Includes wage and salary receipts and other laborincome—compensation for injuries, employer contributions to private pension and welfare funds, pay ofmilitary reservists not on full-time active duty (pay for full-time active duty included in military wagesand salaries), directors' fees, jury and witness fees, compensation of prison inmates, Government paymentsto enemy prisoners of war, marriage fees to justices of the peace, and merchant marine war-risk life andinjury claims.
2 See appendix table O-3, for major components.8 See appendix table C-28 for dividend payments.* Equals personal income exclusive of net income of unincorporated farm enterprises, farm wages, agri-
cultural net rents, agricultural net interest, and net dividends paid by agricultural corporations.« Estimates based on incomplete data; fourth quarter by Council of Economic Advisers.fl Not available.
NOTE.—Detail will not necessarily add to totals because of rounding.
Source: Department of Commerce (except as noted).
102
Digitized for FRASER http://fraser.stlouisfed.org/ Federal Reserve Bank of St. Louis
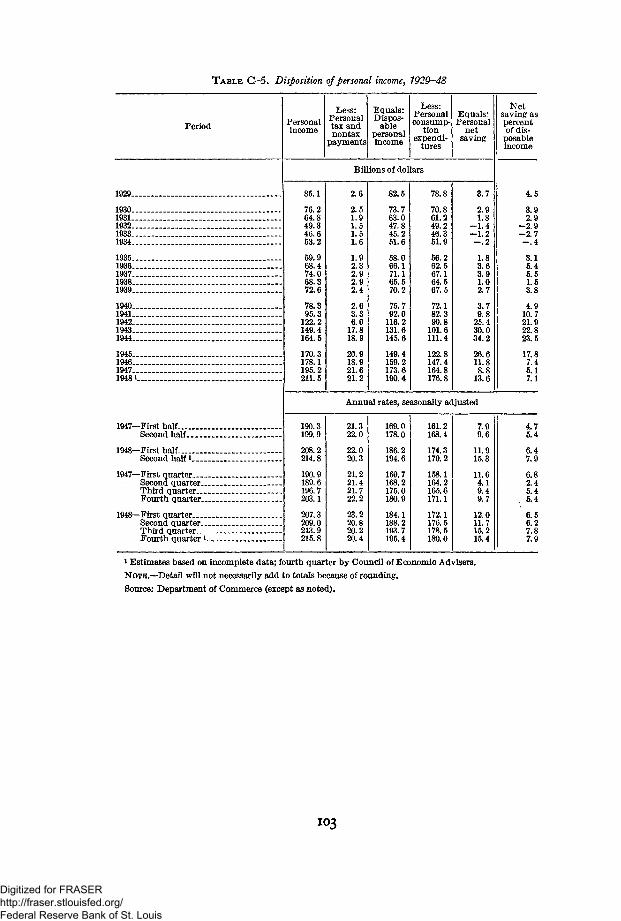
T A B L E C—5. Disposition of personal income, 7929-48
Period Personalincome
Less:Personaltax andnontax
payments
Equals:Dispos-
ablepersonalincome
Less:Personalconsump-
tionexpendi-
tures
Equals:Personal
netsaving
Netsaving aspercentof dis-
posableincome
1929-
1930_.1931-1932..1933-1934..
1935—1936-1937-1938-1939-
1940-1941-1942-1943-1944-
1945-1946—1947-19481.
1947—First half-Second half..
1948—First halfSecond half i.
1947—First quarterSecond quarter-Third quarter.. .Fourth quarter-
1948—First quarterSecond quarter..Third quarter. _.Fourth quarter 1
Billions of dollars
85.1
76.264.849.346.653.2
59.968.474.068.372.6
78.395.3
122.2149.4164.5
170.3178.1195.2211.5
2.6
2.51.91.51.51.6
1.92.32.92.92.4
2.63.36.0
17.818.9
20.918.921.621.2
82.5
73.763.047.845.251.6
58.066.171.165.570.2
75.792.0
116.2131.6145.6
149.4159.2173.6190.4
78.8
70.861.249.246.351.9
56.262.567.164.567.5
72.182.390.8
101.6111.4
122.8147.4164.8176.8
3.7
2.91.8
- 1 . 4- 1 . 2—.2
1.83.63.91.02.7
3.79.8
25.430.034.2
26.611.88.8
13.6
Annual rates, seasonally adjusted
190.3199.9
208.2214.8
190.9189.6196.7203.1
207.3209.0213.9215.8
21.322.0
22.020.3
21.221.421.722.2
23.220.820.220.4
169.0178.0
186.2194.6
169.7168.2175.0180.9
184.1188.2193.7195.4
161.2168.4
174.3179.2
158.1164.2165.6171.1
172.1176.5178.5180.0
7.99.6
11.915.3
11.64.19.49.7
12.011.715.215.4
4.5
3.92.9
- 2 . 9- 2 . 7—.4
3.15.45.51.53.8
4.910.721.922.823.5
17.87.45.17.1
4.75.4
6.47.9
6.82.45.45.4
6.56.27.87.9
i Estimates based on incomplete data; fourth quarter by Council of Economic Advisers.
NOTE.—Detail will not necessarily add to totals because of rounding.
Source: Department of Commerce (except as noted).
103
Digitized for FRASER http://fraser.stlouisfed.org/ Federal Reserve Bank of St. Louis
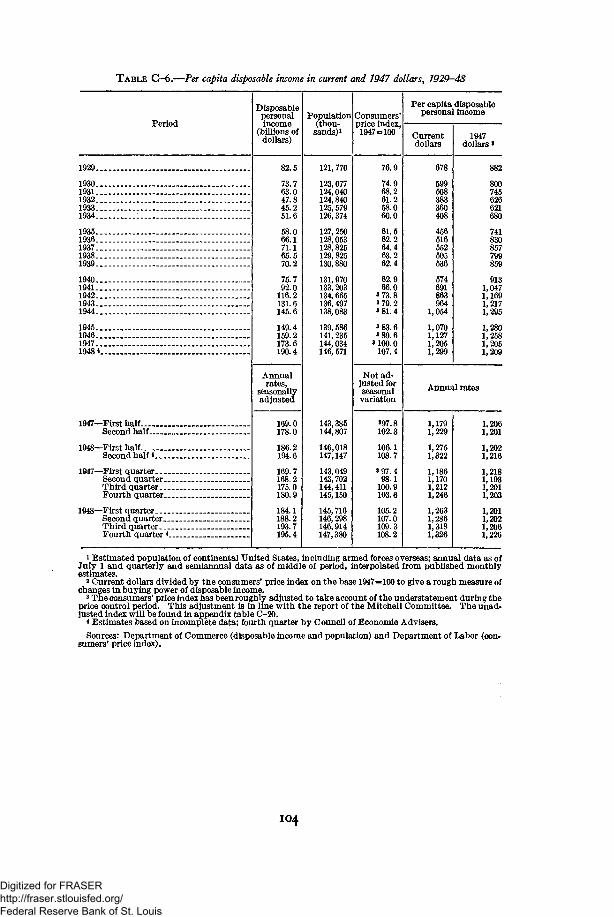
TABLE C~6.—Per capita disposable income in current and 1947 dollars, 1929-48
Period
Disposablepersonalincome
(billions ofdollars)
82.5
73.763.047.845.251.6
58.066.171.165.570.2
75.792.0
116.2131.6145.6
149.4159.2173.6190.4
Annualrates,
seasonallyadjusted
169.0178.0
186.2194.6
169.7168.2175.0180.9
184.1188.2193.7195.4
Population(thou-sands)!
121,770
123,077124,040124,840125,579126, 374
127, 250128,053128, 825129,825130,880
131,970133,203134, 665136,497138,083
139,586141, 235144,034146,571
143,385144,807
146,018147,147
143,049143,702144,411145,150
145,716146,298146,914147,380
Consumers'price index,1947=100
76.9
74.968.261.258.060.0
61.562.264.463.262.4
62.966.0
3 73.83 79.23 81.4
3 83.63 89.6
3100.0107.4
Not ad-justed forseasonalvariation
397.8102.3
106.1108.7
3 97.498.1
100.9103.6
105.2107.0109.3108.2
Per capita disposablepersonal income
Currentdollars
678
599508383360408
456516552605536
574691863964
1,054
1,0701,1271,2051,299
1947dollars *
882
800745626621680
741830857799859
9131,0471,1691,2171,295
1,2801,2581,2051,209
Annual rates
1,1791,229
1,2751,322
1,1861,1701,2121,246
1,2631,2861,3181,326
1,2061,201
1,2021,216
1,2181,1931,2011,203
1,2011,2021,2061,226
1929..
1930..1931..1932..1933..1934..
1935..1936..1937..1938_.1939..
1940..1941..1942..1943..1944..
1945..1946..1947..1948*
1947—First halfSecond half
1948—First half.. _Second half*
1947—First quarterSecond quarter..Third quarter...Fourth quarter..
1948—First quarterSecond quarter..Third quarterFourth quarter *.
1 Estimated population of continental United States, including armed forces overseas; annual data as ofJuly 1 and quarterly and semiannual data as of middle of period, interpolated from published monthlyestimates.
2 Current dollars divided by the consumers' price index on the base 1947=100 to give a rough measure ofchanges in buying power of disposable income.3 The consumers' price index has been roughly adjusted to take account of the understatement during theprice control period. This adjustment is in line with the report of the Mitchell Committee. The unad-justed index will be found in appendix table C-20.
* Estimates based on incomplete data; fourth quarter by Council of Economic Advisers.Sources: Department of Commerce (disposable income and population) and Department of Labor (con-
sumers' price index).
IO4
Digitized for FRASER http://fraser.stlouisfed.org/ Federal Reserve Bank of St. Louis
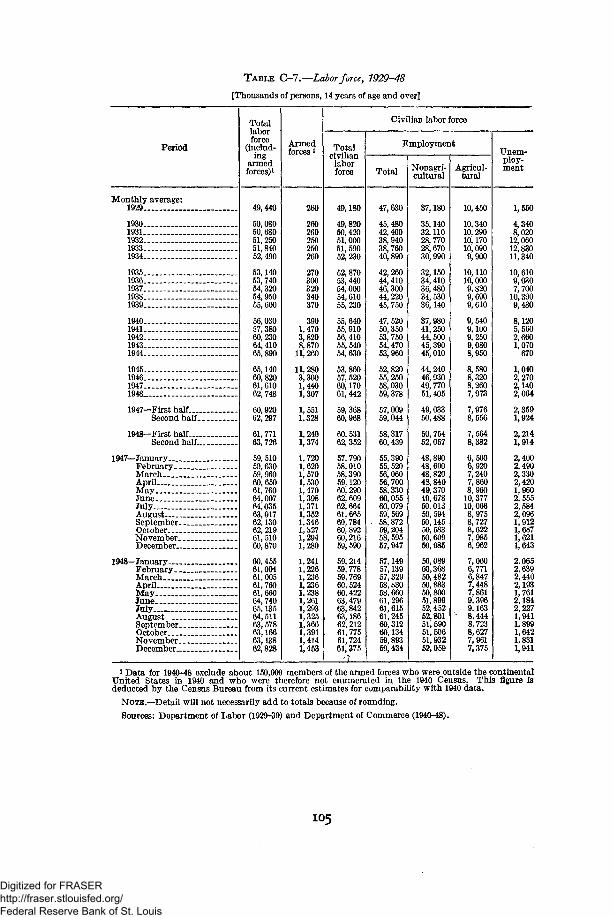
TABLE C-7.—Labor force, 1929-48
[Thousands of persons, 14 years of age and over]
Period
Totallaborforce
(includ-ing
armedforces)1
Armedforces1
Civilian labor force
Totalcivilian
laborforce
Employment
Total Nonagri-cultural
Agricul-tural
Unem-ploy-ment
Monthly average:1929
193019311932 _1933 _1934
1935 ._.-1936193719381939
19401941___1942 -1943 _1944
1945__ _1946_19471948
1947—First half...Second half.
1948—First half—Second half.
1947—January.FebruaryMarchApril . . . ._MayJuneJuly. . .AugustSeptemberOctoberNovemberDecember
1948—January.FebruaryMarchAprilMayJuneJulyAugustSeptemberOctober. __NovemberDecember
49,440
50,08050,68051, 25051, 84052,490
53,14053, 74054,32054,95055, 600
56, 03057,38060,23064,41065, 890
65,14060, 82061, 61062, 748
60, 92062,297
61,77163,726
59, 51059,63059, 96060, 65061,76064,00764,03563,01762,13062, 21961, 51060,870
60,45561,00461, 00561,76061, 66064, 74065,13564,51163,57863,16663,13862,828
260
260260250250260
270300320340370
3901,4703,8208,87011, 260
11,2803,3001,4401,307
1,5511.328
1,2401,374
1,7201,6201,5701,5301,4701,3981,3711,3521,346I,b271,2941,280
1,2411,2261,2361,2361.2381,2611,2931,3251,3661,3911,4141,453
49,180
49,82050,42051,00051, 59052, 230
52, 87053,44054, 00054,61055, 230
55, 64055,91056, 41055, 54054, 630
53, 86057, 52060,17061,442
60,968
60,53162, 352
57,79058,01058,39059,12060, 29062, 60962, 66461,66560, 78460, 89260,21659, 590
59,21459,77859,76960,52460.42263,47963,84263,18662,21261,77561,72461,375
47,630
45,48042,40038,940
40,890
42,26044,410
44, 22045, 750
47, 52050,35053, 75054, 47053,960
52, 82055, 25058, 03059,37857,00959,044
58,31760,439
55,39055, 52056,06056, 70058,33060,05560,07959, 56958, 87259, 20458, 59557,947
57,14957,13957,32958,83058.66061,29661,61561,24560,31260,13459,89359,434
37,180
35,14032,11028, 77028, 67030,990
32,15034,41036,48034, 53036,140
37,98041,25044, 50045, 39045, 010
44, 24046, 93049, 77051,405
49,03350,488
50,75452,057
48,60048,82048,84049,37049,67850.01350,59450,14550,58350,60950,985
10,450
10,34010,29010,17010,0909,900
10,11010,0009,8209,6909,610
9,5409,1009,2509,0808,950
8,5808,3208,2607,973
7,9768,556
7,564
6,500
7,2407,8608,96010,37710,0668,9758,7278,6227,9856,962
50,08950,36850,48250,88350,80051,89952,45252,80151, 59051,50651, 93252,059
7,0606,7716,8477,4487,8619,3969,163
* 8,4448,7238,6277,9617,375
1,550
4,3408,02012,06012,83011,340
10,6109,0307,70010,390
8,1205,5602,6601,070670
1,0402,2702,1402,064
2,3591,924
2,2141,914
2,4002,4902,3302,4201,9602,5552,5842,0961,9121,6871,6211,643
2,0652,6392,4402,1931,7612,1842,2271,9411,8991,6421,8311,941
1 Data for 1940-48 exclude about 150,000 members of the armed forces who were outside the continentalUnited States in 1940 and who were therefore not enumerated in the 1940 Census. This figure isdeducted by the Census Bureau from its current estimates for comparability with 1940 data.
NOTE.—Detail will not necessarily add to totals because of rounding.
Sources: Department of Labor (1929-39) and Department of Commerce (1940-48).
105
Digitized for FRASER http://fraser.stlouisfed.org/ Federal Reserve Bank of St. Louis
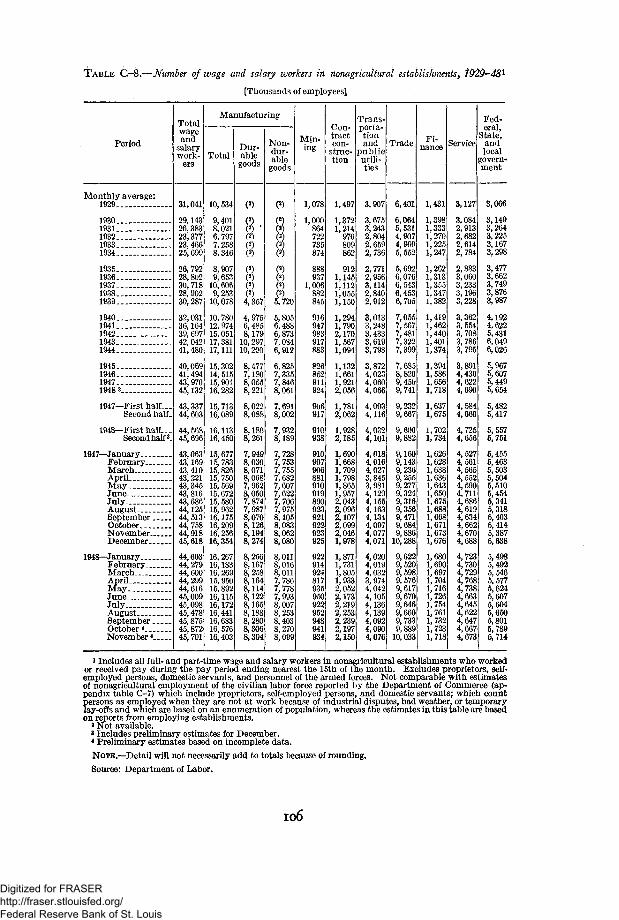
TABLE C-8.—Number of wage and salary workers in nonagricultural establishments, 1Q20-48i
[Thousands of employees]
Period
Totalwageand
salarywork-
ers
Manufacturing
TotalDur-able
goods
Non-dur-able
goods
Min-ing
Con-tractcon-
struc-tion
Trans-portstionand
publicutili-ties
Trade Fi-nance Service
Fed-eral,
State,andlocal
govern-ment
Monthly average:1929
1930_193119321933___1934
1935_.1936193719381939
1940___ —1941. . . .19421943._.1944
1945__194619471948 3
1947—First half. _.Second halL
1948—First half...Second half3.
1947—January. _February. _MarchAprilMayJuneJulyAugust.. .SeptemberOctoberNovemberDecember
1948—January _ _February..March...April . . .MayJuneJulyAugust..SeptemberOctober *November *
31,041
29,14326,38323,37723,46625,699
26,79228,80230,71828, 90230,287
32,03136,16439, 69742,04241,480
40,06941,49443,97045,132
43,33744,603
44, 56845,696
43,06343,16943,41043, 22143,34543,81643,68644,12544, 51344, 75844,91845,618
44,60344,27944,60044,29944,61645,00945,09845,47845,87545,87245, 701
10,534
9,4018,0216,7977,2588,346
8,9079,65310,6069,25310,078
10,78012, 97415,05117,38117, 111
15,30214, 51515,90116,282
15,71316,089
16,11316,450
15,67715,78315, 82615, 75015, 56915,67215, 58015, 96216,17516, 20916,25616,354
16,26716,18316,26915, 95015,89216,11516,17216,44116,68316, 57616,403
4,9756,4858,17910,29710,200
8,4777,1808,0558,221
8,022
()5,720
5,805
8,1808,261
7,9498,0308,0718,0687,9628,0507,8747,9878,0708,1268,1948,274
8,2568,1678,2588,1648,1148,1228,1658,1888,280
6,8737,0846,912
6.8257,3357,8468,061
7,6918,002
7,9328,189
7,7287,7537,7557,6827,6077,6227,7067,9758,105
8,062
8,304
8,0118,0168,0117,7867,7787,9938,0078,2538,4038,2708,099
1,078
1,000864722735874
9371,006882845
916947983917883
852911924
906917
910
910907906881910919890923921922923925
922914924817935950922952948941934
1,497
1,3721,214
970809862
9121,1451,1121,0551,150
1,2941,7902,1701,5671,094
1,1321,6611,9212,056
1,7812,062
1,9282,185
1,6901,6681,709
1^8651,9572,043
2,1072,0992,0461,978
1,8711,7311,8051,9332,0522,1732,2192,2532,2392,1972,150
3,907
3,6753,2432,8042,6592,736
2,7712,9563,1142,8402,912
3,0133,2483,4333,6193,798
3,8724,0234,0604,066
4,0034,116
4,0324,101
4,0184,0164,0273,8453,9814,1294,1554,1634,1344,0974,0774,071
4,0204,0194,0323,9744,0424,1054,1364,1394,0924,0904,076
6,401
6,0645,5314,9074, r~"5,552
6,0766, 5436,4536,705
7,0557,5677,4817,3227,399
7,6858,8209,4509,741
9,2329,667
9,6009,8S2
9,1609,1439,2369,2559,2779,3249,3169,3569,4719,684
10,288
9,6229,5209,5989,5769,6179,6709,6469,6609,7339,889
10, Q33
1,431
V1,3331,2701,2251,247
1,1,3131,3551,3471,382
1,4191,4621,4401,4011,374
1,3941,5861,6561,718
1,6371,675
1,7021,734
1,6261,6281,6381,6361,6431,6501,6751,6881,6681,6711,6731,676
1,1,6901,6971,7041,7161,7261,7541,7611,7321,7231,718
3,127
3,0842,9132,6822,6142,784
2,8833,0603,2333,1963,228
3,3623,5543,7083,7863,795
3,8914,4304,6224, " "
4,5844, " "
4,7254,656
4,5274,5614,5654,5524,5904,7114,6864,6194,6344,6624,6704,688
4,7234,7304,7294,7684,7384,6634,6454,6224,6474,6674,673
3,066
3,1493,2643,2253,1673,298
3,4773,6623,7493,8763,987
4,1924,6225,4316,0496,026
5,9675,6075,4495,654
5,4825,417
5,5575,751
5,4555,4635,5035,5045,5105,4545,3415,3185,4035,4145,3875,638
5,4985,4925,5465,5775,6245,6075,6045,6505,8015,7895,714
1 Includes all full- and part-time wage and salary workers in nonagricultural establishments who workedor received pay during the pay period ending nearest the 15th of the month. Excludes proprietors, self-employed persons, domestic servants, and personnel of the armed forces. Not comparable with estimatesof nonagricultural employment of the civilian labor force reported by the Department of Commerce (ap-pendix table C-7) which include proprietors, self-employed persons, and domestic servants; which countpersons as employed when they are not at work because of industrial disputes, bad weather, or temporarylay-offs and which are based on an enumeration of population, whereas the estimates in this table are basedon reports from employing establishments.
2 Not available.3 Includes preliminary estimates for December.* Preliminary estimates based on incomplete data.
NOTE.—Detail will not necessarily add to totals because of rounding.
Source: Department of Labor.
106
Digitized for FRASER http://fraser.stlouisfed.org/ Federal Reserve Bank of St. Louis

TABLE C-9.—Average gross weekly earnings in selected industries, 1929-48
Period
M anufacturing
Total
$25.03
23.2520.8717.0516.7318.40
20.1321.7824.0522.3023.86
25.2029.5836.6543.1446.08
44.3943.7449.2553.12
47.89
50.61
52.06
54.18
47.1047.2947.6947.5048.4449.3348.9849.1750.4751.0551.2952.69
52.0751.7552.0751.7951.8652.8552.9554.0554.1854.5054.49
Dur-able
goods
$27.22
24.7721.2816.2116.4318.87
21.5224.0426.9124.0126.50
28.4434.0442.7349.3052.07
49.0546.4952.4556.73
50.78
54.12
55.23
58.16
49.6049.7450.3050.3451.7252.9952.1952.4654.0654. 6954.8656.48
55.4654.7755.2554.9654.8156.1356.2158.1957.9059.1358.58
Non-durable
goods
$22.93
21.8420.5017.5716.8918.05
19.1119.9421.5321.0521.78
22.2724.9229.1334.1237.12
38.2941.0245.8749.33
44.77
46.96
48.67
49.98
44.4744.6744.8944.4044.8845.3145.6145.7846.8047.2947.5648.72
48.4548.5648.6648.3348.6549.3749.4949.7950.3849.6850.14
Bitu-minous
coalmining
$25.72
22.2117.6913.9114.4718.10
19.5822.7123.8420.8023.88
24.7130.8635.0241.6251.27
52.2558.0366.8672.09
64.41
69.20
69.77
74.41
69.5465.3064.9054.1465.5167.0954.8770.2371.1971.9171.7775.22
75.7870.5474.84
6 49. 5374.0873.8767.6278.1074.9876.40(2)
Private"Kn-fMDUUQ-
ing con-struc-tion
<•>
(2)(2)(2)(2)
$22.97
24.5127.0130.1429.1930.39
31.7035.1441.8048.1352.18
53.7356.2463.3069.57
60.94
65.32
67.57
71.57
59.9758.9261.2360.5762.2662.7163.6064.7165.3666.3664.5567.31
66.2866.3166.8967.3168.1370.4971.3871.8972.0671.79(2)
Class Isteamrail-
roads
$28.49
27.7626.7623.3423.0924.32
26.7628.0129.2030.2630.99
31.5534.2538.6543.6846.06
45.694 51. 22
54.1758.70
52.38
56.02
58.70
(2)
52.7054.1052.4352.0351.3051.7251.1651.6857.4758.4458. 3859.02
59.6060.5458.9456.8657.2459.0558.2259.17(2)(2)(2)
Tele-phone
m(2)(2)(2)(2)(2)
(2)$29.8131.5331.94
32.4432.7433.9736.3038.39
(3)
44.0444.9648.75
40.86
47.92
48.06
49.45
43.3743.3142.51
e 32. 266 38.13
45.5846.5146.9248.0248.7749.4447.83
48.2047.8247.3147.5648.8248.6749.1948.3549.2149.75
(2)
w noie-sale
trade
<>)
(2)$27.7226.1126.37
26.9328.5329.9429.4829.85
30.3932.3235.5639.4042.29
44.0748.0652.4056.41
51.22
53.54
55.64
57.21
50.0550.8750.8051.1351.5752.8852.2252.0553.6553.6854.7054.97
54.3655.8755.1755.8456.6156.0056.5457.5157.6757.58(2)
Retailtrade
«
8$20.7119.1819.86
19.9620.6821.7321.1421.17
21.1721.9423.2424.8826.58
28.3132.5536.6740.26
35.98
37.40
39.08
41.45
35.0235.2735.3135.9336.5037.8237.9938.1437.0636.7437.1437.36
37.6238.3338.8939.2739.8440.5241.1941.1940.4840.32
(2)
Hotels(year
round) *
Monthly average:1929
19301931. _1932 _1933_. ...1934
1935.. _19361937.1938__1939.
1940-1941..1942.._1943...1944
1945194619471948 8.. _
1947—First half.Second
half.-..
1948—First half.Second
half e. _
1947—January.FebruaryMarch _!AprilMay _June. . .JulyAugust __September-__OctoberNovember...December
1948—JanuaryFebruaryMarchApril...MayJuneJuly-AugustSeptember...October»November7..
8$14.2512.7913.17
13.5713.9714.7814.9315.25
15.5216.0917.6220.2122.65
24.5326.9529.6531.77
29.18
30.10
31.31
32.23
28.6228.9129.0929.4129. 2329.8529.3629.5029.8630.4530.5430.89
30.5531.1930.9631.5931.7031.8832.0432.3432.2132.45
)
1 Money payments only; additional value of room, board, uniforms, and tips is not included.2 Not available.3 Not available. New series, beginning April 1945; includes only employees subject to provisions of the
Fair Labor Standards Act and is not comparable with preceding series, which includes all employees.< Annual average includes retroactive pay increases not included in the monthly averages.* Includes preliminary estimates for November and December except in the case of class I steam railroads
for which data are available only through August.6 Data for these months reflect work stoppages.7 Preliminary estimates based on incomplete data.
NOTE.—Data are for production workers in manufacturing and mining, hourly-rated employees in rail-roads, and for all employees in other industries. Data are for pay-roll periods ending closest to the middleof the month except in railroads where monthly pay-roll and employment figures are used.
Source: Department of Labor.
107
Digitized for FRASER http://fraser.stlouisfed.org/ Federal Reserve Bank of St. Louis
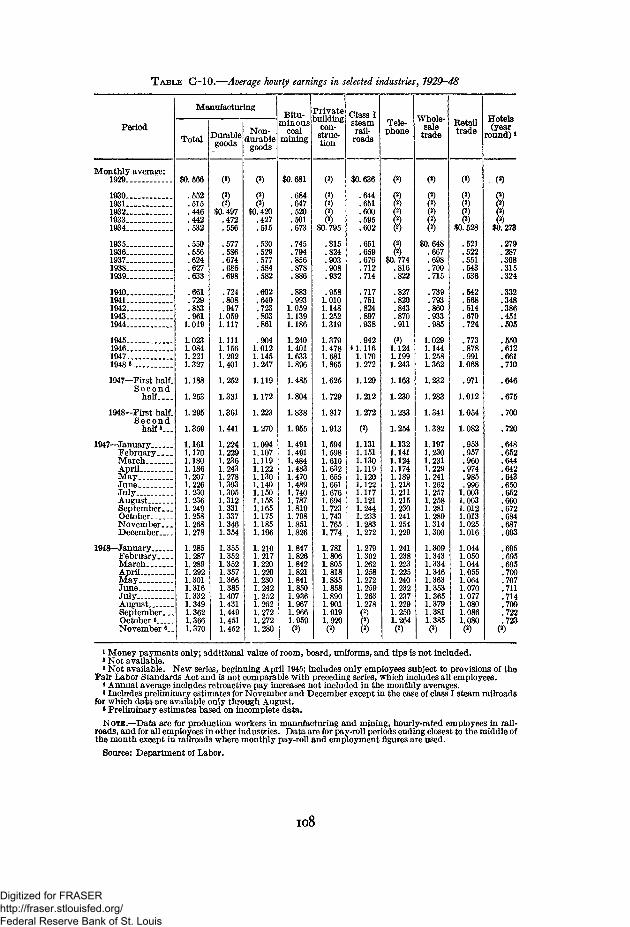
T A B L E G—10.—Average hourly earnings in selected industries
Period
Monthly average:1929- _
19301931193219331934
19351936 —193719381939
19401941194219431944
19451946 . ._19471948 8
1947—First half.Second
half.....
1948—First half.Second
half's...
1947—JanuaryFebruaryMarchAprilMay.JuneJulyAugust _September. __OctoberNovember. _.December
1948—JanuaryFebruaryMarch.AprilMay.JuneJulyAugust _ .September. „October eNovember 6__
Manufacturing
Total
$0,566
.552
.515
.446
.442
.532
.550
.556
.624
.627
.633
.661
.729
.853
.9611.019
1.0231.0841.2211.327
1.188
1.253
1.295
1.359
1.1611.1701.1801.1861.2071.2261.2301.2361.2491.2581.2681.278
1.2851.2871.2891.2921.3011.3161.3321.3491.3621.3661.370
Durablegoods
:
$0,497.472.556
.577
.586
.674
.686
.698
.724
.808
.9471.0591.117
1.1111.1561.2921.401
1.252
1.331
1.361
1.441
1.2241.2291.2361.2431.2781.3031.3051.3121.3311.3371.3461.354
1.3551.3521.3521.3571.3661.3851.4071.4311.4491.4511.452
Non-durable
goods
:
$0,420.427.515
.530
.529
.577
.584
.582
.602
.640
.723
.803
.861
.9041.0121.1451.247
1.119
1.172
1.223
1.270
1.0941.1071.1191.1221.1301.1401.1501.1581.1651.1751.1851.196
1.2101.2171.2201.2201.2301.2421.2521.2621.2721.2721.280
Bitu-minous
coalmining
$0,681
.684
.647
.520
.501
.673
.745
.794
.856
.878
.886
.883
.9931.0591.1391.186
1.2401.4011.6331.896
1.485
1.804
1.838
1.955
1.4911.4911.4841.4831.4701.4891.7401.7871.8191.7981.8511.826
1.8471.8261.8421.8211.8411.8501.9361.9671.9661.959
Privatebuilding
con-struc-tion
(2)
(2)(2)(2)
(2)$0,795
.815
.824
.903
.908
.932
.9581.0101.1481.2521.319
1.3791.4781.6811.865
1.625
1.729
1.817
1.913
1.5941.5981.6101.6321 6551.6611.6761.6941.7231.7431.7651.774
1.7811.8061.8051.8181.8351.8581.8901.9011.9191.920
Class Isteamrail-
roads
$0,636
.644
.651
.600
.595
.602
.651
.659
.676
.712
.714
.717
.751
.824
.897
.938
.942* 1.116
1.1701.272
1.129
1.212
1.272
1.1311.1511.1301.1191.1201.1221.1171.1211.2441.2331.2831.272
1.2791.3021.2621.2581.2721.2591.2631.278
Tele-phone
(2)
(2)(2)(2)
(2)(2)
$0.774.816.822
.827
.820
.843
.870
.911
1.1241.1991.243
1.163
1.230
1.233
1.254
1.1321.1411.1241.1741.1891.2181.2111.2151.2301.2411.2541.229
1.2411.2381.2231.2251.2401.2321.2371.2291.2501.264
, 7929-48
Whole-sale
trade
(2)
(2)(2)
$0,648.667.698.700.715
.739
.793
.860
.933
.985
1.0291.1441.2581.362
1.232
1.283
1.341
1.382
1.1971.2301.2311.2291.2411.2621.2571.2581.2811.2891.3141.300
1.3091.3431.3341.3461.3631.3531.3651.3791.3811.385
Retailtrade
(a)
(2)(2)
$0,528
.521
.522
.551
.543
.536
.542
.568
.614
.670
.724
.773
.878
.9911.068
.971
1.012
1.054
1.082
.953
.957
.960
.974
.985
.9961.0031.0031.0121.0131.0251.016
1.0441.0501.0441.0551.0641.0701.0771.0801.0861.080
Hotels(year
round) *
(2)(2)(2)(2)
$0,273
.279
.287
.308
.315
.324
.332
.348
.386
.451
.505
.550
.612
.661
.710
.646
.675
.700
.720
.648
.652
.644
.642
.643
.650
.652
.660
.672
.684
.687
.693
.695
.695
.695
.700
.707
.711
.714
.709
.722
.723
* Money payments only; additional value of room, board, uniforms, and tips is not included,a Not available.3 Not available. New series, beginning April 1945; includes only employees subject to provisions of the
Fair Labor Standards Act and is not comparable with preceding series, which includes all employees.* Annual average includes retroactive pay increases not included in the monthly averages.«Includes preliminary estimates for November and December except in the case of class I steam railroads
for which data are available only through August.«Preliminary estimates based on incomplete data.
NOTE.—Data are for production workers in manufacturing and mining, hourly-rated employees in rail-roads, and for all employees in other industries. Data are for pay-roll periods ending closest to the middle ofthe month except in railroads where monthly pay-roll and employment figures are used.
Source: Department of Labor.
108
Digitized for FRASER http://fraser.stlouisfed.org/ Federal Reserve Bank of St. Louis
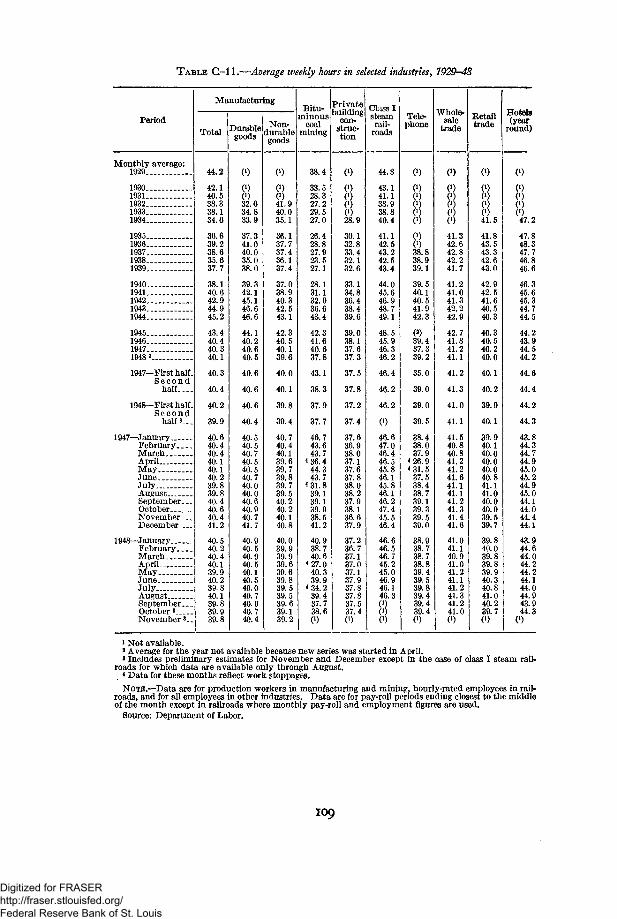
TABLE C- l 1.—Average weekly hours in selected industries, 1929-48
Period
Manufacturing
Total
44.2
42.140.538.338.134.6
36.639.238.635.637.7
38.140.642.944.945.2
43.440.440.340.1
40.3
40.4
40.2
39.9
40.640.440.440.140.140.239.839.840.440.640.441.2
40.540.240.440.139.940.239.840.139.839.939.8
Durablegoods
0)0)0)32.634.833.9
37.341.040.035.038.0
39.342.145.146.646.6
44.140.240.640.5
40.6
40.6
40.6
40.4
40.540.540.740.540.540.740.040.040.640.940.741.7
40.940.540.940.540.140.540.040.740.040.740.4
Non-durablegoods
0)0)0)41.940.035.1
36.137.737.436.137.4
37.038.940.342.543.1
42.340.540.139.6
40.0
40.1
39.8
39.4
40.740.440.139.639.739.839.739.540.240.240.140.8
40.039.939.939.639.639.839.539.539.639.139.2
Bitu-minous
coalmining
38.4
33.528.327.229.527.0
26.428.827.923.527.1
28.131.132.936.643.4
42.341.640.637.8
43.1
38.3
37.9
37.7
46.743.643.7
4 36.444.343.7
4 31.839.139.139.938.541.2
40.938.740.6
4 27.040.339.9
4 34.239.437.738.60)
Privatebuilding
con-struc-tion
0)0)0)0)(028.9
30.132.833.432.132.6
33.134.836.438.439.6
39.038.137.637.3
37.5
37.8
37.2
37.4
37.636.938.037.137.637.838.038.237.938.136.637.9
37.236.737.137.037.137.937.837.837.537.4C1)
Class Isteamrail-
roads
44.8
43.141.138.938.840.4
41.142.543.242.543.4
44.045.646.948.749.1
48.545.946.346.2
46.4
46.2
46.2
0)46.647.046.446.545.846.145.846.146.247.445.546.4
46.646.546.745.245.046.946.146.30)0)0)
Tele-phone
0)
(J)0)0)(0
838.838.939.1
39.540.140.541.942.3
(2)
39.437.339.2
35.0
39.0
39.0
39.5
38.438.037.9
4 26.94 31.5
37.538.438.739.139.339.539.0
38.938.738.738.839.439.539.839.439.439.40)
Whole-. . 1 .saie
trade
0)0)0)0)0)(041.342.642.842.241.7
41.241.041.342.242.9
42.741.841.241.1
41.2
41.3
41.0
41.1
41.540.840.841.241.241.641.141.141.241.341.441.6
41.041.140.941.041.241.141.241.341.241.00)
Retailtrade
0)
80)41.5
41.843.543.342.643.0
42.942.541.640.540.3
40.340.540.240.0
40.1
40.2
39.9
40.1
39.940.140.040.040.040.841.141.040.040.039.539.7
39.840.039.839.839.940.340.841.040.239.70)
Hotels(year
round)
Monthly average:1929
1930 -1931 _1932___1933__1934 . . .
1935__1936___.193719381939
19401941194219431944
1945194619471948 3 . . .
1947—First half.Second
half..._
1948—First half.Second
half3___
1947—JanuaryFebruary...MarchAprilMayJune.JulyAugustSeptember..October...November..December...
1948—JanuaryFebruary...MarchAprilMayJuneJuly.AugustSeptember..October s___.November3.
47.2
47.848.347.746.846.6
46.345.645.344.744.5
44.243.944.544.2
44.6
44.4
44.2
44.3
43.844.344.744.945.045.244.945.044.144.044.444.1
43.944.644.044.244.244.144.044.943.944.3
C1)
1 Not available.J Average for the year not available because new series was started in April.3 Includes preliminary estimates for November and December except in the case of class I steam rail-
roads for which data are available only through August.* Data for these months reflect work stoppages.
NOTE.—Data are for production workers in manufacturing and mining, hourly-rated employees in rail-roads, and for all employees in other industries. Data are for pay-roll periods ending closest to the middleof the month except in railroads where monthly pay-roll and employment figures are used.
Source: Department of Labor.
109
Digitized for FRASER http://fraser.stlouisfed.org/ Federal Reserve Bank of St. Louis
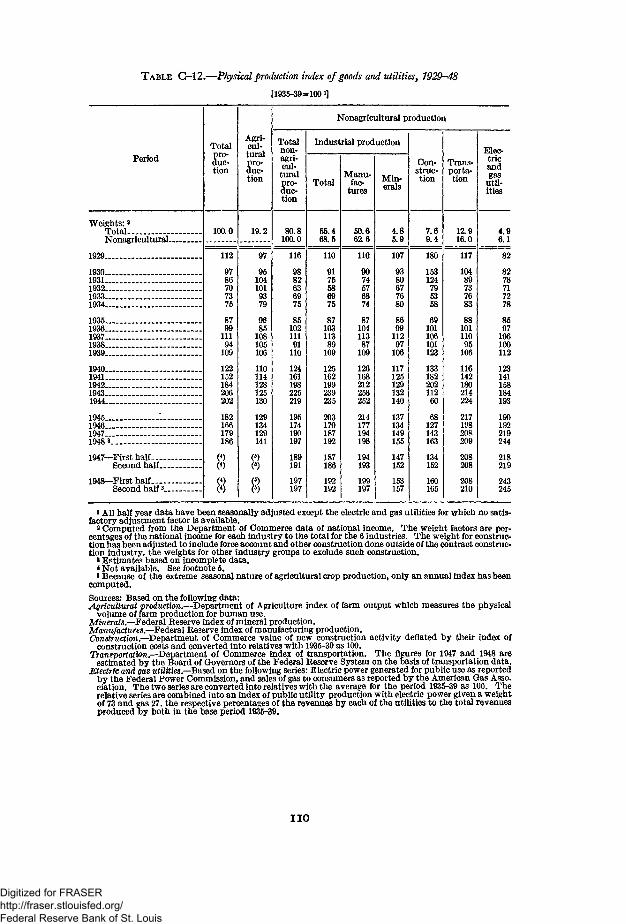
TABLE C-12.—Physical production index of goods and utilities, 1929-48
[1935-39=1001]
Period
Weights: aTotalNonagricultural
1929
193019311932 - . _1933 _1934
193519361937 .19381939
19401941194219431944
1945 1194619471948 3
1947—First halfSecond half
1948—First halfSecond half3 -_
Totalpro-duc-tion
100.0
112
9786707375
8799
11194
109
122152184206202
182166179186
88
Agri-cul-turalpro-duc-tion
19.2
97
951041019379
9685
108105106
110114128125130
129134129141
88
Nonagricultural production
Totalnon-agri-cul-
turalpro-duc-tion
80.8100.0
116
9882636975
8510211191
110
124161198225219
195174190197
189191
197197
Industrial production
Total
55.468.5
110
9175586975
8710311389
109
125162199239235
203170187192
187186
192192
Manu-fac-
tures
50.662.6
110
9074576874
8710411387
109
126168212258252
214177194198
194193
199197
Min-erals
4.85.9
107
9380677680
8699
11297
106
117125129132140
137134149155
147152
153157
Con-struc-tion
7.69.4
180
153124795358
69101106101123
13318220211260
68127143163
134152
160165
Trans-porta-tion
12.916.0
117
10489737683
8810111095
106
116142180214224
217198208209
208208
208210
Elec-tricandgas
util-ities
4.96.1
82
8278717278
8597
106100112
123141158184193
190192219244
218219
243245
1 All half year data have been seasonally adjusted except the electric and gas utilities for which no satis-factory adjustment factor is available.
2 Computed from the Department of Commerce data of national income. The weight factors are per-centages of the national income for each industry to the total for the 6 industries. The weight for construc-tion has been adjusted to include force account and other construction done outside of the contract construc-tion industry, the weights for other industry groups to exclude such construction.
8 Estimates based on incomplete data.* Not available. See footnote 5.*Because of the extreme seasonal nature of agricultural crop production, only an annual index has been
computed.
Sources; Based on the following data:Agricultural production.—Department of Agriculture index of farm output which measures the physical
volume of farm production for human use.Minerals.—Federal Reserve index of mineral production.Manufactures — Federal Reserve index of manufacturing production.Construction.—Department of Commerce value of new construction activity deflated by their index of
construction costs and converted into relatives with 1935-39 as 100.Transportation.—Department of Commerce index of transportation. The figures for 1947 and 1948 are
estimated by the Board of Governors of the Federal Reserve System on the basis of transportation data.Electric and gas utilities— Based on the following series: Electric power generated for public use as reported
by the Federal Power Commission, and sales of gas to consumers as reported by the American Gas Asso.ciation. The two series are converted into relatives with the average for the period 1935-39 as 100. Therelative series are combined into an index of public utility production with electric power given a weightof 73 and gas 27. the respective percentages of the revenues by each of the utilities to the total revenuesproduced by both in the base period 1935-39.
IIO
Digitized for FRASER http://fraser.stlouisfed.org/ Federal Reserve Bank of St. Louis
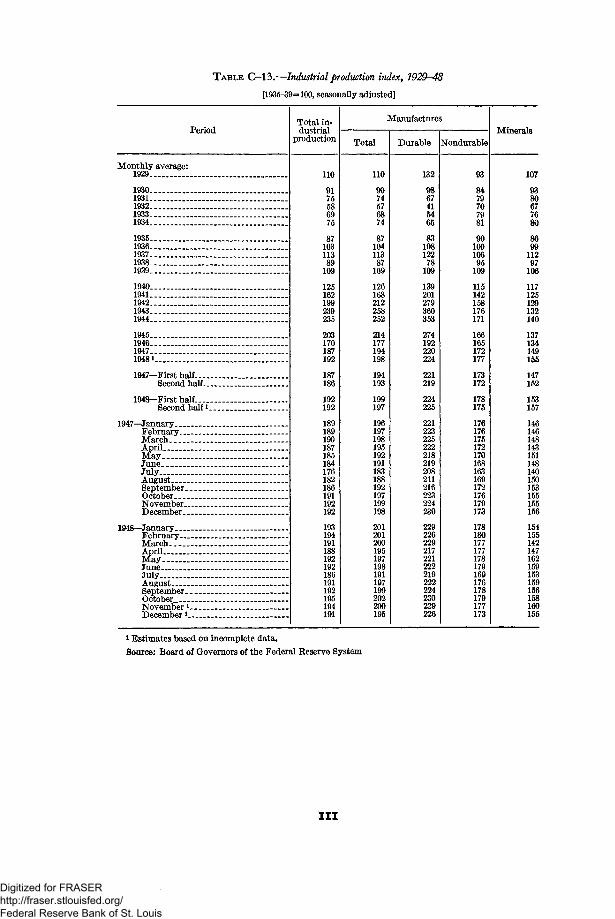
TABLE C-13.—Industrial production index, 1929-48
[1935-39=100, seasonally adjusted]
Period
Monthly average:1929
19301931193219331934
19351936 . _193719381939
1940194119421943 .1944 „. .
19451946194719481
1947—First halfSecond half
1948—First half .Second half1
1947—JanuaryFebruaryMarch. _AprilMay - _JuneJulyAugust _SeptemberOctober _NovemberDecember _. _. __
1948—JanuaryFebruary..MarchAprilMayJuneJulyAugust --SeptemberOctober _ «_November iDecember * -
Total in-dustrial
production
110
9175586975
8710311389
109
125162199239235
203170187192
187186
192192
189189190187185184176182186191192192
193194191188192192186191192195194191
Manufacture
Total
110
9074576874
8710411387
109
126168212258252
214177194198
194193
199197
196197198195192191183188192197199198
201201200195197198191197199202200195
Durable
132
9867415465
8310812278
109
139201279360353
274192220224
221219
224225
221223225222218219208211216223224230
229226229217221222219222224230229226
3
Nondurable
93
8479707981
9010010695
109
115142158176171
166165172177
173172
178175
176176175172170168163169172176179173
178180177177178179169176178179177173
Minerals
107
9380677680
8699
11297
106
117125129132140
137134149155
147152
153157
146146148143151148140150153155155156
154155142147162159153159156158160155
i Estimates based on incomplete data.
Source: Board of Governors of the Federal Reserve System
I I I
Digitized for FRASER http://fraser.stlouisfed.org/ Federal Reserve Bank of St. Louis
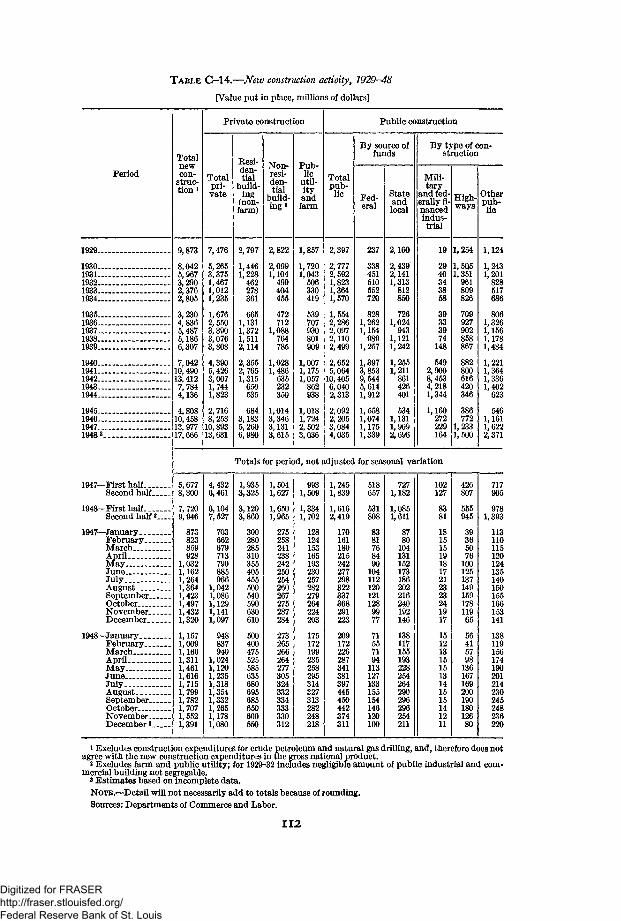
TABLE O14.—New construction activity, 1929-48
[Value put in place, millions of dollars]
Period
Totalnewcon-
struc-tion *
Private construction
Totalpri-vate
Resi-den-tial
build-ing
(non-farm)
Non-resi-den-tial
build-ing2
Pub-lic
util-
andfarm
Public construction
Totalpub-lic
By source offunds
Fed-eral
Stateandlocal
By type of con-struction
Mili-tary
and fed-erally fi-nancedindus-trial
High-ways
Otherpub-lic
1929-
1930-1931-1932-1933-1934-
1935-1936-1937-1938-1939-
1940-1941-1942-1943-1944-
1945-1946-1947-1948 3
1947—First halfSecond half___
1948—First halfSecond half 3. . . .
1947—JanuaryFebruaryMarchAprilMayJuneJulyAugust _.SeptemberOctober. ___NovemberDecember. _.
1948—JanuaryFebruaryMarchAprilMayJuneJulyAugustSeptember _OctoberNovemberDecember3
9,873
8,0425,9673,2902,3762,805
3,2304,8365,4875,1866,307
7,04210,49013,4127,7844,136
10,45813,97717,666
7,476
5,2653,3751,4671,0121,235
1,6762,5503,3903,0763,808
4,3905,4263,0071,7441,823
2,7168,25310,89313,631
2,797
1,4461,228462278361
6651,1311,3721,5112,114
2,3552,7651,315650535
6843,1835,260
2,822
2,0991,104499404455
472712
1,088764785
1,0281,486635232350
1,0143,3463,1313,615
1,857
1,7201,043506330419
539707930801909
1,0071,1751,057862938
1,0181,7242,5023,036
2,397
2,7772,5921,8231,3641,570
1,5542,2862,0972,1102,499
2,6525,064
10,4056,0402,313
2,0922,2053,0844,035
237
451510552720
1,2621,154989
1,257
1,3973,8539,5445,6141,912
1,5581,0741,1751,339
2,160
2,4392,1411,313812850
1,024943
1,1211,242
1,2551,211861426401
5341,1311,9092,696
19
2940343858
39333974148
5492,9008,4534,2181,344
1,160272229164
1,254
1,5051,351961
70.9927902858
882800616420346
386772
1,2331,500
Totals for period, not adjusted for seasonal variation
1,124
1,2431,201828517
8061,3261,1561,1781,484
1,2211,3641,3361,402623
5461,1611,6222,371
5,6778,300
7,7209,946
873823859928
1,0321,1621,2641,3641,4231,4971,4321,320
1,1571,0091,1661,3111,4611,6161,7151,7991,7821,7071,5521,391
4,4326,461
6,1047,527
703662679713790885966
1,0421,0861,1291,1411,097
948837940
1,0241,1201,2351,3181,3541,3321,2651,1781,080
1,9353,325
3,1203,860
300280285310355405455500540590630610
500400475525585635680695685650600550
1,5041,627
1,6501,965
275258241238242250254260267275287284
273265266264277305324332334333330312
9931,509
1,3341,702
128124153165193230257282279264224203
175172199235258295314327313282248218
1,2451,839
1,6162,419
170161180215242277298822337368291223
209172226287341381397445450442374311
518657
531808
83817684901041121201211289977
71557194113127133155154146120100
7271,182
1,0851,611
8780104131152173186202216240192146
138117155193228254264290296296254211
102127
8381
181515191817212323241917
151213151513141515141211
426807
555945
3936507610012513714915917811965
5641579813616716920019018012680
717905
978
113110115120124135140150155166153141
138119156174190201214230245248236220
1 Excludes construction expenditures for crude petroleum and natural gas drilling, and, therefore does notagree with the new construction expenditures in the gross national product.
2 Excludes farm and public utility; for 1929-32 includes negligible amount of public industrial and com-mercial building not segregable.
3 Estimates based on incomplete data.NOTE.—Detail will not necessarily add to totals because of rounding.Sources: Departments of Commerce and Labor.
112
Digitized for FRASER http://fraser.stlouisfed.org/ Federal Reserve Bank of St. Louis
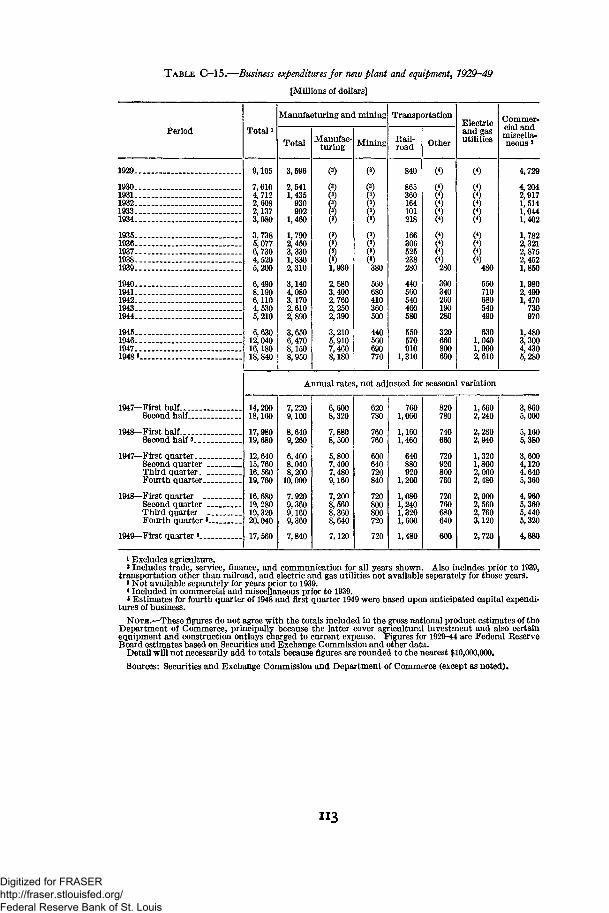
TABLE C-15.—Business expenditures for new plant and equipment, 1929-49
[Millions of dollars]
Period Total i
Manufacturing and mining
Total
3,596
2,5411,435
930992
1,460
1,7902,4503,3301,8302,310
3,1404,0803,1702,6102,890
3,6506,4708,1508,950
Manufac-turing
0
33333
333
(3)1,930
2,5803,4002,7602,2502,390
3,2105,9107,4608,180
Mining
m
18(3)(3)
380
560680410360500
440560690770
Transportation
Rail-road
840
865360164101218
166306525238280
440560540460580
550570910
1,310
Other
(4)
8(4)
(4)280
390340260190280
320660800690
Electricand gasutilities
(4)
?4)
4)
(4)(4)(4)
480
550710680540490
6301,0401,9002,610
Commer-cial andmiscella-neous a
1929..
1930..1931..1932..1933..1934..
1935..1936..1937..1938-.1939..
1940..1941-.1942..1943..1944..
1945-.1946..1947..1948«
1947—First half-Second half
1948— First halfSecond half 5. _.
1947—First quarter...Second quarterThird quarter,iFourth quarter.
1948—First quarter .Second quarterThird quarterFourth quarter
1949—First quarter «..
9,165
7,6104,7122,6082,1373,080
3,7385,0776,7304,5205,200
6,4908,1906,1104,5305,210
6,63012,04016,18018,840
Annual rates, not adjusted for seasonal variation
14,20018,160
17,98019,680
12,64015,76016,56019,760
16,68019,28019,32020,040
17,560
7,2209,100
8,6409,260
6,4008,0408,200
10,000
7,9209,3609,1609,360
7,840
6,6008,320
7,8808,500
5,8007,4007,4809,160
7,2008,5608,3608,640
7,120
620780
760760
600640720840
720800800720
720
7601,060
1,1601,460
640880920
1,200
1,0801,2401,3201,600
1,480
820780
740660
720920800760
720760680640
600
1,5602,240
2,2802,940
1,3201,8002,0002,480
2,0002,5602,7603,120
2,720
4,729
4,2042,9171,5141,0441,402
1,7822,3212,8752,4521,850
1,9802,4901,470730970
1,4803,3004,4305,280
5,000
5,1605,380
3,6004,1204,6405,360
4,9605,3605,4405,320
4,880
1 Excludes agriculture.2 Includes trade, service, finance, and communication for all years shown. Also includes prior to 1939,
transportation other than railroad, and electric and gas utilities not available separately for those years.3 Not available separately for years prior to 1939.* Included hi commercial and miscellaneous prior to 1939.« Estimates for fourth quarter of 1948 and first quarter 1949 were based upon anticipated capital expendi-
tures of business.
NOTE.—These figures do not agree with the totals included in the gross national product estimates of theDepartment of Commerce, principally because the latter cover agricultural investment and also certainequipment and construction outlays charged to current expense. Figures for 1929-44 are Federal ReserveBoard estimates based on Securities and Exchange Commission and other data.
Detail will not necessarily add to totals because figures are rounded to the nearest $10,000,000.
Sources: Securities and Exchange Commission and Department of Commerce (except as noted).
"3
Digitized for FRASER http://fraser.stlouisfed.org/ Federal Reserve Bank of St. Louis
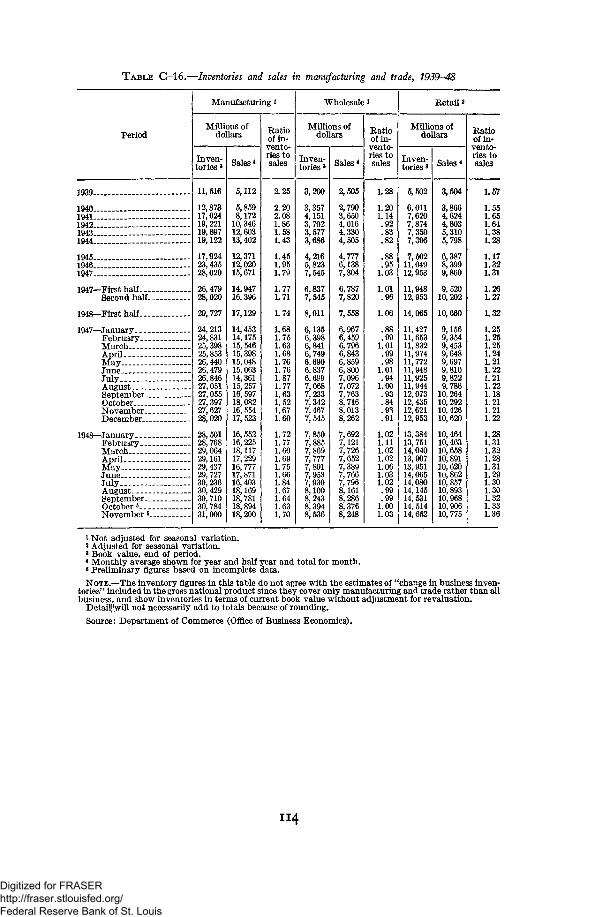
TABLE G-16.—Inventories and sales in manufacturing and trade, 1939-48
Period
Manufacturing 1
Millions ofdollars
Inven-tories 3
11,516
12,87317,02419,22119,89719,122
17,92423,43528,020
26,47928,020
29,727
24, 21324,83125,39825,85326,44026,47926,84627,05127,05527,39727,62728,020
28, 50128, 76829,06429,16129,43729, 72730, 23630, 42930, 71030, 78431,000
Sales *
5,112
5,8598,172
10,34612,60313,402
12,37112,02015,671
14,94716,396
17,129
14,45314,17515, 54615,39815,04815,06314,36115, 25716, 59718,08216, 55417, 523
16, 55216, 22518,11717, 22916, 77717,87116, 40318,16918, 78118, 89418,200
Ratioof in-vento-ries tosales
2.25
2.202.081.861.581.43
1.451.951.79
1.771.71
1.74
1.681.751.631.681.761.761.871.771.631.521.671.60
1.721.771.601.691.751.661.841.671.641.631.70
Wholesale *
Millions ofdollars
Inven-tories a
3,200
3,3574,1513,7023,5773,686
4,2165,8237,545
6,8377,545
8,011
6,1356,3986,8416,7496,6906,8376,6997,0687,2337,3427,4677,545
7,8507,8857,8697,7777,8017,9537,9308,1008,2438,3948,536
Sales *
2,505
2,7903,6504,0164,3304,505
4,7776,1387,304
6,7877,820
7,558
6,9676,4596,7966,8436,8596,8007,0967,0727,7638,7168,0138,262
7,6927,1217,7267,6527,3897,7667,7968,1618,2868,3768,248
Ratioof in-vento-ries tosales
1.28
1.201.14.92.83.82
.88
.951.03
1.01.96
1.06
.88
.991.01.99.98
1.01.94
1.00.93.84.93.91
1.021.111.021.021.061.031.02.99.99
1.001.03
Retail *
Millions ofdollars
Inven-tories *
5,502
6,0117,6207,8747,3507,396
7,50211,04912,953
11,94812,953
14,065
11,42711,65311,83211,97411, 77211,94811,92511,94412,07312,43512,62112,953
13,38413,75114,04013,90713,95114,06514,08014,14514, 53114,51414, 652
Sales *
3,504
3,8664,6244,8035,3105,798
6,3878,3999,860
9,52010,202
10,660
9,1569,3549,4539,6489,6979,8109,8229,786
10,26410,29210,42610,620
10,46410,46310, 65810,89110,62010,86210,85710,89310,96810,90610,775
Ratioof in-vento-ries tosales
1.57
1.551.651.641.381.28
1.171.321.31
1.261.27
1.32
1.251.251.251.241.211.221.211.221.181.211.211.22
:
:'.
1.28L.31L.32L.28L.31L.29L.30L.301.321.33]L.36
1939
194019411942.19431944
1945. -19461947.- —
1947—First half. __Second half.
1948—First half. . .
1947—JanuaryFebruary. __MarchAprilMayJuneJulyAugustSeptember._OctoberNovember. .December...
1948—JanuaryFebruary . . .MarchAprilMayJuneJulyAugustSeptember. _October 5.. _November ».
1 Not adjusted for seasonal variation.2 Adjusted for seasonal variation.• Book value, end of period.4 Monthly average shown for year and half year and total for month.«Preliminary figures based on incomplete data.
NOTE.—The inventory figures in this table do not agree with the estimates of "change in business inven-tories" included in the gross national product since they cover only manufacturing and trade rather than allbusiness,, and show inventories in terms of current book value without adjustment for revaluation.
Detail]*will not necessarily add to totals because of rounding.
Source: Department of Commerce (Office of Business Economics).
114
Digitized for FRASER http://fraser.stlouisfed.org/ Federal Reserve Bank of St. Louis
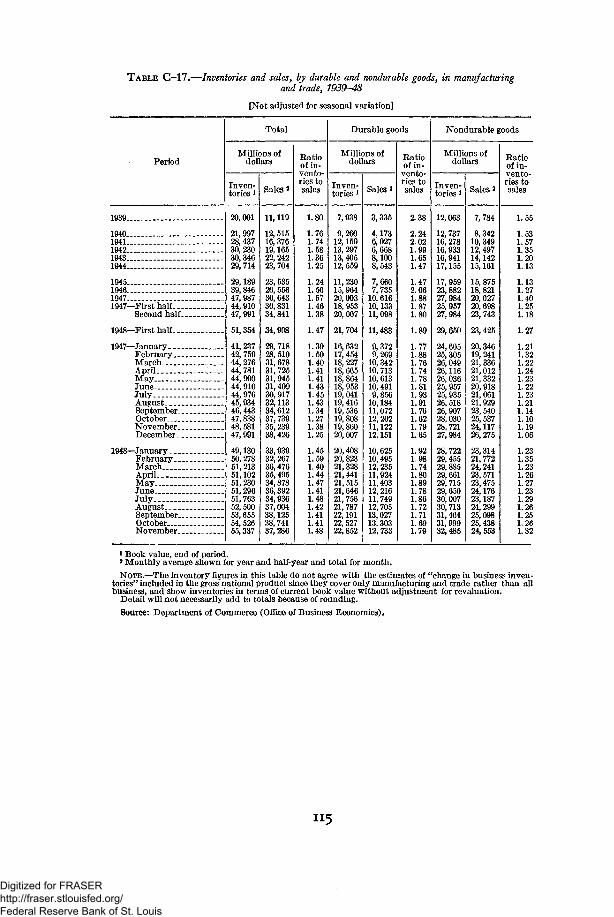
TABLE G-17.—Inventories and sales, by durable and nondurable goods, in manufacturingand trade; 1939-48
[Not adjusted for seasonal variation]
Period
Total
Millions ofdollars
Inven-tories *
20,001
21,99728,43730, 23030, 34629, 714
29,18939, 84647, 98744,91047, 991
51,354
41,23742, 75944,27644, 78144, 90044, 91044, 97645,93446,44347,83848,58147,991
49,13050, 27851,21351,10251,23051,29651,76352,50053,65554, 52655,337
Sales a
11,119
12,51516,37619,16522, 24223, 704
23, 53526,55630,64330,83134,841
34,908
29, 71828, 51031,67831,72531,94531,40930,91732,11334,61237,73935,23938,426
33,93932, 26736,47635,49534,87836,39234,93637,00438,12538,74137,286
Ratioof in-vento-ries tosales
1.80
1.761.741.581.361.25
1.241.501.571.461.38
1.47
1.391.501.401.411.411.431.451.431.341.271.381.25
1.451.591.401.441.471.411.481.421.411.411.48
Durable goods
Millions ofdollars
Inven-tories 1
7,938
9,26012.15913', 29713, 40512, 559
11, 23015,96420,00318,95320,007
21, 704
16,63217, 45418, 22718,66518, 86418, 95319,04119,41619,53619,80819,86020,007
20,40820,82321,32821,44121,51521,64621,75621,78722,19122, 52722,852
Sales 2
3,335
4,1736,0276,6688,1008,543
7,6607,735
10, 61610,13311,098
11,483
9,3729,269
10, 34210, 71310, 61310, 4919,856
10,18411,07212,20211,12212,151
10,62510,49512, 23511,92411,40312,21611,74912,70513,02713, 30312,733
Ratioof in-
vento-ries tosales
2.38
2.242.021.991.651.47
1.472.061.881.871.80
1.89
1.771.88]
:]
]]]]:
L.76L.74L. 78L.81L. 93L.91L.76L.62L.79L.65
L.92L.98L.74L.80L.891.78L.86L.721.711.69]L.79
Nondurable goods
Millions ofdollars
Inven-tories i
12,063
12,73716, 27816, 93316,94117,155
17,95923, 88227, 98425, 95727,984
29,650
24,60525, 30526, 04926,11626, 03625, 95725, 93526,51826,90728,03028,72127,984
28,72229,45529,88529,66129,71529,65030,00730,71331,46431,99932,485
Sales 2
7,784
8,34210,34912,49714,14215,161
15, 87518,82120,02720, 69823, 743
23,425
20,34619, 24121,33621,01221, 33220,91821, 06121,92923, 54025,53724,11726,275
23,31421, 77224,24123,57123,47524,17623,18724,29925,09825,43824,553
Ratioof in-vento-ries tosales
1.55
1.531.571.351.201.13
1.131.27
:]
]
]]
]]]]i:
ii
L.40L.25L.18
L.27
L.21L.32L.22L.24L.23L.221.23L.21L.14L.10L.19L.06
L.23L.35L.23L.26L.27L.23L.29L.26.25.26
L32
1939..
1940...1941...1942...1943—1944...
1945194619471947—First half....
Second half..
1948—First half....
1947—JanuaryFebruary. . .MarchApril.MayJuneJulyAugustSeptember-OctoberNovember..December..
1948—JanuaryFebruary. _.MarchAprilMayJune.JulyAugustSeptember-OctoberNovember..
* Book value, end of period.8 Monthly average shown for year and half-year and total for month.NOTE.—The inventory figures in this table do not agree with the estimates of "change in business inven-
tories" included in the gross national product since they cover only manufacturing and trade rather than allbusiness, and show inventories in terms of current book value without adjustment for revaluation.
Detail will not necessarily add to totals because of rounding.
Source: Department of Commerce (Office of Business Economics).
Digitized for FRASER http://fraser.stlouisfed.org/ Federal Reserve Bank of St. Louis
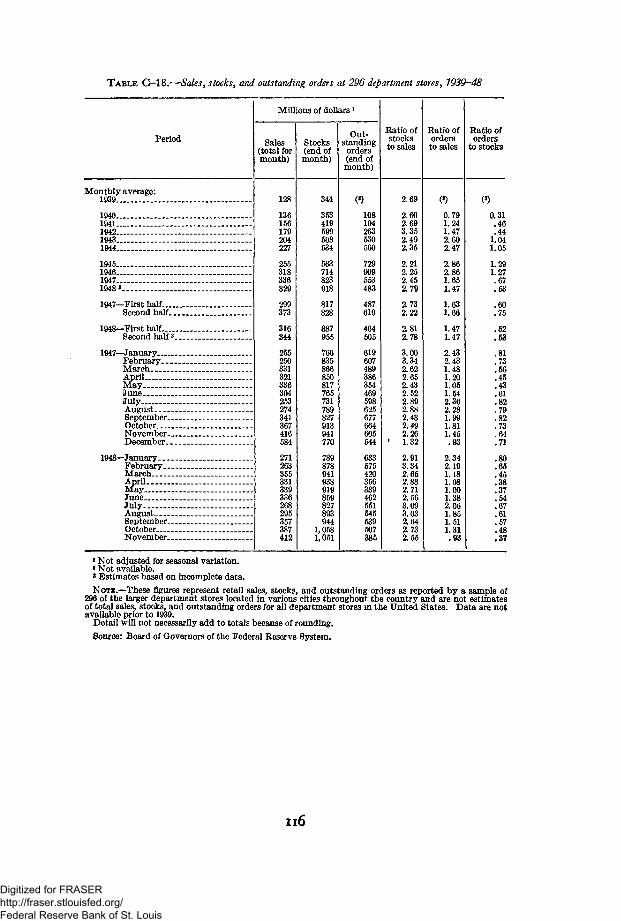
TABLE G—18.—Sales, stocks, and outstanding orders at 296 department stores, 1939-48
Period
Millions of dollars *
Sales(total formonth)
Stocks(end ofmonth)
Out-standing
orders(end ofmonth)
Ratio ofstocks
Ratio oforders
Ratio oforders
to stocks
Monthly average:1939
1940—1941—1942—1943.1944....
1945...1946—1947—1948 8-
1947—First half....Second half.
1948—First halfSecond half 3.
1947—JanuaryFebruary. _.MarchAprilMayJuneJulyAugustSeptember-OctoberNovember..December-.
1948—JanuaryFebruary...MarchAprilMayJuneJuly.AugustSeptember-OctoberNovember..
128
136156179204227
255318336329
299373
316344
255250331321336304253274341367416584
271263355331339
295357387412
344
353419
534
563714823918
817828
887955
766835866850817765731789827913941770
789878941938919859827893944
1,0581,051
<*>
108194263530560
729909553483
487619
464505
619607
354469
625677
544
575420356339462551545539507385
2.69
2.602.693.352.492.35
2.212.252.452.79
2.732.22
2.812.78
3.003.342.622.652.432.522.892.882.432.492.261.32
2.913.342.652.832.712.563.093.032.642.732.55
0.791.241.472.602.47
2.862.861.651.47
1.631.66
1.471.47
2.432.431.481.201.051.542.362.281.991.811.45
2.342.191.181.081.001.382.061.851.511.31
0.31.46.44
1.041.05
1.291.27.67.53
.60
.75
.52
.81
.73
.56
.45
.43
.61
.82
.79
.82
.73
.64
.71
.80
.65
.45
.38
.37
.54
.67
.61
.57
.48
.37
i Not adjusted for seasonal variation.a Not available.3 Estimates based on incomplete data.
NOTE.-—These figures represent retail sales, stocks, and outstanding orders as reported by a sample of296 of the larger department stores located in various cities throughout the country and are not estimatesof total sales, stocks, and outstanding orders for all department stores in the United States. Data are notavailable prior to 1939.
Detail will not necessarily add to totals because of rounding.
Source: Board of Governors of the Federal Reserve System.
Digitized for FRASER http://fraser.stlouisfed.org/ Federal Reserve Bank of St. Louis
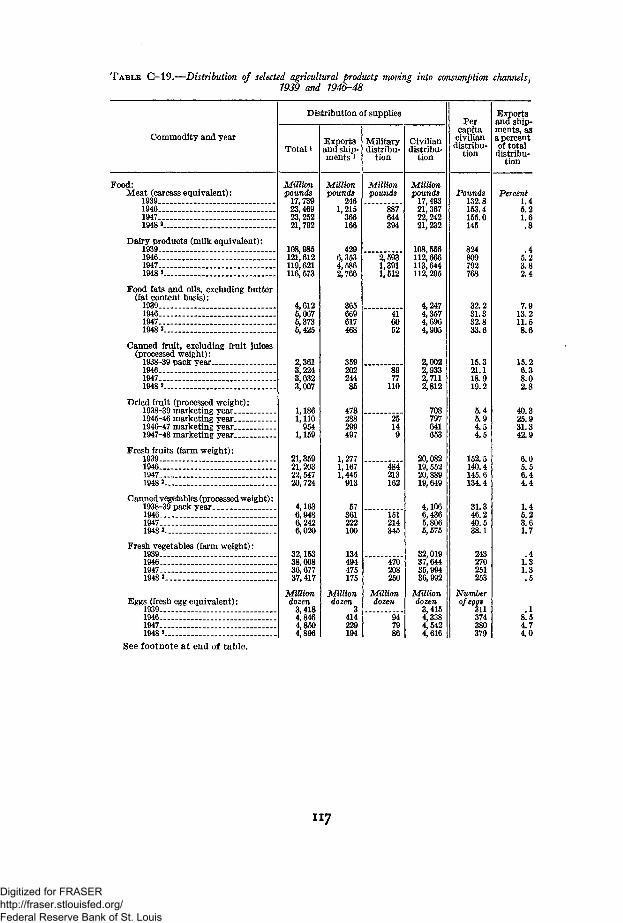
TABLE G-19.—Distribution of selected agricultural products moving into consumption channels.7939 and 7946-48
Commodity and year
Distribution of supplies
Total iExportsand ship-
t *
Militarydistribu-
tion
Civiliandistribu-
tion
Percapita
civiliandistribu-
tion
Exportsand ship-ments, asa percentof total
distribu-tion
Food:Meat (carcass equivalent):
1939.19461947.1948«
Dairy products (milk equivalent):19391946.19471948 K
Food fats and oils, excluding butter(fat content basis):
1939194619471948 3
Canned fruit, excluding fruit juices(processed weight):
1938-39 pack year19461947.1948 2
Dried fruit (processed weight):1938-39 marketing year1945-46 marketing year1946-47 marketing year1947-48 marketing year
Fresh fruits (farm weight):1939194619471948 2
Canned vegetables (processed weight):1938-39 pack year _1946.1947.1948 2 _. „
Fresh vegetables (farm weight):193919461947-1948 2 _
Eggs (fresh egg equivalent):193919461947.19482
Millionpounds
17,73923,46923,25221,792
108,985121,612119,621116,573
4,6125,0675,3735,425
2,3613,2243,0323,007
1,1861,110954
1,159
21,35921,20322,54720,724
4,1636,9486,2426,020
32,15338,60836,67737,417
Milliondozen
3,4184,8464,8504,896
Millionpounds
2461,215
366166
4296,3534,5862,766
365
617468
35920224485
478
299497
1,2771,1671,445
913
57361222100
134494475175
Milliondozen
3414229194
Millionpounds
887644
2,5931,3911,512
8977
no
484213162
151214345
470208250
Milliondozen
Millionpounds
17,49321,36722,24221,232
108,556112,666113,644112,295
4,2474,357
4,905
2,0022,9332,7112,812
708797641653
20,08219,55220,88919,649
4,1066,4365,8065,575
32,01937,64435,994
Milliondozen
3,4154,3384,5424,616
Pounds132.8153.4155.0145
824809792768
32.231.332.833.6
15.321.118.919.2
5.45.94.54.5
152.5140.4145.6134.4
31.346.240.538.1
243270251253
Number
374380379
Percent1.45.21.6.8
.45.23.82.4
7.913.211.58.6
15.26.38.02.8
40.325.931.342.9
6.05.56.44.4
1.45.23.61.7
.41.31.3
.18.54.74.0
See footnote at end of table.
117
Digitized for FRASER http://fraser.stlouisfed.org/ Federal Reserve Bank of St. Louis
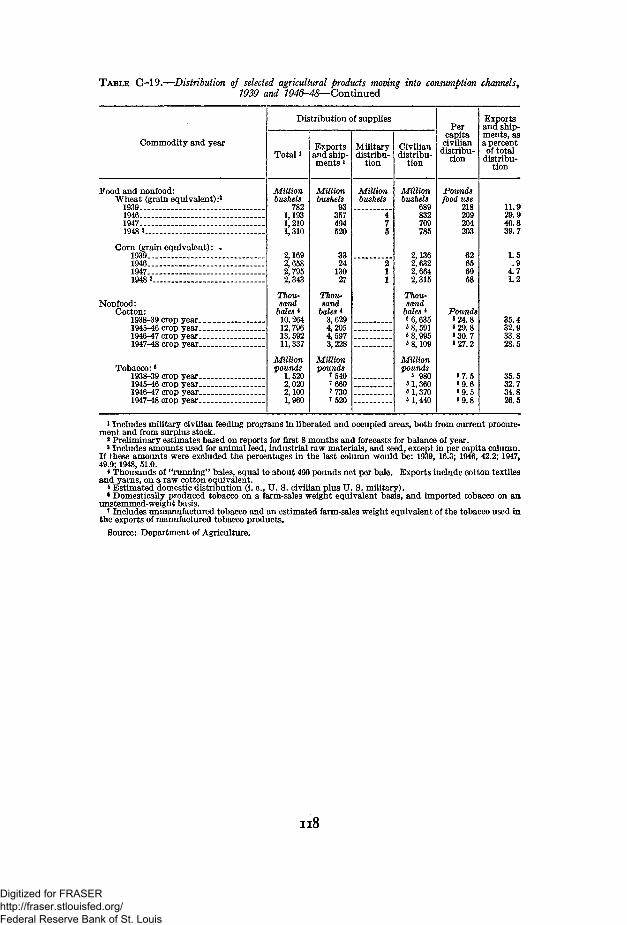
T A B L E C—19.—Distribution of selected agricultural products moving into consumption channels,7939 and 1946-48— Continued
Commodity and year
Distribution of supplies
Total iExports
and ship-ments 1
Militarydistribu-
tion
Civiliandistribu-
tion
Percapitacivilian
distribu-tion
Exportsand ship-ments, asa percentof total
distribu-tion
Food and nonfood:Wheat (grain equivalent):3
1939..1946— _1947- -1948 2.... _
Corn (grain equivalent): *19391946 . „ .19471948 2
Nonfood:Cotton:
1938-39 crop year.1945-46 crop year.1946-47 crop year.1947-48 crop year.
Tobacco:6
1938-39 crop year.1945-46 crop year.1946-47 crop year.1947-48 crop year.
Millionbushels
7821,1931,2101,310
2,1692,6582,7952,343
Thou-sand
bales *10,26412, 79613,59211,337
Millionpounds
1,5202,0202,1001,960
Millionbushels
93357494520
3324
13027
Thou-sand
bales *3,6294,2054,5973,228
Millionpounds
7 5407 6607 7307 520
Millionbushels
Millionbushels
689832709785
2,1362,6322,6642,315
Thou-sand
bales *5 6,635«8,591«8,9956 8,109
Millionpounds
« 9808 1,360«1,370«1,440
Poundsfood use
218209204203
Pounds8 24.88 29.88 30.75 27.2
8 7.589.68 9.58 9.8
11.940.839.7
1.5.9
4.71.2
35.432.933.828.5
35.532.734.826.5
1 Includes military civilian feeding programs in liberated and occupied areas, both from current procure-ment and from surplus stock.
2 Preliminary estimates based on reports for first 8 months and forecasts for balance of year.a Includes amounts used for animal feed, industrial raw materials, and seed, except in per capita column.If these amounts were excluded the percentages in the last column would be: 1939, 16.3; 1946, 42.2; 1947,49.9; 1948, 51.0.
* Thousands of "running" bales, equal to about 490 pounds net per bale. Exports include cotton textilesand yarns, on a raw cotton equivalent.
8 Estimated domestic distribution (i. e., 17. S. civilian plus U. S. military).6 Domestically produced tobacco on a farm-sales weight equivalent basis, and imported tobacco on anunstemmed-weight basis.7 Includes unmanufactured tobacco and an estimated farm-sales weight equivalent of the tobacco used inthe exports of manufactured tobacco products.
Source: Department of Agriculture.
n8
Digitized for FRASER http://fraser.stlouisfed.org/ Federal Reserve Bank of St. Louis
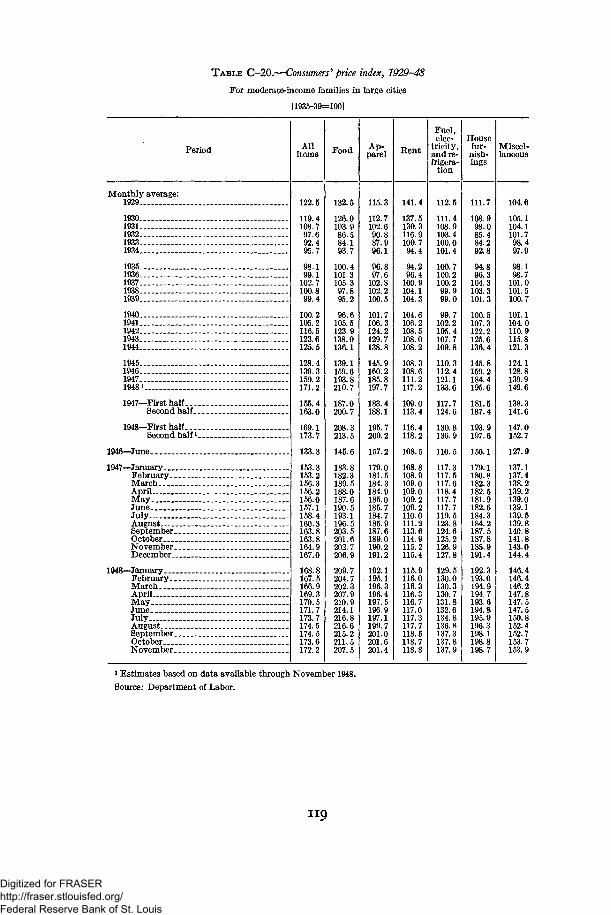
TABLE C-20.—Consumers'' price index, 1929-48
For moderate-income families in large cities
[1935-39=100]
Period Allitems
122.5
119.4108.797.692.495.7
98.199.1
102.7100.899.4
100.2105.2116.5123.6125.5
128.4139.3159.2171.2
155.4163.0
169.1173.7
133.3
153.3153.2156.3156.2156.0157.1158.4160.3163.8163.8164.9167.0
168.8167.5166.9169.3170.5171.7173.7174.5174.5173.6172.2
Food
132.5
126.0103.986.584.193.7
100.4101.3105.397.895.2
96.6105.5123.9138.0136.1
139.1159.6193.8210.7
187.0200.7
208.3213.5
145.6
183.8182.3189.5188.0187.6190.5193.1196.5203.5201.6202.7206.9
209.7204.7202.3207.9210.9214.1216.8216.6215.2211.5207.5
Ap-parel
115.3
112.7102.690.887.996.1
96.897.6
102.8102.2100.5
101.7106.3124.2129.7138.8
145.9160.2185.8197.7
183.4188.1
195.7200.2
157.2
179.0181.5184.3184.9185.0185.7184.7185.9187.6189.0190.2191.2
192.1195.1196.3196.4197.5196.9197.1199.7201.0201.6201.4
Kent
141.4
137.5130.3116.9100.794.4
94.296.4
100.9104.1104.3
104.6106.2108.5108.0108.2
108.3108.6111.2117.2
109.0113.4
116.4118.2
108.5
108.8108.9109.0109.0109.2109.2110.0111.2113.6114.9115.2115.4
115.9116.0116.3116.3116.7117.0117.3117.7118.5118.7118.8
Fuel,elec-
tricity,and re-frigera-
tion
112.5
111.4108.9103.4100.0101.4
100.7100.2100.299.999.0
99.7102.2105.4107.7109.8
110.3112.4121.1133.6
117.7124.6
130.8136.9
110.5
117.3117.5117.6118.4117.7117.7119.5123.8124.6125.2126.9127.8
129.5130.0130.3130.7131.8132.6134.8136.8137.3137.8137.9
Housefur-
nish-ings
111.7
108.998.085.484.292.8
94.896.3
104.3103.3101.3
100.5107.3122.2125.6136.4
145.8159.2184.4195.6
181.5187.4
193.9197.6
156.1
179.1180.8182.3182.5181.9182.6184.3184.2187.5187.8188.9191.4
192.3193.0194.9194.7193.6194.8195.9196.3198.1198.8198.7
Miscel-laneous
Monthly average:1929
1930_1931193219331934 . . ._
1935193619371938.1939
1940... .-_1941194219431944
1945._-1946 _..194719481 ._
1947—First half....Second half..
1948—First half.. .Second half V
1946—June.
1947—JanuaryFebruary.MarchApril..May.JuneJulyAugustSeptemberOctober _NovemberDecember
1948—January _FebruaryMarchApril.. .MayJuneJulyAugustSeptemberOctoberNovember
104.6
105.1104.1101.798.497.9
98.198.7
101.0101.5100.7
101.1104.0110.9115.8121.3
124.1128.8139.9149.6
138.3141.6
147.0152.7
127.9
137.1137.4138.2139.2139.0139.1139.5139.8140.8141.8143.0144.4
146.4146.4146.2147.8147.5147.5150.8152.4152.7153.7153.9
* Estimates based on data available through November 1948.
Source: Department of Labor.
Digitized for FRASER http://fraser.stlouisfed.org/ Federal Reserve Bank of St. Louis
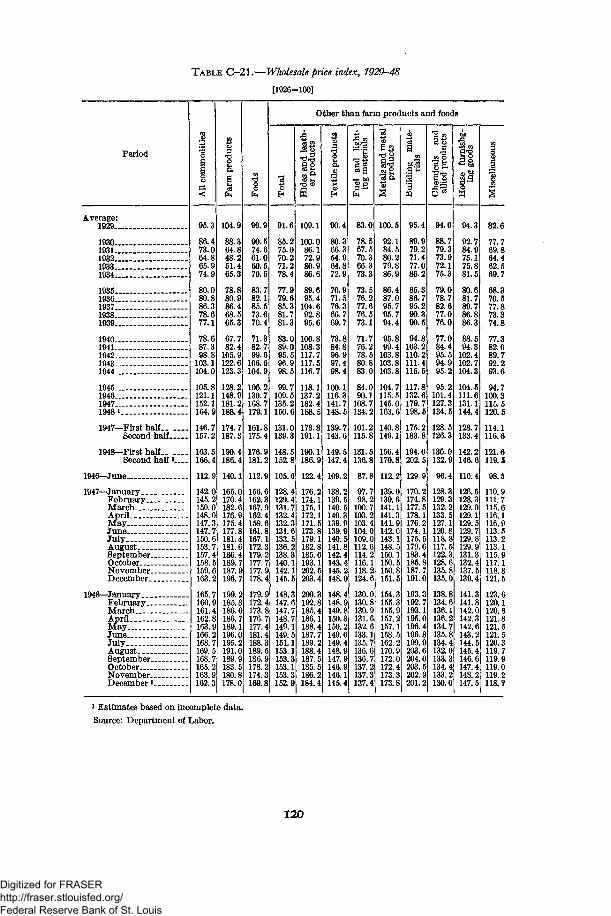
TABLE C-21.— Wholesale price index, 1929-48
[1926=100]
Period
Other than farm products and foods
Average:1929
19301931193219331934
19351936193719381939
19401941..1942 _19431944
194519461947.19481
1947—First half.. .___Second half
1948—First half.. .Second half *
1946—June
1947—JanuaryFebruaryMarchAprilMay __.June .-JulyAugustSeptember- _OctoberNovemberDecember
1948—January.February -March..April -MayJuneJulyAugustSeptemberOctober...NovemberDecember1
95.3
86.473.064.865.974.9
80.080.886.378.677.1
78.687.398.8
103.1104.0
105.8121.1152.1164.9
146.7157.:
163.5166.4
112.9
142.0145.2150.0148.0147.147.150.6153.7157.4158.5159.6163.2
165.7160.9161.4162.8163.9166.2168.7169.5168.7165.163.9162.3
104.9
88.364.848.251.465.3
78.880.986.468.565.3
67.782.4
105.9122.6123.3
128.2148.9181.2188.4
174.7187.3
190.4186.4
140.1
165.0170.4182.6176.9175.4177.8181.4181.6186.4189.7187.9196.7
199.2185.3186.0186.7189.1196.0195.2191.0189.9183.5180.8178.0
90.574.661.060.570.5
83.782.185.573.670.4
71.382.799.6
106.6104.9
106.2130.7168.7179.1
161.8175.4
176.9181.:
112.9
156.6162.3167.9162.4159.6161.8167.1172.3179.2177.177.9178.4
179.9172.4173.8176.177.4181.4188.3189.5186.9178.174.3169.8
91.6
85.275.070.271.278.4
77.979.685.381.781.3
83.089.095.596.998.5
99.7109.5135.2150.6
131.0139.3
148.5152.8
105.6
128.4129.4131.7132.4132.3131.6133.5136.138.3140.1142.1145.5
148.3147.6147.148.7149.1149.5151.1153.1153.3153.1153.3152.9
109.1
100.086.172.9
89.695.4
104.692.895.6
100.8108.3117.7117.5116.7
118.1137.2182.4188.5
173.8191.1
190.1186.9
122.4
176.2174.1175.1172.1171.5173.8179.1182.8185.6193.1202.5203.4
200.3192.8185.4186.1188.4187.189.188.4187.5185.5186.184.4
90.4
80.366.354.964.872.9
70.971.576.366.769.7
73.884.896.997.498.4
100.1116.3141.7148.5
139.7143.6
149.5147.4
109.2
138.139.5140.5140.3139.9139.9140.5141.8142.4143.4145.148.0
148.4148.9149.8150.3150.149.6149.4148.9147.9146.9146.1145.4
83.0
78.567.570.366.373.3
73.576.277.676.573.1
71.776.278.580.883.0
84.090.1
108.7134.2
101.2115.8
131.5136.8
87.8
97.798.2
100.7103.2103.4104.0109.0112.6114.2116.1118.2124.6
130.0130.8130.9131.6132.6133.1135.7136.6136.7137.2137.3137.
100.5
92.184.580.279.886.9
86.487.095.795.794.4
95.899.4
103.1103.8103.8
104.7115.5145.0163.6
140.8149.1
156.4170.8
112.2
139.0139.141.1141.3141.9142.0143.1148.5150.1150.5150.8151.5
154.3155.3155.9157.157.1158.162.2170.9172.0172.4173.3173.8
95.4
79.271.477.086.2
85.386.795.290.390.5
94.8103.2110.2111.4115.5
117.8132.6179.7198.5
175.2183.8
194.6202.5
129.9
170.2174.8177.5178.1176.2174.1175.5179.6183.4185.8187.191.0
193.3192.193.1195.0196.4196.8199.9203.6204.0203.5202.9201.2
94.0
79.373.972.175.3
79.078.782.677.076.0
77.084.495.594.995.2
95.2101.4127.3134.5
128.5126.3
136.0132.9
96.4
128.3129.3132.2133.5127.1120.8118.8117.5122.3128.6135.8135.0
138.8134.6136.1136.134.135.8134.4132.0133.3134.4133.130.0
94.3
92.784.975.175.881.5
80.681.789.786.886.3
88.594.3
102.4102.7104.3
104.5111.6131.1144.4
128.7133.4
142.2146.6
110. <
126.5128.3129.0129.1129.5129.7129.8129.9131.3132.4137.5139.4
141.3141.8142.0142.3142.6143.2144.5145.4146.6147.4148.2147.5
82.6
77.769.864.462.569.7
68.370.577.873.374.8
77.382.089.792.293.6
94.7100.3115.5120.5
114.1116.6
121.6119.5
98.5
110.9111.7115.6116.1116.9113.5113.2113.1115.9117.1118.8121.5
123.6120.1120.8121.8121.5121.5120.3119. 7119.9119.0119.2118.7
i Estimates based on incomplete data.
Source: Department of Labor.
120
Digitized for FRASER http://fraser.stlouisfed.org/ Federal Reserve Bank of St. Louis
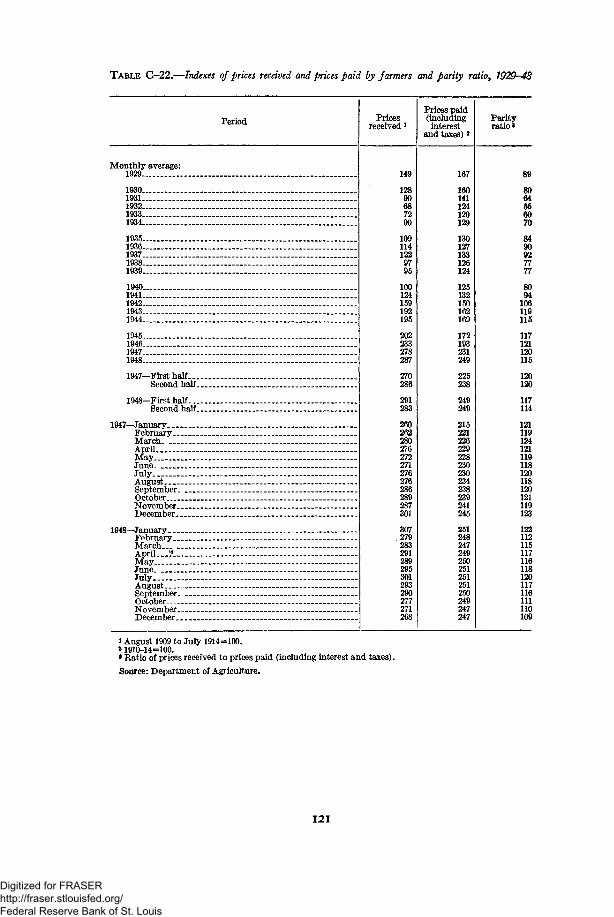
TABLE C-22.—Indexes of prices received and prices paid by farmers and parity ratio, 1929-48
Monthly average:1929
19301931193219331934
19351936193719381939
19401941194219431944
19451946 __19471948. . . .
1947—First halfSecond half
1948—First halfSecond half
1947—January.... *__FebruaryMarchAprilMayJuneJulyAugustSeptemberOctoberNovemberDecember.
1948—JanuaryFebruaryMarch _ __ __April 9 ,MayJuneJulyAugustSeptemberOctoberNovemberDecember
Period Pricesreceived1
149
12890687290
1091141229795
100124159192195
202233278287
270286
291283
260262280276272271276276286289287301
307279283291289295301293290277271268
Prices paid(including
interestand taxes) *
167
160141124120129
130127133126124
125132150162169
172193231249
225238
249249
215221226229228230230234238239241245
251248247249250251251251250249247247
Parityratio»
89
8064556070
8490927777
8094
106119115
117121120115
120120
117114
121119124121119118120118120121119123
122112115117116118120117116111110109
i August 1909 to July 1914=100.a 1910-14=100.• Ratio of prices received to prices paid (including interest and taxes).
Source: Department of Agriculture.
121
Digitized for FRASER http://fraser.stlouisfed.org/ Federal Reserve Bank of St. Louis
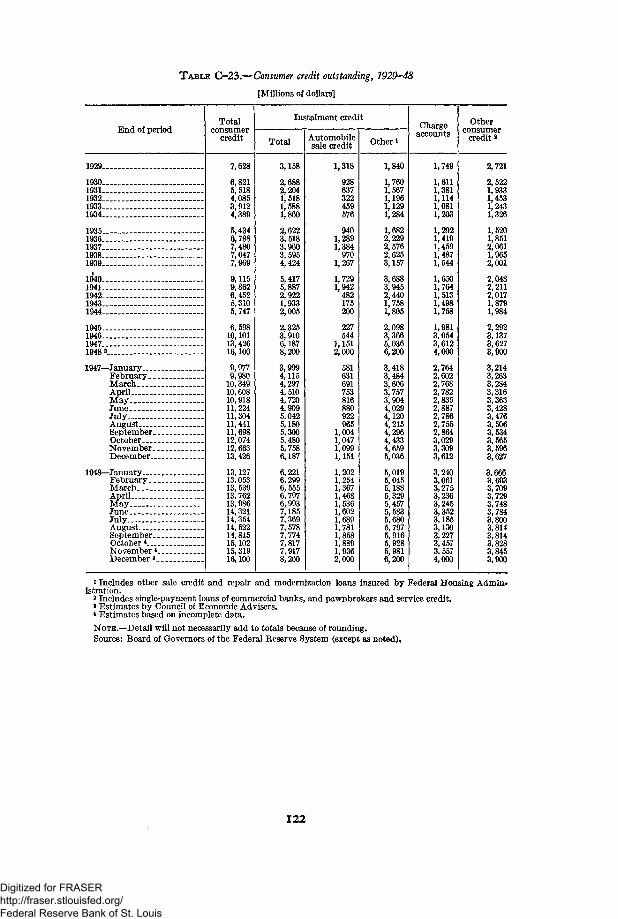
TABLE C-23.—Consumer credit outstanding, 1929-48
[Millions of dollars]
End of periodTotal
consumercredit
Instalment credit
Total Automobilesale credit Other i
Chargeaccounts
Otherconsumer
credit a
1929
1930__1931...1932__1933._1934... _.
1935—1936... -.1937.—1938—.1939—
1940—1941..1942..1943—1944
1945.-1946-19471948 »
1947—JanuaryFebruary. _.MarchAprilMay _.JuneJulyAugustSeptember..OctoberNovember..December...
1948—JanuaryFebruary. _.MarchAprilM a y . .JuneJulyAugustSeptember..October *.__.November *.December 3.
7,628
6,8215,5184,0853,9124,389
5,434
7,4807,0477,969
9,1159,8626,4525,3105,747
10.10113,42616,100
9,9779,98010,34910,60810,91811, 22411,30411,44111,69812,07412,66313,426
13,12713,05313, 53913,76213,98614,32114,35414, 52214,81515.10215,31916,100
3,158
2,6882,2041,5181,5881,860
2,6223,5183,9603,5954,424
5,4175,8872,9221,9332,005
2,3253,9106,1878,200
3,9994,1154,2974,5104,7204,9095,0425,1805,3005,4805,7586,187
6,2216,2996,5556,7976,9937,1857,3697,5787,7747,8177,9178,200
1,318
928637322459576
9401,2891,384970
1,267
1,7291,942482175200
227544
1,1512,000
581631691753816880922965
1,0041,0471,0991,151
1,2021,2541,3671,4681,5361,6021,6891,7811,8581,8891,9362,000
1,840
1,7601,5671,1961,1291,284
1,6822,2292,5762,6253,157
3,9452,4401,7581,805
3,3665,0366,200
3,4183,4843,6063,7573,9044,0294,1204,2154,2964,4334,6595,036
5,0195,0455,1885,3295,4575,5835,6805,7975,9165,9285,981
1,749
,611,381,114,081,203
,292,419,459,487,544
,650,764,513,498,758
1,9813,0543,6124,000
2,7642,6022,7682,7822,8352,8872,7862,7552,8643,0293,3093,612
3,2403,0613,2753,2363,2453,3523,1853,1303,2273,4573,5574,000
2,721
2,522\ 933, 453[,243,326
,520,851
2,0611,9652,001
2,0482,2112,0171,8791,984
2,2923,1373,6273,900
3,2143,2633,2843,3163,3633,4283,4763,5063,5343,5653,5963,627
3,6663,6933,7093,7293,7483,7843,8003,8143,8143,8283,8453,900
1 Includes other sale credit and repair and modernization loans insured by Federal Housing Admin*istration.2 Includes single-payment loans of commercial banks, and pawnbrokers and service credit.
3 Estimates by Council of Economic Advisers.* Estimates based on incomplete data.NOTE.—Detail will not necessarily add to totals because of rounding.Source: Board of Governors of the Federal Reserve System (except as noted).
122
Digitized for FRASER http://fraser.stlouisfed.org/ Federal Reserve Bank of St. Louis
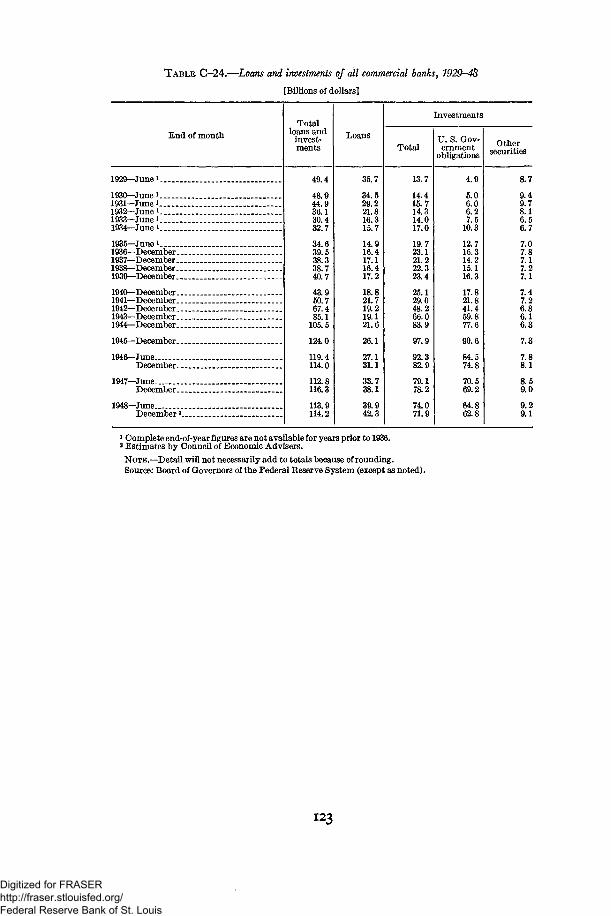
TABLE C-24.—Loans and investments of all commercial banks, 1929-48
[Billions of dollars]
End of month
1929—June 1
1930—June 11931—June 1
1932—June i1933—June1
1934—June1
1935—June»1936—December __1937—December1938—December1939—December
1940—December1941—December _1942—December1943—December1944—December
1945—December
1946—JuneDecember
1947—June.
1948—June -December2
Totalloans and
invest-ments
49.4
48.944.936.130.432.7
34 639 538.338 740.7
43 950.767.485 1
105.5
124.0
119.4114.0
112.8116.3
113.9114.2
Loans
35.7
34.529.221.816.315.7
14.916.417.116.417.2
18.821.719.219.121.6
26.1
27.131.1
33.738.1
39.942.3
Total
13.7
14.415.714.314.017.0
19 723.121.222 323.4
25.129.048.266.083.9
97.9
92.382.9
79.178.2
74.071.9
Investments
U. S. Gov-ernment
obligations
4.9
5.06.06.27.5
10.3
12.715.314.215.116.3
17.821.841.459.877.6
90.6
84.574.8
70.569.2
64.862.8
Othersecurities
8.7
9.49.78.16.56.7
7.07.87.17.27.1
7.47.26.86.16.3
7.3
7.88.1
8.59.0
9.29.1
1 Complete end-of-year figures are not available for years prior to 1936.2 Estimates by Council of Economic Advisers.
NOTE.—Detail will not necessarily add to totals because of rounding.Source: Board of Governors of the Federal Reserve System (except as noted).
123
Digitized for FRASER http://fraser.stlouisfed.org/ Federal Reserve Bank of St. Louis
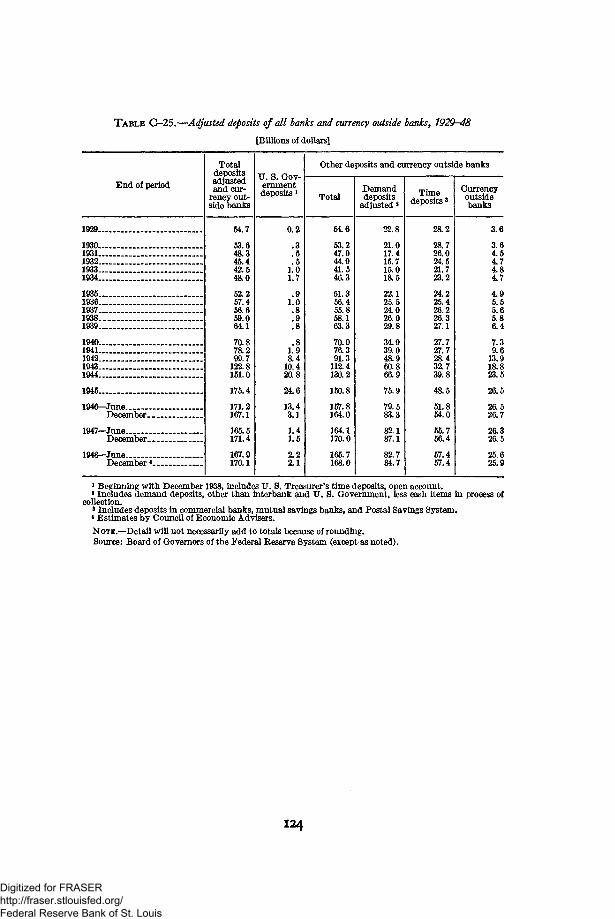
TABLE C-25.—Adjusted deposits of all banks and currency outside banks, 1929-48
[Billions of dollars]
End of period
1929
1930 „193119321933. . . . .1934
1935 . . . . . .1936193719381939
19401941194219431944
1945
1946—June
1947—JuneDecember _ - - -
1948-—JuneDecember4 .
Totaldepositsadjustedand cur-
rency out-side banks
54.7
53.648.345.442.548.0
62.257.456.659.064.1
70.878.299.7
122.8151.0
175.4
171.2167.1
165.5171.4
167.9170.1
U. S. Gov-ernmentdeposits l
0.2
.3
.5
.51.01.7
.91.0.8.9.8
,81.98.4
10.420.8
24.6
13.43.1
1.41.5
2.22.1
Other deposits and currency outside banks
Total
54.6
53.247.944.941.546.3
51.356.455.858.163.3
70.076.391.3
112.4130.2
150.8
157.8164.0
164.1170.0
165.7168.0
Demanddeposits
adjusted2
22.8
21.017.415.715.018.5
22.125.524.026.029.8
34.939.048.960.866.9
75.9
79.583.3
82.187.1
82.784.7
Timedeposits3
28.2
28.726.024.521.723.2
24.225.426.226.327.1
27.727.728.432.739.8
48.5
51.854.0
55.756.4
57.457.4
Currencyoutsidebanks
3.6
3.64.54.74.84.7
4.95.55.65.86.4
7.39.6
13.918.823.5
26.5
26.526.7
26.326.5
25.625.9
1 Beginning with December 1938, includes U. S. Treasurer's time deposits, open account.2 Includes demand deposits, other than interbank and U. S. Government, less cash items in process of
collection.8 Includes deposits in commercial banks, mutual savings banks, and Postal Savings System.* Estimates by Council of Economic Advisers.
NOTE.—Detail will not necessarily add to totals because of rounding.Source: Board of Governors of the Federal Reserve System (except as noted).
124
Digitized for FRASER http://fraser.stlouisfed.org/ Federal Reserve Bank of St. Louis
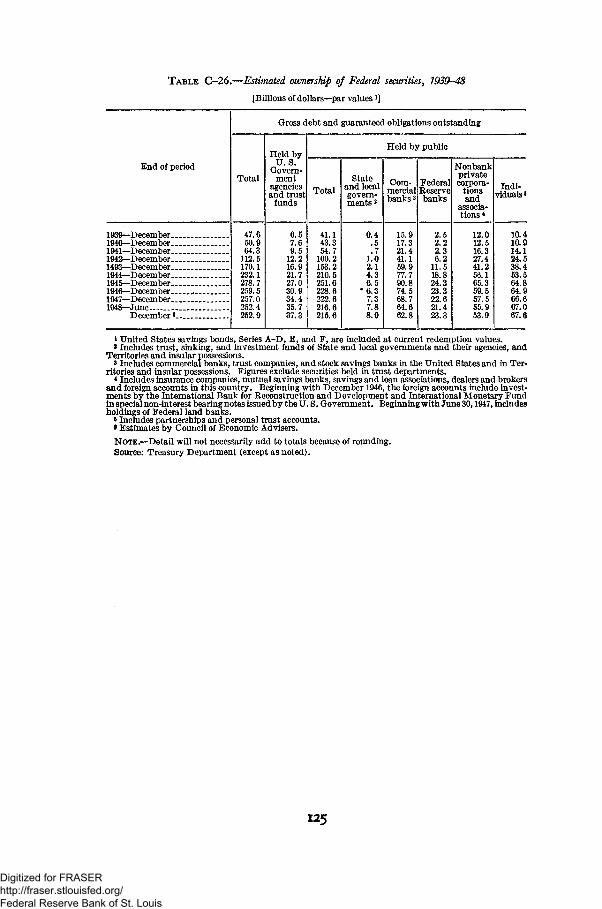
TABLE C-26.—Estimated ownership of Federal securities, 1939-48
[Billions of dollars—par values *]
End of period
1939—December1940—December1941—December. . . .1942—December1493—December _1944—December1945—D ecember1946—D ecember _1947—December1948—June
December 6__
Gross debt and guaranteed obligations outstanding
Total
47.650.964.3
112.5170.1232.1278.7259.5257.0252.4252.9
Held byU.S.
Govern-ment
agenciesand trust
funds
6.57.69.5
12.216.921.727.030.934.435.737.3
Held by public
Total
41.143.354.7
100.2153.2210.5251.6228.6222.6216.6215.6
Stateand localgovern-ments 2
0.4.5.7
1.02.14.36.5
* 6.37.37.88.0
Com-mercialbanks 3
15.917.321.441.159.977.790.874.568.764.662.8
FederalReservebanks
2.52.22.36.2
11.518.824.323.322.621.423.3
Nonbankprivatecorpora-
tionsand
associa-tions 4
12.012.516.327.441.256.165.359.557.555.953.9
Indi-viduals*
10.410.914.124.538.453.564.864.966.667.067.6
i United States savings bonds, Series A-D, E, and F, are included at current redemption values.* Includes trust, sinking, and investment funds of State and local governments and their agencies, and
Territories and insular possessions.8 Includes commercial banks, trust companies, and stock savings banks in the United States and in Ter-
ritories and insular possessions. Figures exclude securities held in trust departments.* Includes insurance companies, mutual savings banks, savings and loan associations, dealers and brokers
and foreign accounts in this country. Beginning with December 1946, the foreign accounts include invest-ments by the International Bank for Reconstruction and Development and International Monetary Fundin special non-interest bearing notes issued by the U.S. Government. Beginning with June 30,1947, includesholdings of Federal land banks.
* Includes partnerships and personal trust accounts.fi Estimates by Council of Economic Advisers.
NOTE.—Detail will not necessarily add to totals because of rounding.Source: Treasury Department (except as noted).
125
Digitized for FRASER http://fraser.stlouisfed.org/ Federal Reserve Bank of St. Louis
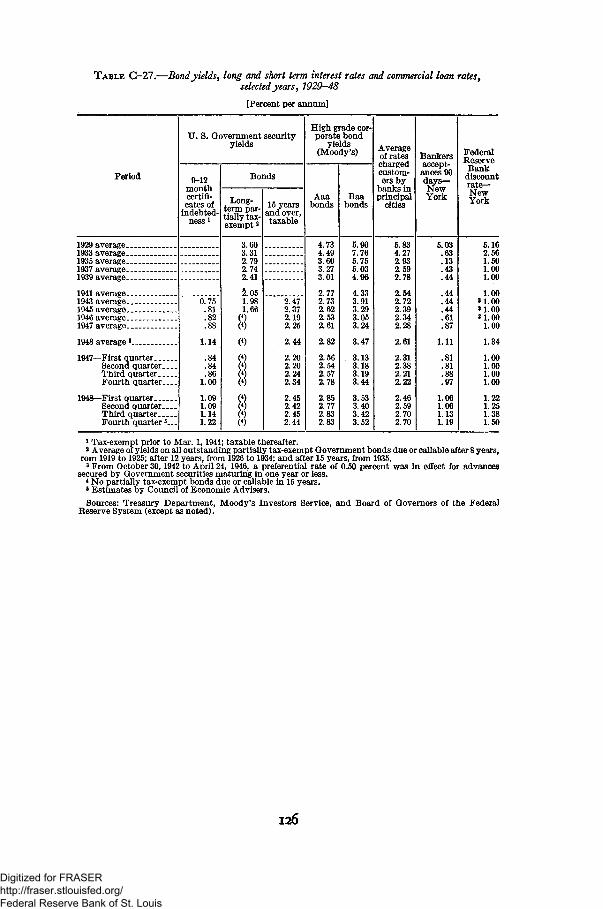
T A B L E G-27.—Bond yields, long and short term interest rates and commercial loan rates,selected years, 1929-48
[Percent per annum]
Period
U. S. Government securityyields
9-12monthcertifi-cates of
indebted-ness l
Bonds
Long-term par-tially tax-exempt 2
15 yearsand over,taxable
High grade cor-porate bond
yields(Moody's)
Aaabonds
Baabonds
Averageof rateschargedcustom-ers by
banks inprincipal
Bankersaccept-ances 90days—NewYork
FederalReserve
Bankdiscountr a t e -NewYork
1929 average..1933 average..1935 average..1937 average.1939 average..
1941 average.1943 average.1945 average.1946 average.1947 average.
3.603.311.79
1948 average 8
1947—First quarterSecond quarter. __Third quarterFourth quarter...
1948—First quarterSecond quarter. __Third quarterFourth quarter 5_.
0.75.81.82
1.14
.84
.84
.861.00
1.091.091.141.22
2.742.41
5.051.981.66
2.472.372.192.25
2.44
2.202.202.242.34
2.452.422.452.44
4.734.493.603.273.01
2.772.732.622.532.61
2.82
2.562.542.572.78
2.852.772.832.83
5.907.765.755.034.96
4.333.913.293.053.24
3.47
3.133.183.193.44
3.533.403.423.52
5.834.272.932.592.78
2.542.722.392.342.28
2.61
2.312.382.212.22
2.462.592.702.70
5.03.63.13.43.44
.44
.44
.44
.61
.87
1.11
.81
.81
.88
.97
1.061.061.131.19
5.162.561.501.001.00
1.00U.OOU.008 1.00
1.00
1.34
1.001.001.001.00
1.221.251.381.50
1 Tax-exempt prior to Mar. 1,1941; taxable thereafter.a Average of yields on all outstanding partially tax-exempt Government bonds due or callable after 8 years,
rom 1919 to 1925; after 12 years, from 1926 to 1934; and after 15 years, from 1935.3 From October 30,1942 to April 24, 1946, a preferential rate of 0.50 percent was in effect for advances
secured by Government securities maturing in one year or less.* No partially tax-exempt bonds due or callable in 15 years.« Estimates by Council of Economic Advisers.
Sources: Treasury Department, Moody's Investors Service, and Board of Governors of the FederalReserve System (except as noted).
126
Digitized for FRASER http://fraser.stlouisfed.org/ Federal Reserve Bank of St. Louis
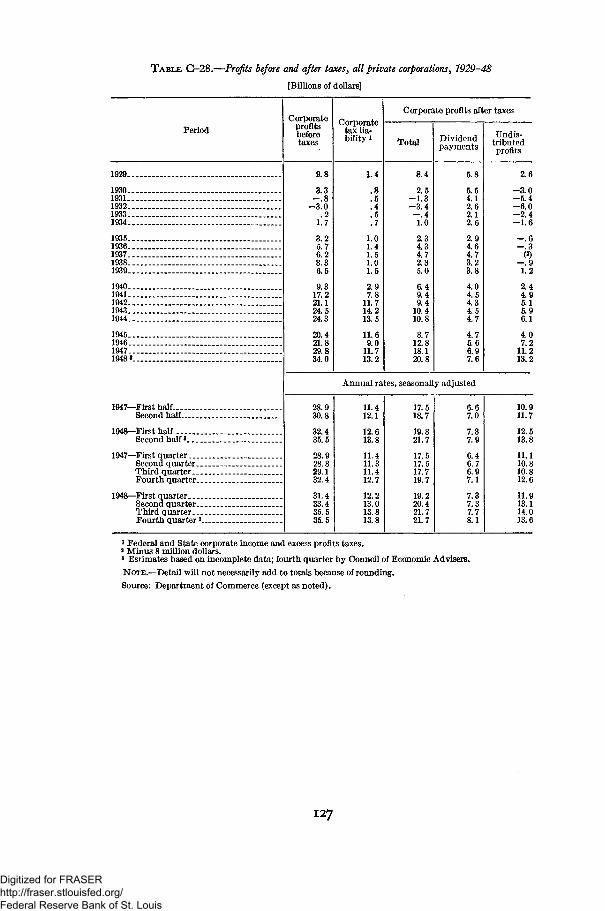
TABLE C-28.—Profits before and after taxes, all private corporations, 1929-48
[Billions of dollars]
PeriodCorporate
profitsbeforetaxes
Corporatetax lia-bility i
Corporate profits after taxes
Total Dividendpayments
Undis-tributedprofits
1929..
1930-1931..1932..1933..1934..
1935..1936..1937..1938..1939..
1940..1941..1942-.1943..1944..
1945..1946..1947..1948 3.
1947—First half....Second half..
1948—First halfSecond half 3_
1947—First quarterSecond quarter..Third quarter...Fourth quarter..
1948—First quarterSecond quarter...Third quarterFourth quarter 3_.
9.8
3.3- . 8
-3 .0.2
1.7
3.25.76.23.36.5
9.317.221.124.524.3
20.421.829.834.0
1.4
.8
.5
.4
.5
.7
1.01.41.51.01.5
2.97.8
11.714.213.5
11.69.0
11.713.2
8.4
2.5- 1 . 3-3 .4- . 41.0
2.34.34.72.35.0
6.49.49.4
10.410.8
8.712.818.120.8
5.8
5.54.12.62.12.6
2.94.64.73.2
4.04.54.34.54.7
4.75.66.97.6
Annual rates, seasonally adjusted
28.930.8
32.435.5
28.928.829.132.4
31.433.435.535.5
11.412.1
12.613.8
11.411.311.412.7
12.213.013.813.8
17.518.7
19.821.7
17.517.517.719.7
19.220.421.721.7
6.67.0
7.37.9
6.46.76.97.1
7.37.37.78.1
2.6
- 3 . 0- 5 . 4- 6 . 0- 2 . 4- 1 . 6
- . 6- . 3
(2)- . 91.2
2.44.95.15.96.1
4.07.2
11.213.2
10.911.7
12.513.8
11.110.810.812.6
11.913.114.013.6
1 Federal and State corporate income and excess profits taxes.2 Minus 8 million dollars.3 Estimates based on incomplete data; fourth quarter by Council of Economic Advisers.
NOTE.—Detail will not necessarily add to totals because of rounding.
Source: Department of Commerce (except as noted).
127
Digitized for FRASER http://fraser.stlouisfed.org/ Federal Reserve Bank of St. Louis
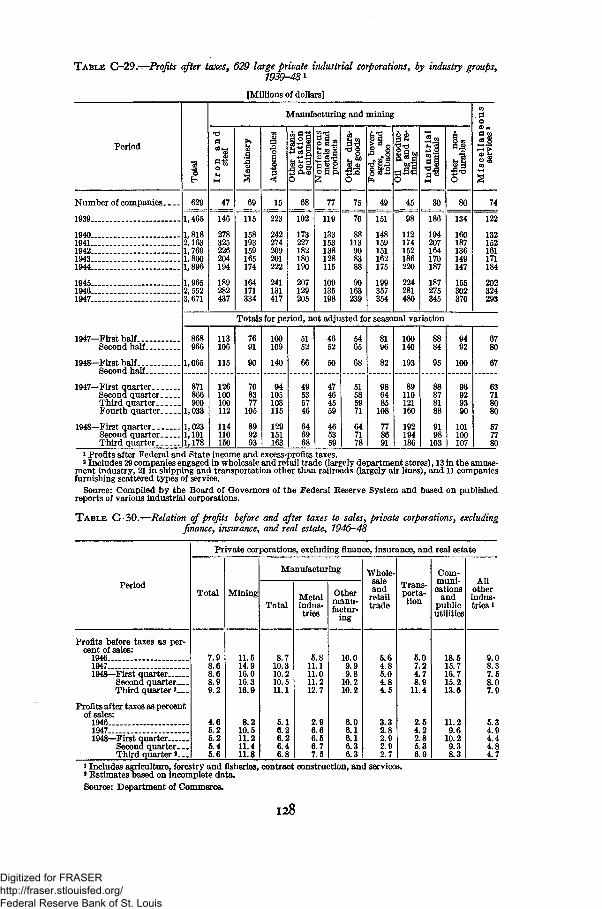
TABLE C-29.—Profits after taxes, 629 large private industrial corporations, by industry groups,1939-48 i
[Millions of dollars]
Period
Manufacturing and mining
t m 3
Number of companies
1939
194019411942..19431944.
19451946..1947 _._.
629 47 69 15 77 75 49 45 30 80 74
1,465
1,8182,1631,7691,8001,896
1,9652,5523,671
146
278325226204194
189282437
115
158193159165174
164171334
223
242274209201222
241131417
102
173227182180190
207129205
119
133153138128115
109135198
70
881139083
90163
151
148159151162175
199357354
98
112174152186220
224281480
186
194207164170187
187275345
134
160187136149147
155302370
122
132152161171184
202324293
Totals for period, not adjusted for seasonal variation
1947—First half....Second half..
1948—First half—.Second half..
966
1,065
1947—First quarterSecond quarter.„__Third quarterFourth quarter
1948—First quarterSecond quarterThird quarter. . .
871866900
1,033
1,0231,1011,178
113106
115
126100100112
114110150
90
708377
105
100109
140
94105103115
129151163
66 50
81
6485
108
778691
100140
193
110121160
192194186
878188
9198
103
100
929390
101100107
6780
67
63718080
577780
1 Profits after Federal and State income and excess-profits taxes.2 Includes 29 companies engaged in wholesale and retail trade (largely department stores), 13 in the amuse-
ment industry, 21 in shipping and transportation other than railroads (largely air lines), and 11 companiesfurnishing scattered types of service.
Source: Compiled by the Board of Governors of the Federal Reserve System and based on publishedreports of various industrial corporations.
TABLE C-30.—Relation of profits before and after taxes to sales, private corporations, excludingfinance, insurance, and real estate, 7946-48
Period
Profits before taxes as per-cent of sales:
194619471948—First quarter
Second quarterThird quarter 2... _
Profits after taxes as percentof sales:
194619471948—First quarter.
Second quarterThird quarter«. . .
Private corporations, excluding finance, insurance, and real estate
Total
7.98.68.68.99.2
4.65.25.25.45.6
Mining
11.514.916.016.316.9
8.210.511.211.411.8
Manufacturing
Total
8.710.310.210.511.1
5.16.26.26.46.8
Metalindus-tries
5.811.111.011.212.7
2.96.66.56.77.5
Othermanu-factur-
ing
10.09.99.8
10.210.2
6.06.16.16.36.3
Whole-saleand
retailtrade
5.64.85.04.84.5
3.32.82.92.92.7
Trans-porta-tion
6.07.24.78.9
11.4
2.54.22.85.36.9
Com-muni-cations
andpublicutilities
18.515.716.715.213.6
11.29.6
10.29.38.3
Allotherindus-tries i
9.08.37.58.07.9
5.34.94.44.84.7
i Includes agriculture, forestry and fisheries, contract construction, and services.s Estimates based on incomplete data.Source: Department of Commerce.
128
Digitized for FRASER http://fraser.stlouisfed.org/ Federal Reserve Bank of St. Louis
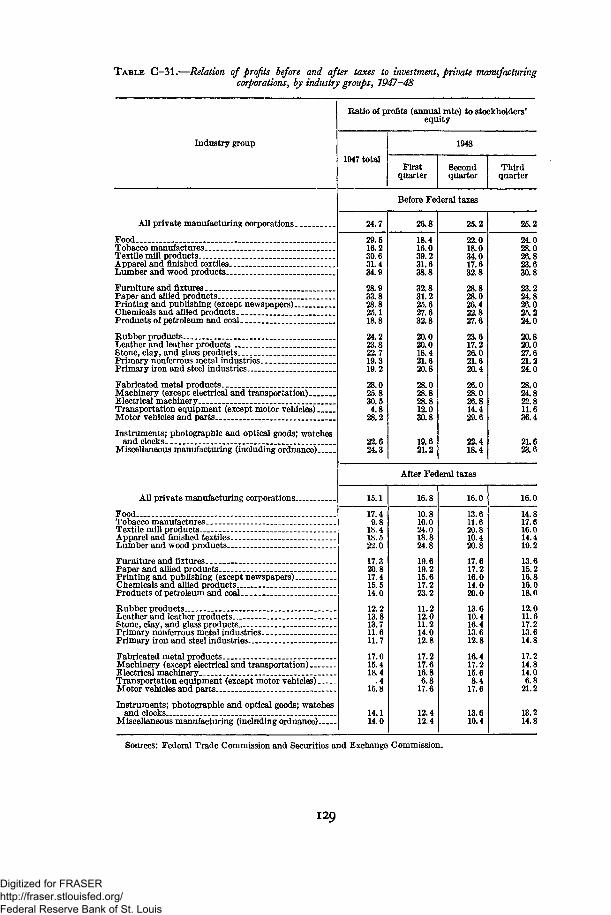
TABLE C-31.—Relation of profits before and after taxes to investment) private manufacturingcorporations, by industry groups, 1947—48
Industry group
All private manufacturing corporations.
FoodTobacco manufacturesTextile mill products. _Apparel and finished textiles __Lumber and wood products..
Furniture and fixtures.Paper and allied productsPrinting and publishing (except newspapers)Chemicals and allied products..Products of petroleum and coal__
Rubber productsLeather and leather productsStone, clay, and glass products..Primary nonferrous metal industriesPrimary iron and steel industries
Fabricated metal productsMachinery (except electrical and transportation)Electrical machineryTransportation equipment (except motor vehicles)Motor vehicles and parts
Instruments; photographic and optical goods; watchesand clocks.-
Miscellaneous manufacturing (including ordnance)
All private manufacturing corporations..
FoodTobacco manufacturesTextile mill productsApparel and finished textilesLumber and wood products.
Furniture and fixturesPaper and allied productsPrinting and publishing (except newspapers)..Chemicals and allied productsProducts of petroleum and coal «
Rubber products _.Leather and leather productsStone, clay, and glass productsPrimary nonferrous metal industries -Primary iron and steel industries
Fabricated metal products.Machinery (except electrical and transportation).Electrical machinery..Transportation equipment (except motor vehicles)Motor vehicles and parts
Instruments; photographic and optical goods; watchesand clocks.._ _.
Miscellaneous manufacturing (including ordnance)
Ratio of profits (annual rate) to stockholders'equity
Before Federal taxes
24.7
29.516.230.631.4
28.933.828.825.118.8
24.223.822.719.319.2
28.025.830.54.8
28.2
22.624.3
15.1
17.49.8
18.418.522.0
17.320.817.415.514.0
12.213.813.711.611.7
17.015.418.4
.415.8
14.114.0
26.8
18.416.039.231.638.8
32.831.225.627.632.8
20.020.018.421.620.8
28.028.828.812.030.8
19.621.2
25.2
22.018.034.017.6
28.828.026.422.827.6
23.617.226.021.620.4
26.028.026.814.429.6
22.418.4
After Federal taxes
16.8
10.810.024.018.824.8
19.619.215.617.223.2
11.212.011.214.012.8
17.217.616.86.8
17.6
12.412.4
16.0
13.611.620.810.420.8
17.617.216.014.020.0
13.610.416.413.612.8
16.417.215.68.4
17.6
13.610.4
25.2
24.028.026.823.630.8
24.826.025.224.0
20.820.027.621.224.0
28.024.822.811.636.4
21.623.6
16.0
14.817.616.014.419.2
13.615.216.816.018.0
12.011.617.213.614.8
17.214.814.06.8
21.2
13.214.8
Sources: Federal Trade Commission and Securities and Exchange Commission.
129
Digitized for FRASER http://fraser.stlouisfed.org/ Federal Reserve Bank of St. Louis
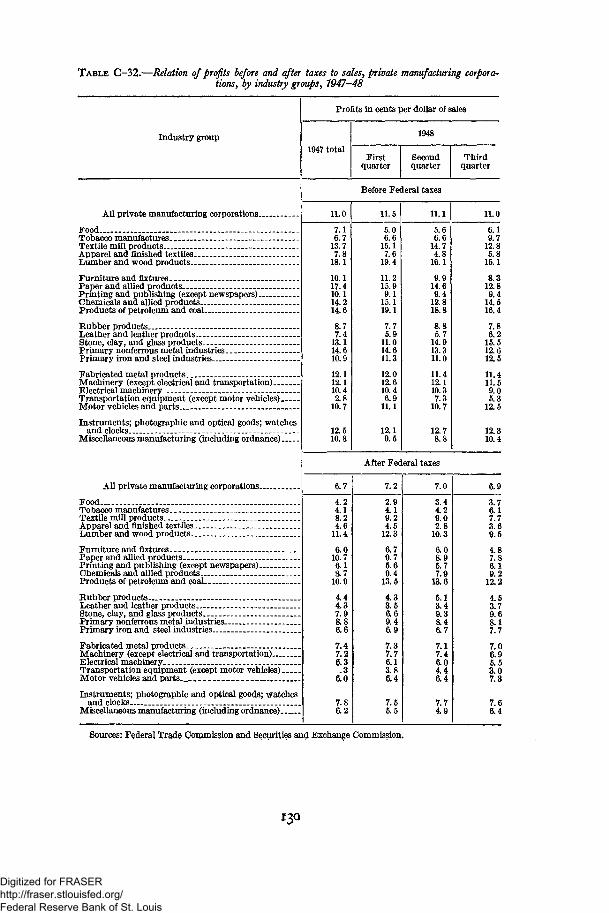
TABLE C—32.—Relation of profits before and after taxes to sales, private manufacturing corpora'tions, bjy industry groups, 7947—48
Industry group
Profits in cents per dollar of sales
1947 total
1948
Firstquarter
Secondquarter
Thirdquarter
All private manufacturing corporations
Food _ _Tobacco manufactures _-.Textile mill productsApparel and finished textilesLumber and wood products
Furniture and fixtures.-Paper and allied productsPrinting and publishing (except newspapers)Chemicals and allied productsProducts of petroleum and coal
Rubber products.. - . -_Leather and leather products _Stone, clay, and glass products.Primary nonferrous metal industriesPrimary iron and steel industries
Fabricated metal productsMachinery (except electrical and transportation)Electrical machineryTransportation equipment (except motor vehicles)Motor vehicles and parts
Instruments; photographic and optical goods; watchesand clocks
Miscellaneous manufacturing (including ordnance)
All private manufacturing corporations..
Food -Tobacco manufacturesTextile mill productsApparel and finished textiles _Lumber and wood products._
Furniture and fixturesPaper and allied productsPrinting and publishing (except newspapers).Chemicals and allied products—Products of petroleum and coal _
Rubber productsLeather and leather productsStone, clay, and glass productsPrimary nonferrous metal industries..Primary iron and steel industries
Fabricated metal productsMachinery (except electrical and transportation)Electrical machinery _Transportation equipment (except motor vehicles)Motor vehicles and parts
Instruments; photographic and optical goods; watchesand clocks.. _
Miscellaneous manufacturing (including ordnance)
Before Federal taxes
11.0
7.16.7
13.77.8
18.1
10.117.410.114.214.6
8.77.4
13.114.610.9
12.112.110.42.8
10.7
12.510.8
11.5
5.06.6
15.17.6
19.4
11.215.99.1
15.119.1
7.75.9
11.014.611.3
12.012.610.46.9
11.1
12.19.5
11.1
5.66.6
14.74.8
16.1
9.914.69.4
12.818.8
8.85.7
14.913.311.0
11.412.110.37.3
10.7
12.78.8
After Federal taxes
6.7
4.24.18.24.6
11.4
6.010.76.18.7
10.9
4.44.37.98.86.6
7.47.26.3.3
6.0
7.86.2
7.2
2.94.19.24.5
12.3
6.79.75.69.4
13.5
4.33.56.69.46.9
7.37.76.13.86.4
7.55.5
7.0
3.44.29.02.8
10.3
6.08.95.77.9
13.6
5.13.49.38.46.7
7.17.46.04.46.4
7.74.9
11.0
6.19.7
12.85.8
15.1
8.312.89.4
14.516.4
7.86.2
15.512.612.5
11.411.59.05.3
12.5
12.310.4
6.9
3.76.17.73.69.5
4.87.86.19.2
12.2
4.53.79.68.17.7
7.06.95.53.07.3
7.66.4
Sources: Federal Tra.de Commission and Securities and Exchange Commission.
I 3 Q
Digitized for FRASER http://fraser.stlouisfed.org/ Federal Reserve Bank of St. Louis
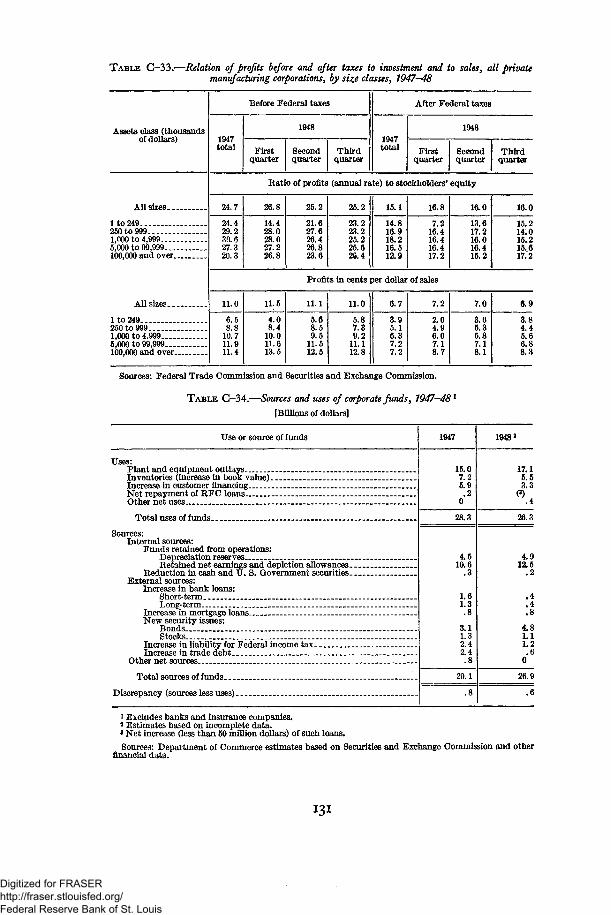
TABLE C-33.—Relation of profits before and after taxes to investment and to sales, all privatemanufacturing corporations, by sizje classes, 1947-48
Assets class (thousandsof dollars)
All sizes. _
1 to 249250 to 9991,000 to 4,9995,000 to 99,999100,000 and over __
All sizes. _
1 to 249250 to 9991,000 to 4.9995,000 to 99,999100,000 and over
Before Federal taxes
1947total
1948
Firstquarter
Secondquarter
Thirdquarter
After Federal taxes
1947total
1948
Firstquarter
Secondquarter
Thirdquarter
Katio of profits (annual rate) to stockholders' equity
24.7
24.429.230.627.320.3
26.8
14.428.028.027.226.8
25.2
21.627.626.426.823.6
25.2
23.223.225.225.626.4
15.1
14.816.918.216.512.9
16.8
7.216.416.416.417.2
16.0
13.617.216.016.415.2
16.0
15.214.015.215.617.2
Profits in cents per dollar of sales
11.0
6.58.8
10.711.911.4
11.5
4.08.4
10.011.613.5
11.1
5.68.59.5
11.512.5
11.0
5.87.39.2
11.112.8
6.7
3.95.16.37.27.2
7.2
2.04.96.07.18.7
7.0
3.65.35.87.18.1
6.9
3.84.45.66.88.3
Sources: Federal Trade Commission and Securities and Exchange Commission.
TABLE C-34.—Sources and uses of corporate funds, 1947-48*
[Billions of dollars]
Use or source of funds
Uses:Plant and equipment outlaysInventories (increase in book value)Increase in customer financing _Net repayment of RFC loans _- _Other net uses
Total uses of funds....
Sources:Internal sources:
Funds retained from operations:Depreciation reservesRetained net earnings and depletion allowances--
Reduction in cash and XT. S. Government securitiesExternal sources:
Increase in bank loans:Short-term _Long-term
Increase in mortgage loansNew security issues:
Bonds _ _ _ _Stocks
Increase in liability for Federal income tax_Increase in trade debt
Other net sources
Total sources of funds
Discrepancy (sources less uses) __
1947
15.07.25.9.2
0
28.3
4.510.6
.3
1.61.3.8
3.11.32.42.4.8
29.1
.8
1948 *
17.15.53.3
26.3
4.912,5
.2
.4
.4
.8
4.81.11.2.6
0
26.9
.6
i Excludes banks and insurance companies.3 Estimates based on incomplete data.s Net increase (less than 50 million dollars) of such loans.
Sources: Department of Commerce estimates based on Securities and Exchange Commission and otherfinancial data.
Digitized for FRASER http://fraser.stlouisfed.org/ Federal Reserve Bank of St. Louis
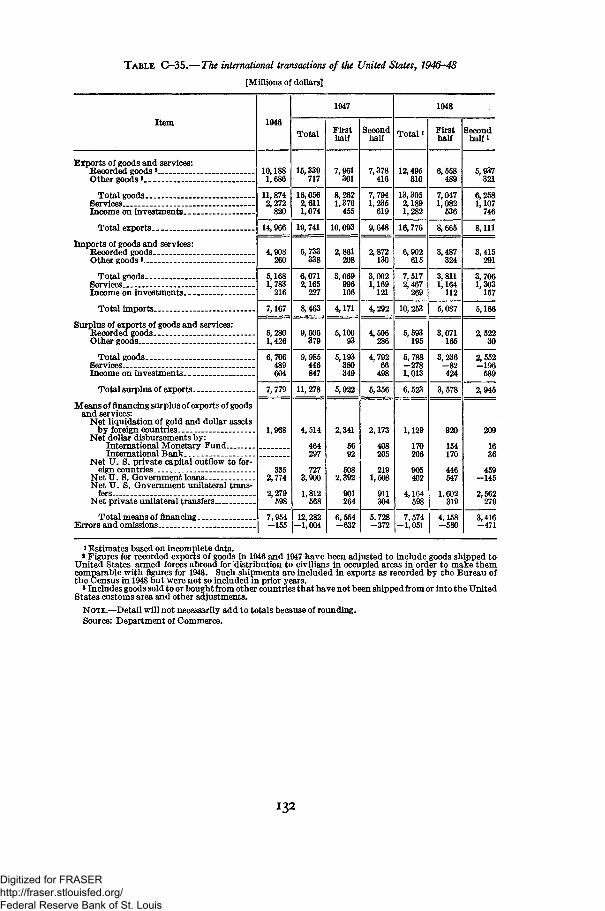
TABLE C-35.—The international transactions of the United States, 1946-48
[Millions of dollars]
Item
Exports of goods and services:Recorded goods *Other goods8
Total goodsServices _ -_ _Income on investments
Total exports
Imports of goods and services:Recorded goodsOther goods 3
Total goods -ServicesIncome on investments
Total imports.-
Surplus of exports of goods and services:Recorded goods. _ _Other goods
Total goodsServicesIncome on investments
Total surplus of exports
Means of financing surplus of exports of goodsand services:
Net liquidation of gold and dollar assetsby foreign countries
Net dollar disbursements by:International Monetary FundInternational Bank
Net U. S. private capital outflow to for-eign countries
Net U. S Government loansNet U. S. Government unilateral trans-
fersNet private unilateral transfers
Total means of financingErrors and omissions
1946
10,1881,686
11,8742,272
820
14,966
4,908260
5,1681,783
216
7,167
5,2801,426
6,706489604
7,779
1,968
3352,774
2,279598
7,954-155
1947
Total
15,339717
16,0562,6111,074
19,741
5,733338
6,0712,165
227
8,463
9,606379
9,985446847
11, 278
4,514
464297
7273,900
1,812568
12,282-1,004
Firsthalf
7,961301
8,2621,376
455
10,093
2,861208
3,069996106
4,171
5,10093
5,193380349
5,922
2,341
5692
5082,392
901264
6,554-632
Secondhalf
7,378416
7,7941,235
619
9,648
2,872130
3,0021,169
121
4,292
4,506286
4,79266
498
5,356
2,173
408205
2191,508
911304
5,728-372
Total i
12,495810
13,3052,1891,282
16,776
6,902615
7,5172,467
269
10,253
5,593195
5,788-2781,013
6,523
1,129
170206
905402
4,164598
7,574-1,051
1948
Firsthalf
6,558489
7,0471,082
536
8,665
3,487324
3,8111,164
112
5,087
3,071165
3,236- 8 2424
3,578
920
154170
446547
1,602319
4,158-580
Secondhalfi
5,937321
6,2581,107
746
8,111
3,415291
3,7061,303
157
5,166
2,52230
2,552-196
589
2,945
209
1636
459-145
2,562279
3,416-471
1 Estimates based on incomplete data.2 Figures for recorded exports of goods in 1946 and 1947 have been adjusted to include goods shipped to
United States armed forces abroad for distribution to civilians in occupied areas in order to make themcomparable with figures for 1948. Such shipments are included in exports as recorded by the Bureau ofthe Census in 1948 but were not so included in prior years.
3 Includes goods sold to or bought from other countries tha t have not been shipped from or into the UnitedStates customs area and other adjustments.
NOTE.—Detail will not necessarily add to totals because of rounding.Source: Department of Commerce.
132
Digitized for FRASER http://fraser.stlouisfed.org/ Federal Reserve Bank of St. Louis
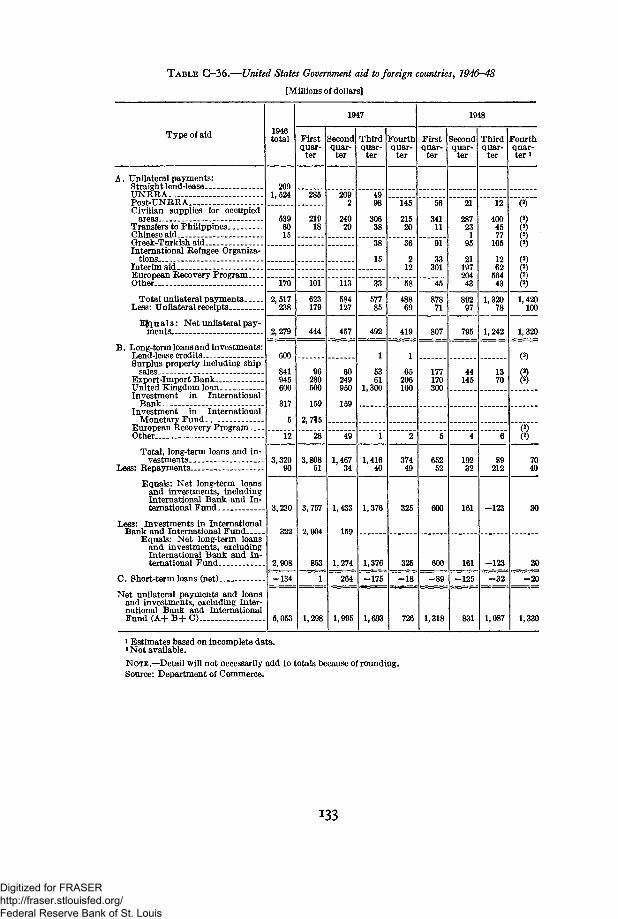
TABLE C-36.—United States Government aid to foreign countries, 1946-48
[Millions of dollars]
Type of aid
A. Unilateral payments:Straight lend-leaseUNRRAPost-UNRRACivilian supplies for occupied
areasTransfers to PhilippinesChinese aid _ _ __Greek-Turkish aid.International Refugee Organiza-
tions-Interim aid. _European Recovery ProgramOther —
Total unilateral paymentsLess: Unilateral receipts. _
Ejq u a 1 s: Net unilateral pay-ments
B. Long-term loans and investments:Lend-lease creditsSurplus property including ship
sales - - . . .Export-Import BankUnited Kingdom loanInvestment in International
Bank ._ ._ -Investment in International
Monetary FundEuropean Recovery ProgramOther
Total, long-term loans and in-vestments
Less: Repayments _ _
Equals: Net long-term loansand investments, includingInternational Bank and In-ternational Fund
Less: Investments in InternationalBank and International Fund
Equals: Net long-term loansand investments, excludingInternational Bank and In-ternational Fund
C. Short-term loans (net)
Net unilateral payments and loansand investments, excluding Inter-national Bank and InternationalFund (A+ B-f- C)
1946total
2091,524
5396015
170
2,517238
2,279
600
841945600
317
5
12
3,32090
3,230
322
2,908
-134
5,053
1947
Firstquar-
ter
285
21918
101
623179
444
96280500
159
2,715
28
3,80851
3,757
2,904
853
1
1,298
Secondquar-
ter
2092
24020
113
584127
457
60249950
159
49
1,46734
1,433
159
1,274
264
1,995
Thirdquar-
ter
4998
30638
38
15
33
57785
492
1
5361
1,300
1
1,41640
1,376
1,376
-175
1,693
Fourthquar-
ter
145
21520
36
212
58
48869
419
1
65206100
2
37449
325
325
-18
726
1948
Firstquar-
ter
56
34111
91
33301
45
87871
807
177170300
5
65252
600
600
-89
1,318
Secondquar-
ter
21
287231
95
2119720443
89297
795
44145
4
19232
161
161
-125
831
Thirdquar-
ter
12
4004577
105
1262
56443
1,32078
1,242
1370
6
89212
-123
-123
-32
1,087
Fourthquar-ter i
(2)
888(2)(2)1,420
100
1,320
(2)
8
(2)(2)7040
30
30
-20
1,330
i Estimates based on incomplete data.»Not available.
NOTE.—Detail will not necessarily add to totals because of rounding.Source: Department of Commerce.
133
Digitized for FRASER http://fraser.stlouisfed.org/ Federal Reserve Bank of St. Louis
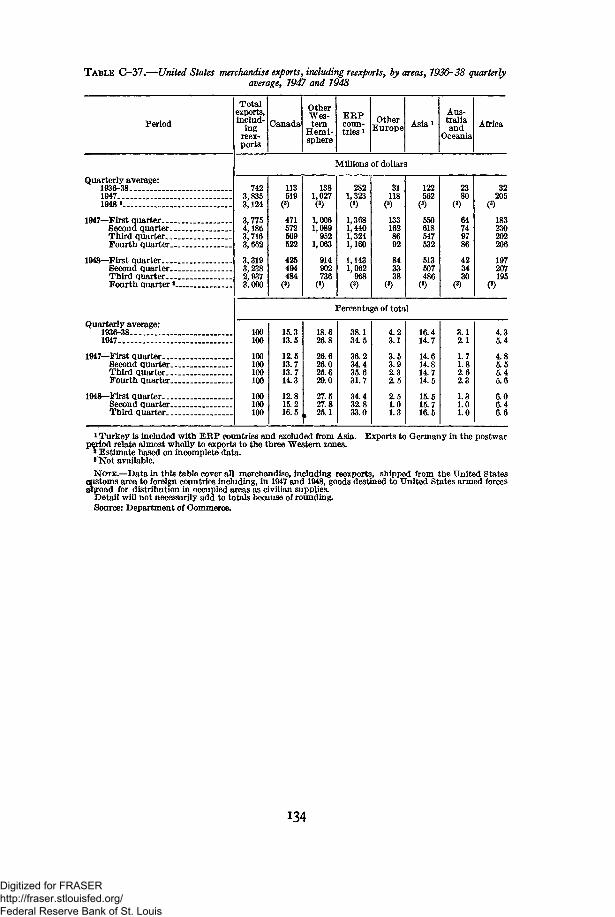
TABLE G-37.—United States merchandise exports, including reexports, by areas, 1936-38 quarterlyaverage, 1947 and 1948
Period
Totalexports,includ-
ingreex-ports
Canada
OtherWes-tern
Hemi-sphere
E R Pcoun-tries *
OtherEurope Asia*
Aus-traliaand
OceaniaAfrica
Millions of dollars
Quarterly average:1936-3819471948 *
1947—First quarterSecond quarter..Third quarter. _.Fourth quarter..
1948—First quarterSecond quarter..Third quarter. . .Fourth quarter *
Quarterly average:1936-381947-
1947—First quarter...Second quarter.Third quarter..Fourth quarter.
1948—First quarter..,Second quarter.Third quarter.
7423,8353,124
3,7754,1863,716
3,3193,2382,9373,000
11351900471572509522
425494484(3)
1381,027(3)
1,0061,089952
1,063
914902736(3)
2821,323(3)
1,3681,4401,3241,160
1,1431,062968(3)
31118(3)
1331628692
843338
09
12256209550618547532
51350748609
2380
0964749786
423430
09
Percentage of total
100100
88
88
88
8
15.313.5
12.513.713.714.3
12.815.216.5
18.626.8
26.626.025.629.0
27.527.8
, 25.1
38.134.5
36.234.435.631.7
34.432.833.0
4.23.1
3.53.92.32.5
2.51.01.3
16.414.7
14.614.814.714.5
15.515.716.5
3.12.1
1.71.82.62.3
1.31.01.0
32205
09183230202206
197207195
09
4.35.4
4.85.55.45.6
6.06.46.6
Exports to Germany in the postwari Turkey is included with E R P countries and excluded from Asia.period relate almost wholly to exports to the three Western zones.
* Estimate based on incomplete data.»Not available.
NOTE.—Data in this table cover all merchandise, includmg reexports, shipped from the United Statescustoms area to foreign countries including, in 1947 and 1948, goods destined to United States armed forcesatjroad for distribution in occupied areas as civilian supplies.
Detail will not necessarily add to totals because of rounding.Source: Department of Commerce.
134
Digitized for FRASER http://fraser.stlouisfed.org/ Federal Reserve Bank of St. Louis
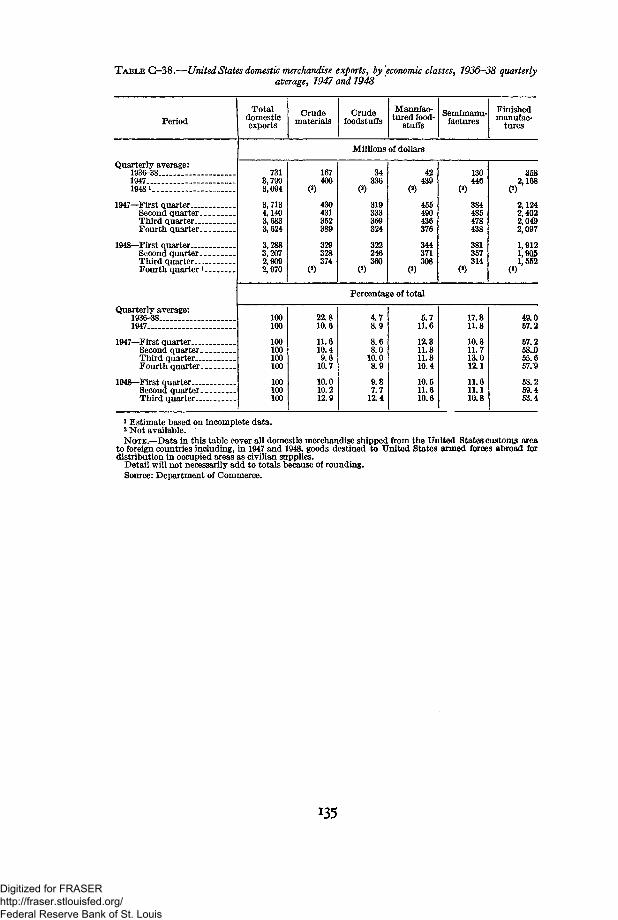
TABLE G-38.—United States domestic merchandise exports, by economic classes, 1936-38 quarterlyaverage, 1947 and 1948
Period
Quarterly average:1936-38194719481
1947—First quarterSecond quarterThird quarterFourth quarter
1948—First quarterSecond quarterThird quarterFourth quarter *
Quarterly average:1936-38-1947
1947—First quarter..Second quarter__Third quarterFourth quarter
1948—First quarterSecond quarter___Third quarter. . . .
Totaldomesticexports
Crudematerials
Crudefoodstuffs
Manufac-tured food-
stuffsSemimanu-
facturesFinishedmanufac-
tures
Millions of dollars
7313,7903,094
3,7134,1403,6833,624
3,2883,2072,9092,970
167400
(2)
430431352389
329328374
(2)
34336
<2)
319333369324
322246360
(2)
42439
(2)
455490436376
344371308
(2)
130446
00
384485478438
381357314
(J)
3582,168
2,1242,4022,0492,097
1,9121,9051,552
<2)
Percentage of total
100100
100100100100
100100100
22.810.6
11.610.49.6
10.7
10.010.212.9
4.78.9
8.68.0
10.08.9
9.87.7
12.4
5.711.6
12.311.811.810.4
10.511.610.6
17.811.8
10.311.713.012.1
11.611.110.8
49.057.2
67.258J355.657.9
58.259.463.4
1 Estimate based on incomplete data.2 Not available.NOTE.—Data in this table cover all domestic merchandise shipped from the United States customs area
to foreign countries including, in 1947 and 1948, goods destined to United States armed forces abroad fordistribution in occupied areas as civilian supplies.
Detail will not necessarily add to totals because of rounding.Source: Department of Commerce.
Digitized for FRASER http://fraser.stlouisfed.org/ Federal Reserve Bank of St. Louis
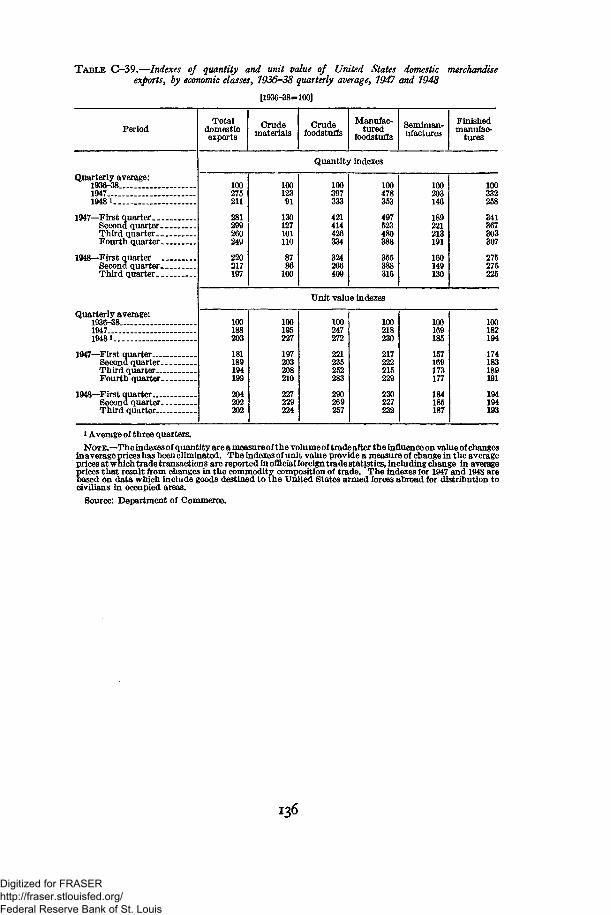
TABLE C-39.—Indexes of quantity and unit value of United States domestic merchandiseexports, by economic classes, 1936-38 quarterly average, 1947 and 1948
Period
Quarterly average:1936-3819471948 i .
1947—First quarterSecond quarter __Third quarter.. _Fourth quarter__
1948—First quarterSecond quarter^.Third quarter
Quarterly average:1936-38194719481
1947—First quarterSecond quarterThird quarterFourth quarter
1948—First quarterSecond quarterThird quarter
Totaldomesticexports
[1936-38=
Crudematerials
100]
Crudefoodstuffs
Manufac-tured
foodstuffsSemiman-ufactures
Finishedmanufac-
tures
Quantity indexes
100275211
281299260249
220217197
10012391
130127101110
8786
100
100397333
421414426334
324266409
100478353
497523480388
355388316
100203146
189221213191
160149130
100332258
341367303307
275275225
Unit value indexes
100188203
181189194199
204202202
100196227
197203208210
227229224
100247272
221235252283
290269267
100218230
217222215229
230227232
100169186
157169173177
184185187
100182194
174183189191
194194193
i Average of three quarters.
NOTE.—The indexes of quantity are a measure of the volume of trade after the influence on value of changesinaverage prices has been eliminated. The indexes of unit value provide a measure of change in the averageprices at which trade transactions are reported in official foreign trade statistics, including change in averageprices that result from changes in the commodity composition of trade. The indexes for 1947 and 1948 arebased on data which include goods destined to the United States armed forces abroad for distribution tocivilians in occupied areas.
Source: Department of Commerce.
x36
Digitized for FRASER http://fraser.stlouisfed.org/ Federal Reserve Bank of St. Louis
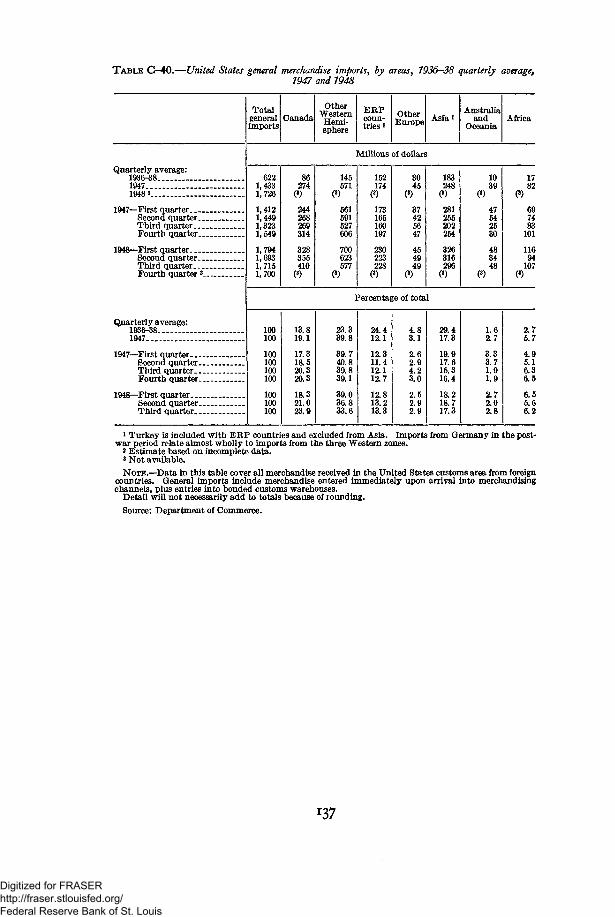
TABLE G—40.—United States general merchandise imports, by areas, 1936—38 quarterly average,1947 and 1948
Totalgeneralimports
CanadaOther
WesternHemi-sphere
E R Pcoun-tries i
OtherEurope Asia i
Australiaand
OceaniaAfrica
Millions of dollars
Quarterly average:1936-3819471948 2
1947—First quarter. . . .Second quarter..Third quarter.. .Fourth quarter..
1948—First quarterSecond quarter..Third quarter.. .Fourth quarter3.
6221,4331,726
1,4121,4491,3231,549
1,7941,6931,7151,700
86274(3)
244268269314
328355410(3)
145571
09561591527606
700623577
(3)
152174(3)
173165160197
230223228(3)
3045
(3)
37425647
454949
(3)
183248(3)
281255202254
326316296(3)
1039
0947542530
483448
09
Percentage of total
Quarterly average:193648...._.1947....
1947—First quarter-..Second quarter.Third quarter..Fourth quarter.
1948—First quarter...Second quarter.Third quarter..
100100
100100100100
100100100
13.819.1
17.318.520.320.3
18.321.023.9
23.339.8
39.740.839.839.1
39.036.833.6
24.412.1
12.311.412.112.7
12.813.213.3
4.83.1
2.62.94.23.0
2.52.92.9
29.417.3
19.917.615.316.4
18.218.717.3
1.62.7
3.33.71.91.9
2.72.02.8
1782
7483101
11694107
09
2.75.7
4.95.16.36.5
6.55.66.2
1 Turkey is included with ERP countries and excluded from Asia. Imports from Germany in the post-war period relate almost wholly to imports from the three Western zones.
2 Estimate based on incomplete data.8 Not available.NOTE.—Data in this table cover all merchandise received in the United States customs area from foreign
countries. General imports include merchandise entered immediately upon arrival into merchandisingchannels, plus entries into bonded customs warehouses.
Detail will not necessarily add to totals because of rounding.Source: Department of Commerce.
137
Digitized for FRASER http://fraser.stlouisfed.org/ Federal Reserve Bank of St. Louis
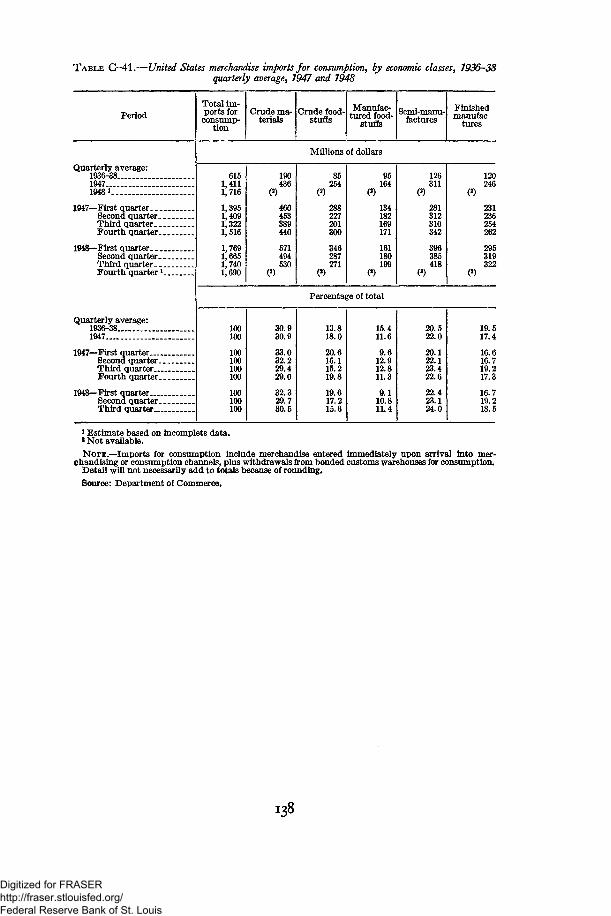
TABLE C-41.—United States merchandise imports for consumption, by economic classes, 7936-38quarterly average, 7947 and 7948
Period
Quarterly average:1936-3819471948 1
1947—First quar ter . .Second quarterThird quar ter . .Fourth quarter
1948—First quarter. _Second quarter. _Third quarter. _Fourth quarter1
Quarterly average:1936-381947
1947—First quarterSecond quarterThird quarterFourth quarter
1948—First quarterSecond quarterThird quarter
Total im-ports for
consump-tion
Crude ma-terials
Crude food-stuffs
Manufac-tured food-
stuffsSemi-manu-
facturesFinishedmanufac
tures
Millions of dollars
6151,4111,716
1,3951,4091,3221,516
1,7691,6651,7401,690
190436
460453389440
571494530
85254
288227201300
346287271
95164
134182169171
161180199
126311
281312310342
396385418
120246
231236254262
295319322
Percentage of total
100100
100100100100
100100100
30.930.9
33.032.229.429.0
32.329.730.5
13.818.0
20.616.115.219.8
19.617.215.6
15.411.6
9.612.912.811.3
9.110.811.4
20.522.0
20.122.123.422.6
22.423.124.0
19.517.4
16.616.719.217.3
16.719.218.5
1 Estimate based on incomplete data.* Not available.
NOTE.—Imports for consumption include merchandise entered immediately upon arrival into mer-chandising or consumption channels, plus withdrawals from bonded customs warehouses for consumption.
Detail will not necessarily add to totals because of rounding.
Source: Department of Commerce.
138
Digitized for FRASER http://fraser.stlouisfed.org/ Federal Reserve Bank of St. Louis
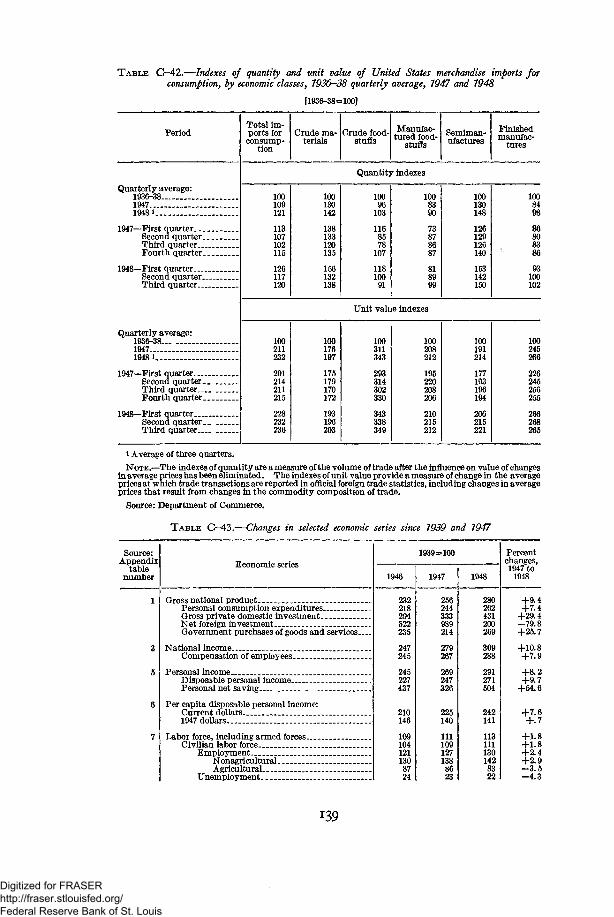
TABLE C—42.—Indexes of quantity and unit value of United States merchandise imports forconsumption, by economic classes, 7936—38 quarterly average, 7947 and 7948
[1936-38=100]
Period
Quarterly average:1936-38 _194719481
1947—First quarter __Second quarterThird quarter.Fourth quarter
1948—First quarter.Second quarterThird quarter.
Quarterly average:1936-3819471948 1
1947—First quarter.Second quarter _Third quarter. _ _Fourth quarter
1948—First quarterSecond quarter. _Third quarter
Total im-ports for
consump-tion
Crude ma-terials
Crude food-stuffs
Manufac-tured food-
stuffsSemiman-ufactures
Finishedmanufac-
tures
Quantity indexes
100109121
113107102115
126117120
100130142
138133120135
156132138
10096
103
1168578
107
11810091
1008390
73878687
818999
100130148
126129126140
153142150
1008498
86808386
93100102
Unit value indexes
100211232
201214211215
228232236
100176197
175179170172
193196203
100311343
293314302330
343338349
100208212
195220208206
210215212
100191214
177193196194
206215221
100245266
226245256255
266268265
i Average of three quarters.
NOTE.—The indexes of quantity are a measure of the volume of trade after the influence on value of changesin average prices has been eliminated. The indexes of unit value provide a measure of change in the averageprices at which trade transactions are reported in official foreign trade statistics, including changes in averageprices that result from changes in the commodity composition of trade.
Source: Department of Commerce.
T A B L E C—43.—Changes in selected economic series since 7939 and 7947
Source:Appendix
tablenumber
Economic series1939=100
1946
232218294522235
247245
245227437
210146
1091041211308724
1947
256244333989214
279267
269247326
225140
1111091271388623
1948
280262431200269
309288
291271504
242141
1131111301428322
Percentchanges,1947 to
1948
+9.4+7.4
+29.4-79.8+25.7
+10.8+7.9
+8.2+9.7
+54.6
+ #
+1.8+1.8+2.4+2.9- 3 . 5- 4 . 3
Gross national productPersonal consumption expendituresGross private domestic investmentNet foreign investmentGovernment purchases of goods and services
National incomeCompensation of employees
Personal incomeDisposable personal incomePersonal net saving
Per capita disposable personal income:Current dollars _1947 dollars ._.
Labor force, including armed forces..Civilian labor force.
Employment..Nonagricultural.. _Agricultural
Unemployment
Digitized for FRASER http://fraser.stlouisfed.org/ Federal Reserve Bank of St. Louis
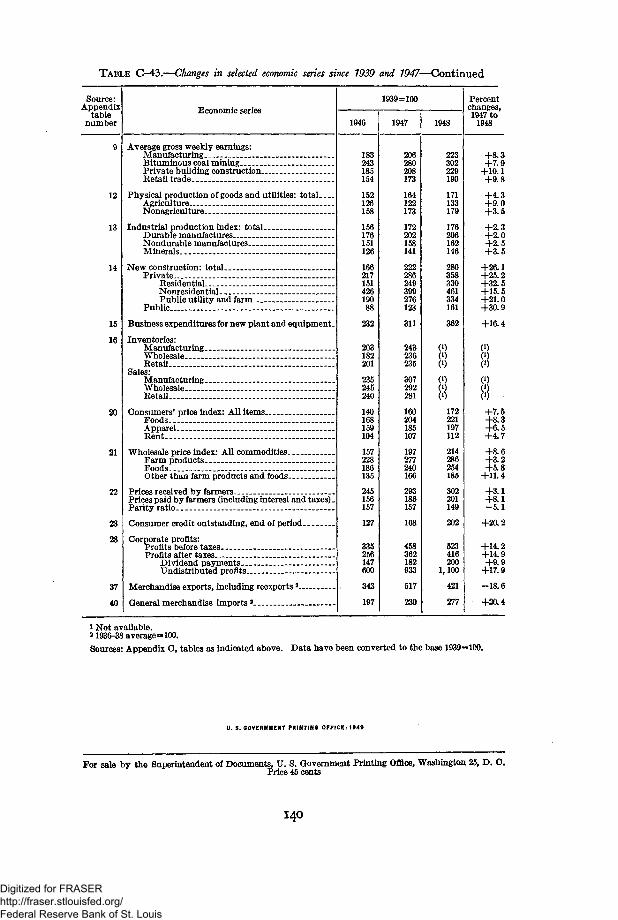
TABLE C-43.—Changes in selected economic series since 1939 and 1947—Continued
Source:Appendix
tablenumber
12
13
14
20
21
22
23
Economic series
Average gross weekly earnings:ManufacturingBituminous coal miningPrivate building construction.—Retail trade
Physical production of goods and utilities: totalAgricultureNonagriculture
Industrial production index: total __.Durable manufacturesNondurable manufacturesMinerals
New construction: total _Private
Residential - _ _.Nonresidential _ _ __,Public utility and farm. _
Public _ -—
Business expenditures for new plant and equipment
Inventories:ManufacturingWholesale-—Retail.. _ _ _
Sales:ManufacturingWholesale ._Retail
Consumers' price index: All itemsFoodsApparelRent ._
Wholesale price index: All commodities. __.Farm products _FoodsOther than farm products and foods
Prices received by farmersPrices paid by farmers (including interest and taxes).Parity ratio
Consumer credit outstanding, end of period
Corporate profits:Profits before taxesProfits after taxes—
Dividend paymentsUndistributed profits
Merchandise exports, including reexports2
General merchandise imports 3_._
1939=100
1946
183243185154
152126158
156176151126
166217151426190
232
203182201
235245240
140168159104
157228186135
245156157
127
335256147600
197
1947
206280208173
164122173
172202158141
222286249399276123
311
243236235
307292281
160204185107
197277240166
293186157
168
458362182
517
1948
223302229190
171133179
176206162146
280358330461334161
362
172221197112
214286254185
302201149
202
523416200
1,100
421
277
Percentchanges,1947 to
1948
+8.3+7.9
+10.1+9.8
+4.3+9.0+3.5
+2.3+2.0+2.5+3.5
+26.1+25.2+32.5+15.5+21.0+30.9
+16.4
+7.5+8.3+6.5+4.7
+8.6+3.2+5.8
+11.4
+3.1+8.1-5.1
+20.2
+14.2+14.9+9.9
+17.9
-18.6
+20.4
i Not available.a 1936-38 average=100.Sources: Appendix C, tables as indicated above. Data have been converted to the base 1939—100.
U. 5. GOVERNMENT PRINTING OFFICE: 1949
For sale by the Superintendent of Documents, U. S. Government Printing Office, Washington 25, D. O.Price 45 cents
I4O
Digitized for FRASER http://fraser.stlouisfed.org/ Federal Reserve Bank of St. Louis

Digitized for FRASER http://fraser.stlouisfed.org/ Federal Reserve Bank of St. Louis

Digitized for FRASER http://fraser.stlouisfed.org/ Federal Reserve Bank of St. Louis

Digitized for FRASER http://fraser.stlouisfed.org/ Federal Reserve Bank of St. Louis

Digitized for FRASER http://fraser.stlouisfed.org/ Federal Reserve Bank of St. Louis