CONTRIBUTION OF ELECTRON TOMOGRAPHY TO … · A. KRUK, A. CZYRSKA-FILEMONOWICZ CONTRIBUTION OF...
6
A R C H I V E S O F M E T A L L U R G Y A N D M A T E R I A L S Volume 58 2013 Issue 2 DOI: 10.2478/amm-2013-0005 A. KRUK * , A. CZYRSKA-FILEMONOWICZ * CONTRIBUTION OF ELECTRON TOMOGRAPHY TO DEVELOPMENT OF INNOVATIVE MATERIALS FOR CLEAN ENERGY SYSTEMS AND AERONAUTICS WKLAD TOMOGRAFII ELEKTRONOWEJ DO ROZWOJU INNOWACYJNYCH MATERIALÓW DLA NISKOEMISYJNYCH SYSTEMÓW ENERGETYCZNYCH I LOTNICTWA The development of innovative materials for clean energy systems and aeronautics requires use of modern research methods to characterize the structure on the level from micro- to nanoscale. Modern two-dimensional imaging techniques recently available in electron microscopes allow use of tomographic methods to characterize the structure of materials. Application of modern three dimensional imaging techniques such as electron tomography allows accurate qualitative and quantitative measurement of the structure elements in the micro- and nanoscale. The electron tomography studies have been carried out for three-dimensional visualization and metrology of different materials for clean energy systems and aeronautics. Electron tomography results provided quantitative data about shape, size and distribution of the particles, complementary to those obtained by means of quantitative TEM metallography. Keywords: TEM, STEM-HAADF, EFTEM, FIB-SEM, tomography Rozwój innowacyjnych materialów dla niskoemisyjnych systemów energetycznych i lotnictwa wymaga zastosowania no- woczesnych metod badawczych w celu scharakteryzowania struktury na poziomie od mikro- do nanoskali. Nowoczesne dwu- wymiarowe techniki obrazowania od niedawna dostępne w mikroskopach elektronowych, umożliwiają zastosowanie metod tomograficznych do scharakteryzowania struktury materialów. Zastosowanie nowoczesnych technik trójwymiarowego obrazo- wania, takich jak tomografia elektronowa umożliwia dokladny jakościowy i ilościowy pomiar elementów mikrostruktury w mikro- i nanoskali. Badania metodami tomografii elektronowej przeprowadzone zostaly w celu trójwymiarowej wizualizacji i metrologii elementów mikrostruktury różnych materialów konstrukcyjnych dla systemów niskoemisyjnej energetyki i lotnic- twa. Badania metodami tomografii elektronowej dostarczają danych ilościowych dotyczących ksztaltów, wielkości i rozkladu przestrzennego cząstek i są one uzupelnieniem do danych uzyskiwanych za pomocą metod ilościowej analizy metalograficznej przy wykorzystaniu transmisyjnej mikroskopii elektronowej. 1. Introduction The development of innovative materials for clean energy systems and aeronautics requires use of modern research meth- ods to characterize the structure on the level from micro- to nanoscale. Modern 2D imaging techniques recently available in electron microscopes allow use of tomographic methods to characterize the structure of materials [1, 2]. Application of these methods enables to estimate the influence of the struc- tural parameters on mechanical and corrosion properties of modern structural materials with high accuracy. Transmission- and Scanning Electron Microscopy (TEM, SEM) methods pro- vide the qualitative and quantitative information about the phase composition and morphology engineering materials. However, most of them are based on metrology of the 2D projections of the 3D objects. Application of new (in materi- al science) electron tomography techniques, such as TEM and Focused Ion Beam Scanning Electron Microscopy (FIB-SEM) tomography, gives the new opportunities. Those techniques allow us to reconstruct the microstructure of investigated ma- terials in three dimensions. TEM images give valuable in- formation about the microstructure and chemical composition of materials. However, they “only” provide a 2D projection of a 3D object. Electron tomography was developed to re- construct objects in three dimensions (3D) from a tilt series of TEM or SEM images. This technique is well accepted in the life sciences as a method used to study viruses or cells [3]. The resolution in the reconstructions, however, is lim- ited to a few nanometers. Electron tomography techniques have recently been adopted by researchers to materials science [4-6]. In practice, the resolution is still in the order of one to two nanometers because of the limited stability of the sample holders and the presence of dynamic diffraction in crystalline solids. Electron tomography is a technique that uses the TEM or SEM to determine a 3D structure from any given asymmetric * AGH UNIVERSITY OF SCIENCE AND TECHNOLOGY, INTERNATIONAL CENTRE OF ELECTRON MICROSCOPY FOR MATERIALS SCIENCE & FACULTY OF METALS ENGINEERING AND INDUSTRIAL COMPUTER SCIENCE, AL. A. MICKIEWICZA 30, 30-059 KRAKÓW, POLAND
Transcript of CONTRIBUTION OF ELECTRON TOMOGRAPHY TO … · A. KRUK, A. CZYRSKA-FILEMONOWICZ CONTRIBUTION OF...
A R C H I V E S O F M E T A L L U R G Y A N D M A T E R I A L S
Volume 58 2013 Issue 2
DOI: 10.2478/amm-2013-0005
A. KRUK∗, A. CZYRSKA-FILEMONOWICZ∗
CONTRIBUTION OF ELECTRON TOMOGRAPHY TO DEVELOPMENT OF INNOVATIVE MATERIALS FOR CLEAN ENERGYSYSTEMS AND AERONAUTICS
WKŁAD TOMOGRAFII ELEKTRONOWEJ DO ROZWOJU INNOWACYJNYCH MATERIAŁÓW DLA NISKOEMISYJNYCHSYSTEMÓW ENERGETYCZNYCH I LOTNICTWA
The development of innovative materials for clean energy systems and aeronautics requires use of modern research methodsto characterize the structure on the level from micro- to nanoscale. Modern two-dimensional imaging techniques recentlyavailable in electron microscopes allow use of tomographic methods to characterize the structure of materials. Applicationof modern three dimensional imaging techniques such as electron tomography allows accurate qualitative and quantitativemeasurement of the structure elements in the micro- and nanoscale. The electron tomography studies have been carried outfor three-dimensional visualization and metrology of different materials for clean energy systems and aeronautics. Electrontomography results provided quantitative data about shape, size and distribution of the particles, complementary to thoseobtained by means of quantitative TEM metallography.
Keywords: TEM, STEM-HAADF, EFTEM, FIB-SEM, tomography
Rozwój innowacyjnych materiałów dla niskoemisyjnych systemów energetycznych i lotnictwa wymaga zastosowania no-woczesnych metod badawczych w celu scharakteryzowania struktury na poziomie od mikro- do nanoskali. Nowoczesne dwu-wymiarowe techniki obrazowania od niedawna dostępne w mikroskopach elektronowych, umożliwiają zastosowanie metodtomograficznych do scharakteryzowania struktury materiałów. Zastosowanie nowoczesnych technik trójwymiarowego obrazo-wania, takich jak tomografia elektronowa umożliwia dokładny jakościowy i ilościowy pomiar elementów mikrostruktury wmikro- i nanoskali. Badania metodami tomografii elektronowej przeprowadzone zostały w celu trójwymiarowej wizualizacji imetrologii elementów mikrostruktury różnych materiałów konstrukcyjnych dla systemów niskoemisyjnej energetyki i lotnic-twa. Badania metodami tomografii elektronowej dostarczają danych ilościowych dotyczących kształtów, wielkości i rozkładuprzestrzennego cząstek i są one uzupełnieniem do danych uzyskiwanych za pomocą metod ilościowej analizy metalograficznejprzy wykorzystaniu transmisyjnej mikroskopii elektronowej.
1. Introduction
The development of innovative materials for clean energysystems and aeronautics requires use of modern research meth-ods to characterize the structure on the level from micro- tonanoscale. Modern 2D imaging techniques recently availablein electron microscopes allow use of tomographic methods tocharacterize the structure of materials [1, 2]. Application ofthese methods enables to estimate the influence of the struc-tural parameters on mechanical and corrosion properties ofmodern structural materials with high accuracy. Transmission-and Scanning Electron Microscopy (TEM, SEM) methods pro-vide the qualitative and quantitative information about thephase composition and morphology engineering materials.However, most of them are based on metrology of the 2Dprojections of the 3D objects. Application of new (in materi-al science) electron tomography techniques, such as TEM andFocused Ion Beam Scanning Electron Microscopy (FIB-SEM)
tomography, gives the new opportunities. Those techniquesallow us to reconstruct the microstructure of investigated ma-terials in three dimensions. TEM images give valuable in-formation about the microstructure and chemical compositionof materials. However, they “only” provide a 2D projectionof a 3D object. Electron tomography was developed to re-construct objects in three dimensions (3D) from a tilt seriesof TEM or SEM images. This technique is well accepted inthe life sciences as a method used to study viruses or cells[3]. The resolution in the reconstructions, however, is lim-ited to a few nanometers. Electron tomography techniqueshave recently been adopted by researchers to materials science[4-6]. In practice, the resolution is still in the order of one totwo nanometers because of the limited stability of the sampleholders and the presence of dynamic diffraction in crystallinesolids.
Electron tomography is a technique that uses the TEM orSEM to determine a 3D structure from any given asymmetric
∗ AGH UNIVERSITY OF SCIENCE AND TECHNOLOGY, INTERNATIONAL CENTRE OF ELECTRON MICROSCOPY FOR MATERIALS SCIENCE & FACULTY OF METALS ENGINEERING ANDINDUSTRIAL COMPUTER SCIENCE, AL. A. MICKIEWICZA 30, 30-059 KRAKÓW, POLAND
388
object [4]. This process can be simply divided into four steps.First, a series of 2D projection images of the specimen arerecorded semi automatically and systematically tilted to dif-ferent angles in the microscope. During registration a seriesof images shift adjustment is performed between subsequentimages. In second step, these individual images are alignedto a common origin. In the next step, the projections arereconstructed using for example Backprojected method (BP)to create a 3D representation of the sample in the Fourierspace. The Direct Fourier Method (BP) and the Filtered Back-projection method (WBP) are two of the most well-knownheuristics for tomographic reconstruction. The last step is con-nected with 3D visualization and metrology of reconstructedobject.
A requirement for the calculation of 3D reconstructionsfrom electron micrographs in electron tomography is that theregistered image contrast must be a projection of some phys-ical characteristic of the sample, e.g. its mass/electron den-sity (Z-contrast) [3]. This implies that besides conventionalTEM bright-field (TEM-BF) imaging, dominated by diffrac-tion and/or scattering contrast, several different modes of im-age acquisition can be utilized in electron tomography to giveinsight into different characteristics of the sample [4]. Ener-gy filtered transmission electron microscopy (EFTEM) andX-ray spectroscopic imaging (STEM-EDX), for instance, en-able the mapping of local concentrations of selected chemicalelements. In EFTEM technique signal-to-noise ratios (SNR)are poor and every element map requires the registrationof multiple images in each projection, which is disadvanta-geous if beam-sensitive samples are investigated. On the otherhand, certain other acquisition modes are unsuitable (e.g. im-ages based on Bragg angle diffraction contrast). In this case,however, the problem can be overcome by acquiring projec-tion images with high angular annular dark-field scanningtransmission electron microscopy (STEM-HAADF) utilizingZ-contrast [4]. Although these methods are very powerful, ex-posure (scanning) times of 10÷30 sec. per image are requiredwhen using STEM-HAADF and, furthermore, scanning noisecannot be avoided.
The Focused Ion Beam (FIB) has become an impor-tant tool in materials science for studying of materials at themicro- and nanometer scale [5-8]. FIB-SEM tomography isbased on a serial slicing technique employing a FIB-SEMdual beam workstation. In the studies described below, elec-tron tomography images were recorded by dual beam work-station (Zeiss NEON 40EsB CrossBeam) equipped with a FIBcolumn (Ga+ ions). The experimental details are given else-where [1]. Dual-beam SEM enables the acquisition of serialimages with small (few nanometres) and reproducible spacingbetween the single imaging planes. No mechanical stage tiltingis necessary between the FIB milling and the electron beamSEM imaging steps. Serial FIB cross-sections are performedthrough the investigated volume and each exposed surface isimaged with a scanning electron microscope. With applica-tion of computer algorithms for experimental data processingand graphics packages for 3D visualization can be easily re-constructed and the microstructure interrogated to obtain bothqualitative and quantitative information. It is possible to studyfeatures at spatial resolutions at the level of tens of nanometersand volumes up to tens of cube microns.
In the studies presented below the STEM-HAADF,EFTEM, STEM-EDX tomography and FIB-SEM tomogra-phy have been carried out to visualize three-dimensional mor-phology of different materials: ferritic ODS alloy INCOLOYMA956 (oxide dispersoids), IN 718 and CMSX-4 Ni-base su-peralloys (3D distribution of nanoparticles), W-based alloysfor fusion applications (distribution of carbides and porosity),low-alloyed creep-resistant Cr-V-Mo bainitic steel (carbidesdistribution). Electron tomography results provided quantita-tive data about shape, size and distribution the microstruc-tural elements, complementary to those obtained by means ofquantitative TEM metallography. Obtained results showed thatFIB-SEM, a meso-scale tomography technique, is suitable for3D reconstruction of the objects of 100 nm in size or evensmaller.
2. Application of EFTEM and FIB-SEM electrontomography to 3D visualization and metrology of
nanoparticles in Inconel 718 superalloy
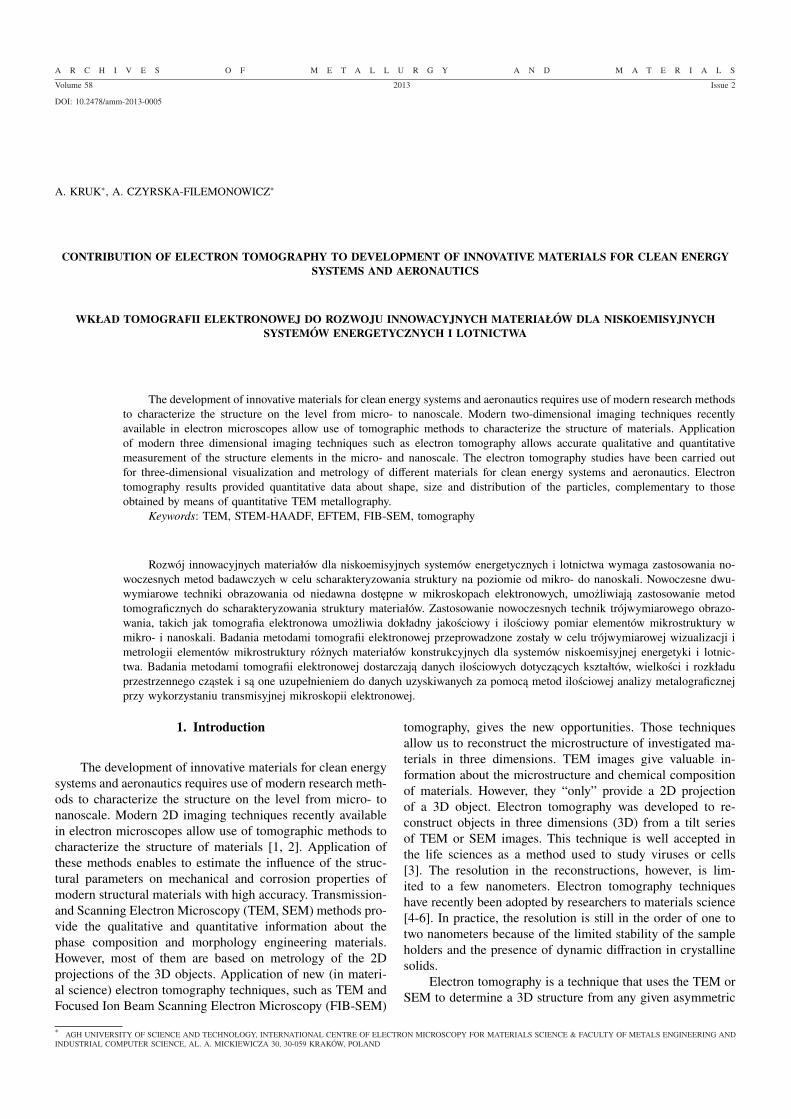
Inconel 718 (IN 718) is a commercial nickel-base su-peralloy, used in aeronautics, space and nuclear industry, e.g.for critical pieces in gas turbine engines, rocket motors andnuclear reactors. Chemical composition of the IN 718 is asfollows (wt %): Ni -19Fe -18Cr -5Nb -3Mo -1Ti -0.5Al - 0.04C. Its microstructure consists of a γ matrix (Ni-based solidsolution) containing the γ’ (Ni3Al) and γ” (Ni3Nb) coherentnanoparticles. The primary strengthening mechanism for thisalloy is a precipitation hardening by the γ’ and γ” particlesand therefore properly sized and distributed precipitates arecritical for good alloy performance [9]. For electron tomog-raphy investigation the samples of IN 718 were prepared inthe form of electrochemically polished thin foils. Tilt serieswere acquired semi automatically using Tecnai G2 microscopeoperating at 200 kV with use of FEI Xplore 3D software.Although titanium partitions to both γ’ and γ” phases, theTi maps were not collected in wide tilt angles, because theEFTEM images provided by the Ti L2,3 at 455.5 eV exhib-ited low signal-to-noise ratio (SNR) compared with the Crmaps. Figure 1 shows the examples of the EFTEM maps ofchromium, contained in γ phase, in different tilt angles from–43◦ to +52.5◦. The EFTEM images were collected in Cr L2,3edges at 574 eV, which were well visible in EELS spectra.Taking into account that the γ matrix is rich in chromium andgood quality of the EFTEM Cr mapping, it was more suitableto analyze the shape of the precipitates from a tomographicreconstruction of a tilt series of the absence of chromium.Tomographic reconstruction result is shown in Fig. 2.
Additionally, FIB-SEM tomography technique was usedfor imaging, characterization and metrology of strengtheningparticles in IN 718 alloy. Repeated removal of layers as thinas several nm for some hundred times permits to investigate attotal a volume of some nm3 with a voxel size as 2.5 nm×2.5nm×2.5 nm. The 3D mapping of nanoparticles with high res-olution by serial FIB slicing (in a distance of about 2.5 nm)and SEM imaging was performed. Ga ion beam at 30 kVwas used to perform a precise in-situ milling. The SEM im-ages at accelerating voltage 1.5 kV were taken with usingBSE (Back Scattered Electron) detector. To visualize the 3D
389
Fig. 1. Example of four Cr EFTEM elemental maps (slices) from theraw data stack of IN 718 alloy (tilt range of −45◦ to +60◦ with a 4◦
step)
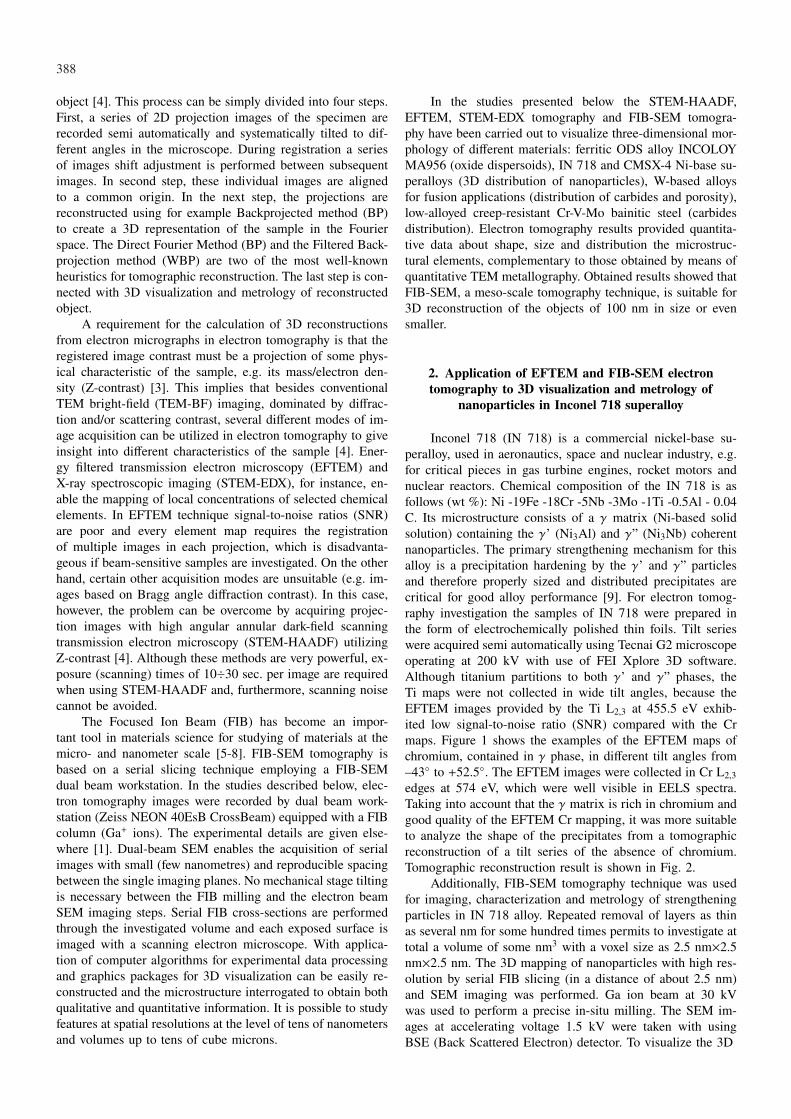
Fig. 2. Orthogonal view of the 3D surface rendering from the SIRTreconstructions for γ’ (yellow) and γ” (orange) nanoparticles in IN718
Fig. 3. Three-dimensional imaging of γ’ and γ” nanoparticles in IN718 superalloy using FIB-SEM tomography. 3D visualization of FIBserial slicing and SEM imaging stack, voxel size in the raw datavolume is 3×3×5 nm. Reconstructed volume: a) 1.9×1.4×0.74 µm,b) 2.0×0.9×0.4 µm
reconstruction, the Amira 5.4.1 and ImageJA 1.45b softwarewere used. Filtering and shift correction performed on theimages using cross-correlation method allowed for 3D visu-alization of the reconstructed volume. The image processingand segmentation permitted on the quantitative evaluation ofthe microstructure components. The volume fraction Vv of γ”
precipitates is equal 6.27±2.4% and the mean volume of theprecipitates Vave = 22.17·103±9.7·103 nm3. Figure 3 presentsan example of visualization in 3D of a reconstructed samplevolume. The results achieved for γ’ and γ” precipitates in IN718 superalloy confirm the ability of FIB-SEM tomographyto reconstruct 3D structures with dimensions in the range of100 nm or even smaller. Such 3D reconstructions can serveas a basis for quantitative analysis of complex structures in ananoscale.
3. Three-dimensional imaging of grains, porosity andTiC particles in tungsten-base alloy for fusion reactors
using FIB-SEM tomography
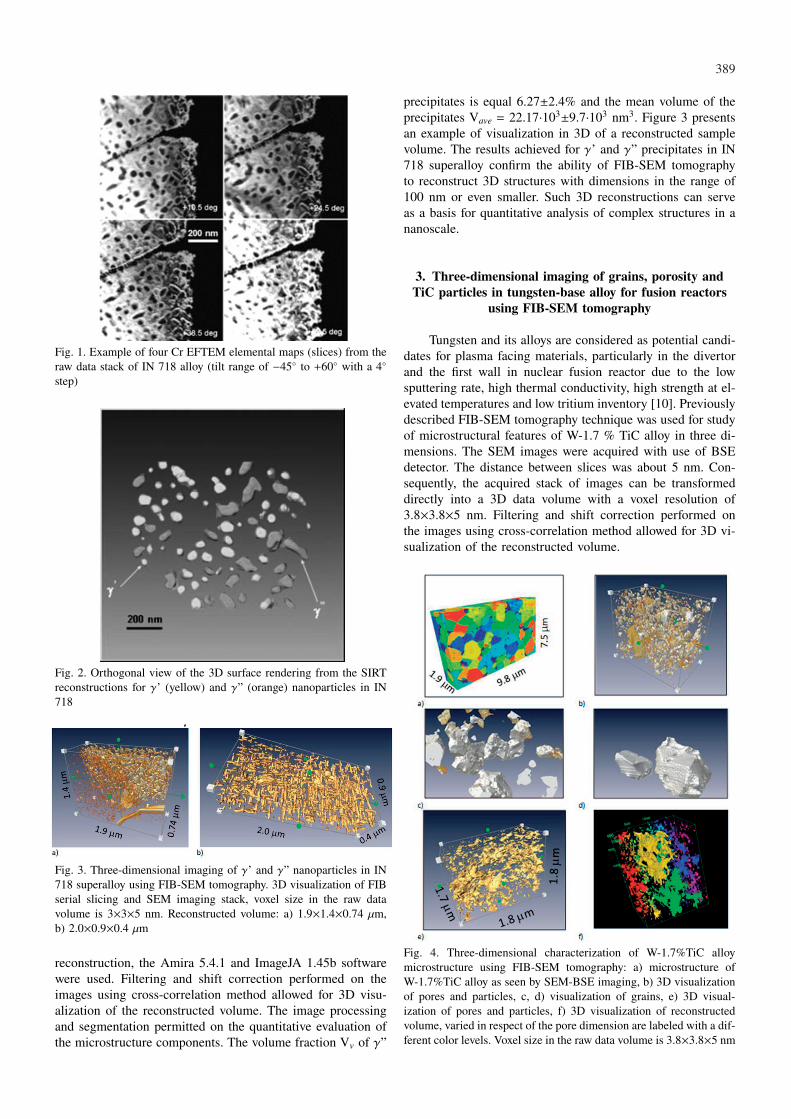
Tungsten and its alloys are considered as potential candi-dates for plasma facing materials, particularly in the divertorand the first wall in nuclear fusion reactor due to the lowsputtering rate, high thermal conductivity, high strength at el-evated temperatures and low tritium inventory [10]. Previouslydescribed FIB-SEM tomography technique was used for studyof microstructural features of W-1.7 % TiC alloy in three di-mensions. The SEM images were acquired with use of BSEdetector. The distance between slices was about 5 nm. Con-sequently, the acquired stack of images can be transformeddirectly into a 3D data volume with a voxel resolution of3.8×3.8×5 nm. Filtering and shift correction performed onthe images using cross-correlation method allowed for 3D vi-sualization of the reconstructed volume.
Fig. 4. Three-dimensional characterization of W-1.7%TiC alloymicrostructure using FIB-SEM tomography: a) microstructure ofW-1.7%TiC alloy as seen by SEM-BSE imaging, b) 3D visualizationof pores and particles, c, d) visualization of grains, e) 3D visual-ization of pores and particles, f) 3D visualization of reconstructedvolume, varied in respect of the pore dimension are labeled with a dif-ferent color levels. Voxel size in the raw data volume is 3.8×3.8×5 nm
390
Three-dimensional visualization of pores and cracks intungsten-base alloy is presented in Fig. 4. The reconstructedvolume was 4.21×3.7×0.3 µm3. The pores can be divided in-to large irregular and small oval in shape, marked in differentcolors, respectively. Such 3D imaging gives the qualitative in-formation about size, shape and spatial distribution of pores.The relative volume of pores and particles in this volume wasestimated to be 5.19±1.35%. Mean diameter of particles inthat volume was estimated as 32.6±18.8 nm.
4. Three-dimensional imaging of the carbides in Cr-V-Mosteel using FIB-SEM and STEM-HAADF tomography
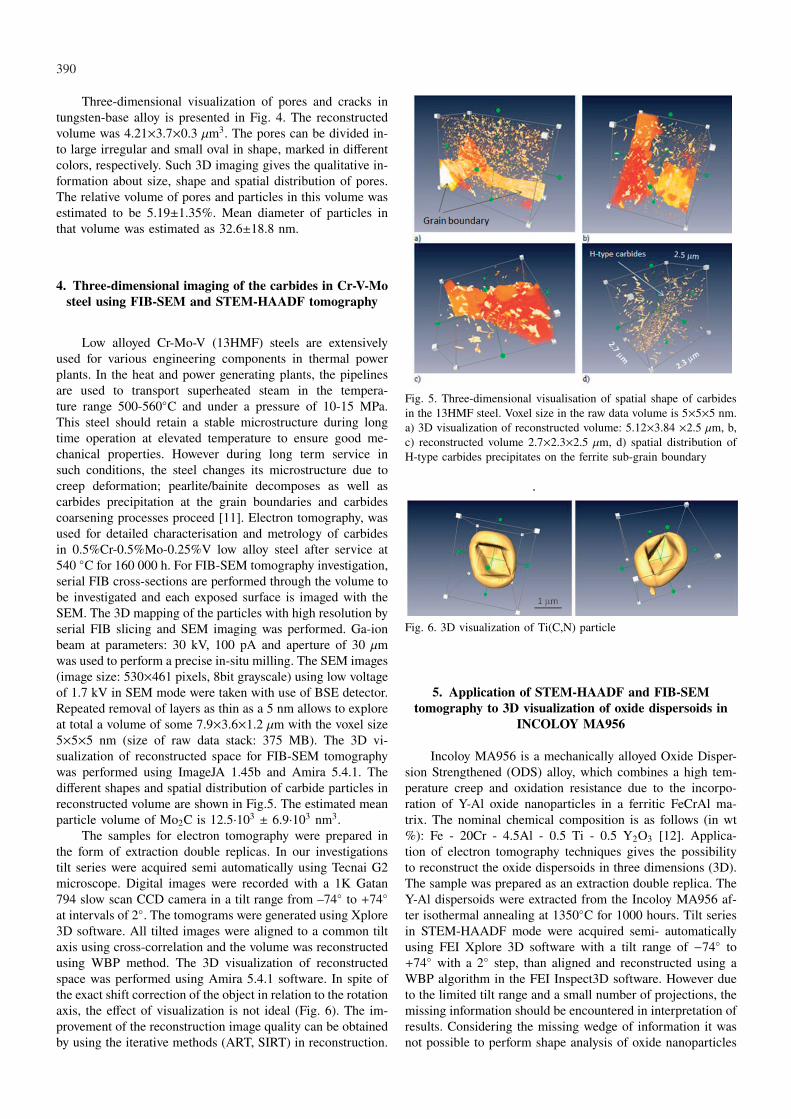
Low alloyed Cr-Mo-V (13HMF) steels are extensivelyused for various engineering components in thermal powerplants. In the heat and power generating plants, the pipelinesare used to transport superheated steam in the tempera-ture range 500-560◦C and under a pressure of 10-15 MPa.This steel should retain a stable microstructure during longtime operation at elevated temperature to ensure good me-chanical properties. However during long term service insuch conditions, the steel changes its microstructure due tocreep deformation; pearlite/bainite decomposes as well ascarbides precipitation at the grain boundaries and carbidescoarsening processes proceed [11]. Electron tomography, wasused for detailed characterisation and metrology of carbidesin 0.5%Cr-0.5%Mo-0.25%V low alloy steel after service at540 ◦C for 160 000 h. For FIB-SEM tomography investigation,serial FIB cross-sections are performed through the volume tobe investigated and each exposed surface is imaged with theSEM. The 3D mapping of the particles with high resolution byserial FIB slicing and SEM imaging was performed. Ga-ionbeam at parameters: 30 kV, 100 pA and aperture of 30 µmwas used to perform a precise in-situ milling. The SEM images(image size: 530×461 pixels, 8bit grayscale) using low voltageof 1.7 kV in SEM mode were taken with use of BSE detector.Repeated removal of layers as thin as a 5 nm allows to exploreat total a volume of some 7.9×3.6×1.2 µm with the voxel size5×5×5 nm (size of raw data stack: 375 MB). The 3D vi-sualization of reconstructed space for FIB-SEM tomographywas performed using ImageJA 1.45b and Amira 5.4.1. Thedifferent shapes and spatial distribution of carbide particles inreconstructed volume are shown in Fig.5. The estimated meanparticle volume of Mo2C is 12.5·103 ± 6.9·103 nm3.
The samples for electron tomography were prepared inthe form of extraction double replicas. In our investigationstilt series were acquired semi automatically using Tecnai G2microscope. Digital images were recorded with a 1K Gatan794 slow scan CCD camera in a tilt range from –74◦ to +74◦
at intervals of 2◦. The tomograms were generated using Xplore3D software. All tilted images were aligned to a common tiltaxis using cross-correlation and the volume was reconstructedusing WBP method. The 3D visualization of reconstructedspace was performed using Amira 5.4.1 software. In spite ofthe exact shift correction of the object in relation to the rotationaxis, the effect of visualization is not ideal (Fig. 6). The im-provement of the reconstruction image quality can be obtainedby using the iterative methods (ART, SIRT) in reconstruction.
Fig. 5. Three-dimensional visualisation of spatial shape of carbidesin the 13HMF steel. Voxel size in the raw data volume is 5×5×5 nm.a) 3D visualization of reconstructed volume: 5.12×3.84 ×2.5 µm, b,c) reconstructed volume 2.7×2.3×2.5 µm, d) spatial distribution ofH-type carbides precipitates on the ferrite sub-grain boundary
Fig. 6. 3D visualization of Ti(C,N) particle
5. Application of STEM-HAADF and FIB-SEMtomography to 3D visualization of oxide dispersoids in
INCOLOY MA956
Incoloy MA956 is a mechanically alloyed Oxide Disper-sion Strengthened (ODS) alloy, which combines a high tem-perature creep and oxidation resistance due to the incorpo-ration of Y-Al oxide nanoparticles in a ferritic FeCrAl ma-trix. The nominal chemical composition is as follows (in wt%): Fe - 20Cr - 4.5Al - 0.5 Ti - 0.5 Y2O3 [12]. Applica-tion of electron tomography techniques gives the possibilityto reconstruct the oxide dispersoids in three dimensions (3D).The sample was prepared as an extraction double replica. TheY-Al dispersoids were extracted from the Incoloy MA956 af-ter isothermal annealing at 1350◦C for 1000 hours. Tilt seriesin STEM-HAADF mode were acquired semi- automaticallyusing FEI Xplore 3D software with a tilt range of −74◦ to+74◦ with a 2◦ step, than aligned and reconstructed using aWBP algorithm in the FEI Inspect3D software. However dueto the limited tilt range and a small number of projections, themissing information should be encountered in interpretation ofresults. Considering the missing wedge of information it wasnot possible to perform shape analysis of oxide nanoparticles
391
with the required resolution to determine facets or planes ofeach particle.
Fig. 7. a, b) 3D visualization of Y-Al oxide dispersoids in reconstruct-ed volume of Incoloy MA956, spatial distribution of dispersoids inreconstructed volume, c) complex particle at different angles of view
For FIB-SEM tomography of the SEM images (imagesize: 996×455 pixels, 8bit gray-scale) were taken using in-lensSE detector at low voltage of 1.7 kV. The distance betweenslices was about 8 nm. Repeated removal of layers as thin asa 8 nm allowed to explore a total volume of 7.9×3.6×1.2 µmwith the voxel size 8×8×8 nm (size of raw data stack: 62 MB).The shape and dimensions of selected oxides particle is illus-trated in Fig. 8. The volume fraction of oxide particles present-ed in reconstructed volume was measured as Vv = 0.62±0.1%.The mean particle volume is Vave = 5.34·105±5.27·105 nm3.Thus, the mean equivalent sphere diameter of the Y-Al oxidesis deq = 92.3±28.7 nm.
Fig. 8. The 3D visualization of Y-Al oxide particles in reconstructedvolume 3.6×2.0×1.2 µm and metrology of single particle in IncoloyMA956 by electron tomography. Volume fraction of oxide particles,Vv = 0.62±0.1%
6. The 3D imaging and metrology of Ni-base CMSX-4superalloy microstructure using FIB-SEM and
STEM-EDX tomography methods
The single crystal nickel-base CMSX-4 superalloy iswidely used for gas turbine blades of aeroengines as well
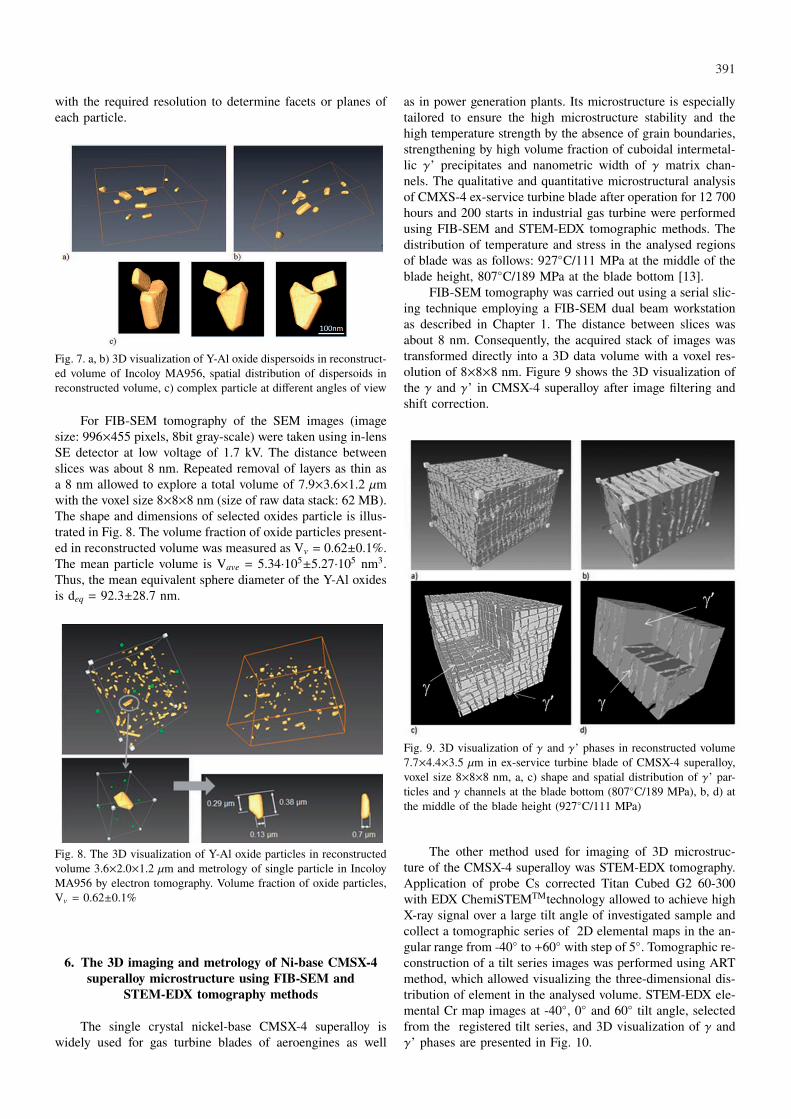
as in power generation plants. Its microstructure is especiallytailored to ensure the high microstructure stability and thehigh temperature strength by the absence of grain boundaries,strengthening by high volume fraction of cuboidal intermetal-lic γ’ precipitates and nanometric width of γ matrix chan-nels. The qualitative and quantitative microstructural analysisof CMXS-4 ex-service turbine blade after operation for 12 700hours and 200 starts in industrial gas turbine were performedusing FIB-SEM and STEM-EDX tomographic methods. Thedistribution of temperature and stress in the analysed regionsof blade was as follows: 927◦C/111 MPa at the middle of theblade height, 807◦C/189 MPa at the blade bottom [13].
FIB-SEM tomography was carried out using a serial slic-ing technique employing a FIB-SEM dual beam workstationas described in Chapter 1. The distance between slices wasabout 8 nm. Consequently, the acquired stack of images wastransformed directly into a 3D data volume with a voxel res-olution of 8×8×8 nm. Figure 9 shows the 3D visualization ofthe γ and γ’ in CMSX-4 superalloy after image filtering andshift correction.
Fig. 9. 3D visualization of γ and γ’ phases in reconstructed volume7.7×4.4×3.5 µm in ex-service turbine blade of CMSX-4 superalloy,voxel size 8×8×8 nm, a, c) shape and spatial distribution of γ’ par-ticles and γ channels at the blade bottom (807◦C/189 MPa), b, d) atthe middle of the blade height (927◦C/111 MPa)
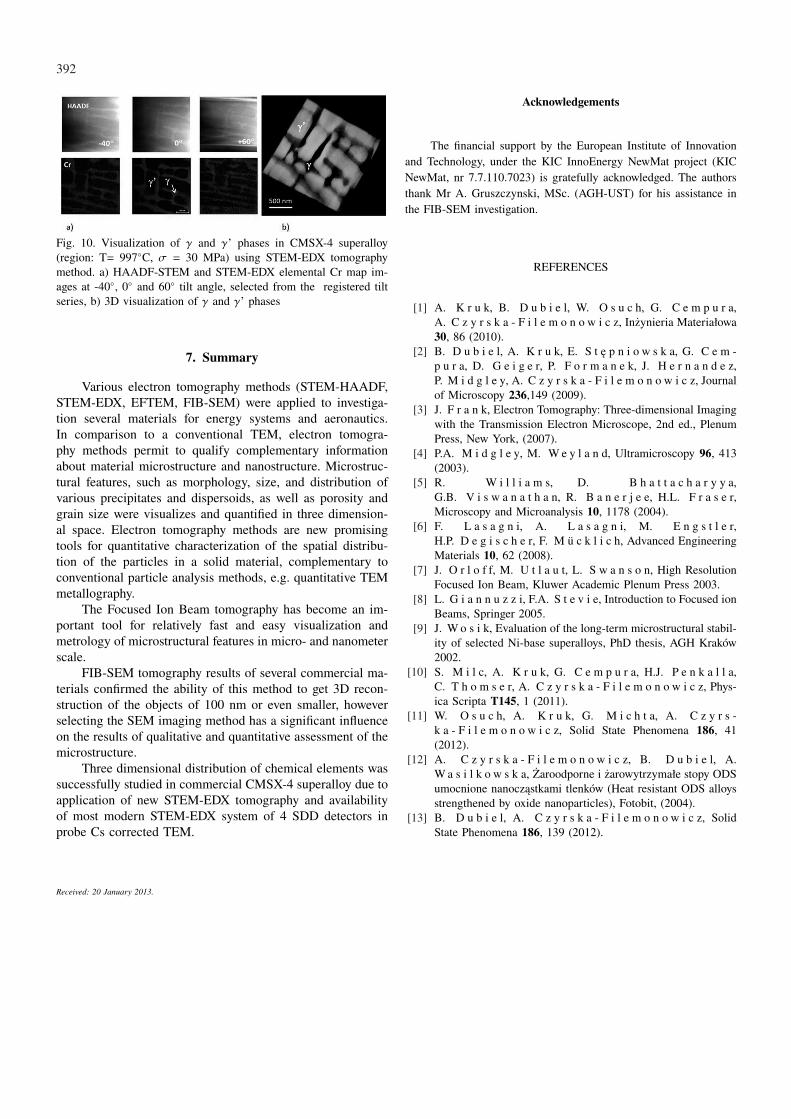
The other method used for imaging of 3D microstruc-ture of the CMSX-4 superalloy was STEM-EDX tomography.Application of probe Cs corrected Titan Cubed G2 60-300with EDX ChemiSTEMTMtechnology allowed to achieve highX-ray signal over a large tilt angle of investigated sample andcollect a tomographic series of 2D elemental maps in the an-gular range from -40◦ to +60◦ with step of 5◦. Tomographic re-construction of a tilt series images was performed using ARTmethod, which allowed visualizing the three-dimensional dis-tribution of element in the analysed volume. STEM-EDX ele-mental Cr map images at -40◦, 0◦ and 60◦ tilt angle, selectedfrom the registered tilt series, and 3D visualization of γ andγ’ phases are presented in Fig. 10.
392
Fig. 10. Visualization of γ and γ’ phases in CMSX-4 superalloy(region: T= 997◦C, σ = 30 MPa) using STEM-EDX tomographymethod. a) HAADF-STEM and STEM-EDX elemental Cr map im-ages at -40◦, 0◦ and 60◦ tilt angle, selected from the registered tiltseries, b) 3D visualization of γ and γ’ phases
7. Summary
Various electron tomography methods (STEM-HAADF,STEM-EDX, EFTEM, FIB-SEM) were applied to investiga-tion several materials for energy systems and aeronautics.In comparison to a conventional TEM, electron tomogra-phy methods permit to qualify complementary informationabout material microstructure and nanostructure. Microstruc-tural features, such as morphology, size, and distribution ofvarious precipitates and dispersoids, as well as porosity andgrain size were visualizes and quantified in three dimension-al space. Electron tomography methods are new promisingtools for quantitative characterization of the spatial distribu-tion of the particles in a solid material, complementary toconventional particle analysis methods, e.g. quantitative TEMmetallography.
The Focused Ion Beam tomography has become an im-portant tool for relatively fast and easy visualization andmetrology of microstructural features in micro- and nanometerscale.
FIB-SEM tomography results of several commercial ma-terials confirmed the ability of this method to get 3D recon-struction of the objects of 100 nm or even smaller, howeverselecting the SEM imaging method has a significant influenceon the results of qualitative and quantitative assessment of themicrostructure.
Three dimensional distribution of chemical elements wassuccessfully studied in commercial CMSX-4 superalloy due toapplication of new STEM-EDX tomography and availabilityof most modern STEM-EDX system of 4 SDD detectors inprobe Cs corrected TEM.
Acknowledgements
The financial support by the European Institute of Innovationand Technology, under the KIC InnoEnergy NewMat project (KICNewMat, nr 7.7.110.7023) is gratefully acknowledged. The authorsthank Mr A. Gruszczynski, MSc. (AGH-UST) for his assistance inthe FIB-SEM investigation.
REFERENCES
[1] A. K r u k, B. D u b i e l, W. O s u c h, G. C e m p u r a,A. C z y r s k a - F i l e m o n o w i c z, Inżynieria Materiałowa30, 86 (2010).
[2] B. D u b i e l, A. K r u k, E. S t ę p n i o w s k a, G. C e m -p u r a, D. G e i g e r, P. F o r m a n e k, J. H e r n a n d e z,P. M i d g l e y, A. C z y r s k a - F i l e m o n o w i c z, Journalof Microscopy 236,149 (2009).
[3] J. F r a n k, Electron Tomography: Three-dimensional Imagingwith the Transmission Electron Microscope, 2nd ed., PlenumPress, New York, (2007).
[4] P.A. M i d g l e y, M. W e y l a n d, Ultramicroscopy 96, 413(2003).
[5] R. W i l l i a m s, D. B h a t t a c h a r y y a,G.B. V i s w a n a t h a n, R. B a n e r j e e, H.L. F r a s e r,Microscopy and Microanalysis 10, 1178 (2004).
[6] F. L a s a g n i, A. L a s a g n i, M. E n g s t l e r,H.P. D e g i s c h e r, F. M u c k l i c h, Advanced EngineeringMaterials 10, 62 (2008).
[7] J. O r l o f f, M. U t l a u t, L. S w a n s o n, High ResolutionFocused Ion Beam, Kluwer Academic Plenum Press 2003.
[8] L. G i a n n u z z i, F.A. S t e v i e, Introduction to Focused ionBeams, Springer 2005.
[9] J. W o s i k, Evaluation of the long-term microstructural stabil-ity of selected Ni-base superalloys, PhD thesis, AGH Kraków2002.
[10] S. M i l c, A. K r u k, G. C e m p u r a, H.J. P e n k a l l a,C. T h o m s e r, A. C z y r s k a - F i l e m o n o w i c z, Phys-ica Scripta T145, 1 (2011).
[11] W. O s u c h, A. K r u k, G. M i c h t a, A. C z y r s -k a - F i l e m o n o w i c z, Solid State Phenomena 186, 41(2012).
[12] A. C z y r s k a - F i l e m o n o w i c z, B. D u b i e l, A.W a s i l k o w s k a, Żaroodporne i żarowytrzymałe stopy ODSumocnione nanocząstkami tlenków (Heat resistant ODS alloysstrengthened by oxide nanoparticles), Fotobit, (2004).
[13] B. D u b i e l, A. C z y r s k a - F i l e m o n o w i c z, SolidState Phenomena 186, 139 (2012).
Received: 20 January 2013.