Citation style: Pilorz Wojciech, Laskowski Igor, …...climate Communication Wind Shear and the...
18
Title: Wind Shear and the Strength of Severe Convective Phenomena - Preliminary Results from Poland in 2011–2015 Author: Wojciech Pilorz, Igor Laskowski, Ewa Łupikasza, Mateusz Taszarek Citation style: Pilorz Wojciech, Laskowski Igor, Łupikasza Ewa, Taszarek Mateusz. (2016). Wind Shear and the Strength of Severe Convective Phenomena - Preliminary Results from Poland in 2011–2015. “Climate” (Vol. 4 (2016), art. no. 51), doi 10.3390/cli4040051.
Transcript of Citation style: Pilorz Wojciech, Laskowski Igor, …...climate Communication Wind Shear and the...

Title: Wind Shear and the Strength of Severe Convective Phenomena - Preliminary Results from Poland in 2011–2015
Author: Wojciech Pilorz, Igor Laskowski, Ewa Łupikasza, Mateusz Taszarek
Citation style: Pilorz Wojciech, Laskowski Igor, Łupikasza Ewa, Taszarek Mateusz. (2016). Wind Shear and the Strength of Severe Convective Phenomena - Preliminary Results from Poland in 2011–2015. “Climate” (Vol. 4 (2016), art. no. 51), doi 10.3390/cli4040051.
climate
Communication
Wind Shear and the Strength of Severe ConvectivePhenomena—Preliminary Results from Polandin 2011–2015Wojciech Pilorz 1,2,*, Igor Laskowski 2,3, Ewa Łupikasza 1 and Mateusz Taszarek 4
1 Department of Climatology, University of Silesia, Bedzinska Str. 60, Sosnowiec 41-200, Poland;[email protected]
2 Skywarn Poland Association, 29 November Str. 18/19, Warsaw 00-465, Poland; [email protected] Faculty of Production Engineering and Logistics, University of Technology in Opole, Proszkowska Str. 76,
Opole 45-758, Poland4 Department of Climatology, Adam Mickiewicz University in Poznan, Dziegielowa Str. 27,
Poznan 61-680, Poland; [email protected]* Correspondence: [email protected]
Academic Editors: Christina Anagnostopoulou and Yang ZhangReceived: 31 May 2016; Accepted: 8 October 2016; Published: 13 October 2016
Abstract: Severe convective phenomena cause significant loss in the economy and, primarily,casualties. Therefore, it is essential to forecast such extreme events to avoid or minimize thenegative consequences. Wind shear provides an updraft-downdraft separation in the convective cell,which extends the cell lifetime. Wind shears between a few different air layers have been examinedin all damaging convective cases in Poland, taken from the European Severe Weather Databasebetween 2011 and 2015, in order to find their values and patterns according to the intensity of thisphenomenon. Each severe weather report was assigned wind shear values from the nearest soundingstation, and subsequently the presented summary was made. It was found that wind shear valuesdiffer between the given phenomena and their intensity. This regularity is particularly visible inshears containing 0 km wind. The highest shears occur within wind reports. Lower values areassociated with hail reports. An important difference between weak and F1+ tornadoes was foundin most of the wind shears. Severe phenomena probability within 0–6 km and 0–1 km shears showdifferent patterns according to the phenomena and their intensity. This finding has its application insevere weather forecasting.
Keywords: wind shear; deep moist convection; large hail; severe wind gusts; tornadoes; Poland
1. Introduction
One of the main causes of infrastructural and forest damage in Poland is related to severeweather events, including large hail, high wind speed gusts, and tornadoes. While severethunderstorm occurrence is associated with deep moist convection (DMC) [1], the presence of favorableenvironmental conditions is necessary for the formation of each aforementioned phenomenon.Severe weather is more likely to occur when the convective available potential energy increasesalong with vertical wind shear [2], which is known as “local variation in the wind vector or any of itscomponents in a given direction” [3]. Previous research has shown that a storm type (and hence itsseverity) depends on vertical wind shear (e.g., [4–8]). High shear environments are more favorablethan high buoyancy for the formation of strong supercell storms (which can produce a variety of severeweather) [9–12]. Significant shear is common during multicell storms and squall lines, including bowechoes, which may result in strong, damaging wind gusts near the surface, and occasionally tornadoes
Climate 2016, 4, 51; doi:10.3390/cli4040051 www.mdpi.com/journal/climate

Climate 2016, 4, 51 2 of 17
(e.g., [13,14]). However, damaging wind gusts are associated also with “wet” and “dry” microbursts inweak shear environments [12,13].
Vertical wind shear may play a different role in the thunderstorm formation at a particulartroposphere level. High values of low-level wind shear (0–1 km) are often associated with tornadooccurrence [15]. Long-lived convective structures, such as bow echoes and derechoes, are also liableto generate low-level winds because of their ability to produce “optimal conditions for lifting atthe leading edge of the gust front” [16]. Significant wind shear at mid-levels of the troposphere isan important factor for supercell development due to the enhanced inflow strength and the removal ofprecipitation from updraft [13,17]. As a result, deep layer shear (0–6 km) is often used for assessingsevere weather potential [15]. Upper-level winds can influence the low-level storm-relative flowstrength and helicity [18], and therefore cannot be omitted in severe storm forecasting. Wind shear,which can be calculated as the magnitude of the vector difference between the top and the bottom ofa specific layer in the atmosphere, is called bulk shear [19,20]. Another well-known classification ofwind shear is based on directional and speed wind shear [2], however, it will not be further examinedin this paper.
Wind shear has recently been researched to improve forecasting severe convection. Groenemeijerand van Delden [21] stated that both 0–1 km and 0–6 km bulk wind shear values decrease alongwith the increase in the hail diameter, and increase with the tornado strength. Both shear valueshave a very wide range during non-thunderstorm conditions and during thunderstorm conditionswithout aforesaid phenomena. Convective parameters were analyzed to determine the most applicableones to forecasting large hail in Germany [22]. To determine the values of any weather parameters(such as bulk wind shear) during storm incidents, information about the place and time of the severeweather is needed. While many studies have used insurance data (e.g., [22–25]), the recent EuropeanSevere Weather Database (ESWD) presents new opportunities for European storm research to beconducted. This database allows for the determining of severe weather phenomena occurrence inEurope and nearby regions [26]. Basing on the ESWD data, Groenemeijer and Kühne [27] discussedspatial, multiannual, annual, and daily tornado distribution over Europe. Taszarek and Brooks [28]used the ESWD data to determine the climatology of tornadoes in Poland. Brooks [29,30] determinedthe probability of severe, convectively driven wind, large hail, and tornadoes related to 0–6 km shearand Convective Available Potential Energy (CAPE) distribution in Europe and in the United States.Basing on the ESWD data, Taszarek and Kolendowicz [31] also found that strong tornadoes areassociated with higher, i.e., 0–1 km and 0–6 km bulk wind shear values rather than with the weakerones. Taszarek and Kolendowicz [31] and Craven and Brooks [15] stated that the stronger the tornadois, the higher deep layer sheer (DLS) and bulk wind shear (LLS) are needed. The goal of this study isto define the values of selected wind shears related to hazardous weather events, including severewind gust, large hail, and tornadoes, and to find relations between the aforementioned phenomenaintensity and the shear values. Cases with high wind shears resulting in an increased intensity of thesephenomena were extracted. We considered the following bulk wind shear values: 0–6 km, 0–1 km,0–2 km, 0–3 km, 3–6 km, 0–8 km, and 1–8 km. These particular wind shears were chosen to coverthe most important layers in the troposphere, including low level wind and the deep layer shears.This investigation has its application in forecasting the listed phenomena and distinguishing whatphenomenon is the most probable in the given bulk wind shear values, provided that they have otherfavorable conditions for convection development.
2. Materials and Methods
The information on the location, time, and intensity of severe storm were taken from the ESWD.The sounding data come from the University of Wyoming database. The ESWD is an open databasewhere everyone is allowed to create a severe weather report. The ESWD is maintained by the EuropeanSevere Storms Laboratory (ESSL). Severity criteria are clearly defined in this database. Each report hasits quality control mark (QC). Reports marked with QC0 are “as received”. Such reports are not verified
Climate 2016, 4, 51 3 of 17
by the authorized people from the ESWD management or other organizations associated with theESSL (e.g., Skywarn Poland). A verifier can attribute a higher mark (QC0+, plausibility check passed;or QC1, report confirmed) to the report only if it is in agreement with radar, lightning, and othermeteorological data. In this study, the reports with QC0+ and QC1 mark were considered. Many ofthese reports lack information on the severe storm intensity, therefore the reports were supplemented,if possible, with the missing data. In Poland, a great majority of the reports were prepared by the stormspotters from Skywarn Poland Association. These data have not been checked yet whether they havethe same regularity of the convective indicators (such as wind shears). Such information is essentialto know if the reports and the intensity ratings were prepared properly. All the reports in the ESWDfrom the study period have been checked if they were affected by any errors. The ESWD includesFujita and Torro damage scale ([32], torro.org.uk). Since it is more precise, the Torro scale was used inthis paper for a severe wind events assessment, while F-scale was used for tornado intensity rating.During the verification process, in some of the reports several of the criteria for the reporting werefound to be mistaken. Such reports were excluded. Mistakes in the ESWD are probably related tothe period before 2011, because of the reporting process performed by non-Polish speakers from theESWD management, who might have missed some details in the description in the source materialswritten in Polish.
Weather reports for Poland were examined from April to September, coinciding with the potentialperiod of severe convective weather occurrence. In the multiyear period of 2011–2015 we selectedreports on strong winds related to convective (thunderstorm presence required) conditions only.It happens that wind damage appears in non-convective conditions when a deep cyclone generatesa pressure gradient resulting in high winds. Such cases were excluded from the investigation.
Each regarded sounding must meet the following criteria:
1. time criterion: maximum three hours after the report and six hours before the report2. space criterion: a distance from the sounding station to the report location of 200 km or less3. air mass criterion: the report and the sounding must be located in the same air mass
(no front between)4. CAPE criterion: CAPE > 0
Sounding data processing was performed using Sounding Decoder 2014 software. All windshear values were estimated with the vector difference method (the magnitude of the vector differencebetween certain layers)—bulk shear. Each report meeting the above listed criteria was assigned to thedata from the nearest sounding station. Each sounding was analyzed manually. The soundings withzero CAPE or heavily changed lower temperature and dew point temperature were excluded becauseof the storms influence on the conditions.
From the profiles that meet the above mentioned criteria we excluded those which might bemodified by any factors and thus not represent conditions during the analyzed severe weather events.The degree of the modification is indicated by having a vertical profile of air temperature and dewpoint that is significantly different from other stations within the same air mass.
The limitation of this study is primarily due to its short study period which was an unavoidableresult of the data reliability. The consequence of such a short period is having a small number oftornado and very large number of hail events included within the study. Thus, the study cannot betreated as a climatological study.
3. Results
3.1. Wind Shear Characteristics within Different Severe Weather Events and Their Intensity
Out of the total number of 1690 severe weather reports with attributed wind shear values,three severe phenomena were distinguished. These events were evidenced by 1144 wind reports,502 hail reports, and 44 tornado reports. These phenomena were divided into groups according to their

Climate 2016, 4, 51 4 of 17
intensity. Hail intensity was assessed on the basis of its maximum diameter. Firstly, the most numerousgroup of hail reports relate to large hail with diameters between 20 and 49 mm. The second groupconcerns hailstones with a diameter of at least 50 mm. Among the wind reports, three groups weredistinguished using wind speed usually estimated by damage analysis. The most numerous groupwas the one with unrated (UR) wind, which means no wind speed ratings (about 77% of all the windreports). The second group (severe wind) includes reports with T1 rating (25–33 m/s). The extremelysevere wind group involves wind speeds exceeding 33 m/s. Tornadoes were divided into two groups,according to their intensity. The weak tornado group consists of the wind speed rating assessed as F0(T0 and T1) and waterspouts. The strong tornado group comprises the wind speed ratings of at leastF1 (F1+). No tornado stronger than F3/T6 category was recorded in the study period.
Seven box-and-whiskers plots were generated showing bulk wind shear variability accordingto the phenomena and their intensity, one for each shear. The sounding data were taken fromnine sounding stations in Poland and neighboring countries: Greifswald and Lindenberg inGermany, Praha and Prostejov in the Czech Republic, Poprad in Slovakia, Kaliningrad in Russia,and Łeba, Legionowo, and Wrocław in Poland (Figure 1). Each diagram has been checked forerroneous measurements.
Climate 2016, 4, 51 4 of 18
were distinguished using wind speed usually estimated by damage analysis. The most numerous group was the one with unrated (UR) wind, which means no wind speed ratings (about 77% of all the wind reports). The second group (severe wind) includes reports with T1 rating (25–33 m/s). The extremely severe wind group involves wind speeds exceeding 33 m/s. Tornadoes were divided into two groups, according to their intensity. The weak tornado group consists of the wind speed rating assessed as F0 (T0 and T1) and waterspouts. The strong tornado group comprises the wind speed ratings of at least F1 (F1+). No tornado stronger than F3/T6 category was recorded in the study period.
Seven box-and-whiskers plots were generated showing bulk wind shear variability according to the phenomena and their intensity, one for each shear. The sounding data were taken from nine sounding stations in Poland and neighboring countries: Greifswald and Lindenberg in Germany, Praha and Prostejov in the Czech Republic, Poprad in Slovakia, Kaliningrad in Russia, and Łeba, Legionowo, and Wrocław in Poland (Figure 1). Each diagram has been checked for erroneous measurements.
Figure 1. Contour map of Poland. The red dots represent the sounding stations location. The circles denote the area within 200 km from the sounding station.
0–1 km Bulk Wind Shear (LLS)
The magnitude of the vector difference between the ground level wind and the wind at 1 km above the ground (usually called Low Level Shear, LLS) is a vertically strongly limited characteristic (involving only the lowest kilometer of the troposphere), but it is essential for assessing the probability of some phenomena. LLS with DLS (Deep Layer Shear) are the most commonly used bulk wind shears to forecast severe weather. The highest values of 0–1 km bulk wind shear were related to all the wind reports regardless of wind intensity (maximum wind speed)—see Figure 2. Lower values of the bulk wind shear were found in the hail and tornadoes classes. As to the wind rating categories, there was little difference in the bulk wind shear values with a median of about 7.5 m/s. Slightly higher shears were observed in the severe wind category. Extremely severe wind had a clearly lower value of the 99th percentile relative to the other wind classes. It might be due to a relatively low number of the severe weather reports in that class. In case of the hail categories, the
Figure 1. Contour map of Poland. The red dots represent the sounding stations location. The circlesdenote the area within 200 km from the sounding station.
0–1 km Bulk Wind Shear (LLS)
The magnitude of the vector difference between the ground level wind and the wind at 1 kmabove the ground (usually called Low Level Shear, LLS) is a vertically strongly limited characteristic(involving only the lowest kilometer of the troposphere), but it is essential for assessing the probabilityof some phenomena. LLS with DLS (Deep Layer Shear) are the most commonly used bulk windshears to forecast severe weather. The highest values of 0–1 km bulk wind shear were related to allthe wind reports regardless of wind intensity (maximum wind speed)—see Figure 2. Lower values ofthe bulk wind shear were found in the hail and tornadoes classes. As to the wind rating categories,

Climate 2016, 4, 51 5 of 17
there was little difference in the bulk wind shear values with a median of about 7.5 m/s. Slightly highershears were observed in the severe wind category. Extremely severe wind had a clearly lower valueof the 99th percentile relative to the other wind classes. It might be due to a relatively low numberof the severe weather reports in that class. In case of the hail categories, the median was the samein both the large and the very large hail classes. Very large hail had a clearly lower value of the99th percentile, which could result from a small number of the severe weather reports in comparisonto the other classes. The tornado classes were characterized by a distinct difference in the bulk windshear. Weak tornadoes had a median LLS of 5 m/s, while F1+ tornadoes had a median of almost7 m/s (Figure 2). As Taszarek and Kolendowicz [31] suggested, it is the effect of entirely differentconditions in which each tornado category forms. Craven and Brooks [15] and Brooks [29] also pointedout noticeably higher values of the wind shears during violent tornado incidents.
Climate 2016, 4, 51 5 of 18
median was the same in both the large and the very large hail classes. Very large hail had a clearly lower value of the 99th percentile, which could result from a small number of the severe weather reports in comparison to the other classes. The tornado classes were characterized by a distinct difference in the bulk wind shear. Weak tornadoes had a median LLS of 5 m/s, while F1+ tornadoes had a median of almost 7 m/s (Figure 2). As Taszarek and Kolendowicz [31] suggested, it is the effect of entirely different conditions in which each tornado category forms. Craven and Brooks [15] and Brooks [29] also pointed out noticeably higher values of the wind shears during violent tornado incidents.
Figure 2. Box-and-whiskers plot of the bulk wind shear (magnitude of the vector difference between the ground level and the height of 1 km) in the proximity of the severe weather reports on the given phenomena. The box extends from the 25th to 75th percentile and the whiskers reach from the 1st (bottom part) to the 99th (upper part) percentile. The number above the 99th percentile denotes the number of severe weather reports within the given phenomena category. UR wind—unrated wind; v. large hail—very large hail; sev. wind—severe wind; extr. sev. wind—extremely severe wind.
0–2 km Bulk Wind Shear
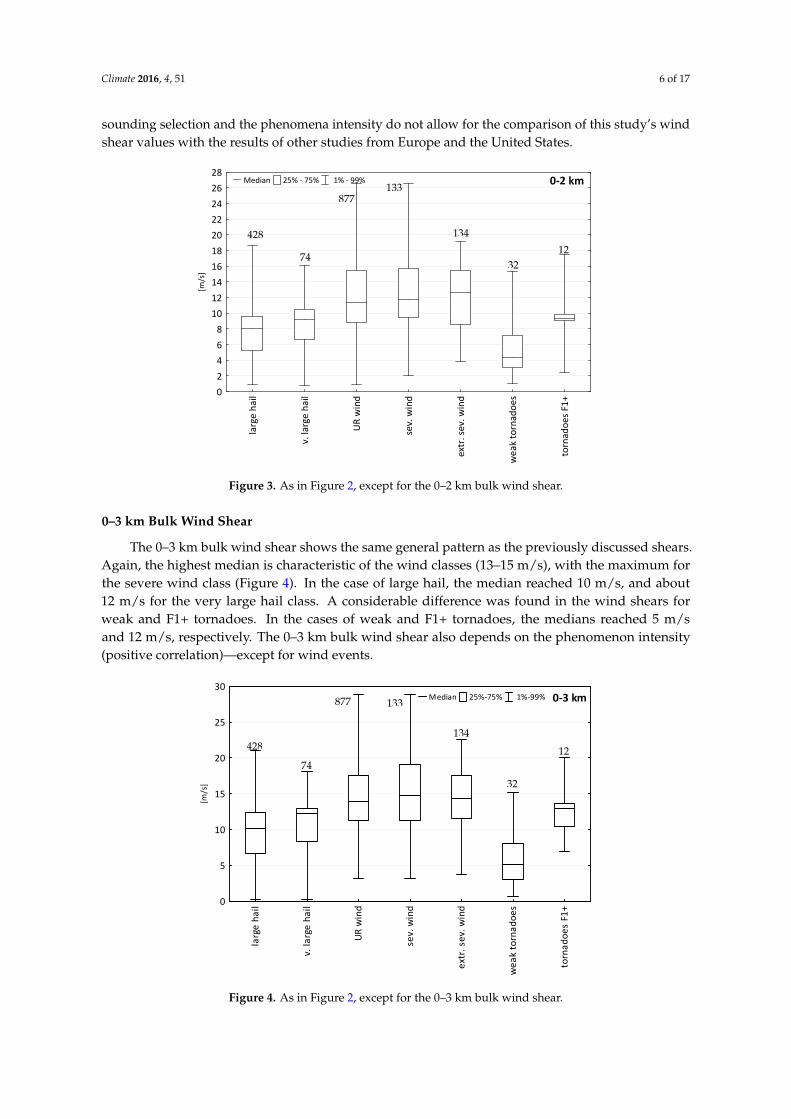
Just like the previously discussed 0–1 km bulk wind shear, the 0–2 km bulk shear shows the same pattern of distribution related to the weather phenomenon. In contrast to the 0–1 km bulk wind shear, the reports with extremely severe wind reached higher values (13 m/s) than the unrated and severe wind reports (Figure 3). The difference was about 1.5 m/s. The hail and the tornado classes had lower shears. The median of the shear for large hail reached 8 m/s, and 9 m/s in the case of very large hail. During the weak tornado events, the median of the 0–2 km bulk wind shear reached about 4 m/s, while during F1+ tornado events it increased substantially to 9 m/s. Note the narrow box in F1+ tornado class in Figure 3 which denotes strongly limited 0–2 km bulk wind shear values during F1+ tornado events. For hail and tornadoes, the 0–2 km bulk wind shear increases with the intensity (assessed by its diameter), which applies to all the analyzed phenomena. These results indicate the fact that the higher the shear is, the more severe weather it brings, provided the other parameters (e.g., convective available potential energy) are favorable for convection. Different criteria for both the sounding selection and the phenomena intensity do not allow for the comparison of this study’s wind shear values with the results of other studies from Europe and the United States.
Figure 2. Box-and-whiskers plot of the bulk wind shear (magnitude of the vector difference betweenthe ground level and the height of 1 km) in the proximity of the severe weather reports on the givenphenomena. The box extends from the 25th to 75th percentile and the whiskers reach from the 1st(bottom part) to the 99th (upper part) percentile. The number above the 99th percentile denotes thenumber of severe weather reports within the given phenomena category. UR wind—unrated wind;v. large hail—very large hail; sev. wind—severe wind; extr. sev. wind—extremely severe wind.
0–2 km Bulk Wind Shear
Just like the previously discussed 0–1 km bulk wind shear, the 0–2 km bulk shear shows thesame pattern of distribution related to the weather phenomenon. In contrast to the 0–1 km bulk windshear, the reports with extremely severe wind reached higher values (13 m/s) than the unrated andsevere wind reports (Figure 3). The difference was about 1.5 m/s. The hail and the tornado classeshad lower shears. The median of the shear for large hail reached 8 m/s, and 9 m/s in the case of verylarge hail. During the weak tornado events, the median of the 0–2 km bulk wind shear reached about4 m/s, while during F1+ tornado events it increased substantially to 9 m/s. Note the narrow box inF1+ tornado class in Figure 3 which denotes strongly limited 0–2 km bulk wind shear values duringF1+ tornado events. For hail and tornadoes, the 0–2 km bulk wind shear increases with the intensity(assessed by its diameter), which applies to all the analyzed phenomena. These results indicate thefact that the higher the shear is, the more severe weather it brings, provided the other parameters(e.g., convective available potential energy) are favorable for convection. Different criteria for both the
Climate 2016, 4, 51 6 of 17
sounding selection and the phenomena intensity do not allow for the comparison of this study’s windshear values with the results of other studies from Europe and the United States.Climate 2016, 4, 51 6 of 18
larg
e ha
il
v. la
rge
hail
UR
win
d
sev.
win
d
extr
. sev
. win
d
wea
k to
rnad
oes
torn
adoe
s F1+
02468
10121416182022242628
[m/s
]
Median 25% - 75% 1% - 99% 0-2 km
Figure 3. As in Figure 2, except for the 0–2 km bulk wind shear.
0–3 km Bulk Wind Shear
The 0–3 km bulk wind shear shows the same general pattern as the previously discussed shears. Again, the highest median is characteristic of the wind classes (13–15 m/s), with the maximum for the severe wind class (Figure 4).In the case of large hail, the median reached 10 m/s, and about 12 m/s for the very large hail class. A considerable difference was found in the wind shears for weak and F1+ tornadoes. In the cases of weak and F1+ tornadoes, the medians reached 5 m/s and 12 m/s, respectively. The 0–3 km bulk wind shear also depends on the phenomenon intensity (positive correlation)—except for wind events.
428
74
877133
134
3212
Figure 3. As in Figure 2, except for the 0–2 km bulk wind shear.
0–3 km Bulk Wind Shear
The 0–3 km bulk wind shear shows the same general pattern as the previously discussed shears.Again, the highest median is characteristic of the wind classes (13–15 m/s), with the maximum forthe severe wind class (Figure 4). In the case of large hail, the median reached 10 m/s, and about12 m/s for the very large hail class. A considerable difference was found in the wind shears forweak and F1+ tornadoes. In the cases of weak and F1+ tornadoes, the medians reached 5 m/sand 12 m/s, respectively. The 0–3 km bulk wind shear also depends on the phenomenon intensity(positive correlation)—except for wind events.Climate 2016, 4, 51 7 of 18
larg
e ha
il
v. la
rge
hail
UR w
ind
sev.
win
d
extr
. sev
. win
d
wea
k to
rnad
oes
torn
adoe
s F1
+0
5
10
15
20
25
30
[m/s
]
Median 25%-75% 1%-99% 0-3 km
Figure 4. As in Figure 2, except for the 0–3 km bulk wind shear.
0–6 km Wind Shear (DLS)
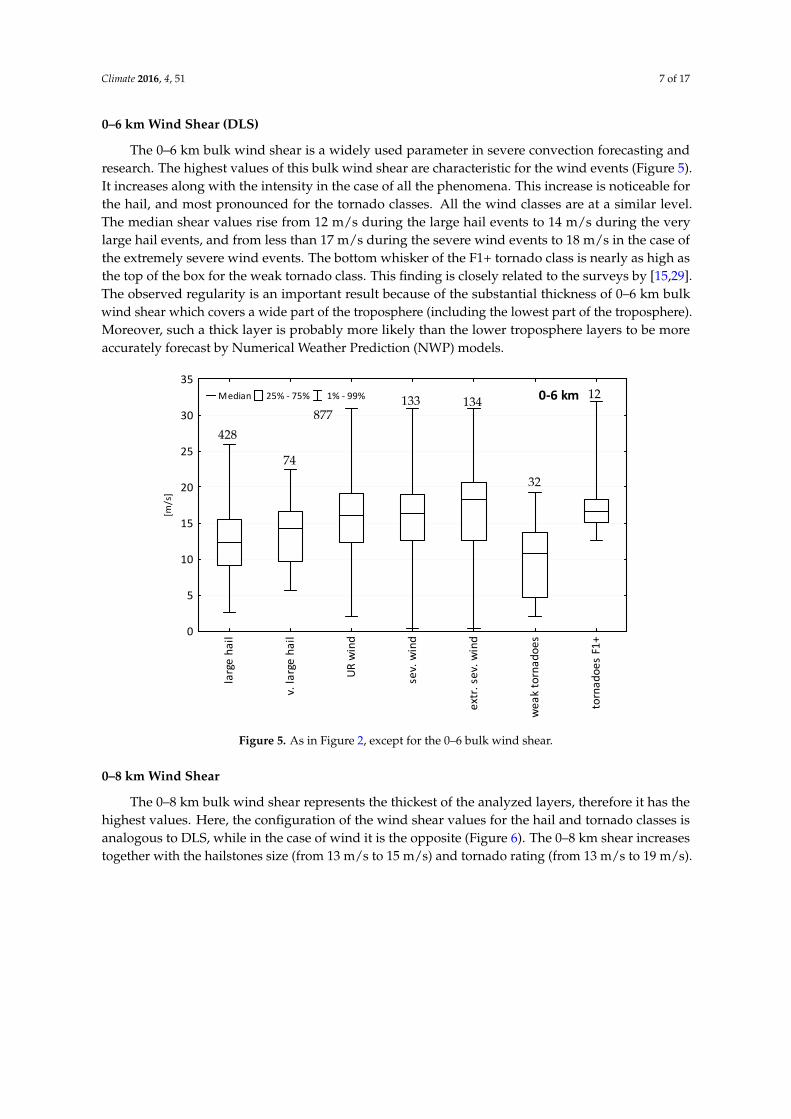
The 0–6 km bulk wind shear is a widely used parameter in severe convection forecasting and research. The highest values of this bulk wind shear are characteristic for the wind events (Figure 5). It increases along with the intensity in the case of all the phenomena. This increase is noticeable for the hail, and most pronounced for the tornado classes. All the wind classes are at a similar level. The median shear values rise from 12 m/s during the large hail events to 14 m/s during the very large hail events, and from less than 17 m/s during the severe wind events to 18 m/s in the case of the extremely severe wind events. The bottom whisker of the F1+ tornado class is nearly as high as the top of the box for the weak tornado class. This finding is closely related to the surveys by [15,29]. The observed regularity is an important result because of the substantial thickness of 0–6 km bulk wind shear which covers a wide part of the troposphere (including the lowest part of the troposphere). Moreover, such a thick layer is probably more likely than the lower troposphere layers to be more accurately forecast by Numerical Weather Prediction (NWP) models.
428
74
877 133
134
32
12
Figure 4. As in Figure 2, except for the 0–3 km bulk wind shear.
Climate 2016, 4, 51 7 of 17
0–6 km Wind Shear (DLS)
The 0–6 km bulk wind shear is a widely used parameter in severe convection forecasting andresearch. The highest values of this bulk wind shear are characteristic for the wind events (Figure 5).It increases along with the intensity in the case of all the phenomena. This increase is noticeable forthe hail, and most pronounced for the tornado classes. All the wind classes are at a similar level.The median shear values rise from 12 m/s during the large hail events to 14 m/s during the verylarge hail events, and from less than 17 m/s during the severe wind events to 18 m/s in the case ofthe extremely severe wind events. The bottom whisker of the F1+ tornado class is nearly as high asthe top of the box for the weak tornado class. This finding is closely related to the surveys by [15,29].The observed regularity is an important result because of the substantial thickness of 0–6 km bulkwind shear which covers a wide part of the troposphere (including the lowest part of the troposphere).Moreover, such a thick layer is probably more likely than the lower troposphere layers to be moreaccurately forecast by Numerical Weather Prediction (NWP) models.Climate 2016, 4, 51 8 of 18
larg
e ha
il
v. la
rge
hail
UR w
ind
sev.
win
d
extr
. sev
. win
d
wea
k to
rnad
oes
torn
adoe
s F1
+0
5
10
15
20
25
30
35
[m/s
]
Median 25% - 75% 1% - 99% 0-6 km
Figure 5. As in Figure 2, except for the 0–6 bulk wind shear.
0–8 km Wind Shear
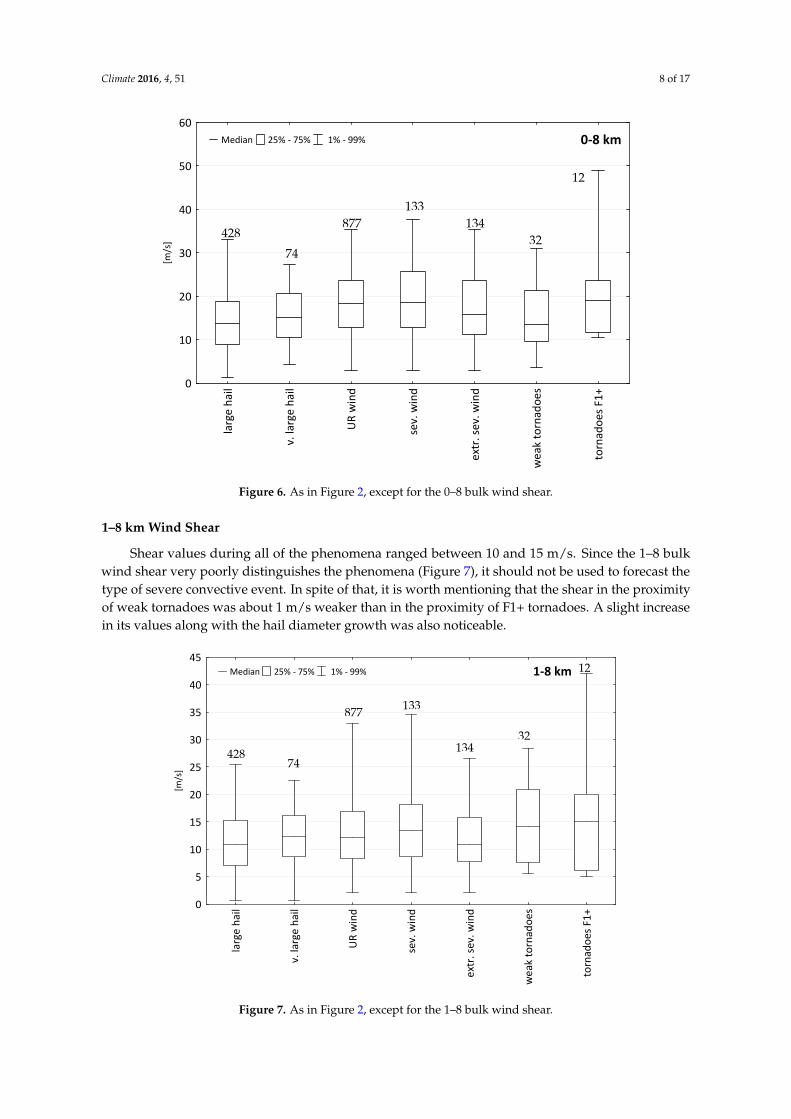
The 0–8 km bulk wind shear represents the thickest of the analyzed layers, therefore it has the highest values. Here, the configuration of the wind shear values for the hail and tornado classes is analogous to DLS, while in the case of wind it is the opposite (Figure 6). The 0–8 km shear increases together with the hailstones size (from 13 m/s to 15 m/s) and tornado rating (from 13 m/s to 19 m/s).
larg
e ha
il
v. la
rge
hail
UR
win
d
sev.
win
d
extr
. sev
. win
d
wea
k to
rnad
oes
torn
adoe
s F1+
0
10
20
30
40
50
60
[m/s
]
Median 25% - 75% 1% - 99% 0-8 km
Figure 6. As in Figure 2, except for the 0–8 bulk wind shear.
428
74
877133 134
32
12
428 74
877133
13432
12
Figure 5. As in Figure 2, except for the 0–6 bulk wind shear.
0–8 km Wind Shear
The 0–8 km bulk wind shear represents the thickest of the analyzed layers, therefore it has thehighest values. Here, the configuration of the wind shear values for the hail and tornado classes isanalogous to DLS, while in the case of wind it is the opposite (Figure 6). The 0–8 km shear increasestogether with the hailstones size (from 13 m/s to 15 m/s) and tornado rating (from 13 m/s to 19 m/s).
Climate 2016, 4, 51 8 of 17
Climate 2016, 4, 51 8 of 18
larg
e ha
il
v. la
rge
hail
UR w
ind
sev.
win
d
extr
. sev
. win
d
wea
k to
rnad
oes
torn
adoe
s F1
+0
5
10
15
20
25
30
35
[m/s
]
Median 25% - 75% 1% - 99% 0-6 km
Figure 5. As in Figure 2, except for the 0–6 bulk wind shear.
0–8 km Wind Shear
The 0–8 km bulk wind shear represents the thickest of the analyzed layers, therefore it has the highest values. Here, the configuration of the wind shear values for the hail and tornado classes is analogous to DLS, while in the case of wind it is the opposite (Figure 6). The 0–8 km shear increases together with the hailstones size (from 13 m/s to 15 m/s) and tornado rating (from 13 m/s to 19 m/s).
larg
e ha
il
v. la
rge
hail
UR
win
d
sev.
win
d
extr
. sev
. win
d
wea
k to
rnad
oes
torn
adoe
s F1+
0
10
20
30
40
50
60
[m/s
]
Median 25% - 75% 1% - 99% 0-8 km
Figure 6. As in Figure 2, except for the 0–8 bulk wind shear.
428
74
877133 134
32
12
428 74
877133
13432
12
Figure 6. As in Figure 2, except for the 0–8 bulk wind shear.
1–8 km Wind Shear
Shear values during all of the phenomena ranged between 10 and 15 m/s. Since the 1–8 bulkwind shear very poorly distinguishes the phenomena (Figure 7), it should not be used to forecast thetype of severe convective event. In spite of that, it is worth mentioning that the shear in the proximityof weak tornadoes was about 1 m/s weaker than in the proximity of F1+ tornadoes. A slight increasein its values along with the hail diameter growth was also noticeable.
Climate 2016, 4, 51 9 of 18
1–8 km Wind Shear
Shear values during all of the phenomena ranged between 10 and 15 m/s. Since the 1–8 bulk wind shear very poorly distinguishes the phenomena (Figure 7), it should not be used to forecast the type of severe convective event. In spite of that, it is worth mentioning that the shear in the proximity of weak tornadoes was about 1 m/s weaker than in the proximity of F1+ tornadoes. A slight increase in its values along with the hail diameter growth was also noticeable.
larg
e ha
il
v. la
rge
hail
UR
win
d
sev.
win
d
extr
. sev
. win
d
wea
k to
rnad
oes
torn
adoe
s F1+
0
5
10
15
20
25
30
35
40
45
[m/s
]
Median 25% - 75% 1% - 99% 1-8 km
Figure 7. As in Figure 2, except for the 1–8 bulk wind shear.
3–6 km Wind Shear
The values of the 3–6 km bulk wind shear, which range from 4.5 m/s to 7.5 m/s (Figure 8), do not constitute a good indicator of the particular phenomena. A clearly visible gap between the intensity classes appears only for tornado events, but the order of wind shear in this case is different from what could be expected on the basis of the shears analyzed previously. The shear for weaker tornadoes was greater than for F1+ tornadoes. Just like in the case of the 1–8 km bulk wind shear, the 3–6 km shear should not be used for forecasting this type of convective event.
428 74
877 133
13432
12
Figure 7. As in Figure 2, except for the 1–8 bulk wind shear.

Climate 2016, 4, 51 9 of 17
3–6 km Wind Shear
The values of the 3–6 km bulk wind shear, which range from 4.5 m/s to 7.5 m/s (Figure 8), do notconstitute a good indicator of the particular phenomena. A clearly visible gap between the intensityclasses appears only for tornado events, but the order of wind shear in this case is different from whatcould be expected on the basis of the shears analyzed previously. The shear for weaker tornadoes wasgreater than for F1+ tornadoes. Just like in the case of the 1–8 km bulk wind shear, the 3–6 km shearshould not be used for forecasting this type of convective event.Climate 2016, 4, 51 10 of 18
larg
e ha
il
v. la
rge
hail
UR
win
d
sev.
win
d
extr
. sev
. win
d
wea
k to
rnad
oes
torn
adoe
s F1+
0
2
4
6
8
10
12
14
16
18
20
[m/s
]
Median 25% - 75% 1% - 99% 3-6 km
Figure 8. As in Figure 2, except for the 3–6 bulk wind shear.
The statistical significance of the differences between the wind shear means (medians) for the various severe weather events and the particular wind shears was checked with the U Mann–Whitney test method. The U Mann–Whitney test (U M–W) is the most powerful non-parametric alternative to the t test used for assessing the statistical significance of differences between the means for independent samples [33]. Wilks [34] calls it a test of location (position) difference, thus making a reference to one of the statistical measures of position (i.e., the median). According to [34], the power of the U M–W test is close to that of the t test. The U M–W test verifies the null hypothesis that the difference of location between the samples is equal to 0.
3.2. Probability for the Phenomena Related to LLS and DLS
Despite the fact the 0–1 km bulk shear turned out to be insignificant at the 5% level—Table 1 (which may result from the low number of the weather reports), we decided to choose the 0–1km and 0–6 km bulk wind shears (respectively LLS and DLS) as the most useful ones because of the significant difference of the layer thickness and its influence on the given severe phenomena. The thickness difference allows an analysis of the relationship between two significantly different layers. LLS describes the wind variation in the lower troposphere, while DLS describes the wind changes also in the middle troposphere. Therefore, these two parameters were employed in the further analyses. Furthermore, the two shears allow for the assessment of the intensity of the wind during wind and tornado events. An interesting observation was made in the case of hail. LLS does not rise with the hail diameter, while DLS does. The probability of each severe phenomenon intensity class (the same classes as referred to before in this paper), was estimated according to the distribution of LLS and DLS values from all the soundings during the study period.
428
74
877 133
13432
12
Figure 8. As in Figure 2, except for the 3–6 bulk wind shear.
The statistical significance of the differences between the wind shear means (medians) for thevarious severe weather events and the particular wind shears was checked with the U Mann–Whitneytest method. The U Mann–Whitney test (U M–W) is the most powerful non-parametric alternative tothe t test used for assessing the statistical significance of differences between the means for independentsamples [33]. Wilks [34] calls it a test of location (position) difference, thus making a reference to one ofthe statistical measures of position (i.e., the median). According to [34], the power of the U M–W test isclose to that of the t test. The U M–W test verifies the null hypothesis that the difference of locationbetween the samples is equal to 0.
3.2. Probability for the Phenomena Related to LLS and DLS
Despite the fact the 0–1 km bulk shear turned out to be insignificant at the 5% level—Table 1(which may result from the low number of the weather reports), we decided to choose the 0–1 kmand 0–6 km bulk wind shears (respectively LLS and DLS) as the most useful ones because ofthe significant difference of the layer thickness and its influence on the given severe phenomena.The thickness difference allows an analysis of the relationship between two significantly differentlayers. LLS describes the wind variation in the lower troposphere, while DLS describes the windchanges also in the middle troposphere. Therefore, these two parameters were employed in the furtheranalyses. Furthermore, the two shears allow for the assessment of the intensity of the wind duringwind and tornado events. An interesting observation was made in the case of hail. LLS does not risewith the hail diameter, while DLS does. The probability of each severe phenomenon intensity class
Climate 2016, 4, 51 10 of 17
(the same classes as referred to before in this paper), was estimated according to the distribution ofLLS and DLS values from all the soundings during the study period.
Table 1. The statistical significance (p) of the differences between the wind shear means (medians) forthe various severe weather events and the particular wind shears. p < 0.05 is bolded. LH, large hail;VLH, very large hail; URV, unrated wind; SV, severe wind; ExtSV, extremely severe wind; T, tornado;TF1+—tornado with rating at least F1.
0–6 km 0–1 km 0–2 km 0–3 km 3–6 km 0–8 km 1–8 km
LH/VLH 0.006 0.441 0.019 0.042 0.913 0.042 0.0496URV/SV 0.775 0.587 0.403 0.312 0.788 0.073 0.061
URV/ExtSV 0.074 0.244 0.257 0.102 0.985 0.176 0.084SV/ExtSV 0.210 0.112 0.980 0.857 0.854 0.022 0.010
T/TF1+ 0.0002 0.067 0.0002 0.00001 0.316 0.225 0.752
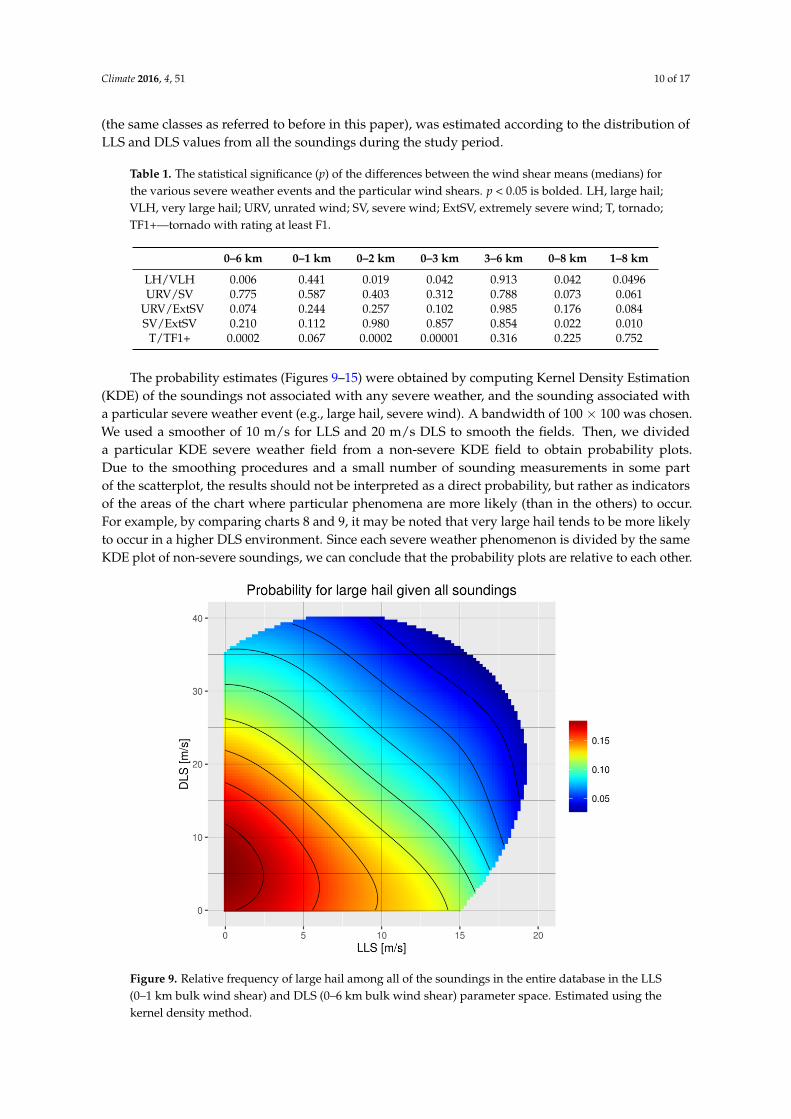
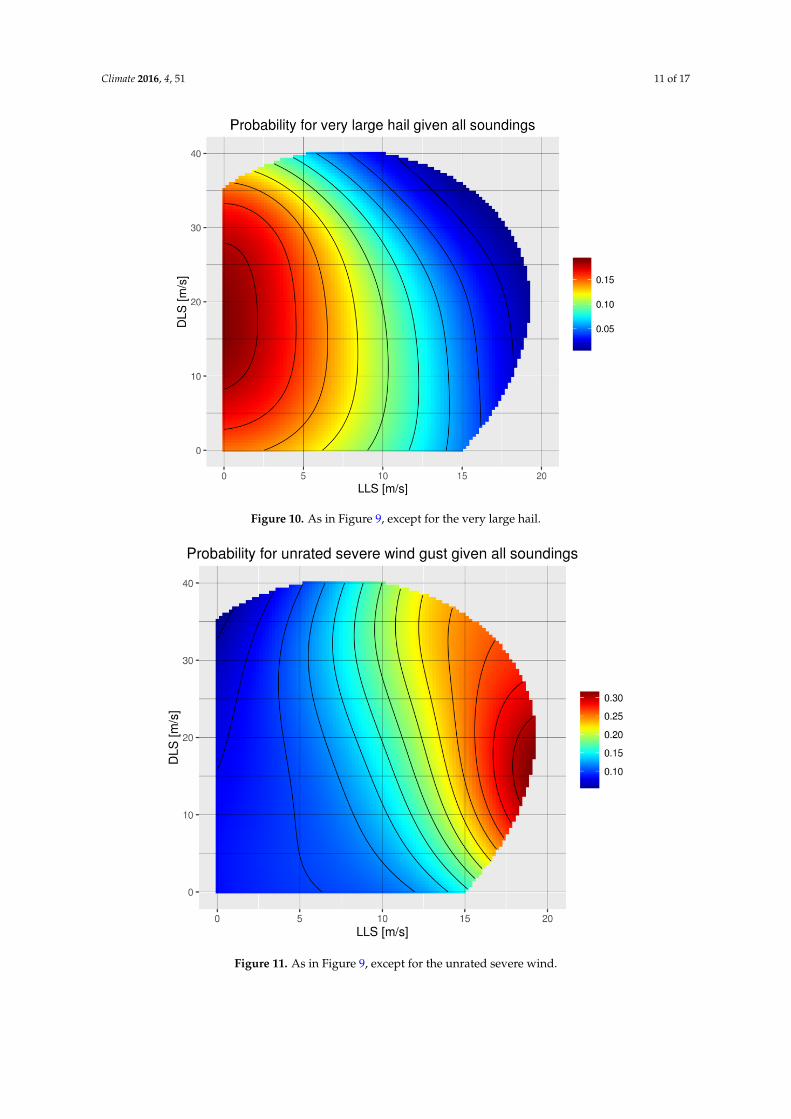
The probability estimates (Figures 9–15) were obtained by computing Kernel Density Estimation(KDE) of the soundings not associated with any severe weather, and the sounding associated witha particular severe weather event (e.g., large hail, severe wind). A bandwidth of 100 × 100 was chosen.We used a smoother of 10 m/s for LLS and 20 m/s DLS to smooth the fields. Then, we divideda particular KDE severe weather field from a non-severe KDE field to obtain probability plots.Due to the smoothing procedures and a small number of sounding measurements in some partof the scatterplot, the results should not be interpreted as a direct probability, but rather as indicatorsof the areas of the chart where particular phenomena are more likely (than in the others) to occur.For example, by comparing charts 8 and 9, it may be noted that very large hail tends to be more likelyto occur in a higher DLS environment. Since each severe weather phenomenon is divided by the sameKDE plot of non-severe soundings, we can conclude that the probability plots are relative to each other.
Climate 2016, 4, 51 11 of 18
Table 1. The statistical significance (p) of the differences between the wind shear means (medians) for the various severe weather events and the particular wind shears. p < 0.05 is bolded. LH, large hail; VLH, very large hail; URV, unrated wind; SV, severe wind; ExtSV, extremely severe wind; T, tornado; TF1+—tornado with rating at least F1.
0–6 km 0–1 km 0–2 km 0–3 km 3–6 km 0–8 km 1–8 kmLH/VLH 0.006 0.441 0.019 0.042 0.913 0.042 0.0496 URV/SV 0.775 0.587 0.403 0.312 0.788 0.073 0.061
URV/ExtSV 0.074 0.244 0.257 0.102 0.985 0.176 0.084 SV/ExtSV 0.210 0.112 0.980 0.857 0.854 0.022 0.010
T/TF1+ 0.0002 0.067 0.0002 0.00001 0.316 0.225 0.752
The probability estimates (Figures 9–15) were obtained by computing Kernel Density Estimation (KDE) of the soundings not associated with any severe weather, and the sounding associated with a particular severe weather event (e.g., large hail, severe wind). A bandwidth of 100x100 was chosen. We used a smoother of 10 m/s for LLS and 20 m/s DLS to smooth the fields. Then, we divided a particular KDE severe weather field from a non-severe KDE field to obtain probability plots. Due to the smoothing procedures and a small number of sounding measurements in some part of the scatterplot, the results should not be interpreted as a direct probability, but rather as indicators of the areas of the chart where particular phenomena are more likely (than in the others) to occur. For example, by comparing charts 8 and 9, it may be noted that very large hail tends to be more likely to occur in a higher DLS environment. Since each severe weather phenomenon is divided by the same KDE plot of non-severe soundings, we can conclude that the probability plots are relative to each other.
Figure 9. Relative frequency of large hail among all of the soundings in the entire database in the LLS (0–1 km bulk wind shear) and DLS (0–6 km bulk wind shear) parameter space. Estimated using the kernel density method.
Figure 9. Relative frequency of large hail among all of the soundings in the entire database in the LLS(0–1 km bulk wind shear) and DLS (0–6 km bulk wind shear) parameter space. Estimated using thekernel density method.
Climate 2016, 4, 51 11 of 17Climate 2016, 4, 51 12 of 18
Figure 10. As in Figure 9, except for the very large hail.
Figure 11. As in Figure 9, except for the unrated severe wind.
Figure 10. As in Figure 9, except for the very large hail.
Climate 2016, 4, 51 12 of 18
Figure 10. As in Figure 9, except for the very large hail.
Figure 11. As in Figure 9, except for the unrated severe wind. Figure 11. As in Figure 9, except for the unrated severe wind.

Climate 2016, 4, 51 12 of 17Climate 2016, 4, 51 13 of 18
Figure 12. As in Figure 9, except for the severe wind.
Figure 13. As in Figure 9, except for the extremely severe wind.
Figure 12. As in Figure 9, except for the severe wind.
Climate 2016, 4, 51 13 of 18
Figure 12. As in Figure 9, except for the severe wind.
Figure 13. As in Figure 9, except for the extremely severe wind. Figure 13. As in Figure 9, except for the extremely severe wind.

Climate 2016, 4, 51 13 of 17Climate 2016, 4, 51 14 of 18
Figure 14. As in Figure 9, except for weak tornadoes.
Figure 15. As in Figure 9, except for significant (F1+) tornadoes.
Figure 14. As in Figure 9, except for weak tornadoes.
Climate 2016, 4, 51 14 of 18
Figure 14. As in Figure 9, except for weak tornadoes.
Figure 15. As in Figure 9, except for significant (F1+) tornadoes. Figure 15. As in Figure 9, except for significant (F1+) tornadoes.

Climate 2016, 4, 51 14 of 17
Large hail (20–49 mm in diameter) is probable at relatively low DLS and LLS values (Figure 9).The probability of its occurrence rises at DLS of about 5 m/s and LLS of 0–2 m/s. At higher values ofLLS and DLS, the large hail probability decreases. Very large hail (≥50 mm in diameter) probabilityshows a one-way increase (Figure 10). It rises only along with the increasing DLS, at relatively low LLS,however, higher LLS does not mean that a storm in a strong LLS environment will not generate verylarge hail. The highest probability of very large hail is concentrated over 11–25 m/s DLS and 0–2 m/sLLS. The severe and unrated wind events present a similar probability distribution (Figures 11 and 12).It suggests that most of the unrated cases meet the severe wind criterion (T1 wind rating). The highestprobability of unrated and severe wind cases occur with DLS of 10–25 m/s and LLS of 18–19 m/s.The occurrence of the severe wind is less probable than of the unrated one. It might result from thelower number of the severe wind cases. The distribution of the probability of extremely severe windis different for the other wind classes. The highest one is for 32–37 m/s DLS and 13–16 m/s LLS.The probability distribution is stretched exclusively to the area of higher LLS and the area of DLSwith the rejected region with low values of both the shears. The relevant discrepancy between theprobability distribution of the weak and F1+ tornado was found (Figures 14 and 15). While weaktornadoes are most probable in the condition of low DLS and low to moderate LLS, F1+ tornadoesare most probable in a strong DLS and moderate LLS environment. The increase in the probabilitydistribution towards lower DLS and higher LLS is observed as well. A low number of the tornadocases (especially in the strong tornado class) could have an impact on the presented results, therefore itshould be treated as an approximate outcome.
4. Discussion
In general, wind events are phenomena involving dozens or hundreds of severe weather reports.Most of them are caused by large convective systems which need higher shear values to exist.In addition, a high wind speed at a low enough level may be utilized to enhance downdraft [35].Large convective systems, producing widespread severe wind gusts, result in a great number of severeweather reports. A very limited number of them involve extremely severe wind. Consequently, there isa great number of severe wind reports and a lower number of extremely severe wind reports existingin the same shear values. Such incidents may be the reason for the little differentiation within the windintensity classes. Therefore, a further study of the maximum rating within a given sounding proximityis desirable. Some of the wind reports with extreme wind speed rating occurred in a relatively lowshear environment. Such cases might occur in the environment with weak shears but high values ofa low level lapse rate and a relatively low dew point temperature. This might be the reason for theinteresting finding of the lower 0–8 km and 1–8 km shears during the extremely severe wind eventsthan during severe cases. DLS is the shear with the most visible increase of its values along with thewind intensity. The LLS values remain the same in all the wind classes, but the wind reports generallyhave admittedly the highest values within all the phenomena. This regularity has not been observedin the 0–8 km and the 1–8 km bulk wind shears, therefore these shears should not be analyzed whileforecasting severe weather.
The largest probability of severe wind gusts in the area with high LLS and DLS is dictated bytwo factors. High DLS results in long-lasting storms (which leads to a large number of weather reports),whereas high LLS leads to downdraft enhancement. Wind reports may also come from smaller stormsin the environment of the low wind shear conditions but strongly favorable thermodynamic conditions.However, such incidents are in the minority. Similarity in the probability distribution of the severewind and the severe unrated wind occurrences suggests that the majority of the unrated weatherreports are related to severe (T1) rating. It is an important finding because more than 75% of all of theanalyzed wind reports are the unrated ones. This result also suggests that the wind damage classifiedmanually by the Skywarn Poland members was generally assessed properly.
Constant LLS values and the increase of DLS values from the large to the very large hail class havetheir origin in very large hail. Very large hail is produced mostly by supercell storms [36] where only

Climate 2016, 4, 51 15 of 17
high DLS is sufficient to engender this type of storm. High LLS is necessary for the tornado formationwithin supercell storms by providing vorticity at low levels. Therefore, the very large hail probabilityrises only together with DLS values, while in the case of the other phenomena such a pattern is notobserved. Some of the hail reports occurred in a relatively low shear environment. Such cases mightoccur in an environment with high CAPE, which provides an updraft strong enough for the largehail formation.
In most of the analyzed shears, the distinctive “gap” between weak tornadoes and F1+ tornadoeswas found. This result meets findings made by [15,31]. The important role of the LLS is highlighted bythe lack of the “gap” between weak and F1+ tornadoes in the 1–8 km and 3–6 km bulk wind shears.This “gap” was observed in all the shears involving ground speed matter. This “gap” is enhancedwhen landspouts and, especially, waterspouts are considered as weak tornadoes and gathered intoone class, rather than treated as an isolated category, as [21] did. Waterspouts create a large percentageof tornadoes in Poland. This kind of tornado originates in substantially different conditions thanstronger tornadoes (highly lower DLS). This may play an important role in the presented results.
5. Conclusions
This study showed that not every bulk wind shear reveals the same pattern along with theincrease in the phenomena intensity. Moreover, not all the analyzed shears allowed for the discussedphenomena to be distinguished. The most commonly used DLS enables us to properly distinguish thephenomena and therefore these shears could be of great importance while forecasting severe weather.The commonly used LLS does not show such a pattern, however, the analysis of LLS and DLS incombination could be of help while analyzing severe convective phenomena. The 0–2 km and 0–3 kmbulk wind shears also allow for us to make a proper differentiation between the given phenomena andtheir intensity. Their values rise along with the intensity of the given phenomenon. The 0–8 km bulkwind shear evens out the differences between the phenomena, while the 3–6 km and the 1–8 km bulkwind shears exhibit the distribution completely different from that characteristic of the shears thatinclude the ground wind speed factor. The values of the 3–6 km and the 1–8 km bulk wind shears inall the analyzed classes are similar. They do not allow for the distinguishing of either the phenomenaor the intensity that are more likely to occur.
Due to the low number of the weather reports and the minor differences between the intensityclasses, there is no statistical significance at the 5% level for most of the wind classes. The hail diameterclasses are significant at the 5% level for the most shears. The 0–1 km and 3–6 km shears did notshow statistical significance for any of the phenomena. It was found that only DLS rises togetherwith the hail diameter, while LLS does not play any role. A significant “gap” in almost all the bulkwind shears between weak and F1+ tornadoes was found. Weak tornadoes are more likely to formin weak and average DLS conditions, while tornadoes with a rating of F1 and greater need a highDLS environment. High or moderate LLS during F1+ tornado events is required as well. The highestprobability of severe wind events occurs during relatively high LLS and DLS, but extremely severewind events need the highest values. The 0–8 km shear should not be used as a tool for recognizing theparticular convective phenomena. The 1–8 km and the 3–6 km bulk wind shears present a completelydifferent distribution within the analyzed phenomena and their intensity. The highest intensity classesin all the analyzed phenomena might be affected by the low number of the selected weather reports.Therefore, future works must focus on determining severe weather probability based on longer periodsof the ESWD data. More severe weather parameters, not only bulk wind shears, should be taken intoconsideration. Shear values might be obtained from other sources, such as reanalysis data. There isa possibility of building models to obtain the probability for the hail size or the tornado strength,but a longer analysis period is indispensable to obtain more statistically significant data. These findingsgenerally show the same pattern as previous studies, which suggests that the majority of the reports’ratings were assessed properly. This is an essential application because of the reporting process madeby the spotter organization.

Climate 2016, 4, 51 16 of 17
Acknowledgments: We thank the reviewers for the constructive suggestions. We also appreciate all the peoplesupporting European Severe Weather Database.
Author Contributions: Igor Laskowski was responsible for the data preparation and the introduction part.Mateusz Taszarek was responsible for the Kernel Density plots generating. Ewa Łupikasza was responsible forthe Box-and-whiskers plots generating and the statistical significance testing. Wojciech Pilorz was responsible forthe manuscript preparation and performed the analysis.
Conflicts of Interest: The authors declare no conflict of interest.
References
1. Doswell, C.A. Severe convective storms—An overview. In Severe Convective Storms; Doswell, C.A., Ed.;American Meteorological Society: Boston, MA, USA, 2001; pp. 1–26.
2. Markowski, P.; Richardson, Y. On the classification of vertical wind shear as directional shear versus speedshear. Weather Forecast. 2006, 21, 242–246. [CrossRef]
3. Glickman, T.S. Glossary of Meteorology, 2nd ed.; American Meteorological Society: Boston, MA, USA, 2000.4. Chisholm, A.J.; Renick, J.H. The Kinematics of Multicell and Supercell Alberta Hailstorms, Alberta Hail Studies;
Research Council of Alberta: Edmonton, AB, Canada, 1972.5. Marwitz, J.D. The structure and motion of severe hailstorms. Part I: Supercell storms. J. Appl. Meteorol. 1972,
11, 166–179. [CrossRef]6. Marwitz, J.D. The structure and motion of severe hailstorms. Part II: Multi-cell storms. J. Appl. Meteorol.
1972, 11, 180–188. [CrossRef]7. Marwitz, J.D. The structure and motion of severe hailstorms. Part III: Severely sheared storms. J. Appl.
Meteorol. 1972, 11, 189–201. [CrossRef]8. Fankhauser, J.C.; Mohr, C.G. Some correlations between various sounding parameters and hailstorm
characterstics in northeast Colorado. In Proceedings of the 10th Conference on Severe Local Storms, Omaha,NE, USA, 18–21 October 1977.
9. Weisman, M.L.; Klemp, J.B. The dependence of numerically simulated convective storms on vertical windshear and buoyancy. Mon. Weather Rev. 1982, 110, 504–520. [CrossRef]
10. Weisman, M.L.; Klemp, J.B. The structure and classification of numerically simulated convective storms indirectionally-varying wind shears. Mon. Weather Rev. 1984, 112, 2479–2498. [CrossRef]
11. Doswell, C.A.; Burgess, D.W. Tornadoes and tornadic storms: A review of conceptual models. In The Tornado:Its Structure, Dynamics, Prediction and Hazards; American Geophysical Union: Washington, DC, USA, 1993;pp. 713–717.
12. Moller, A.R. Severe local storms forecasting. In Severe Convective Storms; Doswell, C.A., Ed.; AmericanMeteorological Society: Boston, MA, USA, 2001; pp. 433–480.
13. Johns, R.H.; Doswell, C.A. Severe local storms forecasting. Weather Forecast. 1992, 7, 588–612. [CrossRef]14. Przybylinski, R.W. The bow echo: Observations, numerical simulations, and severe weather detection
methods. Weather Forecast. 1995, 10, 203–218. [CrossRef]15. Craven, J.P.; Brooks, H.E. Baseline climatology of sounding derived parameters associated with deep moist
convection. Natl. Weather Dig. 2004, 28, 13–24.16. Weisman, M.L. The genesis of severe long-lived bow echoes. J. Atmos. Sci. 1993, 50, 645–670. [CrossRef]17. Brooks, H.E.; Doswell, C.A.; Davies-Jones, R.P. Environmental helicity and the maintenance and evolution of
low-level mesocyclones. Geophys. Monogr. Ser. 1993. [CrossRef]18. Kerr, B.W.; Darkow, G.L. Storm-relative winds and helicity in the tornadic thunderstorm environment.
Weather Forecast. 1996, 11, 489–505. [CrossRef]19. Monteverdi, J.P.; Doswell, C.A.; Lipari, G.S. Shear parameter thresholds for forecasting tornadic
thunderstorms in northern and central California. Weather Forecast. 2003, 18, 357–370. [CrossRef]20. Blanchard, D.O. Supercells in environments with atypical hodographs. Weather Forecast. 2011. [CrossRef]21. Groenemeijer, P.H.; Van Delden, A. Sounding-derived parameters associated with large hail and tornadoes
in the Netherlands. Atmos. Res. 2007. [CrossRef]22. Mohr, S.; Kunz, M. Recent trends and variabilities of convective parameters relevant for hail events in
Germany and Europe. Atmos. Res. 2013. [CrossRef]

Climate 2016, 4, 51 17 of 17
23. Changnon, S.A. Data and approaches for determining hail risk in the contiguous United States.J. Appl. Meteorol. 1999, 38, 1730–1739. [CrossRef]
24. Sioutas, M.; Meaden, T.; Webb, J.D.C. Hail frequency, distribution and intensity in Northern Greece.Atmos. Res. 2009. [CrossRef]
25. Vinet, F. Climatology of hail in France. Atmos. Res. 2001, 56, 309–323. [CrossRef]26. Dotzek, N.; Groenemeijer, P.; Feuerstein, B.; Holzer, A.M. Overview of ESSL’s severe convective storms
research using the European Severe Weather Database ESWD. Atmos. Res. 2009. [CrossRef]27. Groenemeijer, P.H.; Kühne, T. A climatology of tornadoes in Europe: Results from European Severe Weather
Database. Mon. Weather Rev. 2014. [CrossRef]28. Taszarek, M.; Brooks, H.E. Tornado climatology of Poland. Mon. Weather Rev. 2015. [CrossRef]29. Brooks, H.E. Proximity soundings for severe convection for Europe and the United States. Atmos. Res. 2009.
[CrossRef]30. Brooks, H.E. Severe storms and climate change. Atmos. Res. 2013. [CrossRef]31. Taszarek, M.; Kolendowicz, L. Sounding-derived parameters associated with tornado occurrence and
Universal Tornadic Index. Atmos. Res. 2013. [CrossRef]32. Proposed Characterization of Tornadoes and Hurricanes by Area and Intensity. Available online:
https://archive.org/details/nasa_techdoc_19720008829 (accessed on 12 October 2016).33. Stanisz. Biostatystyka; Jagiellonian University Press: Cracow, Poland, 2005. (In Polish)34. Wilks, D.S. Statistical Methods in the Atmospheric Sciences; Elsevier: Amsterdam, The Netherlands, 2006.35. Houze, R.A.; Rutledge, S.A.; Biggerstaff, M.I.; Smull, B.F. Interpretation of Doppler weather radar displays
of midlatitude mesoscale convective systems. Bull. Am. Meteorol. Soc. 1989, 70, 608–619. [CrossRef]36. Knight, C.A.; Knight, N.C. Hailstorms. In Severe Convective Storms; Doswell, C.A., Ed.; American
Meteorological Society: Boston, MA, USA, 2001; pp. 223–248.
© 2016 by the authors; licensee MDPI, Basel, Switzerland. This article is an open accessarticle distributed under the terms and conditions of the Creative Commons Attribution(CC-BY) license (http://creativecommons.org/licenses/by/4.0/).


![1 · Web view[23]H. Mughrabi, H. W. Hoppel Fatigue and microstructure of ultrafine-grained metals produced by severe plastic deformation, Scripta Mater., v. 51, s. 807 – 812 (2004);](https://static.fdocuments.pl/doc/165x107/60b171388b82235ab37b7606/1-web-view-23h-mughrabi-h-w-hoppel-fatigue-and-microstructure-of-ultrafine-grained.jpg)