
0 1-*+ (2$ ,'&,.(3 &'%*, ..(-1#*4 (-( 0 #
6
http://www.jstor.org !"#$%&’ )*+,"-’+&#*. -*/ 01-*+ 2$,’&,. 3&’%*,.. -1#*4 - 0"#/5’+&6&+7 8"-/&,*+ 95+%#":.;< =#* >#,* -*/ 2’#++ ?@ A#11&*. 2#5"’,< B&C#.D E#1@ FGD H#@ ID :2,$@D JKKG;D $$@ GLIMGLF 05N1&.%,/ N7< O1-’CP,11 05N1&.%&*4 #* N,%-1Q #Q H#"/&’ 2#’&,+7 B&C#. 2+-N1, R3?< http://www.jstor.org/stable/3546357 9’’,..,/< LSTLSTULLV UU<LU Your use of the JSTOR archive indicates your acceptance of JSTOR's Terms and Conditions of Use, available at http://www.jstor.org/page/info/about/policies/terms.jsp. JSTOR's Terms and Conditions of Use provides, in part, that unless you have obtained prior permission, you may not download an entire issue of a journal or multiple copies of articles, and you may use content in the JSTOR archive only for your personal, non-commercial use. Please contact the publisher regarding any further use of this work. Publisher contact information may be obtained at http://www.jstor.org/action/showPublisher?publisherCode=black. Each copy of any part of a JSTOR transmission must contain the same copyright notice that appears on the screen or printed page of such transmission. JSTOR is a not-for-profit organization founded in 1995 to build trusted digital archives for scholarship. We enable the scholarly community to preserve their work and the materials they rely upon, and to build a common research platform that promotes the discovery and use of these resources. For more information about JSTOR, please contact [email protected].
Transcript of 0 1-*+ (2$ ,'&,.(3 &'%*, ..(-1#*4 (-( 0 #

http://www.jstor.org
!"#$%&'()*+,"-'+&#*.(-*/(01-*+(2$,'&,.(3&'%*,..(-1#*4(-(0"#/5'+&6&+7(8"-/&,*+95+%#":.;<(=#*(>#,*(-*/(2'#++(?@(A#11&*.2#5"',<(B&C#.D(E#1@(FGD(H#@(ID(:2,$@D(JKKG;D($$@(GLIMGLF05N1&.%,/(N7<(O1-'CP,11(05N1&.%&*4(#*(N,%-1Q(#Q(H#"/&'(2#'&,+7(B&C#.2+-N1,(R3?<(http://www.jstor.org/stable/35463579'',..,/<(LSTLSTULLV(UU<LU
Your use of the JSTOR archive indicates your acceptance of JSTOR's Terms and Conditions of Use, available athttp://www.jstor.org/page/info/about/policies/terms.jsp. JSTOR's Terms and Conditions of Use provides, in part, that unlessyou have obtained prior permission, you may not download an entire issue of a journal or multiple copies of articles, and youmay use content in the JSTOR archive only for your personal, non-commercial use.
Please contact the publisher regarding any further use of this work. Publisher contact information may be obtained athttp://www.jstor.org/action/showPublisher?publisherCode=black.
Each copy of any part of a JSTOR transmission must contain the same copyright notice that appears on the screen or printedpage of such transmission.
JSTOR is a not-for-profit organization founded in 1995 to build trusted digital archives for scholarship. We enable thescholarly community to preserve their work and the materials they rely upon, and to build a common research platform thatpromotes the discovery and use of these resources. For more information about JSTOR, please contact [email protected].

FORUM FORUM
FORUM
FORUM is intended for new ideas or new ways of interpreting existing information. It provides a chance for suggesting hypotheses and for challenging current thinking on ecological issues. A lighter prose, designed to attract readers, will be permitted. Formal research reports, albeit short, will not be accepted, and all contributions should be concise with a relatively short list of references. A summary is not required.
Trophic interactions and plant species richness along a productivity gradient
Jon Moen, Dept of Biological Sciences, Idaho State Univ., Pocatello, ID 83201, USA (present address: Dept of Ecological Botany, Umea Univ., S-901 87 Umea, Sweden ([email protected])) and Scott L. Collins, Div. of Environmental Biology, Rm 635, National Science Foundation, Arlington, VA 22230, USA.
We analyzed the interactive effects of trophic structure and disturbance on species diversity of plant communities along a productivity gradient by merging the intermediate disturbance hypothesis with a simple three-trophic-level predator-prey model. In two-trophic-level systems, i.e. without carnivores, the model produces a unimodal, hump-shaped pattern of species richness, which is consistent with patterns predicted from other models. If carnivores are included, trophic cascades produce a bimodal pattern of species richness over the productivity gradient. We have found no appropriate data sets in the literature with which to assess the validity of our model. We thus offer the model as an alternative hypothesis to be tested regarding plant species richness in productivity gradients, and as a reminder of the importance of trophic structure for patterns and processes in plant communities.
One of the recurrent themes in ecology is the search to explain patterns of variations in species diversity be- tween different areas and along environmental gradi- ents. To date, much research regarding species diversity along gradients has focused on single factor causation, such as the relationship between diversity and produc- tivity (Grime 1973, Tilman 1982, Rosenzweig and Abramsky 1993) or diversity and disturbance (Connell 1978, Abugov 1982, Petraitis et al. 1989). Theoretical analyses generally demonstrate that diversity, often measured as species richness, varies in a unimodal, hump-shaped pattern with both productivity (Grime 1979, Tilman 1982, Huston and DeAngelis 1994) and disturbance (Connell 1978, Huston 1979, Abugov 1982). That is, diversity reaches a maximum at some intermediate level of productivity or disturbance. This unimodal pattern results primarily from the differential effects of competition along the gradient, although the specific mechanisms of competitive interactions differ among the various models (Rosenzweig and Abramsky 1993; see Abrams [1995] for a discussion on the evi- dence for a unimodal diversity curve and an argument for monotonically increasing curves).
One of the limitations of these analyses is that they do not explicitly consider the effects of trophic structure on diversity along gradients. As noted by Grime (1979), Huston (1979), and Menge and Sutherland (1987), dis- turbance and competition interact to different degrees along environmental gradients. In addition, the number of trophic levels and complexity increase as productiv- ity and space increase (Oksanen et al. 1981, Pimm 1982, Schoener 1989). As food web complexity increases, trophic cascades (or top-down effects) may alter com- petitive interactions and thus affect species diversity at lower levels. For example, McLaren and Peterson (1994) demonstrated that boreal forest vegetation could only respond to climate variability when top carnivores were present to control herbivores. Also, trophic cascades have been documented in lakes and rivers (Carpenter and Kitchell 1988, Power 1990). Thus, top- down forces impose constraints on the structure of producer communities.
Despite the considerable recent interest in trophic cascades and bottom-up versus top-down forces, few studies have considered the impacts of these phenom- ena on species diversity. In order to show that trophic interactions may affect patterns in plant species diver- sity, we used two of the simplest models we could think of: 1) a three-trophic-level predator-prey model similar to that used by Oksanen et al. (1981), and 2) a simple quadratic regression of the relationship between species richness and grazing pressure similar to the intermedi- ate disturbance hypothesis (Connell 1978). If these, much oversimplified, models show interesting patterns, we deem it likely that more realistic models (and nature itself, of course) may also show intriguing patterns of diversity in relation to trophic structure. With this note we would thus like to point out the potential impor- tance of the interactive effects of trophic structure and disturbance on species diversity of plant communities along a productivity gradient.
OIKOS 76:3 (1996) 603
Tri-trophic interactions We modeled the interactions between plants, herbivores and predators according to Fretwell (1977) and Ok- sanen et al. (1981). Their argument follows Hairston et al. (1960) who hypothesized that herbivores are gener- ally regulated by predators. Although this notion is still controversial, there is increasing evidence that top-down factors provide important constraints on community structure (Persson et al. 1988, McLaren and Peterson 1994, Schmitz 1995). Fretwell (1977) extended Hairston et al.'s argument to gradients in primary productivity. He stated a verbal argument, later formalized by Ok- sanen et al. (1981), that the number of trophic levels is dependent on primary productivity. The higher the productivity, the more functional trophic levels in the system. In extremely unproductive areas, primary pro- duction is assumed to be too low to sustain herbivores, and the "food chain" consists of one functional trophic level: plants. In the absence of disturbance, the plants are then predicted to eventually deplete their resources and thus compete. In moderately productive areas, plant production is high enough to sustain herbivores, albeit at low population densities. These densities may be lower than what is needed for efficient predators to have a positive growth rate. The food chain then con- sists of two functional trophic levels: plants and herbi- vores. Uncontrolled by predation, these herbivores are predicted to exert a strong grazing pressure on the vegetation. In productive areas, primary production is high enough to sustain both herbivores and predators. With the herbivores regulated by predators, the plant communities should again experience lower grazing pressure. The model thus predicts strong grazing pres- sure at intermediate levels of productivity.
We used a set of simple equations describing preda- tor-prey interactions in three trophic levels: plants (P), herbivores (H), and predators (C). The equations were as follows:
the herbivore functional response. g is the conversion efficiency between prey and offspring for the predators, while p and v are the mortality rates without food for herbivores and predators, respectively.
The equation set was solved analytically to obtain equilibrium solutions. Three solutions were chosen with 1) only plants present, 2) plants and herbivores present, and 3) all three trophic levels present. The break point for K where the system changes from one trophic level to two trophic levels was determined by solving the equilibrium herbivore equation for K when the system has two trophic levels. The break point for K where the system changes from two trophic levels to three was determined by solving the equilibrium predator equa- tion for K.
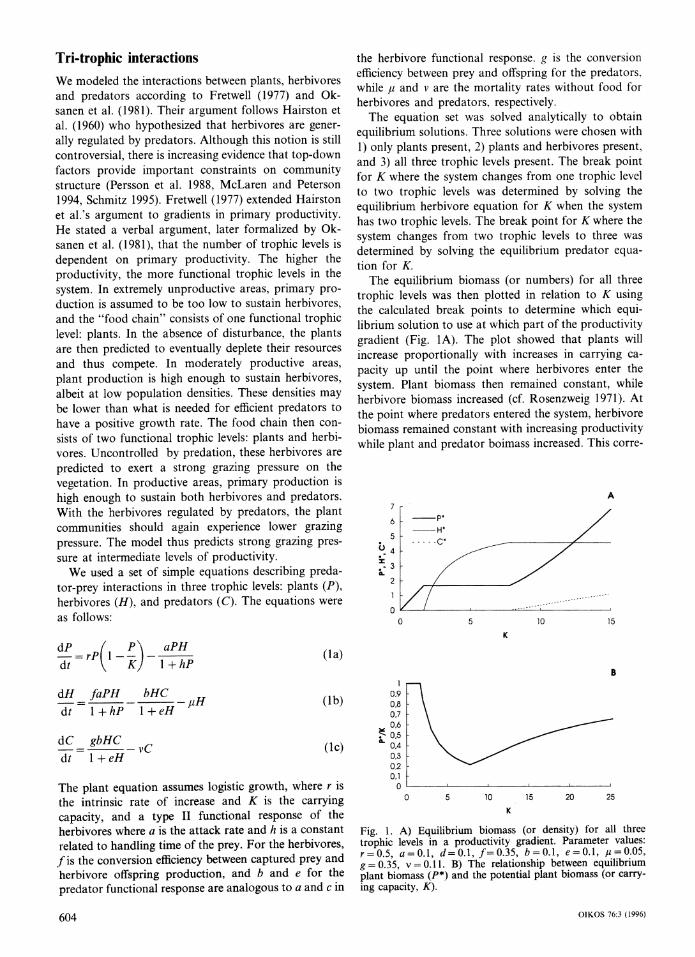
The equilibrium biomass (or numbers) for all three trophic levels was then plotted in relation to K using the calculated break points to determine which equi- librium solution to use at which part of the productivity gradient (Fig. 1A). The plot showed that plants will increase proportionally with increases in carrying ca- pacity up until the point where herbivores enter the system. Plant biomass then remained constant, while herbivore biomass increased (cf. Rosenzweig 1971). At the point where predators entered the system, herbivore biomass remained constant with increasing productivity while plant and predator boimass increased. This corre-
A 7
6
5
b4 . 4
-3
2
1
0 10 15
K dP rP( p aPH dt 1K + hP
dH faPH bHC dt 1 +hP 1 +eH
dC gbHC _ dt 1 +eH
(la) B
0,9 (lb) 0.8
0,7 y 0,6 - 0,5
(Ic) 0.,4 0,3 0,2 0,1
The plant equation assumes logistic growth, where r is the intrinsic rate of increase and K is the carrying capacity, and a type II functional response of the herbivores where a is the attack rate and h is a constant related to handling time of the prey. For the herbivores, f is the conversion efficiency between captured prey and herbivore offspring production, and b and e for the predator functional response are analogous to a and c in
0 0 10 15 20 25
Fig. 1. A) Equilibrium biomass (or density) for all three trophic levels in a productivity gradient. Parameter values: r=0.5, a=0.1, d=0.1, f=0.35, b=0.1, e=0.1, #=0.05, g =0.35, v=0.11. B) The relationship between equilibrium plant biomass (P*) and the potential plant biomass (or carry- ing capacity, K).
OIKOS 76:3 (1996) 604
sponds with the qualitative predictions of the Fretwell (1977) and Oksanen et al. (1981) models.
The ratio between the equilibrium plant biomass curve in Fig. 1, i.e. P*, and the potential plant biomass in the absence of consumers, i.e. K, was calculated as a measure of the decrease in equilibrium plant biomass due to grazing along the gradient (the inverse of grazing intensity; Fig. 1B). The ratio may vary between 0 and 1, and it showed a strong decrease in plant biomass as herbivores enter the system, and a subsequent release as predators decrease the net growth of the herbivores. This ratio will be used as an index of grazing pressure along the productivity gradient with 1 being no grazing and 0 being high grazing.
Grazing and species richness Several authors have suggested a bell-shaped relation- ship between grazing and prey species richness. Lubchenco (1978) found that grazing by a snail on algae in tide pools produced the highest algal species richness at intermediate levels of snail densities when the snail fed on the competitive dominant algae. Milchunas et al. (1988) discussed the interactions be- tween environmental moisture ("productivity") and the evolutionary history of grazing in grasslands, and they argued that the relationship between grazing intensity and species richness should be bell-shaped except in semi-arid grasslands with a long evolutionary history of grazing. In these latter areas, grazing will not produce the mosaic of growth forms that they suggest are responsible for the bell-shaped pattern because compe- tition is mainly for soil resources and grazing does not cause a shift in competitive interactions between light and nutrients. Also, in systems with a long history of grazing, herbivore pressure has selected for rapid re- growth which yields only a short period of relaxed competitive interactions following defoliation. Further, Caswell (1978) showed in a theoretical model that 'predator-mediated coexistence' of prey species is highly probable in non-equilibrium systems where transient behavior may persist for extremely long periods of time.
The Intermediate Disturbance Hypothesis (IDH) can provide a more generalized conceptual framework for incorporating the effects of trophic interactions along productivity gradients (Grime 1973, Connell 1978, Pe- traitis et al. 1989, Collins et al. 1996). IDH states that species richness should be the highest at intermediate levels of disturbance. When disturbance is infrequent, dominant species occupy resources and eliminate weak competitors. If disturbance occurs too frequently, rich- ness decreases because species intolerant to disturbance become locally extinct. Intermediate levels of distur- bance create spatio-temporal heterogeneity that favors species coexistence by freeing limiting resources and allowing continued recruitment and persistence of spe-
35-
30 -
? 25
c" 10
5 -
0
0 0,2 0,4 0,6 0,8 1
P*/K
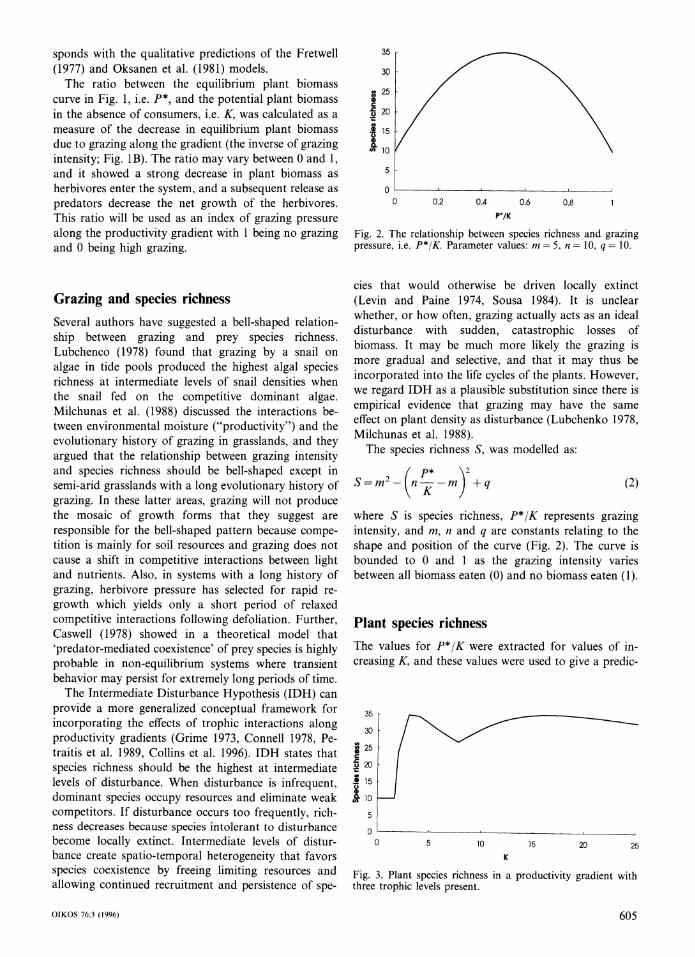
Fig. 2. The relationship between species richness and grazing pressure, i.e. P*/K. Parameter values: m = 5, n = 10, q = 10.
cies that would otherwise be driven locally extinct (Levin and Paine 1974, Sousa 1984). It is unclear whether, or how often, grazing actually acts as an ideal disturbance with sudden, catastrophic losses of biomass. It may be much more likely the grazing is more gradual and selective, and that it may thus be incorporated into the life cycles of the plants. However, we regard IDH as a plausible substitution since there is empirical evidence that grazing may have the same effect on plant density as disturbance (Lubchenko 1978, Milchunas et al. 1988).
The species richness S, was modelled as:
p* 2 S=m2--n --m +q K (2)
where S is species richness, P*/K represents grazing intensity, and m, n and q are constants relating to the shape and position of the curve (Fig. 2). The curve is bounded to 0 and 1 as the grazing intensity varies between all biomass eaten (0) and no biomass eaten (1).
Plant species richness The values for P*/K were extracted for values of in- creasing K, and these values were used to give a predic-
35
30
[ 25
o 20
.! 15
Q 10
5
0 0 10 15 20 25
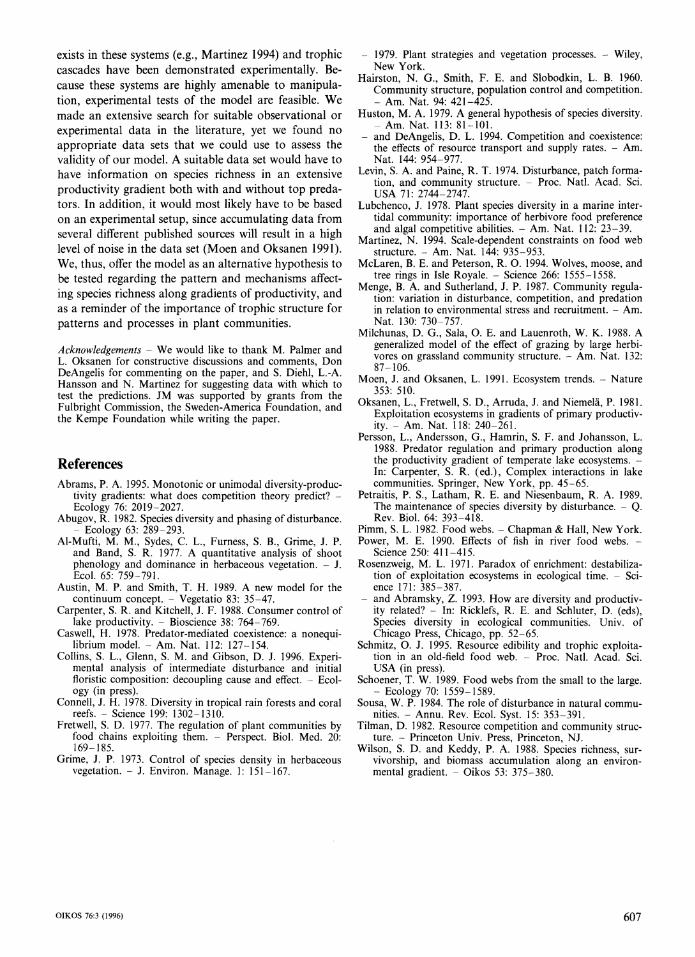
Fig. 3. Plant species richness three trophic levels present.
in a productivity gradient with
OIKOS 76:3 (1996) 605

tion of plant species richness along the productivity gradient (Fig. 3). Unlike other models of species rich- ness along productivity gradients, by explicitly incorpo- rating disturbance and trophic structure, our model produces a species richness curve that is bimodal (Fig. 3). Species richness is low when productivity is low, and richness increases rapidly as grazing reduces dominance and allows grazing-adapted plants to establish. S then drops off as grazing pressure increases. However, when predators enter the system, grazing pressure again de- creases and S increases producing a bimodal distribu- tion of species richness. Austin and Smith (1989) also argue for a similar pattern of species richness along an environmental gradient on the grounds that any gradi- ent has two extremes of stress which cannot be col- lapsed into a single stress value. However, they do not provide any analytical or observational support for their claim.
The qualitative pattern of our model is robust to changes in the parameters or variations in the structure of the model. However, it requires a zone of heavy grazing pressure in the productivity gradient so that P*/K moves over the hump in Fig. 2, followed by a decrease in grazing pressure. This could be accom- plished with any number of sets of predator-prey equa- tions and parameter values. The quantitative pattern will of course be dependent on the shape of the curves and thus on the exact equations and parameter values used.
A system without predators In general, studies of plant species richness along pro- ductivity gradients in terrestrial communities have been conducted in systems without predators. In such sys- tems, diversity is generally highest at intermediate levels of productivity (Al-Mufti et al. 1977, Wilson and Keddy 1988). Mechanisms producing this pattern are generally assumed to be stress at the low end of the gradient and competition at the more productive end of the gradient (e.g., Grime 1979). Our model produces this pattern if we assume that the system is without predators. Equilibrium plant biomass will remain con- stant after herbivores enter the system (Fig. 4A), and the decrease of plant biomass in relation to K will approach an asymptote set by the intake rate of the herbivores (Fig. 4B). The species richness curve for the plants along the productivity gradient will show the familiar unimodal distribution (Fig. 4C).
Testing the model Our model incorporates some ecological realism by building trophic structure and disturbance into the relationship between species richness and productivity,
A 6
5
4
I -3
2
1
0 5 10 15
K
B
0,9 0,8 0,7 0,6
" 0,5 0,4 0,3 0,2 0,1
0 0 5 10 15 20 25
C 35
30
| 25 . 20
$ 15
10
5
0 10 15 20 25
Fig. 4. A) Plant and herbivore equilibrium biomass (or den- sity) in a system without predators. Parameters as in Fig. 1. B) the relationship between P* and K. C) Plant species richness in a productivity gradient without predators.
and our model results clearly differ from those of previous models (Huston 1979, Tilman 1982) and em- pirical field studies (Al-Mufti et al. 1977, Wilson and Keddy 1988). However, in the absence of a complex trophic structure (i.e. with only two trophic levels), our model yields the familiar peak in species richness at intermediate levels of productivity. Field studies in terrestrial systems that explicitly incorporate the devel- opment of trophic structure over fairly extensive pro- ductivity gradients are uncommon, and the trophic structure in these systems has been highly modified by the dramatic decline in most large predator popula- tions. In addition, most studies do not include an independent assessment of productivity, such as a direct measurement of net primary production. Thus, terres- trial systems may no longer provide a suitable labora- tory for testing the model. We believe that aquatic systems may provide an ideal venue with which to test these models because complex trophic structure still
OIKOS 76:3 (1996)
Hf
U I I.
606
exists in these systems (e.g., Martinez 1994) and trophic cascades have been demonstrated experimentally. Be- cause these systems are highly amenable to manipula- tion, experimental tests of the model are feasible. We made an extensive search for suitable observational or experimental data in the literature, yet we found no appropriate data sets that we could use to assess the validity of our model. A suitable data set would have to have information on species richness in an extensive productivity gradient both with and without top preda- tors. In addition, it would most likely have to be based on an experimental setup, since accumulating data from several different published sources will result in a high level of noise in the data set (Moen and Oksanen 1991). We, thus, offer the model as an alternative hypothesis to be tested regarding the pattern and mechanisms affect- ing species richness along gradients of productivity, and as a reminder of the importance of trophic structure for patterns and processes in plant communities.
Acknowledgements - We would like to thank M. Palmer and L. Oksanen for constructive discussions and comments, Don DeAngelis for commenting on the paper, and S. Diehl, L.-A. Hansson and N. Martinez for suggesting data with which to test the predictions. JM was supported by grants from the Fulbright Commission, the Sweden-America Foundation, and the Kempe Foundation while writing the paper.
References Abrams, P. A. 1995. Monotonic or unimodal diversity-produc-
tivity gradients: what does competition theory predict? - Ecology 76: 2019-2027.
Abugov, R. 1982. Species diversity and phasing of disturbance. - Ecology 63: 289-293.
Al-Mufti, M. M., Sydes, C. L., Furness, S. B., Grime, J. P. and Band, S. R. 1977. A quantitative analysis of shoot phenology and dominance in herbaceous vegetation. - J. Ecol. 65: 759-791.
Austin, M. P. and Smith, T. H. 1989. A new model for the continuum concept. - Vegetatio 83: 35-47.
Carpenter, S. R. and Kitchell, J. F. 1988. Consumer control of lake productivity. - Bioscience 38: 764-769.
Caswell, H. 1978. Predator-mediated coexistence: a nonequi- librium model. - Am. Nat. 112: 127-154.
Collins, S. L., Glenn, S. M. and Gibson, D. J. 1996. Experi- mental analysis of intermediate disturbance and initial floristic composition: decoupling cause and effect. - Ecol- ogy (in press).
Connell, J. H. 1978. Diversity in tropical rain forests and coral reefs. - Science 199: 1302-1310.
Fretwell, S. D. 1977. The regulation of plant communities by food chains exploiting them. - Perspect. Biol. Med. 20: 169-185.
Grime, J. P. 1973. Control of species density in herbaceous vegetation. - J. Environ. Manage. 1: 151-167.
- 1979. Plant strategies and vegetation processes. - Wiley, New York.
Hairston, N. G., Smith, F. E. and Slobodkin, L. B. 1960. Community structure, population control and competition. - Am. Nat. 94: 421-425.
Huston, M. A. 1979. A general hypothesis of species diversity. - Am. Nat. 113: 81-101.
- and DeAngelis, D. L. 1994. Competition and coexistence: the effects of resource transport and supply rates. - Am. Nat. 144: 954-977.
Levin, S. A. and Paine, R. T. 1974. Disturbance, patch forma- tion, and community structure. - Proc. Natl. Acad. Sci. USA 71: 2744-2747.
Lubchenco, J. 1978. Plant species diversity in a marine inter- tidal community: importance of herbivore food preference and algal competitive abilities. - Am. Nat. 112: 23-39.
Martinez, N. 1994. Scale-dependent constraints on food web structure. - Am. Nat. 144: 935-953.
McLaren, B. E. and Peterson, R. 0. 1994. Wolves, moose, and tree rings in Isle Royale. - Science 266: 1555-1558.
Menge, B. A. and Sutherland, J. P. 1987. Community regula- tion: variation in disturbance, competition, and predation in relation to environmental stress and recruitment. - Am. Nat. 130: 730-757.
Milchunas, D. G., Sala, 0. E. and Lauenroth, W. K. 1988. A generalized model of the effect of grazing by large herbi- vores on grassland community structure. - Am. Nat. 132: 87-106.
Moen, J. and Oksanen, L. 1991. Ecosystem trends. - Nature 353: 510.
Oksanen, L., Fretwell, S. D., Arruda, J. and Niemeli, P. 1981. Exploitation ecosystems in gradients of primary productiv- ity. - Am. Nat. 118: 240-261.
Persson, L., Andersson, G., Hamrin, S. F. and Johansson, L. 1988. Predator regulation and primary production along the productivity gradient of temperate lake ecosystems. - In: Carpenter, S. R. (ed.), Complex interactions in lake communities. Springer, New York, pp. 45-65.
Petraitis, P. S., Latham, R. E. and Niesenbaum, R. A. 1989. The maintenance of species diversity by disturbance. - Q. Rev. Biol. 64: 393-418.
Pimm, S. L. 1982. Food webs. - Chapman & Hall, New York. Power, M. E. 1990. Effects of fish in river food webs. -
Science 250: 411-415. Rosenzweig, M. L. 1971. Paradox of enrichment: destabiliza-
tion of exploitation ecosystems in ecological time. - Sci- ence 171: 385-387.
- and Abramsky, Z. 1993. How are diversity and productiv- ity related? - In: Ricklefs, R. E. and Schluter, D. (eds), Species diversity in ecological communities. Univ. of Chicago Press, Chicago, pp. 52-65.
Schmitz, 0. J. 1995. Resource edibility and trophic exploita- tion in an old-field food web. - Proc. Natl. Acad. Sci. USA (in press).
Schoener, T. W. 1989. Food webs from the small to the large. - Ecology 70: 1559-1589. Sousa, W. P. 1984. The role of disturbance in natural commu-
nities. - Annu. Rev. Ecol. Syst. 15: 353-391. Tilman, D. 1982. Resource competition and community struc-
ture. - Princeton Univ. Press, Princeton, NJ. Wilson, S. D. and Keddy, P. A. 1988. Species richness, sur-
vivorship, and biomass accumulation along an environ- mental gradient. - Oikos 53: 375-380.
OIKOS 76:3 (1996) 607


![...2 iX" % $ Z 2 ' = 1 P + % ! F $ d ( 1 + , Z % 0 0 4 # i5 \ 4 - % # , 4 0 , ( , 1 . \ v v 0 2 0 % $ ! H * ( 3 2 _ 0 F $ 2 # . + % 1 ] 0 , x #W ! 1 I # % 1 i# = h , F $. = !0 $ %](https://static.fdocuments.pl/doc/165x107/60a035cab9335f09b94efb40/-2-ix-z-2-1-p-f-d-1-z-0-0-4-i5-4-4.jpg)