Raport roczny Annual report - Rawlplug · zynowych oraz usprawnienia procesu logistycznego. Został...
62
Transcript of Raport roczny Annual report - Rawlplug · zynowych oraz usprawnienia procesu logistycznego. Został...
Raport rocznyAnnual report2006


List of contents
4 Letter from the President of the Board
6 Characteristics of the Capital Group
3 Group’s formation
3 composition of the Capital Group
8 Shareholding structure
3 current shareholding
10 Parent company's management
3 management board
3 supervisory board
3 shares held by the members of the management
of the parent company
14 Sales and supply
3 the group’s core business
18 The business structure of KOELNER Group
20 Markets
3 domestic market
3 foreign markets
3 seasonal character of sales
3 supply sources
24 Development strategy
28 Investments
3 Group’s investments
30 Employees
32 Transactions between related parties
32 Information on loans granted, securities and
guarantees and credit taken
34 Important agreements
36 Financial results
3 profitability indicator
3 liquidity indicators
3 inventory
3 debt indicators
42 Authorised entity
to audit financial statements
44 Corporate governance
46 Information on the audit of the RAWLPLUG Ltd
Capital Group
48 Financial statement
3 expert auditor’s opinion
60 KOELNER SA worldwide
Spis treści
5 List Prezesa Zarządu
6 Charakterystyka Grupy Kapitałowej
3 kształtowanie się Grupy
3 skład Grupy Kapitałowej
9 Struktura akcjonariatu
3 aktualny akcjonariat
11 Władze Spółki Dominującej
3 Zarząd
3 Rada Nadzorcza
3 akcje w posiadaniu członków władz Spółki
Dominującej
15 Sprzedaż i zaopatrzenie
3 przedmiot działalności Grupy
19 Struktura biznesowa Grupy KOELNER
21 Rynki zbytu
3 krajowe
3 zagraniczne
3 sezonowość sprzedaży
3 źródła zaopatrzenia
25 Strategia rozwoju
29 Inwestycje
3 inwestycje Grupy
31 Kadry
33 Zawarcie przez podmioty z Grupy transakcji
z podmiotami powiązanymi
33 Informacja o udzielonych pożyczkach,
poręczeniach i gwarancjach oraz zaciągniętych
kredytach
35 Znaczące umowy
37 Wyniki finansowe
3 wskaźniki rentowności
3 wskaźniki płynności
3 zapasy
3 wskaźniki zadłużenia
43 Informacja o podmiocie uprawnionym
do badania sprawozdań finansowych
45 Zasady ładu korporacyjnego
47 Informacja na temat audytu Grupy Kapitałowej
RAWLPLUG Ltd
49 Sprawozdanie finansowe
3 opinia niezależnego biegłego rewidenta
60 KOELNER SA na świecie
annualreport
4
Dear Sir or Madam,
It is a great pleasure for me to present
a review of 2006 to you.
Last year was a time of hard work within our Group, as well as a time of expansion to new markets.
In our Group we focused on some of the most important activities chiefly influencing our
financial results, such as: increase of manufacturing capacities, improvement of logistics, and
possibly the most complete consolidation of all organisational structures.
The increasing demand for our products forces us to continuously develop and modernise our
machine plant. Undoubtedly, the one we already have is one of the most modern machine plants.
Combined with our own research and development activities we are positioned in the lead of
European producers.
Due to the increase of the manufacturing capacities, we face the necessity to extend the storage
area and improve the logistics process. A warehouse of 4 600 m2 was commissioned and the
construction works of a new 3 000 m2 facility began. These actions will contribute to the higher
availability of production resources and goods. What is more, we began implementing the Qguar
system to operate the storage processes.
One of the crucial tasks which we faced in 2006 was the internal consolidation of the Group. By
this I mean the standardisation of the ordering procedures, i.e. the consolidation of the purchase
departments comprising the Group production planning, distribution, and finances. The aim is
to reduce the costs and improve the operation of all departments.
In 2006 the territorial scope of the Group expanded. We created trade companies in the United
Arab Emirates, Kazakhstan, and Sweden. Moreover, we purchased a significant block of shares
in the ŚRUBEX SA. Production Plant.
I would like to thank all the investors for their trust placed in us and to assure them that we will
continue to develop the Group with the same intensity. I also hope that our effort will be
reflected in the value of our shares. 3
Radosław Koelner
President of the Management Board
5 raportroczny
Szanowni Państwo!
Mam wielką przyjemność przedstawić Państwu podsumowanie 2006 roku.
Miniony rok upłynął na wytężonej pracy zarówno wewnątrz naszej Grupy, jak i nad poszerzaniem
jej o nowe rynki zbytu.
Wewnątrz Grupy skupiliśmy się na kilku najważniejszych aktywnościach, które mają największy
wpływ na osiągane wyniki finansowe. Należą do nich: zwiększenie mocy produkcyjnych, uspraw-
nienie logistyki oraz możliwie najpełniejsza konsolidacja wszystkich struktur organizacyjnych.
Zwiększający się popyt na nasze produkty sprawia, że stale musimy rozbudowywać i unowo-
cześniać park maszynowy. Bez wątpienia ten, który posiadamy aktualnie, jest jednym z najno-
wocześniejszych, co – w połączeniu z własnymi działami badawczo-rozwojowymi – stawia nas
w czołówce producentów europejskich.
Wraz ze wzrostem mocy produkcyjnych nastąpiła konieczność zwiększenia powierzchni maga-
zynowych oraz usprawnienia procesu logistycznego. Został oddany do użytku magazyn o powierzchni
4 600 m2 oraz rozpoczęto prace nad kolejnym – o powierzchni 3 000 m2, co w znacznym stopniu
przyczyni się do wzrostu dostępności zarówno surowców produkcyjnych, jak i towarów hand-
lowych. Dodatkowo, rozpoczęliśmy wdrażanie systemu informatycznego obsługującego pro-
cesy magazynowe Qguar.
Do istotnych zadań postawionych przed nami w 2006 roku zaliczyć należy również konsolida-
cję wewnętrznej organizacji Grupy. Mam tu na myśli ujednolicenie procedur zamówień, a więc
konsolidację działów zakupów spółek wchodzących w skład Grupy, planowania produkcji, dys-
trybucji oraz finansów. Celem takiego działania jest redukcja kosztów oraz usprawnienie dzia-
łania wszystkich działów.
W 2006 roku powiększył się zasięg terytorialny naszej Grupy. Utworzyliśmy spółki handlowe
w Zjednoczonych Emiratach Arabskich, Kazachstanie oraz Szwecji. Dodatkowo nabyliśmy
znaczny pakiet akcji w fabryce śrub ŚRUBEX SA.
Dziękując wszystkim inwestorom za zaufanie, jakim nas obdarzyli, pragnę zapewnić, że prowa-
dzone prace nad rozwojem Grupy będą kontynuowane z równą intensywnością jak dotychczas.
Równocześnie mam nadzieję, że ten wysiłek znajdzie odzwierciedlenie w wartości naszych akcji. 3
Radosław Koelner
Prezes Zarządu
annualreport
6
KSZTAŁTOWANIE SIĘ GRUPYSPÓŁKA DOMINUJĄCA
Spółka KOELNER SA została zarejestrowana 20 grudnia 1999 r. w dziale B rejestru
handlowego pod numerem 9101. Aktualnie Spółka zarejestrowana jest pod numerem
KRS 33537. Założycielami Spółki byli: Krystyna, Przemysław i Radosław Koelner. Przed-
miotem działalności Spółki jest projektowanie, wytwarzanie oraz sprzedaż, głównie
przez hurtowe kanały dystrybucji, następujących grup asortymentowych:
4 mocowań budowlanych,
4 narzędzi ręcznych oraz elektronarzędzi,
4 normalii śrubowych.
GROUP’S FORMATIONPARENT COMPANY
The company KOELNER SA was registered on the 20 December 1999 in the B section of the
commercial register under the number 9101. At the moment the Company is registered under
the number KRS 33537. Its founders were: Krystyna, Przemysław and Radosław Koelner. The
market objective of the Company is the design, production and sale (mainly wholesale) of the
products of the following groups:
4 construction fastenings,
4 manual and electric tools,
4 standardised screws.
CHARACTERISTICS OFTHE CAPITAL GROUP
CHARAKTERYSTYKAGRUPY KAPITAŁOWEJ
7 raportroczny
RAWLPLUG Ltd
RAWLPLUG Ireland Ltd
RAWL France S.a.r.l.
KOELNER Centrum Sp. z o.o. 51%
KOELNER Górny Śląsk Sp. z o.o. 100%
FPiN WAPIENICA Sp. z o.o. 99,97%
100%
KOELNER Hungária Kft 51%
KOELNER Kazakhstan Ltd* 70%
KOELNER CZ SRO100%
KOELNER Bulgaria EOOD100%
SC KOELNER Romania SRL100%
UAB KOELNER Vilnius100%
TOW KOELNER Kiev99%
KOELNER Ltd84,33%
ŚRUBEX SA19,99%
KOELNER – RAWLPLUG Middle-East*100%
RAWL Scandinavia AB* 100%
100%
100%
100%
KOELNER Deutschland GmbH 100%
KOELNER Tworzywa Sztuczne Sp. z o.o.
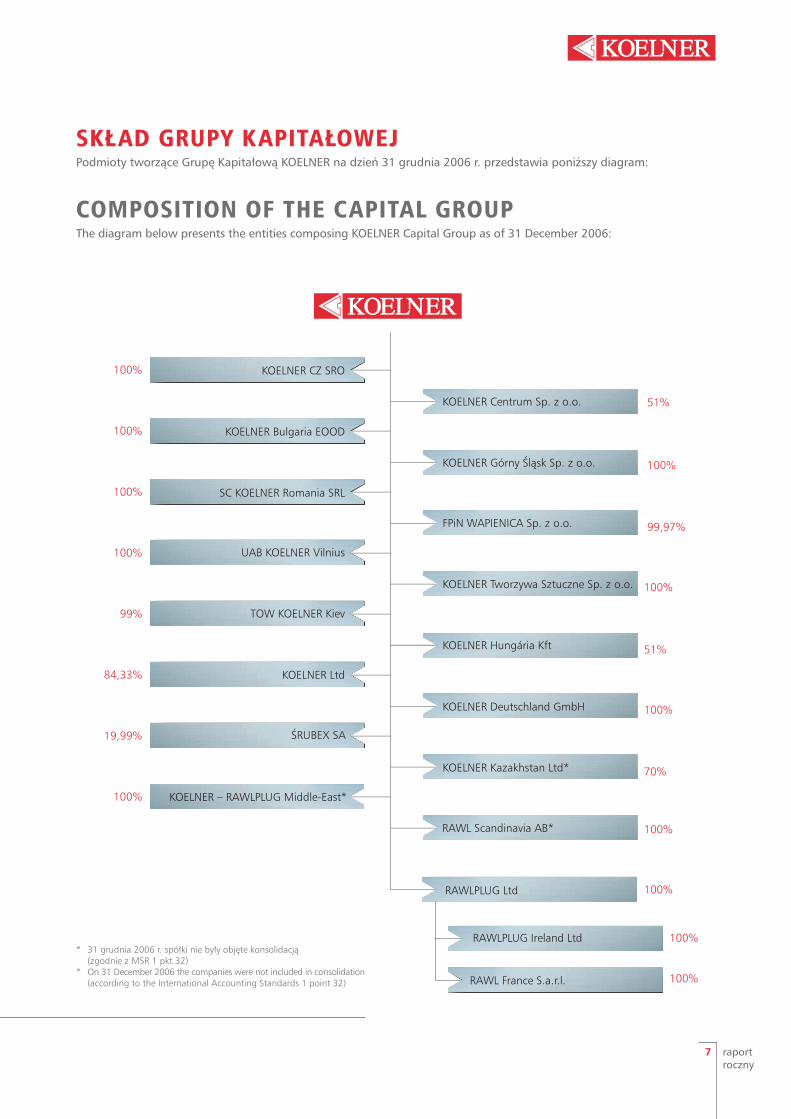
SKŁAD GRUPY KAPITAŁOWEJPodmioty tworzące Grupę Kapitałową KOELNER na dzień 31 grudnia 2006 r. przedstawia poniższy diagram:
COMPOSITION OF THE CAPITAL GROUPThe diagram below presents the entities composing KOELNER Capital Group as of 31 December 2006:
* 31 grudnia 2006 r. spółki nie były objęte konsolidacją (zgodnie z MSR 1 pkt 32)
* On 31 December 2006 the companies were not included in consolidation(according to the International Accounting Standards 1 point 32)
SHAREHOLDING STRUCTURE
annualreport
8
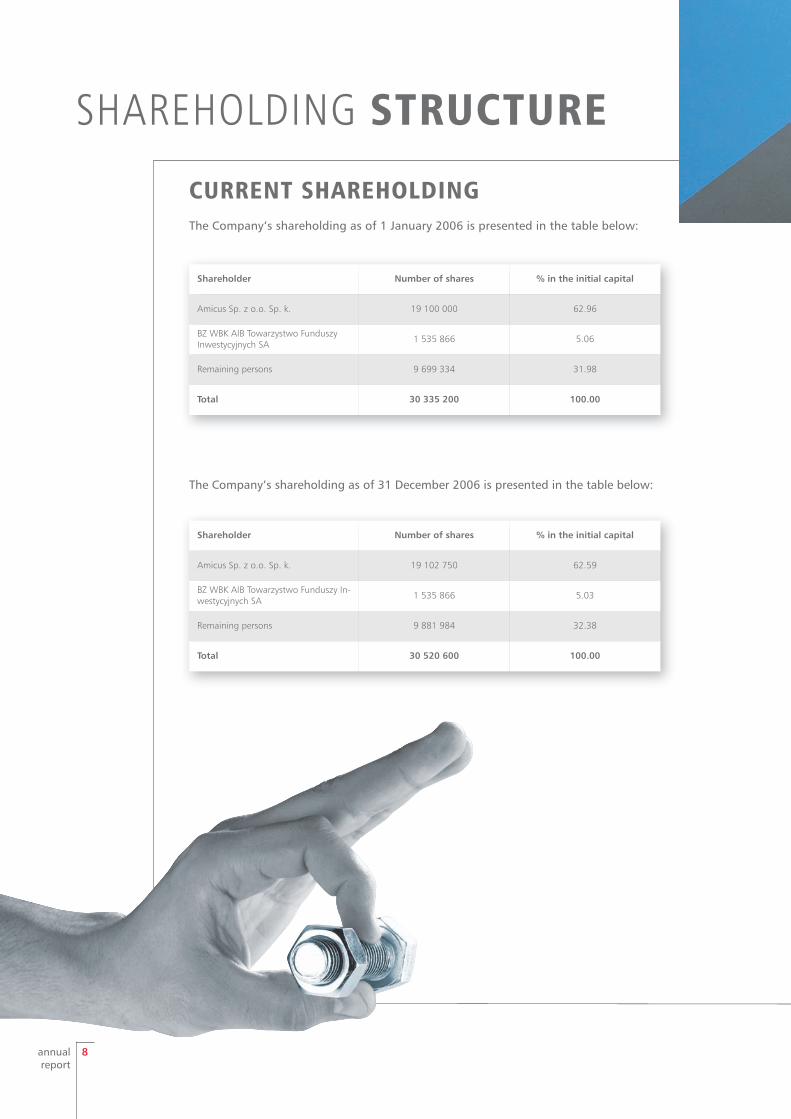
CURRENT SHAREHOLDINGThe Company’s shareholding as of 1 January 2006 is presented in the table below:
Shareholder Number of shares % in the initial capital
Amicus Sp. z o.o. Sp. k. 19 100 000 62.96
BZ WBK AIB Towarzystwo Funduszy Inwestycyjnych SA 1 535 866 5.06
Remaining persons 9 699 334 31.98
Total 30 335 200 100.00
The Company’s shareholding as of 31 December 2006 is presented in the table below:
Shareholder Number of shares % in the initial capital
Amicus Sp. z o.o. Sp. k. 19 102 750 62.59
BZ WBK AIB Towarzystwo Funduszy In-westycyjnych SA 1 535 866 5.03
Remaining persons 9 881 984 32.38
Total 30 520 600 100.00
9 raportroczny
STRUKTURA AKCJONARIATU
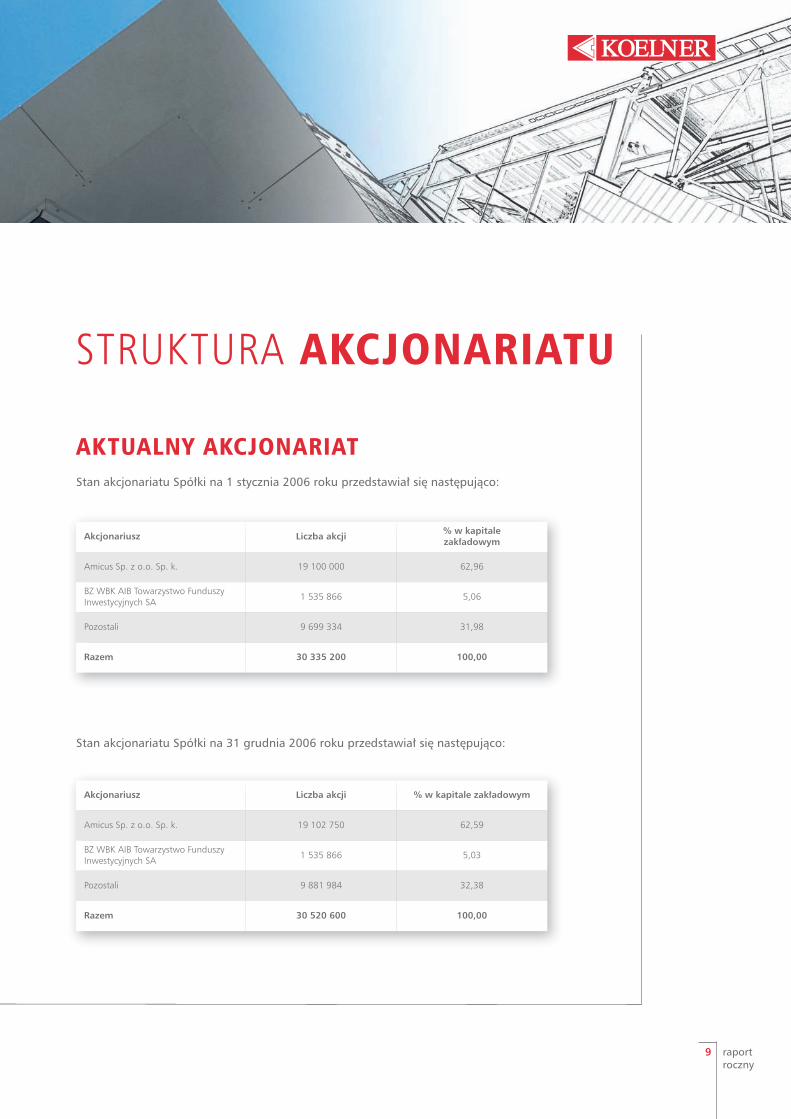
AKTUALNY AKCJONARIATStan akcjonariatu Spółki na 1 stycznia 2006 roku przedstawiał się następująco:
Stan akcjonariatu Spółki na 31 grudnia 2006 roku przedstawiał się następująco:
Akcjonariusz Liczba akcji % w kapitale zakładowym
Amicus Sp. z o.o. Sp. k. 19 100 000 62,96
BZ WBK AIB Towarzystwo Funduszy Inwestycyjnych SA 1 535 866 5,06
Pozostali 9 699 334 31,98
Razem 30 335 200 100,00
Akcjonariusz Liczba akcji % w kapitale zakładowym
Amicus Sp. z o.o. Sp. k. 19 102 750 62,59
BZ WBK AIB Towarzystwo Funduszy Inwestycyjnych SA 1 535 866 5,03
Pozostali 9 881 984 32,38
Razem 30 520 600 100,00
annualreport
10
PARENT COMPANY'SMANAGEMENTMANAGEMENT BOARDThe Company’s management as of 1 January 2006 is comprised of the following members:
SUPERVISORY BOARDThe Company’s Supervisory Board as of 1 January 2006
is comprised of the following members:
4 Przemysław KoelnerChairman of the Supervisory Board
4 Joanna Stabiszewska Secretary of the Supervisory Board
4 Krystyna Koelner Member of the Supervisory Board
4 Zbigniew Pamuła Member of the Supervisory Board
4 Zbigniew Szczypiński Member of the Supervisory Board
4 Arkadiusz JastrzębskiMember of the Supervisory Board
4 Wojciech ArkuszewskiMember of the Supervisory Board
On 17 November 2006 Mrs Krystyna Koelner was appointed
to become a Vice-Chairperson of the Supervisory Board.
Until 31 December 2006 the Supervisory Board included the same members.
Until 31 December 2006 the Management Board included the same members.
4 Radosław Koelner
President of the Management Board
4 Tomasz Mogilski
Vice-President of the Management Board
11 raportroczny
WŁADZE SPÓŁKIDOMINUJĄCEJZARZĄDSkład Zarządu Spółki na dzień 1 stycznia 2006 r. przedstawiał się następująco:
RADA NADZORCZASkład Rady Nadzorczej Spółki na dzień 1 stycznia 2006 r.
przedstawiał się następująco:
4 Przemysław KoelnerPrzewodniczący Rady Nadzorczej
4 Joanna Stabiszewska Sekretarz Rady Nadzorczej
4 Krystyna Koelner Członek Rady Nadzorczej
4 Zbigniew Pamuła Członek Rady Nadzorczej
4 Zbigniew Szczypiński Członek Rady Nadzorczej
4 Arkadiusz JastrzębskiCzłonek Rady Nadzorczej
4 Wojciech ArkuszewskiCzłonek Rady Nadzorczej
W dniu 17 listopada 2006 r. powołano panią
Krystynę Koelner na Wiceprzewodniczącą Rady Nadzorczej.
Do 31 grudnia 2006 r. Rada Nadzorcza
funkcjonowała w niezmienionym składzie.
Do 31 grudnia 2006 r. Zarząd funkcjonował w niezmienionym składzie.
4 Radosław Koelner
Prezes Zarządu
4 Tomasz Mogilski
Wiceprezes Zarządu
annualreport
12
SHARES HELD BY THE MEMBERS OF THE MANAGEMENT OF THE PARENT COMPANYAccording to the information gathered by the Company, the persons performing the functions in
the management bodies of the Company as of 31 December 2006 held the following numbers of
shares of KOELNER SA:
Management Board Number of shares
Radosław Koelner – President of the Management Board 524 750
Tomasz Mogilski – Vice-President of the Management Board 75 000
Supervisory Board Number of shares
Przemysław Koelner – President of the Supervisory Board 403 625
Krystyna Koelner – Vice-Chairperson of the Supervisory Board 396 625
Zbigniew Pamuła – Member of the Supervisory Board 0
Zbigniew Szczypiński – Member of the Supervisory Board 360
Joanna Stabiszewska – Secretary of the Supervisory Board 0
Arkadiusz Jastrzębski – Member of the Supervisory Board 0
Wojciech Arkuszewski – Member of the Supervisory Board 0
13 raportroczny
AKCJE W POSIADANIU CZŁONKÓW WŁADZ SPÓŁKI DOMINUJĄCEJWedług informacji posiadanych przez Spółkę stan posiadania akcji KOELNER SA przez
osoby pełniące funkcje we władzach Spółki na dzień 31 grudnia 2006 r. przedstawiał się
następująco:
Zarząd Liczba sztuk
Radosław Koelner – Prezes Zarządu 524 750
Tomasz Mogilski – Wiceprezes Zarządu 75 000
Rada Nadzorcza Liczba sztuk
Przemysław Koelner – Przewodniczący Rady Nadzorczej 403 625
Krystyna Koelner – Wiceprzewodnicząca Rady Nadzorczej 396 625
Zbigniew Pamuła – Członek Rady Nadzorczej 0
Zbigniew Szczypiński – Członek Rady Nadzorczej 360
Joanna Stabiszewska – Sekretarz Rady Nadzorczej 0
Arkadiusz Jastrzębski – Członek Rady Nadzorczej 0
Wojciech Arkuszewski – Członek Rady Nadzorczej 0

annualreport
14
SALES AND SUPPLY
In the scope of building fastenings the following are distinguished:
Processed goods – “fastening elements” include:
4 light industrial construction fastenings (screws for metal sheeting, “expanding” nails, connections
for multi-layered walls),
4 fastenings for facades and roofs (facade and roof connectors, telescopic connectors for flat roofs),
4 dry interior building elements (plug cores, screws, accessories for walls and ceilings from plaster
board panels).
Commercial goods include:
4 carpentry connections,
4 screws, rivets, standard screws – screws, nuts washers and other joining elements,
4 nails, wire product, ropes, rope accessories.
The Group’s sales are targeted towards professional and semi-professional customers; therefore the
product range is typified by goods and products of a better value in comparison to competitors in
Central Eastern Europe markets, whereas in the markets of Western Europe the Group (thanks to
a comparative advantage of costs) is able to offer a lower price for a range of similar quality.
The target market of the goods and products of the Group is the building-installation industry, and
in particular the segment concerned with internal finishing, thermo-renovation and industrial
construction. The products are also applied in the furniture and production industries, including
the production of household products, and also in the machine industry.
THE GROUP’S CORE BUSINESSKOELNER Group sales are made mainly through wholesale distribution
channels in the following product groups:
4 building fastenings,
4 hand tools and electrical tools,
4 standard screws.

15 raportroczny
SPRZEDAŻ I ZAOPATRZENIEPRZEDMIOT DZIAŁALNOŚCI GRUPYSprzedaż Grupy KOELNER odbywa się głównie przez hurtowe kanały dystrybucji w następujących
grupach asortymentowych:
4 mocowania budowlane,
4 narzędzia ręczne oraz elektronarzędzia,
4 normalia śrubowe.
W ramach kategorii mocowań budowlanych wyróżnia się:
Towary po przerobie – „elementy złączne” obejmujące:
4 mocowania lekkich konstrukcji przemysłowych (wkręty do blach, gwoździe wstrzeliwane,
łączniki do murów warstwowych),
4 mocowania fasadowe i dachowe (łączniki do fasad, łączniki teleskopowe do dachów płaskich),
4 elementy do suchej zabudowy wnętrz (kołki, wkręty, akcesoria do ścian i sufitów z płyty
gipsowo-kartonowej).
Towary handlowe obejmujące:
4 łączniki ciesielskie,
4 wkręty, nity, normalia śrubowe – śruby, nakrętki, podkładki i inne elementy złączne,
4 gwoździe, wyroby z drutu, liny, akcesoria linowe.
W związku z tym, że sprzedaż Grupy skierowana jest do odbiorców profesjonalnych i półprofe-
sjonalnych, oferta asortymentowa obejmuje towary i produkty charakteryzujące się wyższą ja-
kością i ceną w porównaniu do konkurentów na rynkach Europy Środkowo-Wschodniej.
Natomiast na rynkach Europy Zachodniej Grupa (dzięki przewagom kosztowym) jest w stanie za-
oferować niższą cenę za asortyment o zbliżonej jakości.
Głównym odbiorcą towarów i produktów Grupy jest przemysł budowlano-montażowy,
a w szczególności jego segmenty zajmujące się wykańczaniem wnętrz, termorenowacją i bu-
downictwem przemysłowym. Znajdują one także zastosowanie w przemyśle meblarskim i prze-
twórczym m.in. do produkcji sprzętu AGD, a także w przemyśle maszynowym.
annualreport
16
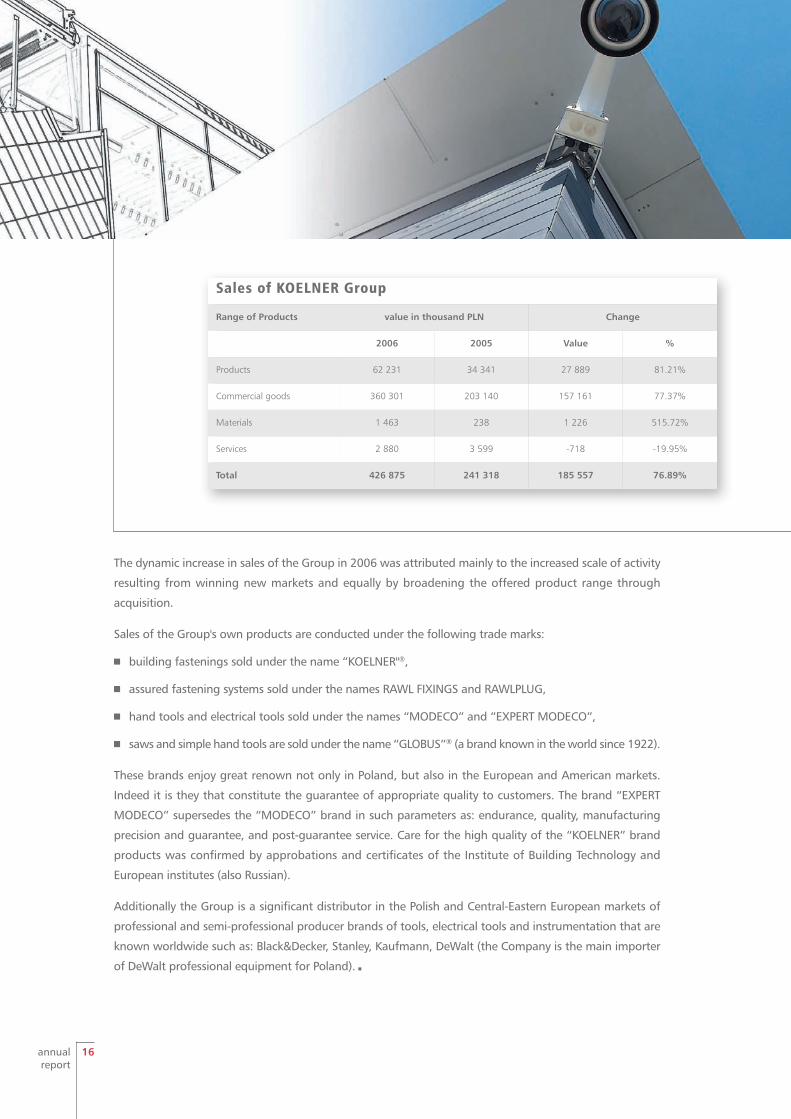
Sales of KOELNER Group
Range of Products value in thousand PLN Change
2006 2005 Value %
Products 62 231 34 341 27 889 81.21%
Commercial goods 360 301 203 140 157 161 77.37%
Materials 1 463 238 1 226 515.72%
Services 2 880 3 599 -718 -19.95%
Total 426 875 241 318 185 557 76.89%
The dynamic increase in sales of the Group in 2006 was attributed mainly to the increased scale of activity
resulting from winning new markets and equally by broadening the offered product range through
acquisition.
Sales of the Group's own products are conducted under the following trade marks:
4 building fastenings sold under the name “KOELNER"®,
4 assured fastening systems sold under the names RAWL FIXINGS and RAWLPLUG,
4 hand tools and electrical tools sold under the names “MODECO” and “EXPERT MODECO”,
4 saws and simple hand tools are sold under the name “GLOBUS”® (a brand known in the world since 1922).
These brands enjoy great renown not only in Poland, but also in the European and American markets.
Indeed it is they that constitute the guarantee of appropriate quality to customers. The brand “EXPERT
MODECO” supersedes the “MODECO” brand in such parameters as: endurance, quality, manufacturing
precision and guarantee, and post-guarantee service. Care for the high quality of the “KOELNER” brand
products was confirmed by approbations and certificates of the Institute of Building Technology and
European institutes (also Russian).
Additionally the Group is a significant distributor in the Polish and Central-Eastern European markets of
professional and semi-professional producer brands of tools, electrical tools and instrumentation that are
known worldwide such as: Black&Decker, Stanley, Kaufmann, DeWalt (the Company is the main importer
of DeWalt professional equipment for Poland). 3

17 raportroczny
Sprzedaż Grupy KOELNER
asortyment wartość w tys. zł zmiana
2006 2005 wartość %
Produkty 62 231 34 341 27 889 81,21%
Towary handlowe 360 301 203 140 157 161 77,37%
Materiały 1 463 238 1 226 515,72%
Usługi 2 880 3 599 -718 -19,95%
Suma 426 875 241 318 185 557 76,89%
Dynamiczny wzrost sprzedaży Grupy w 2006 r. spowodowany był przede wszystkim zwiększeniem skali
prowadzonej działalności w wyniku pozyskiwania nowych rynków zbytu, jak również rozszerzeniem
oferty asortymentowej poprzez akwizycję.
Sprzedaż produkcji własnej Grupy jest prowadzona pod następującymi znakami handlowymi:
4 mocowania budowlane oferowane pod nazwą „KOELNER”®,
4 systemy mocowań odpowiedzialnych oferowane pod marką RAWL FIXINGS i RAWLPLUG
4 narzędzia ręczne i elektronarzędzia oferowane pod nazwami „MODECO” oraz „EXPERT MODECO”,
4 piły i proste narzędzia ręczne oferowane pod nazwą „GLOBUS”® (marka rozpoznawalna na świecie
od 1922 r.),
Marki te cieszą się dużą renomą nie tylko Polsce, ale także na rynkach europejskich oraz rynku amery-
kańskim. Stanowi ona dla odbiorców gwarancję odpowiedniej jakości. Marka „EXPERT MODECO” prze-
wyższa markę „MODECO” w zakresie takich parametrów jak: trwałość, jakość, dokładność wykonania
oraz serwis gwarancyjny i pogwarancyjny. Dbałość o wysoką jakość produktów marki „KOELNER” po-
twierdzona została przez aprobaty i certyfikaty Instytutu Techniki Budowlanej oraz instytutów euro-
pejskich (także rosyjskich).
Ponadto Grupa jest znaczącym na rynku polskim oraz
w Europie Środkowo-Wschodniej dystrybutorem
marek producentów profesjonalnych i półprofe-
sjonalnych narzędzi, elektronarzędzi oraz
oprzyrządowania o światowej renomie, takich
jak: „Black&Decker”, „Stanley”, „Kaufmann”,
„DeWalt” (w odniesieniu do ostatniej z tych
marek Spółka jest głównym importerem sprzętu
profesjonalnego na rynku polskim). 3
annualreport
18
The business structure ofKOELNER Group is as follows
4 KOELNER – Tworzywa Sztuczne Sp. z o.o. (further: KTS) was, in
2006, the only and exclusive contractor of services consisting
of processing and assembling entrusted products and goods
on behalf of KOELNER SA. These services extend to the whole
commercial product range of the Company. In 2007 the majority
of the manufacture activity was transferred to KOELNER SA.
Furthermore KTS undertakes the design of new products and
the conduct of research and development work for KOELNER
Group and rents warehouse and office buildings to KOELNER SA
in Wrocław at Kwidzyńska 6 Str., and also is the main guarantor
of the loans borrowed by the Company (mortgages on real
estate and bill of exchange co-signatory).
4 Sale of goods is performed by KOELNER SA (at the centre or
at branches), domestic and foreign dependent distribution
companies, and through independent distributors.
4 KOELNER SA is responsible for the purchase of materials for the
production of KTS, warehouse management, and marketing and
promotion of goods sold by KOELNER Group.
4 WAPIENICA Sp. z o.o. is the dominant Polish producer of saws
and tools for the sawmill, furniture and machine industries.
Acquisition of this company enabled the Group to extend its
product range.
4 RAWLPLUG Ltd is the oldest brand and the oldest producer of
fastening systems in the world. The company was founded in
1919 and to this day is considered the leading producer of
fastening systems in Europe. 3
Struktura biznesowa Grupy KOELNER przedstawia się następująco:
4 „KOELNER – Tworzywa Sztuczne” Sp. z o.o. (dalej: KTS) w 2006 roku była jedy-
nym i wyłącznym wykonawcą usług polegających na przerobie i konfekcjo-
nowaniu powierzonych produktów i towarów na rzecz KOELNER SA. Zakres
usług obejmował cały oferowany asortyment handlowy Spółki. W 2007 roku
większość działalności produkcyjnej została przeniesiona do KOELNER SA.
Ponadto KTS zajmuje się projektowaniem nowych wyrobów i prowadzeniem
prac badawczo-rozwojowych dla Grupy KOELNER oraz wynajmuje KOELNER SA
obiekty magazynowe i biurowe zlokalizowane we Wrocławiu przy ul. Kwi-
dzyńskiej 6, a także jest głównym gwarantem kredytów zaciąganych przez
Spółkę (hipoteki na nieruchomościach i poręczenia weksli).
4 Sprzedaż towarów odbywa się poprzez KOELNER SA (w centrali oraz w od-
działach), dystrybucyjne spółki zależne krajowe i zagraniczne oraz sieć nieza-
leżnych dystrybutorów.
4 KOELNER SA odpowiedzialna jest za zakup surowców do produkcji dla KTS,
gospodarkę magazynową oraz marketing i promocję towarów sprzedawa-
nych przez Grupę KOELNER.
4 WAPIENICA Sp. z o.o. to do-
minujący w Polsce producent
profesjonalnych pił i narzędzi
dla przemysłu tartacznego,
meblarskiego, maszynowego. Akwizycja tej spółki pozwo-
liła na rozszerzenie oferty towarowej Grupy.
4 RAWLPLUG Ltd jest najstarszą marką oraz najstarszym pro-
ducentem systemów zamocowań na świecie. Spółka zo-
stała założona w 1919 roku i do dzisiaj uważana jest za
wiodącego producenta systemów zamocowań w Europie. 3
19 raportroczny
annualreport
20
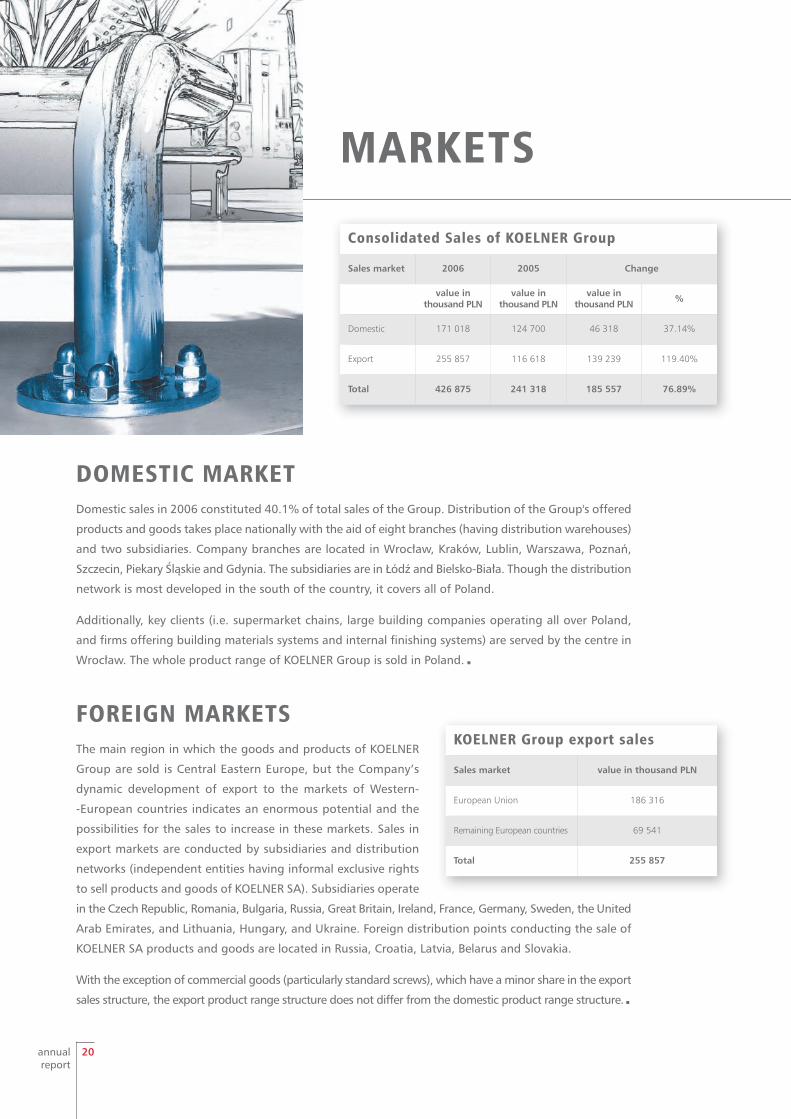
MARKETS
DOMESTIC MARKETDomestic sales in 2006 constituted 40.1% of total sales of the Group. Distribution of the Group's offered
products and goods takes place nationally with the aid of eight branches (having distribution warehouses)
and two subsidiaries. Company branches are located in Wrocław, Kraków, Lublin, Warszawa, Poznań,
Szczecin, Piekary Śląskie and Gdynia. The subsidiaries are in Łódź and Bielsko-Biała. Though the distribution
network is most developed in the south of the country, it covers all of Poland.
Additionally, key clients (i.e. supermarket chains, large building companies operating all over Poland,
and firms offering building materials systems and internal finishing systems) are served by the centre in
Wrocław. The whole product range of KOELNER Group is sold in Poland. 3
FOREIGN MARKETSThe main region in which the goods and products of KOELNER
Group are sold is Central Eastern Europe, but the Company’s
dynamic development of export to the markets of Western-
-European countries indicates an enormous potential and the
possibilities for the sales to increase in these markets. Sales in
export markets are conducted by subsidiaries and distribution
networks (independent entities having informal exclusive rights
to sell products and goods of KOELNER SA). Subsidiaries operate
in the Czech Republic, Romania, Bulgaria, Russia, Great Britain, Ireland, France, Germany, Sweden, the United
Arab Emirates, and Lithuania, Hungary, and Ukraine. Foreign distribution points conducting the sale of
KOELNER SA products and goods are located in Russia, Croatia, Latvia, Belarus and Slovakia.
With the exception of commercial goods (particularly standard screws), which have a minor share in the export
sales structure, the export product range structure does not differ from the domestic product range structure. 3
Consolidated Sales of KOELNER Group
Sales market 2006 2005 Change
value in thousand PLN
value in thousand PLN
value in thousand PLN %
Domestic 171 018 124 700 46 318 37.14%
Export 255 857 116 618 139 239 119.40%
Total 426 875 241 318 185 557 76.89%
KOELNER Group export sales
Sales market value in thousand PLN
European Union 186 316
Remaining European countries 69 541
Total 255 857

21 raportroczny
RYNKI ZBYTUSprzedaż skonsolidowana Grupy KOELNERKierunek sprzedaży 2006 2005 zmiana
wartość w tys. zł wartość w tys. zł wartość w tys. zł %
Kraj 171 018 124 700 46 318 37,14%
Eksport 255 857 116 618 139 239 119,40%
Suma 426 875 241 318 185 557 76,89%
KRAJOWESprzedaż krajowa stanowiła w 2006 r. 40,1% sprzedaży Grupy. Dystrybucja towarów i produktów ofe-
rowanych przez Grupę odbywa się w kraju za pomocą ośmiu oddziałów (posiadających magazyny dys-
trybucyjne) oraz dwóch spółek zależnych. Oddziały Spółki zlokalizowane są we Wrocławiu, Krakowie,
Lublinie, Warszawie, Poznaniu, Szczecinie, Piekarach Śląskich i Gdyni. Spółki zależne znajdują się
w Łodzi i Bielsku-Białej. Chociaż sieć sprzedaży jest najbardziej rozwinięta na południu kraju, obejmuje
ona swoim zasięgiem teren całej Polski.
Ponadto obsługą klientów kluczowych (tj. sieci supermarketów, dużych firm budowlanych, których te-
renem działania jest cała Polska oraz firm oferujących systemy materiałów budowlanych, systemy do
wykończenia wnętrz) zajmuje się centrala we Wrocławiu. W Polsce sprzedawana jest pełna oferta asor-
tymentowa Grupy KOELNER. 3
ZAGRANICZNEGłównym obszarem, na którym są sprzedawane towary i produkty Grupy KOELNER jest Europa Środkowo-
-Wschodnia, ale dynamiczny rozwój eksportu Spółki na rynki krajów Europy Zachodniej wskazuje na olbrzymi
potencjał i możliwości wzrostu sprzedaży na tych rynkach. Sprzedaż na rynkach eksportowych prowa-
dzona jest poprzez spółki zależne oraz sieci dystrybucyjne (niezależne podmioty posiadające nieformalne
prawo na wyłączność do sprzedaży produktów i towarów KOELNER SA). Spółki zależne działają w Czechach,
Rumunii, Bułgarii, Rosji, Wielkiej Brytanii, Irlandii, Francji, Niemczech, Szwecji, Zjednoczonych Emiratach
Arabskich oraz na Litwie, Węgrzech i Ukrainie. Zagraniczne punkty dystrybucyjne zajmujące się sprze-
dażą produktów i towarów KOELNER SA są zlokalizowane w Rosji, Chorwacji, na Łotwie, Białorusi i Słowacji.
Z wyjątkiem towarów handlowych (a w szczególności
normaliów śrubowych), które posiadają nieznaczący
udział w strukturze sprzedaży eksportowej, struktura
asortymentowa eksportu nie różni się od struktury
sprzedaży na rynku krajowym. 3
Sprzedaż eksportowa Grupy KOELNER
Kierunek sprzedaży wartość w tys. PLN
Unia Europejska 186 316
Pozostałe kraje europejskie 69 541
Suma 255 857

annualreport
22
The target market of the goods and products of KOELNER Group is the building-
-installation industry, therefore we can witness a phenomenon of the seasonality of
sales. It is characteristic both for domestic and foreign markets of the Group. The Group
gains the highest revenue of sales in the third quarter of the year, whereas the lowest
are obtained in the first quarter. Due to the increase of the percentage of sales in the
Group’s revenue structure of hand tools, electric tools, and saws, which are less seasonal
in comparison to construction fastenings, this phenomenon will be of a lesser extent. 3
SUPPLY SOURCESCommercial goods, and goods for further processing, which are supplied to the Company and
its subsidiaries, are those processed to a lesser degree (i.e. plastic, steel), those processed to
a medium degree (e.g. screws, standard screws, simple tools, sintered carbides), and those
processed to a high degree (hand tools, electrical tools). They are ordered on a regular basis
from domestic and European suppliers, and also from Asian suppliers (Taiwan, Malaysia, China).
KOELNER SA has no suppliers who have any exclusivity for the supply of any goods. All goods
have alternative sources; this is the Group's long term strategy. Though there are no perfect
substitutes for the commercial goods sold by the Company, alternatives exist in the form of
products with close function and parameters. In 2006 no supplier exceeded the 10% threshold
in the purchase structure. 3
SEASONAL CHARACTER OF SALES
23 raportroczny
W związku z tym, że głównym odbiorcą produktów i towarów Grupy KOELNER
jest przemysł budowlano-montażowy, występuje zjawisko sezonowości sprzedaży.
Jest ono charakterystyczne zarówno dla krajowych, jak i zagranicznych rynków
zbytu Grupy. Największe przychody ze sprzedaży Grupa realizuje w trzecim kwar-
tale, zaś najmniejsze w pierwszym. Ze względu na zwiększanie się udziału sprze-
daży narzędzi ręcznych, elektronarzędzi oraz pił w strukturze przychodów Grupy,
charakteryzującej się mniejszą sezonowością niż mocowania budowlane, zjawisko
to będzie ulegać osłabieniu. 3
ŹRÓDŁA ZAOPATRZENIATowary handlowe, jak i towary do dalszego przerobu, w które zaopatruje się Spółka i jej podmioty
zależne, to zarówno artykuły o małym (np. tworzywa sztuczne, stal), średnim (np. wkręty, nor-
malia śrubowe, proste narzędzia, węgliki spiekane), jak i wysokim stopniu przetworzenia (na-
rzędzia ręczne, elektronarzędzia). Zamawiane są one na bieżąco od dostawców krajowych
i europejskich, a także od dostawców azjatyckich (Tajwan, Malezja, Chiny). KOELNER SA nie ma
dostawcy, który posiadałby wyłączność na dostawy jakiegokolwiek asortymentu. Każdy towar ma
źródło alternatywne, co wynika też z długoterminowej strategii Grupy. Chociaż nie ma dosko-
nałych substytutów dla towarów handlowych kupowanych przez Grupę, istnieje alternatywa
w postaci produktów o zbliżonych funkcjach i parametrach. W 2006 r. żaden dostawca nie prze-
kroczył 10% progu w strukturze zakupów. 3
SEZONOWOŚĆ SPRZEDAŻY
annualreport
24
DEVELOPMENT STRATEGY
The Company strategy consists of4 Attaining the position of market leader in the fastenings market in Poland (with about 25-30% market
share) and the electrical tools market (with about 5-10% market share);
4 Attaining approximately 20-30% market share in building fastenings and about 5% market share in
the tools and electrical tools market in Central-Eastern Europe;
4 With reference to European markets - intensification of sales and entering new markets.
The strategy will be achieved through4 Introducing new, innovative goods of higher quality;
4 Adjusting the extent of the product range to Client expectations;
4 Maintaining the current high quality of the offered goods;
4 Maintaining competitive prices with reference to foreign competitors;
4 Increasing the speed of serving clients;
4 Introducing new information systems assisting management, order service, and the centralisation
of warehouse management;
4 Continuous staff training;
4 Perpetual development of the efficiency of the organisation and adjusting it to the requirements
of a dynamically developing organisation.
25 raportroczny
STRATEGIA ROZWOJU
Strategia Spółki zakłada4 osiągnięcie pozycji lidera na rynku zamocowań w Polsce (z ok. 25-30% udziałem w rynku) i znaczą-
cego gracza na rynku narzędzi i elektronarzędzi (z ok. 5-10% udziałem w rynku);
4 osiągnięcie ok. 20-30% udziału w rynku mocowań budowlanych oraz ok. 5% udziału w rynku
narzędzi i elektronarzędzi w Europie Środkowo-Wschodniej;
4 w odniesieniu do rynków europejskich – intensyfikację sprzedaży oraz wchodzenie na nowe rynki.
Strategia ta będzie realizowana poprzez4 wprowadzanie nowych, bardziej innowacyjnych i lepszych jakościowo towarów;
4 dopasowanie zakresu oferty asortymentowej do oczekiwań Klientów;
4 utrzymanie obecnej wysokiej jakości oferowanych towarów;
4 utrzymanie konkurencyjnych cen w odniesieniu do zagranicznych konkurentów;
4 poprawę szybkości obsługi Klientów;
4 wprowadzenie systemów informatycznych wspomagających proces zarządzania, obsługę zamówień
oraz centralizację gospodarki magazynowej;
4 stałe doskonalenie zawodowe personelu;
4 udoskonalanie sprawności organizacyjnej i dopasowanie jej do wymogów dynamicznie rozwijającej
się organizacji.
annualreport
26
In order to systematically extend and modify the range of goods and products according to the
expectations of clients, the following actions are directed at all markets:
4 increase budget for research and development of new products;
4 draw up new patterns for the introduced range;
4 increase emphasis on display at sales points.
These activities will enable the differentiation of the brands belonging to the Company and by
extension the greater distinguishing of the offer of the company against the background of the
competition. This will allow even better control over the margins obtained and the greater value
of sales and global share in the market.
In addition, for the purpose of strengthening its market position KOELNER Group plans to
increase production potential and extend the logistics centre. This will increase the product range
on the domestic market and enable the increase of export. Due to the purchases of 2004-2005
of about 80 new machines and peripheral equipment by KOELNER Tworzywa Sztuczne Sp. z o.o.,
the production hold-ups should be eliminated, which refers principally to dry interior fastenings
and facade insulation. The Company also plans to develop the logistics base in Poland and
Central-Eastern Europe. The distribution strategy of the Group consists mainly of extension and
modernisation of the logistic centre in Wrocław by progressive limiting of the number of regional
warehouses, whose activity - with regard to their small scale - does not give the
possibility of generating appropriately high margin.
Referring to foreign markets the strategy of the group consists of sales
development by subsidiaries located abroad (including in Germany and in
Hungary). Western European markets are mature, and KOELNER Group - offering
goods and products typified by low prices in comparison to quality - is able to
dynamically increase sales and achieve the appropriate level of margin even by
making relatively few sales, including sales to supermarket chains.
The above measures will enable the use of scale of production and
distribution by KOELNER Group, reduction of delivery terms and a very
elastic adjustment of product range to actual market needs. As
a result such measures should positively affect the turnover and
margins. 3
27 raportroczny
W celu systematycznej rozbudowy i modyfikacji asortymentu produktów
i towarów zgodnie z oczekiwaniami klientów podejmowane są na wszyst-
kich rynkach następujące działania:
4 zwiększanie budżetu na badania i rozwój nowych produktów;
4 opracowywanie nowego wzornictwa dla wprowadzanego asortymentu;
4 zwiększanie nakładów na ekspozycję w punktach sprzedaży.
Działania te pozwalają na zróżnicowanie marek należących do Spółki,
a przez to na większe wyróżnienie oferty Spółki na tle oferty konkurencji.
Umożliwi to jeszcze lepszą kontrolę nad uzyskiwanymi marżami oraz zwięk-
szy wartość sprzedaży i globalny udział w rynku.
Dodatkowo, w celu umocnienia swojej pozycji rynkowej, Grupa KOELNER
planuje zwiększenie mocy produkcyjnych oraz rozbudowę centrum logi-
stycznego. Spowoduje to poszerzenie oferty wyrobów na rynku krajowym
oraz umożliwi zwiększenie eksportu. Dzięki zakupowi w latach 2004–2005
ok. 80 nowych maszyn i urządzeń peryferyjnych przez KOELNER Tworzywa
Sztuczne Sp. z o.o. powinno zostać zlikwidowane „wąskie gardło” pro-
dukcji, głównie w odniesieniu do mocowań suchej zabudowy wnętrz oraz
izolacji fasadowych. Ponadto Spółka planuje rozbudowę bazy logistycznej
na terenie Polski oraz Europy Środkowo-Wschodniej. W szczególności stra-
tegia dystrybucyjna Grupy zakłada rozbudowę i modernizację centrum lo-
gistycznego we Wrocławiu przy stopniowym ograniczaniu liczby
magazynów regionalnych, których działalność – ze względu na małą skalę
– nie daje możliwości generowania odpowiednio wysokich marż.
W odniesieniu do rynków zagranicznych strategia Grupy zakłada rozwój
sprzedaży poprzez zlokalizowane za granicą dystrybucyjne spółki zależne
oraz rozwój sieci dystrybucji (m.in. w Niemczech i na Węgrzech). Rynki za-
chodnioeuropejskie są rynkami dojrzałymi, a Grupa KOELNER – oferując
towary i produkty charakteryzujące się niższymi cenami przy porównywalnej
jakości – jest w stanie dynamicznie zwiększać swoją sprzedaż i uzyskiwać
odpowiedni poziom marż nawet przy realizacji stosunkowo niewielkich za-
mówień, w tym poprzez sprzedaż do sieci supermarketów.
Powyższe działania umożliwią wykorzystanie skali produkcji i dystrybucji Grupy KOELNER, skrócenie
terminów dostaw oraz bardziej elastyczne dopasowanie oferty produktowej do aktualnych potrzeb
rynku. W konsekwencji powinny wywrzeć pozytywny wpływ na wysokość obrotów i marż. 3
annualreport
28
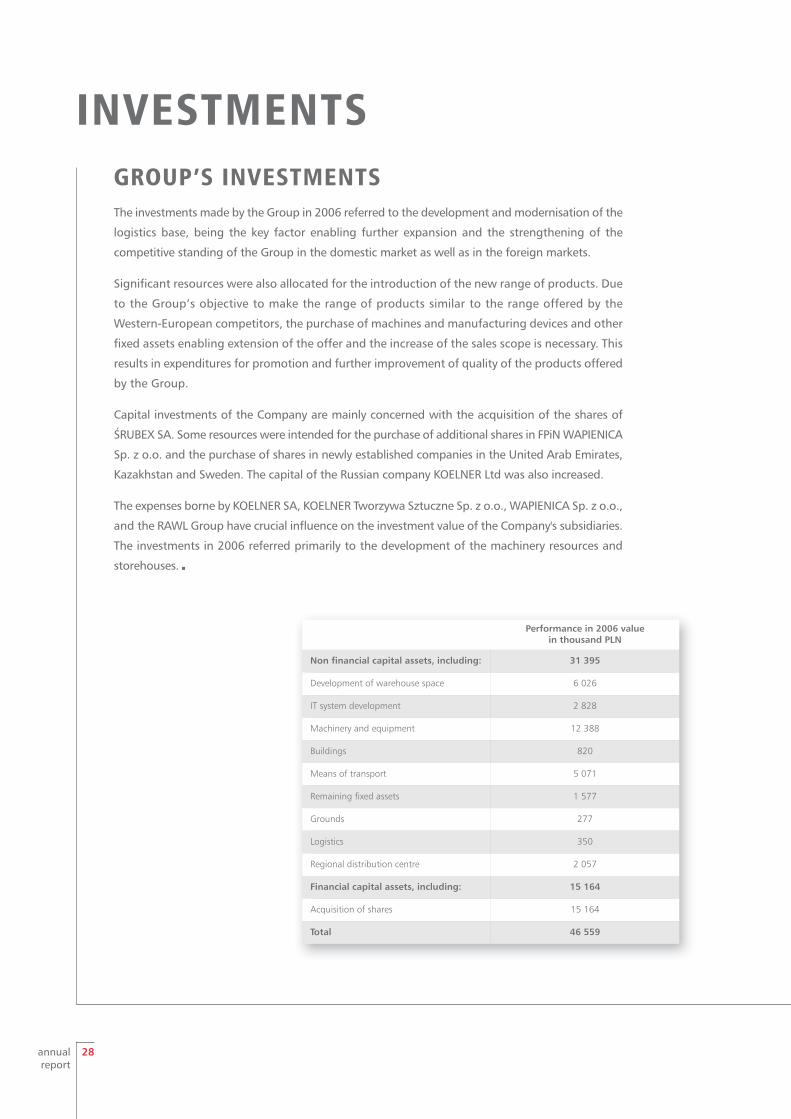
INVESTMENTSGROUP’S INVESTMENTSThe investments made by the Group in 2006 referred to the development and modernisation of the
logistics base, being the key factor enabling further expansion and the strengthening of the
competitive standing of the Group in the domestic market as well as in the foreign markets.
Significant resources were also allocated for the introduction of the new range of products. Due
to the Group’s objective to make the range of products similar to the range offered by the
Western-European competitors, the purchase of machines and manufacturing devices and other
fixed assets enabling extension of the offer and the increase of the sales scope is necessary. This
results in expenditures for promotion and further improvement of quality of the products offered
by the Group.
Capital investments of the Company are mainly concerned with the acquisition of the shares of
ŚRUBEX SA. Some resources were intended for the purchase of additional shares in FPiN WAPIENICA
Sp. z o.o. and the purchase of shares in newly established companies in the United Arab Emirates,
Kazakhstan and Sweden. The capital of the Russian company KOELNER Ltd was also increased.
The expenses borne by KOELNER SA, KOELNER Tworzywa Sztuczne Sp. z o.o., WAPIENICA Sp. z o.o.,
and the RAWL Group have crucial influence on the investment value of the Company's subsidiaries.
The investments in 2006 referred primarily to the development of the machinery resources and
storehouses. 3
Performance in 2006 value in thousand PLN
Non financial capital assets, including: 31 395
Development of warehouse space 6 026
IT system development 2 828
Machinery and equipment 12 388
Buildings 820
Means of transport 5 071
Remaining fixed assets 1 577
Grounds 277
Logistics 350
Regional distribution centre 2 057
Financial capital assets, including: 15 164
Acquisition of shares 15 164
Total 46 559
29 raportroczny
INWESTYCJE
Wykonanie rok 2006 (w tys. zł)
Niefinansowe aktywa trwałe, w tym: 31 395
Rozbudowa hal magazynowych 6 026
Informatyzacja 2 828
Maszyny i urządzenia 12 388
Budynki 820
Środki transportu 5 071
Pozostałe środki trwałe 1 577
Grunty 277
Logistyka 350
Regionalne centra dystrybucji 2 057
Finansowe aktywa trwałe, w tym: 15 164
Nabycie udziałów 15 164
Suma 46 559
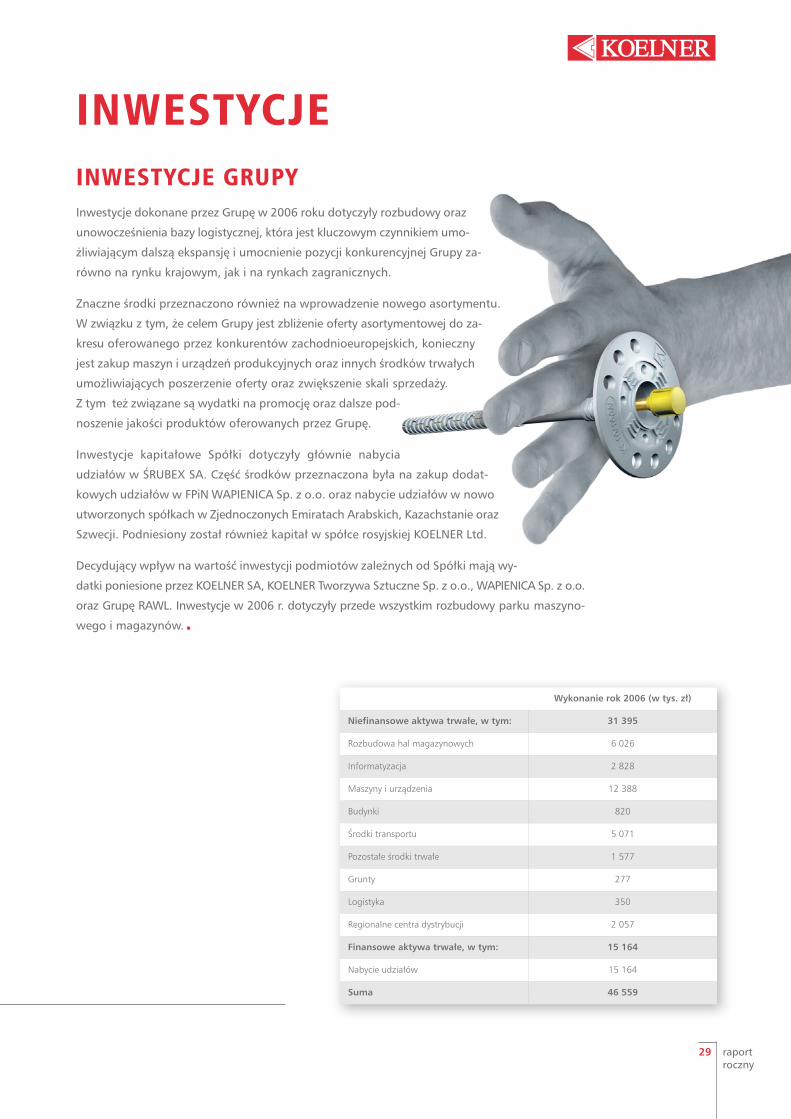
INWESTYCJE GRUPYInwestycje dokonane przez Grupę w 2006 roku dotyczyły rozbudowy oraz
unowocześnienia bazy logistycznej, która jest kluczowym czynnikiem umo-
żliwiającym dalszą ekspansję i umocnienie pozycji konkurencyjnej Grupy za-
równo na rynku krajowym, jak i na rynkach zagranicznych.
Znaczne środki przeznaczono również na wprowadzenie nowego asortymentu.
W związku z tym, że celem Grupy jest zbliżenie oferty asortymentowej do za-
kresu oferowanego przez konkurentów zachodnioeuropejskich, konieczny
jest zakup maszyn i urządzeń produkcyjnych oraz innych środków trwałych
umożliwiających poszerzenie oferty oraz zwiększenie skali sprzedaży.
Z tym też związane są wydatki na promocję oraz dalsze pod-
noszenie jakości produktów oferowanych przez Grupę.
Inwestycje kapitałowe Spółki dotyczyły głównie nabycia
udziałów w ŚRUBEX SA. Część środków przeznaczona była na zakup dodat-
kowych udziałów w FPiN WAPIENICA Sp. z o.o. oraz nabycie udziałów w nowo
utworzonych spółkach w Zjednoczonych Emiratach Arabskich, Kazachstanie oraz
Szwecji. Podniesiony został również kapitał w spółce rosyjskiej KOELNER Ltd.
Decydujący wpływ na wartość inwestycji podmiotów zależnych od Spółki mają wy-
datki poniesione przez KOELNER SA, KOELNER Tworzywa Sztuczne Sp. z o.o., WAPIENICA Sp. z o.o.
oraz Grupę RAWL. Inwestycje w 2006 r. dotyczyły przede wszystkim rozbudowy parku maszyno-
wego i magazynów. 3
annualreport
30
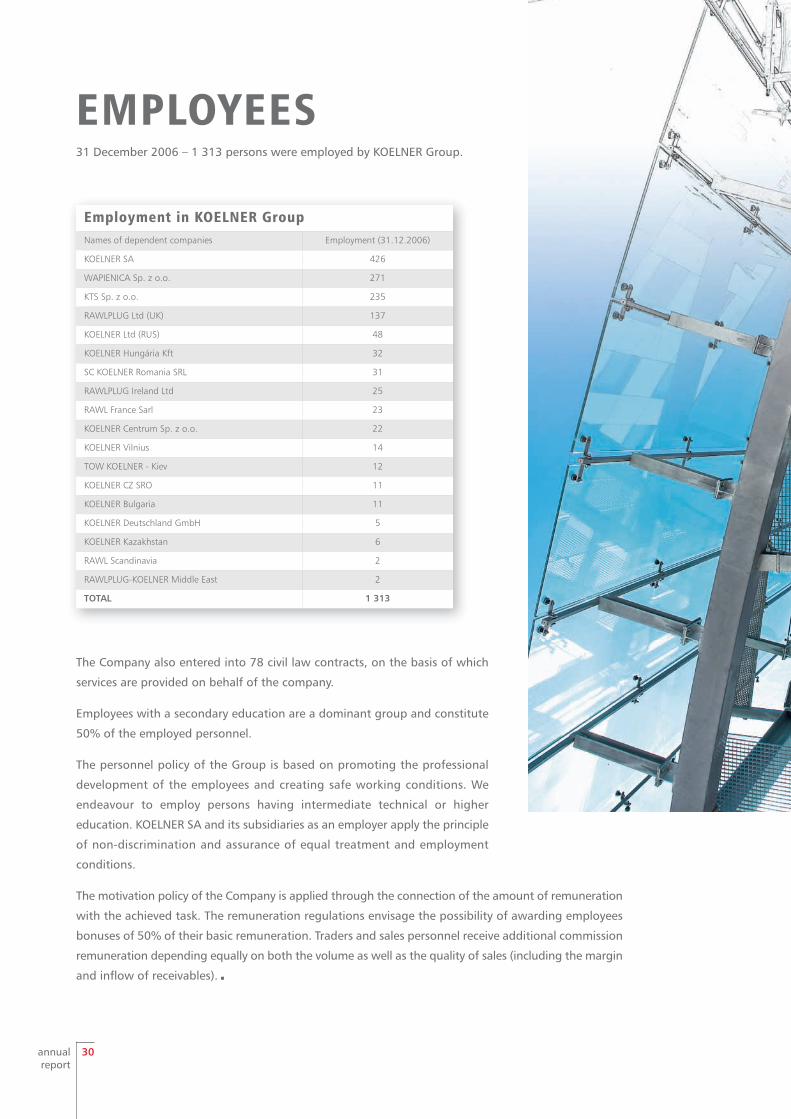
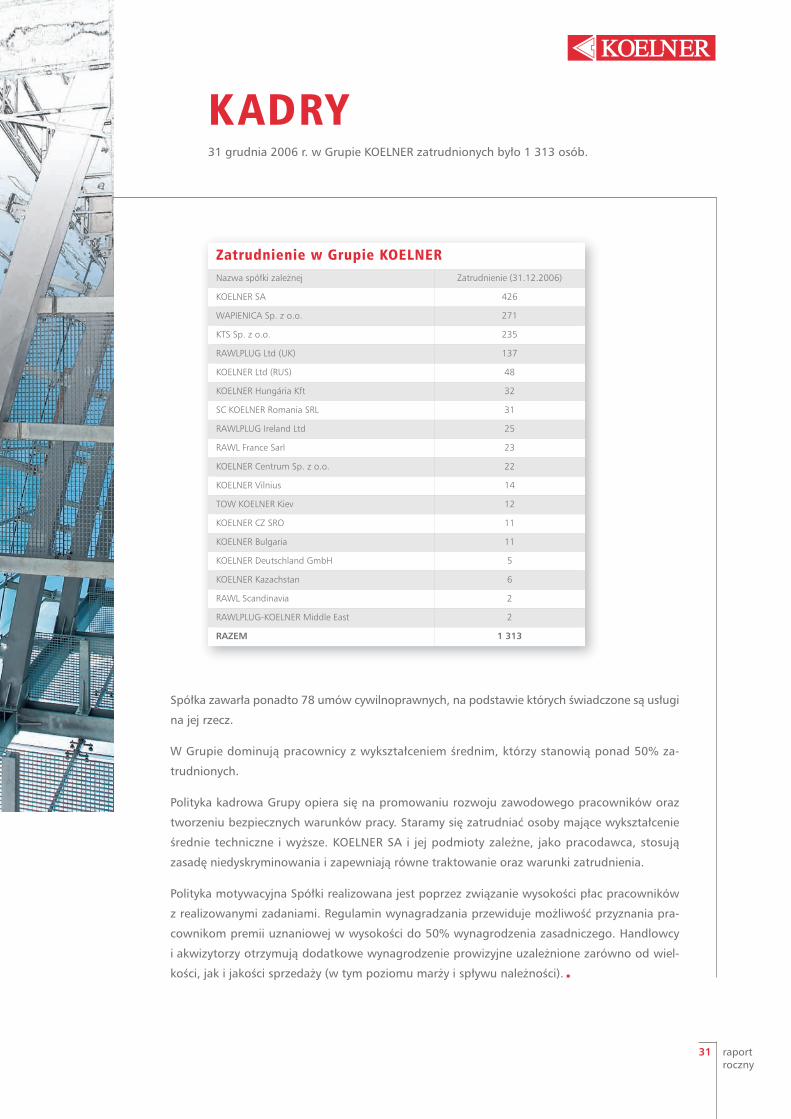
EMPLOYEES31 December 2006 – 1 313 persons were employed by KOELNER Group.
Employment in KOELNER GroupNames of dependent companies Employment (31.12.2006)
KOELNER SA 426
WAPIENICA Sp. z o.o. 271
KTS Sp. z o.o. 235
RAWLPLUG Ltd (UK) 137
KOELNER Ltd (RUS) 48
KOELNER Hungária Kft 32
SC KOELNER Romania SRL 31
RAWLPLUG Ireland Ltd 25
RAWL France Sarl 23
KOELNER Centrum Sp. z o.o. 22
KOELNER Vilnius 14
TOW KOELNER - Kiev 12
KOELNER CZ SRO 11
KOELNER Bulgaria 11
KOELNER Deutschland GmbH 5
KOELNER Kazakhstan 6
RAWL Scandinavia 2
RAWLPLUG-KOELNER Middle East 2
TOTAL 1 313
The Company also entered into 78 civil law contracts, on the basis of which
services are provided on behalf of the company.
Employees with a secondary education are a dominant group and constitute
50% of the employed personnel.
The personnel policy of the Group is based on promoting the professional
development of the employees and creating safe working conditions. We
endeavour to employ persons having intermediate technical or higher
education. KOELNER SA and its subsidiaries as an employer apply the principle
of non-discrimination and assurance of equal treatment and employment
conditions.
The motivation policy of the Company is applied through the connection of the amount of remuneration
with the achieved task. The remuneration regulations envisage the possibility of awarding employees
bonuses of 50% of their basic remuneration. Traders and sales personnel receive additional commission
remuneration depending equally on both the volume as well as the quality of sales (including the margin
and inflow of receivables). 3
31 raportroczny
KADRY31 grudnia 2006 r. w Grupie KOELNER zatrudnionych było 1 313 osób.
Zatrudnienie w Grupie KOELNERNazwa spółki zależnej Zatrudnienie (31.12.2006)
KOELNER SA 426
WAPIENICA Sp. z o.o. 271
KTS Sp. z o.o. 235
RAWLPLUG Ltd (UK) 137
KOELNER Ltd (RUS) 48
KOELNER Hungária Kft 32
SC KOELNER Romania SRL 31
RAWLPLUG Ireland Ltd 25
RAWL France Sarl 23
KOELNER Centrum Sp. z o.o. 22
KOELNER Vilnius 14
TOW KOELNER Kiev 12
KOELNER CZ SRO 11
KOELNER Bulgaria 11
KOELNER Deutschland GmbH 5
KOELNER Kazachstan 6
RAWL Scandinavia 2
RAWLPLUG-KOELNER Middle East 2
RAZEM 1 313
Spółka zawarła ponadto 78 umów cywilnoprawnych, na podstawie których świadczone są usługi
na jej rzecz.
W Grupie dominują pracownicy z wykształceniem średnim, którzy stanowią ponad 50% za-
trudnionych.
Polityka kadrowa Grupy opiera się na promowaniu rozwoju zawodowego pracowników oraz
tworzeniu bezpiecznych warunków pracy. Staramy się zatrudniać osoby mające wykształcenie
średnie techniczne i wyższe. KOELNER SA i jej podmioty zależne, jako pracodawca, stosują
zasadę niedyskryminowania i zapewniają równe traktowanie oraz warunki zatrudnienia.
Polityka motywacyjna Spółki realizowana jest poprzez związanie wysokości płac pracowników
z realizowanymi zadaniami. Regulamin wynagradzania przewiduje możliwość przyznania pra-
cownikom premii uznaniowej w wysokości do 50% wynagrodzenia zasadniczego. Handlowcy
i akwizytorzy otrzymują dodatkowe wynagrodzenie prowizyjne uzależnione zarówno od wiel-
kości, jak i jakości sprzedaży (w tym poziomu marży i spływu należności). 3
annualreport
32
Transactions between related partiesIn 2006 KOELNER SA granted a short-term loan to KOELNER Kazakhstan Ltd in the amount of USD
60 000 with the deadline of payment on 25 December 2006. The interest rate was agreed to
amount to 0.5% per month accrued on the current debt.
The loan granted to Rawlpug Ltd in 2005 was increased by GBP 400 000 in 2006.
All remaining transactions between the affiliated entities were concluded on market terms and their
nature and conditions resulted from the current operational activity of the Group or its subsidiary. 3
Information on loans granted, securitiesand guarantees and credit takenKOELNER Group is not a party to any security or guarantee. Within the frame of the Group,
KOELNER SA is the guarantor of the loan borrowed by RAWLPLUG Ltd to the sum of EUR 16 140 000
(PLN 61 836 000) and the guarantor for the transaction of change of percentage points entered
into by RAWLPLUG Ltd to the sum of EUR 500 000 (PLN 1 916 000).
Detailed information concerning the loans taken by the Group can be found in the balance’s
explanation notes. 3

33 raportroczny
Zawarcie przez podmioty z Grupy transakcji z podmiotami powiązanymiW 2006 spółka KOELNER SA udzieliła spółce KOELNER Kazakhstan Ltd krótkoterminowej pożyczki
w kwocie 60 tys. USD z terminem spłaty do 25 grudnia 2006 r. Oprocentowanie ustalono w wysokości
0,5% w skali miesiąca liczone od aktualnego zadłużenia.
Pożyczka udzielona spółce Rawlpug Ltd w 2005 r. została w roku 2006
zwiększona o kwotę 400 tys. GBP.
Wszystkie pozostałe transakcje pomiędzy jednostkami powiązanymi za-
wierane były na warunkach rynkowych, a ich charakter i warunki wynikały
z bieżącej działalności operacyjnej Spółki lub jednostki od niej zależnej. 3
Informacja o udzielonych pożyczkach, poręczeniachi gwarancjach oraz zaciągniętych kredytachGrupa KOELNER nie jest stroną żadnych poręczeń i gwarancji. W ramach
Grupy, KOELNER SA jest gwarantem kredytu zaciągniętego przez RAWLPLUG
Ltd w wysokości 16 140 tys. EUR (61 836 tys. PLN) oraz gwarantem dla
transakcji zamiany stóp procentowych zawartej przez RAWLPLUG Ltd
w wysokości 500 tys. EUR (1 916 tys. PLN).
Szczegółowe informacje dotyczące zaciągniętych przez Grupę kredytów
znajdują się w notach objaśniających do bilansu. 3
annualreport
34
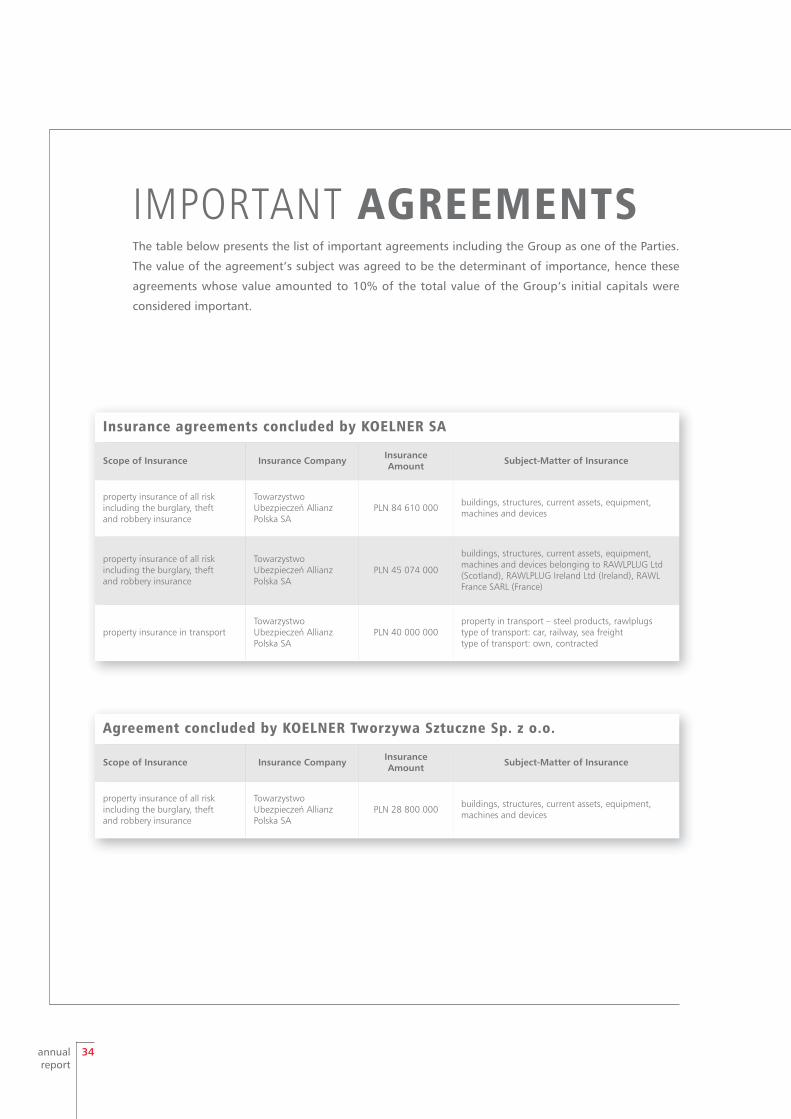
Agreement concluded by KOELNER Tworzywa Sztuczne Sp. z o.o.
Scope of Insurance Insurance Company Insurance Amount Subject-Matter of Insurance
property insurance of all risk including the burglary, theft and robbery insurance
Towarzystwo Ubezpieczeń Allianz Polska SA
PLN 28 800 000 buildings, structures, current assets, equipment, machines and devices
Insurance agreements concluded by KOELNER SA
Scope of Insurance Insurance Company Insurance Amount Subject-Matter of Insurance
property insurance of all risk including the burglary, theftand robbery insurance
Towarzystwo Ubezpieczeń Allianz Polska SA
PLN 84 610 000 buildings, structures, current assets, equipment, machines and devices
property insurance of all risk including the burglary, theft and robbery insurance
Towarzystwo Ubezpieczeń Allianz Polska SA
PLN 45 074 000
buildings, structures, current assets, equipment, machines and devices belonging to RAWLPLUG Ltd(Scotland), RAWLPLUG Ireland Ltd (Ireland), RAWLFrance SARL (France)
property insurance in transportTowarzystwo Ubezpieczeń Allianz Polska SA
PLN 40 000 000property in transport – steel products, rawlplugstype of transport: car, railway, sea freighttype of transport: own, contracted
IMPORTANT AGREEMENTSThe table below presents the list of important agreements including the Group as one of the Parties.
The value of the agreement’s subject was agreed to be the determinant of importance, hence these
agreements whose value amounted to 10% of the total value of the Group’s initial capitals were
considered important.
35 raportroczny
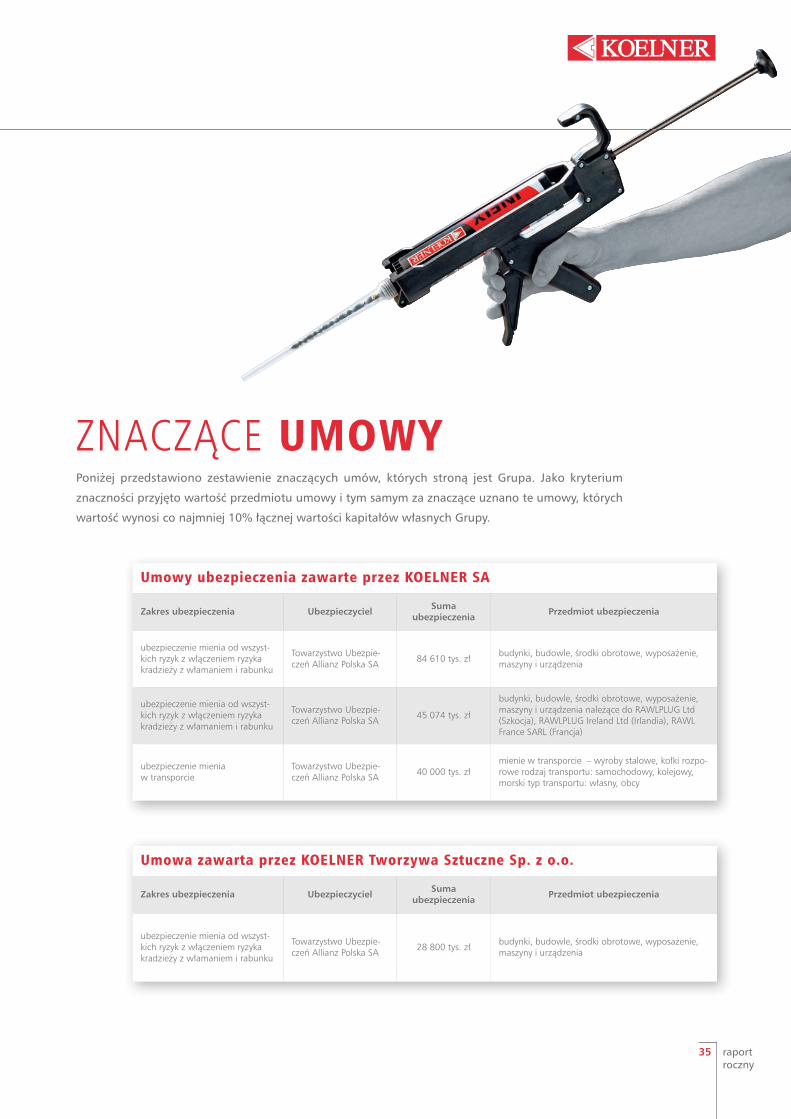
Umowa zawarta przez KOELNER Tworzywa Sztuczne Sp. z o.o.
Zakres ubezpieczenia Ubezpieczyciel Suma ubezpieczenia Przedmiot ubezpieczenia
ubezpieczenie mienia od wszyst-kich ryzyk z włączeniem ryzykakradzieży z włamaniem i rabunku
Towarzystwo Ubezpie-czeń Allianz Polska SA 28 800 tys. zł budynki, budowle, środki obrotowe, wyposażenie,
maszyny i urządzenia
Umowy ubezpieczenia zawarte przez KOELNER SA
Zakres ubezpieczenia Ubezpieczyciel Suma ubezpieczenia Przedmiot ubezpieczenia
ubezpieczenie mienia od wszyst-kich ryzyk z włączeniem ryzykakradzieży z włamaniem i rabunku
Towarzystwo Ubezpie-czeń Allianz Polska SA 84 610 tys. zł budynki, budowle, środki obrotowe, wyposażenie,
maszyny i urządzenia
ubezpieczenie mienia od wszyst-kich ryzyk z włączeniem ryzykakradzieży z włamaniem i rabunku
Towarzystwo Ubezpie-czeń Allianz Polska SA 45 074 tys. zł
budynki, budowle, środki obrotowe, wyposażenie,maszyny i urządzenia należące do RAWLPLUG Ltd(Szkocja), RAWLPLUG Ireland Ltd (Irlandia), RAWLFrance SARL (Francja)
ubezpieczenie mienia w transporcie
Towarzystwo Ubezpie-czeń Allianz Polska SA 40 000 tys. zł
mienie w transporcie – wyroby stalowe, kołki rozpo-rowe rodzaj transportu: samochodowy, kolejowy,morski typ transportu: własny, obcy
ZNACZĄCE UMOWYPoniżej przedstawiono zestawienie znaczących umów, których stroną jest Grupa. Jako kryterium
znaczności przyjęto wartość przedmiotu umowy i tym samym za znaczące uznano te umowy, których
wartość wynosi co najmniej 10% łącznej wartości kapitałów własnych Grupy.
annualreport
36
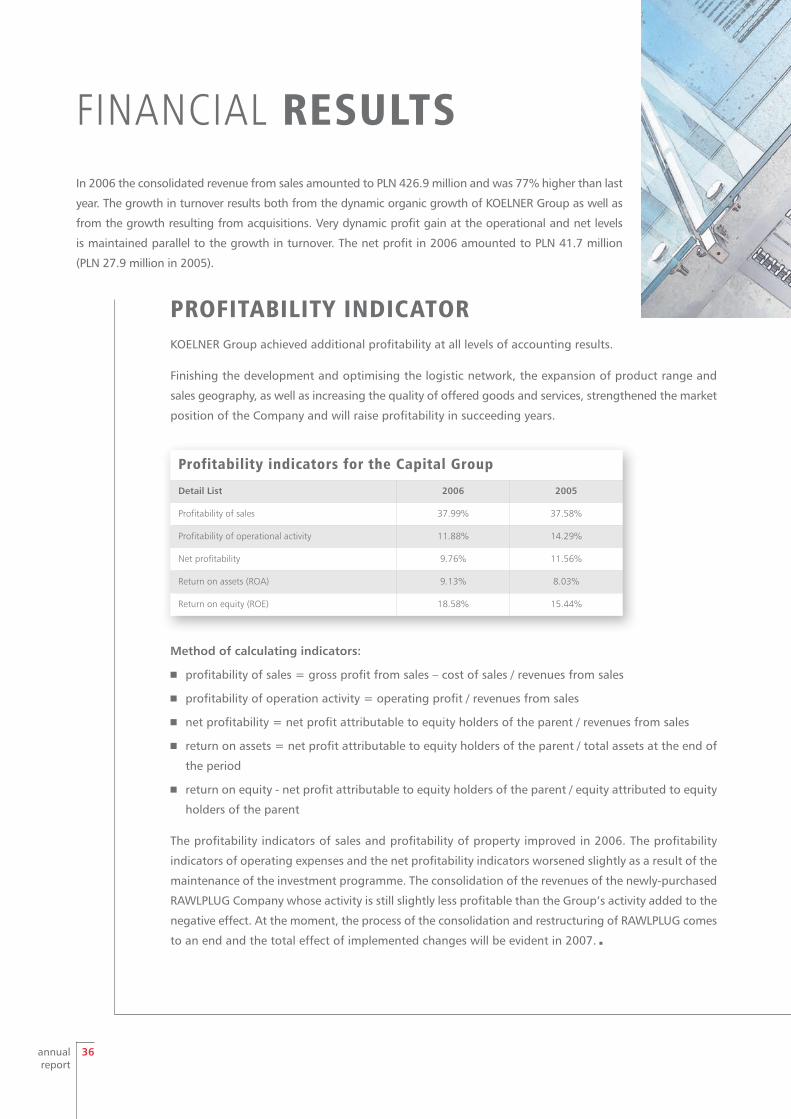
FINANCIAL RESULTSIn 2006 the consolidated revenue from sales amounted to PLN 426.9 million and was 77% higher than last
year. The growth in turnover results both from the dynamic organic growth of KOELNER Group as well as
from the growth resulting from acquisitions. Very dynamic profit gain at the operational and net levels
is maintained parallel to the growth in turnover. The net profit in 2006 amounted to PLN 41.7 million
(PLN 27.9 million in 2005).
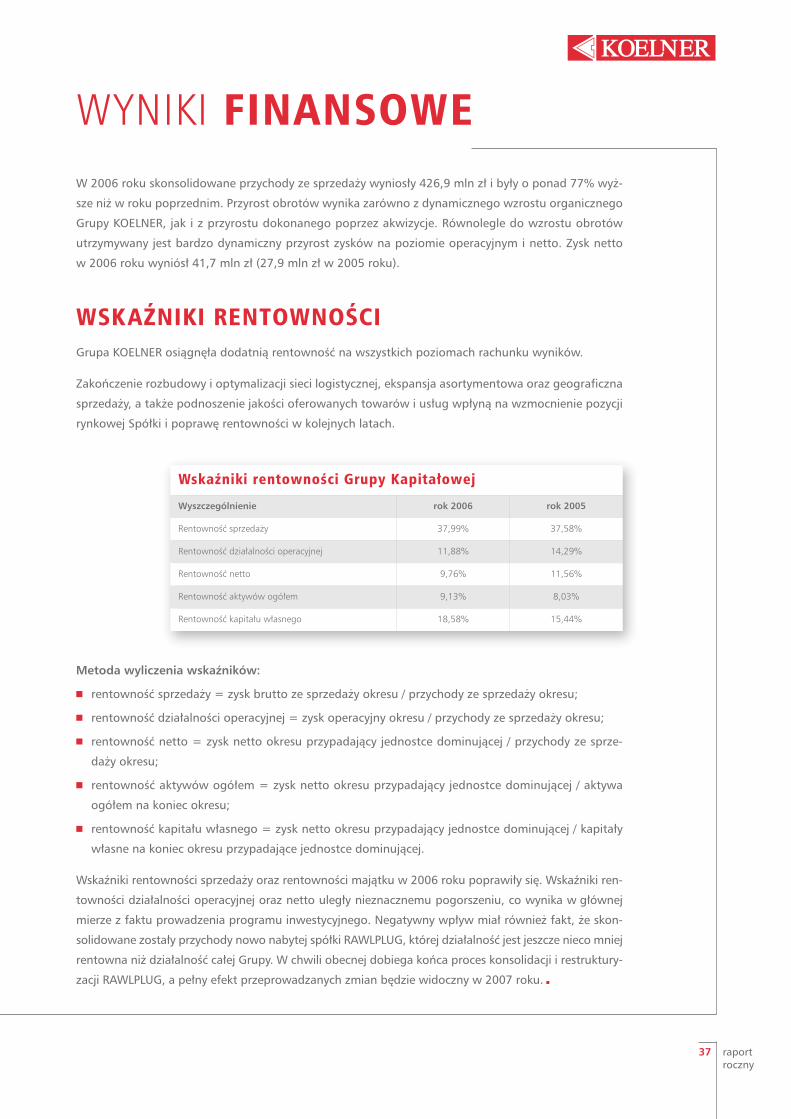
PROFITABILITY INDICATORKOELNER Group achieved additional profitability at all levels of accounting results.
Finishing the development and optimising the logistic network, the expansion of product range and
sales geography, as well as increasing the quality of offered goods and services, strengthened the market
position of the Company and will raise profitability in succeeding years.
Profitability indicators for the Capital Group
Detail List 2006 2005
Profitability of sales 37.99% 37.58%
Profitability of operational activity 11.88% 14.29%
Net profitability 9.76% 11.56%
Return on assets (ROA) 9.13% 8.03%
Return on equity (ROE) 18.58% 15.44%
Method of calculating indicators:
4 profitability of sales = gross profit from sales – cost of sales / revenues from sales
4 profitability of operation activity = operating profit / revenues from sales
4 net profitability = net profit attributable to equity holders of the parent / revenues from sales
4 return on assets = net profit attributable to equity holders of the parent / total assets at the end of
the period
4 return on equity - net profit attributable to equity holders of the parent / equity attributed to equity
holders of the parent
The profitability indicators of sales and profitability of property improved in 2006. The profitability
indicators of operating expenses and the net profitability indicators worsened slightly as a result of the
maintenance of the investment programme. The consolidation of the revenues of the newly-purchased
RAWLPLUG Company whose activity is still slightly less profitable than the Group’s activity added to the
negative effect. At the moment, the process of the consolidation and restructuring of RAWLPLUG comes
to an end and the total effect of implemented changes will be evident in 2007. 3
37 raportroczny
WYNIKI FINANSOWEW 2006 roku skonsolidowane przychody ze sprzedaży wyniosły 426,9 mln zł i były o ponad 77% wyż-
sze niż w roku poprzednim. Przyrost obrotów wynika zarówno z dynamicznego wzrostu organicznego
Grupy KOELNER, jak i z przyrostu dokonanego poprzez akwizycje. Równolegle do wzrostu obrotów
utrzymywany jest bardzo dynamiczny przyrost zysków na poziomie operacyjnym i netto. Zysk netto
w 2006 roku wyniósł 41,7 mln zł (27,9 mln zł w 2005 roku).
WSKAŹNIKI RENTOWNOŚCIGrupa KOELNER osiągnęła dodatnią rentowność na wszystkich poziomach rachunku wyników.
Zakończenie rozbudowy i optymalizacji sieci logistycznej, ekspansja asortymentowa oraz geograficzna
sprzedaży, a także podnoszenie jakości oferowanych towarów i usług wpłyną na wzmocnienie pozycji
rynkowej Spółki i poprawę rentowności w kolejnych latach.
Wskaźniki rentowności Grupy Kapitałowej
Wyszczególnienie rok 2006 rok 2005
Rentowność sprzedaży 37,99% 37,58%
Rentowność działalności operacyjnej 11,88% 14,29%
Rentowność netto 9,76% 11,56%
Rentowność aktywów ogółem 9,13% 8,03%
Rentowność kapitału własnego 18,58% 15,44%
Metoda wyliczenia wskaźników:
4 rentowność sprzedaży = zysk brutto ze sprzedaży okresu / przychody ze sprzedaży okresu;
4 rentowność działalności operacyjnej = zysk operacyjny okresu / przychody ze sprzedaży okresu;
4 rentowność netto = zysk netto okresu przypadający jednostce dominującej / przychody ze sprze-
daży okresu;
4 rentowność aktywów ogółem = zysk netto okresu przypadający jednostce dominującej / aktywa
ogółem na koniec okresu;
4 rentowność kapitału własnego = zysk netto okresu przypadający jednostce dominującej / kapitały
własne na koniec okresu przypadające jednostce dominującej.
Wskaźniki rentowności sprzedaży oraz rentowności majątku w 2006 roku poprawiły się. Wskaźniki ren-
towności działalności operacyjnej oraz netto uległy nieznacznemu pogorszeniu, co wynika w głównej
mierze z faktu prowadzenia programu inwestycyjnego. Negatywny wpływ miał również fakt, że skon-
solidowane zostały przychody nowo nabytej spółki RAWLPLUG, której działalność jest jeszcze nieco mniej
rentowna niż działalność całej Grupy. W chwili obecnej dobiega końca proces konsolidacji i restruktury-
zacji RAWLPLUG, a pełny efekt przeprowadzanych zmian będzie widoczny w 2007 roku. 3
annualreport
38
LIQUIDITY INDICATORSLiquidity indicators for the Group are in a range recognised as safe. These indicators were significantly
lower than in the previous year. Their reduction arose from the expenditure of resources obtained from
the issue for the achievement of the intended investment described in the investment prospectus. 3
Liquidity indicators of the Capital Group
Detail List 2006 2005
Current ratio 1.6 2.2
Quick ratio 0.8 1.1
Method of calculating indicators:
4 current ratio = current assets/current liabilities
4 quick ratio = (current assets – inventory) / current liabilities
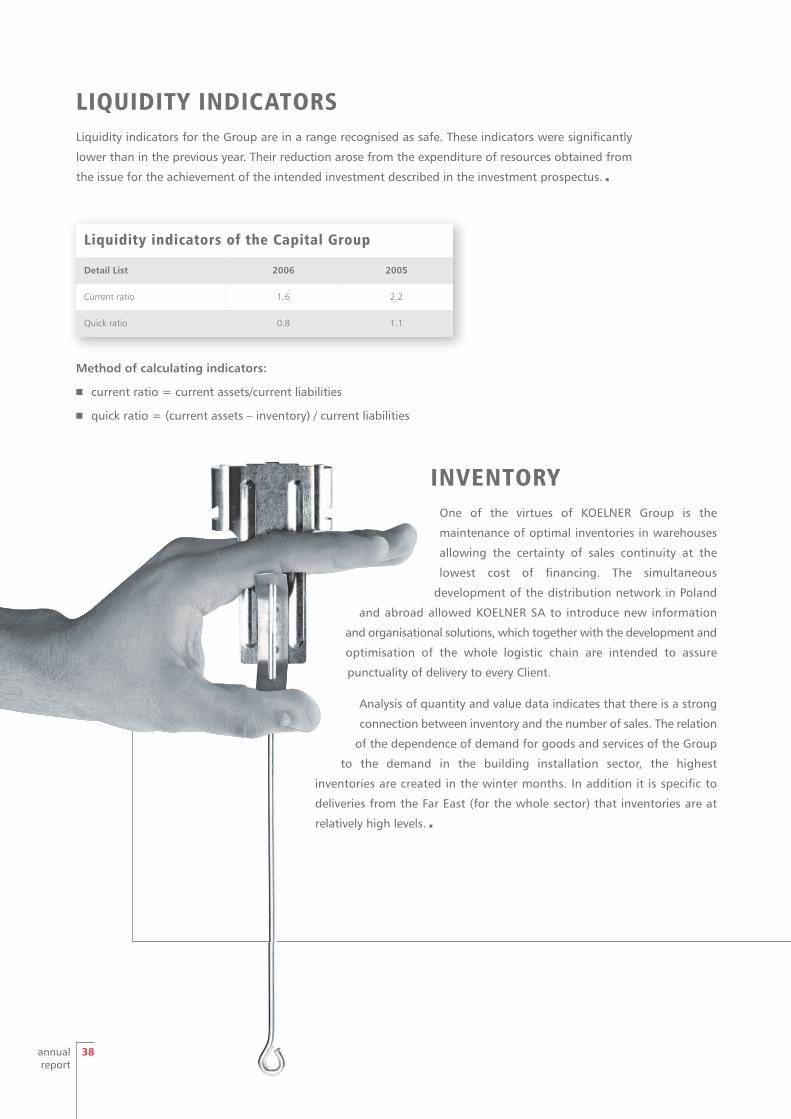
INVENTORYOne of the virtues of KOELNER Group is the
maintenance of optimal inventories in warehouses
allowing the certainty of sales continuity at the
lowest cost of financing. The simultaneous
development of the distribution network in Poland
and abroad allowed KOELNER SA to introduce new information
and organisational solutions, which together with the development and
optimisation of the whole logistic chain are intended to assure
punctuality of delivery to every Client.
Analysis of quantity and value data indicates that there is a strong
connection between inventory and the number of sales. The relation
of the dependence of demand for goods and services of the Group
to the demand in the building installation sector, the highest
inventories are created in the winter months. In addition it is specific to
deliveries from the Far East (for the whole sector) that inventories are at
relatively high levels. 3
39 raportroczny
WSKAŹNIKI PŁYNNOŚCIWskaźniki płynności dla Grupy znajdowały się w przedziałach uznawanych za bezpieczne. Wskaźniki te
były znacząco niższe niż w roku poprzednim. Ich spadek wynikał z wydatkowania środków pozyskanych
z emisji na realizację zamierzeń inwestycyjnych opisanych w prospekcie emisyjnym. 3
Wskaźniki płynności Grupy Kapitałowej
Wyszczególnienie rok 2006 rok 2005
Wskaźnik płynności bieżącej 1,6 2,2
Wskaźnik płynności szybkiej 0,8 1,1
Metoda wyliczenia wskaźników:
4 wskaźnik płynności bieżącej = aktywa obrotowe / zobowiązania krótkoterminowe
4 wskaźnik płynności szybkiej = (aktywa obrotowe – zapasy) / zobowiązania krótkoterminowe
ZAPASYGrupa, poprzez bieżący monitoring, dąży do utrzymywania optymalnych stanów magazynowych, po-
zwalających zapewnić ciągłość sprzedaży przy jak najniższym koszcie ich finansowania. Jednocześnie
stała rozbudowa sieci dystrybucji w kraju i za granicą powoduje, że KOELNER SA wprowadza nowe roz-
wiązania informatyczne i organizacyjne, które wraz z rozbudową i optymalizacją całego łańcucha
logistycznego, mają na celu zapewnienie terminowych dostaw do każdego Klienta.
Analiza danych ilościowych i wartościowych wskazuje, że istnieje silne powiązanie wysokości zapasów
z poziomem sprzedaży. W związku z uzależnieniem popytu na towary i produkty Grupy od popytu
w branży budowlano-montażowej, najwyższy poziom zapasów jest budowany w miesiącach zimowych.
Ponadto specyfika dostaw z Dalekiego Wschodu (dla całej branży) wymaga utrzymywania zapasów
towarów na stosunkowo wysokim poziomie. 3
annualreport
40
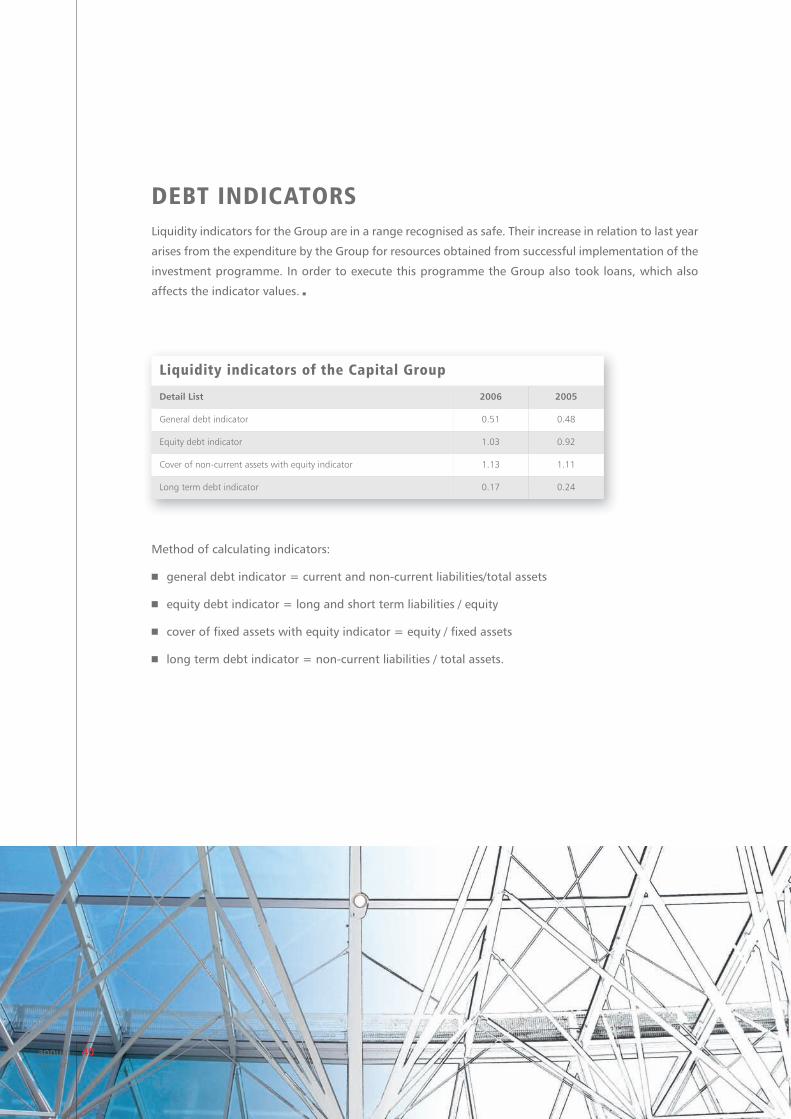
Method of calculating indicators:
4 general debt indicator = current and non-current liabilities/total assets
4 equity debt indicator = long and short term liabilities / equity
4 cover of fixed assets with equity indicator = equity / fixed assets
4 long term debt indicator = non-current liabilities / total assets.
DEBT INDICATORSLiquidity indicators for the Group are in a range recognised as safe. Their increase in relation to last year
arises from the expenditure by the Group for resources obtained from successful implementation of the
investment programme. In order to execute this programme the Group also took loans, which also
affects the indicator values. 3
Liquidity indicators of the Capital Group
Detail List 2006 2005
General debt indicator 0.51 0.48
Equity debt indicator 1.03 0.92
Cover of non-current assets with equity indicator 1.13 1.11
Long term debt indicator 0.17 0.24
41 raportroczny
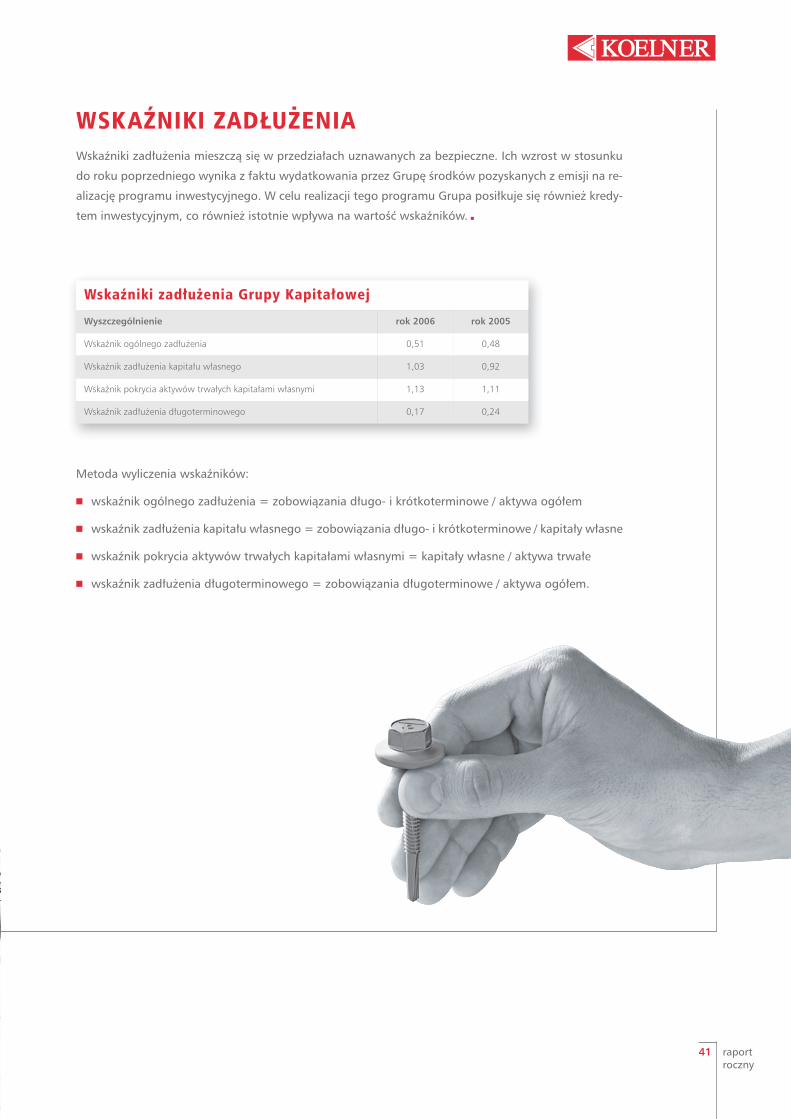
Metoda wyliczenia wskaźników:
4 wskaźnik ogólnego zadłużenia = zobowiązania długo- i krótkoterminowe / aktywa ogółem
4 wskaźnik zadłużenia kapitału własnego = zobowiązania długo- i krótkoterminowe / kapitały własne
4 wskaźnik pokrycia aktywów trwałych kapitałami własnymi = kapitały własne / aktywa trwałe
4 wskaźnik zadłużenia długoterminowego = zobowiązania długoterminowe / aktywa ogółem.
Wskaźniki zadłużenia Grupy Kapitałowej
Wyszczególnienie rok 2006 rok 2005
Wskaźnik ogólnego zadłużenia 0,51 0,48
Wskaźnik zadłużenia kapitału własnego 1,03 0,92
Wskaźnik pokrycia aktywów trwałych kapitałami własnymi 1,13 1,11
Wskaźnik zadłużenia długoterminowego 0,17 0,24
WSKAŹNIKI ZADŁUŻENIAWskaźniki zadłużenia mieszczą się w przedziałach uznawanych za bezpieczne. Ich wzrost w stosunku
do roku poprzedniego wynika z faktu wydatkowania przez Grupę środków pozyskanych z emisji na re-
alizację programu inwestycyjnego. W celu realizacji tego programu Grupa posiłkuje się również kredy-
tem inwestycyjnym, co również istotnie wpływa na wartość wskaźników. 3
annualreport
42
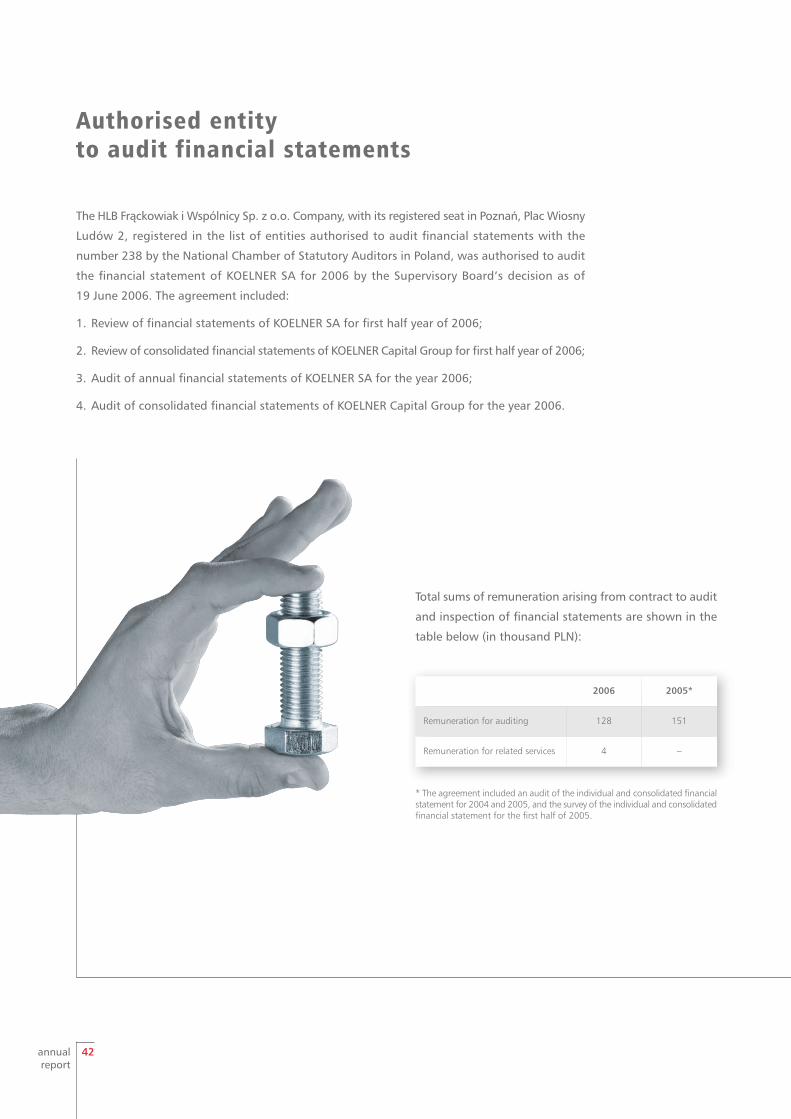
Authorised entityto audit financial statements
The HLB Frąckowiak i Wspólnicy Sp. z o.o. Company, with its registered seat in Poznań, Plac Wiosny
Ludów 2, registered in the list of entities authorised to audit financial statements with the
number 238 by the National Chamber of Statutory Auditors in Poland, was authorised to audit
the financial statement of KOELNER SA for 2006 by the Supervisory Board’s decision as of
19 June 2006. The agreement included:
1. Review of financial statements of KOELNER SA for first half year of 2006;
2. Review of consolidated financial statements of KOELNER Capital Group for first half year of 2006;
3. Audit of annual financial statements of KOELNER SA for the year 2006;
4. Audit of consolidated financial statements of KOELNER Capital Group for the year 2006.
2006 2005*
Remuneration for auditing 128 151
Remuneration for related services 4 –
Total sums of remuneration arising from contract to audit
and inspection of financial statements are shown in the
table below (in thousand PLN):
* The agreement included an audit of the individual and consolidated financialstatement for 2004 and 2005, and the survey of the individual and consolidatedfinancial statement for the first half of 2005.
43 raportroczny
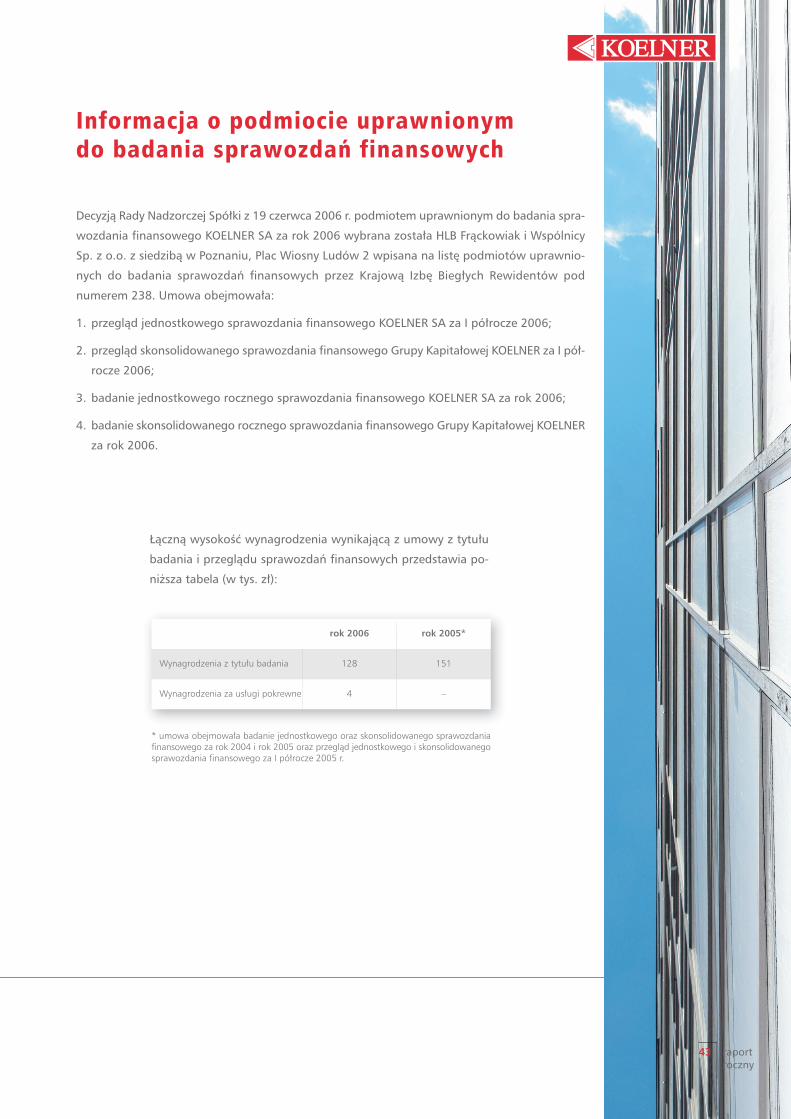
Informacja o podmiocie uprawnionym do badania sprawozdań finansowych
rok 2006 rok 2005*
Wynagrodzenia z tytułu badania 128 151
Wynagrodzenia za usługi pokrewne 4 –
* umowa obejmowała badanie jednostkowego oraz skonsolidowanego sprawozdania finansowego za rok 2004 i rok 2005 oraz przegląd jednostkowego i skonsolidowanegosprawozdania finansowego za I półrocze 2005 r.
Decyzją Rady Nadzorczej Spółki z 19 czerwca 2006 r. podmiotem uprawnionym do badania spra-
wozdania finansowego KOELNER SA za rok 2006 wybrana została HLB Frąckowiak i Wspólnicy
Sp. z o.o. z siedzibą w Poznaniu, Plac Wiosny Ludów 2 wpisana na listę podmiotów uprawnio-
nych do badania sprawozdań finansowych przez Krajową Izbę Biegłych Rewidentów pod
numerem 238. Umowa obejmowała:
1. przegląd jednostkowego sprawozdania finansowego KOELNER SA za I półrocze 2006;
2. przegląd skonsolidowanego sprawozdania finansowego Grupy Kapitałowej KOELNER za I pół-
rocze 2006;
3. badanie jednostkowego rocznego sprawozdania finansowego KOELNER SA za rok 2006;
4. badanie skonsolidowanego rocznego sprawozdania finansowego Grupy Kapitałowej KOELNER
za rok 2006.
Łączną wysokość wynagrodzenia wynikającą z umowy z tytułu
badania i przeglądu sprawozdań finansowych przedstawia po-
niższa tabela (w tys. zł):
annualreport
44
CORPORATEGOVERNANCEKOELNER SA fully observes all the accepted principles of corporate
governance defined in “Good practice in public companies in 2005”,
according to the statement made by the board of management of the
Company on the 30th of June 2005.
45 raportroczny
ZASADY ŁADU KORPORACYJNEGO
KOELNER SA w pełni przestrzega wszystkich przyjętych zasad ładu korpora-
cyjnego, określonych w „Dobrych praktykach w spółkach publicznych w 2005”,
zgodnie z oświadczeniem złożonym przez Zarząd Spółki 30 czerwca 2005 r.
annualreport
46
Until the day of the preparation of the consolidated financial statement of KOELNER SA Capital
Group the auditor inspecting the financial statement of the RAWLPLUG Ltd Capital Group (BDO
Stoy Hayward LLP Chartered Accountants) did not issue his opinion concerning the submitted
statement. The auditor’s stance is ambigous and makes no reference to the financial and
property situation of the RAWLPLUG Capital Group. It is worth mentioning that the individual
statements of RAWL France and Rawl Ireland were audited and the opinions issued do not include
any reservations. BDO Stoy Hayward LLP Chartered Accountants did not manage to outline their
position in reference to the audited statement either to the Management Board or to the general
auditor (HLB Frąckowiak i Wspólnicy) until the day of the preparation of the financial statement.
Radosław Koelner Tomasz Mogilski
President of the Management Board Vice-President of the Management Board
INFORMATION ON THE AUDIT OF THE
RAWLPLUG LTDCAPITAL GROUP

47 raportroczny
INFORMACJA NA TEMAT AUDYTUGRUPY KAPITAŁOWEJRAWLPLUG LTDDo dnia sporządzenia skonsolidowanego sprawozdania finansowego Grupy Kapitałowej KOELNER SA
audytor badający sprawozdanie finansowe Grupy Kapitałowej RAWLPLUG Ltd (BDO Stoy Hayward LLP
Chartered Accountants) nie ustosunkował się do przedłożonego sprawozdania. Stanowisko audytora
jest niezrozumiałe i niemające żadnych podstaw w sytuacji finansowej i majątkowej Grupy RAWLPLUG.
Należy nadmienić, że sprawozdania jednostkowe spółek RAWL France oraz RAWL Ireland zostały zbadane,
a wydane opinie nie zawierają żadnych zastrzeżeń. BDO Stoy Hayward LLP Chartered Accountants nie
zdążyło do dnia sporządzenia sprawozdania finansowego przedstawić ani Zarządowi, ani audytorowi
wiodącemu (HLB Frąckowiak i Wspólnicy) swojego stanowiska odnośnie badanego sprawozdania.
Radosław Koelner Tomasz Mogilski
Prezes Zarządu Wiceprezes Zarządu
annualreport
48
EXPERT AUDITOR’S OPINIONFor the Shareholders of KOELNER SA
We have audited the accompanying consolidated financial statements of the Capital Group in whichthe parent company is KOELNER SA (the Parent Company) with its registered office in Wrocław, ul. Kwidzyńska 6, prepared in accordance with the International Accounting Standards/InternationalFinancial Reporting Standards, comprising the following:
4 consolidated balance sheet as at December 31, 2006, with total assets of PLN 456 488 000 (in words: four hundred fifty six million four hundred eighty eight thousand zlotys),
4 consolidated profit and loss account for the period from January 1, 2006 to December 31, 2006, witha net profit of PLN 41 682 000 (in words: forty one million six hundred eighty two thousand zlotys),
4 consolidated statement of changes in equity, with a net increase in equity for the period fromJanuary 1, 2006 to December 31, 2006 of PLN 43 832 000 (in words: forty three million eight hundredthirty two thousand zlotys),
4 consolidated cash flow statement with a net cash outflow for the period from January 1, 2006 toDecember 31, 2006 of PLN 2 332 (in words: two thousand and three hundred thirty two zlotys),
4 additional notes and explanations.
The Management Board of the Parent Company is responsible for the preparation and fair presentationof these consolidated financial statements in accordance with the adopted accounting policy. Thisresponsibility includes: designing, implementing and maintaining internal controls relevant to thepreparation and fair presentation of consolidated financial statements, selecting and applying appropriate accounting policies and making accounting estimates that are reasonable in the circumstances.
Our responsibility was to audit the accompanying consolidated financial statements and to expressan opinion whether, based on our audit, these financial statements present fairly and truly all significant information for the estimation of the economic and financial position and the CapitalGroup’s financial results.
FINANCIAL STATEMENT

49 raportroczny
OPINIA NIEZALEŻNEGO BIEGŁEGO REWIDENTADla Akcjonariuszy KOELNER SA
Przeprowadziliśmy badanie załączonego skonsolidowanego sprawozdania finansowego Grupy Ka-pitałowej, w której jednostką dominującą jest KOELNER SA (Spółka Dominująca) z siedzibą we Wro-cławiu przy ul. Kwidzyńskiej 6, sporządzonego zgodnie z Międzynarodowymi StandardamiRachunkowości/Międzynarodowymi Standardami Sprawozdawczości Finansowej, obejmującego:
4 skonsolidowany bilans sporządzony na dzień 31 grudnia 2006 roku, który po stronie aktywów i pasywów wykazuje sumę 456 488 tysięcy złotych (słownie: czterysta pięćdziesiąt sześć milionówczterysta osiemdziesiąt osiem tysięcy złotych),
4 skonsolidowany rachunek zysków i strat za okres od 1 stycznia 2006 roku do 31 grudnia 2006roku wykazujący zysk netto w kwocie 41 682 tysiące złotych (słownie: czterdzieści jeden milio-nów sześćset osiemdziesiąt dwa tysiące złotych),
4 zestawienie zmian w skonsolidowanym kapitale własnym, wykazujące zwiększenie kapitału wła-snego w okresie od 1 stycznia 2006 roku do 31 grudnia 2006 roku o kwotę 43 832 tysiące zło-tych (słownie: czterdzieści trzy miliony osiemset trzydzieści dwa tysiące złotych),
4 skonsolidowany rachunek przepływów pieniężnych wykazujący zmniejszenie stanu środków pie-niężnych w okresie od 1 stycznia 2006 roku do 31 grudnia 2006 roku o kwotę 2 332 tysiące zło-tych (słownie: dwa miliony trzysta trzydzieści dwa tysiące złotych),
4 dodatkowe informacje i objaśnienia.
Za sporządzenie i rzetelną prezentację skonsolidowanego sprawozdania finansowego, zgodnegoz przyjętą polityką rachunkowości, odpowiada Zarząd Spółki Dominującej. Obowiązki z tym zwią-zane obejmują: zaprojektowanie, wdrożenie i zapewnienie działania kontroli wewnętrznej związanejze sporządzaniem i rzetelną prezentacją skonsolidowanych sprawozdań finansowych, dobór i za-stosowanie odpowiedniej polityki rachunkowości oraz dokonywanie, uzasadnionych w danych oko-licznościach, szacunków księgowych.
Naszym zadaniem było zbadanie załączonego skonsolidowanego sprawozdania finansowego i wyra-żenie opinii, na podstawie badania, czy sprawozdanie to przedstawia rzetelnie i jasno wszystkie infor-macje istotne dla oceny sytuacji majątkowej i finansowej oraz wyniku finansowego Grupy Kapitałowej.
SPRAWOZDANIE FINANSOWE
annualreport
50
We conducted our audit of the accompanying consolidated financial statements in accordancewith:
4 provisions of Chapter 7 of the Accounting Act of 29 September 1994 (uniform text: Journalof Laws of 2002, No. 76, 694, with further amendments) (the Accounting Act),
4 the auditing standards issued by the National Chamber of Statutory Auditors in Poland.
We planned and conducted our audit in order to obtain a reasonable assurance that the auditedconsolidated financial statements are free from material misstatement. The audit was largelybased on a random examination of evidence supporting the amounts and disclosures includedin the audited consolidated financial statements. The audit also included the assessment of theaccounting policies used by related companies and significant estimates made by the ParentCompany's Management Board as well as an evaluation of the overall presentation of the financial statements. We believe that our audit has provided a reasonable basis for expressingan opinion on the consolidated financial statements.
The consolidated financial statements of the Capital Group for the previous financial year, endedDecember 31, 2005, were audited by us last year. We issued at that time the auditor’s opinionabout this consolidated financial statement with a reservation regarding the financial statements of the consolidated subsidiaries for the period between 1 January 2005 and 31 December 2005, which were not submitted for the audit by an expert auditor.
The consolidated financial statement of the KOELNER SA Capital Group includes financial data oftwo direct subsidiaries and three subsidiaries comprising the RAWLPLUG Ltd Capital Group, beingat the lower stage of consolidation and whose financial statements were examined by expert auditors acting on the behalf of other authorised entities. The aggregate balance sheet totals, before consolidation exclusions, of the aforementioned companies constitute 34.3% ofthe balance sheet total of the Capital Group's consolidated financial statements without consolidation exclusions. The expert auditor acting on the behalf of a different authorised entity did not issue any opinion about the audited consolidated financial statement of the RAWLPLUG Ltd Capital Group, until the day ofour completion of the consolidated financialstatement of the KOELNER SA Capital Group. The consolidated balance sheet total of theRAWLPLUG Ltd Capital Group constitutes 23.6%of the balance sheet total of the consolidatedfinancial statement of the KOELNER SA Capital Group without exclusions from the consolidation.
51 raportroczny
Badanie załączonego skonsolidowanego sprawozdania finansowego przeprowadziliśmy sto-sownie do postanowień:
4 przepisów rozdziału 7 Ustawy z dnia 29 września 1994 roku o rachunkowości (tekst jednolity:Dz. U. z 2002 roku nr 76, poz. 694 z późniejszymi zmianami) (Ustawa),
4 norm wykonywania zawodu biegłego rewidenta, wydanych przez Krajową Radę Biegłych Rewidentów w Polsce.
Badanie to zaplanowaliśmy i przeprowadziliśmy w taki sposób, aby uzyskać wystarczającą pew-ność, że zbadane skonsolidowane sprawozdanie finansowe nie zawiera istotnych nieprawidło-wości. Badanie polegało na sprawdzeniu – w dużym stopniu w sposób wyrywkowy – dowodówi zapisów potwierdzających kwoty i informacje zawarte w zbadanym skonsolidowanym spra-wozdaniu finansowym. Badanie obejmowało też ocenę zastosowanych przez jednostki powią-zane zasad (polityki) rachunkowości, znaczących szacunków przeprowadzonych przez ZarządSpółki Dominującej, jak również ocenę ogólnej prezentacji skonsolidowanego sprawozdania finansowego. Uważamy, że przeprowadzone przez nas badanie dostarczyło wystarczającychpodstaw do wyrażenia opinii o skonsolidowanym sprawozdaniu finansowym.
Skonsolidowane sprawozdanie finansowe Grupy Kapitałowej za poprzedni rok obrotowy, za-kończony 31 grudnia 2005 roku, zbadaliśmy w roku ubiegłym. Wydaliśmy o tym skonsolido-wanym sprawozdaniu finansowym opinię z zastrzeżeniem, dotyczącym sprawozdań finansowychspółek zależnych objętych konsolidacją za okres od 1 stycznia 2005 roku do 31 grudnia 2005roku, a nie poddanych badaniu przez biegłego rewidenta.
Skonsolidowane sprawozdanie finansowe Grupy Kapitałowej KOELNER SA obejmuje dane finan-sowe dwóch spółek zależnych bezpośrednio oraz trzech spółek zależnych tworzących Grupę Kapitałową RAWLPLUG Ltd na niższym szczeblu konsolidacji, których sprawozdania finansowe byłybadane przez biegłych rewidentów działających w imieniu innych podmiotów uprawnionych.Skumulowana wielkość sum bilansowych, przed wyłączeniami konsolidacyjnymi, tych wspo-mnianych wyżej podmiotów stanowi 34,3% sumy bilansowej skonsolidowanego sprawozdania
finansowego Grupy Kapitałowej bez dokonywania wyłączeń konsolidacyjnych. Dodnia zakończenia przez nas badania skonsolidowanego sprawozdania finansowegoGrupy Kapitałowej KOELNER SA, biegły rewident działający w imieniu innego podmiotuuprawnionego nie ustosunkował się do badanego skonsolidowanego sprawozdaniafinansowego Grupy Kapitałowej RAWLPLUG Ltd Skonsolidowana suma bilansowaGrupy Kapitałowej RAWLPLUG Ltd stanowi 23,6% sumy bilansowej skonsolidowanegosprawozdania finansowego Grupy Kapitałowej KOELNER SA bez dokonywania wyłą-czeń konsolidacyjnych.
annualreport
52
The financial statements of nine subsidiaries included in the consolidated financial statement were not audited by the expert auditors. The accumulated value of the balance sheet totals of the above-mentionedcompanies and the accumulated value of the net revenue from the sales of products and goods and finan-cial operations, before the exclusions from the consolidation, constitute 7.3% of the balance sheet and 14.2%of the net revenue from the sales of products and goods and financial operations of the consolidated financial statement of the Capital Group without exclusions from the consolidation.
In our opinion, except for the potential effects of the matters presented above, the audited consolidated financial statements, including the figures and explanations:
4 present truly and fairly all information material for the assessment of the Capital Group's financial position as at December 31, 2006 as well as its financial result for the financial year from January 1, 2006to December 31, 2006,
4 were prepared, in all material respects, correctly, i.e. in accordance with the accounting principles (policy)resulting from the International Accounting Standards, International Financial Reporting Standards and related interpretations published in the form of European Commission regulations and to the extent notregulated in those Standards – in accordance with the provisions of the Accounting Act and regulationsissued on the basis thereof,
4 the statement presents data being in line with the requirements of the Regulation of the Minister of Financeof 19 October 2005 in reference to current and periodic information conveyed by issuers of securities(Journal of Laws of 2005, no. 209, item 1744),
4 comply with the laws affecting the content of the consolidated financial statements.
We have read the Parent Company's Management Board Report on the business operations of the CapitalGroup for the period from January 1, 2006 to December 31, 2006. In our opinion this Report meets the material requirements of Art. 49 clause 2 of the Accounting Act as well as the regulations of the Regulationof the Minister of Finance of October 19, 2005 regarding current and periodic information disclosed by issuers of securities. Disclosures included in this Report, derived from the consolidated financial statementsaudited by us, are consistent with them.
Sławomir Mirkowski Cecylia Pol
Statutory Auditor President of the Management Board
No. 9639/7208. HLB Frąckowiak i Wspólnicy Sp. z o.o., Poznań, pl. Wiosny Ludów 2, Registered to audit financial statements by National Chamber of Statutory Auditors; reg. No. 238
Statutory Auditor no. 5282/782
Poznań, June 4, 2007.
53 raportroczny
Sprawozdania finansowe dziewięciu spółek zależnych, objęte skonsolidowanym sprawozdaniem finanso-wym, nie były badane przez biegłych rewidentów. Skumulowana wielkość sum bilansowych tych wspo-mnianych wyżej spółek oraz skumulowana wielkość przychodów netto ze sprzedaży produktów i towaróworaz operacji finansowych, przed wyłączeniami konsolidacyjnymi, stanowi 7,3% sumy bilansowej oraz 14,2%przychodów netto ze sprzedaży produktów i towarów oraz operacji finansowych skonsolidowanego spra-wozdania finansowego Grupy Kapitałowej bez dokonywania wyłączeń konsolidacyjnych.
Naszym zdaniem, z wyjątkiem skutków kwestii przedstawionych wyżej, zbadane skonsolidowane sprawoz-danie finansowe, obejmujące dane liczbowe i objaśnienia słowne:
4 przedstawia rzetelnie i jasno wszystkie informacje istotne dla oceny sytuacji majątkowej i finansowej GrupyKapitałowej na dzień 31 grudnia 2006 roku, jak też jej wyniku finansowego za rok obrotowy od 1 stycznia2006 roku do 31 grudnia 2006 roku,
4 sporządzone zostało we wszystkich istotnych aspektach prawidłowo, to jest zgodnie z zasadami (polityką)rachunkowości, wynikającymi z Międzynarodowych Standardów Rachunkowości, Międzynarodowych Stan-dardów Sprawozdawczości Finansowej oraz związanych z nimi interpretacji ogłoszonych w formie roz-porządzeń Komisji Europejskiej, a w zakresie nieuregulowanym w tych Standardach – stosownie dowymogów Ustawy o rachunkowości i wydanych na jej podstawie przepisów wykonawczych,
4 prezentuje dane zgodnie z wymogami Rozporządzenia Ministra Finansów z dnia 19 października 2005 rokuw sprawie informacji bieżących i okresowych przekazywanych przez emitentów papierów wartościowych(Dz. U. z 2005 roku nr 209, poz. 1744),
4 jest zgodne z wpływającymi na treść skonsolidowanego sprawozdania finansowego przepisami prawa.
Zapoznaliśmy się ze sporządzonym przez Zarząd Spółki Dominującej sprawozdaniem z działalności GrupyKapitałowej za okres od 1 stycznia 2006 roku do 31 grudnia 2006 roku. Naszym zdaniem sprawozdanie tospełnia istotne wymogi art. 49 ust. 2 Ustawy o rachunkowości oraz przepisów Rozporządzenia Ministra Finansów z dnia 19 października 2005 roku w sprawie informacji bieżących i okresowych przekazywanychprzez emitentów papierów wartościowych. Zawarte w tym sprawozdaniu z działalności kwoty i informacjepochodzące ze zbadanego przez nas skonsolidowanego sprawozdania finansowego są z nim zgodne.
Sławomir Mirkowski Cecylia Pol
Biegły Rewident Prezes Zarządu
Nr 9639/7208. HLB Frąckowiak i Wspólnicy Sp. z o.o., Poznań, pl. Wiosny Ludów 2, podmiot uprawniony do badania sprawozdań finansowych, wpisany na listę podmiotów uprawnionych do badania pod numerem 238
Biegły Rewident nr 5282/782
Poznań, dnia 4 czerwca 2007 roku.

annualreport
54
Wybrane dane finansowe skonsolidowane | Selected financial dataw tys. zł / PLN thousand w tys. EUR / EUR thousand
2006 2005 2006 2005
Przychody netto ze sprzedaży produktów,towarów i materiałów
Net income resulting from the sales of products,goods, and materials 426 876 241 318 109 481 59 980
Zysk (strata) z działalności operacyjnej Operating profit (loss) 50 601 34 275 12 978 8 519
Zysk (strata) brutto Profit (loss) before tax 48 754 34 208 12 504 8 503
Zysk (strata) netto Net profit (loss) 41 682 27 919 10 690 6 939
Zysk (strata) netto przypadający akcjonariuszomjednostki dominującej
Net profit (loss) attributable to equity holders ofthe parent 39 841 27 619 10 218 6 865
Przepływy pieniężne netto z działalnościoperacyjnej Net cash from/(used in) operating activities 10 222 9 151 2 622 2 275
Przepływy pieniężne netto z działalnościinwestycyjnej Net cash from/(used in) investing activities (40 569) (110 390) (10 405) (27 438)
Przepływy pieniężne netto z działalnościfinansowej Net cash from/(used in) financing activities 28 015 75 319 7 185 18 721
Przepływy pieniężne netto, razem Total net cash flow (2 332) (25 920) (598) (6 442)
Aktywa razem Total assets 456 488 347 081 119 150 89 922
Zobowiązania długoterminowe Non-current liabilities 76 054 81 859 19 851 21 208
Zobowiązania krótkoterminowe Current liabilities 156 066 84 685 40 735 21 940
Kapitał własny przypadający akcjonariuszomjednostki dominującej
Equity attributable to equity holders of theparent 216 094 174 651 56 404 45 249
Kapitał zakładowy Share capital 30 521 30 335 7 966 7 859
Średnia ważona liczba akcji Weighted average number of shares 30 356 026 30 042 360 30 356 026 30 042 360
Zysk (strata) na jedną akcję zwykłą (w zł / EUR) Profit (loss) per ordinary share (in PLN / EUR) 1,31 0,92 0,34 0,23
Liczba akcji na dzień bilansowy Number of shares in balance sheet date 30 520 600 30 335 200 30 520 600 30 335 200
Wartość księgowa na jedną akcję (w zł / EUR) Book value per share (in PLN / EUR) 7,08 5,76 1,85 1,49
Wszystkie dane w tys. PLN, jeśli nie wskazano inaczej.All amounts in PLN thousands unless otherwise indicated.
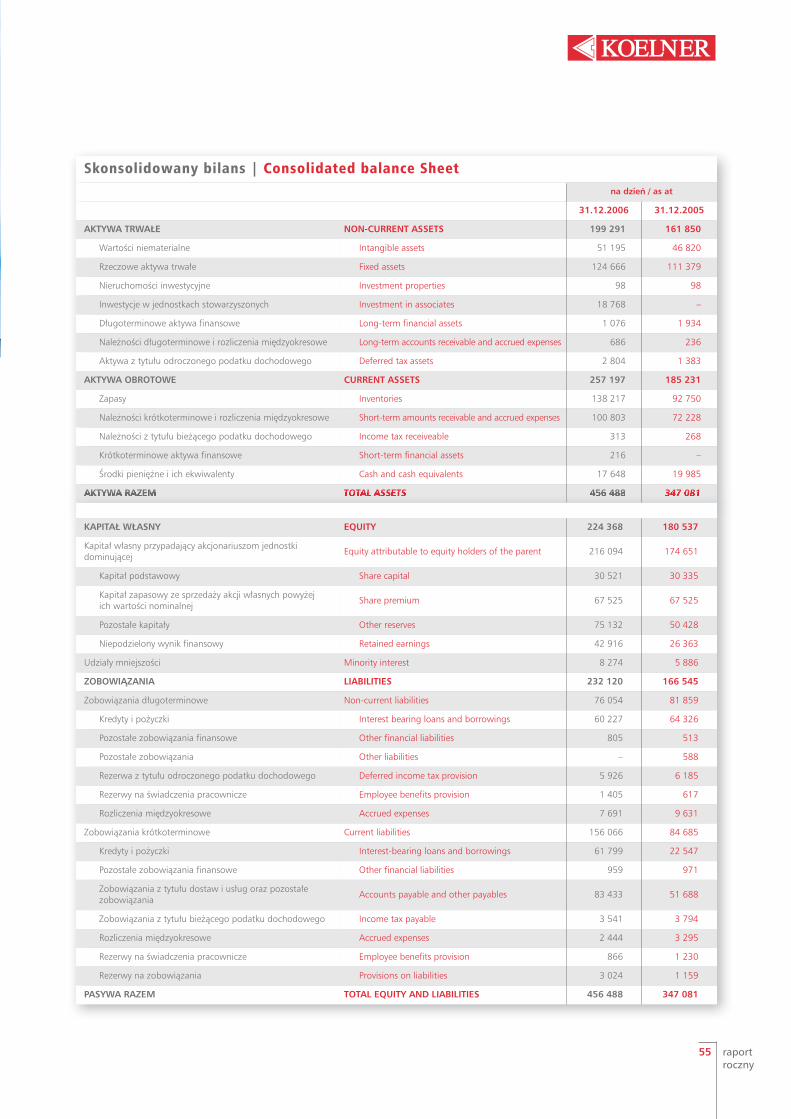
Skonsolidowany bilans | Consolidated balance Sheetna dzień / as at
31.12.2006 31.12.2005
AKTYWA TRWAŁE NON-CURRENT ASSETS 199 291 161 850
Wartości niematerialne Intangible assets 51 195 46 820
Rzeczowe aktywa trwałe Fixed assets 124 666 111 379
Nieruchomości inwestycyjne Investment properties 98 98
Inwestycje w jednostkach stowarzyszonych Investment in associates 18 768 –
Długoterminowe aktywa finansowe Long-term financial assets 1 076 1 934
Należności długoterminowe i rozliczenia międzyokresowe Long-term accounts receivable and accrued expenses 686 236
Aktywa z tytułu odroczonego podatku dochodowego Deferred tax assets 2 804 1 383
AKTYWA OBROTOWE CURRENT ASSETS 257 197 185 231
Zapasy Inventories 138 217 92 750
Należności krótkoterminowe i rozliczenia międzyokresowe Short-term amounts receivable and accrued expenses 100 803 72 228
Należności z tytułu bieżącego podatku dochodowego Income tax receiveable 313 268
Krótkoterminowe aktywa finansowe Short-term financial assets 216 –
Środki pieniężne i ich ekwiwalenty Cash and cash equivalents 17 648 19 985
AKTYWA RAZEM TOTAL ASSETS 456 488 347 081
55 raportroczny
KAPITAŁ WŁASNY EQUITY 224 368 180 537
Kapitał własny przypadający akcjonariuszom jednostkidominującej Equity attributable to equity holders of the parent 216 094 174 651
Kapitał podstawowy Share capital 30 521 30 335
Kapitał zapasowy ze sprzedaży akcji własnych powyżej ich wartości nominalnej Share premium 67 525 67 525
Pozostałe kapitały Other reserves 75 132 50 428
Niepodzielony wynik finansowy Retained earnings 42 916 26 363
Udziały mniejszości Minority interest 8 274 5 886
ZOBOWIĄZANIA LIABILITIES 232 120 166 545
Zobowiązania długoterminowe Non-current liabilities 76 054 81 859
Kredyty i pożyczki Interest bearing loans and borrowings 60 227 64 326
Pozostałe zobowiązania finansowe Other financial liabilities 805 513
Pozostałe zobowiązania Other liabilities – 588
Rezerwa z tytułu odroczonego podatku dochodowego Deferred income tax provision 5 926 6 185
Rezerwy na świadczenia pracownicze Employee benefits provision 1 405 617
Rozliczenia międzyokresowe Accrued expenses 7 691 9 631
Zobowiązania krótkoterminowe Current liabilities 156 066 84 685
Kredyty i pożyczki Interest-bearing loans and borrowings 61 799 22 547
Pozostałe zobowiązania finansowe Other financial liabilities 959 971
Zobowiązania z tytułu dostaw i usług oraz pozostałezobowiązania Accounts payable and other payables 83 433 51 688
Zobowiązania z tytułu bieżącego podatku dochodowego Income tax payable 3 541 3 794
Rozliczenia międzyokresowe Accrued expenses 2 444 3 295
Rezerwy na świadczenia pracownicze Employee benefits provision 866 1 230
Rezerwy na zobowiązania Provisions on liabilities 3 024 1 159
PASYWA RAZEM TOTAL EQUITY AND LIABILITIES 456 488 347 081
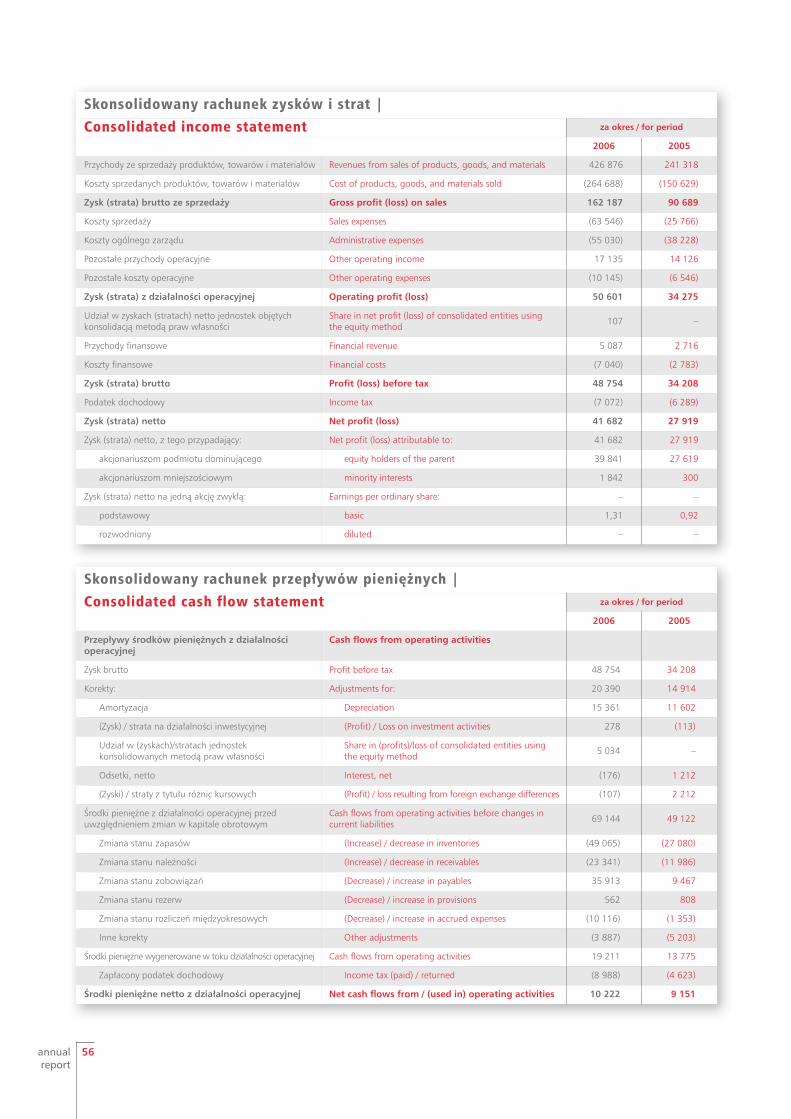
annualreport
56
Skonsolidowany rachunek zysków i strat | Consolidated income statement za okres / for period
2006 2005
Przychody ze sprzedaży produktów, towarów i materiałów Revenues from sales of products, goods, and materials 426 876 241 318
Koszty sprzedanych produktów, towarów i materiałów Cost of products, goods, and materials sold (264 688) (150 629)
Zysk (strata) brutto ze sprzedaży Gross profit (loss) on sales 162 187 90 689
Koszty sprzedaży Sales expenses (63 546) (25 766)
Koszty ogólnego zarządu Administrative expenses (55 030) (38 228)
Pozostałe przychody operacyjne Other operating income 17 135 14 126
Pozostałe koszty operacyjne Other operating expenses (10 145) (6 546)
Zysk (strata) z działalności operacyjnej Operating profit (loss) 50 601 34 275
Udział w zyskach (stratach) netto jednostek objętychkonsolidacją metodą praw własności
Share in net profit (loss) of consolidated entities usingthe equity method 107 –
Przychody finansowe Financial revenue 5 087 2 716
Koszty finansowe Financial costs (7 040) (2 783)
Zysk (strata) brutto Profit (loss) before tax 48 754 34 208
Podatek dochodowy Income tax (7 072) (6 289)
Zysk (strata) netto Net profit (loss) 41 682 27 919
Zysk (strata) netto, z tego przypadający: Net profit (loss) attributable to: 41 682 27 919
akcjonariuszom podmiotu dominującego equity holders of the parent 39 841 27 619
akcjonariuszom mniejszościowym minority interests 1 842 300
Zysk (strata) netto na jedną akcję zwykłą: Earnings per ordinary share: – –
podstawowy basic 1,31 0,92
rozwodniony diluted – –
Skonsolidowany rachunek przepływów pieniężnych | Consolidated cash flow statement za okres / for period
2006 2005
Przepływy środków pieniężnych z działalnościoperacyjnej
Cash flows from operating activities
Zysk brutto Profit before tax 48 754 34 208
Korekty: Adjustments for: 20 390 14 914
Amortyzacja Depreciation 15 361 11 602
(Zysk) / strata na działalności inwestycyjnej (Profit) / Loss on investment activities 278 (113)
Udział w (zyskach)/stratach jednostekkonsolidowanych metodą praw własności
Share in (profits)/loss of consolidated entities using the equity method 5 034 –
Odsetki, netto Interest, net (176) 1 212
(Zyski) / straty z tytułu różnic kursowych (Profit) / loss resulting from foreign exchange differences (107) 2 212
Środki pieniężne z działalności operacyjnej przeduwzględnieniem zmian w kapitale obrotowym
Cash flows from operating activities before changes incurrent liabilities 69 144 49 122
Zmiana stanu zapasów (Increase) / decrease in inventories (49 065) (27 080)
Zmiana stanu należności (Increase) / decrease in receivables (23 341) (11 986)
Zmiana stanu zobowiązań (Decrease) / increase in payables 35 913 9 467
Zmiana stanu rezerw (Decrease) / increase in provisions 562 808
Zmiana stanu rozliczeń międzyokresowych (Decrease) / increase in accrued expenses (10 116) (1 353)
Inne korekty Other adjustments (3 887) (5 203)
Środki pieniężne wygenerowane w toku działalności operacyjnej Cash flows from operating activities 19 211 13 775
Zapłacony podatek dochodowy Income tax (paid) / returned (8 988) (4 623)
Środki pieniężne netto z działalności operacyjnej Net cash flows from / (used in) operating activities 10 222 9 151
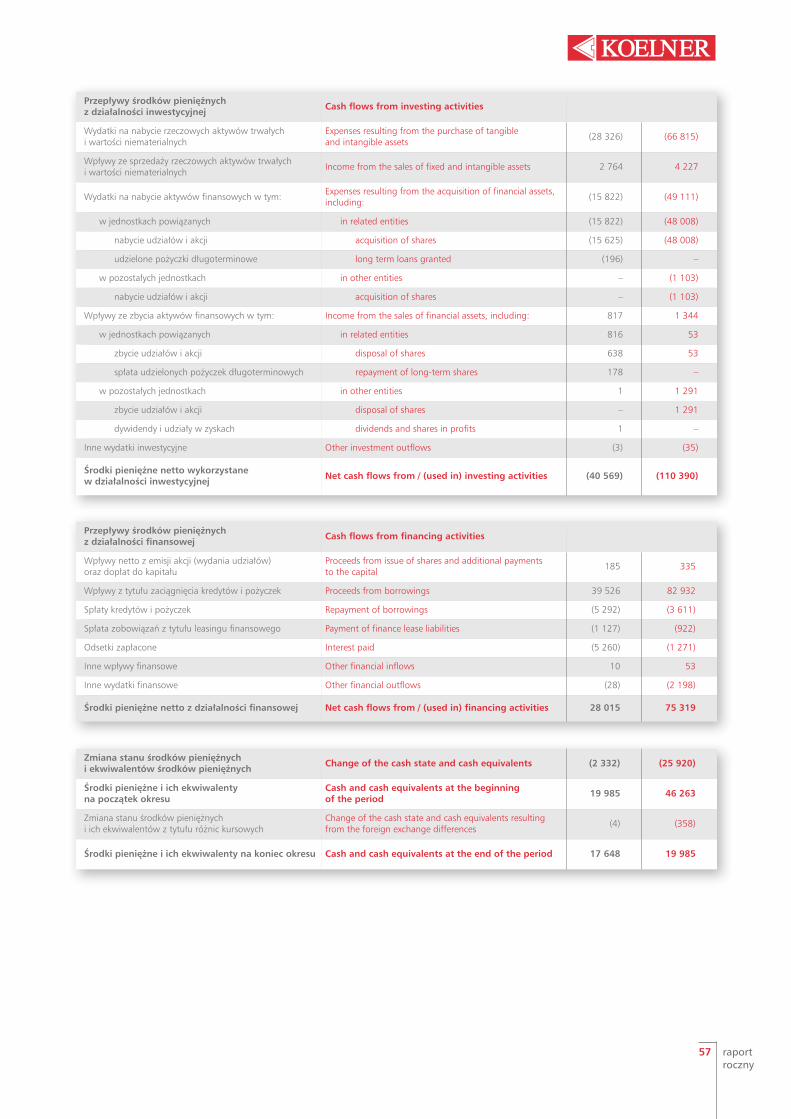
57 raportroczny
Przepływy środków pieniężnych z działalności finansowej Cash flows from financing activities
Wpływy netto z emisji akcji (wydania udziałów) oraz dopłat do kapitału
Proceeds from issue of shares and additional payments to the capital 185 335
Wpływy z tytułu zaciągnięcia kredytów i pożyczek Proceeds from borrowings 39 526 82 932
Spłaty kredytów i pożyczek Repayment of borrowings (5 292) (3 611)
Spłata zobowiązań z tytułu leasingu finansowego Payment of finance lease liabilities (1 127) (922)
Odsetki zapłacone Interest paid (5 260) (1 271)
Inne wpływy finansowe Other financial inflows 10 53
Inne wydatki finansowe Other financial outflows (28) (2 198)
Środki pieniężne netto z działalności finansowej Net cash flows from / (used in) financing activities 28 015 75 319
Zmiana stanu środków pieniężnych i ekwiwalentów środków pieniężnych Change of the cash state and cash equivalents (2 332) (25 920)
Środki pieniężne i ich ekwiwalenty na początek okresu
Cash and cash equivalents at the beginning of the period 19 985 46 263
Zmiana stanu środków pieniężnych i ich ekwiwalentów z tytułu różnic kursowych
Change of the cash state and cash equivalents resultingfrom the foreign exchange differences (4) (358)
Środki pieniężne i ich ekwiwalenty na koniec okresu Cash and cash equivalents at the end of the period 17 648 19 985
Przepływy środków pieniężnych z działalności inwestycyjnej Cash flows from investing activities
Wydatki na nabycie rzeczowych aktywów trwałychi wartości niematerialnych
Expenses resulting from the purchase of tangible and intangible assets (28 326) (66 815)
Wpływy ze sprzedaży rzeczowych aktywów trwałychi wartości niematerialnych Income from the sales of fixed and intangible assets 2 764 4 227
Wydatki na nabycie aktywów finansowych w tym: Expenses resulting from the acquisition of financial assets,including: (15 822) (49 111)
w jednostkach powiązanych in related entities (15 822) (48 008)
nabycie udziałów i akcji acquisition of shares (15 625) (48 008)
udzielone pożyczki długoterminowe long term loans granted (196) –
w pozostałych jednostkach in other entities – (1 103)
nabycie udziałów i akcji acquisition of shares – (1 103)
Wpływy ze zbycia aktywów finansowych w tym: Income from the sales of financial assets, including: 817 1 344
w jednostkach powiązanych in related entities 816 53
zbycie udziałów i akcji disposal of shares 638 53
spłata udzielonych pożyczek długoterminowych repayment of long-term shares 178 –
w pozostałych jednostkach in other entities 1 1 291
zbycie udziałów i akcji disposal of shares – 1 291
dywidendy i udziały w zyskach dividends and shares in profits 1 –
Inne wydatki inwestycyjne Other investment outflows (3) (35)
Środki pieniężne netto wykorzystane w działalności inwestycyjnej Net cash flows from / (used in) investing activities (40 569) (110 390)
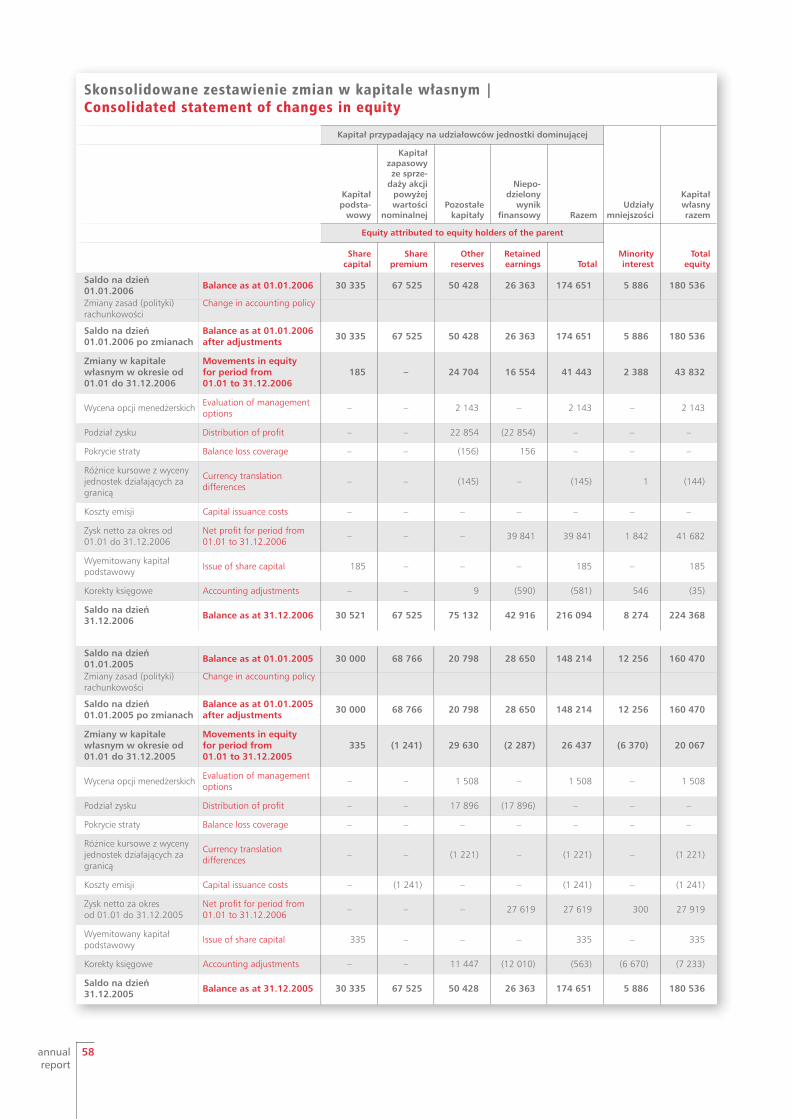
annualreport
58
Skonsolidowane zestawienie zmian w kapitale własnym |Consolidated statement of changes in equity
Kapitał przypadający na udziałowców jednostki dominującej
Udziałymniejszości
Kapitał własnyrazem
Kapitałpodsta-
wowy
Kapitał zapasowyze sprze-
daży akcjipowyżejwartości
nominalnejPozostałe
kapitały
Niepo-dzielony
wynikfinansowy Razem
Equity attributed to equity holders of the parent
Minorityinterest
Total equity
Sharecapital
Sharepremium
Otherreserves
Retainedearnings Total
Saldo na dzień01.01.2006 Balance as at 01.01.2006 30 335 67 525 50 428 26 363 174 651 5 886 180 536
Zmiany zasad (polityki)rachunkowości
Change in accounting policy
Saldo na dzień01.01.2006 po zmianach
Balance as at 01.01.2006after adjustments 30 335 67 525 50 428 26 363 174 651 5 886 180 536
Zmiany w kapitalewłasnym w okresie od01.01 do 31.12.2006
Movements in equity for period from 01.01 to 31.12.2006
185 – 24 704 16 554 41 443 2 388 43 832
Wycena opcji menedżerskich Evaluation of managementoptions – – 2 143 – 2 143 – 2 143
Podział zysku Distribution of profit – – 22 854 (22 854) – – –
Pokrycie straty Balance loss coverage – – (156) 156 – – –
Różnice kursowe z wycenyjednostek działających zagranicą
Currency translationdifferences – – (145) – (145) 1 (144)
Koszty emisji Capital issuance costs – – – – – – –
Zysk netto za okres od 01.01 do 31.12.2006
Net profit for period from01.01 to 31.12.2006 – – – 39 841 39 841 1 842 41 682
Wyemitowany kapitałpodstawowy Issue of share capital 185 – – – 185 – 185
Korekty księgowe Accounting adjustments – – 9 (590) (581) 546 (35)
Saldo na dzień31.12.2006 Balance as at 31.12.2006 30 521 67 525 75 132 42 916 216 094 8 274 224 368
Saldo na dzień01.01.2005 Balance as at 01.01.2005 30 000 68 766 20 798 28 650 148 214 12 256 160 470
Zmiany zasad (polityki)rachunkowości
Change in accounting policy
Saldo na dzień01.01.2005 po zmianach
Balance as at 01.01.2005after adjustments 30 000 68 766 20 798 28 650 148 214 12 256 160 470
Zmiany w kapitalewłasnym w okresie od01.01 do 31.12.2005
Movements in equity for period from 01.01 to 31.12.2005
335 (1 241) 29 630 (2 287) 26 437 (6 370) 20 067
Wycena opcji menedżerskich Evaluation of managementoptions – – 1 508 – 1 508 – 1 508
Podział zysku Distribution of profit – – 17 896 (17 896) – – –
Pokrycie straty Balance loss coverage – – – – – – –
Różnice kursowe z wycenyjednostek działających zagranicą
Currency translationdifferences – – (1 221) – (1 221) – (1 221)
Koszty emisji Capital issuance costs – (1 241) – – (1 241) – (1 241)
Zysk netto za okres od 01.01 do 31.12.2005
Net profit for period from01.01 to 31.12.2006 – – – 27 619 27 619 300 27 919
Wyemitowany kapitałpodstawowy Issue of share capital 335 – – – 335 – 335
Korekty księgowe Accounting adjustments – – 11 447 (12 010) (563) (6 670) (7 233)
Saldo na dzień31.12.2005 Balance as at 31.12.2005 30 335 67 525 50 428 26 363 174 651 5 886 180 536
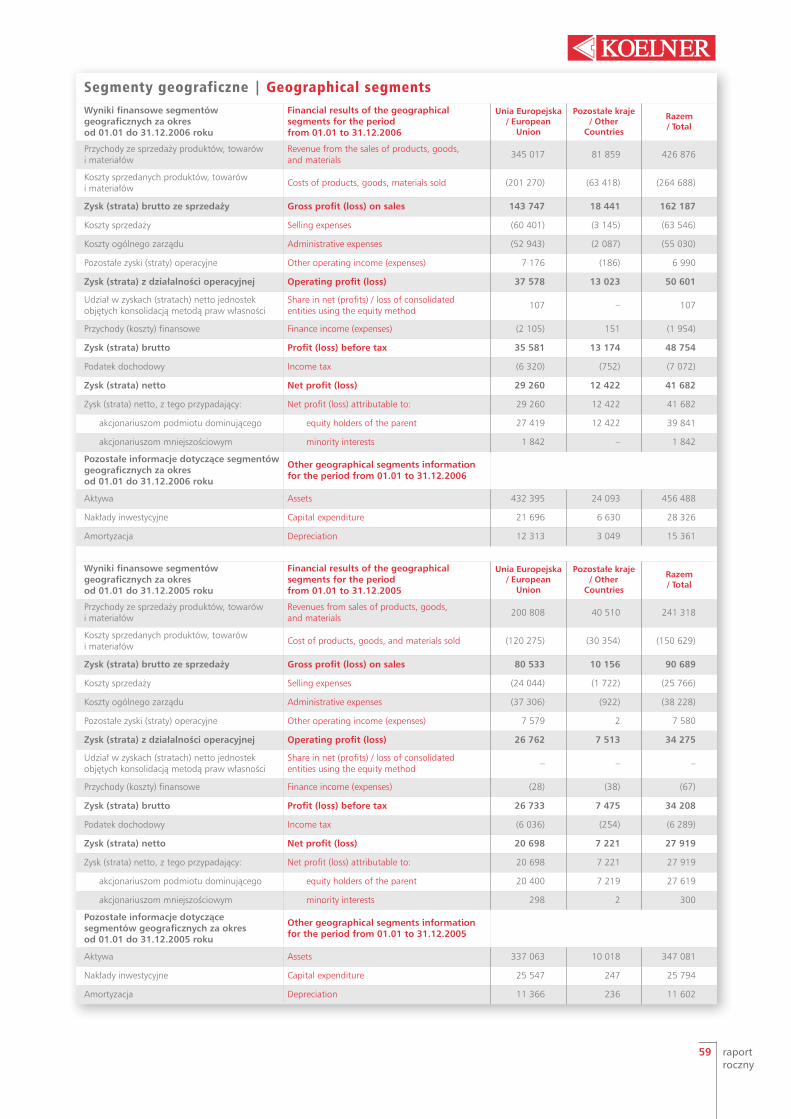
59 raportroczny
Segmenty geograficzne | Geographical segmentsWyniki finansowe segmentówgeograficznych za okres od 01.01 do 31.12.2006 roku
Financial results of the geographicalsegments for the period from 01.01 to 31.12.2006
Unia Europejska/ European
Union
Pozostałe kraje / Other
Countries
Razem / Total
Przychody ze sprzedaży produktów, towarówi materiałów
Revenue from the sales of products, goods, and materials 345 017 81 859 426 876
Koszty sprzedanych produktów, towarówi materiałów Costs of products, goods, materials sold (201 270) (63 418) (264 688)
Zysk (strata) brutto ze sprzedaży Gross profit (loss) on sales 143 747 18 441 162 187
Koszty sprzedaży Selling expenses (60 401) (3 145) (63 546)
Koszty ogólnego zarządu Administrative expenses (52 943) (2 087) (55 030)
Pozostałe zyski (straty) operacyjne Other operating income (expenses) 7 176 (186) 6 990
Zysk (strata) z działalności operacyjnej Operating profit (loss) 37 578 13 023 50 601
Udział w zyskach (stratach) netto jednostekobjętych konsolidacją metodą praw własności
Share in net (profits) / loss of consolidatedentities using the equity method 107 – 107
Przychody (koszty) finansowe Finance income (expenses) (2 105) 151 (1 954)
Zysk (strata) brutto Profit (loss) before tax 35 581 13 174 48 754
Podatek dochodowy Income tax (6 320) (752) (7 072)
Zysk (strata) netto Net profit (loss) 29 260 12 422 41 682
Zysk (strata) netto, z tego przypadający: Net profit (loss) attributable to: 29 260 12 422 41 682
akcjonariuszom podmiotu dominującego equity holders of the parent 27 419 12 422 39 841
akcjonariuszom mniejszościowym minority interests 1 842 – 1 842
Pozostałe informacje dotyczące segmentówgeograficznych za okres od 01.01 do 31.12.2006 roku
Other geographical segments informationfor the period from 01.01 to 31.12.2006
Aktywa Assets 432 395 24 093 456 488
Nakłady inwestycyjne Capital expenditure 21 696 6 630 28 326
Amortyzacja Depreciation 12 313 3 049 15 361
Wyniki finansowe segmentówgeograficznych za okres od 01.01 do 31.12.2005 roku
Financial results of the geographicalsegments for the period from 01.01 to 31.12.2005
Unia Europejska/ European
Union
Pozostałe kraje / Other
Countries
Razem / Total
Przychody ze sprzedaży produktów, towarówi materiałów
Revenues from sales of products, goods, and materials 200 808 40 510 241 318
Koszty sprzedanych produktów, towarówi materiałów Cost of products, goods, and materials sold (120 275) (30 354) (150 629)
Zysk (strata) brutto ze sprzedaży Gross profit (loss) on sales 80 533 10 156 90 689
Koszty sprzedaży Selling expenses (24 044) (1 722) (25 766)
Koszty ogólnego zarządu Administrative expenses (37 306) (922) (38 228)
Pozostałe zyski (straty) operacyjne Other operating income (expenses) 7 579 2 7 580
Zysk (strata) z działalności operacyjnej Operating profit (loss) 26 762 7 513 34 275
Udział w zyskach (stratach) netto jednostekobjętych konsolidacją metodą praw własności
Share in net (profits) / loss of consolidatedentities using the equity method – – –
Przychody (koszty) finansowe Finance income (expenses) (28) (38) (67)
Zysk (strata) brutto Profit (loss) before tax 26 733 7 475 34 208
Podatek dochodowy Income tax (6 036) (254) (6 289)
Zysk (strata) netto Net profit (loss) 20 698 7 221 27 919
Zysk (strata) netto, z tego przypadający: Net profit (loss) attributable to: 20 698 7 221 27 919
akcjonariuszom podmiotu dominującego equity holders of the parent 20 400 7 219 27 619
akcjonariuszom mniejszościowym minority interests 298 2 300
Pozostałe informacje dotyczące segmentów geograficznych za okres od 01.01 do 31.12.2005 roku
Other geographical segments informationfor the period from 01.01 to 31.12.2005
Aktywa Assets 337 063 10 018 347 081
Nakłady inwestycyjne Capital expenditure 25 547 247 25 794
Amortyzacja Depreciation 11 366 236 11 602
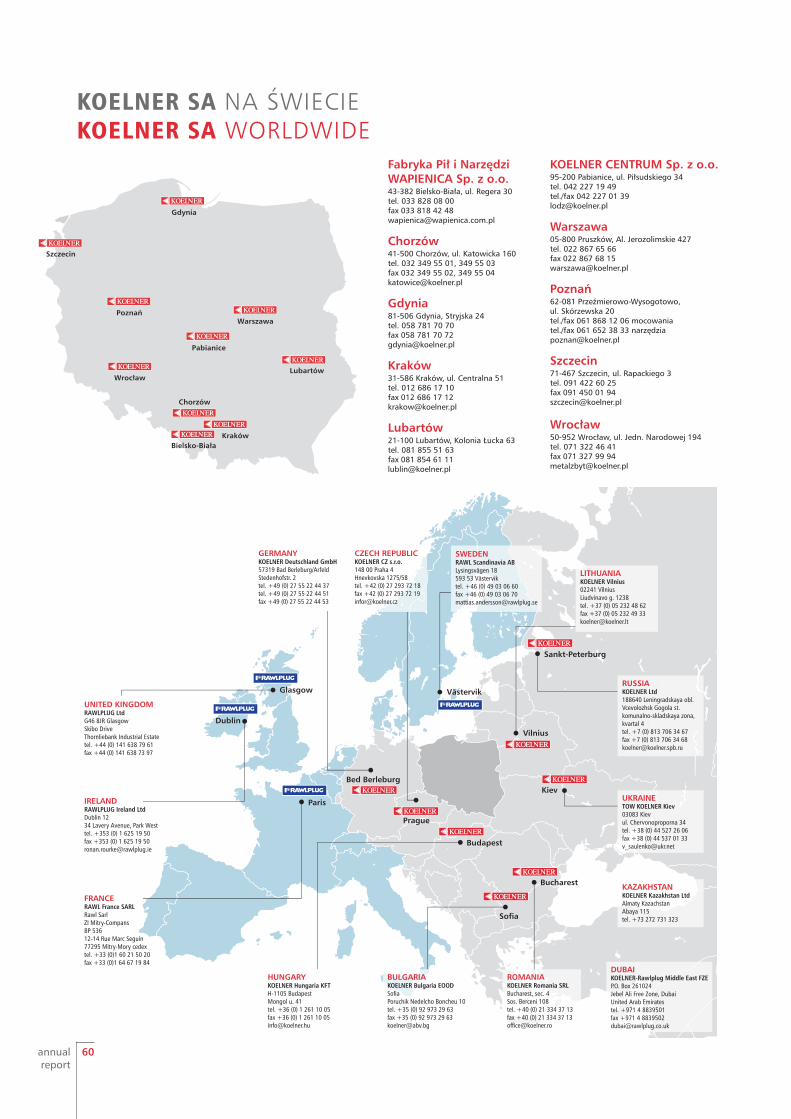
Dublin
Glasgow
Paris
Bucharest
Sofia
Vilnius
Prague
Kiev
Budapest
Bed Berleburg
Sankt-Peterburg
GERMANYKOELNER Deutschland GmbH57319 Bad Berleburg/ArfeldStedenhofstr. 2tel. +49 (0) 27 55 22 44 37tel. +49 (0) 27 55 22 44 51fax +49 (0) 27 55 22 44 53
UNITED KINGDOMRAWLPLUG LtdG46 8JR GlasgowSkibo DriveThornliebank Industrial Estatetel. +44 (0) 141 638 79 61fax +44 (0) 141 638 73 97
FRANCERAWL France SARLRawl SarlZI Mitry-CompansBP 53612-14 Rue Marc Seguin77295 Mitry-Mory cedextel. +33 (0)1 60 21 50 20 fax +33 (0)1 64 67 19 84
IRELANDRAWLPLUG Ireland LtdDublin 1234 Lavery Avenue, Park Westtel. +353 (0) 1 625 19 50fax +353 (0) 1 625 19 [email protected]
CZECH REPUBLICKOELNER CZ s.r.o.148 00 Praha 4Hnevkovska 1275/58tel. +42 (0) 27 293 72 18fax +42 (0) 27 293 72 [email protected]
RUSSIAKOELNER Ltd188640 Leningradskaya obl.Vcevolozhsk Gogola st.komunalno-skladskaya zona,kvartal 4tel. +7 (0) 813 706 34 67fax +7 (0) 813 706 34 [email protected]
KAZAKHSTANKOELNER Kazakhstan LtdAlmaty KazachstanAbaya 115tel. +73 272 731 323
BULGARIAKOELNER Bulgaria EOODSofiaPoruchik Nedelcho Boncheu 10tel. +35 (0) 92 973 29 63fax +35 (0) 92 973 29 [email protected]
LITHUANIAKOELNER Vilnius02241 VilniusLiudvinavo g. 1238tel. +37 (0) 05 232 48 62fax +37 (0) 05 232 49 33 [email protected]
UKRAINETOW KOELNER Kiev03083 Kievul. Chervonoproporna 34tel. +38 (0) 44 527 26 06fax +38 (0) 44 537 01 [email protected]
ROMANIAKOELNER Romania SRLBucharest, sec. 4Sos. Berceni 108tel. +40 (0) 21 334 37 13fax +40 (0) 21 334 37 [email protected]
DUBAIKOELNER-Rawlplug Middle East FZEP.O. Box 261024Jebel Ali Free Zone, DubaiUnited Arab Emiratestel. +971 4 8839501fax +971 4 [email protected]
HUNGARYKOELNER Hungaria KFTH-1105 BudapestMongol u. 41tel. +36 (0) 1 261 10 05fax +36 (0) 1 261 10 [email protected]
SWEDENRAWL Scandinavia ABLysingsvägen 18593 53 Västerviktel. +46 (0) 49 03 06 60fax +46 (0) 49 03 06 [email protected]
Västervik
annualreport
60
Lubartów
Kraków
Szczecin
Gdynia
Poznań
Wrocław
Warszawa
Pabianice
Bielsko-Biała
Chorzów
KOELNER SA NA ŚWIECIEKOELNER SA WORLDWIDE
Fabryka Pił i Narzędzi WAPIENICA Sp. z o.o. 43-382 Bielsko-Biała, ul. Regera 30tel. 033 828 08 00 fax 033 818 42 48 [email protected]
Chorzów41-500 Chorzów, ul. Katowicka 160 tel. 032 349 55 01, 349 55 03fax 032 349 55 02, 349 55 [email protected]
Gdynia81-506 Gdynia, Stryjska 24 tel. 058 781 70 70 fax 058 781 70 [email protected]
Kraków 31-586 Kraków, ul. Centralna 51 tel. 012 686 17 10 fax 012 686 17 12 [email protected]
Lubartów21-100 Lubartów, Kolonia Łucka 63 tel. 081 855 51 63 fax 081 854 61 11 [email protected]
KOELNER CENTRUM Sp. z o.o.95-200 Pabianice, ul. Piłsudskiego 34 tel. 042 227 19 49 tel./fax 042 227 01 39 [email protected]
Warszawa05-800 Pruszków, Al. Jerozolimskie 427 tel. 022 867 65 66 fax 022 867 68 15 [email protected]
Poznań62-081 Przeźmierowo-Wysogotowo, ul. Skórzewska 20 tel./fax 061 868 12 06 mocowaniatel./fax 061 652 38 33 narzę[email protected]
Szczecin71-467 Szczecin, ul. Rapackiego 3 tel. 091 422 60 25 fax 091 450 01 94 [email protected]
Wrocław50-952 Wrocław, ul. Jedn. Narodowej 194 tel. 071 322 46 41 fax 071 327 99 94 [email protected]
KOELNER SAul. Kwidzyńska 6 51-416 Wrocław tel. + 48 71 32 60 100 fax + 48 71 37 26 111
e-mail: [email protected]