Porównanie systemów szkolnych według raportów PISA, TALIS...
19
Środowiskowe Seminarium Dydaktyki Fizyki Porównanie systemów szkolnych wedlug raportów PISA, TALIS, OECD Grzegorz Karwasz Kierownik Zakladu Dydaktyki Fizyki UMK Toruń, 16.03. 2011
Transcript of Porównanie systemów szkolnych według raportów PISA, TALIS...
Środowiskowe Seminarium
Dydaktyki Fizyki
Porównanie systemów szkolnych
według raportów PISA, TALIS, OECD
Grzegorz KarwaszKierownik Zakładu Dydaktyki Fizyki UMK
Toruń, 16.03. 2011
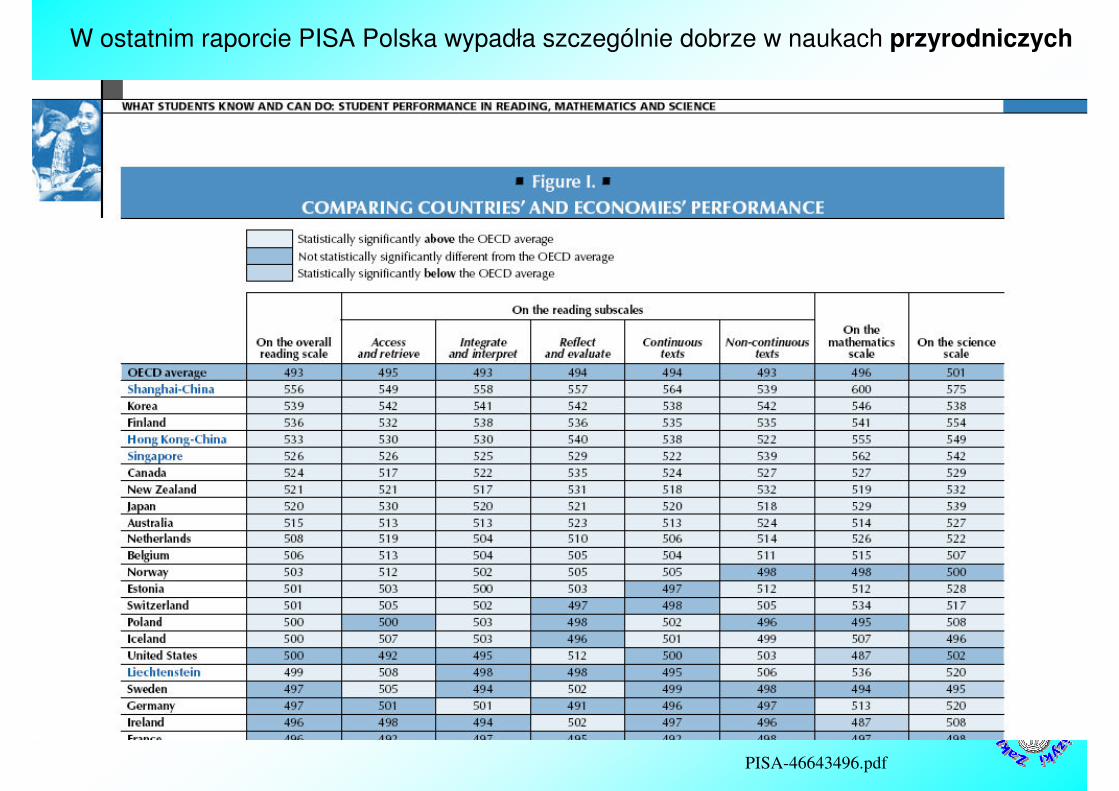
W ostatnim raporcie PISA Polska wypadła szczególnie dobrze w naukach przyrodniczych
PISA-46643496.pdf
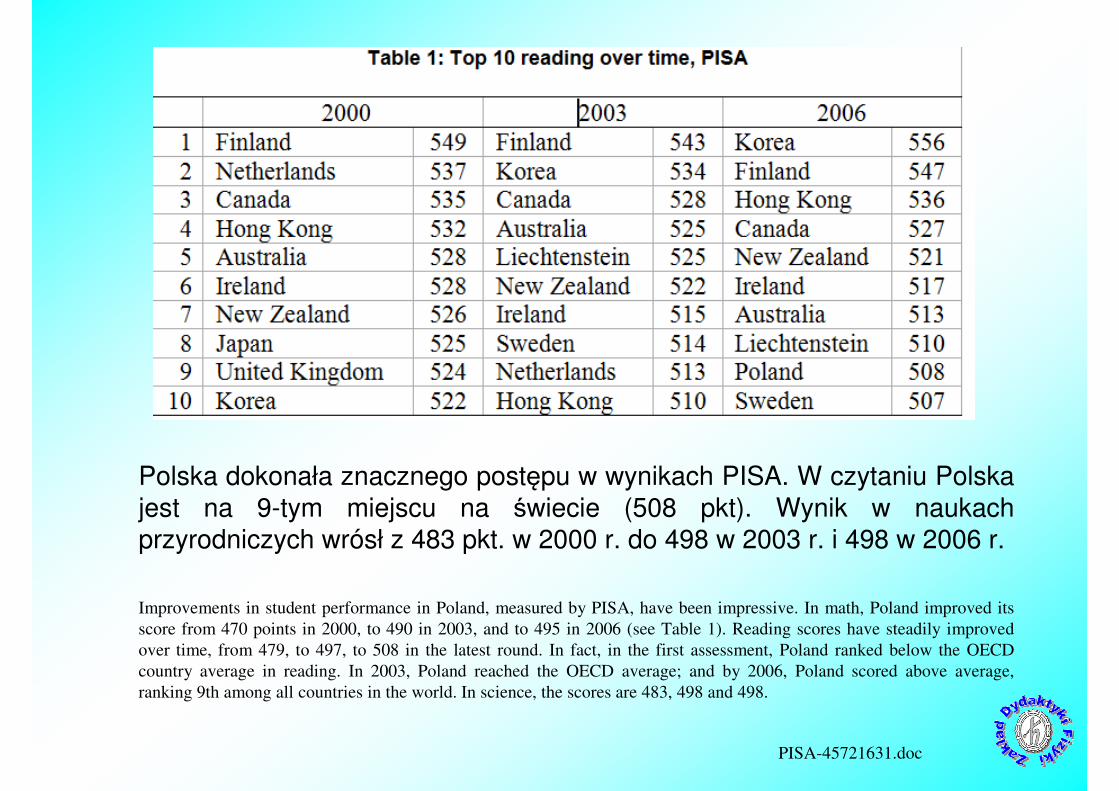
Polska dokonała znacznego postępu w wynikach PISA. W czytaniu Polska
jest na 9-tym miejscu na świecie (508 pkt). Wynik w naukach przyrodniczych wrósł z 483 pkt. w 2000 r. do 498 w 2003 r. i 498 w 2006 r.
Improvements in student performance in Poland, measured by PISA, have been impressive. In math, Poland improved its
score from 470 points in 2000, to 490 in 2003, and to 495 in 2006 (see Table 1). Reading scores have steadily improved
over time, from 479, to 497, to 508 in the latest round. In fact, in the first assessment, Poland ranked below the OECD
country average in reading. In 2003, Poland reached the OECD average; and by 2006, Poland scored above average,
ranking 9th among all countries in the world. In science, the scores are 483, 498 and 498.
PISA-45721631.doc
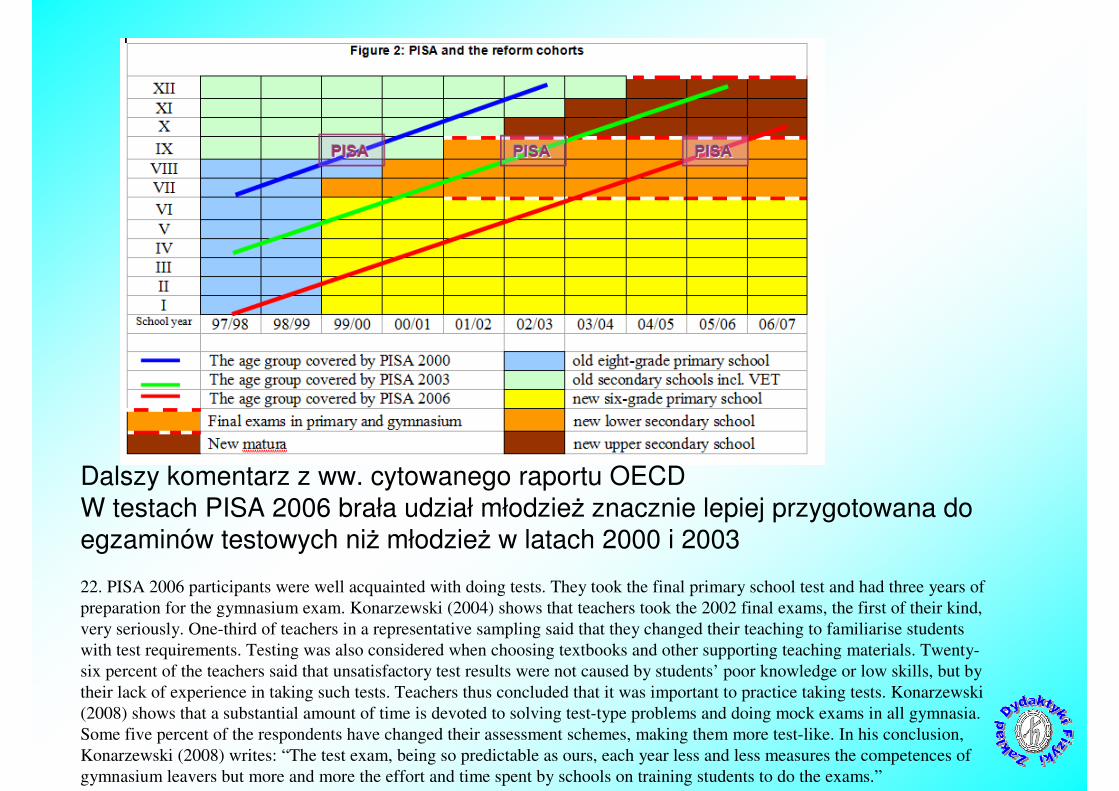
Dalszy komentarz z ww. cytowanego raportu OECD
W testach PISA 2006 brała udział młodzież znacznie lepiej przygotowana doegzaminów testowych niż młodzież w latach 2000 i 2003
22. PISA 2006 participants were well acquainted with doing tests. They took the final primary school test and had three years of
preparation for the gymnasium exam. Konarzewski (2004) shows that teachers took the 2002 final exams, the first of their kind,
very seriously. One-third of teachers in a representative sampling said that they changed their teaching to familiarise students
with test requirements. Testing was also considered when choosing textbooks and other supporting teaching materials. Twenty-
six percent of the teachers said that unsatisfactory test results were not caused by students’ poor knowledge or low skills, but by
their lack of experience in taking such tests. Teachers thus concluded that it was important to practice taking tests. Konarzewski
(2008) shows that a substantial amount of time is devoted to solving test-type problems and doing mock exams in all gymnasia.
Some five percent of the respondents have changed their assessment schemes, making them more test-like. In his conclusion,
Konarzewski (2008) writes: “The test exam, being so predictable as ours, each year less and less measures the competences of
gymnasium leavers but more and more the effort and time spent by schools on training students to do the exams.”
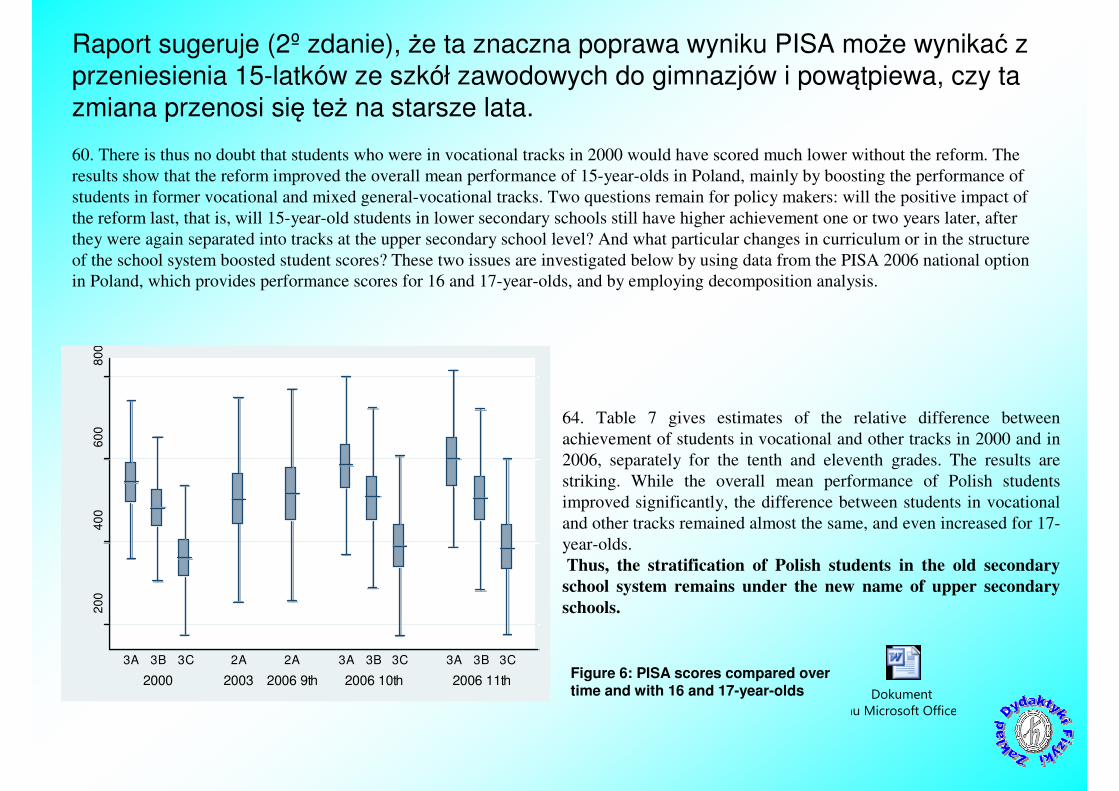
Raport sugeruje (2º zdanie), że ta znaczna poprawa wyniku PISA może wynikać z
przeniesienia 15-latków ze szkół zawodowych do gimnazjów i powątpiewa, czy ta
zmiana przenosi się też na starsze lata.
60. There is thus no doubt that students who were in vocational tracks in 2000 would have scored much lower without the reform. The
results show that the reform improved the overall mean performance of 15-year-olds in Poland, mainly by boosting the performance of
students in former vocational and mixed general-vocational tracks. Two questions remain for policy makers: will the positive impact of
the reform last, that is, will 15-year-old students in lower secondary schools still have higher achievement one or two years later, after
they were again separated into tracks at the upper secondary school level? And what particular changes in curriculum or in the structure
of the school system boosted student scores? These two issues are investigated below by using data from the PISA 2006 national option
in Poland, which provides performance scores for 16 and 17-year-olds, and by employing decomposition analysis.
Figure 6: PISA scores compared over time and with 16 and 17-year-olds
200
400
600
800
2000 2003 2006 9th 2006 10th 2006 11th
3A 3B 3C 2A 2A 3A 3B 3C 3A 3B 3C
64. Table 7 gives estimates of the relative difference between
achievement of students in vocational and other tracks in 2000 and in
2006, separately for the tenth and eleventh grades. The results are
striking. While the overall mean performance of Polish students
improved significantly, the difference between students in vocational
and other tracks remained almost the same, and even increased for 17-
year-olds.
Thus, the stratification of Polish students in the old secondary
school system remains under the new name of upper secondary
schools.
Dokument
programu Microsoft Office Word 9
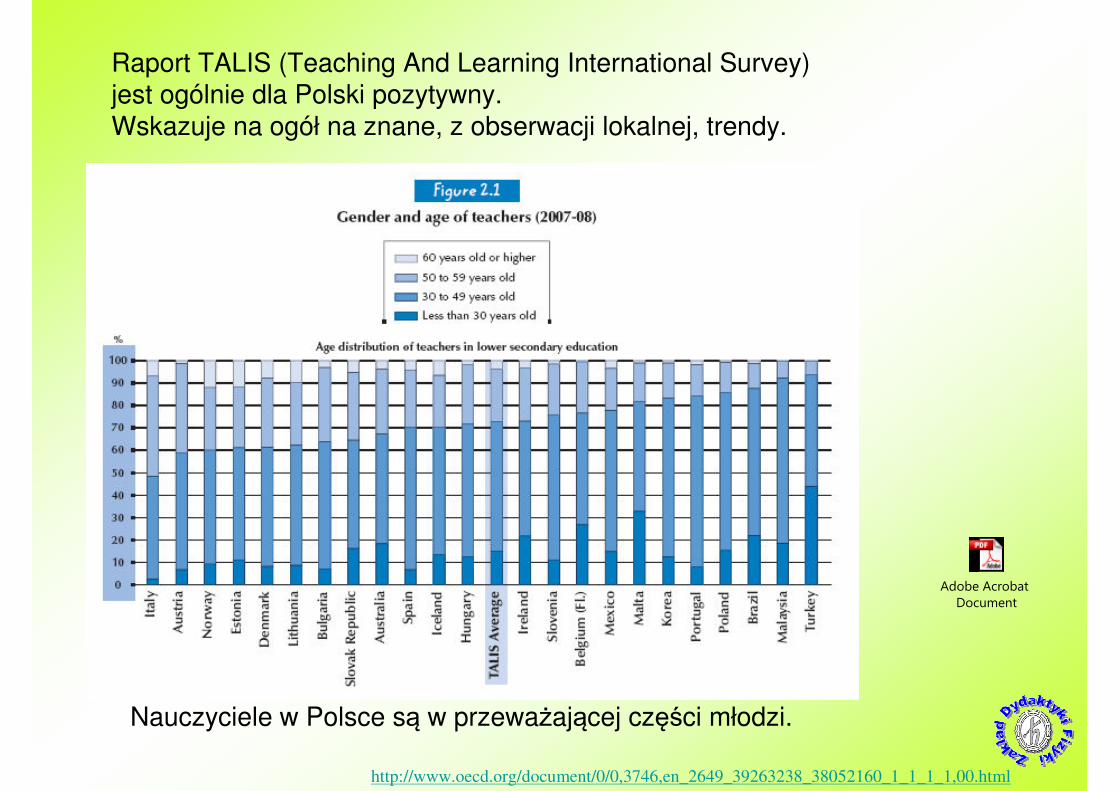
Raport TALIS (Teaching And Learning International Survey)jest ogólnie dla Polski pozytywny.
Wskazuje na ogół na znane, z obserwacji lokalnej, trendy.
Nauczyciele w Polsce są w przeważającej części młodzi.
http://www.oecd.org/document/0/0,3746,en_2649_39263238_38052160_1_1_1_1,00.html
Adobe Acrobat
Document
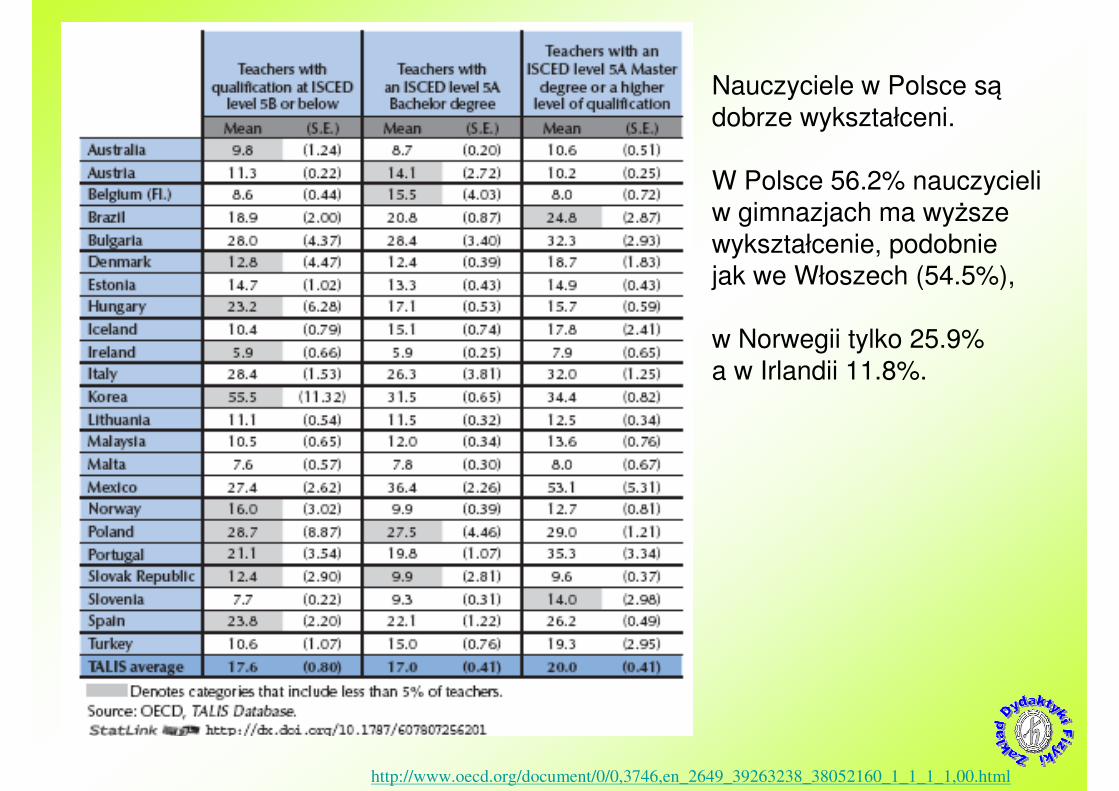
Nauczyciele w Polsce są
dobrze wykształceni.
W Polsce 56.2% nauczycieliw gimnazjach ma wyższe
wykształcenie, podobniejak we Włoszech (54.5%),
w Norwegii tylko 25.9%
a w Irlandii 11.8%.
W gimnazjach w Polsce .
http://www.oecd.org/document/0/0,3746,en_2649_39263238_38052160_1_1_1_1,00.html
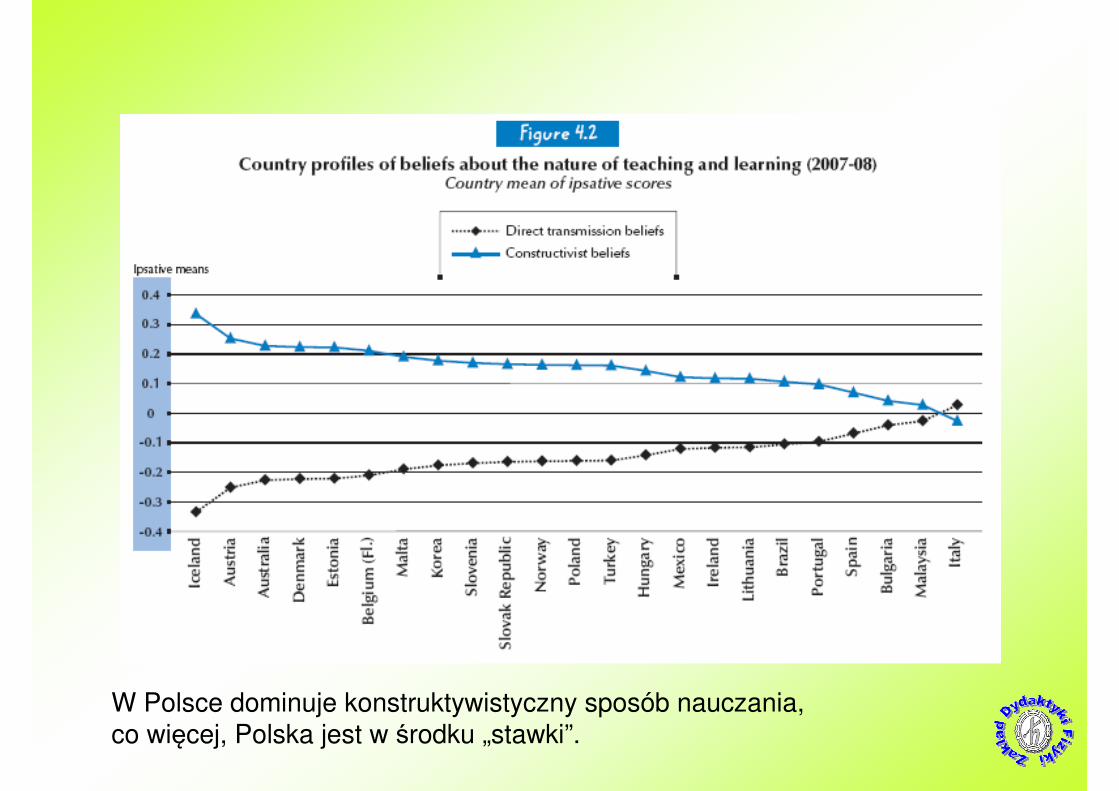
W Polsce dominuje konstruktywistyczny sposób nauczania,
co więcej, Polska jest w środku „stawki”.
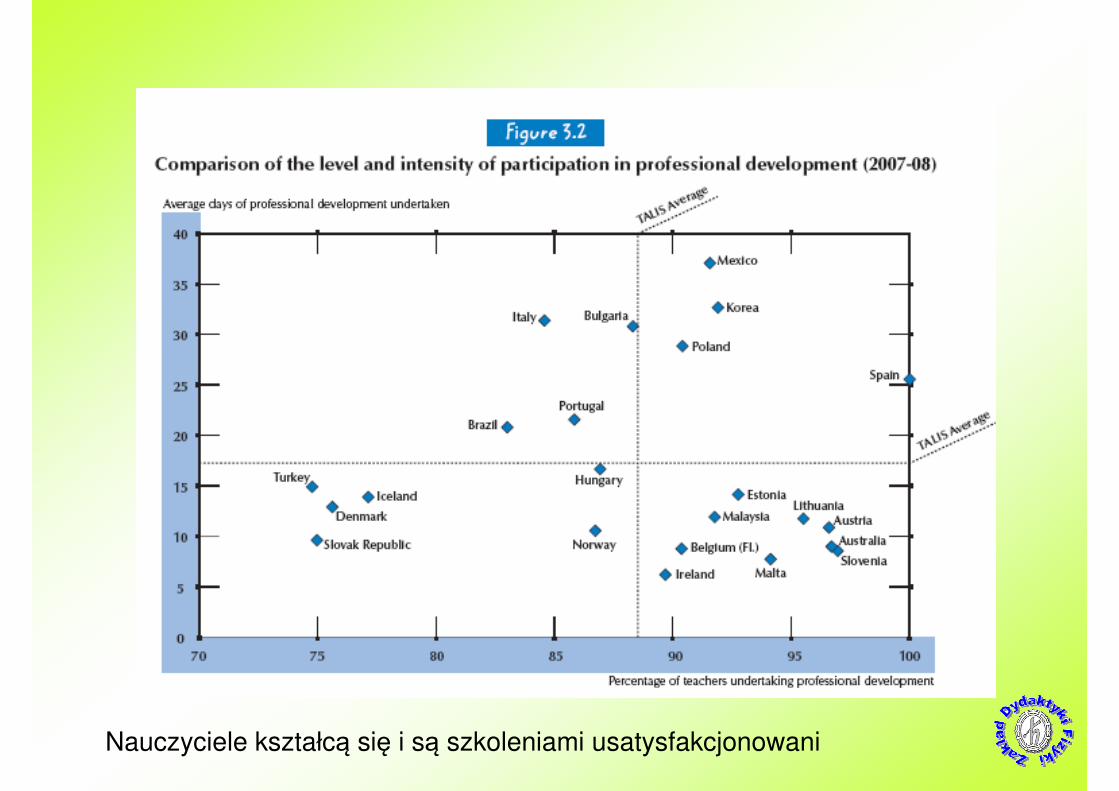
Nauczyciele kształcą się i są szkoleniami usatysfakcjonowani
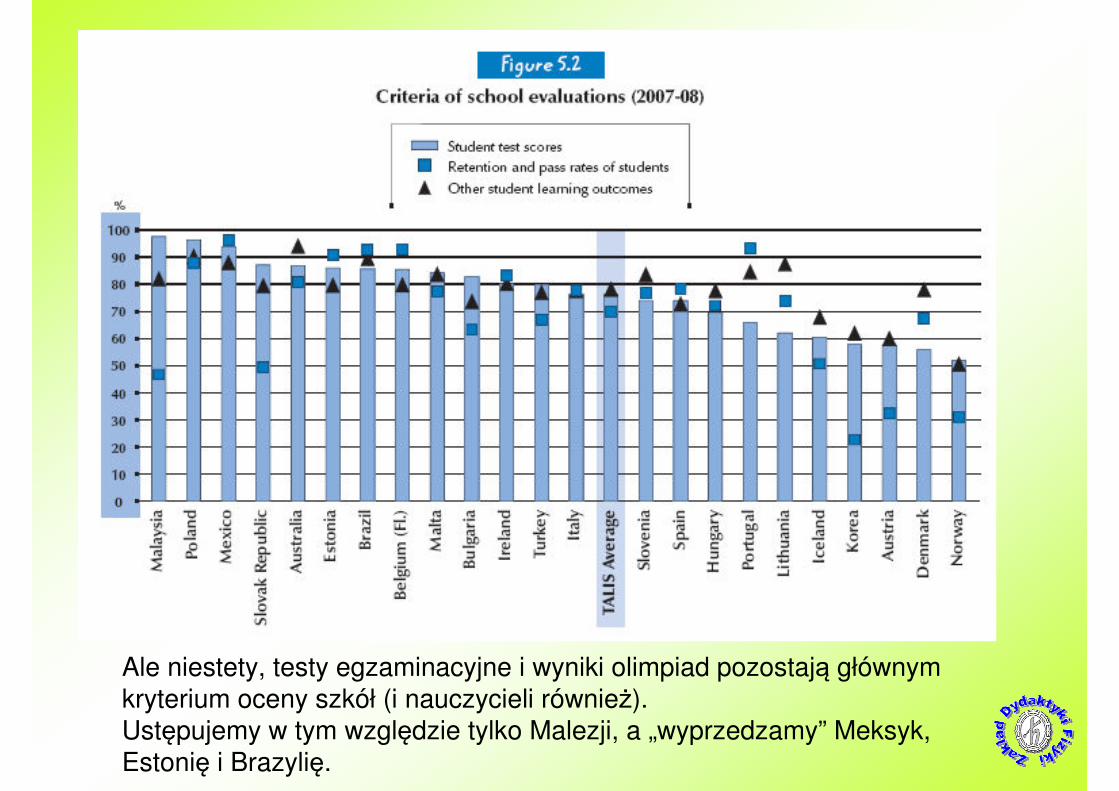
Ale niestety, testy egzaminacyjne i wyniki olimpiad pozostają głównym
kryterium oceny szkół (i nauczycieli również).
Ustępujemy w tym względzie tylko Malezji, a „wyprzedzamy” Meksyk,
Estonię i Brazylię.
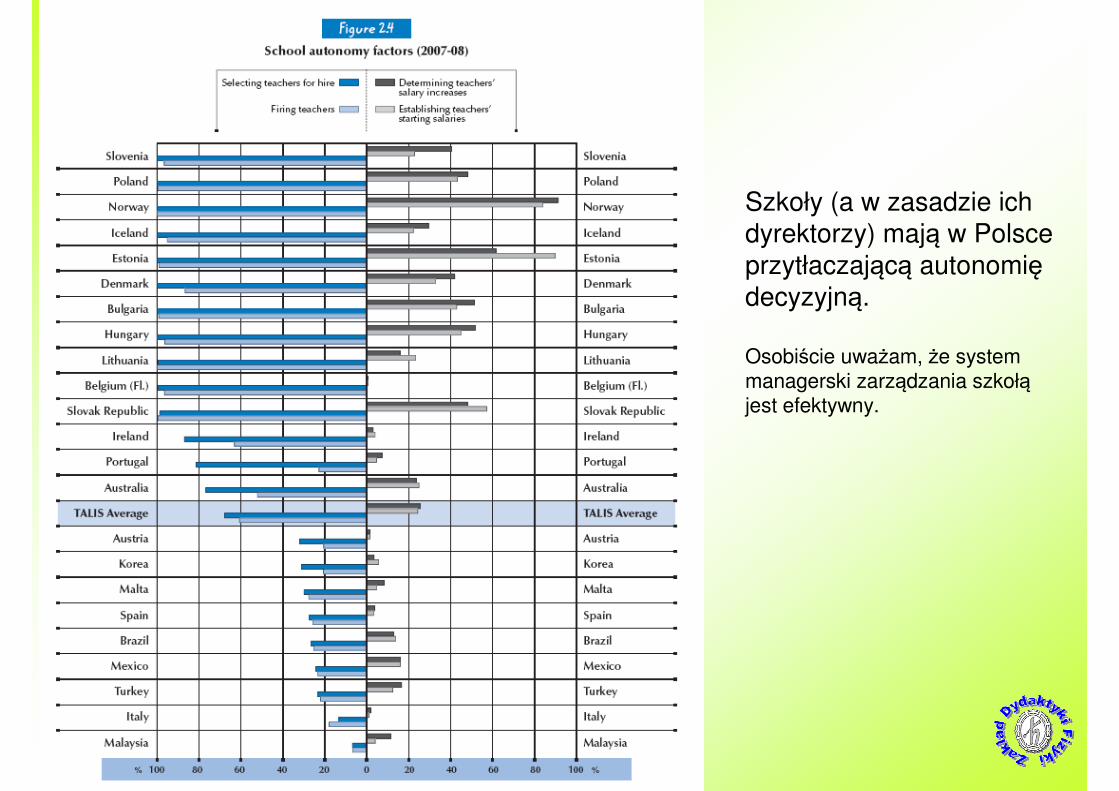
Szkoły (a w zasadzie ich dyrektorzy) mają w Polsce
przytłaczającą autonomiędecyzyjną.
Osobiście uważam, że systemmanagerski zarządzania szkołąjest efektywny.
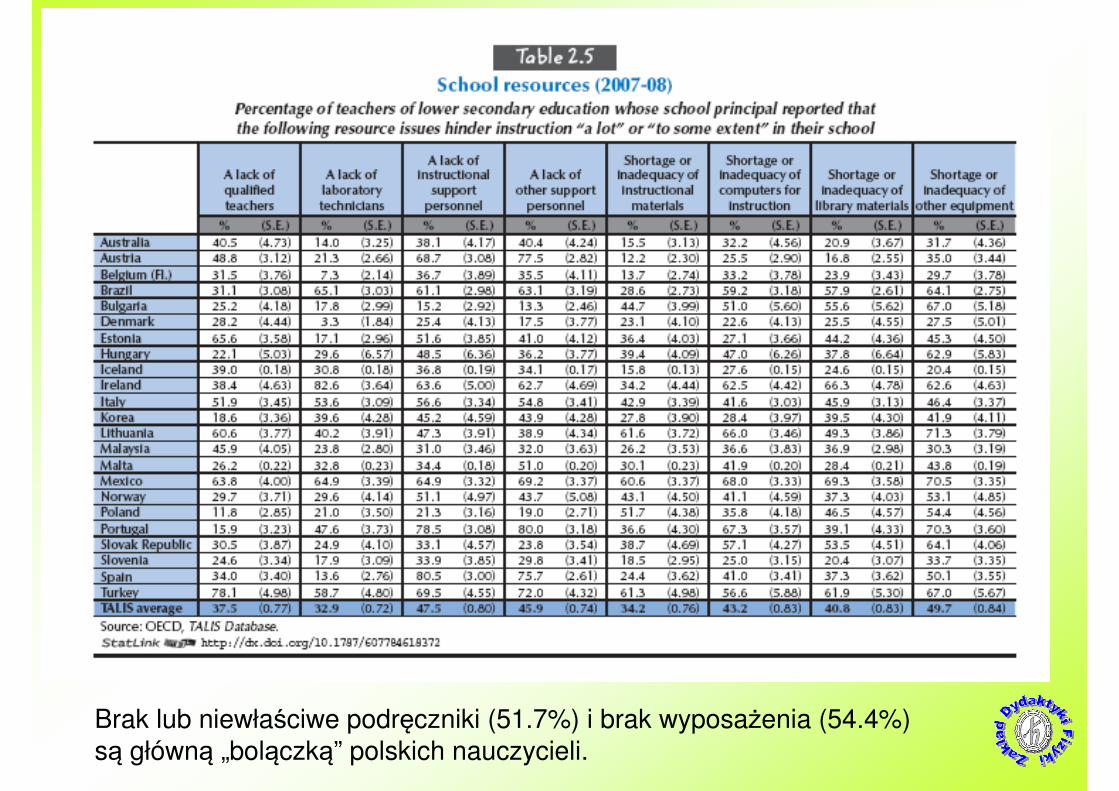
Brak lub niewłaściwe podręczniki (51.7%) i brak wyposażenia (54.4%)
są główną „bolączką” polskich nauczycieli.
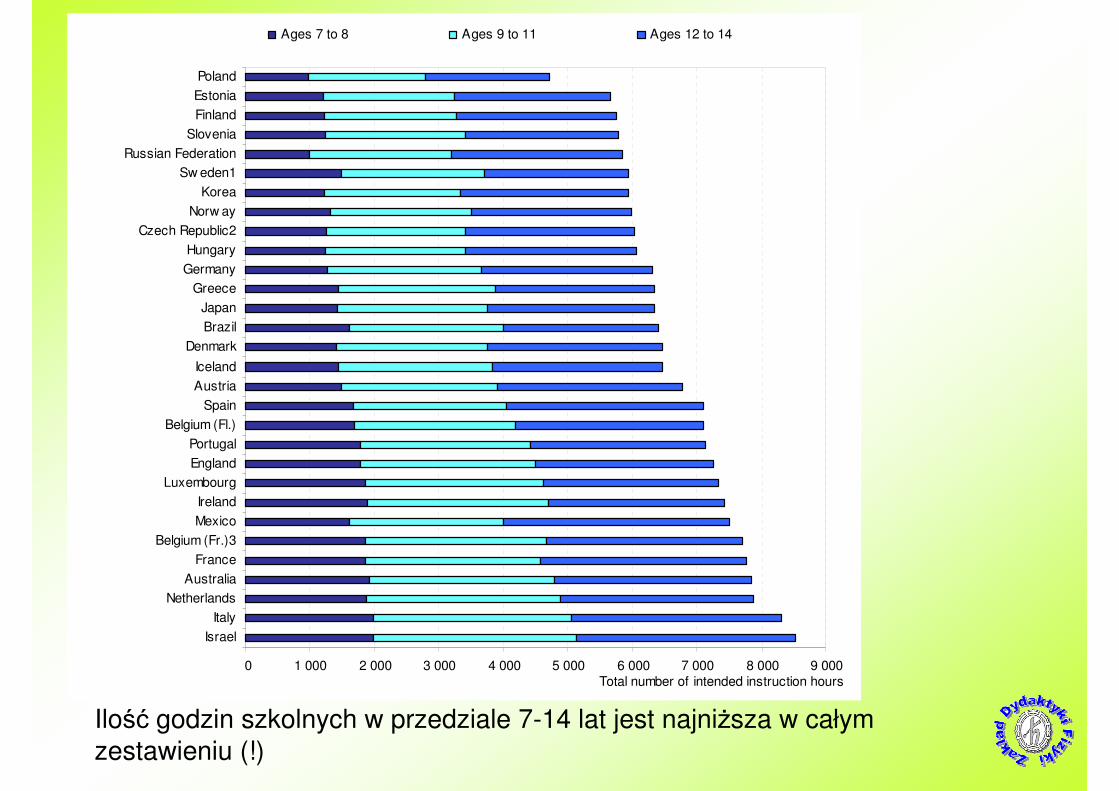
Ilość godzin szkolnych w przedziale 7-14 lat jest najniższa w całym
zestawieniu (!)
0 1 000 2 000 3 000 4 000 5 000 6 000 7 000 8 000 9 000
Israel
Italy
Netherlands
Australia
France
Belgium (Fr.)3
Mexico
Ireland
Luxembourg
England
Portugal
Belgium (Fl.)
Spain
Austria
Iceland
Denmark
Brazil
Japan
Greece
Germany
Hungary
Czech Republic2
Norw ay
Korea
Sw eden1
Russian Federation
Slovenia
Finland
Estonia
Poland
Total number of intended instruction hours
Ages 7 to 8 Ages 9 to 11 Ages 12 to 14
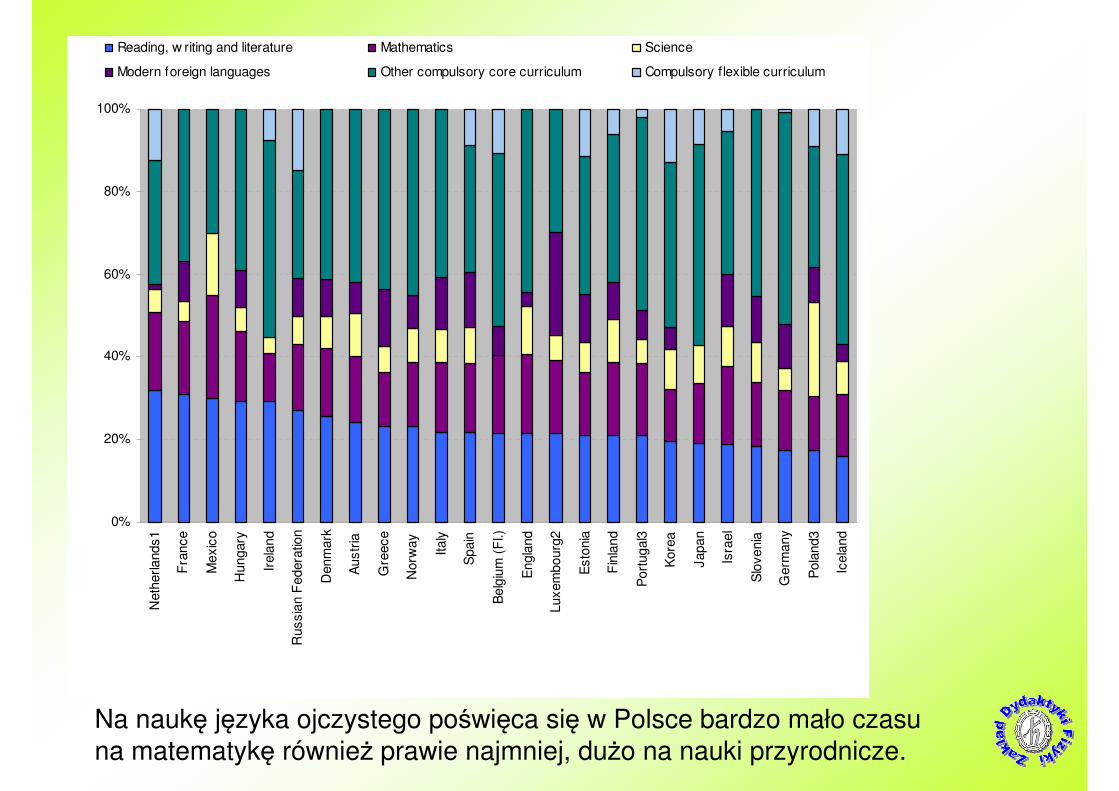
Na naukę języka ojczystego poświęca się w Polsce bardzo mało czasu
na matematykę również prawie najmniej, dużo na nauki przyrodnicze.
0%
20%
40%
60%
80%
100%
Neth
erlands1
Fra
nce
Mexic
o
Hungary
Irela
nd
Russia
n F
edera
tion
Denm
ark
Austr
ia
Gre
ece
Norw
ay
Italy
Spain
Belg
ium
(F
l.)
Engla
nd
Luxem
bourg
2
Esto
nia
Fin
land
Port
ugal3
Kore
a
Japan
Isra
el
Slo
venia
Germ
any
Pola
nd3
Icela
nd
Reading, w riting and literature Mathematics Science
Modern foreign languages Other compulsory core curriculum Compulsory flexible curriculum
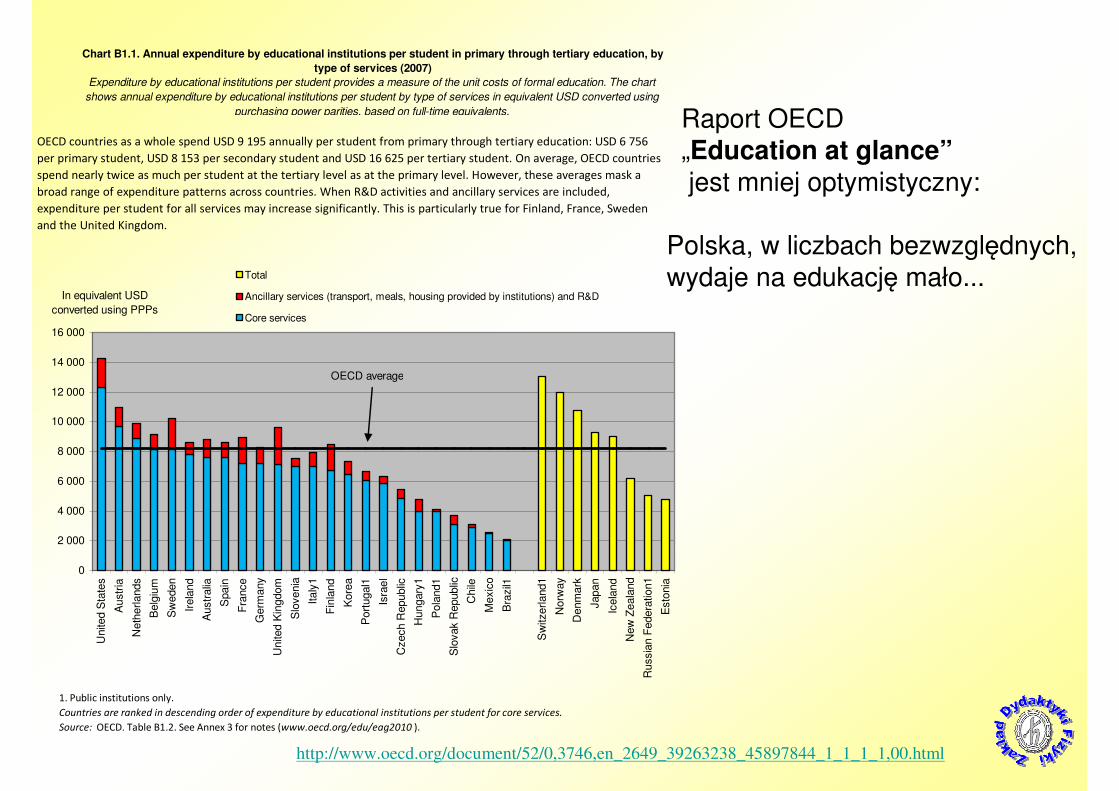
Raport OECD
„Education at glance”
jest mniej optymistyczny:
Polska, w liczbach bezwzględnych,
wydaje na edukację mało...
http://www.oecd.org/document/52/0,3746,en_2649_39263238_45897844_1_1_1_1,00.html
0
2 000
4 000
6 000
8 000
10 000
12 000
14 000
16 000
Unite
d S
tate
s
Austr
ia
Neth
erlands
Belg
ium
Sw
eden
Irela
nd
Austr
alia
Spain
Fra
nce
Germ
any
United K
ingdom
Slo
venia
Italy
1
Fin
land
Kore
a
Port
ugal1
Isra
el
Czech R
epublic
Hungary
1
Pola
nd1
Slo
vak R
epublic
Chile
Mexic
o
Bra
zil1
Sw
itzerland1
Norw
ay
Denm
ark
Japan
Icela
nd
New
Zeala
nd
Russia
n F
edera
tion1
Esto
nia
In equivalent USD
converted using PPPs
Total
Ancillary services (transport, meals, housing provided by institutions) and R&D
Core services
1. Public institutions only.
Countries are ranked in descending order of expenditure by educational institutions per student for core services.
Source: OECD. Table B1.2. See Annex 3 for notes (www.oecd.org/edu/eag2010 ).
Chart B1.1. Annual expenditure by educational institutions per student in primary through tertiary education, by
type of services (2007)
Expenditure by educational institutions per student provides a measure of the unit costs of formal education. The chart
shows annual expenditure by educational institutions per student by type of services in equivalent USD converted using
purchasing power parities, based on full-time equivalents.
OECD average
OECD countries as a whole spend USD 9 195 annually per student from primary through tertiary education: USD 6 756
per primary student, USD 8 153 per secondary student and USD 16 625 per tertiary student. On average, OECD countries
spend nearly twice as much per student at the tertiary level as at the primary level. However, these averages mask a
broad range of expenditure patterns across countries. When R&D activities and ancillary services are included,
expenditure per student for all services may increase significantly. This is particularly true for Finland, France, Sweden
and the United Kingdom.
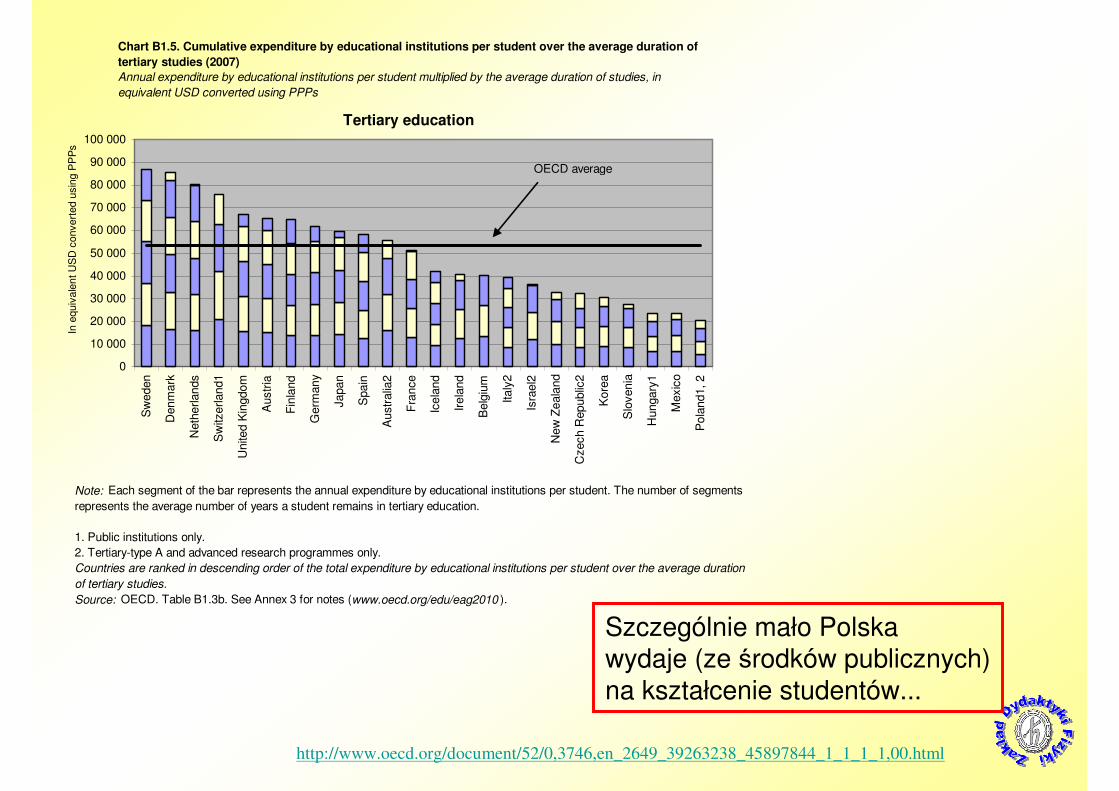
Szczególnie mało Polska
wydaje (ze środków publicznych)
na kształcenie studentów...
http://www.oecd.org/document/52/0,3746,en_2649_39263238_45897844_1_1_1_1,00.html
0
10 000
20 000
30 000
40 000
50 000
60 000
70 000
80 000
90 000
100 000S
weden
Denm
ark
Neth
erlands
Sw
itzerland1
United K
ingdom
Austr
ia
Fin
land
Germ
any
Japan
Spain
Austr
alia
2
Fra
nce
Icela
nd
Irela
nd
Belg
ium
Italy
2
Isra
el2
New
Zeala
nd
Czech R
epublic
2
Kore
a
Slo
venia
Hungary
1
Mexic
o
Pola
nd1, 2
In e
quiv
ale
nt U
SD
convert
ed u
sin
g P
PP
s
Note: Each segment of the bar represents the annual expenditure by educational institutions per student. The number of segments
represents the average number of years a student remains in tertiary education.
1. Public institutions only.
2. Tertiary-type A and advanced research programmes only.
Countries are ranked in descending order of the total expenditure by educational institutions per student over the average duration
of tertiary studies.
Source: OECD. Table B1.3b. See Annex 3 for notes (www.oecd.org/edu/eag2010 ).
Chart B1.5. Cumulative expenditure by educational institutions per student over the average duration of
tertiary studies (2007)
Annual expenditure by educational institutions per student multiplied by the average duration of studies, in
equivalent USD converted using PPPs
OECD average
Tertiary education
http://www.oecd.org/document/52/0,3746,en_2649_39263238_45897844_1_1_1_1,00.html
Equivalent USD converted using PPPs
0
20 000
40 000
60 000
80 000
100 000
120 000
Luxem
bourg
Sw
itzerland
Germ
any
Ko
rea
Irela
nd
Ne
therland
s
Japa
n
Scotla
nd
Austr
alia
Spain
Engla
nd
Unite
d S
tate
s
Denm
ark
Belg
ium
(F
l.)
Aus
tria
Fin
lan
d
Belg
ium
(F
r.)
New
Zeala
nd
Norw
ay
Port
ugal
Italy
Fra
nc
e
Sw
eden
Slo
venia
Gre
ec
e
Icela
nd
Mexic
o
Isra
el
Cz
ech R
epublic
Pola
nd
Hungary
Esto
nia
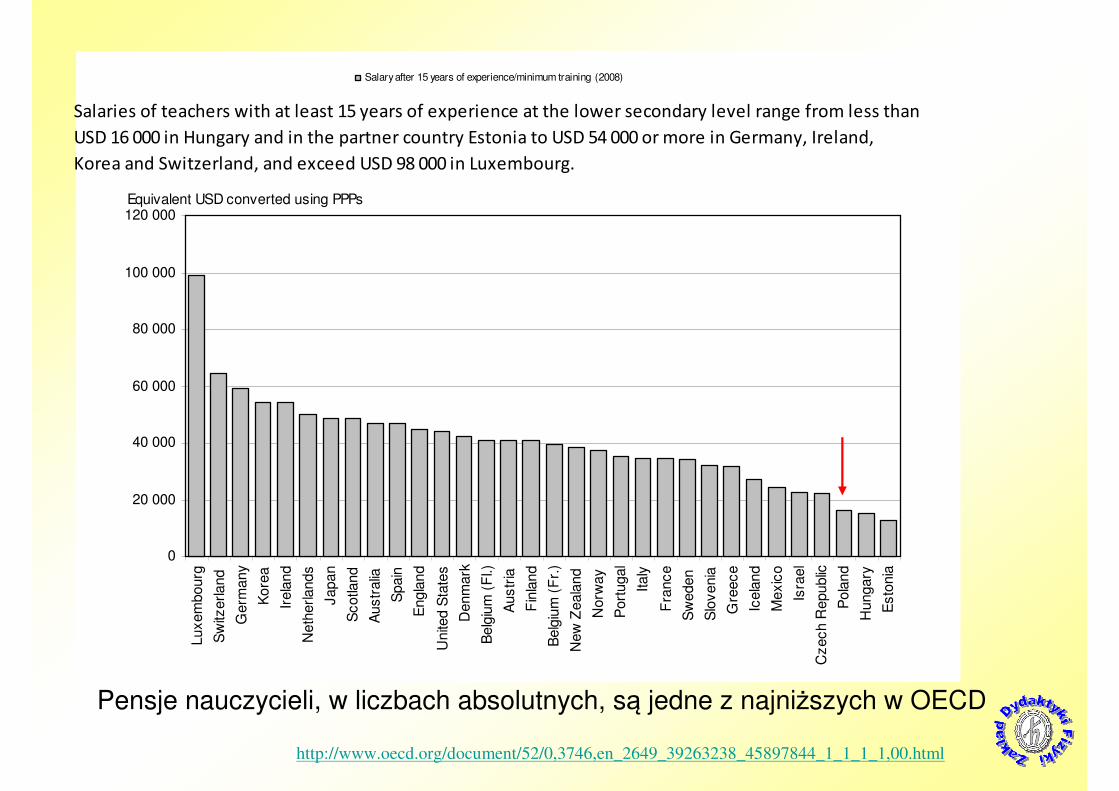
Salary after 15 years of experience/minimum training (2008)
Salaries of teachers with at least 15 years of experience at the lower secondary level range from less than
USD 16 000 in Hungary and in the partner country Estonia to USD 54 000 or more in Germany, Ireland,
Korea and Switzerland, and exceed USD 98 000 in Luxembourg.
Pensje nauczycieli, w liczbach absolutnych, są jedne z najniższych w OECD
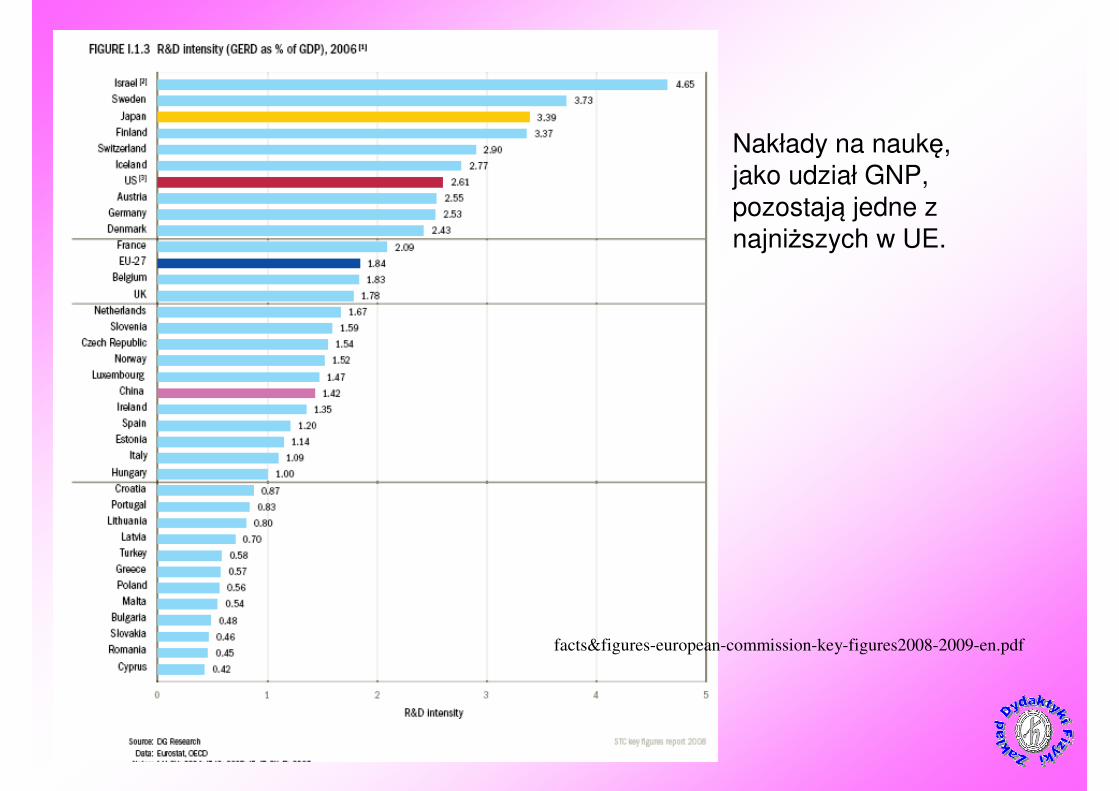
Nakłady na naukę,jako udział GNP,
pozostają jedne z
najniższych w UE.
facts&figures-european-commission-key-figures2008-2009-en.pdf
Komentarz końcowy:
1. Przedstawione statystyki wskazują na pewne mankamenty polskiego systemu
szkolnictwa, jak słabość systemu kształcenia zawodowego, mała liczba zajęćszkolnych, mała ilość godzin matematyki i języka polskiego, nadmierna
parametryzacja oceny (rankingów) szkół, słabość podręczników.
2. Przedstawione statystyki, w tym nakładów na kształcenie studentów dotyczątylko wydatków publicznych. Należy szacować, że nakłady (prywatne) na kształcenie
się w wyższych szkołach niepaństwowych są cyfrą znaczącą w całości statystyki.
3. Nakłady są podane jako liczby bezwzględne. Porównanie danych z tego
samego dokumentu OECD całości wydatków na oświatę z budżetu Państwa wskazuje, że Polska wydaje podobną cyfrę (ok. 11%) jak średnia OECD.
4. Niestety, niskie liczby bezwzględne nakładów (i zarobków) oddają miejsce Polski
w statystykach ekonomicznych OECD.
Dochód pro capita (w 2007 r.) był w Polsce ciągle niższy niż na Węgrzech.
5. Ostatecznym sprawdzianem systemów edukacyjnych jest umiejętność wykształcenia
społeczeństwa osiągającego kulturowy, cywilizacyjny i ekonomiczny sukces.
Brak tego sukcesu oznacza słabość systemu edukacji.
6. Z uwagi na punkt 4, wróć do punktu 1... [GK, 12.03.2011]