
platform in como design
15
24th Pump Users Symposium Adequacy of Flow Loop Control of Pumps Operating in a Parallel Configuration Whenever Any of the Pumps are Tripped Authors: Marcelo Bonniard – Equipment Engineer – PETROBRAS Oscar von Meien – Process Engineer – PETROBRAS
Transcript of platform in como design
8/13/2019 platform in como design
http://slidepdf.com/reader/full/platform-in-como-design 1/15
24th Pump
Users
Symposium
Adequacy of Flow Loop Control of Pumps Operating in a Parallel
Configuration Whenever Any of the Pumps are Tripped
Authors:
Marcelo Bonniard – Equipment Engineer – PETROBRAS
Oscar von Meien – Process Engineer – PETROBRAS
8/13/2019 platform in como design
http://slidepdf.com/reader/full/platform-in-como-design 2/15
8/13/2019 platform in como design
http://slidepdf.com/reader/full/platform-in-como-design 3/15
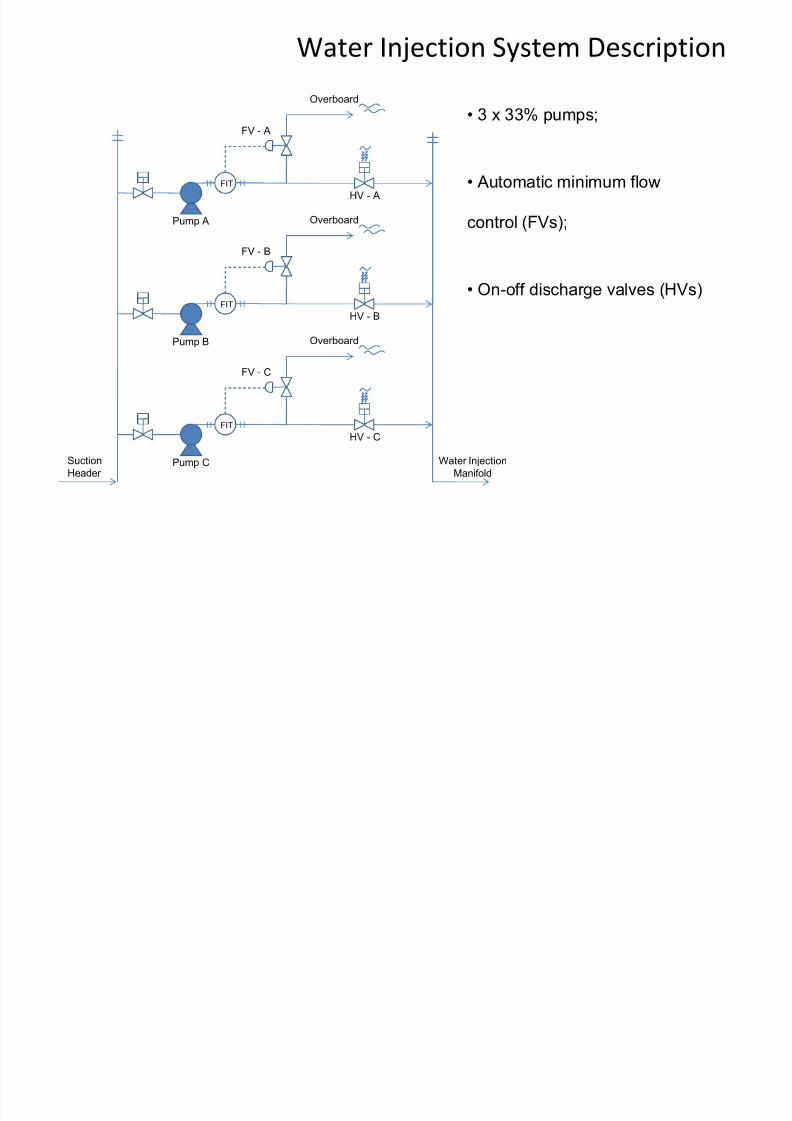
Water Injection System Description
Water Injection
Manifold
Suction
Header
FIT
Overboard
FV - A
Pump A
HV - A
FIT
Overboard
FV - B
Pump B
HV - B
FIT
Overboard
FV - C
Pump C
HV - C
• 3 x 33% pumps;
• Automatic minimum flow
control (FVs);
• On-off discharge valves (HVs)
8/13/2019 platform in como design
http://slidepdf.com/reader/full/platform-in-como-design 4/15
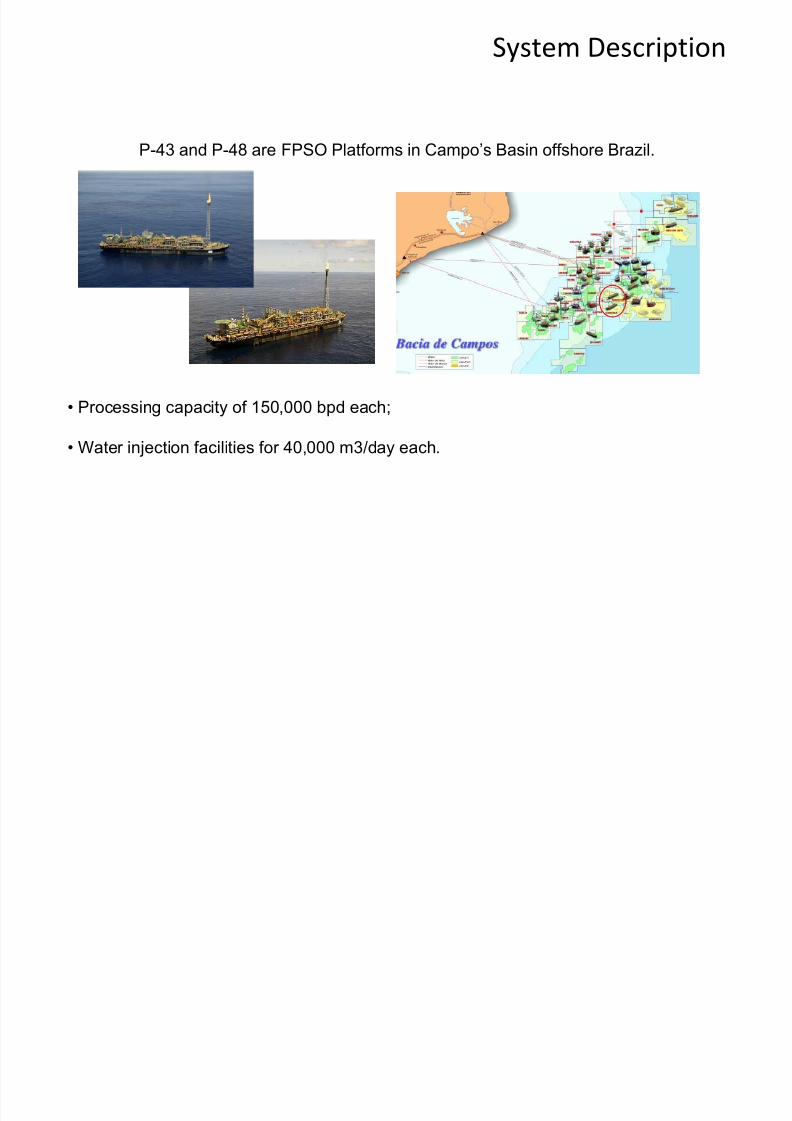
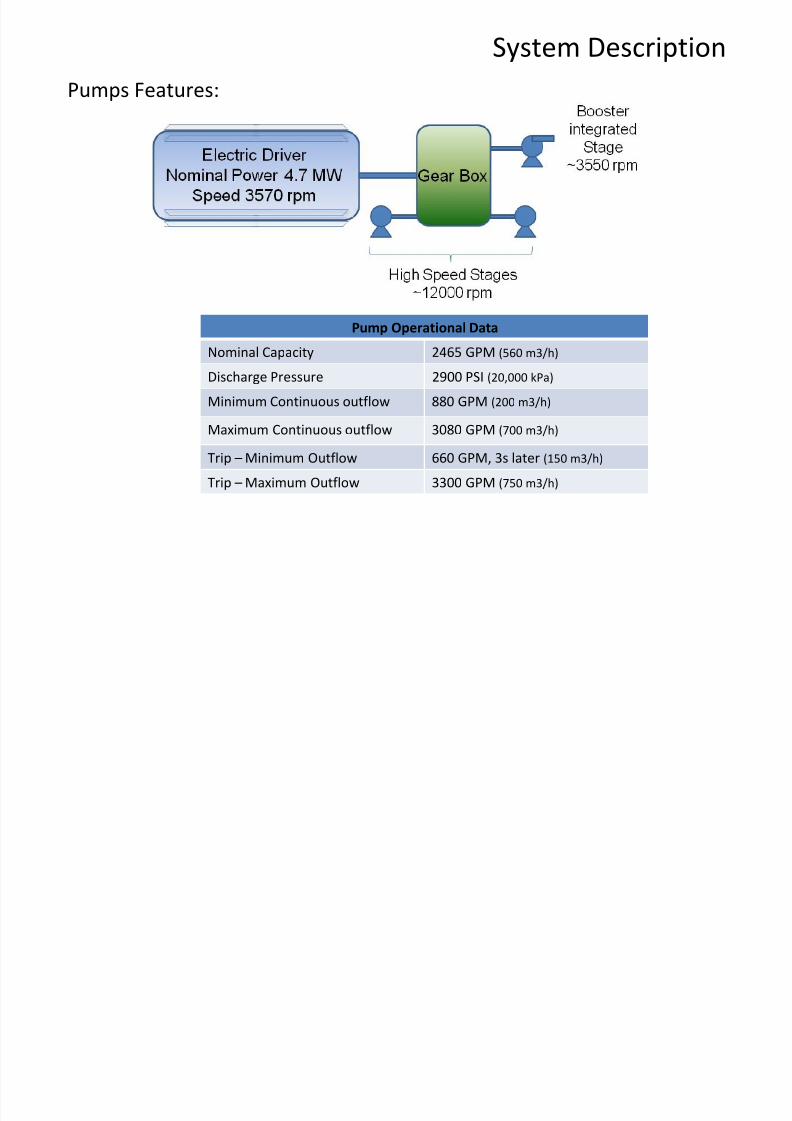
System Description
Pumps
Features:
Pump Operational Data
Nominal Capacity 2465 GPM (560 m3/h)
Discharge Pressure 2900 PSI (20,000 kPa)
Minimum Continuous outflow 880 GPM (200 m3/h)
Maximum Continuous outflow 3080 GPM (700 m3/h)
Trip – Minimum Outflow 660 GPM, 3s later (150 m3/h)
Trip
– Maximum
Outflow 3300
GPM
(750
m3/h)
8/13/2019 platform in como design
http://slidepdf.com/reader/full/platform-in-como-design 5/15
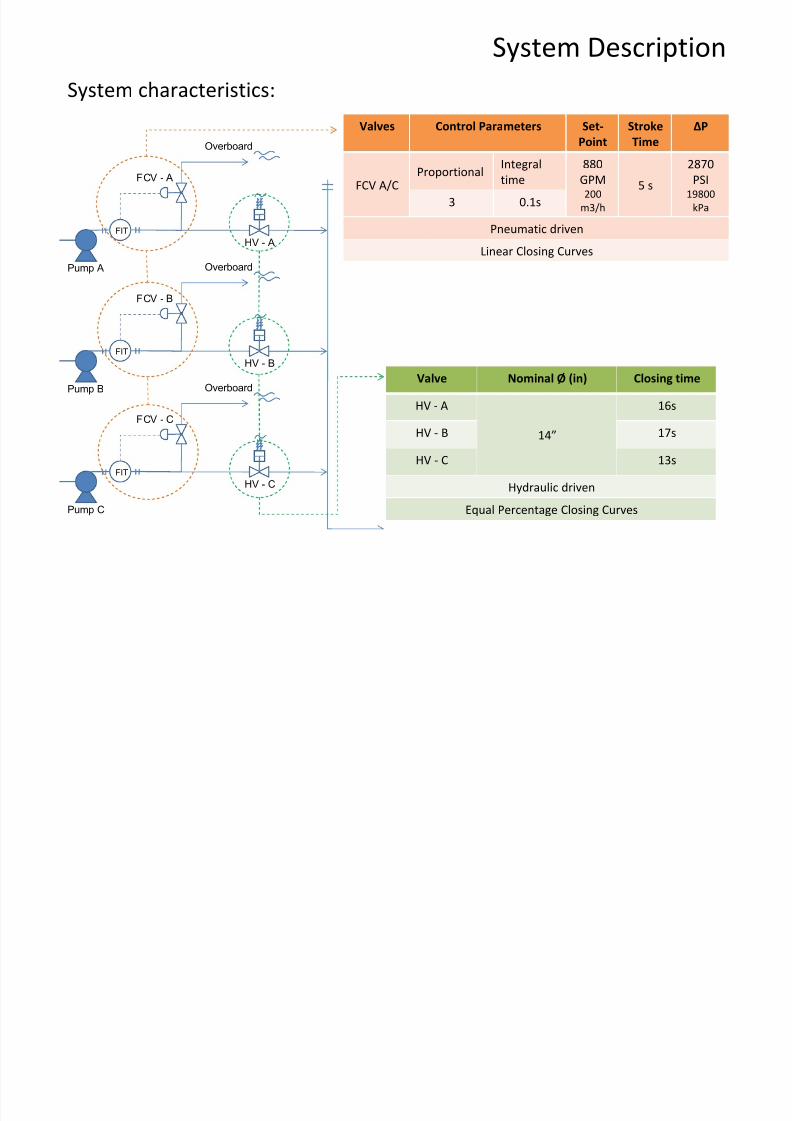
System Description
System
characteristics:
FIT
Overboard
FCV - A
Pump A
HV - A
FIT
Overboard
FCV - B
Pump B
HV - B
FIT
Overboard
FCV - C
Pump C
HV - C
Valves Control Parameters Set‐
Point
Stroke
Time
∆P
FCV A/CProportional
Integral
time
880
GPM
200 m3/h
5 s
2870
PSI
19800 kPa
3 0.1s
Pneumatic driven
Linear Closing Curves
Valve Nominal Ø (in) Closing time
HV ‐ A
14”
16s
HV ‐ B 17s
HV ‐ C 13s
Hydraulic driven
Equal Percentage Closing Curves
8/13/2019 platform in como design
http://slidepdf.com/reader/full/platform-in-como-design 6/15
System Loop Control
Main Control Constrains:
• Maximum flow pump trip - 3300 GPM (750 m3/h);
• Minimum flow pump trip - 660 GPM (150 m3/h) – 3s delay;
• Discharge valves open if pressure exceeds 3550 PSI (24500 kPa);
8/13/2019 platform in como design
http://slidepdf.com/reader/full/platform-in-como-design 7/15
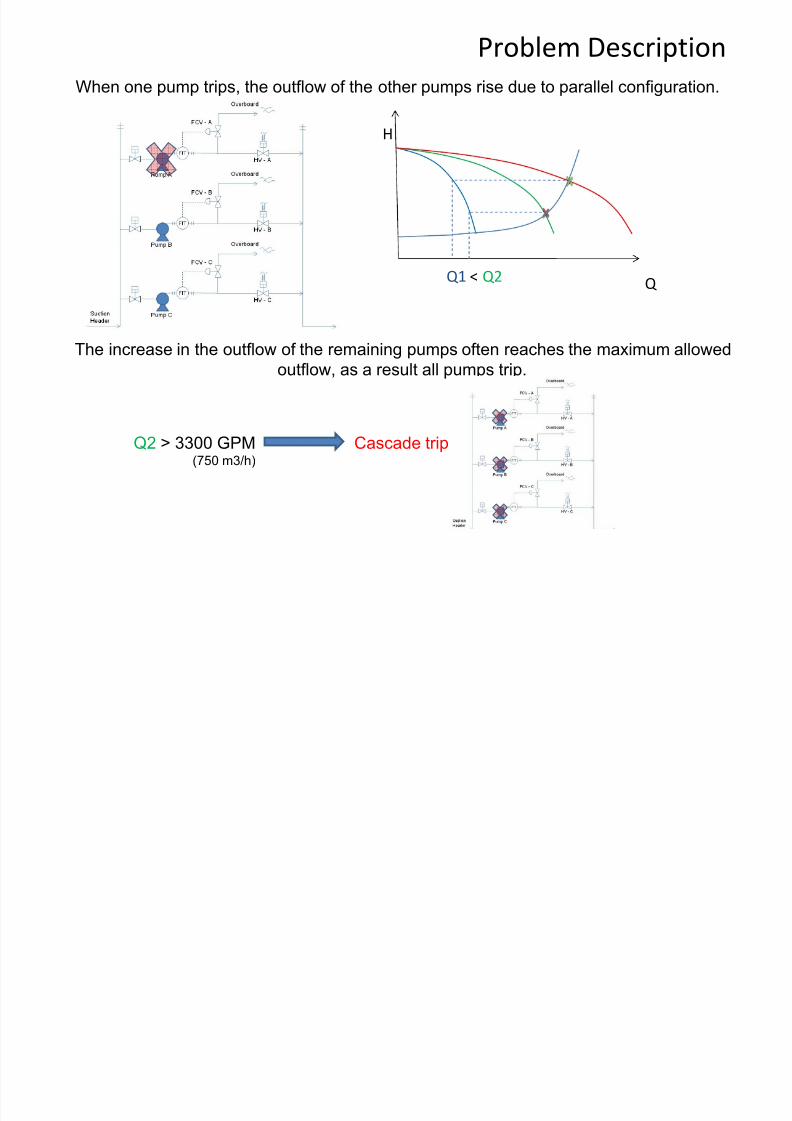
Problem Description
H
Q Q1 < Q2
When one pump trips, the outflow of the other pumps rise due to parallel configuration.
The increase in the outflow of the remaining pumps often reaches the maximum allowed
outflow, as a result all pumps trip.
Q2 > 3300 GPM(750 m3/h)
Cascade trip
8/13/2019 platform in como design
http://slidepdf.com/reader/full/platform-in-como-design 8/15
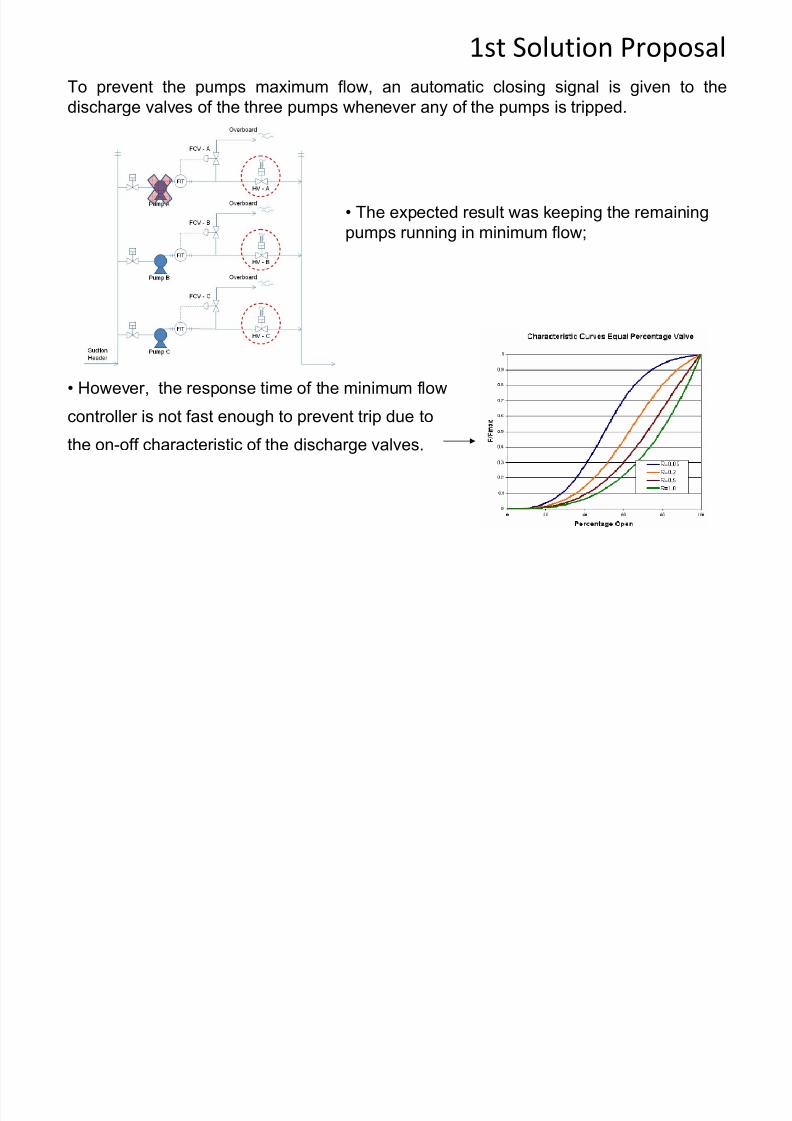
1st Solution Proposal
To prevent the pumps maximum flow, an automatic closing signal is given to the
discharge valves of the three pumps whenever any of the pumps is tripped.
• The expected result was keeping the remaining
pumps running in minimum flow;
• However, the response time of the minimum flowcontroller is not fast enough to prevent trip due to
the on-off characteristic of the discharge valves.
8/13/2019 platform in como design
http://slidepdf.com/reader/full/platform-in-como-design 9/15
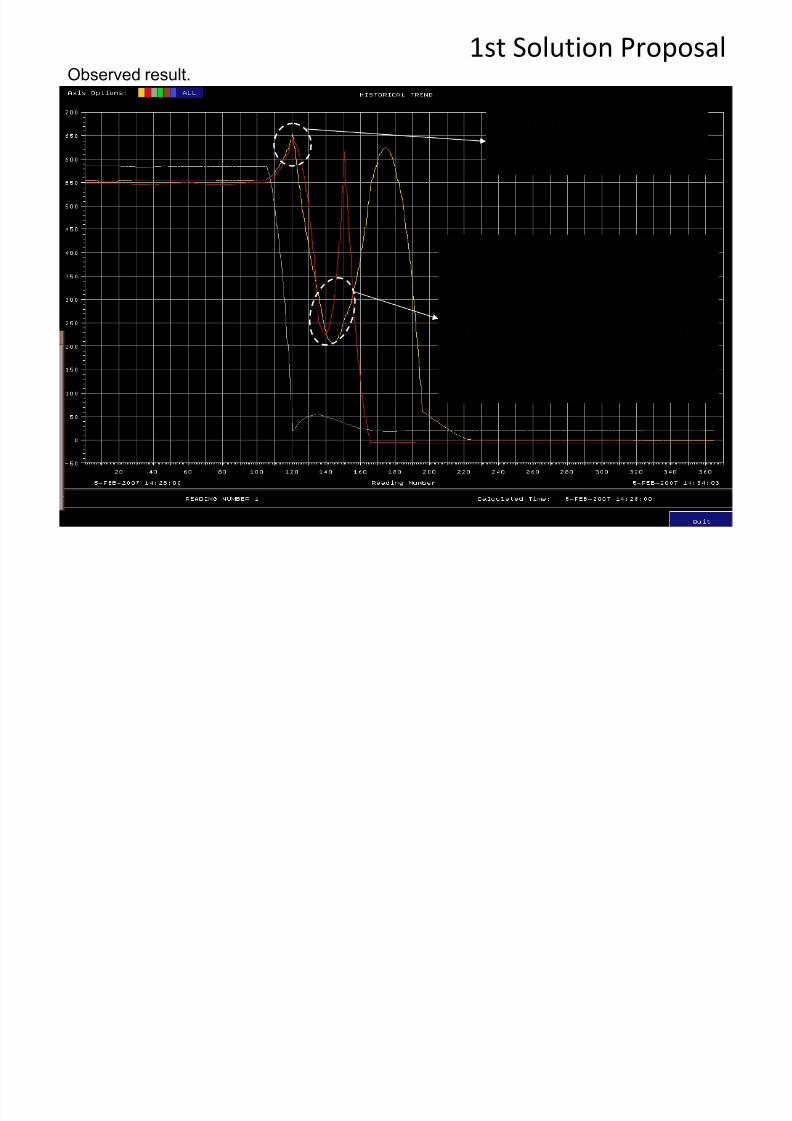
1st Solution ProposalObserved result.
The pumps do not achieve
maximum outflow.
Positive Result
The closure of the discharge valves
made the pressure to increase up
to the limit, 3550 PSI (24500 kPa) .Since this constrain overrides any
other control action, the valves had
to open again, as a result the
remaining pumps tripped by
maximum outflow.
8/13/2019 platform in como design
http://slidepdf.com/reader/full/platform-in-como-design 10/15
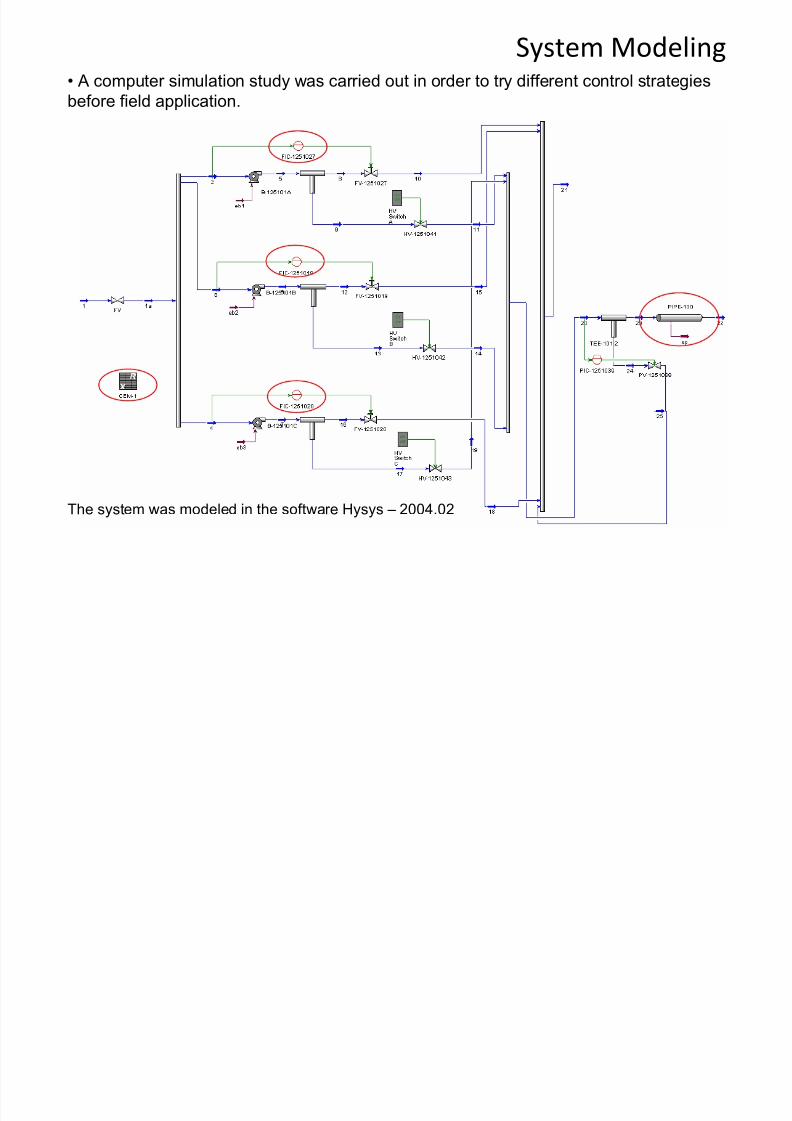
System Modeling• A computer simulation study was carried out in order to try different control strategies
before field application.
The system was modeled in the software Hysys – 2004.02
8/13/2019 platform in como design
http://slidepdf.com/reader/full/platform-in-como-design 11/15
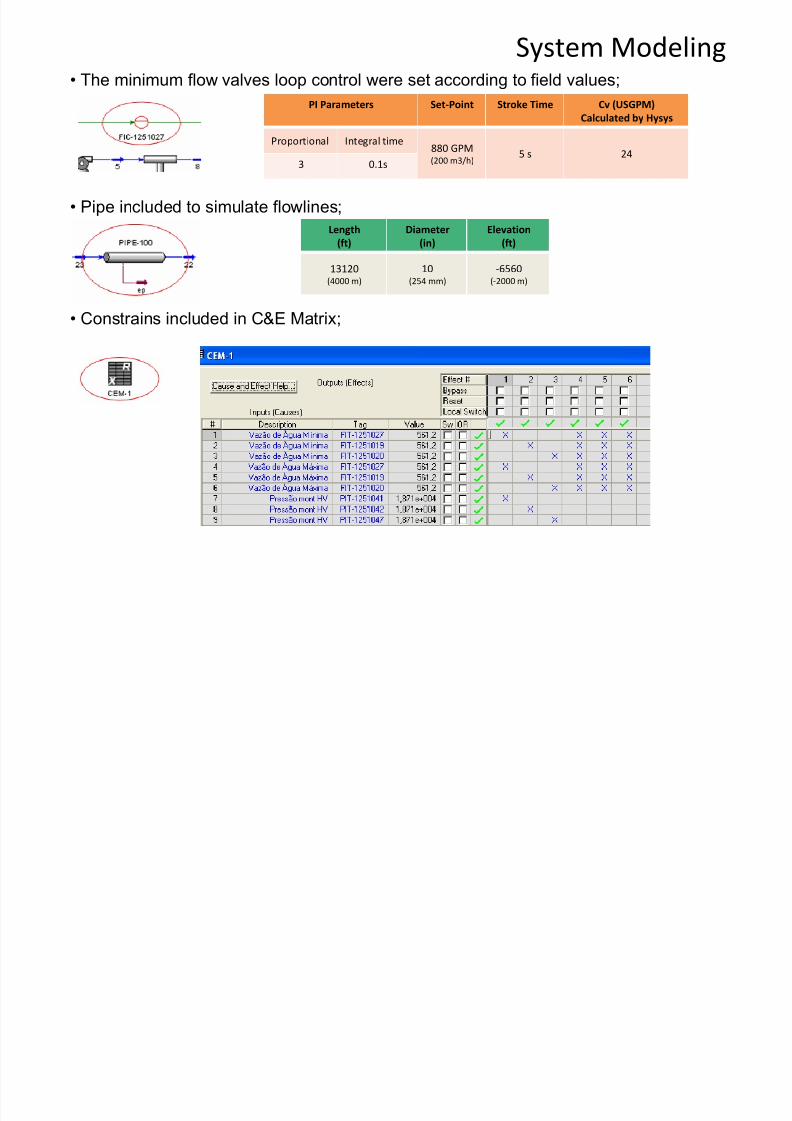
System Modeling• The minimum flow valves loop control were set according to field values;
PI Parameters Set‐Point Stroke Time Cv (USGPM)
Calculated by Hysys
Proportional Integral time880 GPM(200 m3/h)
5 s 243 0.1s
• Pipe included to simulate flowlines;
Length
(ft)
Diameter
(in)
Elevation
(ft)
13120(4000 m)
10(254 mm)
‐6560(‐2000 m)
• Constrains included in C&E Matrix;
8/13/2019 platform in como design
http://slidepdf.com/reader/full/platform-in-como-design 12/15
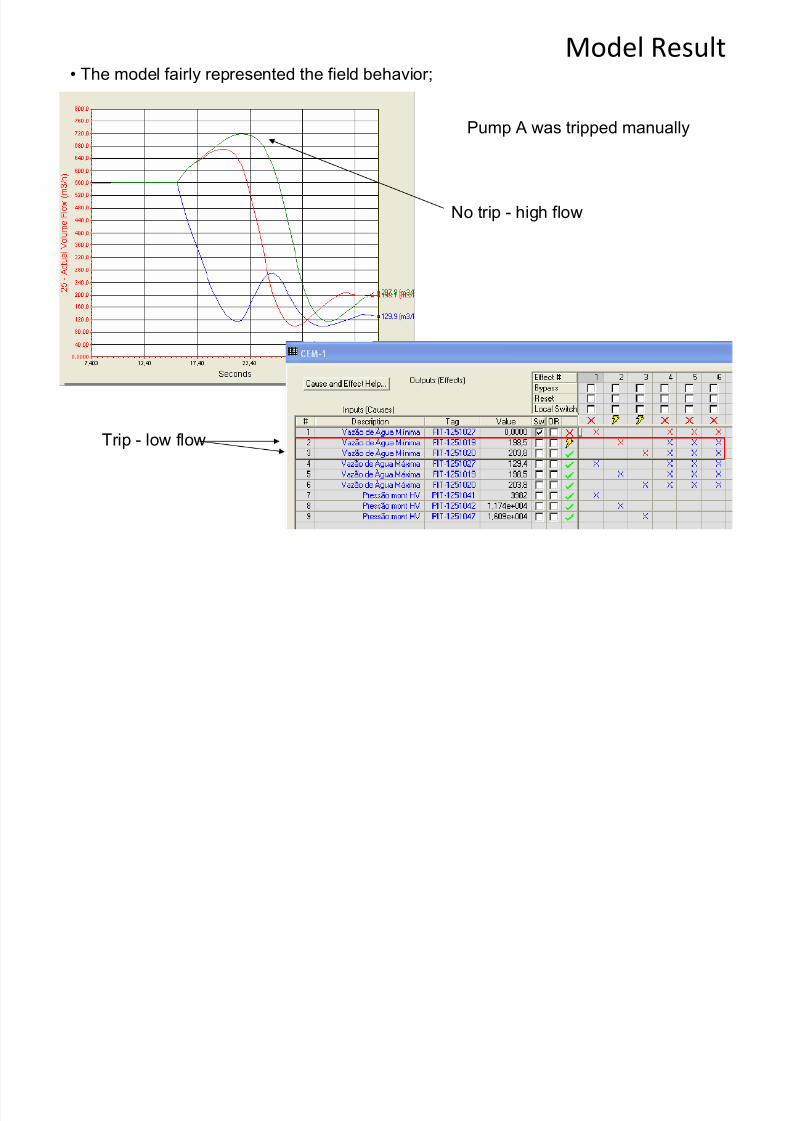
Model Result• The model fairly represented the field behavior;
No trip - high flow
Trip - low flow
Pump A was tripped manually
8/13/2019 platform in como design
http://slidepdf.com/reader/full/platform-in-como-design 13/15
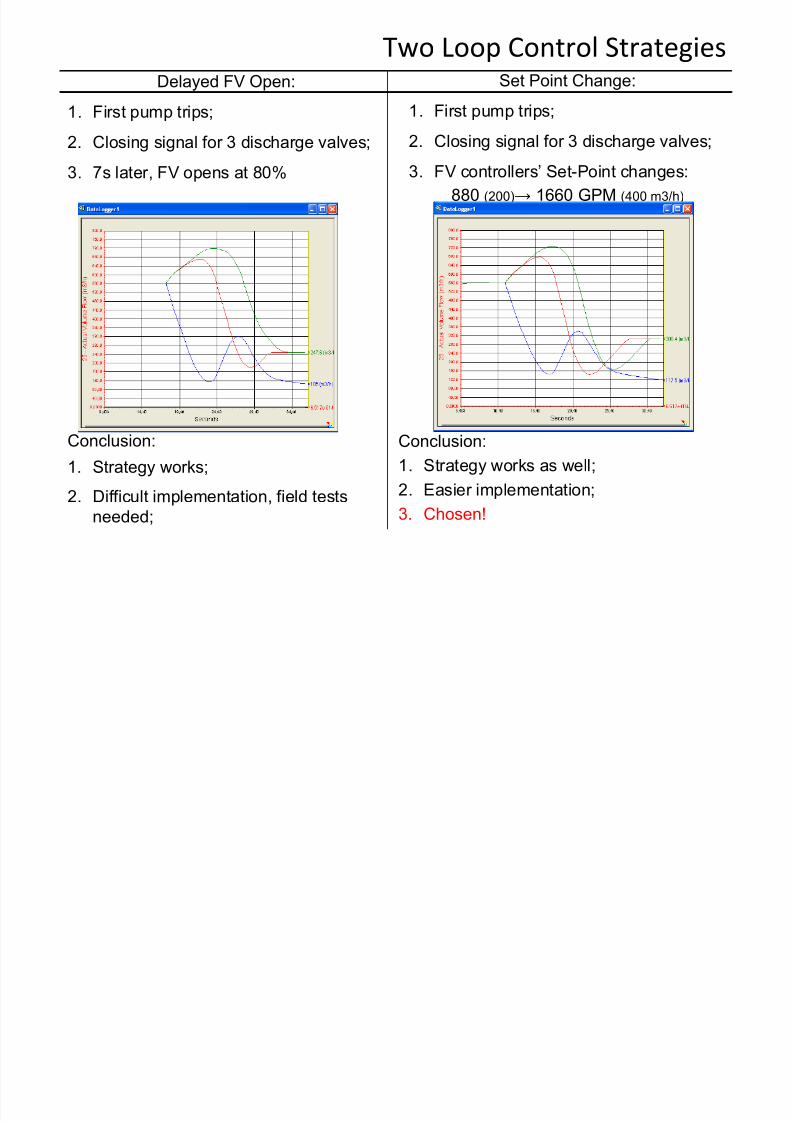
Two Loop Control StrategiesDelayed FV Open:
1. First pump trips;
2. Closing signal for 3 discharge valves;
3. 7s later, FV opens at 80%
Conclusion:
1. Strategy works;
2. Difficult implementation, field testsneeded;
Set Point Change:
1. First pump trips;
2. Closing signal for 3 discharge valves;
3. FV controllers’ Set-Point changes:
880 (200)→ 1660 GPM (400 m3/h)
Conclusion:
1. Strategy works as well;
2. Easier implementation;3. Chosen!
8/13/2019 platform in como design
http://slidepdf.com/reader/full/platform-in-como-design 14/15
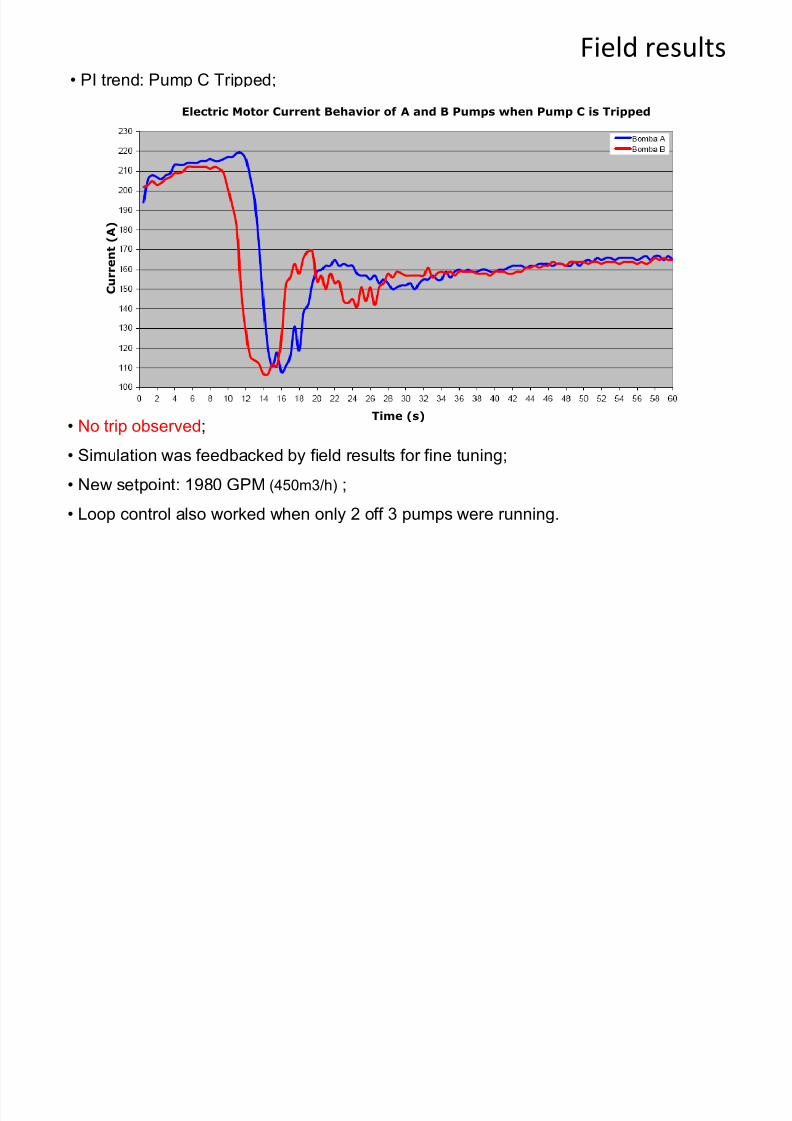
Field results• PI trend: Pump C Tripped;
Electric Motor Current Behavior of A and B Pumps when Pump C is Tripped
C u r r e n t ( A )
Time (s)• No trip observed;
• Simulation was feedbacked by field results for fine tuning;
• New setpoint: 1980 GPM (450m3/h) ;• Loop control also worked when only 2 off 3 pumps were running.
8/13/2019 platform in como design
http://slidepdf.com/reader/full/platform-in-como-design 15/15
Conclusion
• Simulations allow to test a large number of ideas before field application;
• Reliable results;
• Model can be used to solve other problems.
Dynamic Simulation Proved to be a Valuable Tool to Solve
Control Problems in large Pumping Systems