Performance verification of a LIF-LIDAR technique for stand-off detection and classification of...
8
Performance verification of a LIF-LIDAR technique for stand-off detection and classification of biological agents Jacek Wojtanowski n , Marek Zygmunt, Michal Muzal, Piotr Knysak, Andrzej Mlodzianko, Andrzej Gawlikowski, Tadeusz Drozd, Krzysztof Kopczyński, Zygmunt Mierczyk, Miroslawa Kaszczuk, Maciej Traczyk, Andrzej Gietka, Wieslaw Piotrowski, Marcin Jakubaszek, Roman Ostrowski Institute of Optoelectronics, Military University of Technology, 2 Sylwestra Kaliskiego Str., Warsaw 00-908, Poland article info Article history: Received 30 June 2014 Received in revised form 18 August 2014 Accepted 20 August 2014 Keywords: LIDAR Stand-off detection Biological agents abstract LIF (laser-induced fluorescence) LIDAR (light detection and ranging) is one of the very few promising methods in terms of long-range stand-off detection of air-borne biological particles. A limited classification of the detected material also appears as a feasible asset. We present the design details and hardware setup of the developed range-resolved multichannel LIF-LIDAR system. The device is based on two pulsed UV laser sources operating at 355 nm and 266 nm wavelength (3rd and 4th harmonic of Nd:YAG, Q-switched solid-state laser, respectively). Range-resolved fluorescence signals are collected in 28 channels of compound PMT sensor coupled with Czerny–Turner spectrograph. The calculated theoretical sensitivities are confronted with the results obtained during measurement field campaign. Classification efforts based on 28-digit fluorescence spectral signatures linear processing are also presented. & 2014 Elsevier Ltd. All rights reserved. 1. Introduction Stand-off detection and identification of biological particles in the air, especially at low volume concentrations, are a challenge hardly accomplished even in case of the current high-tech systems. Such real-time sensing capability is desired both in the civilian and military sectors. Great efforts were made and are still undertaken by a number of private and governmental organizations to develop a reliable system; however, no satisfactory end-products have been achieved so far. LIDAR is an active technique of remote-sensing based on a laser application [1]. Initiated in the 1960s, it was originally developed in the area of atmospheric research [2–4]. With the passage of time, a LIDAR technique was adopted in a variety of other scientific and military sectors [5–8]. In the LIDAR method, a laser beam plays a role analogous to radio waves in the RADAR technique (radio detection and ranging). Laser beam is directed in a given direction (towards an unknown cloud for instance) and the receiving optics collects optical echo signals. Due to substantial difference in wavelengths of electro- magnetic waves concerning both methods, the LIDAR technique enables one to observe much smaller targets when compared with the RADAR method and provides a much higher spatial resolution. Typical LIDAR devices operate at a wavelength range from UV ( 200 nm) up to LWIR ( 12 μm), which provides the capability to detect microscopic particles in the regime of elastically scat- tered light detection. Scattering LIDAR is the most basic represen- tative of the family. Apart from scattering, light interaction with particles includes a broad range of other physical phenomena [9], which can be measured in the LIDAR technique to provide additional recognition capabilities. The discussed LIF-LIDAR method (Fig. 1) is based on fluorescence emission [10–13] of biological particles illuminated by ultraviolet laser radiation (laser-induced fluorescence). Fluor- escence signals emitted by the excited particles are detected in LIDAR receiving channel(s) in standard range-resolved regimes. It should be noted that fluorescence emission signal is not monochromatic, but corresponds to a relatively broad spectral range, even if excited with monochromatic laser source. The shape of this emission in spectral domain is frequently regarded as a “fingerprint” of a fluorescing substance. Most nonbiological aerosols are not fluore- scence active; so, the basic bio/nonbio discrimination can be achieved by detected/not-detected fluorescence triggering [14]. In such cases, spectrally resolved analysis of the received fluorescence is not needed. The signal can be detected by a single detector associated with spectrally integrated fluorescence. Our first attempts of LIF-LIDAR development were associated with this type of solution. More Contents lists available at ScienceDirect journal homepage: www.elsevier.com/locate/optlastec Optics & Laser Technology http://dx.doi.org/10.1016/j.optlastec.2014.08.013 0030-3992/& 2014 Elsevier Ltd. All rights reserved. n Corresponding author. E-mail address: [email protected] (J. Wojtanowski). Optics & Laser Technology 67 (2015) 25–32
Transcript of Performance verification of a LIF-LIDAR technique for stand-off detection and classification of...
Performance verification of a LIF-LIDAR technique for stand-offdetection and classification of biological agents
Jacek Wojtanowski n, Marek Zygmunt, Michał Muzal, Piotr Knysak, Andrzej Młodzianko,Andrzej Gawlikowski, Tadeusz Drozd, Krzysztof Kopczyński, Zygmunt Mierczyk,Mirosława Kaszczuk, Maciej Traczyk, Andrzej Gietka, Wiesław Piotrowski,Marcin Jakubaszek, Roman OstrowskiInstitute of Optoelectronics, Military University of Technology, 2 Sylwestra Kaliskiego Str., Warsaw 00-908, Poland
a r t i c l e i n f o
Article history:Received 30 June 2014Received in revised form18 August 2014Accepted 20 August 2014
Keywords:LIDARStand-off detectionBiological agents
a b s t r a c t
LIF (laser-induced fluorescence) LIDAR (light detection and ranging) is one of the very few promisingmethods in terms of long-range stand-off detection of air-borne biological particles. A limitedclassification of the detected material also appears as a feasible asset. We present the design detailsand hardware setup of the developed range-resolved multichannel LIF-LIDAR system. The device isbased on two pulsed UV laser sources operating at 355 nm and 266 nm wavelength (3rd and 4thharmonic of Nd:YAG, Q-switched solid-state laser, respectively). Range-resolved fluorescence signals arecollected in 28 channels of compound PMT sensor coupled with Czerny–Turner spectrograph. Thecalculated theoretical sensitivities are confronted with the results obtained during measurement fieldcampaign. Classification efforts based on 28-digit fluorescence spectral signatures linear processing arealso presented.
& 2014 Elsevier Ltd. All rights reserved.
1. Introduction
Stand-off detection and identification of biological particles inthe air, especially at low volume concentrations, are a challengehardly accomplished even in case of the current high-tech systems.Such real-time sensing capability is desired both in the civilian andmilitary sectors. Great efforts were made and are still undertaken bya number of private and governmental organizations to develop areliable system; however, no satisfactory end-products have beenachieved so far. LIDAR is an active technique of remote-sensingbased on a laser application [1]. Initiated in the 1960s, it wasoriginally developed in the area of atmospheric research [2–4].With the passage of time, a LIDAR technique was adopted in avariety of other scientific and military sectors [5–8].
In the LIDAR method, a laser beam plays a role analogous toradio waves in the RADAR technique (radio detection and ranging).Laser beam is directed in a given direction (towards an unknowncloud for instance) and the receiving optics collects optical echosignals. Due to substantial difference in wavelengths of electro-magnetic waves concerning both methods, the LIDAR techniqueenables one to observe much smaller targets when compared with
the RADAR method and provides a much higher spatial resolution.Typical LIDAR devices operate at a wavelength range from UV(�200 nm) up to LWIR (�12 μm), which provides the capabilityto detect microscopic particles in the regime of elastically scat-tered light detection. Scattering LIDAR is the most basic represen-tative of the family.
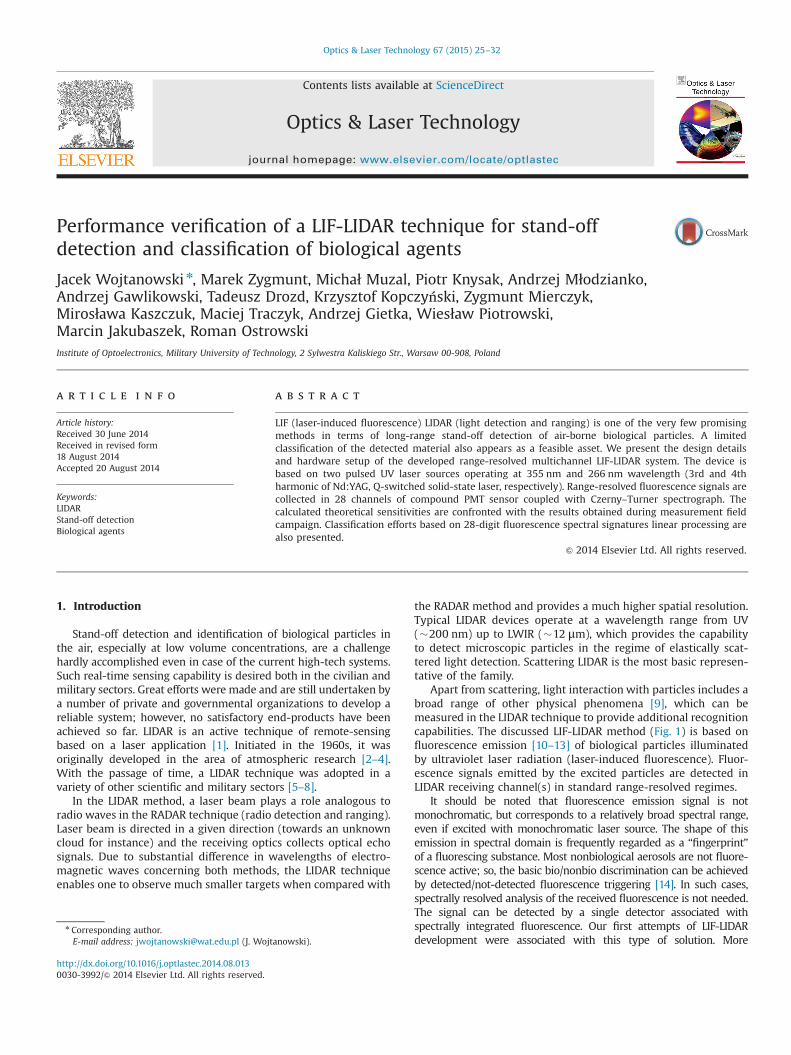
Apart from scattering, light interaction with particles includes abroad range of other physical phenomena [9], which can bemeasured in the LIDAR technique to provide additional recognitioncapabilities. The discussed LIF-LIDAR method (Fig. 1) is based onfluorescence emission [10–13] of biological particles illuminatedby ultraviolet laser radiation (laser-induced fluorescence). Fluor-escence signals emitted by the excited particles are detected inLIDAR receiving channel(s) in standard range-resolved regimes.
It should be noted that fluorescence emission signal is notmonochromatic, but corresponds to a relatively broad spectral range,even if excited with monochromatic laser source. The shape of thisemission in spectral domain is frequently regarded as a “fingerprint”of a fluorescing substance. Most nonbiological aerosols are not fluore-scence active; so, the basic bio/nonbio discrimination can be achievedby detected/not-detected fluorescence triggering [14]. In such cases,spectrally resolved analysis of the received fluorescence is not needed.The signal can be detected by a single detector associated withspectrally integrated fluorescence. Our first attempts of LIF-LIDARdevelopment were associated with this type of solution. More
Contents lists available at ScienceDirect
journal homepage: www.elsevier.com/locate/optlastec
Optics & Laser Technology
http://dx.doi.org/10.1016/j.optlastec.2014.08.0130030-3992/& 2014 Elsevier Ltd. All rights reserved.
n Corresponding author.E-mail address: [email protected] (J. Wojtanowski).
Optics & Laser Technology 67 (2015) 25–32
demanding applications, however, where a certain degree of particlesclassification is required, should take the advantage of spectrallyresolved detection methodology, which apart from the integratedfluorescence flux also provides its spectral composition [15]. Due tosubstantial content of natural and man-made harmless bio-aerosols inthe atmosphere, the latter approach was undertaken, since it seemedto be indispensable especially for military sensors, which require lowfalse-alarm levels.
The main physical limits for the development of long-rangebiological LIDARs result from: low fluorescence cross-sections ofbioparticles, low concentration detection requirements, atmo-spheric attenuation, ambient optical radiance (especially duringdaytime), and similarity in fluorescence spectra of biologicalspecies. Progress in the field is currently determined mainly bythe development of high-power pulsed UV laser sources.
Despite its drawbacks, a LIF-LIDAR technique does not seem tohave many reasonable alternatives in the area of long-range stand-off detection of biological aerosols. The only other technique worthmentioning is FTIR (Fourier-transform infrared spectroscopy). Thispassive method relies on the ambient optical background and doesnot provide comparable range performances. Inside LIDAR family,one could also consider DISC-LIDAR (differential scattering) andDIAL-LIDAR (differential absorption) techniques; however, none ofthem proved useful for biological detection purposes.
The main purpose of the research presented in the paper wasassociated with multichannel LIF-LIDAR theoretical modeling, hard-ware development, and finally its testing in realistic conditions toassess the obtained sensitivity and biological discrimination potential.
2. LIF-LIDAR setup and its theoretical performance
When compared with classical scattering LIDAR, capable of tracingthe aerosols at the distances of tens of kilometers, LIF-LIDAR
performance is diminished by a number of factors. First of all, UVlaser beam is strongly scattered on its path through the atmosphere[16,17]; so, its energy is significantly reduced before it reaches themeasured cloud. On the other side, fluorescence emission signalappears in the wavelength range, which coincides with the naturalsky daylight radiance [18], implying a noisy background and opticalpower capable of saturating the detection unit. Finally, fluorescencecross-sections stand several orders of magnitude below the elasticscattering cross-sections [19,20]. It results in extremely low-powerfluorescence signal arriving to the receiver. All these factors make theeffective LIF-LIDAR design a real challenge.
The developed LIDAR system (Fig. 2) includes two laser sources forfluorescence excitation, operating at wavelengths 266 nm and355 nm. Biological fluorescence efficiency is spectrally dependentand the optimum excitation wavelengths can be identified as280 nm (aromatic amino acids fluorescence) and 340 nm (cell meta-bolism factors fluorescence) [15]; however, due to unavailability ofhigh-power pulsed lasers operating at exactly those wavelengths, thechoice of nearest spectral vicinity seemed to be reasonable. Bothwavelengths have been implemented in the device, since the detectionof both types of fluorescence origins mentioned above may proveessential in terms of agents discrimination. The role of collecting opticsis performed by the Newtonian telescope with an effective inputaperture diameter of 22 cm. The received optical signal is generallycomposed of elastically scattered and fluorescence components. Theformer is optically separated and directed to two dedicated photo-multiplier tubes (PMT) considering two linear orthogonal polarizationstates of elastically backscattered radiation (lasers applied in thesystem demonstrates linear, vertical polarization). Fluorescence com-ponent is directed to Czerny–Turner spectrograph, where its spectralcontent is spatially separated and focused onto 28 stripes of multi-channel PMT. The electrical signals obtained in the detectors areprobed at the rate of 250MS/s and digitized for storing and processingpurposes. The whole system is installed on a motorized automatic
Fig. 1. Principles of a LIF-LIDAR technique.
Fig. 2. The developed LIDAR platform (left – functional scheme, right – photograph).
J. Wojtanowski et al. / Optics & Laser Technology 67 (2015) 25–3226
scanning platform. In this paper, the discussion is limited to thefluorescence component of the developed fluorescence-scattering-depolarization LIDAR platform.
To evaluate the achievable ranges of effective fluorescencedetection and to optimize the construction of the LIDAR system,the mathematical formulation of the expected signal-to-noiseratio (SNR) as a function of range was taken into consideration.The analysis included the impact of the most vital environmentaland hardware factors. The decent SNR evaluation required thedetermination of three main components:
- spectral power level of the measured optical signal,- spectral power level of the total optical signal impinging ontothe detector surface (including the ambient background),
- detector noise characteristics at the applied configuration.
Theoretical power of range-resolved fluorescence optical echosignal P(F)(R) can be obtained from the classical LIDAR equation [21]modified with regard to fluorescing target, which in the case ofhomogeneous biological cloud is given by the following equation [22]:
PðFÞðRÞ ¼ Epc2
e�½γðλexcÞþ γðλemsÞ�RA0
R2ξðRÞ∂σðFÞΔλNðRÞη0 ð1Þ
where Ep is the laser pulse output energy [J], c is the speed of light[m s�1], γ the extinction coefficient [km�1], λexc the excitationwavelength [nm], λems the emission wavelength [nm], A0 the receiverarea [m2], ξ is range-dependent geometrical overlap factor (dimen-sionless), ∂σ(F) is the fluorescence differential cross-section[m2 sr�1 nm�1], Δλ the spectral width of detection channel [nm],N is the concentration of bioparticles [m�3], and η0 is the wavelength-dependent transmission of the receiving optical train (dimensionless).Eq. (1) does not include the effects of finite fluorescence lifetime anddetection integration time. These factors contribute to the change ofreceived waveform shape in time domain. Since the approachproposed in the paper is based on signal integration throughout thewhole aerosol cloud, such a simplification is valid.
Since its spectral range overlaps with the fluorescence emissionbands, the natural daylight background forms an essential factor,which limits the capabilities of the fluorescence LIDAR duringdaytime, especially when sunny weather occurs. The averagespectral diffuse sky luminance Sbλ [W m�2 sr�1 nm�1] dependson the hour of the day and corresponding sun azimuth as well asweather conditions. Unsurprisingly, it is several orders of magni-tude lower at nighttime and then its impact is negligible. Similarto the measured fluorescence signal, the background radiation iscollected by the receiver optics and directed onto the detectorsurface. In case of PMT, the background radiation generates a
photocurrent ib [A] in its photocathode given by
ib ¼ SbλΩ0A0Δληpmteλhc
ð2Þ
where Ω0 is the receiver solid angle field of view [sr], ηpmt is thequantum efficiency of the PMT photocathode (dimensionless), e is theelectron charge [Q], and h is Planck’s constant [J s]. The resultingphotocathode SNR is also associated with signal and backgroundinduced shot noise as well as dark current:
SNR¼ isin¼ isffiffiffiffiffiffiffiffiffiffiffiffiffiffiffiffiffiffiffiffiffiffiffiffiffiffiffiffiffiffiffi
2eB isþ ibþ idð Þp ð3Þ
where is is the current generated at PMT photocathode by thefluorescence optical signal:
is ¼ Pηpmteλems
hcð4Þ
where in is the photocathode shot noise resulting from: signal currentis (Eq. (4)), background current ib (Eq. (2)), and cathode dark current id.B stands for the detector frequency bandwidth [Hz]. Since a long-range fluorescence LIDAR is typically based on high-power pulsed UVlaser(s), detection SNR can be increased by the application of asynchronous accumulation technique [23], where a number of mea-sured echo pulses are integrated and averaged. Resultant signal-to-noise ratio SNRav�n is then given by
SNRav�n ¼ SNRffiffiffin
p ð5Þwhere n is the number of integrated pulses. Finally, the output SNRrange-dependence can be expressed by the following formula:
SNRav�nðRÞ ¼PðFÞðRÞηpmte
λhc
ffiffiffin
pffiffiffiffiffiffiffiffiffiffiffiffiffiffiffiffiffiffiffiffiffiffiffiffiffiffiffiffiffiffiffiffiffiffiffiffiffiffiffiffiffiffiffiffiffiffiffiffiffiffiffiffiffiffiffiffiffiffiffiffiffiffiffiffiffiffiffiffiffiffiffiffiffiffiffiffiffiffiffiffiffiffiffiffiffiffiffiffiffiffiffi2eB PðFÞðRÞηpmte
λhcþSbΩ0A0Δληpmte
λhcþ id
h ir ð6Þ
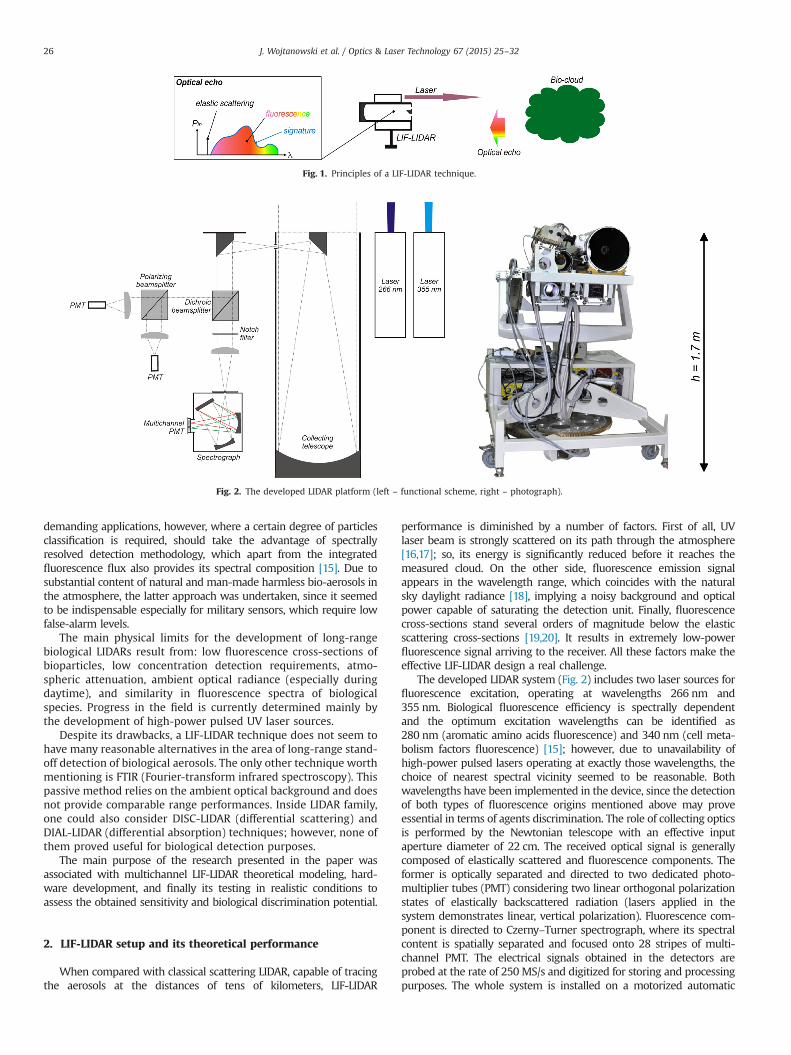
The more the pulses integrated, the better the results in terms ofSNR; however, the integration time should not exceed several tens ofseconds due to the dynamics of the measured cloud of aerosol. Fig. 3shows the plots of SNRav�20 curves for the parameters correspond-ing to the developed platform.
Minimum detectable SNR level of 10 can be reasonably consideredto provide technical capability to process the signal and to analyze itsspectral signature. The SNR curves in Fig. 3 reveal that the systemperformance strongly depends on bio-agent fluorescence cross-sectionand ambient optical background. Fluorescence emission spectra over-lap with visible wavelength range, which in the case of sunny dayscreates a main limiting factor of LIDAR fluorescence detection perfor-mance, as underlined before. Because of the broadband nature offluorescence emission, application of narrow spectral filtering is not amethod to deal with this problem, since it does not improve SNR.Nevertheless, it has to be done for two reasons. First of all, it is crucial
0 500 1000 1500 2000 2500100
101
102
103
R [m]
SNR av
-20
Threshold
N =1000 ppl
Fig. 3. Theoretical performance of the developed LIF-LIDAR regarding stand-off detection of 1000 ppl bio-agent concentration (left: SNR curves vs. detection threshold, right:system main parameters).
J. Wojtanowski et al. / Optics & Laser Technology 67 (2015) 25–32 27
to prevent detector saturation or even damage and second—aiming atfluorescence signatures spectral analysis, emission band must beoptically discretized into a number of narrower spectral regions.Strong ambient optical background has a direct impact on noise;however, signal is also indirectly influenced due to enforced amplifica-tion reduction. Detector cannot sustain high-background resultantlarge DC current and the amplification has to be decreased; otherwise,as mentioned, nonlinear behavior, saturation, or even damage occur.
The presented theoretical performance concerns one representa-tive configuration with respect to aerosol concentration (1000 ppl)and measurement time (1 s, since laser repetition rate equals 20 Hz).One can develop SNR(R) plots for other scenarios, when higher (lower)concentrations and longer (shorter) averaging times are taken intoaccount. Also, another level of fluorescence cross-sections may beconsidered; however, the range of 10�13–10�12 cm2 sr�1 nm�1 usedfor calculations seems to be appropriately representative [22].
3. Field campaign and data analysis
To verify the theoretical predictions and evaluate the system’s realsensitivity and overall performance, the measurement campaign wasorganized in the facilities of Dugway Proving Ground (DPG) [24]. Thesystem was located in constant distance of about 700m from aspecialized chamber (3 m diameter and 30m length), where testedbiological particles were released at known quantities to form thecloud of the aerosol in the interior. It was kept constantly homo-genized by a multiple-fan system. Additionally, the chamber wasmonitored by APS (aerosol particle sampler) in situ instruments interms of the aerosol volume concentration and its evolution in time.Most measurements were performed during nighttime to avoidbackground sunlight radiance. Being preceded by 2min of backgroundanalysis, each trial lasted for about 15 min including the releasemoment and the period of gradual slow concentration decay causedby controlled leakage of the aerosol from the chamber. Such aconfiguration and proved quality of the measured target aerosolallowed one to:
1) evaluate the system’s fluorescence sensitivity for a variety ofbiological species,
2) create a library or a database of fluorescence spectral signaturesfor classification purposes,
3) calibrate the system.
3.1. Sensitivity analysis
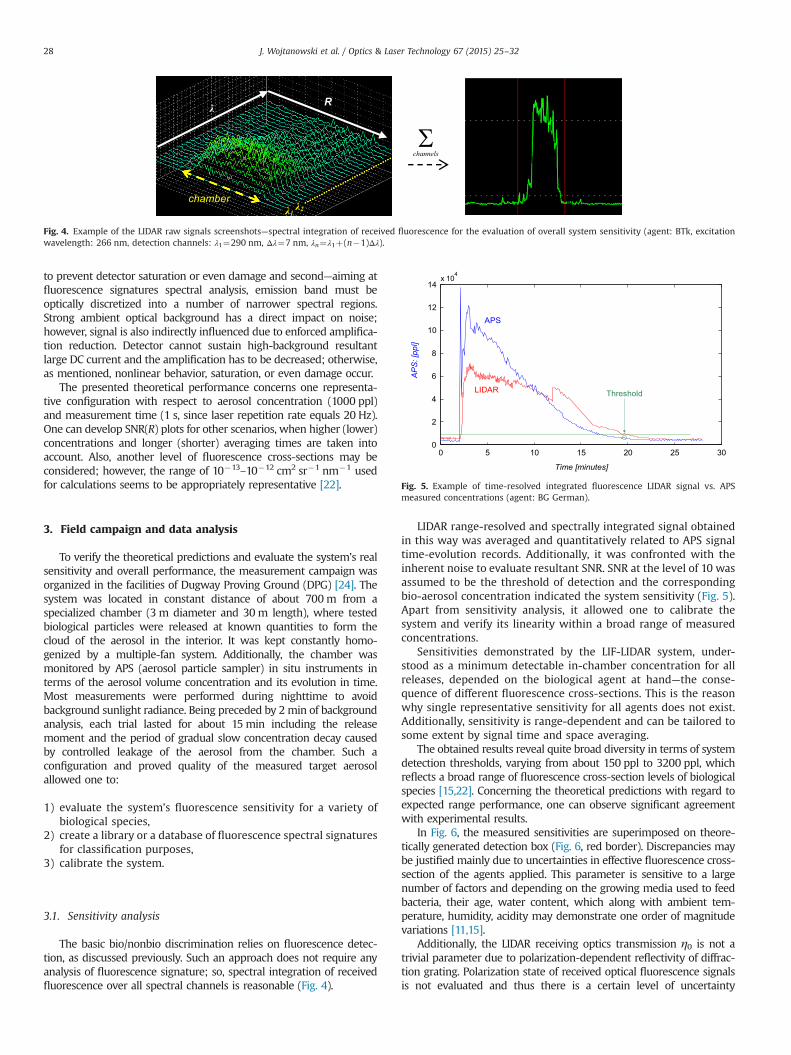
The basic bio/nonbio discrimination relies on fluorescence detec-tion, as discussed previously. Such an approach does not require anyanalysis of fluorescence signature; so, spectral integration of receivedfluorescence over all spectral channels is reasonable (Fig. 4).
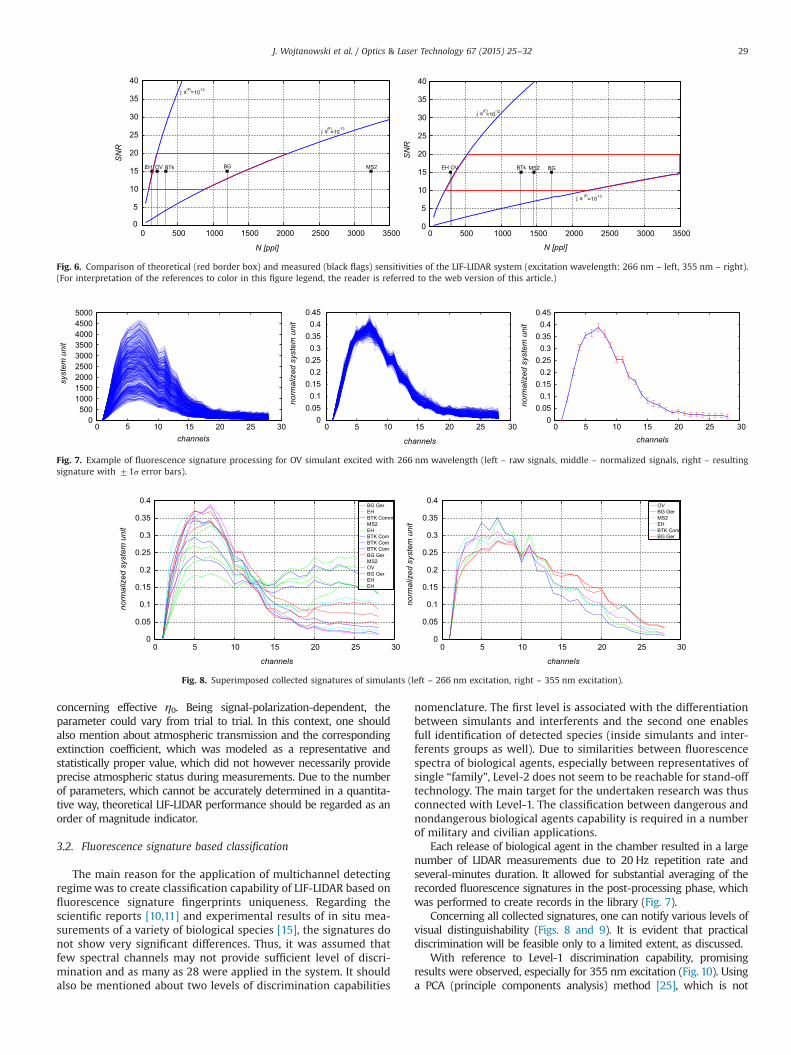
LIDAR range-resolved and spectrally integrated signal obtainedin this way was averaged and quantitatively related to APS signaltime-evolution records. Additionally, it was confronted with theinherent noise to evaluate resultant SNR. SNR at the level of 10 wasassumed to be the threshold of detection and the correspondingbio-aerosol concentration indicated the system sensitivity (Fig. 5).Apart from sensitivity analysis, it allowed one to calibrate thesystem and verify its linearity within a broad range of measuredconcentrations.
Sensitivities demonstrated by the LIF-LIDAR system, under-stood as a minimum detectable in-chamber concentration for allreleases, depended on the biological agent at hand—the conse-quence of different fluorescence cross-sections. This is the reasonwhy single representative sensitivity for all agents does not exist.Additionally, sensitivity is range-dependent and can be tailored tosome extent by signal time and space averaging.
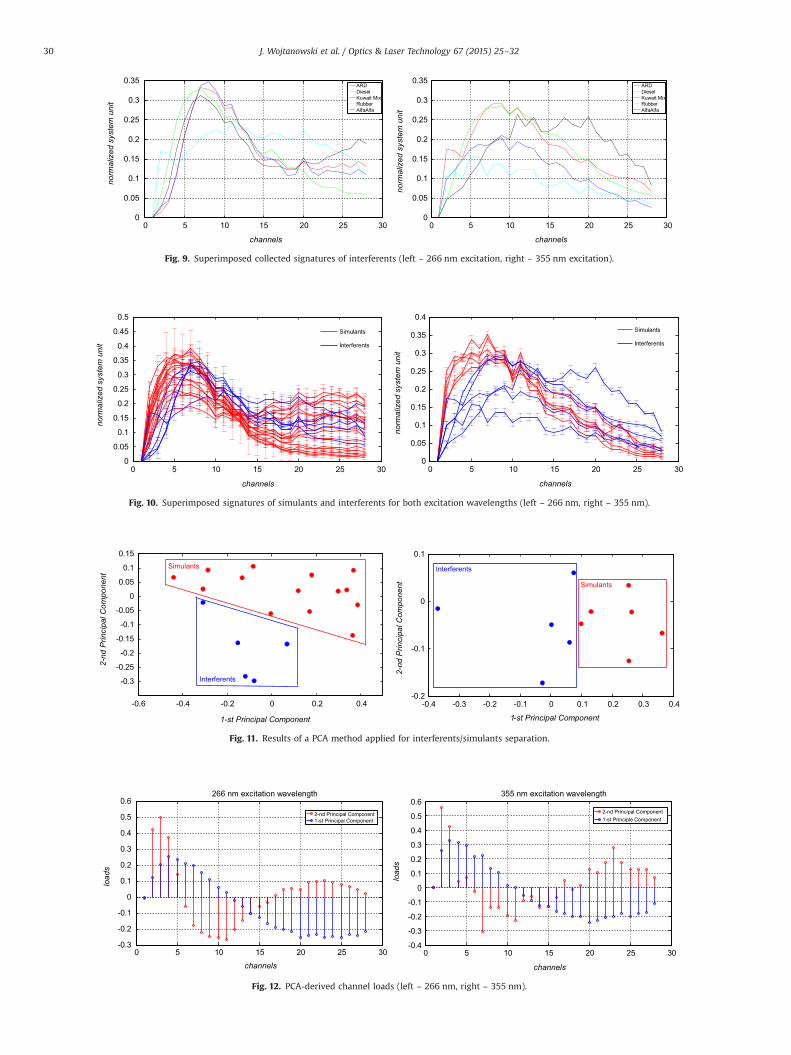
The obtained results reveal quite broad diversity in terms of systemdetection thresholds, varying from about 150 ppl to 3200 ppl, whichreflects a broad range of fluorescence cross-section levels of biologicalspecies [15,22]. Concerning the theoretical predictions with regard toexpected range performance, one can observe significant agreementwith experimental results.
In Fig. 6, the measured sensitivities are superimposed on theore-tically generated detection box (Fig. 6, red border). Discrepancies maybe justified mainly due to uncertainties in effective fluorescence cross-section of the agents applied. This parameter is sensitive to a largenumber of factors and depending on the growing media used to feedbacteria, their age, water content, which along with ambient tem-perature, humidity, acidity may demonstrate one order of magnitudevariations [11,15].
Additionally, the LIDAR receiving optics transmission η0 is not atrivial parameter due to polarization-dependent reflectivity of diffrac-tion grating. Polarization state of received optical fluorescence signalsis not evaluated and thus there is a certain level of uncertainty
channels
chamber λ1 λ2
Rλ
Fig. 4. Example of the LIDAR raw signals screenshots—spectral integration of received fluorescence for the evaluation of overall system sensitivity (agent: BTk, excitationwavelength: 266 nm, detection channels: λ1¼290 nm, Δλ¼7 nm, λn¼λ1þ(n�1)Δλ).
0 5 10 15 20 25 300
2
4
6
8
10
12
14x 10
4
Time [minutes]
AP
S: [
ppl]
Threshold
APS
LIDAR
Fig. 5. Example of time-resolved integrated fluorescence LIDAR signal vs. APSmeasured concentrations (agent: BG German).
J. Wojtanowski et al. / Optics & Laser Technology 67 (2015) 25–3228
concerning effective η0. Being signal-polarization-dependent, theparameter could vary from trial to trial. In this context, one shouldalso mention about atmospheric transmission and the correspondingextinction coefficient, which was modeled as a representative andstatistically proper value, which did not however necessarily provideprecise atmospheric status during measurements. Due to the numberof parameters, which cannot be accurately determined in a quantita-tive way, theoretical LIF-LIDAR performance should be regarded as anorder of magnitude indicator.
3.2. Fluorescence signature based classification
The main reason for the application of multichannel detectingregime was to create classification capability of LIF-LIDAR based onfluorescence signature fingerprints uniqueness. Regarding thescientific reports [10,11] and experimental results of in situ mea-surements of a variety of biological species [15], the signatures donot show very significant differences. Thus, it was assumed thatfew spectral channels may not provide sufficient level of discri-mination and as many as 28 were applied in the system. It shouldalso be mentioned about two levels of discrimination capabilities
nomenclature. The first level is associated with the differentiationbetween simulants and interferents and the second one enablesfull identification of detected species (inside simulants and inter-ferents groups as well). Due to similarities between fluorescencespectra of biological agents, especially between representatives ofsingle “family”, Level-2 does not seem to be reachable for stand-offtechnology. The main target for the undertaken research was thusconnected with Level-1. The classification between dangerous andnondangerous biological agents capability is required in a numberof military and civilian applications.
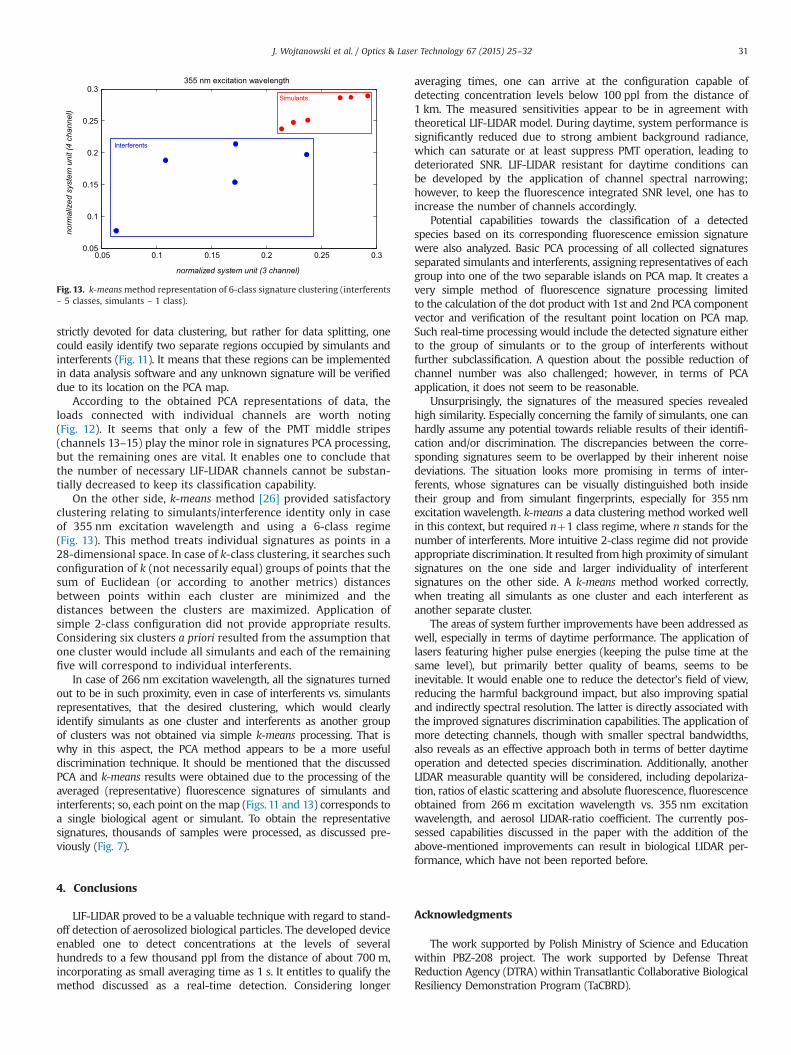
Each release of biological agent in the chamber resulted in a largenumber of LIDAR measurements due to 20 Hz repetition rate andseveral-minutes duration. It allowed for substantial averaging of therecorded fluorescence signatures in the post-processing phase, whichwas performed to create records in the library (Fig. 7).
Concerning all collected signatures, one can notify various levels ofvisual distinguishability (Figs. 8 and 9). It is evident that practicaldiscrimination will be feasible only to a limited extent, as discussed.
With reference to Level-1 discrimination capability, promisingresults were observed, especially for 355 nm excitation (Fig. 10). Usinga PCA (principle components analysis) method [25], which is not
00
500 1000 1500 2000 2500 3000 3500
5
10
15
20
25
30
35
40
N [ppl]
SN
R
0 500 1000 1500 2000 2500 3000 35000
5
10
15
20
25
30
35
40
N [ppl]
SN
R
Fig. 6. Comparison of theoretical (red border box) and measured (black flags) sensitivities of the LIF-LIDAR system (excitation wavelength: 266 nm – left, 355 nm – right).(For interpretation of the references to color in this figure legend, the reader is referred to the web version of this article.)
0 5 10 15 20 25 300
0.050.1
0.150.2
0.250.3
0.350.4
0.45
channels
norm
aliz
ed s
yste
m u
nit
0 5 10 15 20 25 300
500100015002000250030003500400045005000
channels
syst
em u
nit
0 5 10 15 20 25 300
0.050.1
0.150.2
0.250.3
0.350.4
0.45
channels
norm
aliz
ed s
yste
m u
nit
Fig. 7. Example of fluorescence signature processing for OV simulant excited with 266 nm wavelength (left – raw signals, middle – normalized signals, right – resultingsignature with 71σ error bars).
0 5 10 15 20 25 300
0.05
0.1
0.15
0.2
0.25
0.3
0.35
0.4
channels
norm
aliz
ed s
yste
m u
nit
0 5 10 15 20 25 300
0.05
0.1
0.15
0.2
0.25
0.3
0.35
0.4
channels
norm
aliz
ed s
yste
m u
nit
Fig. 8. Superimposed collected signatures of simulants (left – 266 nm excitation, right – 355 nm excitation).
J. Wojtanowski et al. / Optics & Laser Technology 67 (2015) 25–32 29
0 5 10 15 20 25 300
0.05
0.1
0.15
0.2
0.25
0.3
0.35
0.4
channels
norm
aliz
ed s
yste
m u
nit
Simulants
Interferents
0 5 10 15 20 25 300
0.05
0.1
0.15
0.2
0.25
0.3
0.35
0.4
0.45
0.5
channels
norm
aliz
ed s
yste
m u
nit
Simulants
Interferents
Fig. 10. Superimposed signatures of simulants and interferents for both excitation wavelengths (left – 266 nm, right – 355 nm).
0 5 10 15 20 25 300
0.05
0.1
0.15
0.2
0.25
0.3
0.35
channels
norm
aliz
ed s
yste
m u
nit
0 5 10 15 20 25 300
0.05
0.1
0.15
0.2
0.25
0.3
0.35
channels
norm
aliz
ed s
yste
m u
nit
Fig. 9. Superimposed collected signatures of interferents (left – 266 nm excitation, right – 355 nm excitation).
-0.4 -0.3 -0.2 -0.1 0 0.1 0.2 0.3 0.4-0.2
-0.1
0
0.1
1-st Principal Component
2-nd
Prin
cipa
l Com
pone
nt
Interferents
Simulants
-0.6 -0.4 -0.2 0 0.2 0.4
-0.3
-0.25
-0.2
-0.15
-0.1
-0.05
0
0.05
0.1
0.15
1-st Principal Component
2-nd
Prin
cipa
l Com
pone
nt
Interferents
Simulants
Fig. 11. Results of a PCA method applied for interferents/simulants separation.
0 5 10 15 20 25 30-0.3
-0.2
-0.1
0
0.1
0.2
0.3
0.4
0.5
0.6
channels
load
s
266 nm excitation wavelength
0 5 10 15 20 25 30-0.4
-0.3
-0.2
-0.1
0
0.1
0.2
0.3
0.4
0.5
0.6
channels
load
s
355 nm excitation wavelength
Fig. 12. PCA-derived channel loads (left – 266 nm, right – 355 nm).
J. Wojtanowski et al. / Optics & Laser Technology 67 (2015) 25–3230
strictly devoted for data clustering, but rather for data splitting, onecould easily identify two separate regions occupied by simulants andinterferents (Fig. 11). It means that these regions can be implementedin data analysis software and any unknown signature will be verifieddue to its location on the PCA map.
According to the obtained PCA representations of data, theloads connected with individual channels are worth noting(Fig. 12). It seems that only a few of the PMT middle stripes(channels 13–15) play the minor role in signatures PCA processing,but the remaining ones are vital. It enables one to conclude thatthe number of necessary LIF-LIDAR channels cannot be substan-tially decreased to keep its classification capability.
On the other side, k-means method [26] provided satisfactoryclustering relating to simulants/interference identity only in caseof 355 nm excitation wavelength and using a 6-class regime(Fig. 13). This method treats individual signatures as points in a28-dimensional space. In case of k-class clustering, it searches suchconfiguration of k (not necessarily equal) groups of points that thesum of Euclidean (or according to another metrics) distancesbetween points within each cluster are minimized and thedistances between the clusters are maximized. Application ofsimple 2-class configuration did not provide appropriate results.Considering six clusters a priori resulted from the assumption thatone cluster would include all simulants and each of the remainingfive will correspond to individual interferents.
In case of 266 nm excitation wavelength, all the signatures turnedout to be in such proximity, even in case of interferents vs. simulantsrepresentatives, that the desired clustering, which would clearlyidentify simulants as one cluster and interferents as another groupof clusters was not obtained via simple k-means processing. That iswhy in this aspect, the PCA method appears to be a more usefuldiscrimination technique. It should be mentioned that the discussedPCA and k-means results were obtained due to the processing of theaveraged (representative) fluorescence signatures of simulants andinterferents; so, each point on the map (Figs. 11 and 13) corresponds toa single biological agent or simulant. To obtain the representativesignatures, thousands of samples were processed, as discussed pre-viously (Fig. 7).
4. Conclusions
LIF-LIDAR proved to be a valuable technique with regard to stand-off detection of aerosolized biological particles. The developed deviceenabled one to detect concentrations at the levels of severalhundreds to a few thousand ppl from the distance of about 700 m,incorporating as small averaging time as 1 s. It entitles to qualify themethod discussed as a real-time detection. Considering longer
averaging times, one can arrive at the configuration capable ofdetecting concentration levels below 100 ppl from the distance of1 km. The measured sensitivities appear to be in agreement withtheoretical LIF-LIDAR model. During daytime, system performance issignificantly reduced due to strong ambient background radiance,which can saturate or at least suppress PMT operation, leading todeteriorated SNR. LIF-LIDAR resistant for daytime conditions canbe developed by the application of channel spectral narrowing;however, to keep the fluorescence integrated SNR level, one has toincrease the number of channels accordingly.
Potential capabilities towards the classification of a detectedspecies based on its corresponding fluorescence emission signaturewere also analyzed. Basic PCA processing of all collected signaturesseparated simulants and interferents, assigning representatives of eachgroup into one of the two separable islands on PCA map. It creates avery simple method of fluorescence signature processing limitedto the calculation of the dot product with 1st and 2nd PCA componentvector and verification of the resultant point location on PCA map.Such real-time processing would include the detected signature eitherto the group of simulants or to the group of interferents withoutfurther subclassification. A question about the possible reduction ofchannel number was also challenged; however, in terms of PCAapplication, it does not seem to be reasonable.
Unsurprisingly, the signatures of the measured species revealedhigh similarity. Especially concerning the family of simulants, one canhardly assume any potential towards reliable results of their identifi-cation and/or discrimination. The discrepancies between the corre-sponding signatures seem to be overlapped by their inherent noisedeviations. The situation looks more promising in terms of inter-ferents, whose signatures can be visually distinguished both insidetheir group and from simulant fingerprints, especially for 355 nmexcitation wavelength. k-means a data clustering method worked wellin this context, but required nþ1 class regime, where n stands for thenumber of interferents. More intuitive 2-class regime did not provideappropriate discrimination. It resulted from high proximity of simulantsignatures on the one side and larger individuality of interferentsignatures on the other side. A k-means method worked correctly,when treating all simulants as one cluster and each interferent asanother separate cluster.
The areas of system further improvements have been addressed aswell, especially in terms of daytime performance. The application oflasers featuring higher pulse energies (keeping the pulse time at thesame level), but primarily better quality of beams, seems to beinevitable. It would enable one to reduce the detector’s field of view,reducing the harmful background impact, but also improving spatialand indirectly spectral resolution. The latter is directly associated withthe improved signatures discrimination capabilities. The application ofmore detecting channels, though with smaller spectral bandwidths,also reveals as an effective approach both in terms of better daytimeoperation and detected species discrimination. Additionally, anotherLIDAR measurable quantity will be considered, including depolariza-tion, ratios of elastic scattering and absolute fluorescence, fluorescenceobtained from 266m excitation wavelength vs. 355 nm excitationwavelength, and aerosol LIDAR-ratio coefficient. The currently pos-sessed capabilities discussed in the paper with the addition of theabove-mentioned improvements can result in biological LIDAR per-formance, which have not been reported before.
Acknowledgments
The work supported by Polish Ministry of Science and Educationwithin PBZ-208 project. The work supported by Defense ThreatReduction Agency (DTRA) within Transatlantic Collaborative BiologicalResiliency Demonstration Program (TaCBRD).
0.05 0.1 0.15 0.2 0.25 0.30.05
0.1
0.15
0.2
0.25
0.3
normalized system unit (3 channel)
norm
aliz
ed s
yste
m u
nit (
4 ch
anne
l)355 nm excitation wavelength
Simulants
Interferents
Fig. 13. k-meansmethod representation of 6-class signature clustering (interferents– 5 classes, simulants – 1 class).
J. Wojtanowski et al. / Optics & Laser Technology 67 (2015) 25–32 31
References
[1] Measures RM. Laser remote sensing: fundamentals and applications. USA:Krieger Publishing; 1992.
[2] Weitkamp C. Lidar: range-resolved optical remote sensing of the atmosphere.USA: Springer Series in Optical Sciences; 2005.
[3] Mensah FE. Lidar techniques and remote sensing in the atmosphere: under-standing the use of laser light in the atmosphere. USA: Author House; 2009.
[4] Woods PT, Jolliffe BW. Experimental and theoretical studies related to a dyelaser differential lidar system for the determination of atmospheric SO2 andNO2 concentrations. Opt Lasers Eng 1978;10(1):25–8.
[5] Wojtanowski J, Mierczyk Z, Zygmunt M. Laser remote sensing of underwaterobjects. Proc SPIE 2008;7105:71050F (1–12).
[6] Mierczyk Z, Zygmunt M, Gawlikowski A, Gietka A, Kaszczuk M, Knysak P, et al.Two-wavelength backscattering lidar for stand-off detection of aerosols. ProcSPIE 2008;7111:71110R (1–9).
[7] Kaszczuk M, Mierczyk Z, Zygmunt M, Drozd T, Gawlikowski A, Gietka A, et al..Multispectral laser head for reconnaissance and analysis of terrain compo-nents for unmanned aerial vehicles, (in Polish). In: Proc Ekomilitaris, 25; 2011.p. 271–78.
[8] Utkin AB, Lavrov A, Vilar R. Laser rangefinder architecture as a cost-effectiveplatform for lidar fire surveillance. Opt Lasers Eng 2009;41(7):862–70.
[9] Born M, Wolf E. Principles of optics. USA: Cambridge University Press; 2003.[10] Demchenko AP. Introduction to fluorescence sensing. USA: Springer; 2009.[11] Lakowicz J. Principles of fluorescence spectroscopy. USA: Plenum Publishers;
1999.[12] Jonsson P, Kullander F, Nordstand M, Tjarnhage T, Wasterby P, Lindgren M.
Development of fluorescence-based point detector for biological sensing. ProcSPIE 2004;5617:60–74.
[13] Bengtsson M, Grönlunda R, Sjöholma M, Abrahamssona C, Dernfalkb AD,Wallströmc S, et al. Fluorescence lidar imaging of fungal growth on high-voltage outdoor composite insulators. Opt Lasers Eng 2005;43(6):624–32.
[14] Eversole JD, Cary Jr. WK, Scotto CS, Pierson R, Spence M, Campilo AJ.Continuous bioaerosol monitoring using UV excitation fluorescence: outdoortest results. Field Anal Chem Technol 2001;1594:205–12.
[15] Włodarski M, Kaliszewski M, Kwaśny M, Kopczynski K, Zawadzki Z, Mierczyk Z,et al. Fluorescence excitation-emission matrices of selected biological materials.Proc SPIE 2006;6398:1–12.
[16] Bohren CF, Huffman DR. Absorption and scattering of light by small particles.USA: John Willey & Sons; 1983.
[17] Van de Hulst HC. Light scattering by small particles. USA: Willey; 1957.[18] Agishev R, Gross B, Moshary F, Gilerson A, Ahmed S. Simple approach to
predict APD/PMT lidar detector performance under sky background usingdimensionless parameterization. Opt Lasers Eng 2006;44(8):779–96.
[19] Sivaprakasam V, Huston AL, Scotto C, Eversole JD. Multiple UV wavelengthexcitation and fluorescence of bioaerosols. Opt Express 2004;12(19):4457–66.
[20] Faris G, Copeland RA, Mortelmans K, Bronk B. Spectrally resolved absolutefluorescence cross sections for bacillus spores. Appl Opt 1997;36(4):958–67.
[21] Richmond RD, Cain SC. Direct-detection LADAR systems. USA: SPIE Press; 2010.[22] Wojtanowski J. The application of multispectral fluorescence LIDAR technique
for stand-off detection of biological aerosols. ([Ph.D. dissertation]). Poland:Military University of Technology; 2011 [in Polish].
[23] Zygmunt M. Methods of sub-noise signals detection in time-of-flight laserrangefinders. ([Ph.D. dissertation]). Poland: Military University of Technology;2002 [in Polish].
[24] ⟨http://www.dugway.army.mil/⟩.[25] Jolliffe IT. Principal component analysis. 2nd ed.. USA: Springer Series in
Statistics; 2002.[26] Hartigan JA. Clustering algorithms. USA: John Wiley & Sons; 1975.
J. Wojtanowski et al. / Optics & Laser Technology 67 (2015) 25–3232


![HI J 平成31年3月29日...DE H I H JKI H #LI H MNI H OPI H QRI H STI H OPUVI H WXYI H ZMI H Z[I H \]^ H _`a^ H bc^ H #b^ H def H ghf H Lif H j^ H kl^ H OP^ H kef H * ^ H mne^ H oOP^](https://static.fdocuments.pl/doc/165x107/5ea2e0b2ed3aed659b2111bb/hi-j-313oe29-de-h-i-h-jki-h-li-h-mni-h-opi-h-qri-h-sti-h-opuvi.jpg)


![;DkfbsLo======== ljifo;rL lzif{s k]h g+=Jun 01, 2015 · 2 k|j[mlt k|jfx /fli6«o q}dfl;s s[lif pRr lzIffsf nflu k[y' 6]lSgsn sn]h u'0f:t/Lo s[lif pRr lzIffsf nflu lq=la af6 dfGotf](https://static.fdocuments.pl/doc/165x107/6103a9a30e70d44e71278990/dkfbslo-ljiforl-lzifs-kh-g-jun-01-2015-2-kjmlt-kjfx-fli6o.jpg)