HARMONIC DISTORTION ANALYSIS IN ARMATURE ... machines. The problem of bad power quality concerns not...
7
Zeszyty Problemowe – Maszyny Elektryczne Nr 84/2009 217 Krzysztof Ludwinek * , Arkadiusz Siedlarz ** * Kielce University of Technology, Kielce ** Pilkington Automotive Poland Sp. z o.o., Sandomierz HARMONIC DISTORTION ANALYSIS IN ARMATURE CURRENTS OF SYNCHRONOUS MACHINE DURING CO-OPERATION WITH THE POWER SYSTEM Abstract: In the article an analysis of harmonic distortion in armature currents in synchronous machine during co-operation with electric power system is presented. The analysis is carried out thanks to the computer appli- cations designed in LabVIEW - graphical programming environment. The applications allow to carry out the analysis of the influence of voltage unbalance and harmonic distortion on the power quality and to display on screen the non-sine waveforms of the voltages and currents taken by electrical equipment. Moreover, the pro- grams display the RMS values of active, reactive and apparent power as well as power of distortion and coef- ficients: THD, PHD, IHD, power factor and voltage unbalance. In addition, the applications allow to record the signals from A/C measuring devices or oscilloscopes and save them to file for further analysis. 1. Introduction Due to the fact that power supply market in Poland has gradually been freed from govern- ment regulations, producers and consumers of electrical energy pay more attention to its qua- lity and reliability of power system. Bad power quality increases its total loss during transmis- sion, could be a reason of serious machine fai- lures leading to reduction of the production volume or to down-time increase. Moreover, it contributes to shortening of total lifetime of the electrical machines. The problem of bad power quality concerns not only industrial consumers but also individual people. Flickering of light, often computers failures and data loss, improper interruption of the circuits by fuses, circuit breakers or RCDs, or electrical and electronic device overheating are only a few example of how big the impact of bad power quality on the life of ordinary people is. Thus, Polish work market needs engineers qualified to deal with this issue. However, Universities in Poland do not spare much time for teaching young engi- neers about this matter. Therefore, Chair of Electrical Machines and Mechatronic Systems (KMEiSM) of Kielce University of Technology created lab stations to start educating students in the field of power quality. The lab stations make possible for the students to analyse the parameters of electrical energy, to display the momentary waveforms of the current, voltage, and momentary power and to carry out some simulations of the influence of asymmetrical currents and voltage on the quality of energy and machines’ work. 2. Computer measurement set for the analysis of higher harmonics in currents and voltages Computer measurement set enables to carry out an analysis of higher harmonics in currents and voltages supplying 1-, 2-, or 3-phase electrical machines or electrical equipment. The com- puter measurement set consists of both: mea- surement set and computer applications in LabVIEW 8.2 (simulation and analysis). These applications allow to carry out the real-time analysis (to calculate the coefficients THD, PHD, IHD, power factor, unsymmetrical factor, powers: active P, reactive, Q, apparent S, mo- dulus apparent S and distortion T) or to record the waveforms of currents and voltages for later analysis. The measurement set consists of 8 measuring transducers, designed and made in Chair of Electrical Machines and Mechatronic Systems, for recording the currents and voltage waveforms (in phase and interfacial configura- tion). 2.1. Applications in LabVIEW - Simulator The simulator allows to generate arbitrary sig- nals by an appropriate set up of the amplitudes and initials phases of particular harmonics cur- rent and voltages. Students can do that by ta- ping the values directly from the keyboard or by changing position of sliders on the screen. Following analysis can be carried out: 1) Analysis of voltage unbalance and higher harmonics distortion in current and voltage and their the influence on the power quality in
Transcript of HARMONIC DISTORTION ANALYSIS IN ARMATURE ... machines. The problem of bad power quality concerns not...

Zeszyty Problemowe – Maszyny Elektryczne Nr 84/2009 217
Krzysztof Ludwinek*, Arkadiusz Siedlarz**
*Kielce University of Technology, Kielce**Pilkington Automotive Poland Sp. z o.o., Sandomierz
HARMONIC DISTORTION ANALYSIS IN ARMATURE CURRENTS OF SYNCHRONOUS MACHINE DURING CO-OPERATION
WITH THE POWER SYSTEM
Abstract: In the article an analysis of harmonic distortion in armature currents in synchronous machine during co-operation with electric power system is presented. The analysis is carried out thanks to the computer appli-cations designed in LabVIEW - graphical programming environment. The applications allow to carry out the analysis of the influence of voltage unbalance and harmonic distortion on the power quality and to display on screen the non-sine waveforms of the voltages and currents taken by electrical equipment. Moreover, the pro-grams display the RMS values of active, reactive and apparent power as well as power of distortion and coef-ficients: THD, PHD, IHD, power factor and voltage unbalance. In addition, the applications allow to record the signals from A/C measuring devices or oscilloscopes and save them to file for further analysis.
1. IntroductionDue to the fact that power supply market in Poland has gradually been freed from govern-ment regulations, producers and consumers of electrical energy pay more attention to its qua-lity and reliability of power system. Bad power quality increases its total loss during transmis-sion, could be a reason of serious machine fai-lures leading to reduction of the production volume or to down-time increase. Moreover, it contributes to shortening of total lifetime of the electrical machines. The problem of bad power quality concerns not only industrial consumers but also individual people. Flickering of light, often computers failures and data loss, improper interruption of the circuits by fuses, circuit breakers or RCDs, or electrical and electronic device overheating are only a few example of how big the impact of bad power quality on the life of ordinary people is. Thus, Polish work market needs engineers qualified to deal with this issue. However, Universities in Poland do not spare much time for teaching young engi-neers about this matter. Therefore, Chair of Electrical Machines and Mechatronic Systems (KMEiSM) of Kielce University of Technology created lab stations to start educating students in the field of power quality. The lab stations make possible for the students to analyse the parameters of electrical energy, to display the momentary waveforms of the current, voltage, and momentary power and to carry out some simulations of the influence of asymmetrical currents and voltage on the quality of energy and machines’ work.
2. Computer measurement set for the analysis of higher harmonics in currents and voltages
Computer measurement set enables to carry out an analysis of higher harmonics in currents and voltages supplying 1-, 2-, or 3-phase electrical machines or electrical equipment. The com-puter measurement set consists of both: mea-surement set and computer applications in LabVIEW 8.2 (simulation and analysis). These applications allow to carry out the real-time analysis (to calculate the coefficients THD, PHD, IHD, power factor, unsymmetrical factor, powers: active P, reactive, Q, apparent S, mo-dulus apparent S and distortion T) or to record
the waveforms of currents and voltages for later analysis. The measurement set consists of 8 measuring transducers, designed and made in Chair of Electrical Machines and Mechatronic Systems, for recording the currents and voltage waveforms (in phase and interfacial configura-tion).
2.1. Applications in LabVIEW - Simulator
The simulator allows to generate arbitrary sig-nals by an appropriate set up of the amplitudes and initials phases of particular harmonics cur-rent and voltages. Students can do that by ta-ping the values directly from the keyboard or by changing position of sliders on the screen. Following analysis can be carried out:1) Analysis of voltage unbalance and higher
harmonics distortion in current and voltage and their the influence on the power quality in
Zeszyty Problemowe – Maszyny Elektryczne Nr 84/2009218
accordance with Polish Norms PN-EN 50160 and PN-EN 61000.
2) Simulation of the amplitudes and phases influence of particular higher harmonics on the resultant waveforms of currents, voltagesand powers.
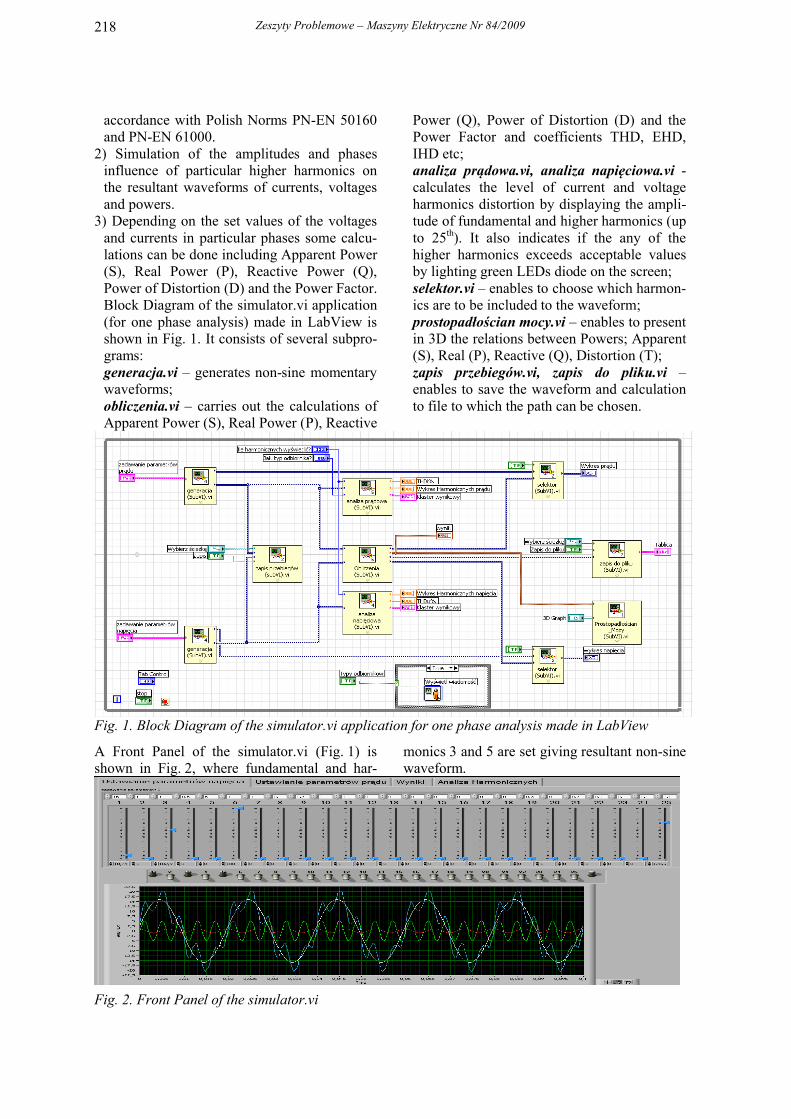
3) Depending on the set values of the voltages and currents in particular phases some calcu-lations can be done including Apparent Power (S), Real Power (P), Reactive Power (Q), Power of Distortion (D) and the Power Factor. Block Diagram of the simulator.vi application (for one phase analysis) made in LabView is shown in Fig. 1. It consists of several subpro-grams:generacja.vi – generates non-sine momentary waveforms;obliczenia.vi – carries out the calculations of Apparent Power (S), Real Power (P), Reactive
Power (Q), Power of Distortion (D) and the Power Factor and coefficients THD, EHD, IHD etc;analiza prądowa.vi, analiza napięciowa.vi -calculates the level of current and voltage harmonics distortion by displaying the ampli-tude of fundamental and higher harmonics (up to 25th). It also indicates if the any of the higher harmonics exceeds acceptable values by lighting green LEDs diode on the screen;selektor.vi – enables to choose which harmon-ics are to be included to the waveform;prostopadłościan mocy.vi – enables to present in 3D the relations between Powers; Apparent (S), Real (P), Reactive (Q), Distortion (T);zapis przebiegów.vi, zapis do pliku.vi –enables to save the waveform and calculation to file to which the path can be chosen.
Fig. 1. Block Diagram of the simulator.vi application for one phase analysis made in LabView
A Front Panel of the simulator.vi (Fig. 1) is shown in Fig. 2, where fundamental and har-
monics 3 and 5 are set giving resultant non-sine waveform.
Fig. 2. Front Panel of the simulator.vi

Zeszyty Problemowe – Maszyny Elektryczne Nr 84/2009 219
The Front Panel has got four windows. First two of them (Ustawianie parametrów napięciaand Ustawianie paramentrów prądu) can be used for setting parameters of arbitrary non-sine signals by changing amplitudes and phases of particular harmonics. If we assume that one of the signals is current and the other is voltage, some calculations can be done. The results of the calculations are presented in window 3 –Wyniki, where RMS values of current and vol-tage as well as powers: apparent (S), active (P), reactive (Q) and distortion (T) and Power Fac-tor are displayed. Calculations are done accor-ding to following formulas:From definition of real power of fundamental harmonic, the real power of n harmonic can be expressed by:
nnnn cosIUP (1)
and the total active power as a sum of individu-al harmonic products of voltage and current n:
50
0 0 01 1
k
i u n n n n n nn n
P A A U I cos P U I cos
(2)
where: Un, In – RMS voltage and current har-monics, A0i, A0u – voltage and current constant component.For a given cosn the value of sinn can be calculated as well as the reactive powers for harmonics n:
nnnn sinIUQ (3)
and the total reactive power as a sum of indi-vidual harmonic products of voltage and current n:
50
1n n n
n
U I sinQ
(4)
Modulus apparent power as indicated in [6] is described as:
150 502 2 2
0 0
( )n nn n
S U I U I
(5)
and apparent power is described as: 2 2 2S P Q (6)
Powers in equation (5) and (6) are not equal. According to the theory of Budenau the differ-ence between them can be explained by so called power of distortion (T). The relations between the powers can be expressed by:
22 2QS P T (7)
As stated in [6] the above formula is controver-sial. Thus, in the paper in LabView applications the real and reactive powers for all harmonics are calculated separately on the basis of the RMS values of current and voltage of particular harmonics, as well as cosn and sin.Power factor can be described as:
50
1n n n
n
U I cosP
PFS U I
(8)
All values are displayed on screen. It is also possible to save the calculation to the txt file. All the calculations are carried out by the sub-programs in LabView and have been showed in separated windows Front Panel.
Fig. 3. Block Diagram Obliczenia.vi
Zeszyty Problemowe – Maszyny Elektryczne Nr 84/2009220
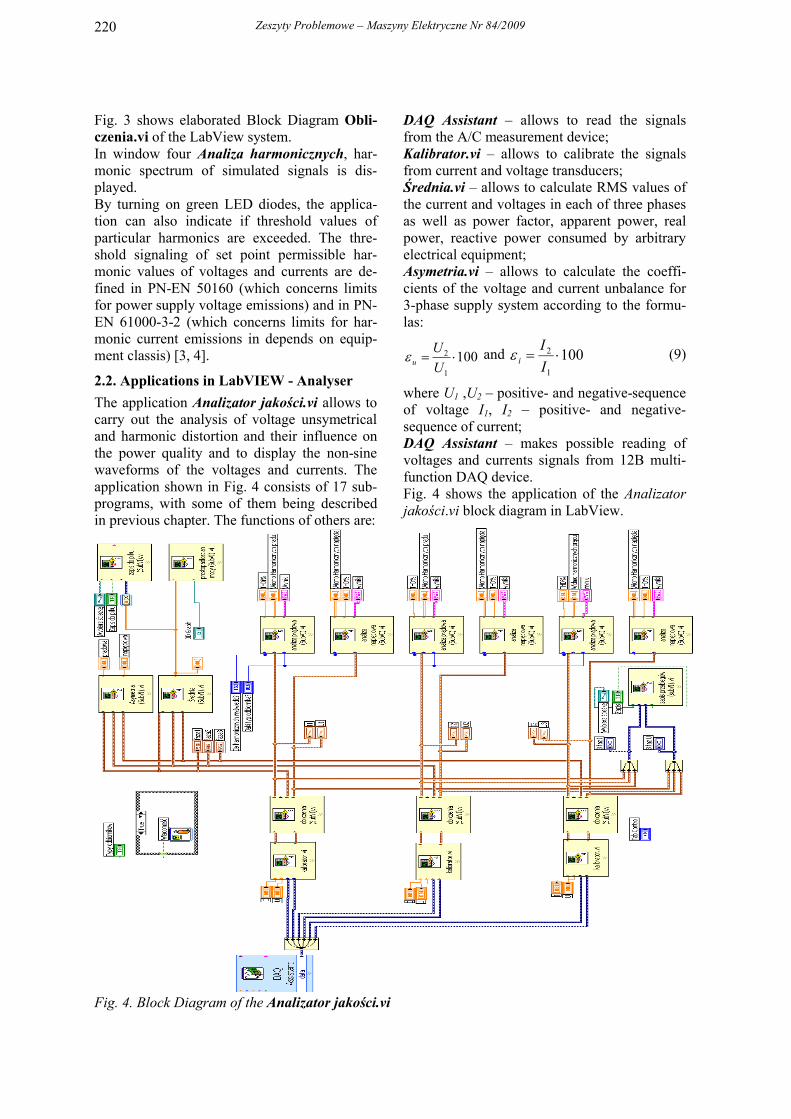
Fig. 3 shows elaborated Block Diagram Obli-czenia.vi of the LabView system.In window four Analiza harmonicznych, har-monic spectrum of simulated signals is dis-played. By turning on green LED diodes, the applica-tion can also indicate if threshold values of particular harmonics are exceeded. The thre-shold signaling of set point permissible har-monic values of voltages and currents are de-fined in PN-EN 50160 (which concerns limits for power supply voltage emissions) and in PN-EN 61000-3-2 (which concerns limits for har-monic current emissions in depends on equip-ment classis) [3, 4].
2.2. Applications in LabVIEW - Analyser
The application Analizator jakości.vi allows to carry out the analysis of voltage unsymetrical and harmonic distortion and their influence on the power quality and to display the non-sine waveforms of the voltages and currents. The application shown in Fig. 4 consists of 17 sub-programs, with some of them being described in previous chapter. The functions of others are:
DAQ Assistant – allows to read the signals from the A/C measurement device;Kalibrator.vi – allows to calibrate the signals from current and voltage transducers;Średnia.vi – allows to calculate RMS values of the current and voltages in each of three phases as well as power factor, apparent power, real power, reactive power consumed by arbitrary electrical equipment;Asymetria.vi – allows to calculate the coeffi-cients of the voltage and current unbalance for 3-phase supply system according to the formu-las:
1001
2 U
Uu and 100
1
2 I
Ii (9)
where U1 ,U2 – positive- and negative-sequence of voltage I1, I2 – positive- and negative-sequence of current;DAQ Assistant – makes possible reading of voltages and currents signals from 12B multi-function DAQ device.Fig. 4 shows the application of the Analizator jakości.vi block diagram in LabView.
Fig. 4. Block Diagram of the Analizator jakości.vi
Zeszyty Problemowe – Maszyny Elektryczne Nr 84/2009 221
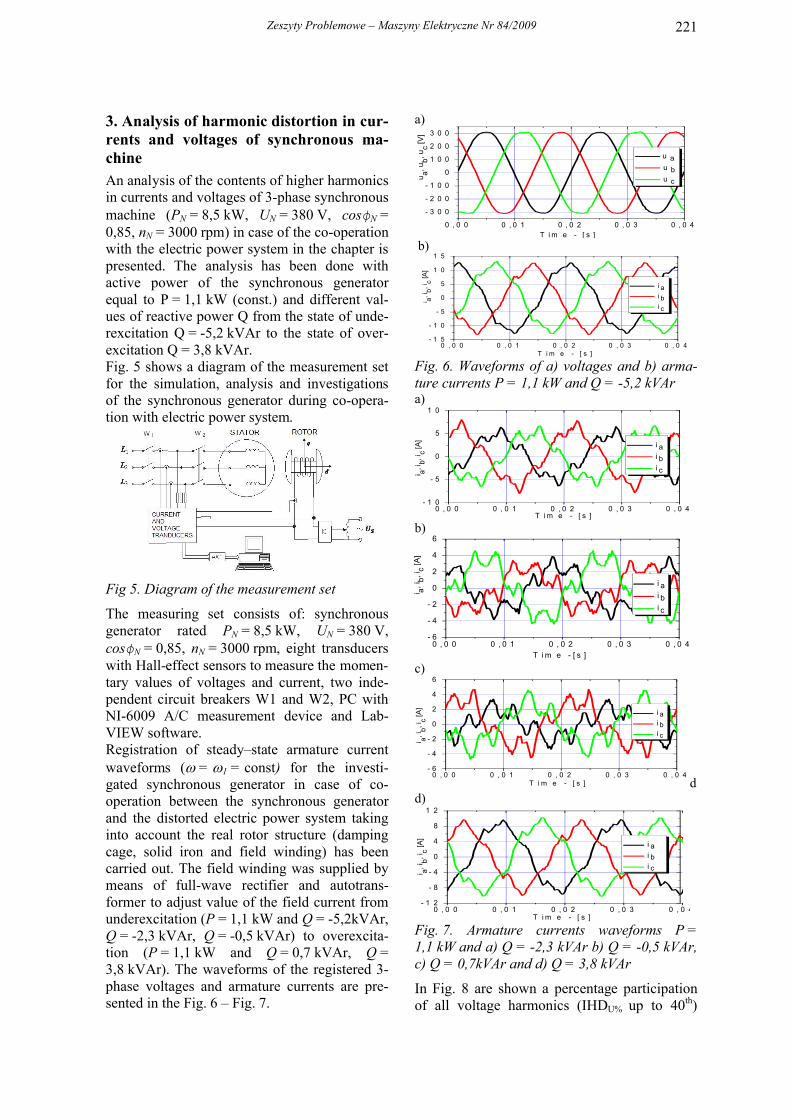
3. Analysis of harmonic distortion in cur-rents and voltages of synchronous ma-chine An analysis of the contents of higher harmonics in currents and voltages of 3-phase synchronous machine (PN = 8,5 kW, UN = 380 V, cosϕN = 0,85, nN = 3000 rpm) in case of the co-operationwith the electric power system in the chapter is presented. The analysis has been done with active power of the synchronous generator equal to P = 1,1 kW (const.) and different val-ues of reactive power Q from the state of unde-rexcitation Q = -5,2 kVAr to the state of over-excitation Q = 3,8 kVAr. Fig. 5 shows a diagram of the measurement setfor the simulation, analysis and investigations of the synchronous generator during co-opera-tion with electric power system.
Fig 5. Diagram of the measurement set
The measuring set consists of: synchronous generator rated PN = 8,5 kW, UN = 380 V, cosϕN = 0,85, nN = 3000 rpm, eight transducers with Hall-effect sensors to measure the momen-tary values of voltages and current, two inde-pendent circuit breakers W1 and W2, PC with NI-6009 A/C measurement device and Lab-VIEW software.Registration of steady–state armature current waveforms ( = 1 = const) for the investi-gated synchronous generator in case of co-operation between the synchronous generator and the distorted electric power system taking into account the real rotor structure (damping cage, solid iron and field winding) has been carried out. The field winding was supplied by means of full-wave rectifier and autotrans-former to adjust value of the field current from underexcitation (P = 1,1 kW and Q = -5,2kVAr, Q = -2,3 kVAr, Q = -0,5 kVAr) to overexcita-tion (P = 1,1 kW and Q = 0,7 kVAr, Q =3,8 kVAr). The waveforms of the registered 3-phase voltages and armature currents are pre-sented in the Fig. 6 – Fig. 7.
a)
0 , 0 0 0 , 0 1 0 , 0 2 0 , 0 3 0 , 0 4
- 3 0 0
- 2 0 0
- 1 0 0
0
1 0 0
2 0 0
3 0 0
ua, u
b, u
c [V
]
u a u b u c
T i m e - [ s ]
b)
0 , 0 0 0 , 0 1 0 , 0 2 0 , 0 3 0 , 0 4- 1 5
- 1 0
- 5
0
5
1 0
1 5
i a, ib
, ic [A
]
i a i b i c
T i m e - [ s ]
Fig. 6. Waveforms of a) voltages and b) arma-ture currents P = 1,1 kW and Q = -5,2 kVAra)
0 , 0 0 0 , 0 1 0 , 0 2 0 , 0 3 0 , 0 4- 1 0
- 5
0
5
1 0i a
, ib
, ic [A
]
T i m e - [ s ]
i a i b i c
b)
0 , 0 0 0 , 0 1 0 , 0 2 0 , 0 3 0 , 0 4- 6
- 4
- 2
0
2
4
6
i a,
i b, i c [
A]
i ai bi c
T i m e - [ s ]
c)
0 , 0 0 0 , 0 1 0 , 0 2 0 , 0 3 0 , 0 4- 6
- 4
- 2
0
2
4
6
i a i b i c
i a, i
b, i
c [A]
T i m e - [ s ] dd)
0 , 0 0 0 , 0 1 0 , 0 2 0 , 0 3 0 , 0 4- 1 2
- 8
- 4
0
4
8
1 2
i a i b i c
i a, i
b, i
c [A]
T i m e - [ s ]
Fig. 7. Armature currents waveforms P = 1,1 kW and a) Q = -2,3 kVAr b) Q = -0,5 kVAr,c) Q = 0,7kVAr and d) Q = 3,8 kVAr
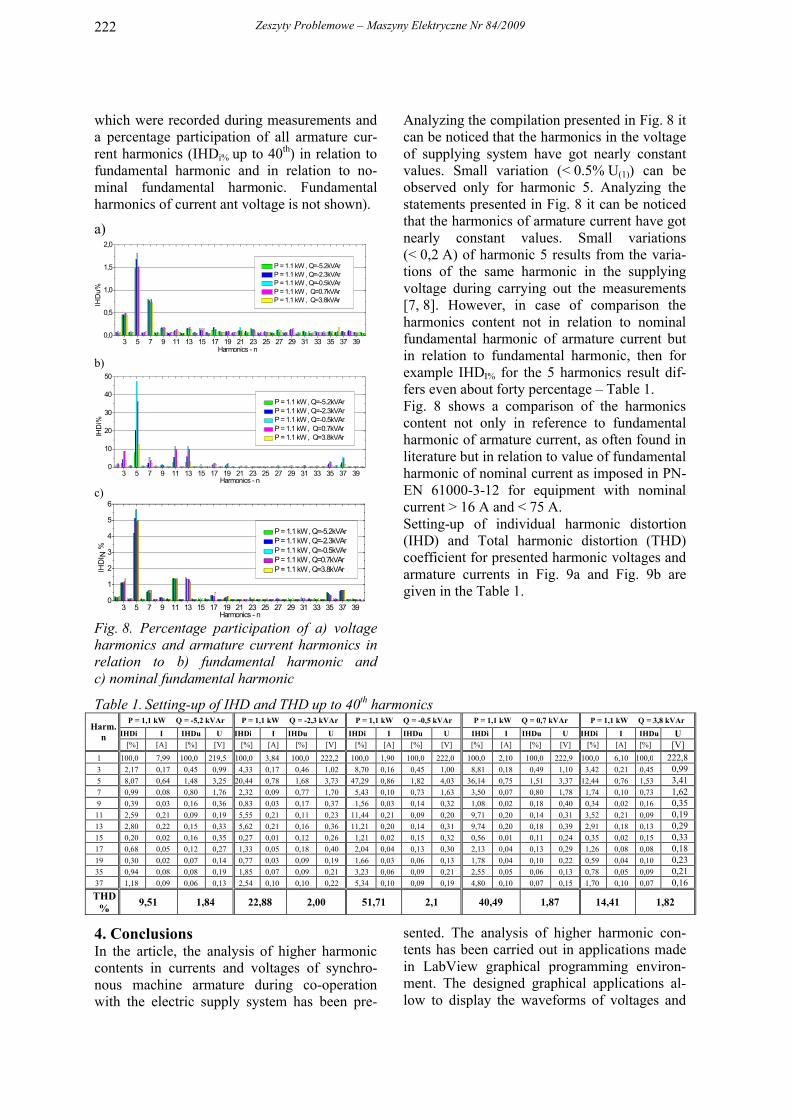
In Fig. 8 are shown a percentage participationof all voltage harmonics (IHDU% up to 40th)
Zeszyty Problemowe – Maszyny Elektryczne Nr 84/2009222
which were recorded during measurements anda percentage participation of all armature cur-rent harmonics (IHDi% up to 40th) in relation to fundamental harmonic and in relation to no-minal fundamental harmonic. Fundamental harmonics of current ant voltage is not shown).
a)
3 5 7 9 11 13 15 17 19 21 23 25 27 29 31 33 35 37 390,0
0,5
1,0
1,5
2,0
IHD
u%
Harmonics - n
P = 1.1 kW , Q=-5.2kVAr P = 1.1 kW , Q=-2.3kVAr P = 1.1 kW , Q=-0.5kVAr P = 1.1 kW , Q=0.7kVAr P = 1.1 kW , Q=3.8kVAr
b)
3 5 7 9 11 13 15 17 19 21 23 25 27 29 31 33 35 37 390
10
20
30
40
50
IHD
i%
Harmonics - n
P = 1.1 kW , Q=-5.2kVArP = 1.1 kW , Q=-2.3kVArP = 1.1 kW , Q=-0.5kVArP = 1.1 kW , Q=0.7kVArP = 1.1 kW , Q=3.8kVAr
c)
3 5 7 9 11 13 15 17 19 21 23 25 27 29 31 33 35 37 390
1
2
3
4
5
6
P = 1.1 kW , Q=-5.2kVArP = 1.1 kW , Q=-2.3kVAr P = 1.1 kW , Q=-0.5kVArP = 1.1 kW , Q=0.7kVArP = 1.1 kW , Q=3.8kVArIH
DI N
%
Harmonics - n
Fig. 8. Percentage participation of a) voltage harmonics and armature current harmonics in relation to b) fundamental harmonic and c) nominal fundamental harmonic
Analyzing the compilation presented in Fig. 8 it can be noticed that the harmonics in the voltage of supplying system have got nearly constant values. Small variation (< 0.5% U(1)) can be observed only for harmonic 5. Analyzing the statements presented in Fig. 8 it can be noticed that the harmonics of armature current have got nearly constant values. Small variations (< 0,2 A) of harmonic 5 results from the varia-tions of the same harmonic in the supplying voltage during carrying out the measurements[7, 8]. However, in case of comparison the harmonics content not in relation to nominal fundamental harmonic of armature current but in relation to fundamental harmonic, then for example IHDI% for the 5 harmonics result dif-fers even about forty percentage – Table 1.Fig. 8 shows a comparison of the harmonics content not only in reference to fundamental harmonic of armature current, as often found in literature but in relation to value of fundamental harmonic of nominal current as imposed in PN-EN 61000-3-12 for equipment with nominal current > 16 A and < 75 A.Setting-up of individual harmonic distortion (IHD) and Total harmonic distortion (THD) coefficient for presented harmonic voltages and armature currents in Fig. 9a and Fig. 9b are given in the Table 1.
Table 1. Setting-up of IHD and THD up to 40th harmonics
Harm.n
P = 1,1 kW Q = -5,2 kVAr P = 1,1 kW Q = -2,3 kVAr P = 1,1 kW Q = -0,5 kVAr P = 1,1 kW Q = 0,7 kVAr P = 1,1 kW Q = 3,8 kVAr
IHDi I IHDu U IHDi I IHDu U IHDi I IHDu U IHDi I IHDu U IHDi I IHDu U[%] [A] [%] [V] [%] [A] [%] [V] [%] [A] [%] [V] [%] [A] [%] [V] [%] [A] [%] [V]
1 100,0 7,99 100,0 219,5 100,0 3,84 100,0 222,2 100,0 1,90 100,0 222,0 100,0 2,10 100,0 222,9 100,0 6,10 100,0 222,83 2,17 0,17 0,45 0,99 4,33 0,17 0,46 1,02 8,70 0,16 0,45 1,00 8,81 0,18 0,49 1,10 3,42 0,21 0,45 0,995 8,07 0,64 1,48 3,25 20,44 0,78 1,68 3,73 47,29 0,86 1,82 4,03 36,14 0,75 1,51 3,37 12,44 0,76 1,53 3,417 0,99 0,08 0,80 1,76 2,32 0,09 0,77 1,70 5,43 0,10 0,73 1,63 3,50 0,07 0,80 1,78 1,74 0,10 0,73 1,629 0,39 0,03 0,16 0,36 0,83 0,03 0,17 0,37 1,56 0,03 0,14 0,32 1,08 0,02 0,18 0,40 0,34 0,02 0,16 0,3511 2,59 0,21 0,09 0,19 5,55 0,21 0,11 0,23 11,44 0,21 0,09 0,20 9,71 0,20 0,14 0,31 3,52 0,21 0,09 0,1913 2,80 0,22 0,15 0,33 5,62 0,21 0,16 0,36 11,21 0,20 0,14 0,31 9,74 0,20 0,18 0,39 2,91 0,18 0,13 0,2915 0,20 0,02 0,16 0,35 0,27 0,01 0,12 0,26 1,21 0,02 0,15 0,32 0,56 0,01 0,11 0,24 0,35 0,02 0,15 0,3317 0,68 0,05 0,12 0,27 1,33 0,05 0,18 0,40 2,04 0,04 0,13 0,30 2,13 0,04 0,13 0,29 1,26 0,08 0,08 0,1819 0,30 0,02 0,07 0,14 0,77 0,03 0,09 0,19 1,66 0,03 0,06 0,13 1,78 0,04 0,10 0,22 0,59 0,04 0,10 0,2335 0,94 0,08 0,08 0,19 1,85 0,07 0,09 0,21 3,23 0,06 0,09 0,21 2,55 0,05 0,06 0,13 0,78 0,05 0,09 0,2137 1,18 0,09 0,06 0,13 2,54 0,10 0,10 0,22 5,34 0,10 0,09 0,19 4,80 0,10 0,07 0,15 1,70 0,10 0,07 0,16
THD%
9,51 1,84 22,88 2,00 51,71 2,1 40,49 1,87 14,41 1,82
4. ConclusionsIn the article, the analysis of higher harmonic contents in currents and voltages of synchro-nous machine armature during co-operationwith the electric supply system has been pre-
sented. The analysis of higher harmonic con-tents has been carried out in applications made in LabView graphical programming environ-ment. The designed graphical applications al-low to display the waveforms of voltages and

Zeszyty Problemowe – Maszyny Elektryczne Nr 84/2009 223
currents taken by arbitrary electrical equipment.Additionally, the applications can carry out calculations of RMS values of Apparent Power (S), Real Power (P), Reactive Power (Q), Power of Distortion (D) as well as Power Fac-tor and coefficients THD, PHD, IHD, and volt-age unbalance. Application Analizator ja-kości.vi allows also to carry out an analysis of previously recorded waveforms of current and voltages. Analysing the harmonic spectrum of armature currents in synchronous machine dur-ing co-operation with supply system, it can be noticed that the content of harmonics 3, 5 and 7 is the most significant. So called slot harmon-ics, in our case No 11, 13 and 35, 37, come from the design of the machine itself, which has got 12 aluminium bars (squirrel-cage) in the rotor and 36 slots in the stator. The synchronous generator meets specified requirements in the standard PN-EN 61000-3-2 regarding harmonic distortion. This norm, depending on the equipment characteristic, determines the limits for particular harmonics. However, it is not clearly stated to what value, RMS of fundamental harmonic of current or RMS of nominal fundamental harmonic current of the machine (as determined in PN-EN 61000-3-12) for particular harmonics should be referenced. In case of individual co-operation of the electrical machine with electrical power system commonly used THDI% and IHDI% coef-ficients do not give unequivocal answer to the content of higher harmonics in the armaturecurrents. The analysis of the individual work of synchronous machine during co-operation with power system proved that THDI% and IHDI%
coefficients have different values depending on how the machine is loaded (Fig. 6 – Fig. 7 and Table 1). RMS values of the voltage harmonics basically almost do not change. If synchronous generator is loaded with P = 1,1 kW and Q = -5,2 kVAr (reactive power taken from the sys-tem) the THDi% coefficient is equaled to 9,5%. If generator is loaded with P = 1,1 kW and Q = -0,5 kVAr the THDi% is equaled to 51,7%.However, RMS values of the current harmonics remained at similar level in the whole range and small changes came from the fact of harmonic variations in the supplying voltage [6, 7]. Simi-lar variations of THDI% and IHDI% coefficients could be noticed when the synchronous ma-chine have been in the state of overexcitation. Comparison of individual contents of harmo-
nics in armature currents registered in mea-surement set and in relation to nominal funda-mental component are presented in Fig. 8.Comparison of harmonic contents in armature currents unambiguously results, that in case of individual co-operation electric machine with electric power system in wide range of load variations more reliable information about THD and individual harmonic contents is in relation to nominal fundamental component then to fundamental component.
5. Bibliography[1] Z. Ko walski : The Quality of Electrical Energy. Monograph. Technical University of Lodz, Łódź 2007, Poland (in Polish)[2] A. S i ed la rz: Analysis and visualization of influ-ence unsymmetrical and distortion of power supply system voltages and currents on the quality of electrical energy in LabView. Master’s thesis. Kielce University of Technolo-gy. Kielce 2008, Poland (in Polish)[3] PN-EN 50160: Voltage characteristics of electricity supplied by public distribution systems. PKN, Warszawa 2008, Poland (in Polish)[4] PN-EN 61000-3-2: Electromagnetic compatibility (EMC) Part 3-2: Limits - Limits for harmonic current emmissions (equipment input current ≤16A per phase)PKN, Warszawa 2007, Poland (in Polish)[5] PN - EN 61000-3-12: Electromagnetic compatibility (EMC) Part 3-12: Limits - Limits for harmonic current produced by equipment connected to public low-voltage systems with input current >16A and ≤75A per phase. PKN, Warszawa 2005, Poland (in Polish)[6] Czarnecki L. S . : Moc bierna i deformacji we-dług definicji Budenau i przyczyny bezużyteczności tych wielkości w elektrotechnice. ZNPŚl, Elektryka 107, Gli-wice 1989, pp. 41-51[7] S. Wiak, R. Nadolski , K. Lud winek, J . S t aszak: Influence of the Synchronous Cylindrical Machine Damping Cage on Content of Higher Harmonics in Armature Currents During Co-Operation with the Distorted and Asymmetrical Electric Power System Com-puter Engineering in Applied Electromagnetism, IOS Press, 2006, pp. 520-527[8] K. Lud winek: Nonsinusoidal and unsymmetrical influence of electric power system on armature currents waveforms in synchronous machine, Zeszyty Naukowe Politechniki Świętokrzyskiej – Elektryka 42, Kielce 2005, pp. 251-266, Poland (in Polish)
AuthorsDSc. Krzysztof Ludwinek, e–mail: [email protected] University of Technology, Al. Tysiąclecia PP. 7, 25–314 Kielce, Poland, MSc. Arkadiusz Siedlarz, e–mail: [email protected] Automotive Poland Sp. z o.o.ul. Portowa 24, 27-600 Sandomierz, Poland


![ŻywillaFechner InstytutMatematykiUniwersytetuŚląskiego ... · Strona 19 |21.05.2017 Żywilla Fechner Literatura Literatura [1]W.R.BloomandH.Heyer,Harmonic analysis of probability](https://static.fdocuments.pl/doc/165x107/5f043bc27e708231d40cf801/ywillafechner-instytutmatematykiuniwersytetulskiego-strona-19-21052017.jpg)