
Eduardo da Motta e Albuquerque(*) - CEDEPLAR 280.pdf · Eduardo da Motta e Albuquerque Leandro...
34
TEXTO PARA DISCUSSÃO N° 280 INTERACTIONS BETWEEN FIRMS AND UNIVERSITIES IN AN IMMATURE SYSTEM OF INNOVATION: a survey of industrial R&D-performers firms in Minas Gerais, Brazil(&) Eduardo da Motta e Albuquerque Leandro Alves Silva Márcia Siqueira Rapini Sara Gonçalves Antunes de Souza Dezembro de 2005
Transcript of Eduardo da Motta e Albuquerque(*) - CEDEPLAR 280.pdf · Eduardo da Motta e Albuquerque Leandro...
TEXTO PARA DISCUSSÃO N° 280
INTERACTIONS BETWEEN FIRMS AND UNIVERSITIES IN AN IMMATURE SYSTEM OF INNOVATION:
a survey of industrial R&D-performers firms in Minas Gerais, Brazil(&)
Eduardo da Motta e Albuquerque Leandro Alves Silva
Márcia Siqueira Rapini Sara Gonçalves Antunes de Souza
Dezembro de 2005
Ficha catalográfica
338.45:62(815.1) A345i 2005
Albuquerque, Eduardo da Motta e. Interactions between firms and universities in an
immature system of innovation: a survey of industrial R&D-performers firms in Minas Gerais, Brazil / Eduardo da Motta e Albuquerque; Leandro Alves Silva; Márcia Siqueira Rapini; Sara Gonçalves Antunes de Souza - Belo Horizonte: UFMG/Cedeplar, 2005. -
p. (Texto para discussão ; 280) 1. Minas Gerais – Indústrias – Inovações
tecnológicas. 2. Pesquisa e desenvolvimento - Minas Gerais. 3. Cooperação universitária - Minas Gerais. I. Silva, Leandro Alves. II. Rapini, Márcia Siqueira. III. Souza, Sara Gonçalves Antunes de. IV. Universidade Federal de Minas Gerais. Centro de Desenvolvimento e Planejamento Regional. V. Título. VI. Série.
CDU
2

UNIVERSIDADE FEDERAL DE MINAS GERAIS FACULDADE DE CIÊNCIAS ECONÔMICAS
CENTRO DE DESENVOLVIMENTO E PLANEJAMENTO REGIONAL
INTERACTIONS BETWEEN FIRMS AND UNIVERSITIES IN AN IMMATURE SYSTEM OF INNOVATION:
a survey of industrial R&D-performers firms in Minas Gerais, Brazil*
Eduardo da Motta e Albuquerque Cedeplar-UFMG, Belo Horizonte, Minas Gerais, Brazil
Leandro Alves Silva Cedeplar-UFMG, Belo Horizonte, Minas Gerais, Brazil
Márcia Siqueira Rapini IEL-FIEMG, Belo Horizonte, Minas Gerais, Brazil
Sara Gonçalves Antunes de Souza
Unimontes, Montes Claros, Minas Gerais, Brazil [email protected]
CEDEPLAR/FACE/UFMG BELO HORIZONTE
2005
* The authors thank Richard Nelson for kindly providing the original questionnaires of the Yale Survey and of the Carnegie
Mellon Survey, and for enlightening discussions and comments on theoretical and methodological qualifications necessary for the adaptation of these questionnaires to a LDC like Brazil. The authors also thank Alvin Klevorick and Wesley Cohen for allowing the access to the original questionnaires of those pioneering Surveys. Carolina Vargas, Danielle Vieira, Patricia Silva, Wellington Cruz e Luigi Calvette are the research team that screened MG firms and interviewed the R&D performer firms. Research assistance from Elaine Rodrigues, Raquel Guimarães and Thaís Henriques is acknowledged. Discussions of various versions of the questionnaire with Fabiana Santos, Heloísa Menezes, Christian Souza and Mauro Borges Lemos have contributed to shape its final format. Mariana Rebouças and her team at the IBGE have provided a worthwhile help preparing original tables using data from PINTEC 2003. Financial support from CNPq, FAPEMIG and BHTEC-UFMG is acknowledged. This research has benefited from the strategic logistic support of IEL-FIEMG. The usual remainder holds.
3

SUMÁRIO INTRODUCTION................................................................................................................................... 6 I. BACKGROUND ................................................................................................................................. 6 II. DATA ON UNIVERSITIES, R&D AND INNOVATION IN BRAZIL AND IN MINAS GERAIS 8 III. DESIGNING AND IMPLEMENTING THE SURVEY................................................................. 15
III.1. Redesigning the Questionnaire ................................................................................................ 15 III.2. Defining and Uncovering the Survey’s Universe .................................................................... 15
IV. RESULTS ....................................................................................................................................... 18
IV.1. Universities and Other Sources of Knowledge in Industrial R&D.......................................... 18 IV.2. Comparing Universities and Industries as Sources of Knowledge .......................................... 22 IV.3. Fields of Public Research and Industrial R&D........................................................................ 23 IV.4. Pathways of Knowledge Flow ................................................................................................. 26 IV.5. NATURE OF CAPITAL AND FORMAL R&D INFLUENCE ON THE RESULTS ........... 29
V. PRELIMINARY CONCLUSIONS AND FURTHER RESEARCH ............................................... 30 REFERENCES...................................................................................................................................... 32 APPENDIX ........................................................................................................................................... 34
4

ABSTRACT
This paper presents preliminary results from a survey of R&D-performer industrial firms located in the state of Minas Gerais, Brazil.1 The inspiration for this research comes from the Yale Survey (Klevorick et all, 1995) and from the Carnegie Mellon Survey (Cohen et all, 2002), for these Surveys are groundwork for the study of interactions between universities and firms.
The objective of this Minas Gerais Survey (MG Survey, henceforth) is the investigation of specific characteristics of the interaction between universities and firms in an “immature national system of innovation”.
The first section summarizes the theoretical questions putted forward by this investigation, specially the role of universities in immature NSIs. The second section investigates the Brazilian NSI using data from the IBGE’s PINTEC, focusing the R&D performer firms in Brazil and the importance of universities and public research institutes as source of knowledge for industrial innovation. This second section presents data that highlight the position of Minas Gerais in the Brazilian NSI and helps to define the MG Survey research universe. The third section summarizes the issues involved in the adaptation of the Yale and the Carnegie Mellon questionnaires to the Brazilian reality and in the identification of the R&D-performer firms in Minas Gerais. The fourth section presents the MG Survey results. The fifth section concludes the paper. Keywords: Systems of innovations, Interactions between science and technologies JEL Classification: H50; O00; O30
1 A South-Eastern state, Minas Gerais has 17.9 million inhabitants and a GDP of US$ 59.6 billion (the 3rd state GDP in
Brazil). See Map I in the Appendix.
5
INTRODUCTION
This paper presents preliminary results from a survey of R&D-performer industrial firms located in the state of Minas Gerais, Brazil.2 The inspiration for this research comes from the Yale Survey (Klevorick et all, 1995) and from the Carnegie Mellon Survey (Cohen et all, 2002), for these Surveys are groundwork for the study of interactions between universities and firms.
The objective of this Minas Gerais Survey (MG Survey, henceforth) is the investigation of specific characteristics of the interaction between universities and firms in an “immature national system of innovation”.
The survey’s design and the definition of the firms that compose the research universe were important challenges and the research team learned a lot: important theoretical, methodological and empirical questions were presented to the research team, as the research unfolded. For example, the very first phrase of the Carnegie Mellon questionnaire was not well suited for a reality as the Brazilian: the questionnaires could not only be answered by R&D executives, given the possibility of existence of firms with R&D investments but without any formal department of R&D (as section IV shows).
The process of elaboration of the MG Survey is described in the following four sections. The first section summarizes the theoretical questions putted forward by this investigation, specially the role of universities in immature NSIs. The second section investigates the Brazilian NSI using data from the IBGE’s PINTEC, focusing the R&D performer firms in Brazil and the importance of universities and public research institutes as source of knowledge for industrial innovation. This second section presents data that highlight the position of Minas Gerais in the Brazilian NSI and helps to define the MG Survey research universe. The third section summarizes the issues involved in the adaptation of the Yale and the Carnegie Mellon questionnaires to the Brazilian reality and in the identification of the R&D-performer firms in Minas Gerais. The fourth section presents the MG Survey results. The fifth section concludes the paper and suggests lines for further research. I. BACKGROUND3
The hypothesis of this paper suggests that the interactions between science and technology are
important since the beginning of development process. These interactions, however, have different features vis-à-vis already developed countries. To introduce the discussion on the specific and peculiar nature of this interaction, this paper investigates, in first place, the specific role for science in less developed countries: important qualifications of the role of science at the periphery are starting points for this paper’s arguments.
2 A South-Eastern state, Minas Gerais has 17.9 million inhabitants and a GDP of US$ 59.6 billion (the 3rd state GDP in
Brazil). See Map I in the Appendix. 3 This sections draws on previous work (Bernardes et all, 2003). In a new version of this work-in-progress paper, this section
will be reorganized to focus in the role of universities in immature NSIs and in the existence of “!partial connections” between science and technology in immature NSIs. These “partial connections” are the subject of investigation of this MG Survey.
6
The literature on economics of technology has deeply criticized views that underplay the efforts necessary for technological imitation. Silverberg (1990, p. 179) shows how imitation and diffusion of technologies must be seen as a continuation of the innovative process. What are the implications of this finding for development? Initial stages of the development process depend heavily on imitation. As imitation is a continuation of the innovative process, it is necessary creativity to copy technologies developed abroad. Cimoli & Dosi (1995, pp. 258-259) point that the combination between acquisition of technology and learning, and the sequence that runs from copy to creativity are two sides of the same process.
This effort to imitate depends on internal capabilities: initial stages of development and catching up process depend on “absorptive capability”. Again, the literature on economics of technology shows important lessons: Cohen & Levinthal (1989) have pointed out the dual role of R&D for firms: innovation and learning. Rosenberg (1991) has described why firms invest in basic research: to monitor knowledge developed elsewhere. Mowery & Rosenberg (1989) have indicated the role of basic research as an “entry ticket” for a network of technological and scientific information. In sum: to imitate, to absorb knowledge from more advanced countries, internal capabilities are necessary. And a certain level of scientific capability is a key component of this absorptive capability.
During the initial phases of development, scientific institutions are necessary mainly for the learning side of the innovative process. The necessity of scientific institutions to support learning processes and diffusion of technologies is greater now, because the later technological paradigms are more science-based than the earlier ones (Dosi, 1988, p. 1136), and current technology depends more heavily on science (OECD, 2002, p. 16). As a country develops, the mix between the learning and innovation faces of the R&D process changes.
Bell & Pavitt (1993) have compared the successful development of latecomers in the XIXth Century (US textile industry) and present day conditions. Today there is a gap between productive and technological capability: it is not anymore automatic the transition between productive capability and technological capability, given the knowledge requirements for technological creation and change (p. 198). This gap points the increased knowledge requirements for contemporary catching up process.
Beyond their key role as supporting the absorptive capability, the scientific institutions have other important contributions for development.
First, it acts as a "focusing device" in this process. Science at periphery is important to function as an “antenna” for the creation of links with international sources of technology. As a “focusing device”, scientific institutions could spot avenues of technological development that are feasible to backward countries, given national and international conditions. This means that scientific information is necessary even to advise in which industrial sectors entry is not feasible. This is very important for less-developed countries: “blind search” could be wasteful. Therefore, the scientific institutions provide "knowledge to focus search" (Nelson, 1982).
Second, the national scientific capability is a major support for industrial development, providing the knowledge necessary for the entry in key industries for the process of development. As Perez & Soete (1988) put forward, scientific knowledge provided by the public infrastructure reduces the entry costs in key sectors.
7

Third, there are other more intricate links between knowledge and growth, like a causal relationship chain between improvements in the scientific dimension and consequent improvements in health, which by its turn, leads to more economic growth. This might be an indirect link between science and growth: and one that would not be reached without internal investment in science health-related disciplines, given the broad global mismatch between health needs and research agenda (UNDP, 2001, p. 110).
Fourth, another causal link might run between science and agricultural improvements. Technologies for agriculture have “ecological specificity”, given specific conditions such as irrigation, characteristics of the land, resistance of crops to insects etc. Therefore, national investments in less developed countries are necessary, because these technologies “cannot be transferred from one zone to another merely through tinkering” (UNDP, 2001, p. 96).
Fifth, given the current global divide in technology, major innovations come from countries that are high-income, temperate, countries that have completed their demographic transition and have an epidemiological structure biased towards chronic diseases etc. Assuming that imitation is the initial form of local innovation, it is unavoidable a huge effort to adapt technologies to a new environment (in terms of income, weather, demography and epidemiology). This effort, in an age of increasingly science-based technologies, has an unavoidable scientific content. And national institutions (highly connected with international networks and communities) might provide this scientific content. Therefore, allocation of resources for scientific development is necessary since the beginning. The Human Development Report 2001 presents examples from countries like Thailand, Cuba, Brazil, and India in this regard (UNDP, 2001, p. 98).
In sum, this section presents arguments for the role of science since the beginning of development processes. These arguments support the necessity of investments in scientific institutions before the catching up process. II. DATA ON UNIVERSITIES, R&D AND INNOVATION IN BRAZIL AND IN MINAS
GERAIS This section presents a snapshot of the Brazilian NSI, using PINTEC data for 2003 (IBGE, 2005). Data for Tables I, II and Figure I were kindly prepared under request by the IBGE. These data cross the PINTEC questions related to firms’ innovative activities and R&D investments with questions regarding the importance of universities and research institutes as source of information.4
Table I summarizes a general picture of Brazilian industrial firms (and their subsets of innovative firms and R&D-performer firms), presenting its distribution throughout Brazilian states. Table I also introduces the MG Survey’s universe.
4 Questions number 31 and 32 inform firm investments in R&D (intramural and/or extramural), and question 115 informs the
importance of universities and research institutes to innovative activities.
8
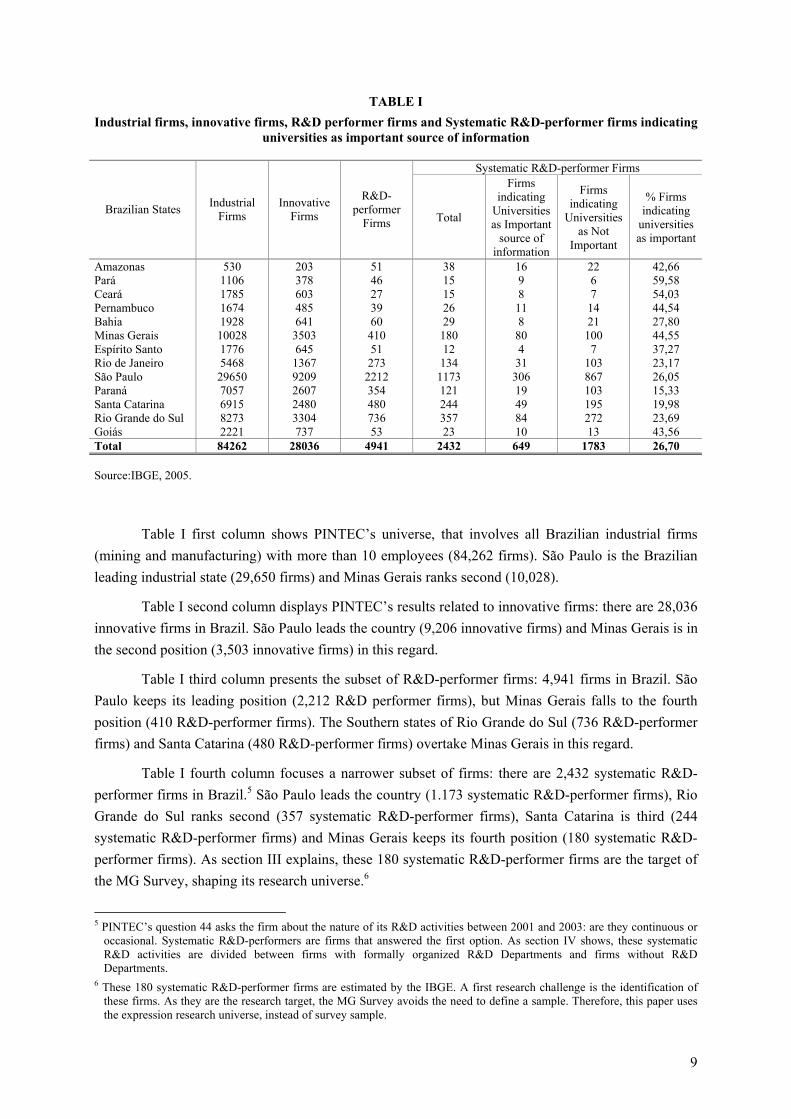
TABLE I Industrial firms, innovative firms, R&D performer firms and Systematic R&D-performer firms indicating
universities as important source of information
Systematic R&D-performer Firms
Brazilian States Industrial Firms
Innovative Firms
R&D-performer
Firms Total
Firms indicating
Universities as Important
source of information
Firms indicating
Universities as Not
Important
% Firms indicating
universities as important
Amazonas 530 203 51 38 16 22 42,66 Pará 1106 378 46 15 9 6 59,58 Ceará 1785 603 27 15 8 7 54,03 Pernambuco 1674 485 39 26 11 14 44,54 Bahia 1928 641 60 29 8 21 27,80 Minas Gerais 10028 3503 410 180 80 100 44,55 Espírito Santo 1776 645 51 12 4 7 37,27 Rio de Janeiro 5468 1367 273 134 31 103 23,17 São Paulo 29650 9209 2212 1173 306 867 26,05 Paraná 7057 2607 354 121 19 103 15,33 Santa Catarina 6915 2480 480 244 49 195 19,98 Rio Grande do Sul 8273 3304 736 357 84 272 23,69 Goiás 2221 737 53 23 10 13 43,56 Total 84262 28036 4941 2432 649 1783 26,70 Source:IBGE, 2005. Table I first column shows PINTEC’s universe, that involves all Brazilian industrial firms (mining and manufacturing) with more than 10 employees (84,262 firms). São Paulo is the Brazilian leading industrial state (29,650 firms) and Minas Gerais ranks second (10,028).
Table I second column displays PINTEC’s results related to innovative firms: there are 28,036 innovative firms in Brazil. São Paulo leads the country (9,206 innovative firms) and Minas Gerais is in the second position (3,503 innovative firms) in this regard.
Table I third column presents the subset of R&D-performer firms: 4,941 firms in Brazil. São Paulo keeps its leading position (2,212 R&D performer firms), but Minas Gerais falls to the fourth position (410 R&D-performer firms). The Southern states of Rio Grande do Sul (736 R&D-performer firms) and Santa Catarina (480 R&D-performer firms) overtake Minas Gerais in this regard.
Table I fourth column focuses a narrower subset of firms: there are 2,432 systematic R&D-performer firms in Brazil.5 São Paulo leads the country (1.173 systematic R&D-performer firms), Rio Grande do Sul ranks second (357 systematic R&D-performer firms), Santa Catarina is third (244 systematic R&D-performer firms) and Minas Gerais keeps its fourth position (180 systematic R&D-performer firms). As section III explains, these 180 systematic R&D-performer firms are the target of the MG Survey, shaping its research universe.6
5 PINTEC’s question 44 asks the firm about the nature of its R&D activities between 2001 and 2003: are they continuous or
occasional. Systematic R&D-performers are firms that answered the first option. As section IV shows, these systematic R&D activities are divided between firms with formally organized R&D Departments and firms without R&D Departments.
6 These 180 systematic R&D-performer firms are estimated by the IBGE. A first research challenge is the identification of these firms. As they are the research target, the MG Survey avoids the need to define a sample. Therefore, this paper uses the expression research universe, instead of survey sample.
9
Table I fifth and sixth columns focus the subject of this research: the correlation between systematic R&D activities and the importance of universities and research institutes as source of information.7 The conjecture that underlies this subject suggests that firms with systematic R&D indicate that universities are more important source of information vis-à-vis firms with occasional R&D. For Brazil as a whole, 26.70% of firms with systematic R&D indicate universities as important sources of information. This percentage is almost twice the average for occasional R&D-performer firms: only 13.87% of them indicate universities as important source of information.
Figure I investigates whether or not this correlation holds in an inter-sectoral framework. Figure I points to an inter-sectoral inverse relationship between non-R&D performers and importance of universities as source of information.
7 The respondents can choose among four point scales: not important, xx important, moderately important and very
important. “Important” for the IBGE aggregates moderately important and very important. “Not important” the two other options. This four-point scale is compatible with the CM Survey.
10

As the sectoral role of non-R&D performers decreases, the importance of universities as source of information increases, Figure I shows. At the left of the Figure there is the recycling sector (100% of non-R&D performers, zero percent of them indicating universities as important source of information). At the right side, there is the office equipment and computers industry (less than 5% of non-R&D performers and more than 27% of the sector’s firms indicating universities as important source of information).
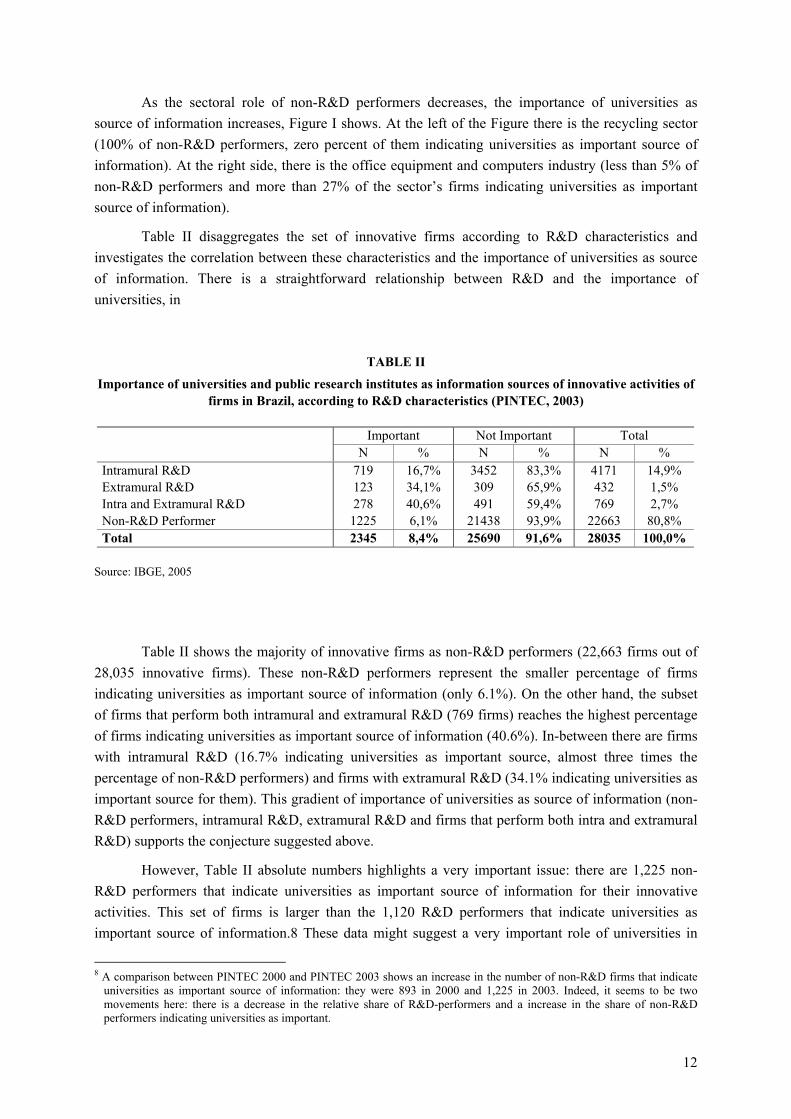
Table II disaggregates the set of innovative firms according to R&D characteristics and investigates the correlation between these characteristics and the importance of universities as source of information. There is a straightforward relationship between R&D and the importance of universities, in
TABLE II
Importance of universities and public research institutes as information sources of innovative activities of firms in Brazil, according to R&D characteristics (PINTEC, 2003)
Important Not Important Total
N % N % N % Intramural R&D 719 16,7% 3452 83,3% 4171 14,9% Extramural R&D 123 34,1% 309 65,9% 432 1,5% Intra and Extramural R&D 278 40,6% 491 59,4% 769 2,7% Non-R&D Performer 1225 6,1% 21438 93,9% 22663 80,8% Total 2345 8,4% 25690 91,6% 28035 100,0%
Source: IBGE, 2005 Table II shows the majority of innovative firms as non-R&D performers (22,663 firms out of 28,035 innovative firms). These non-R&D performers represent the smaller percentage of firms indicating universities as important source of information (only 6.1%). On the other hand, the subset of firms that perform both intramural and extramural R&D (769 firms) reaches the highest percentage of firms indicating universities as important source of information (40.6%). In-between there are firms with intramural R&D (16.7% indicating universities as important source, almost three times the percentage of non-R&D performers) and firms with extramural R&D (34.1% indicating universities as important source for them). This gradient of importance of universities as source of information (non-R&D performers, intramural R&D, extramural R&D and firms that perform both intra and extramural R&D) supports the conjecture suggested above.
However, Table II absolute numbers highlights a very important issue: there are 1,225 non-R&D performers that indicate universities as important source of information for their innovative activities. This set of firms is larger than the 1,120 R&D performers that indicate universities as important source of information.8 These data might suggest a very important role of universities in
8 A comparison between PINTEC 2000 and PINTEC 2003 shows an increase in the number of non-R&D firms that indicate
universities as important source of information: they were 893 in 2000 and 1,225 in 2003. Indeed, it seems to be two movements here: there is a decrease in the relative share of R&D-performers and a increase in the share of non-R&D performers indicating universities as important.
12

immature NSIs: university activities are substitutes for firms R&D. But, these data also present new questions: are these non-R&D firms attaching indicating universities as important moving towards intramural R&D? These data stimulate a specific subject of research: the investigation of the relationship between non-R&D performers and universities.
The data presented in this section provide an initial picture to locate the position of Minas Gerais within the Brazilian NSI. To enrich this picture, Figure II presents data on technological diversification of Brazilian states (using patent data).
13
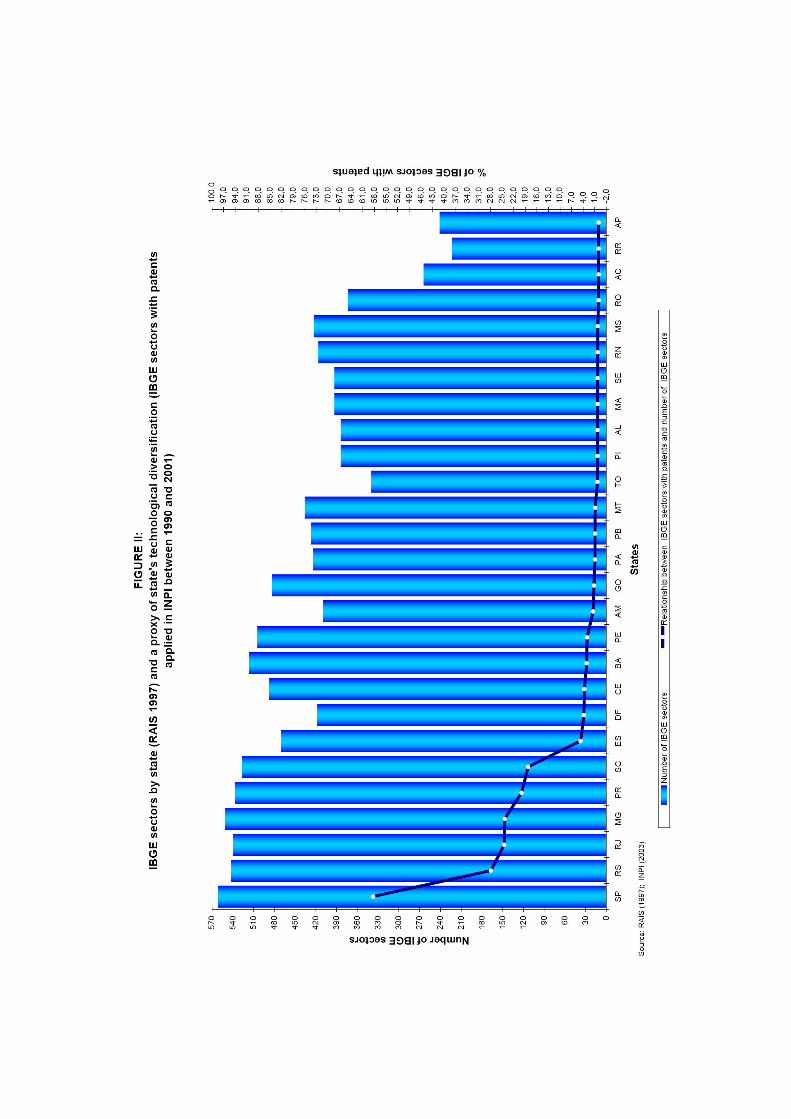
Figure II highlights the leadership of São Paulo (as Tables I shows). Figure II points that Minas Gerais could be located together with Rio Grande do Sul, Paraná, Santa Catarina and Rio de Janeiro as states located at an intermediate level of technological diversification in Brazil, between São Paulo and the remaining states. III. DESIGNING AND IMPLEMENTING THE SURVEY III.1. Redesigning the Questionnaire
The original questionnaires from the Yale Survey and the CM Survey are the starting points for the design (or the redesigning) of the MG Survey questionnaire. However, adaptations of the original questionnaires are necessary, given the present Brazilian NSI stage of formation. The design of the questionnaire for the MG Survey follows four general orientation: 1) to keep as much comparability as possible with the Yale and CM Surveys; 2) to adapt the questionnaire to handle specific characteristics of an immature NSI, both on the scientific and on the technological dimensions; 3) to focus the questionnaire on the subject of the role of universities and public research for industrial innovation (this allows a shortening of the questionnaire, as the subject of the MG Survey corresponds to section III - “The relationship of Science to Technology” - of the Yale Survey and to section III of the CM Survey – “Sources of information”; 4) to dialogue with the Brazilian Innovation Survey (PINTEC), trying to complement that Survey (asking questions that PINTEC have not asked).
Converse et all (1986) suggest to start the crafting of a questionnaire consulting professional experts (p. 48). R&D managers of four firms from four different industrial sectors (steel, animal health, furniture and food) were interviewed.9 Their interviews were very helpful to broaden the set of scientific disciplines, to add new channels of knowledge diffusion and to add a new “public research output” to the investigation. These interviews led also to a new issue in the questionnaire: the identification of the most important universities and public institutes for the firm R&D. The result is a 13-question questionnaire, divided in six sections (1- location of the R&D activities; 2- sources of information; 3- scientific areas and engineering; 4- obstacles and educational background; 5- R&D investments; 6- a final and open question for further information).10 The CM Survey four-point scale is used by the MG Survey. III.2. Defining and Uncovering the Survey’s Universe The target of the research is the set 180 (systematic) R&D performers firms from Minas Gerais (see Table I, section II), according to IBGE’s estimates. These 180 firms would be a feasible universe for these research resources. However, the identification of these 180 firms is not an easy task: there is not any available list of R&D performers firms in Minas Gerais. Therefore, the first step 9 USIMINAS, Pif Paf Alimentos, Itatiaia Móveis and Hertape. 10 The questionnaire is available on request.
15
of the field research is the uncovering of these firms. Using information from five different sources of possible R&D performers from Minas Gerais (1- a FIEMG’s file with 341 R&D-performers firms; 2- a database with 80 firms that applied a patent between 1990 and 2001; 3- a FIEMG’s file with 108 biotechnology firms; 4- ANPEI´s and RMT´s files, with 33 and 34 firms; 5- UFMG´s files with firms contracting university’s services), a database with 507 firms is organized.
The research team (5 interviewers) contacted the firms by phone, investigating whether or not they perform R&D in Minas Gerais.11 In this first screening 339 firms were listed and received the questionnaire. These 339 firms were once more contacted by phone by the research team, to get the answers. These contacts acted as double-checks, solving a lot of doubts from the firms, and in the end more than 100 firms were excluded from the research’s universe. The reasons for these exclusions vary, but are informative: 1) the R&D department is located elsewhere (in another state and/or in another country); 2) the R&D activities of the firm were centralized in another state, and the activities in Minas Gerais discontinued; 3) the R&D activities were discontinued in the last years and no relocated elsewhere.12 The remainder 70 firms declined to answer (probably in the majority of cases, the lack of answer could be seen as a signal of inexistence of R&D activities).
From these 339 questionnaires, 161 were answered. From these 161 questionnaires, 22 were excluded because were either firms with less than 10 employees or from sectors outside the scope of this research (services, construction etc). The universe of this research is composed by 139 R&D-performers firms (a number not so distant from the target: the 180 firms systematic R&D-performers estimated by the IBGE, see Table I).
The universe is different from the pioneering surveys, for it involves the mining sector (as in PINTEC, the scope is industry, including mining and manufacturing). In the YS and in the CMS the scope is manufacturing.
Table III-a presents the “industrial structure” of Minas Gerais and Table III-b shows the distribution of the 139 MG Survey firms according to industrial sectors and size distribution.
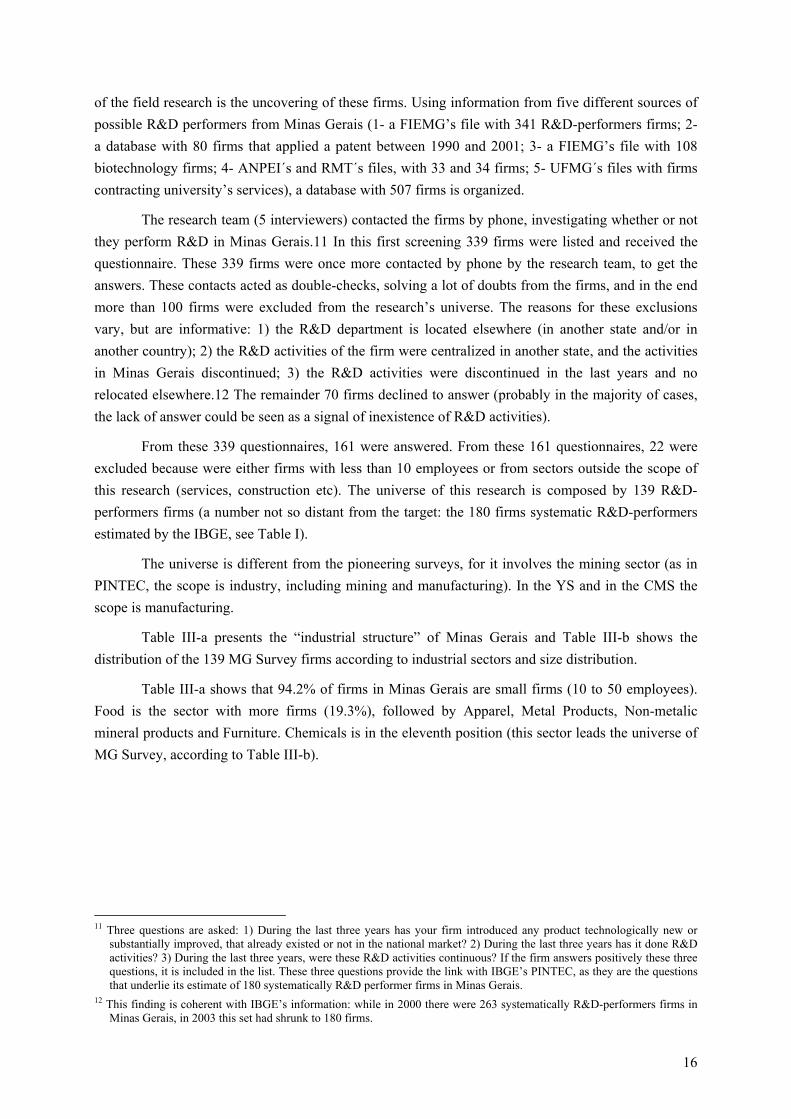
Table III-a shows that 94.2% of firms in Minas Gerais are small firms (10 to 50 employees). Food is the sector with more firms (19.3%), followed by Apparel, Metal Products, Non-metalic mineral products and Furniture. Chemicals is in the eleventh position (this sector leads the universe of MG Survey, according to Table III-b).
11 Three questions are asked: 1) During the last three years has your firm introduced any product technologically new or
substantially improved, that already existed or not in the national market? 2) During the last three years has it done R&D activities? 3) During the last three years, were these R&D activities continuous? If the firm answers positively these three questions, it is included in the list. These three questions provide the link with IBGE’s PINTEC, as they are the questions that underlie its estimate of 180 systematically R&D performer firms in Minas Gerais.
12 This finding is coherent with IBGE’s information: while in 2000 there were 263 systematically R&D-performers firms in Minas Gerais, in 2003 this set had shrunk to 180 firms.
16
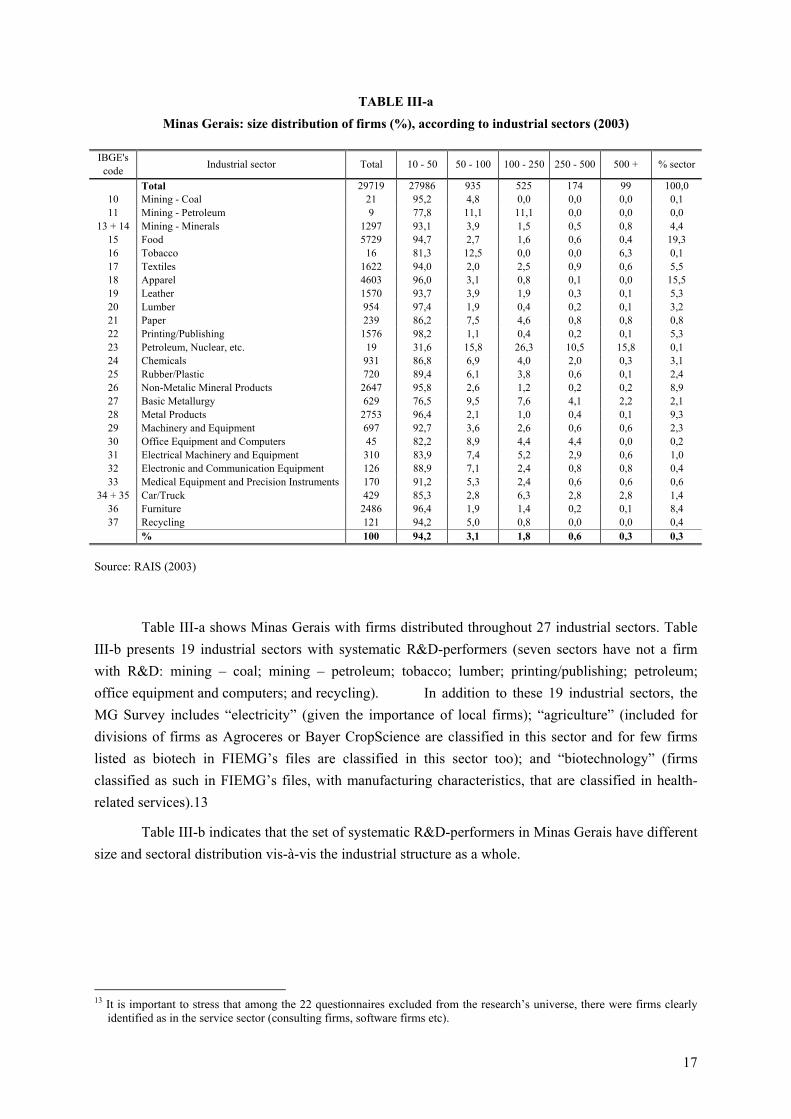
TABLE III-a
Minas Gerais: size distribution of firms (%), according to industrial sectors (2003)
IBGE's code Industrial sector Total 10 - 50 50 - 100 100 - 250 250 - 500 500 + % sector
Total 29719 27986 935 525 174 99 100,0 10 Mining - Coal 21 95,2 4,8 0,0 0,0 0,0 0,1 11 Mining - Petroleum 9 77,8 11,1 11,1 0,0 0,0 0,0
13 + 14 Mining - Minerals 1297 93,1 3,9 1,5 0,5 0,8 4,4 15 Food 5729 94,7 2,7 1,6 0,6 0,4 19,3 16 Tobacco 16 81,3 12,5 0,0 0,0 6,3 0,1 17 Textiles 1622 94,0 2,0 2,5 0,9 0,6 5,5 18 Apparel 4603 96,0 3,1 0,8 0,1 0,0 15,5 19 Leather 1570 93,7 3,9 1,9 0,3 0,1 5,3 20 Lumber 954 97,4 1,9 0,4 0,2 0,1 3,2 21 Paper 239 86,2 7,5 4,6 0,8 0,8 0,8 22 Printing/Publishing 1576 98,2 1,1 0,4 0,2 0,1 5,3 23 Petroleum, Nuclear, etc. 19 31,6 15,8 26,3 10,5 15,8 0,1 24 Chemicals 931 86,8 6,9 4,0 2,0 0,3 3,1 25 Rubber/Plastic 720 89,4 6,1 3,8 0,6 0,1 2,4 26 Non-Metalic Mineral Products 2647 95,8 2,6 1,2 0,2 0,2 8,9 27 Basic Metallurgy 629 76,5 9,5 7,6 4,1 2,2 2,1 28 Metal Products 2753 96,4 2,1 1,0 0,4 0,1 9,3 29 Machinery and Equipment 697 92,7 3,6 2,6 0,6 0,6 2,3 30 Office Equipment and Computers 45 82,2 8,9 4,4 4,4 0,0 0,2 31 Electrical Machinery and Equipment 310 83,9 7,4 5,2 2,9 0,6 1,0 32 Electronic and Communication Equipment 126 88,9 7,1 2,4 0,8 0,8 0,4 33 Medical Equipment and Precision Instruments 170 91,2 5,3 2,4 0,6 0,6 0,6
34 + 35 Car/Truck 429 85,3 2,8 6,3 2,8 2,8 1,4 36 Furniture 2486 96,4 1,9 1,4 0,2 0,1 8,4 37 Recycling 121 94,2 5,0 0,8 0,0 0,0 0,4
% 100 94,2 3,1 1,8 0,6 0,3 0,3 Source: RAIS (2003) Table III-a shows Minas Gerais with firms distributed throughout 27 industrial sectors. Table III-b presents 19 industrial sectors with systematic R&D-performers (seven sectors have not a firm with R&D: mining – coal; mining – petroleum; tobacco; lumber; printing/publishing; petroleum; office equipment and computers; and recycling). In addition to these 19 industrial sectors, the MG Survey includes “electricity” (given the importance of local firms); “agriculture” (included for divisions of firms as Agroceres or Bayer CropScience are classified in this sector and for few firms listed as biotech in FIEMG’s files are classified in this sector too); and “biotechnology” (firms classified as such in FIEMG’s files, with manufacturing characteristics, that are classified in health-related services).13
Table III-b indicates that the set of systematic R&D-performers in Minas Gerais have different size and sectoral distribution vis-à-vis the industrial structure as a whole.
13 It is important to stress that among the 22 questionnaires excluded from the research’s universe, there were firms clearly
identified as in the service sector (consulting firms, software firms etc).
17
TABLE III-b
Minas Gerais survey universe: size distribution of firms (%), according to industrial sectors (2005)
IBGE's code Industrial sector Total 10 - 50 50 - 100 100 - 250 250 - 500 500 + % sector
Total 139 40 23 44 22 10 100,0 01 + 02 Agriculture 5 20,0 20,0 60,0 0,0 0,0 3,6 13 + 14 Mining 10 100,0 0,0 0,0 0,0 0,0 7,2
15 Food 19 36,8 10,5 31,6 10,5 10,5 13,7 17 Textiles 5 20,0 0,0 20,0 60,0 0,0 3,6 18 Apparel 1 0,0 0,0 0,0 100,0 0,0 0,7 19 Leather 2 50,0 0,0 50,0 0,0 0,0 1,4 21 Paper 1 100,0 0,0 0,0 0,0 0,0 0,7 24 Chemicals 20 10,0 30,0 35,0 20,0 5,0 14,4 25 Rubber/Plastic 5 0,0 0,0 40,0 40,0 20,0 3,6 26 Non-Metalic Mineral Products 4 50,0 0,0 50,0 0,0 0,0 2,9 27 Basic Metallurgy 10 60,0 0,0 10,0 20,0 10,0 7,2 28 Metal Products 8 0,0 25,0 50,0 0,0 25,0 5,8 29 Machinery and Equipment 8 12,5 25,0 62,5 0,0 0,0 5,8 31 Electrical Machinery and Equipment 9 33,3 11,1 33,3 22,2 0,0 6,5 32 Electronic and Communication Equipment 3 0,0 33,3 33,3 33,3 0,0 2,2 33 Medical Equipment and Precision Instruments 11 0,0 45,5 9,1 18,2 27,3 7,9
34 + 35 Car/Truck 6 16,7 0,0 66,7 16,7 0,0 4,3 36 Furniture 6 16,7 16,7 33,3 33,3 0,0 4,3 40 Electricity 3 66,7 0,0 33,3 0,0 0,0 2,2 85 Biotechnology 3 33,3 66,7 0,0 0,0 0,0 2,2
% 100 28,8 16,5 31,7 15,8 7,2 71,9
Source: authors' elaboration
The size distribution is not so concentrated in the small firms: medium-size firms (100-250 employees) are 31.7% of the universe, followed by the small firms, with 28.8% of the universe. Large firms (firms with more than 500 employees) are better represented in the MG Survey universe, with 7.2% of firms.
The sectoral distribution is different too. Chemical industry has 14.4 % of the R&D-performers, Food follows with 13.7%, the third place is Medical Equipment, the fourth is Basic Metallurgy, and the fifth Mining. Only the Food industry is in the five leading positions of both Tables III-a and III-b. IV. RESULTS IV.1. Universities and Other Sources of Knowledge in Industrial R&D Figures III and IV show the answers on the importance of sources of information, both for suggesting new projects and for contributing to project completion. In the CM Survey, Figures 1 and 2 (Cohen et all, p. 6) present similar data.
Figure III presents the answers on the information sources suggesting new projects.14 .
14 It is important to note the higher standard-deviation in the MG Survey, both in Figure III and IV, vis-à-vis the standard-
deviation of the CM Survey.
18
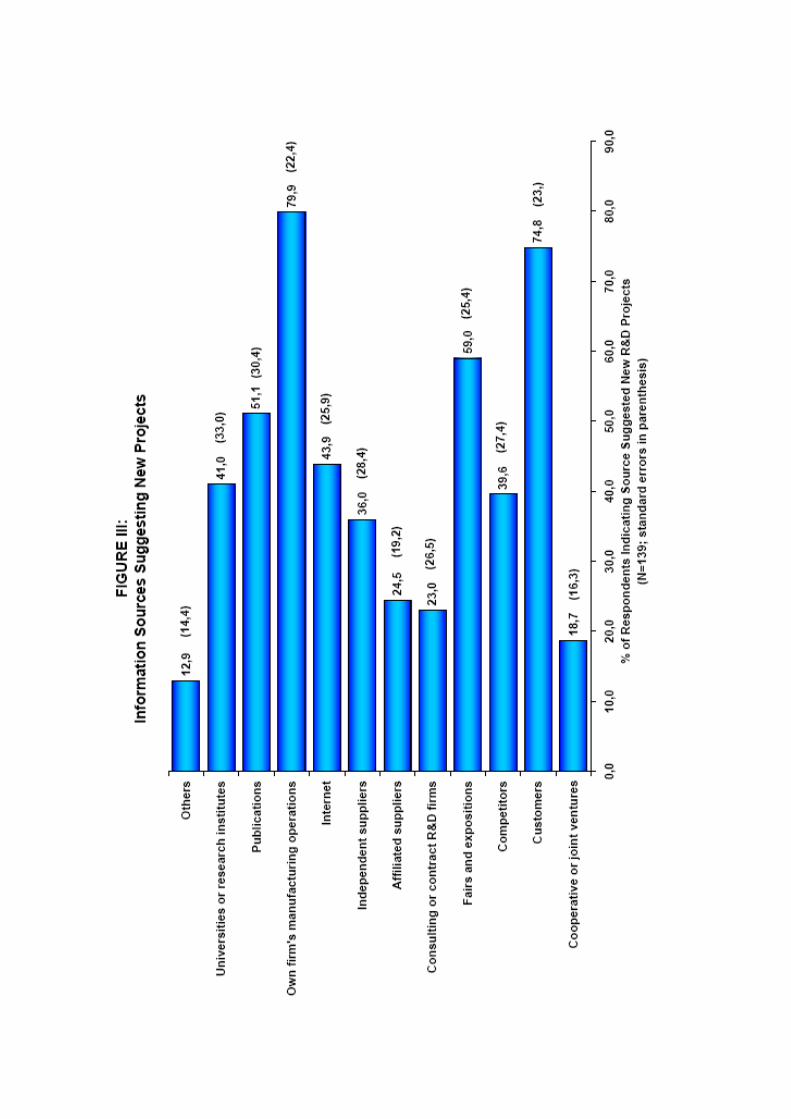

The firms own manufacturing operations is the most important source (for 79.9% of respondents), followed by customers (74.8%). The third place is “fairs and expositions” (included in the MG Survey, not present in the CM Survey) (59.0%), followed by “publications”. Universities and research institutes are in the sixth position (41.0% of respondents). Internet is included as a source of information, in the fifth position (43.9% of respondents). Two important differences with the CM Survey: customers are the first source and Universities and Public Labs are relatively less important sources, with 31.6% of respondents indicating them.
Figure IV presents the answers on the information sources contributing to project completion.
20

Figure IV shows the firms own manufacturing operations as the most important source contributing to project completion (85.6% of respondents), once more followed by customers (64.0 %). Universities and research institutes are in the third position (56.1% of respondents).
Two important similarities with the CM Survey: universities and research institutes are more important as sources contributing for project completion, and the firms own manufacturing operations are the most important source for project completion.
It is worthwhile to put forward the greater importance of universities as source of information both for new projects and for project completion in the MG Survey vis-à-vis the CM Survey: 41.0% and 56.1% in Minas Gerais and 31.6% and 36.3% in the CM Survey.
Viotti et all (2005, p. 674) compare Innovation Surveys from Brazil and from the EU, pointing that the importance of universities as source of information is higher in the Brazilian case (9% of respondents) than in any other European country (Denmark is in the second position, with 6% of respondents indicating universities as important). Even after normalizing the data, Brazil keeps the second position, swapping his position with Denmark. This information hints coherence in the comparison between the MG Survey and the CM Survey.
These comparisons present a very interesting research issue. A conjecture on this issue suggests that as in immature NSI the firms involvement with R&D is small, they would depend upon the university more than in a NSI with strong firms R&D investments and resources. Universities in immature NSIs may combine substitution and complementarity with relatively weaker firms R&D investments. IV.2. Comparing Universities and Industries as Sources of Knowledge In the questionnaire, as in the CM questionnaire, there are questions that investigate the “pathways of knowledge flows” from industry and from universities and research institutes (MG Survey questions 6 and 7; based on CM Survey questions 16 and 17).
Table IV displays an “indicator” of RIUSK (“relative importance of universities as source of knowledge”). This indicator divides the average “moderately important” and “very important” answers in the industry related sources vis-à-vis the university related sources. The intuition behind this indicator is simple: a firm that values equally universities and industry sources has a RIUSK equal to one. As a firm indicates university sources as relatively more important than industry sources, the indicator is less than one. Inversely, as a firm indicates industry sources as relatively more important that university sources, the indicator is greater than one. Of course this “indicator” only offers a very cautious comparison.
22
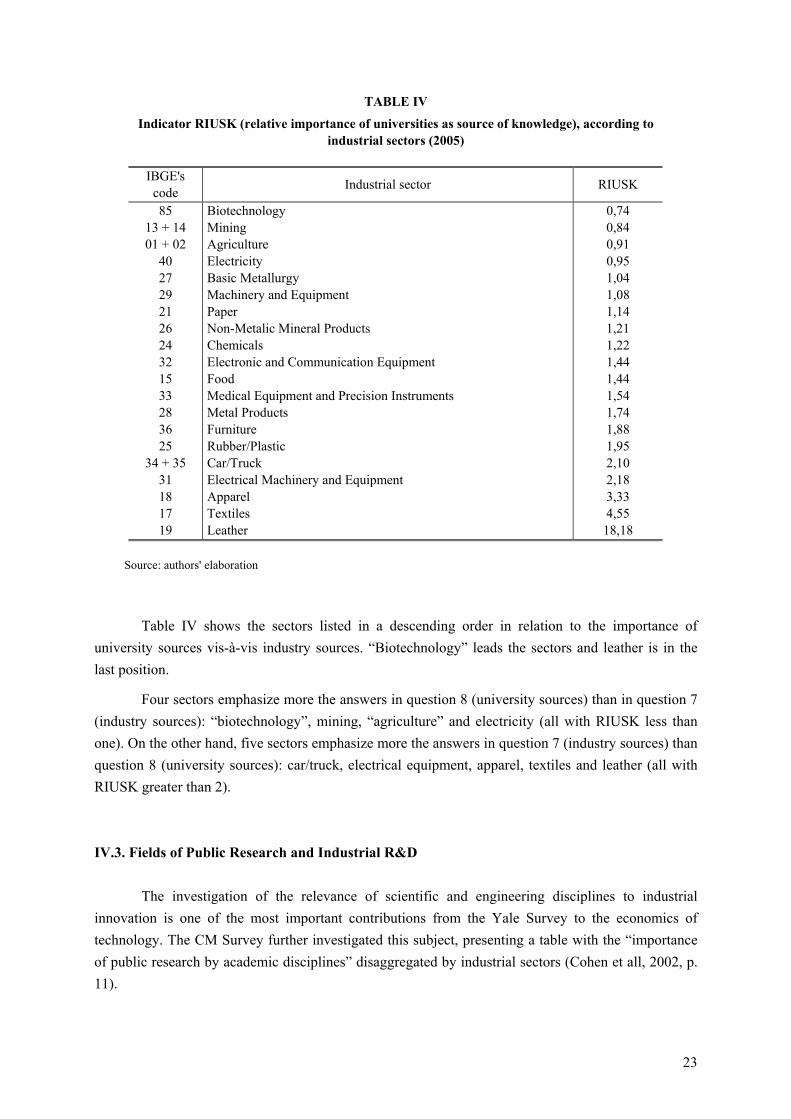
TABLE IV
Indicator RIUSK (relative importance of universities as source of knowledge), according to industrial sectors (2005)
IBGE's
code Industrial sector RIUSK
85 Biotechnology 0,74 13 + 14 Mining 0,84 01 + 02 Agriculture 0,91
40 Electricity 0,95 27 Basic Metallurgy 1,04 29 Machinery and Equipment 1,08 21 Paper 1,14 26 Non-Metalic Mineral Products 1,21 24 Chemicals 1,22 32 Electronic and Communication Equipment 1,44 15 Food 1,44 33 Medical Equipment and Precision Instruments 1,54 28 Metal Products 1,74 36 Furniture 1,88 25 Rubber/Plastic 1,95
34 + 35 Car/Truck 2,10 31 Electrical Machinery and Equipment 2,18 18 Apparel 3,33 17 Textiles 4,55 19 Leather 18,18
Source: authors' elaboration Table IV shows the sectors listed in a descending order in relation to the importance of university sources vis-à-vis industry sources. “Biotechnology” leads the sectors and leather is in the last position.
Four sectors emphasize more the answers in question 8 (university sources) than in question 7 (industry sources): “biotechnology”, mining, “agriculture” and electricity (all with RIUSK less than one). On the other hand, five sectors emphasize more the answers in question 7 (industry sources) than question 8 (university sources): car/truck, electrical equipment, apparel, textiles and leather (all with RIUSK greater than 2). IV.3. Fields of Public Research and Industrial R&D The investigation of the relevance of scientific and engineering disciplines to industrial innovation is one of the most important contributions from the Yale Survey to the economics of technology. The CM Survey further investigated this subject, presenting a table with the “importance of public research by academic disciplines” disaggregated by industrial sectors (Cohen et all, 2002, p. 11).
23

The MG Survey has a question (number 9) to investigate this relationship in Minas Gerais. Few modifications were introduced: 1) disciplines that were in the Yale Survey but not in the CM Survey are re-included, given the industrial structure of Minas Gerais (Geology, Metallurgy, Agricultural science); 2) new disciplines are included, given the specificities of Brazilian economy (Veterinary, Food Science and Technology, Industrial Design, Civil Engineering, and Mechanical Engineering).
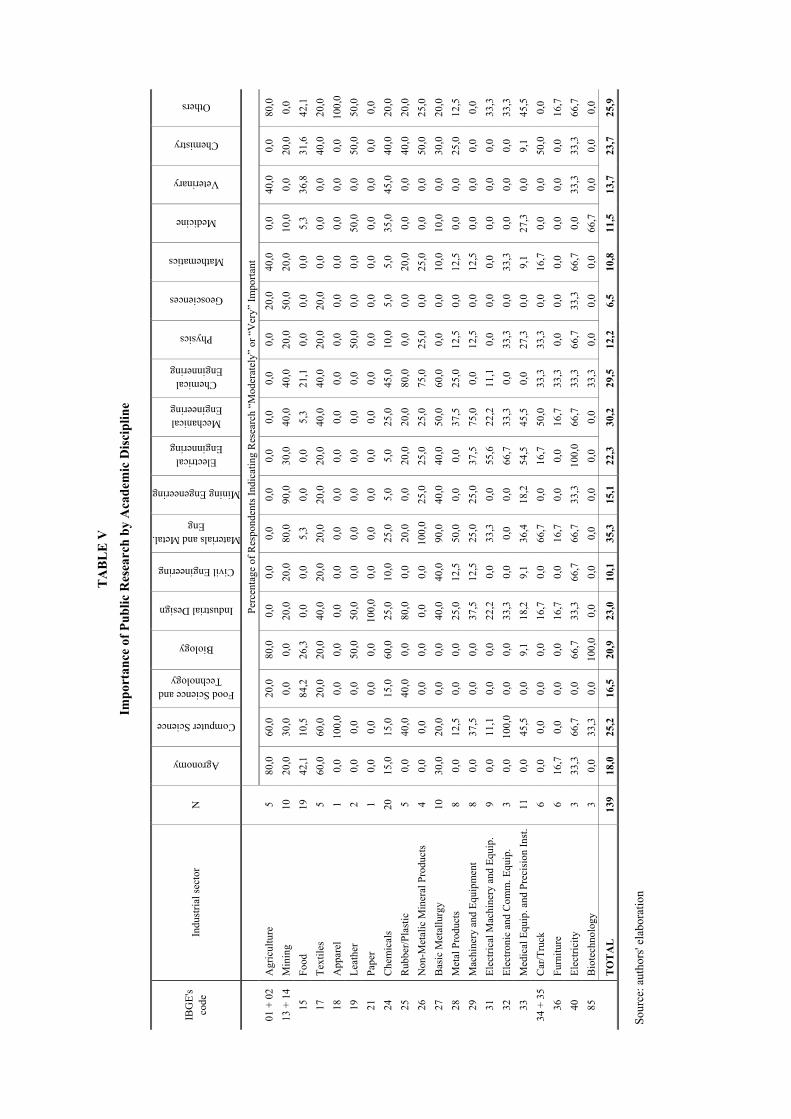
The results are in Table V. Table V has less industrial sectors and more academic disciplines vis-à-vis CM Survey Table 3 (Cohen et all, p. 11).
24
TA
BL
E V
Impo
rtan
ce o
f Pub
lic R
esea
rch
by A
cade
mic
Dis
cipl
ine
IBG
E's
code
In
dust
rial s
ecto
r N
Agronomy
Computer Science
Food Science and Technology
Biology
Industrial Design
Civil Engineering
Materials and Metal. Eng
Mining Engeneering
Electrical Enginnering
Mechanical Engineering
Chemical Enginnering
Physics
Geosciences
Mathematics
Medicine
Veterinary
Chemistry
Others
Pe
rcen
tage
of R
espo
nden
ts In
dica
ting
Res
earc
h “M
oder
atel
y” o
r “V
ery”
Impo
rtant
01 +
02
Agr
icul
ture
580
,060
,020
,080
,00,
00,
00,
00,
00,
00,
00,
00,
020
,040
,00,
040
,00,
080
,013
+ 1
4
M
inin
g10
20,0
30,0
0,0
0,0
20,0
20,0
80,0
90,0
30,0
40,0
40,0
20,0
50,0
20,0
10,0
0,0
20,0
0,0
15
Food
1942
,110
,584
,226
,30,
00,
05,
30,
00,
05,
321
,10,
00,
00,
05,
336
,831
,642
,117
Te
xtile
s5
60,0
60,0
20,0
20,0
40,0
20,0
20,0
20,0
20,0
40,0
40,0
20,0
20,0
0,0
0,0
0,0
40,0
20,0
18
App
arel
10,
010
0,0
0,0
0,0
0,0
0,0
0,0
0,0
0,0
0,0
0,0
0,0
0,0
0,0
0,0
0,0
0,0
100,
019
Le
athe
r2
0,0
0,0
0,0
50,0
50,0
0,0
0,0
0,0
0,0
0,0
0,0
50,0
0,0
0,0
50,0
0,0
50,0
50,0
21
Pape
r1
0,0
0,0
0,0
0,0
100,
00,
00,
00,
00,
00,
00,
00,
00,
00,
00,
00,
00,
00,
024
C
hem
ical
s20
15,0
15,0
15,0
60,0
25,0
10,0
25,0
5,0
5,0
25,0
45,0
10,0
5,0
5,0
35,0
45,0
40,0
20,0
25
Rub
ber/P
last
ic5
0,0
40,0
40,0
0,0
80,0
0,0
20,0
0,0
20,0
20,0
80,0
0,0
0,0
20,0
0,0
0,0
40,0
20,0
26
Non
-Met
alic
Min
eral
Pro
duct
s4
0,0
0,0
0,0
0,0
0,0
0,0
100,
025
,025
,025
,075
,025
,00,
025
,00,
00,
050
,025
,027
B
asic
Met
allu
rgy
1030
,020
,00,
00,
040
,040
,090
,040
,040
,050
,060
,00,
00,
010
,010
,00,
030
,020
,028
M
etal
Pro
duct
s8
0,0
12,5
0,0
0,0
25,0
12,5
50,0
0,0
0,0
37,5
25,0
12,5
0,0
12,5
0,0
0,0
25,0
12,5
29
Mac
hine
ry a
nd E
quip
men
t8
0,0
37,5
0,0
0,0
37,5
12,5
25,0
25,0
37,5
75,0
0,0
12,5
0,0
12,5
0,0
0,0
0,0
0,0
31
Elec
trica
l Mac
hine
ry a
nd E
quip
.9
0,0
11,1
0,0
0,0
22,2
0,0
33,3
0,0
55,6
22,2
11,1
0,0
0,0
0,0
0,0
0,0
0,0
33,3
32
Elec
troni
c an
d C
omm
. Equ
ip.
30,
010
0,0
0,0
0,0
33,3
0,0
0,0
0,0
66,7
33,3
0,0
33,3
0,0
33,3
0,0
0,0
0,0
33,3
33
Med
ical
Equ
ip. a
nd P
reci
sion
Inst
. 11
0,
0 45
,5
0,0
9,1
18,2
9,1
36,4
18,2
54,5
45,5
0,0
27,3
0,0
9,1
27,3
0,0
9,1
45,5
34 +
35
Car
/Tru
ck6
0,0
0,0
0,0
0,0
16,7
0,0
66,7
0,0
16,7
50,0
33,3
33,3
0,0
16,7
0,0
0,0
50,0
0,0
36
Furn
iture
616
,70,
00,
00,
016
,70,
016
,70,
00,
016
,733
,30,
00,
00,
00,
00,
00,
016
,740
El
ectri
city
333
,366
,70,
066
,733
,366
,766
,733
,310
0,0
66,7
33,3
66,7
33,3
66,7
0,0
33,3
33,3
66,7
85
Bio
tech
nolo
gy3
0,0
33,3
0,0
100,
00,
00,
00,
00,
00,
00,
033
,30,
00,
00,
066
,70,
00,
00,
0
T
OT
AL
139
18,0
25,2
16,5
20,9
23,0
10,1
35,3
15,1
22,3
30,2
29,5
12,2
6,5
10,8
11,5
13,7
23,7
25,9
Sour
ce: a
utho
rs' e
labo
ratio
n
Table V shows a basic coherence: Geosciences, for instance, is indicated as important to 50% of respondents in the Mining sector; Biology is important for more than 50% of respondents in “Agriculture”, Leather, Chemicals (Drugs is in this sector), Electricity (environmental conditions might be the issue) and “Biotechnology”. Food science and technology is important for 84.2% of respondents in the Food industry. In general, this picture shows how a diversified economy needs a diversified scientific infrastructure to feed its industrial innovation.
Table V presents the overall picture: Materials and Metallurgic Engineering are the most pervasive disciplines in the MG Survey (35.3% of respondents scored them as at least moderately important). The most important discipline in the CM Survey is Materials Science (42.6% of respondents scored it as at least moderately important).
Mechanical Engineering is in the second rank (30.2%), Chemical Engineering is third (29.5%) and Computer Science is fourth (25.2%). In the CM Survey, Computer Science is in the second position. IV.4. Pathways of Knowledge Flow The pathways of knowledge flow from universities to industrial firms are investigated in question 8. Table VI presents the results.
26
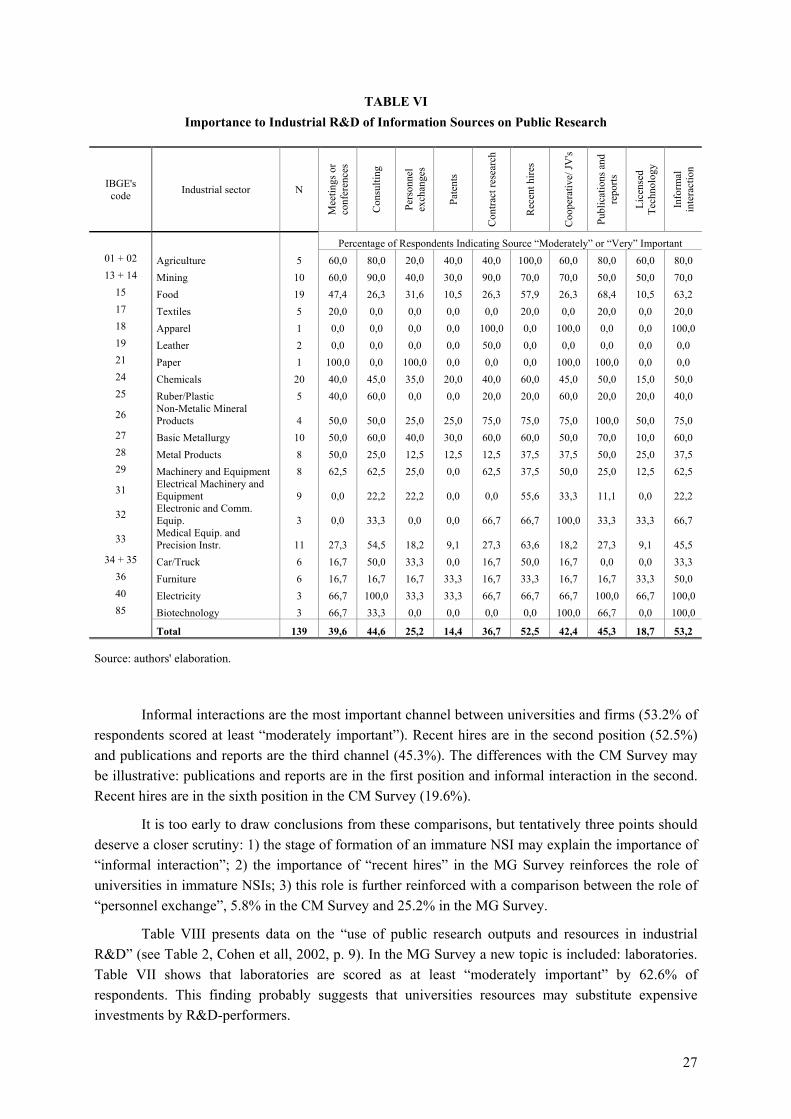
TABLE VI Importance to Industrial R&D of Information Sources on Public Research
IBGE's code Industrial sector N
Mee
tings
or
conf
eren
ces
Con
sulti
ng
Pers
onne
l ex
chan
ges
Pate
nts
Con
tract
rese
arch
Rec
ent h
ires
Coo
pera
tive/
JV's
Publ
icat
ions
and
re
ports
Lice
nsed
Te
chno
logy
Info
rmal
in
tera
ctio
n
Percentage of Respondents Indicating Source “Moderately” or “Very” Important 01 + 02 Agriculture 5 60,0 80,0 20,0 40,0 40,0 100,0 60,0 80,0 60,0 80,0 13 + 14 Mining 10 60,0 90,0 40,0 30,0 90,0 70,0 70,0 50,0 50,0 70,0
15 Food 19 47,4 26,3 31,6 10,5 26,3 57,9 26,3 68,4 10,5 63,2 17 Textiles 5 20,0 0,0 0,0 0,0 0,0 20,0 0,0 20,0 0,0 20,0 18 Apparel 1 0,0 0,0 0,0 0,0 100,0 0,0 100,0 0,0 0,0 100,0 19 Leather 2 0,0 0,0 0,0 0,0 50,0 0,0 0,0 0,0 0,0 0,0 21 Paper 1 100,0 0,0 100,0 0,0 0,0 0,0 100,0 100,0 0,0 0,0 24 Chemicals 20 40,0 45,0 35,0 20,0 40,0 60,0 45,0 50,0 15,0 50,0 25 Ruber/Plastic 5 40,0 60,0 0,0 0,0 20,0 20,0 60,0 20,0 20,0 40,0
26 Non-Metalic Mineral Products 4 50,0 50,0 25,0 25,0 75,0 75,0 75,0 100,0 50,0 75,0
27 Basic Metallurgy 10 50,0 60,0 40,0 30,0 60,0 60,0 50,0 70,0 10,0 60,0 28 Metal Products 8 50,0 25,0 12,5 12,5 12,5 37,5 37,5 50,0 25,0 37,5 29 Machinery and Equipment 8 62,5 62,5 25,0 0,0 62,5 37,5 50,0 25,0 12,5 62,5
31 Electrical Machinery and Equipment 9 0,0 22,2 22,2 0,0 0,0 55,6 33,3 11,1 0,0 22,2
32 Electronic and Comm. Equip. 3 0,0 33,3 0,0 0,0 66,7 66,7 100,0 33,3 33,3 66,7
33 Medical Equip. and Precision Instr. 11 27,3 54,5 18,2 9,1 27,3 63,6 18,2 27,3 9,1 45,5
34 + 35 Car/Truck 6 16,7 50,0 33,3 0,0 16,7 50,0 16,7 0,0 0,0 33,3 36 Furniture 6 16,7 16,7 16,7 33,3 16,7 33,3 16,7 16,7 33,3 50,0 40 Electricity 3 66,7 100,0 33,3 33,3 66,7 66,7 66,7 100,0 66,7 100,0 85 Biotechnology 3 66,7 33,3 0,0 0,0 0,0 0,0 100,0 66,7 0,0 100,0
Total 139 39,6 44,6 25,2 14,4 36,7 52,5 42,4 45,3 18,7 53,2 Source: authors' elaboration. Informal interactions are the most important channel between universities and firms (53.2% of respondents scored at least “moderately important”). Recent hires are in the second position (52.5%) and publications and reports are the third channel (45.3%). The differences with the CM Survey may be illustrative: publications and reports are in the first position and informal interaction in the second. Recent hires are in the sixth position in the CM Survey (19.6%).
It is too early to draw conclusions from these comparisons, but tentatively three points should deserve a closer scrutiny: 1) the stage of formation of an immature NSI may explain the importance of “informal interaction”; 2) the importance of “recent hires” in the MG Survey reinforces the role of universities in immature NSIs; 3) this role is further reinforced with a comparison between the role of “personnel exchange”, 5.8% in the CM Survey and 25.2% in the MG Survey.
Table VIII presents data on the “use of public research outputs and resources in industrial R&D” (see Table 2, Cohen et all, 2002, p. 9). In the MG Survey a new topic is included: laboratories. Table VII shows that laboratories are scored as at least “moderately important” by 62.6% of respondents. This finding probably suggests that universities resources may substitute expensive investments by R&D-performers.
27

TABLE VII
Use of Public Research Outputs and Resources in Industrial R&D
IBGE's code Industrial sector N Research
Findings Prototypes Instruments
and Techniques
Laboratories
Percentage of Respondents Indicating Research
“Moderately” or “Very” Important 01 + 02 Agriculture 5 100,0 20,0 60,0 40,0 13 + 14 Mining 10 60,0 50,0 70,0 80,0
15 Food 19 63,2 26,3 73,7 63,2 17 Textiles 5 20,0 0,0 20,0 60,0 18 Apparel 1 100,0 100,0 100,0 100,0 19 Leather 2 50,0 0,0 50,0 100,0 21 Paper 1 0,0 0,0 100,0 100,0 24 Chemicals 20 60,0 40,0 55,0 65,0 25 Rubber/Plastic 5 60,0 40,0 60,0 100,0 26 Non-Metalic Mineral Products 4 50,0 25,0 50,0 100,0 27 Basic Metallurgy 10 50,0 20,0 50,0 60,0 28 Metal Products 8 25,0 25,0 37,5 50,0 29 Machinery and Equipment 8 50,0 25,0 25,0 50,0 31 Electrical Machinery and Equipment 9 22,2 33,3 33,3 66,7 32 Electronic and Communication Equipment 3 100,0 66,7 66,7 100,0 33 Medical Equipment and Precision Instruments 11 18,2 18,2 27,3 54,5
34 + 35 Car/Truck 6 16,7 16,7 33,3 50,0 36 Furniture 6 33,3 33,3 66,7 0,0 40 Electricity 3 100,0 66,7 100,0 100,0 85 Biotechnology 3 100,0 0,0 66,7 33,3
Total 139 50,4 29,5 52,5 62,6 Source: author's elaboration
28
Comparing with the CM Survey, research findings were the most scored public research output, followed by instruments and techniques. In the MG Survey, “research findings” rank third, behind laboratories and instruments and techniques.15 IV.5. NATURE OF CAPITAL AND FORMAL R&D INFLUENCE ON THE RESULTS This sub-section presents information on the influence on two issues on the relevance of sources of information. These two issues are important for immature NSIs, as they deal with the nature of capital (domestic or foreign) and the formalization of R&D activities.
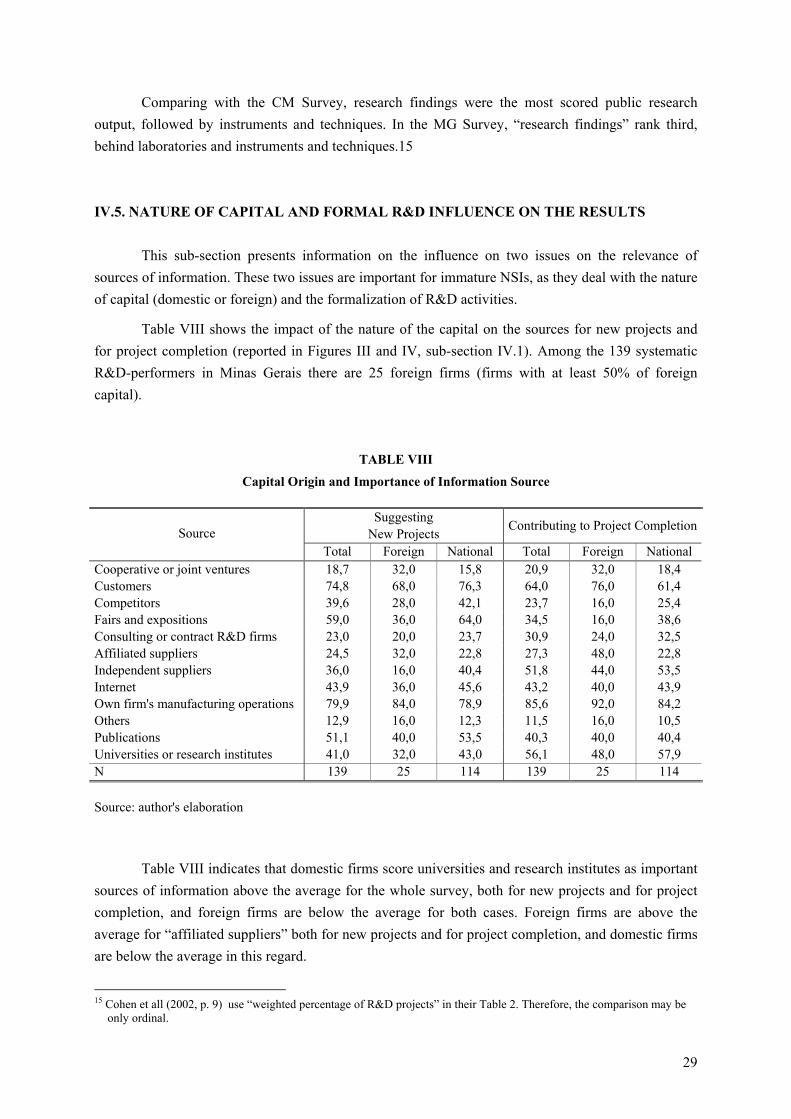
Table VIII shows the impact of the nature of the capital on the sources for new projects and for project completion (reported in Figures III and IV, sub-section IV.1). Among the 139 systematic R&D-performers in Minas Gerais there are 25 foreign firms (firms with at least 50% of foreign capital).
TABLE VIII
Capital Origin and Importance of Information Source
Suggesting New Projects Contributing to Project Completion Source
Total Foreign National Total Foreign National Cooperative or joint ventures 18,7 32,0 15,8 20,9 32,0 18,4 Customers 74,8 68,0 76,3 64,0 76,0 61,4 Competitors 39,6 28,0 42,1 23,7 16,0 25,4 Fairs and expositions 59,0 36,0 64,0 34,5 16,0 38,6 Consulting or contract R&D firms 23,0 20,0 23,7 30,9 24,0 32,5 Affiliated suppliers 24,5 32,0 22,8 27,3 48,0 22,8 Independent suppliers 36,0 16,0 40,4 51,8 44,0 53,5 Internet 43,9 36,0 45,6 43,2 40,0 43,9 Own firm's manufacturing operations 79,9 84,0 78,9 85,6 92,0 84,2 Others 12,9 16,0 12,3 11,5 16,0 10,5 Publications 51,1 40,0 53,5 40,3 40,0 40,4 Universities or research institutes 41,0 32,0 43,0 56,1 48,0 57,9 N 139 25 114 139 25 114 Source: author's elaboration Table VIII indicates that domestic firms score universities and research institutes as important sources of information above the average for the whole survey, both for new projects and for project completion, and foreign firms are below the average for both cases. Foreign firms are above the average for “affiliated suppliers” both for new projects and for project completion, and domestic firms are below the average in this regard.
15 Cohen et all (2002, p. 9) use “weighted percentage of R&D projects” in their Table 2. Therefore, the comparison may be
only ordinal.
29
Table IX investigates the influence of the existence of R&D departments.
TABLE IX
Formal R&D Departments and Importance of Sources of Information
Suggesting New Projects
Contributing to Project Completion Source
Total Yes% No% Total Yes% No% Cooperative or joint ventures 18,7 26,4 5,8 20,9 31,0 3,8 Customers 74,8 75,9 73,1 64,0 60,9 69,2 Competitors 39,6 42,5 34,6 23,7 23,0 25,0 Fairs and expositions 59,0 60,9 55,8 34,5 33,3 36,5 Consulting or contract R&D firms 23,0 21,8 25,0 30,9 32,2 28,8 Affiliated suppliers 24,5 26,4 21,2 27,3 31,0 21,2 Independent suppliers 36,0 33,3 40,4 51,8 52,9 50,0 Internet 43,9 40,2 50,0 43,2 44,8 40,4 Own firm's manufacturing operations 79,9 79,3 80,8 85,6 87,4 82,7 Others 12,9 12,6 13,5 11,5 11,5 11,5 Publications 51,1 48,3 55,8 40,3 39,1 42,3 Universities or research institutes 41,0 42,5 38,5 56,1 65,5 40,4 N 139 87 52 139 87 52 Source: author's elaboration.
There are 87 firms with R&D departments and 52 without R&D departments. Interestingly, firms with R&D Department are above the average in the importance of universities as source of information for new projects and for project completion. V. PRELIMINARY CONCLUSIONS AND FURTHER RESEARCH The focus of this investigation in one state may be seen as an opportunity for a stepwise approach in the preparation of a broader research, probably involving Brazil as a whole and integrating more research groups. Probably the most important contribution of this research is the experience accumulated for the next steps of this research.
Six tentative (and very cautious) conclusions may be suggested at this stage: 1) the importance of universities to industrial innovation in the Brazilian case (according to PINTEC
data) goes beyond the small core of R&D-performers, as there are 1,225 non-R&D performers that scores universities and research institutes as important sources of information (this is a clear subject for further research with non-trivial problems to uncover these 1,225 firms out of 22,663 non-R&D innovative firms in Brazil, for Minas Gerais the non-R&D firms are more than 3,000);
2) focusing the small core of systematic R&D-performers, universities seem to be more important as source of information than in the CM Survey – this might be a hint on the role of universities complementing and substituting firms’ R&D capabilities, given the weaker firms’ involvement in R&D activities in a immature NSI vis-à-vis mature NSIs;
30

3) probably, the role of the scientific infrastructure as an “antenna” for international sources of science and technology strengthen the role of universities and research institutes in immature NSIs;
4) there are differences in the importance of public research disaggregated by academic discipline, probably indicating the more diffused nature of public research in mature NSIs and a more concentrated impact (in the relationship between industrial sectors and academic disciplines) in the case of immature NSIs;16
5) the importance of recent hires and personnel exchange as channels of information and the important role of laboratories as resources used by industrial innovation stress an specificity of universities and research institutes in immature NSIs – a very close relationship between their role as educational institutions and as source of information that underlies business firms’ innovative activities;
6) the importance of universities and research institutes as source of information seems to be influenced by the structural features as nature of capital and formalization of R&D.
16 A look at zeros in Cohen’s Table 3 and in this paper’s Table V suggests this point.
31
REFERENCES BASTOS, C.; REBOUÇAS, M.; BIVAR, W. (2003). A construção da Pesquisa Industrial de Inovação
Tecnológica – PINTEC. In: VIOTTI, E.; MACEDO, M. M. (orgs) Indicadores de ciência, tecnologia e inovação no Brasil. Campinas: Editora Unicamp, pp. 463-532..
BERNARDES, A.; ALBUQUERQUE, E. (2003) Cross-over, thresholds and the interactions between science and technology: lessons for less-developed countries. Research Policy, v. 32, n. 5, pp. 867-887.
COHEN, W.; NELSON, R.; WALSH, J. (2002) Links and impacts: the influence of public R&D on industrial research. Management Science, v. 48, n. 1, pp. 1-23.
COLYVAS, J.; CROW, M.; GELIJNS, A.; MAZZOLENI, R.; NELSON, R. ROSENBERG, N.; SAMPAT, B. (2002) How do university inventions get into pratice? Management Science, v. 48, n. 1, pp. 61-72.
CONVERSE, J. M.; PRESSER, S. (1986) Survey questions: handcrafting the standardized questionnaire. Newbury Park/London: Sage Publications.
IBGE (2005) Pesquisa Industrial – Inovação Tecnológica 2003 – PINTEC. Rio de Janeiro: IBGE.
KLEVORICK, A.; LEVIN, R.; NELSON, R.; WINTER, S (1995). On the sources and significance of inter-industry differences in technological opportunities. Research Policy, v. 24, p. 185-205.
MEYER-KHRAMER, F.; SCHMOCH, U. (1998) Science-based technologies: industry-university interactions in four fields. Research Policy, v. 27, pp. 835-851.
MOWERY, D.; NELSON, R.; SAMPAT, B.; ZIEDONIS, A. (2004) Ivory tower and industrial innovation: university-industry technology transfer before and after the Bayh-Dole Act. Stanford: Stanford University.
MOWEY, D.; SAMPAT, B. (2005) Universities in National Innovation Systems. In: FAGERBERG, J.; MOWERY, D.; NELSON, R. (2005) The Oxford Handbook of Innovation. Oxford: Oxford University Press.
NARIN, F.; HAMILTON, K. S.; OLIVASTRO, D. (1997) The increasing linkage between U.S. technology and public science. Research Policy, v. 26, n. 3, pp. 317-330.
NELSON, R.; ROSENBERG, N. (1993) Technical innovation and national systems. In: NELSON, R. (ed). National innovation systems: a comparative analysis. New York, Oxford: Oxford University, p. 3-21.
PAVITT, K. (1991) What makes basic research economically useful? Research Policy, v. 20, n. 2, pp. 109-119.
RAPINI, Márcia S. (2004) Interação Universidade Industria no Brasil: uma investigação muldimensional. Rio de Janeiro: IE-UFRJ.
ROSENBERG, N. (1982) Inside the black box: technology and economics. Cambridge: Cambridge University.
32

ROSENBERG, N. (2000) Schumpeter and the endogeneity of technology: some American perspectives. London: Routledge.
SILVA, L. (2003) Padrões de interação entre ciência e tecnologia. Dissertação de Mestrado. Belo Horizonte: Cedeplar-UFMG.
VIOTTI, E.; BAESSA, A. KOELLER, P. (2005) Perfil da inovação na indústria brasileira: uma comparação internacional. In: NEGRI, J. A.; SALERNO, M. Inovações, padrões tecnológicos e desempenho das firmas industriais brasileiras. Brasília: IPEA, pp. 653-687.
33

APPENDIX
34


![CARLOS EDUARDO RODRIGUESCARLOS EDUARDO RODRIGUES De Zanzibar rumo ao interior da África Oriental: o comércio de marfim e escravos segundo o relato de Victor Giraud [1883 a 1885]](https://static.fdocuments.pl/doc/165x107/6041a9617334fb7d16693ae9/carlos-eduardo-carlos-eduardo-rodrigues-de-zanzibar-rumo-ao-interior-da-frica.jpg)