Determination the effect of factors affecting the tensile ... · PDF fileocena wpływu...
7
EKSPLOATACJA I NIEZAWODNOSC – MAINTENANCE AND RELIABILITY VOL.18, NO. 1, 2016 110 Article citation info: AMBRIšKO Ľ, MARASOVá D, GRENDEL P. Determination the effect of factors affecting the tensile strength of fabric conveyor belts. Eksplo- atacja i Niezawodnosc – Maintenance and Reliability 2016; 18 (1): 110–116, http://dx.doi.org/10.17531/ein.2016.1.14. Ľubomír AMBRIšKO Daniela MARASOVá Peter GRENDEL DETERMINATION THE EFFECT OF FACTORS AFFECTING THE TENSILE STRENGTH OF FABRIC CONVEYOR BELTS OCENA WPłYWU CZYNNIKóW NA WYTRZYMAłOść NA ROZCIąGANIE TAśM PRZENOśNIKOWYCH TKANINOWO – GUMOWYCH The Design of experiment (DOE) method was used in this paper to rubber conveyor belt tension testing. Using DOE method were from experimentally obtained data established effects of factors and interactions that affect the value of the measured strength and also were determined regression models, which apply input and output variables to the relation. The regression model presents the complete multifactor experiment that contains main factors and interactions. Keywords: mechanical testing, tension, conveyor belt, DOE method (Design of Experiments). Metoda planowania eksperymentu (DOE) w artykule użyta do testowania napięcia taśm przenośnikowych tkaninowo – gumo- wych. Korzystanie z metody DOE były ustalonych poszczególnych czynników oraz ich interakcji ze danych uzyskanych w sposób doświadczalny. Czynniki i interakcje wpływające na wartość zmierzonej wytrzymałośći, a także określono modele regresji, wy- kazającego związki pomiędzy zmiennymi wejściowymi i wyjściowymi. Model regresyjny przedstawia kompletny wieloczynnikowy eksperyment obejmujący podstawowe zmienne oraz ich interakcje. Słowa kluczowe: testy mechaniczne, napięcie, taśma przenośnikowa, metoda DOE. 1. Introduction Belt conveyor system is a high-power conveyance system broadly applied in practice [16]. The main reason of such broad application is its structural and economic adaptability [26]. According to [14, 25], a belt conveyor represents the most cost-effective solution in the loose material transportation. It can be broadly used in the fields, such as coal mining, ports, chemical industry, electric energy, metallurgy, ar- chitecture, and food supplies [13]. Requirements demanded by pro- duction plants regarding minerals are currently rising, which results in the increasing traffic intensity of material flows in mining companies within the transportation of bulk solid materials. Bulk materials are currently transported mainly by trucks. Therefore, an alternative to this kind of transport must be searched [21, 23]. Transportation solu- tion is offered by the continuous belt conveyor system with the crush- ing carried out directly in the quarry, using portable crushers [6]. Large scale belt conveyor is a key (one of the most important) de- vice to transport bulk-solid material for long distance at high rates [5]. Belt conveyors are complex systems with drive groups as function- ally very important components [15]. For belt conveyors, the trans- port task can be defined as a process whose purpose is to transport the set quantity of handled material within a defined time between the set loading and offloading locations [12]. Due to the fact that a conveyor belt, as a carrying and tractive element, represents the most important part of a belt conveyor, it is essential to reduce the costs of manufacture and maintenance thereof. Maintenance cost reduction can be achieved by improvements in util- ity properties of conveyor belts [16]. Conveyor belt properties sig- nificantly affect the reliability of the entire belt conveyor system. Insufficient strength of a conveyor belt can cause its rupture and sub- sequent downtime due to repair and replacement thereof. Rupture of a conveyor belt represents unacceptable risk in the operation of a belt conveyor system and [3] classify it as unsystematic risk in an under- ground mine plant. During the operation, a conveyor belt is affected by various stress- es that cause its damage and wear-out [8]. Awareness of mechanical properties of conveyor belts is very important for a smooth opera- tion of belt conveyors [24]. Requirements regarding conveyor belts depend on the method of their use; therefore, entire belt conveyor, as well as its individual components, is subject to compulsory tests. Re- quired properties of conveyor belts are identified by tests determined by standards and technical or technological regulations. According to Hardygora [10] and Taraba [22] tests of conveyor belts can be divided into three groups: standard tests, certification tests and non-standard tests. The first group includes tests of physi- comechanical properties for their compliance with the standards in force. The second group comprises certification tests on belts required for permitting the latter to be operated in underground mines. The third group embraces non-standard tests – specialist tests performed on special test stands, usually not covered by standards but concern- ing parameters important for the operation of belts. Non-standard tests include, for example, determination of the im- pact resistance of a conveyor belt. The methodology of testing the impact resistance using a special testing equipment is described by authors [7] and determination of impact resistance on the basis of ex- perimental measurements, with the results evaluation using the regres- sion analysis, is described by authors [1, 4]. By using DOE methods in the examining stress conveyor belts in relation to their resistance to breakdown deal works [2, 9]. Conveyor belt tests carried out within the experimental research and the results presented in this article can be classified as the group 1st tests, according to [10]. In addition to the results obtained by standard testing, the article presents a new approach to the evalua-
Transcript of Determination the effect of factors affecting the tensile ... · PDF fileocena wpływu...
Eksploatacja i NiEzawodNosc – MaiNtENaNcE aNd REliability Vol.18, No. 1, 2016110
Article citation info:Ambriško Ľ, mArAsová D, GrenDel P. Determination the effect of factors affecting the tensile strength of fabric conveyor belts. eksplo-atacja i niezawodnosc – maintenance and reliability 2016; 18 (1): 110–116, http://dx.doi.org/10.17531/ein.2016.1.14.
Ľubomír AmbriškoDaniela mArAsováPeter GrenDel
Determination the effect of factors affecting the tensile strength of fabric conveyor belts
ocena wpływu czynników na wytrzymałość na rozciąganie taśm przenośnikowych tkaninowo – gumowych
The Design of experiment (DOE) method was used in this paper to rubber conveyor belt tension testing. Using DOE method were from experimentally obtained data established effects of factors and interactions that affect the value of the measured strength and also were determined regression models, which apply input and output variables to the relation. The regression model presents the complete multifactor experiment that contains main factors and interactions.
Keywords: mechanical testing, tension, conveyor belt, DOE method (Design of Experiments).
Metoda planowania eksperymentu (DOE) w artykule użyta do testowania napięcia taśm przenośnikowych tkaninowo – gumo-wych. Korzystanie z metody DOE były ustalonych poszczególnych czynników oraz ich interakcji ze danych uzyskanych w sposób doświadczalny. Czynniki i interakcje wpływające na wartość zmierzonej wytrzymałośći, a także określono modele regresji, wy-kazającego związki pomiędzy zmiennymi wejściowymi i wyjściowymi. Model regresyjny przedstawia kompletny wieloczynnikowy eksperyment obejmujący podstawowe zmienne oraz ich interakcje.
Słowa kluczowe: testy mechaniczne, napięcie, taśma przenośnikowa, metoda DOE.
1. Introduction
Belt conveyor system is a high-power conveyance system broadly applied in practice [16]. The main reason of such broad application is its structural and economic adaptability [26]. According to [14, 25], a belt conveyor represents the most cost-effective solution in the loose material transportation. It can be broadly used in the fields, such as coal mining, ports, chemical industry, electric energy, metallurgy, ar-chitecture, and food supplies [13]. Requirements demanded by pro-duction plants regarding minerals are currently rising, which results in the increasing traffic intensity of material flows in mining companies within the transportation of bulk solid materials. Bulk materials are currently transported mainly by trucks. Therefore, an alternative to this kind of transport must be searched [21, 23]. Transportation solu-tion is offered by the continuous belt conveyor system with the crush-ing carried out directly in the quarry, using portable crushers [6].
Large scale belt conveyor is a key (one of the most important) de-vice to transport bulk-solid material for long distance at high rates [5]. Belt conveyors are complex systems with drive groups as function-ally very important components [15]. For belt conveyors, the trans-port task can be defined as a process whose purpose is to transport the set quantity of handled material within a defined time between the set loading and offloading locations [12].
Due to the fact that a conveyor belt, as a carrying and tractive element, represents the most important part of a belt conveyor, it is essential to reduce the costs of manufacture and maintenance thereof. Maintenance cost reduction can be achieved by improvements in util-ity properties of conveyor belts [16]. Conveyor belt properties sig-nificantly affect the reliability of the entire belt conveyor system. Insufficient strength of a conveyor belt can cause its rupture and sub-sequent downtime due to repair and replacement thereof. Rupture of a conveyor belt represents unacceptable risk in the operation of a belt
conveyor system and [3] classify it as unsystematic risk in an under-ground mine plant.
During the operation, a conveyor belt is affected by various stress-es that cause its damage and wear-out [8]. Awareness of mechanical properties of conveyor belts is very important for a smooth opera-tion of belt conveyors [24]. Requirements regarding conveyor belts depend on the method of their use; therefore, entire belt conveyor, as well as its individual components, is subject to compulsory tests. Re-quired properties of conveyor belts are identified by tests determined by standards and technical or technological regulations.
According to Hardygora [10] and Taraba [22] tests of conveyor belts can be divided into three groups: standard tests, certification tests and non-standard tests. The first group includes tests of physi-comechanical properties for their compliance with the standards in force. The second group comprises certification tests on belts required for permitting the latter to be operated in underground mines. The third group embraces non-standard tests – specialist tests performed on special test stands, usually not covered by standards but concern-ing parameters important for the operation of belts.
Non-standard tests include, for example, determination of the im-pact resistance of a conveyor belt. The methodology of testing the impact resistance using a special testing equipment is described by authors [7] and determination of impact resistance on the basis of ex-perimental measurements, with the results evaluation using the regres-sion analysis, is described by authors [1, 4]. By using DOE methods in the examining stress conveyor belts in relation to their resistance to breakdown deal works [2, 9].
Conveyor belt tests carried out within the experimental research and the results presented in this article can be classified as the group 1st tests, according to [10]. In addition to the results obtained by standard testing, the article presents a new approach to the evalua-
Eksploatacja i NiEzawodNosc – MaiNtENaNcE aNd REliability Vol.18, No. 1, 2016 111
sciENcE aNd tEchNology
tion thereof, with the determination of the impact of the selected factors on the tensile strength of a conveyor belt.
2. Materials and experimental proce-dure
2.1. Experimental material
A belt conveyor as a composite consists of several materials. Fabric conveyor belts usually consist of a wear resistant top layer (‘top cover’), a fabric carcass providing tensile strength, skim layers for adhesion between rubber and carcass, and a bottom layer (‘bottom cover’) to cover the carcass and provide sufficient friction to the drive pulley [18].
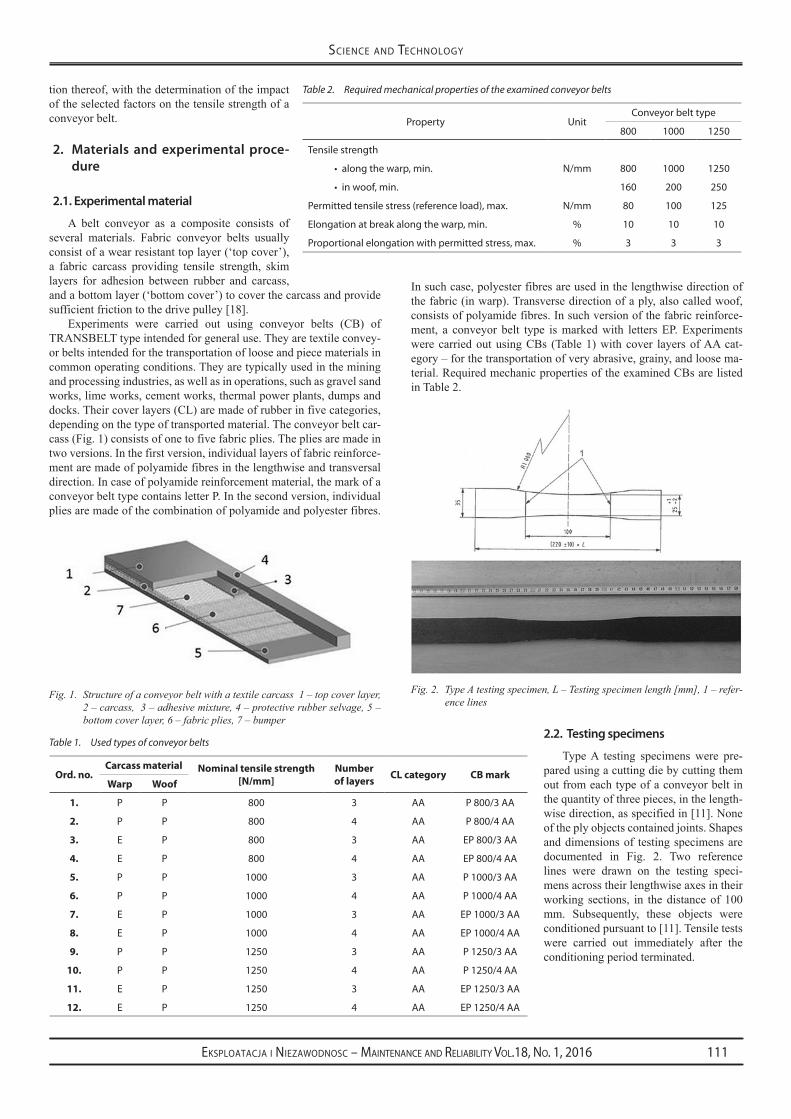
Experiments were carried out using conveyor belts (CB) of TRANSBELT type intended for general use. They are textile convey-or belts intended for the transportation of loose and piece materials in common operating conditions. They are typically used in the mining and processing industries, as well as in operations, such as gravel sand works, lime works, cement works, thermal power plants, dumps and docks. Their cover layers (CL) are made of rubber in five categories, depending on the type of transported material. The conveyor belt car-cass (Fig. 1) consists of one to five fabric plies. The plies are made in two versions. In the first version, individual layers of fabric reinforce-ment are made of polyamide fibres in the lengthwise and transversal direction. In case of polyamide reinforcement material, the mark of a conveyor belt type contains letter P. In the second version, individual plies are made of the combination of polyamide and polyester fibres.
In such case, polyester fibres are used in the lengthwise direction of the fabric (in warp). Transverse direction of a ply, also called woof, consists of polyamide fibres. In such version of the fabric reinforce-ment, a conveyor belt type is marked with letters EP. Experiments were carried out using CBs (Table 1) with cover layers of AA cat-egory – for the transportation of very abrasive, grainy, and loose ma-terial. Required mechanic properties of the examined CBs are listed in Table 2.
2.2. Testing specimens
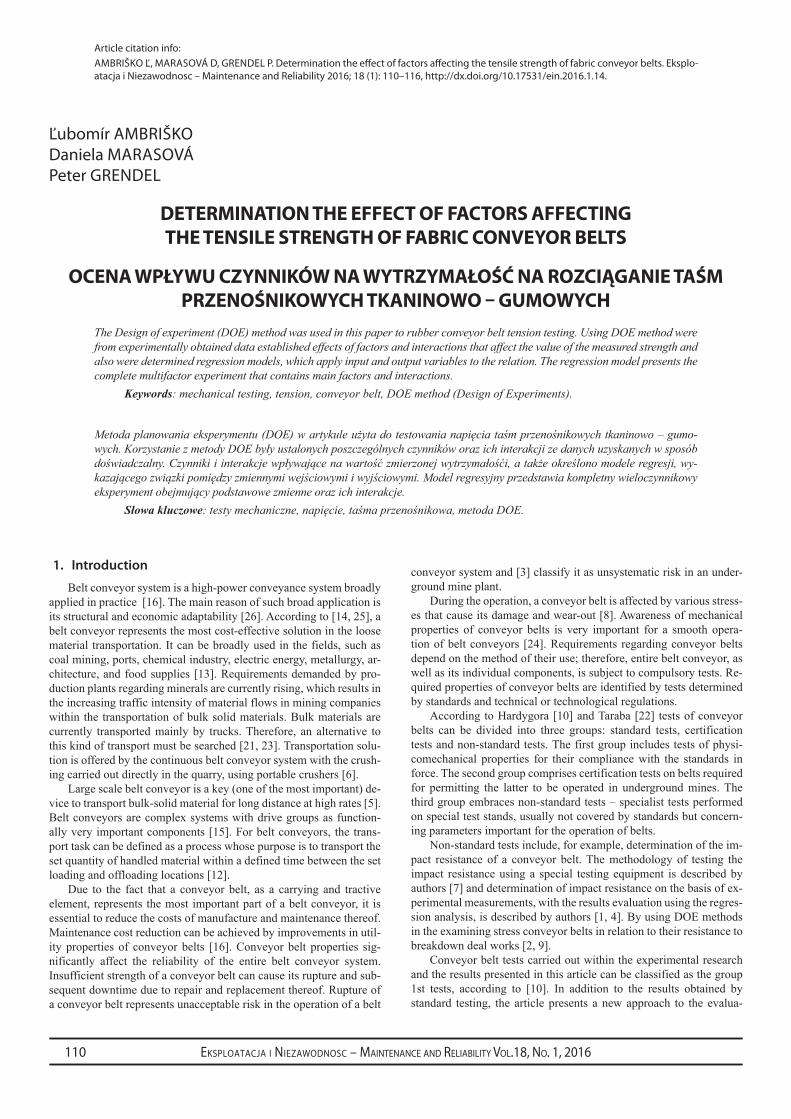
Type A testing specimens were pre-pared using a cutting die by cutting them out from each type of a conveyor belt in the quantity of three pieces, in the length-wise direction, as specified in [11]. None of the ply objects contained joints. Shapes and dimensions of testing specimens are documented in Fig. 2. Two reference lines were drawn on the testing speci-mens across their lengthwise axes in their working sections, in the distance of 100 mm. Subsequently, these objects were conditioned pursuant to [11]. Tensile tests were carried out immediately after the conditioning period terminated.
Table 1. Used types of conveyor belts
ord. no.carcass material nominal tensile strength
[n/mm]number of layers cl category cb mark
warp woof
1. P P 800 3 AA P 800/3 AA
2. P P 800 4 AA P 800/4 AA
3. e P 800 3 AA eP 800/3 AA
4. e P 800 4 AA eP 800/4 AA
5. P P 1000 3 AA P 1000/3 AA
6. P P 1000 4 AA P 1000/4 AA
7. e P 1000 3 AA eP 1000/3 AA
8. e P 1000 4 AA eP 1000/4 AA
9. P P 1250 3 AA P 1250/3 AA
10. P P 1250 4 AA P 1250/4 AA
11. e P 1250 3 AA eP 1250/3 AA
12. e P 1250 4 AA eP 1250/4 AA
Fig. 1. Structure of a conveyor belt with a textile carcass 1 – top cover layer, 2 – carcass, 3 – adhesive mixture, 4 – protective rubber selvage, 5 – bottom cover layer, 6 – fabric plies, 7 – bumper
Fig. 2. Type A testing specimen, L – Testing specimen length [mm], 1 – refer-ence lines
Table 2. Required mechanical properties of the examined conveyor belts
Property UnitConveyor belt type
800 1000 1250
Tensile strength
n/mmalong the warp, min.• 800 1000 1250
in woof, min.• 160 200 250
Permitted tensile stress (reference load), max. n/mm 80 100 125
elongation at break along the warp, min. % 10 10 10
Proportional elongation with permitted stress, max. % 3 3 3
Eksploatacja i NiEzawodNosc – MaiNtENaNcE aNd REliability Vol.18, No. 1, 2016112
sciENcE aNd tEchNology
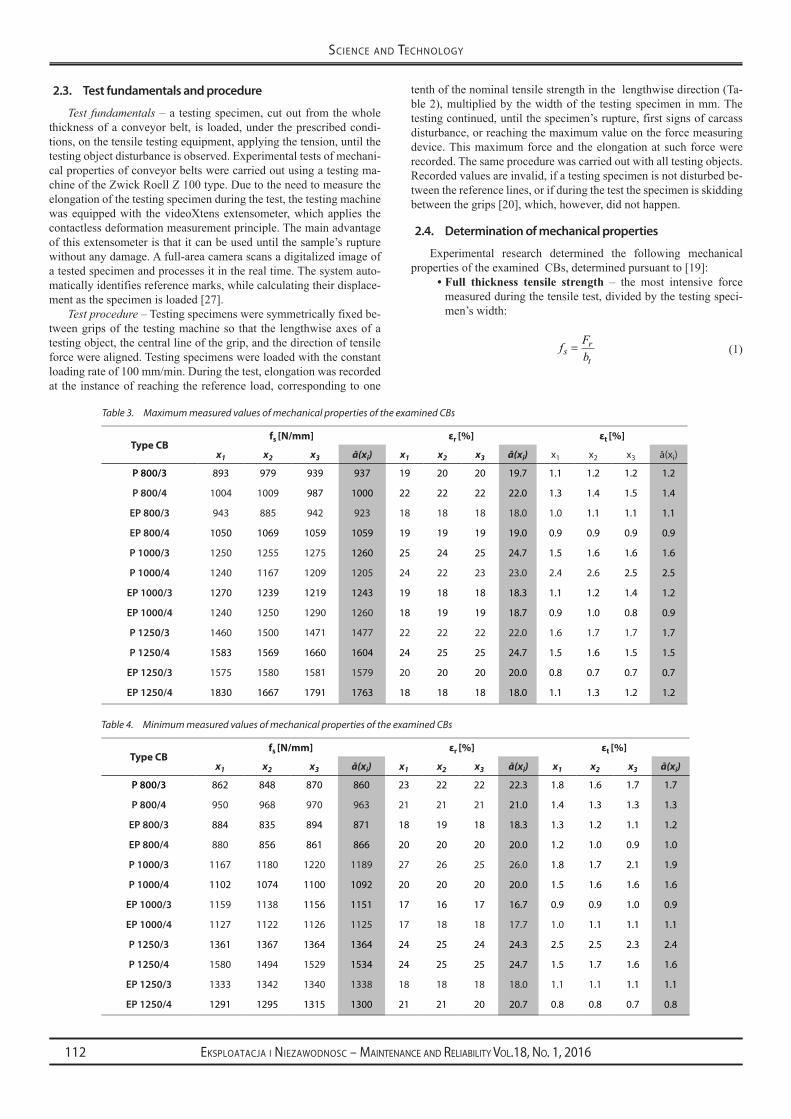
2.3. Test fundamentals and procedure
Test fundamentals – a testing specimen, cut out from the whole thickness of a conveyor belt, is loaded, under the prescribed condi-tions, on the tensile testing equipment, applying the tension, until the testing object disturbance is observed. Experimental tests of mechani-cal properties of conveyor belts were carried out using a testing ma-chine of the Zwick Roell Z 100 type. Due to the need to measure the elongation of the testing specimen during the test, the testing machine was equipped with the videoXtens extensometer, which applies the contactless deformation measurement principle. The main advantage of this extensometer is that it can be used until the sample’s rupture without any damage. A full-area camera scans a digitalized image of a tested specimen and processes it in the real time. The system auto-matically identifies reference marks, while calculating their displace-ment as the specimen is loaded [27].
Test procedure – Testing specimens were symmetrically fixed be-tween grips of the testing machine so that the lengthwise axes of a testing object, the central line of the grip, and the direction of tensile force were aligned. Testing specimens were loaded with the constant loading rate of 100 mm/min. During the test, elongation was recorded at the instance of reaching the reference load, corresponding to one
tenth of the nominal tensile strength in the lengthwise direction (Ta-ble 2), multiplied by the width of the testing specimen in mm. The testing continued, until the specimen’s rupture, first signs of carcass disturbance, or reaching the maximum value on the force measuring device. This maximum force and the elongation at such force were recorded. The same procedure was carried out with all testing objects. Recorded values are invalid, if a testing specimen is not disturbed be-tween the reference lines, or if during the test the specimen is skidding between the grips [20], which, however, did not happen.
2.4. Determination of mechanical properties
Experimental research determined the following mechanical properties of the examined CBs, determined pursuant to [19]:
Full thickness tensile strength• – the most intensive force measured during the tensile test, divided by the testing speci-men’s width:
f Fbs
r
t= (1)
Table 3. Maximum measured values of mechanical properties of the examined CBs
type cbfs [n/mm] εr [%] εt [%]
x1 x2 x3 ā(xi) x1 x2 x3 ā(xi) x1 x2 x3 ā(xi)
P 800/3 893 979 939 937 19 20 20 19.7 1.1 1.2 1.2 1.2
P 800/4 1004 1009 987 1000 22 22 22 22.0 1.3 1.4 1.5 1.4
EP 800/3 943 885 942 923 18 18 18 18.0 1.0 1.1 1.1 1.1
EP 800/4 1050 1069 1059 1059 19 19 19 19.0 0.9 0.9 0.9 0.9
P 1000/3 1250 1255 1275 1260 25 24 25 24.7 1.5 1.6 1.6 1.6
P 1000/4 1240 1167 1209 1205 24 22 23 23.0 2.4 2.6 2.5 2.5
EP 1000/3 1270 1239 1219 1243 19 18 18 18.3 1.1 1.2 1.4 1.2
EP 1000/4 1240 1250 1290 1260 18 19 19 18.7 0.9 1.0 0.8 0.9
P 1250/3 1460 1500 1471 1477 22 22 22 22.0 1.6 1.7 1.7 1.7
P 1250/4 1583 1569 1660 1604 24 25 25 24.7 1.5 1.6 1.5 1.5
EP 1250/3 1575 1580 1581 1579 20 20 20 20.0 0.8 0.7 0.7 0.7
EP 1250/4 1830 1667 1791 1763 18 18 18 18.0 1.1 1.3 1.2 1.2
Table 4. Minimum measured values of mechanical properties of the examined CBs
type cbfs [n/mm] εr [%] εt [%]
x1 x2 x3 ā(xi) x1 x2 x3 ā(xi) x1 x2 x3 ā(xi)
P 800/3 862 848 870 860 23 22 22 22.3 1.8 1.6 1.7 1.7
P 800/4 950 968 970 963 21 21 21 21.0 1.4 1.3 1.3 1.3
EP 800/3 884 835 894 871 18 19 18 18.3 1.3 1.2 1.1 1.2
EP 800/4 880 856 861 866 20 20 20 20.0 1.2 1.0 0.9 1.0
P 1000/3 1167 1180 1220 1189 27 26 25 26.0 1.8 1.7 2.1 1.9
P 1000/4 1102 1074 1100 1092 20 20 20 20.0 1.5 1.6 1.6 1.6
EP 1000/3 1159 1138 1156 1151 17 16 17 16.7 0.9 0.9 1.0 0.9
EP 1000/4 1127 1122 1126 1125 17 18 18 17.7 1.0 1.1 1.1 1.1
P 1250/3 1361 1367 1364 1364 24 25 24 24.3 2.5 2.5 2.3 2.4
P 1250/4 1580 1494 1529 1534 24 25 25 24.7 1.5 1.7 1.6 1.6
EP 1250/3 1333 1342 1340 1338 18 18 18 18.0 1.1 1.1 1.1 1.1
EP 1250/4 1291 1295 1315 1300 21 21 20 20.7 0.8 0.8 0.7 0.8
Eksploatacja i NiEzawodNosc – MaiNtENaNcE aNd REliability Vol.18, No. 1, 2016 113
sciENcE aNd tEchNology
where fs – tensile strength [N/mm],Fr – sample load force at rupture [N],bt – specimen width [mm].
The resulting value of the tensile strength is the arithmetic average of the values for three testing objects in the lengthwise direction.
Elongation at break• – elongation at the maximum force ex-pressed as the percentage gain in the distance between two reference lines
εrL L
L=
−⋅
( )2 1
1100 (2)
where εr – elongation at break [%],L1 – distance between reference lines prior to loading [mm],L2 – distance between reference lines at specimen’s distur-bance [mm].
Elongation at the reference load• – is expressed as the per-centage gain in the distance between two reference lines with the reference force:
εtRL L
L=
−⋅
( )1
1100 (3)
where εt – elongation at the reference load [%],LR – distance between reference lines with the reference load of the testing specimen [mm],L1 – distance between reference lines prior to loading [mm].
The resulting value of the elongation at break and the elongation at the reference load is the arithmetic average of values for three test-ing objects in the lengthwise direction.
For each examined type of a conveyor belt, we tested the testing objects marked as xi, where i = 1, 2, 3. Results of the measurements are listed in Tables 3 and 4.
3. Design and evaluation of experiment
In this work, we monitored the impact of three main factors (Ta-ble 5): nominal strength, i.e. specified minimum value of the tensile strength (factor A), type of carcass (factor B), and number of plies (factor C). Our task was to determine which of the factors, or which of their interactions, have a significant impact on the response, i.e. the tensile strength of a conveyor belt.
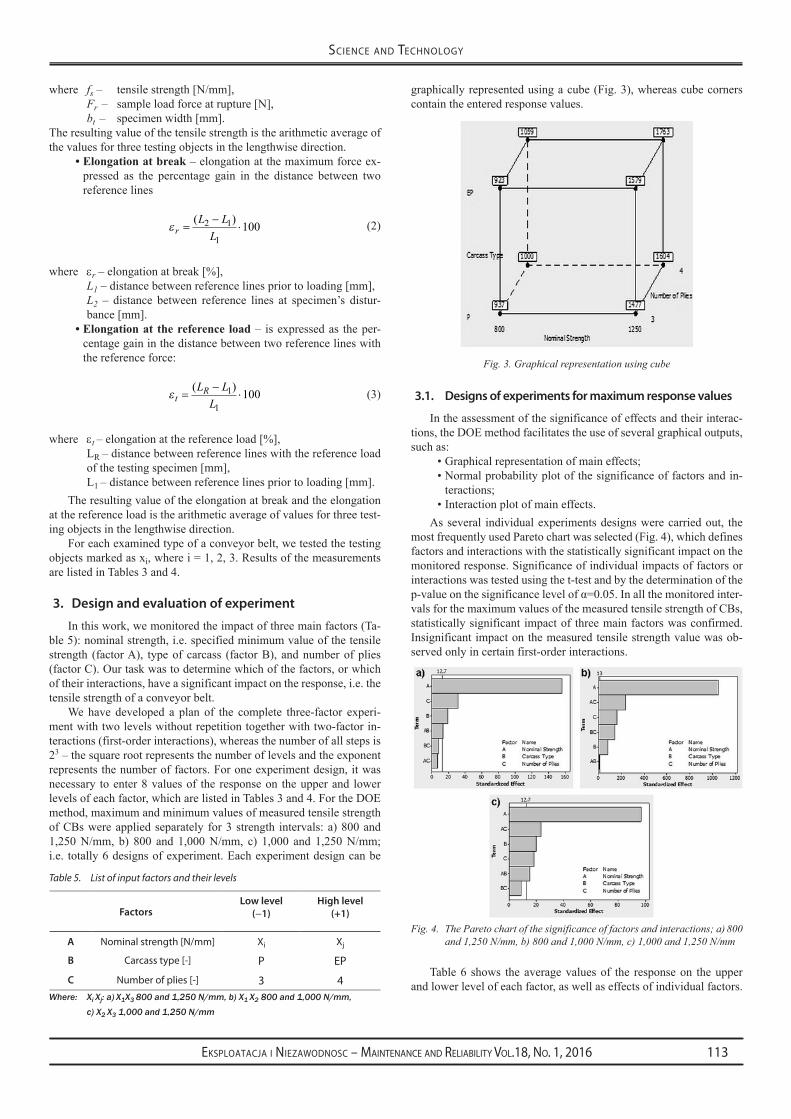
We have developed a plan of the complete three-factor experi-ment with two levels without repetition together with two-factor in-teractions (first-order interactions), whereas the number of all steps is 23 – the square root represents the number of levels and the exponent represents the number of factors. For one experiment design, it was necessary to enter 8 values of the response on the upper and lower levels of each factor, which are listed in Tables 3 and 4. For the DOE method, maximum and minimum values of measured tensile strength of CBs were applied separately for 3 strength intervals: a) 800 and 1,250 N/mm, b) 800 and 1,000 N/mm, c) 1,000 and 1,250 N/mm; i.e. totally 6 designs of experiment. Each experiment design can be
graphically represented using a cube (Fig. 3), whereas cube corners contain the entered response values.
3.1. Designs of experiments for maximum response values
In the assessment of the significance of effects and their interac-tions, the DOE method facilitates the use of several graphical outputs, such as:
Graphical representation of main effects; •Normal probability plot of the significance of factors and in-•teractions; Interaction plot of main effects. •
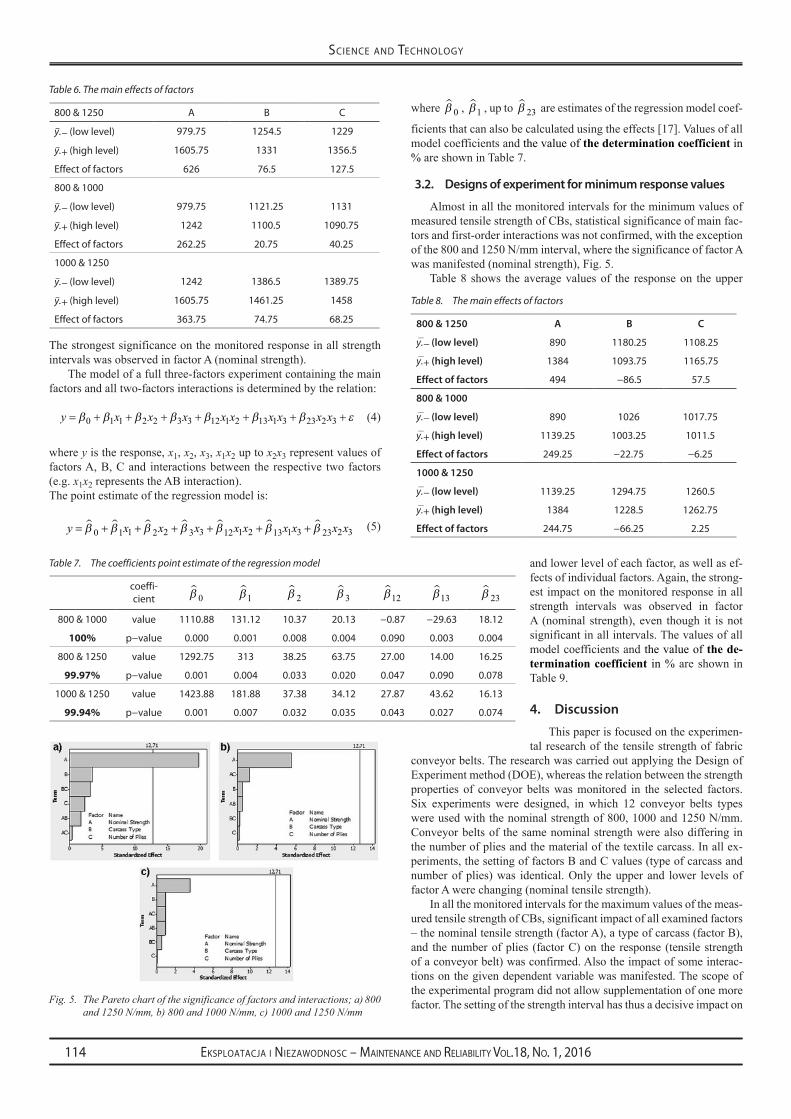
As several individual experiments designs were carried out, the most frequently used Pareto chart was selected (Fig. 4), which defines factors and interactions with the statistically significant impact on the monitored response. Significance of individual impacts of factors or interactions was tested using the t-test and by the determination of the p-valueonthesignificancelevelofα=0.05.Inallthemonitoredinter-vals for the maximum values of the measured tensile strength of CBs, statistically significant impact of three main factors was confirmed. Insignificant impact on the measured tensile strength value was ob-served only in certain first-order interactions.
Table 6 shows the average values of the response on the upper and lower level of each factor, as well as effects of individual factors.
Table 5. List of input factors and their levels
FactorsLow level
(−1)High level
(+1)
A nominal strength [n/mm] Xi Xj
B Carcass type [-] P eP
C number of plies [-] 3 4Where: Xi Xj: a) X1X3 800 and 1,250 N/mm, b) X1 X2 800 and 1,000 N/mm,
c) X2 X3 1,000 and 1,250 N/mm
Fig. 3. Graphical representation using cube
Fig. 4. The Pareto chart of the significance of factors and interactions; a) 800 and 1,250 N/mm, b) 800 and 1,000 N/mm, c) 1,000 and 1,250 N/mm
Eksploatacja i NiEzawodNosc – MaiNtENaNcE aNd REliability Vol.18, No. 1, 2016114
sciENcE aNd tEchNology
The strongest significance on the monitored response in all strength intervals was observed in factor A (nominal strength).
The model of a full three-factors experiment containing the main factors and all two-factors interactions is determined by the relation:
y x x x x x x x x x= + + + + + + +β β β β β β β ε0 1 1 2 2 3 3 12 1 2 13 1 3 23 2 3 (4)
where y is the response, x1, x2, x3, x1x2 up to x2x3 represent values of factors A, B, C and interactions between the respective two factors (e.g. x1x2 represents the AB interaction). The point estimate of the regression model is:
y x x x x x x x x x= + + + + + +β β β β β β β
0 1 1 2 2 3 3 12 1 2 13 1 3 23 2 3 (5)
where β0 , β1 , up to β 23 are estimates of the regression model coef-
ficients that can also be calculated using the effects [17]. Values of all model coefficients and the value of the determination coefficient in % are shown in Table 7.
3.2. Designs of experiment for minimum response values
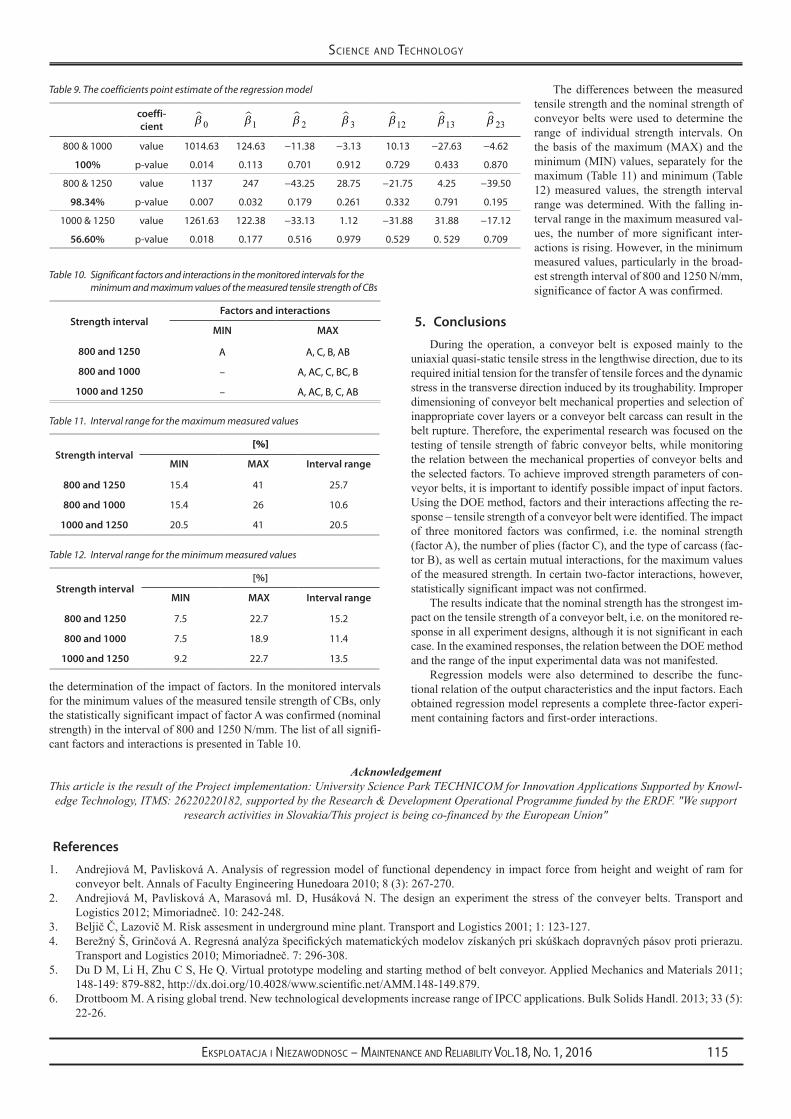
Almost in all the monitored intervals for the minimum values of measured tensile strength of CBs, statistical significance of main fac-tors and first-order interactions was not confirmed, with the exception of the 800 and 1250 N/mm interval, where the significance of factor A was manifested (nominal strength), Fig. 5.
Table 8 shows the average values of the response on the upper
and lower level of each factor, as well as ef-fects of individual factors. Again, the strong-est impact on the monitored response in all strength intervals was observed in factor A (nominal strength), even though it is not significant in all intervals. The values of all model coefficients and the value of the de-termination coefficient in % are shown in Table 9.
4. Discussion
This paper is focused on the experimen-tal research of the tensile strength of fabric
conveyor belts. The research was carried out applying the Design of Experiment method (DOE), whereas the relation between the strength properties of conveyor belts was monitored in the selected factors. Six experiments were designed, in which 12 conveyor belts types were used with the nominal strength of 800, 1000 and 1250 N/mm. Conveyor belts of the same nominal strength were also differing in the number of plies and the material of the textile carcass. In all ex-periments, the setting of factors B and C values (type of carcass and number of plies) was identical. Only the upper and lower levels of factor A were changing (nominal tensile strength).
In all the monitored intervals for the maximum values of the meas-ured tensile strength of CBs, significant impact of all examined factors – the nominal tensile strength (factor A), a type of carcass (factor B), and the number of plies (factor C) on the response (tensile strength of a conveyor belt) was confirmed. Also the impact of some interac-tions on the given dependent variable was manifested. The scope of the experimental program did not allow supplementation of one more factor. The setting of the strength interval has thus a decisive impact on
Table 6. The main effects of factors
800 & 1250 A b C
y̅.− (low level) 979.75 1254.5 1229
y̅.+ (high level) 1605.75 1331 1356.5
effect of factors 626 76.5 127.5
800 & 1000
y̅.− (low level) 979.75 1121.25 1131
y̅.+ (high level) 1242 1100.5 1090.75
effect of factors 262.25 20.75 40.25
1000 & 1250
y̅.− (low level) 1242 1386.5 1389.75
y̅.+ (high level) 1605.75 1461.25 1458
effect of factors 363.75 74.75 68.25
Table 7. The coefficients point estimate of the regression model
coeffi-cient β0 β1 β 2 β3 β12 β13 β 23
800 & 1000 value 1110.88 131.12 10.37 20.13 −0.87 −29.63 18.12
100% p−value 0.000 0.001 0.008 0.004 0.090 0.003 0.004
800 & 1250 value 1292.75 313 38.25 63.75 27.00 14.00 16.25
99.97% p−value 0.001 0.004 0.033 0.020 0.047 0.090 0.078
1000 & 1250 value 1423.88 181.88 37.38 34.12 27.87 43.62 16.13
99.94% p−value 0.001 0.007 0.032 0.035 0.043 0.027 0.074
Fig. 5. The Pareto chart of the significance of factors and interactions; a) 800 and 1250 N/mm, b) 800 and 1000 N/mm, c) 1000 and 1250 N/mm
Table 8. The main effects of factors
800 & 1250 A B C
y̅.− (low level) 890 1180.25 1108.25
y̅.+ (high level) 1384 1093.75 1165.75
Effect of factors 494 −86.5 57.5
800 & 1000
y̅.− (low level) 890 1026 1017.75
y̅.+ (high level) 1139.25 1003.25 1011.5
Effect of factors 249.25 −22.75 −6.25
1000 & 1250
y̅.− (low level) 1139.25 1294.75 1260.5
y̅.+ (high level) 1384 1228.5 1262.75
Effect of factors 244.75 −66.25 2.25
Eksploatacja i NiEzawodNosc – MaiNtENaNcE aNd REliability Vol.18, No. 1, 2016 115
sciENcE aNd tEchNology
the determination of the impact of factors. In the monitored intervals for the minimum values of the measured tensile strength of CBs, only the statistically significant impact of factor A was confirmed (nominal strength) in the interval of 800 and 1250 N/mm. The list of all signifi-cant factors and interactions is presented in Table 10.
The differences between the measured tensile strength and the nominal strength of conveyor belts were used to determine the range of individual strength intervals. On the basis of the maximum (MAX) and the minimum (MIN) values, separately for the maximum (Table 11) and minimum (Table 12) measured values, the strength interval range was determined. With the falling in-terval range in the maximum measured val-ues, the number of more significant inter-actions is rising. However, in the minimum measured values, particularly in the broad-est strength interval of 800 and 1250 N/mm, significance of factor A was confirmed.
5. Conclusions
During the operation, a conveyor belt is exposed mainly to the uniaxial quasi-static tensile stress in the lengthwise direction, due to its required initial tension for the transfer of tensile forces and the dynamic stress in the transverse direction induced by its troughability. Improper dimensioning of conveyor belt mechanical properties and selection of inappropriate cover layers or a conveyor belt carcass can result in the belt rupture. Therefore, the experimental research was focused on the testing of tensile strength of fabric conveyor belts, while monitoring the relation between the mechanical properties of conveyor belts and the selected factors. To achieve improved strength parameters of con-veyor belts, it is important to identify possible impact of input factors. Using the DOE method, factors and their interactions affecting the re-sponse – tensile strength of a conveyor belt were identified. The impact of three monitored factors was confirmed, i.e. the nominal strength (factor A), the number of plies (factor C), and the type of carcass (fac-tor B), as well as certain mutual interactions, for the maximum values of the measured strength. In certain two-factor interactions, however, statistically significant impact was not confirmed.
The results indicate that the nominal strength has the strongest im-pact on the tensile strength of a conveyor belt, i.e. on the monitored re-sponse in all experiment designs, although it is not significant in each case. In the examined responses, the relation between the DOE method and the range of the input experimental data was not manifested.
Regression models were also determined to describe the func-tional relation of the output characteristics and the input factors. Each obtained regression model represents a complete three-factor experi-ment containing factors and first-order interactions.
Table 9. The coefficients point estimate of the regression model
coeffi-cient β0 β1 β 2 β3 β12 β13 β 23
800 & 1000 value 1014.63 124.63 −11.38 −3.13 10.13 −27.63 −4.62
100% p-value 0.014 0.113 0.701 0.912 0.729 0.433 0.870
800 & 1250 value 1137 247 −43.25 28.75 −21.75 4.25 −39.50
98.34% p-value 0.007 0.032 0.179 0.261 0.332 0.791 0.195
1000 & 1250 value 1261.63 122.38 −33.13 1.12 −31.88 31.88 −17.12
56.60% p-value 0.018 0.177 0.516 0.979 0.529 0. 529 0.709
Table 10. Significant factors and interactions in the monitored intervals for the minimum and maximum values of the measured tensile strength of CBs
Strength intervalFactors and interactions
MIN MAX
800 and 1250 A A, C, b, Ab
800 and 1000 – A, AC, C, bC, b
1000 and 1250 – A, AC, b, C, Ab
Table 11. Interval range for the maximum measured values
Strength interval [%]
MIN MAX Interval range
800 and 1250 15.4 41 25.7
800 and 1000 15.4 26 10.6
1000 and 1250 20.5 41 20.5
Table 12. Interval range for the minimum measured values
Strength interval[%]
MIN MAX Interval range
800 and 1250 7.5 22.7 15.2
800 and 1000 7.5 18.9 11.4
1000 and 1250 9.2 22.7 13.5
References
1. Andrejiová M, Pavlisková A. Analysis of regression model of functional dependency in impact force from height and weight of ram for conveyor belt. Annals of Faculty Engineering Hunedoara 2010; 8 (3): 267-270.
2. Andrejiová M, Pavlisková A, Marasová ml. D, Husáková N. The design an experiment the stress of the conveyer belts. Transport and Logistics2012;Mimoriadneč.10:242-248.
3. BeljičČ,LazovičM.Riskassesmentinundergroundmineplant.TransportandLogistics2001;1:123-127.4. BerežnýŠ,GrinčováA.Regresnáanalýzašpecifickýchmatematickýchmodelovzískanýchpriskúškachdopravnýchpásovprotiprierazu.
TransportandLogistics2010;Mimoriadneč.7:296-308.5. Du D M, Li H, Zhu C S, He Q. Virtual prototype modeling and starting method of belt conveyor. Applied Mechanics and Materials 2011;
148-149:879-882,http://dx.doi.org/10.4028/www.scientific.net/AMM.148-149.879.6. Drottboom M. A rising global trend. New technological developments increase range of IPCC applications. Bulk Solids Handl. 2013; 33 (5):
22-26.
AcknowledgementThis article is the result of the Project implementation: University Science Park TECHNICOM for Innovation Applications Supported by Knowl-edge Technology, ITMS: 26220220182, supported by the Research & Development Operational Programme funded by the ERDF. "We support
research activities in Slovakia/This project is being co-financed by the European Union"
Eksploatacja i NiEzawodNosc – MaiNtENaNcE aNd REliability Vol.18, No. 1, 2016116
sciENcE aNd tEchNology
7. GrinčováA,HlúbikováA,KrešákJ.Metodikaskúšaniadopravnýchpásovpriprieraze.TransportandLogistics2008;Mimoriadneč.5:209-213.8. GrinčováA,MarasováD.Experimentalresearchandmathematicalmodellingasaneffectivetoolofassessingfailureofconveyorbelts.
Eksploatacja i Niezawodnosc - Maintenance and Reliability 2014; 16 (2): 229-235. 9. GrujicM,AndrejiovaM,MarasovaD,GrendelP.UsingtheDOEmethodbyexperimentalresearchofconveyorbeltsquality.TTEMJournal:
Technics Technologies Education Management 2013; 8 (2): 558-564. 10. Hardygora M. Trends in conveyor belt research. Transport and Logistics 2002; 3: 1-12. 11. ISO 18573: 2013, Coveyor belts - Test atmospheres and conditioning periods. 12. KulinowskiP.Simulationstudiesasthepartofanintegrateddesignprocessdealingwithbeltconveyoroperation.EksplotacjaiNiezawodnosc
– Maintenance and Reliability 2013; 15 (1): 83-88. 13. LengYF,LiuJ,ZuF.ParametricdesignonbeltconveyordrumsbasedonVBA.AdvMaterRes2010;156-157:1243-1246,http://dx.doi.
org/10.4028/www.scientific.net/AMR.156-157.1243.14. LuoX,LiT,HuB,ZhengM,PengQJ.ThemodelingandsimulatingofconveyorbeltbasedonADAMS.AdvMaterRes2012;562-564:
1451-1455,http://dx.doi.org/10.4028/www.scientific.net/AMR.562-564.1451.15. ManeskiT,JovančićP,IgnjatovićD,Milošević-MitićV,ManeskiM.Conditionandbehaviourdiagnosticsofdrivegroupsonbeltconveyors.
Eng. Failure Anal. 2012; 22: 28-37, http://dx.doi.org/10.1016/j.engfailanal.2012.01.001. 16. MarasováD.Mathematicalandexperimentalsupportforbeltconveyors.Ostrava:VŠB-TU,2013.17. MontgomeryDC.DesignandAnalysisofExperiments.NewYork:J.Wiley,2002.18. RöthemeyerF,SommerF.KautschukTechnologie,MünchenWien:CarlHanserVerlag,2006.19. STN260370:1987,Dopravnépásystextilnoukostrou-Metódyskúšaniazákladnýchvlastnosti.20. STNENISO283:2007,Textilnédopravnépásy-Pevnosťvťahuvcelejhrúbkedopravnéhopása,predĺženiepripretrhnutí(ťažnosť)a
predĺženieprireferenčnomzaťažení-Skúšobnámetóda.21. ŠaderováJ,RosováA,BindzárP,KačmáryP.Multi-Criteriaevaluation-Atoolfortheselectionofsteelwirerope.AppliedMechanicsand
Materials2014;683:33-38,http://dx.doi.org/10.4028/www.scientific.net/AMM.683.33.22. VladimírT.Themethodsofconveyorbeltbasiccharacteristicstestingandspecialtests.TransportandLogistics2004;4(6):59-68.23. Turnbull D. A game changer in Mining. IPCC and continuous mining solution are set to gain more Ground. Bulk Solids Handl. 2013; 33 (5):
16-18. 24. ValentovaH,SkrbekB,NeubertM,HanaP,Nedbal J.Mechanical andultrasoundpropertiesof conveyorbelt rubbers. in:SGEM2011
Conference Proceedings, Bulgaria, 2011: 839-844, http://dx.doi.org/10.5593/sgem2011/s03.125. 25. Wang F S. Indentation rolling resistance of conveyor belts based on Maxwell model. Adv Mater Res 2012; 479-481: 1526-1529, http://
dx.doi.org/10.4028/www.scientific.net/AMR.479-481.1526.26. Westphal H. Optimierung von Fördergurten mit Textil-Einlagen. Hebezeuge Fördermittel 1985; 25 (3): 81-85. 27. Zwick Materials Testing Machines [online]. [cit. 2015-03-30]. <http://www.zwick.com/en/products/static-materials-testing-machines.
html>
Ľubomír ambriškoDaniela marasováinstitute of logistics Faculty of mining, ecology, Process Control and GeotechnologiesTechnical University of košiceletná 9, 040 01 košice, slovakia
peter grenDelDriving school Grendelsecondary school Automobilemoldavská 2, 040 11 košice, slovakia
e-mail: [email protected], [email protected], [email protected]