City of Tempe, AZ - repository.asu.edu City of...The Community Data Project ... City of Tempe, AZ...
57
City of Tempe, AZ City of Tempe, AZ 2012 Arizona Youth Surve y 2012 Arizona Youth Surve y
Transcript of City of Tempe, AZ - repository.asu.edu City of...The Community Data Project ... City of Tempe, AZ...
City of Tempe, AZ City of Tempe, AZ
2012 Arizona Youth Survey 2012 Arizona Youth Survey
The Arizona Criminal Justice Commission�s Statistical Analysis Center thanks Bach Harrison, L.L.C. for their professionalism and contributions during the administration of the 2012 Arizona Youth Survey. In addition we thank the Arizona Department of Gaming, Office of Problem Gambling for their continued financial support of the Arizona Youth Survey. We also benefited from the expertise, guidance, and assistance provided by our colleagues at the Arizona Criminal Justice Commission and from input received from many individuals working for agencies throughout the state including:
Additionally, the success of the 2012 Arizona Youth Survey could not havebeen achieved without the support and participation of school superintendents, principals, prevention coordinators, and teachers throughoutthe state. Finally, we extend our thanks to the students who responded to thesurvey. Their thoughtful participation resulted in a wealth of information that can be used to improve the circumstances in which they live and learn.
Leslie Bloom, The Partnership for Drug Free America, AZ Affiliate
Jennifer Chambers, Arizona State University
Katherine Grzybowski, Arizona State University
Elise Mickkelsen, Office of Problem Gambling
Richard Porter, Arizona Department of Health Services
Rick Pyper, Office of Problem Gambling
Mary Sands, Arizona State University
Lisa Shumaker, Arizona Department of Health Services
Acknowledgements
Table of Contents
Lifetime and 30 Day ATOD Use
Problem Substance Use and Antisocial Behavior
Gambling
Risk and Protective Factor Profiles
Where Youth Obtained Alcohol, Marijuana, and Prescription Drugs
School Safety and Cyber-Bullying
456789
42445657
10
14
18
22
30
38
IntroductionThe Risk and Protective Factor Model of Prevention The Charts and Tables in this Report The Community Data Project The Arizona Substance Abuse Partnership School and Community Improvement Using Survey Data Data Charts:
Risk and Protective Factor Scale DefinitionsData Tables Appendix Contacts for Prevention
4
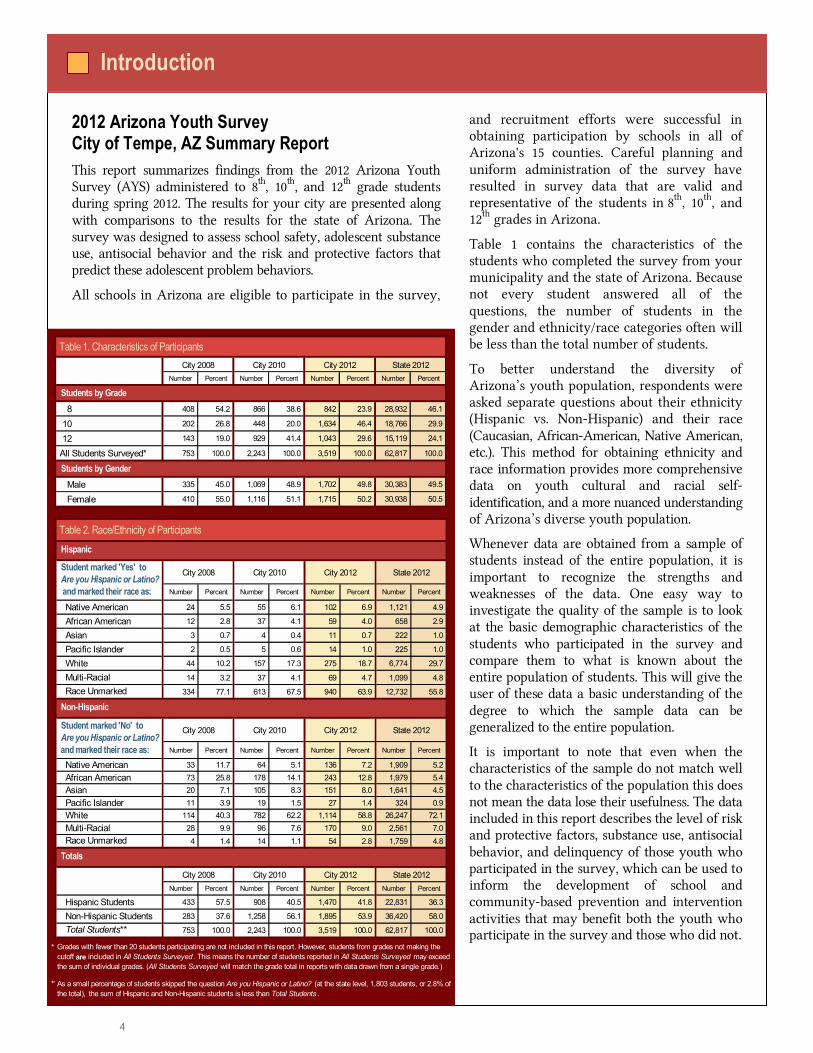
and recruitment efforts were successful in obtaining participation by schools in all of Arizona's 15 counties. Careful planning and uniform administration of the survey have resulted in survey data that are valid and representative of the students in 8th, 10th, and 12th grades in Arizona.
Table 1 contains the characteristics of the students who completed the survey from your municipality and the state of Arizona. Because not every student answered all of the questions, the number of students in the gender and ethnicity/race categories often will be less than the total number of students.
To better understand the diversity of Arizona�s youth population, respondents were asked separate questions about their ethnicity (Hispanic vs. Non-Hispanic) and their race (Caucasian, African-American, Native American, etc.). This method for obtaining ethnicity and race information provides more comprehensive data on youth cultural and racial self-identification, and a more nuanced understanding of Arizona�s diverse youth population.
Whenever data are obtained from a sample of students instead of the entire population, it is important to recognize the strengths and weaknesses of the data. One easy way to investigate the quality of the sample is to look at the basic demographic characteristics of the students who participated in the survey and compare them to what is known about the entire population of students. This will give the user of these data a basic understanding of the degree to which the sample data can be generalized to the entire population.
It is important to note that even when the characteristics of the sample do not match well to the characteristics of the population this does not mean the data lose their usefulness. The data included in this report describes the level of risk and protective factors, substance use, antisocial behavior, and delinquency of those youth who participated in the survey, which can be used to inform the development of school and community-based prevention and intervention activities that may benefit both the youth who participate in the survey and those who did not.
2012 Arizona Youth Survey City of Tempe, AZ Summary Report This report summarizes findings from the 2012 Arizona Youth Survey (AYS) administered to 8th, 10th, and 12th grade students during spring 2012. The results for your city are presented along with comparisons to the results for the state of Arizona. The survey was designed to assess school safety, adolescent substance use, antisocial behavior and the risk and protective factors that predict these adolescent problem behaviors.
All schools in Arizona are eligible to participate in the survey,
Introduction
Table 1. Characteristics of ParticipantsCity 2008 City 2010 City 2012 State 2012
Number Percent Number Percent Number Percent Number Percent
Students by Grade 8 408 54.2 866 38.6 842 23.9 28,932 46.1
10 202 26.8 448 20.0 1,634 46.4 18,766 29.9
12 143 19.0 929 41.4 1,043 29.6 15,119 24.1
All Students Surveyed* 753 100.0 2,243 100.0 3,519 100.0 62,817 100.0
Students by Gender Male 335 45.0 1,069 48.9 1,702 49.8 30,383 49.5
Female 410 55.0 1,116 51.1 1,715 50.2 30,938 50.5
Table 2. Race/Ethnicity of Participants
City 2008 City 2010 City 2012 State 2012
Number Percent Number Percent Number Percent Number Percent
24 5.5 55 6.1 102 6.9 1,121 4.9
12 2.8 37 4.1 59 4.0 658 2.9
3 0.7 4 0.4 11 0.7 222 1.0
2 0.5 5 0.6 14 1.0 225 1.0
44 10.2 157 17.3 275 18.7 6,774 29.7
14 3.2 37 4.1 69 4.7 1,099 4.8
334 77.1 613 67.5 940 63.9 12,732 55.8
City 2008 City 2010 City 2012 State 2012
Number Percent Number Percent Number Percent Number Percent
33 11.7 64 5.1 136 7.2 1,909 5.2 73 25.8 178 14.1 243 12.8 1,979 5.4 20 7.1 105 8.3 151 8.0 1,641 4.5 11 3.9 19 1.5 27 1.4 324 0.9
114 40.3 782 62.2 1,114 58.8 26,247 72.1 28 9.9 96 7.6 170 9.0 2,561 7.0 4 1.4 14 1.1 54 2.8 1,759 4.8
City 2008 City 2010 City 2012 State 2012Number Percent Number Percent Number Percent Number Percent
433 57.5 908 40.5 1,470 41.8 22,831 36.3
283 37.6 1,258 56.1 1,895 53.9 36,420 58.0
753 100.0 2,243 100.0 3,519 100.0 62,817 100.0
*
**
Grades with fewer than 20 students participating are not included in this report. However, students from grades not making the cutoff are included in All Students Surveyed. This means the number of students reported in All Students Surveyed may exceed the sum of individual grades. (All Students Surveyed will match the grade total in reports with data drawn from a single grade.)
Hispanic StudentsNon-Hispanic StudentsTotal Students**
TotalsRace Unmarked
African AmericanAsian
Native American
Pacific IslanderWhiteMulti-Racial
Student marked 'Yes' to Are you Hispanic or Latino? and marked their race as:
Native American
Student marked 'No' to Are you Hispanic or Latino? and marked their race as:
African American
As a small percentage of students skipped the question Are you Hispanic or Latino? (at the state level, 1,803 students, or 2.8% of the total), the sum of Hispanic and Non-Hispanic students is less than Total Students .
Hispanic
Pacific IslanderWhiteMulti-RacialRace Unmarked
Asian
Non-Hispanic
5
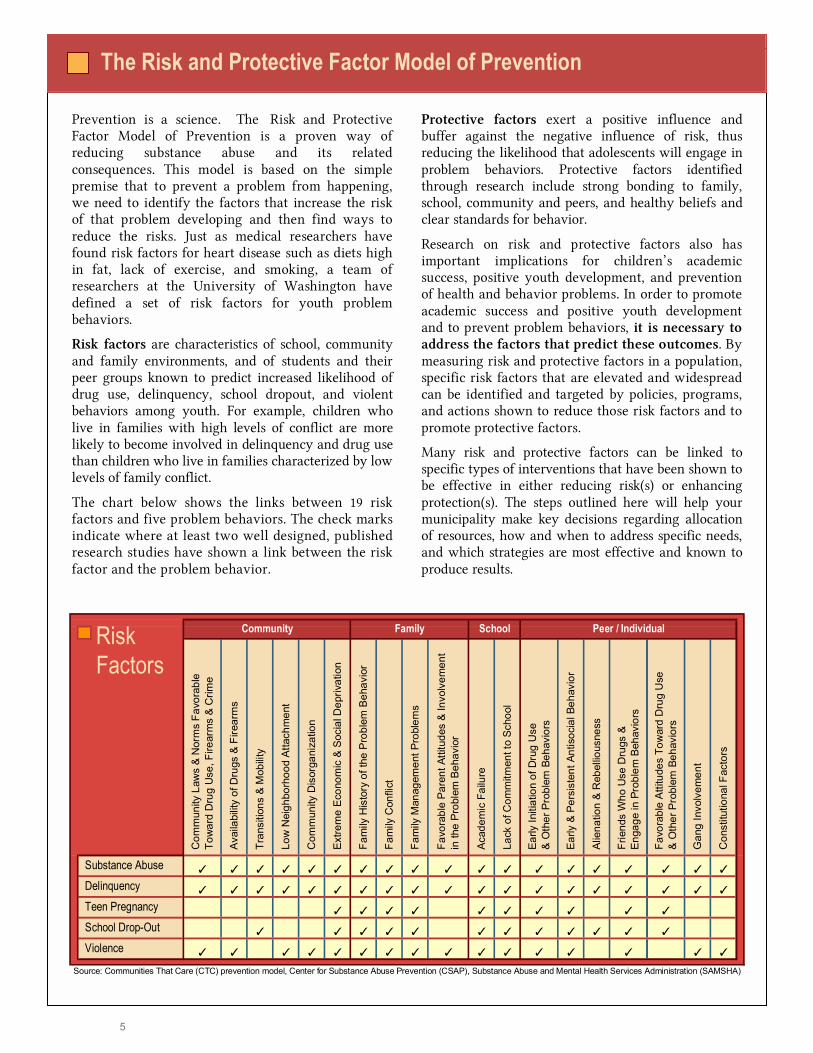
Protective factors exert a positive influence andbuffer against the negative influence of risk, thus reducing the likelihood that adolescents will engage in problem behaviors. Protective factors identified through research include strong bonding to family, school, community and peers, and healthy beliefs and clear standards for behavior.
Research on risk and protective factors also has important implications for children�s academic success, positive youth development, and prevention of health and behavior problems. In order to promote academic success and positive youth development and to prevent problem behaviors, it is necessary to address the factors that predict these outcomes. By measuring risk and protective factors in a population, specific risk factors that are elevated and widespread can be identified and targeted by policies, programs, and actions shown to reduce those risk factors and to promote protective factors.
Many risk and protective factors can be linked to specific types of interventions that have been shown to be effective in either reducing risk(s) or enhancing protection(s). The steps outlined here will help your municipality make key decisions regarding allocation of resources, how and when to address specific needs, and which strategies are most effective and known to produce results.
Prevention is a science. The Risk and Protective Factor Model of Prevention is a proven way of reducing substance abuse and its related consequences. This model is based on the simple premise that to prevent a problem from happening, we need to identify the factors that increase the risk of that problem developing and then find ways to reduce the risks. Just as medical researchers have found risk factors for heart disease such as diets high in fat, lack of exercise, and smoking, a team of researchers at the University of Washington have defined a set of risk factors for youth problem behaviors.
Risk factors are characteristics of school, community and family environments, and of students and their peer groups known to predict increased likelihood of drug use, delinquency, school dropout, and violent behaviors among youth. For example, children who live in families with high levels of conflict are more likely to become involved in delinquency and drug use than children who live in families characterized by low levels of family conflict.
The chart below shows the links between 19 risk factors and five problem behaviors. The check marks indicate where at least two well designed, published research studies have shown a link between the risk factor and the problem behavior.
Source: Communities That Care (CTC) prevention model, Center for Substance Abuse Prevention (CSAP), Substance Abuse and Mental Health Services Administration (SAMSHA)
The Risk and Protective Factor Model of Prevention
T T T T T T T T T T T T T T T T T T T
T T T T T T T T T T T T T T T T T T T
T T T T T T T T T T
T T T T T T T T T T T T
T T T T T T T T T T T T T T T T
Risk Factors
Fav
orab
le P
aren
t Atti
tude
s &
Invo
lvem
ent
in th
e Pr
oble
m B
ehav
ior
Community Peer / IndividualSchoolFamily
Com
mun
ity L
aws
& N
orm
s Fa
vora
ble
Tow
ard
Dru
g U
se, F
irear
ms
& C
rime
Con
stitu
tiona
l Fac
tors
Gan
g In
volv
emen
t
Fav
orab
le A
ttitu
des
Tow
ard
Dru
g U
se &
Oth
er P
robl
em B
ehav
iors
Frie
nds
Who
Use
Dru
gs &
Eng
age
in P
robl
em B
ehav
iors
Alie
natio
n &
Reb
ellio
usne
ss
Ear
ly &
Per
sist
ent A
ntis
ocia
l Beh
avio
r
Ear
ly In
itiat
ion
of D
rug
Use
& O
ther
Pro
blem
Beh
avio
rs
Lac
k of
Com
mitm
ent t
o Sc
hool
Aca
dem
ic F
ailu
re
Com
mun
ity D
isor
gani
zatio
n
Low
Nei
ghbo
rhoo
d At
tach
men
t
Tra
nsiti
ons
& M
obilit
y
Ava
ilabi
lity
of D
rugs
& F
irear
ms
Fam
ily M
anag
emen
t Pro
blem
s
Fam
ily C
onfli
ct
Fam
ily H
isto
ry o
f the
Pro
blem
Beh
avio
r
Ext
rem
e Ec
onom
ic &
Soc
ial D
epriv
atio
n
School Drop-Out Violence
Substance Abuse Delinquency Teen Pregnancy
6
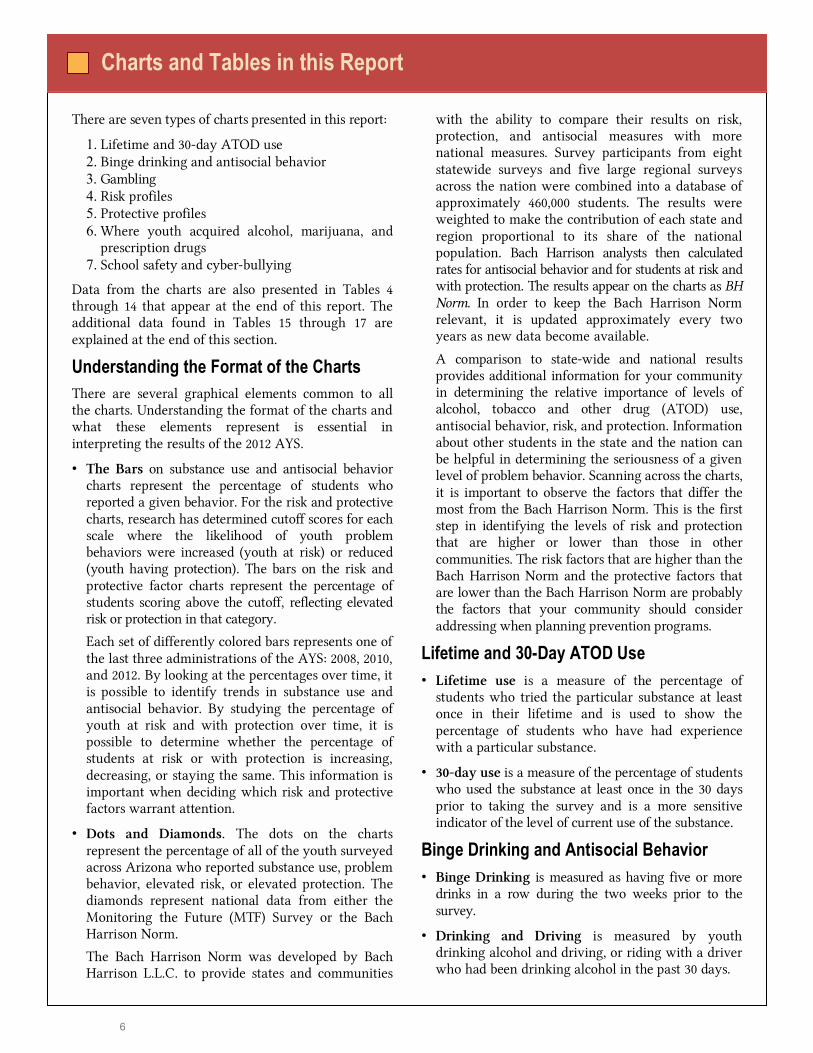
There are seven types of charts presented in this report:
1. Lifetime and 30-day ATOD use 2. Binge drinking and antisocial behavior 3. Gambling 4. Risk profiles 5. Protective profiles 6. Where youth acquired alcohol, marijuana, and
prescription drugs 7. School safety and cyber-bullying
Data from the charts are also presented in Tables 4through 14 that appear at the end of this report. The additional data found in Tables 15 through 17 areexplained at the end of this section.
Understanding the Format of the Charts There are several graphical elements common to all the charts. Understanding the format of the charts and what these elements represent is essential in interpreting the results of the 2012 AYS.
� The Bars on substance use and antisocial behavior charts represent the percentage of students who reported a given behavior. For the risk and protective charts, research has determined cutoff scores for each scale where the likelihood of youth problem behaviors were increased (youth at risk) or reduced(youth having protection). The bars on the risk and protective factor charts represent the percentage of students scoring above the cutoff, reflecting elevated risk or protection in that category. zzz zzz zzzzzzzzz z
Each set of differently colored bars represents one of the last three administrations of the AYS: 2008, 2010, and 2012. By looking at the percentages over time, it is possible to identify trends in substance use and antisocial behavior. By studying the percentage of youth at risk and with protection over time, it is possible to determine whether the percentage of students at risk or with protection is increasing, decreasing, or staying the same. This information is important when deciding which risk and protective factors warrant attention.
� Dots and Diamonds. The dots on the charts represent the percentage of all of the youth surveyed across Arizona who reported substance use, problem behavior, elevated risk, or elevated protection. The diamonds represent national data from either the Monitoring the Future (MTF) Survey or the Bach Harrison Norm. zzzzzzzzzzzzzzzzz zzzzzzzzzzzzzzzzz
The Bach Harrison Norm was developed by Bach Harrison L.L.C. to provide states and communities
Charts and Tables in this Report
with the ability to compare their results on risk, protection, and antisocial measures with more national measures. Survey participants from eight statewide surveys and five large regional surveys across the nation were combined into a database of approximately 460,000 students. The results were weighted to make the contribution of each state and region proportional to its share of the national population. Bach Harrison analysts then calculated rates for antisocial behavior and for students at risk and with protection. The results appear on the charts as BH Norm. In order to keep the Bach Harrison Normrelevant, it is updated approximately every twoyears as new data become available. zzzzz zzzzzzzzz
A comparison to state-wide and national results provides additional information for your community in determining the relative importance of levels of alcohol, tobacco and other drug (ATOD) use,antisocial behavior, risk, and protection. Information about other students in the state and the nation can be helpful in determining the seriousness of a given level of problem behavior. Scanning across the charts, it is important to observe the factors that differ the most from the Bach Harrison Norm. This is the first step in identifying the levels of risk and protection that are higher or lower than those in other communities. The risk factors that are higher than the Bach Harrison Norm and the protective factors that are lower than the Bach Harrison Norm are probably the factors that your community should consider addressing when planning prevention programs.
Lifetime and 30-Day ATOD Use � Lifetime use is a measure of the percentage of
students who tried the particular substance at least once in their lifetime and is used to show the percentage of students who have had experience with a particular substance.
� 30-day use is a measure of the percentage of students who used the substance at least once in the 30 days prior to taking the survey and is a more sensitive indicator of the level of current use of the substance.
Binge Drinking and Antisocial Behavior � Binge Drinking is measured as having five or more
drinks in a row during the two weeks prior to the survey.
� Drinking and Driving is measured by youth drinking alcohol and driving, or riding with a driver who had been drinking alcohol in the past 30 days.
7
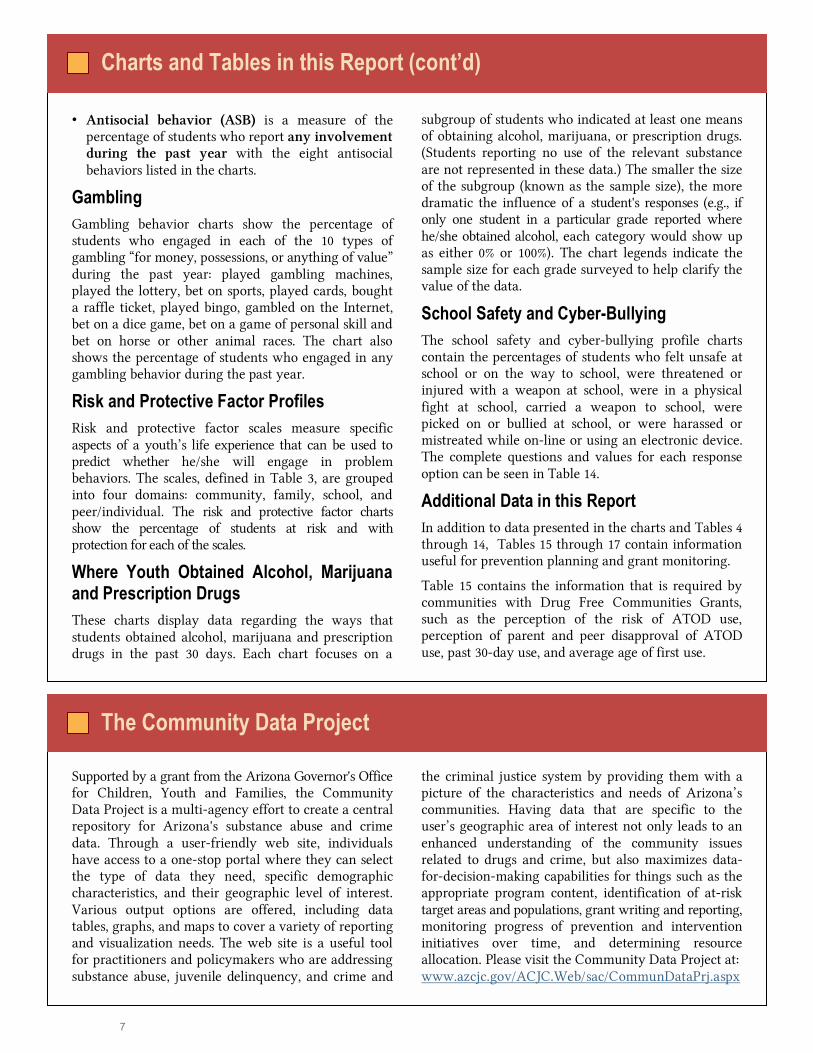
� Antisocial behavior (ASB) is a measure of the percentage of students who report any involvement during the past year with the eight antisocial behaviors listed in the charts.
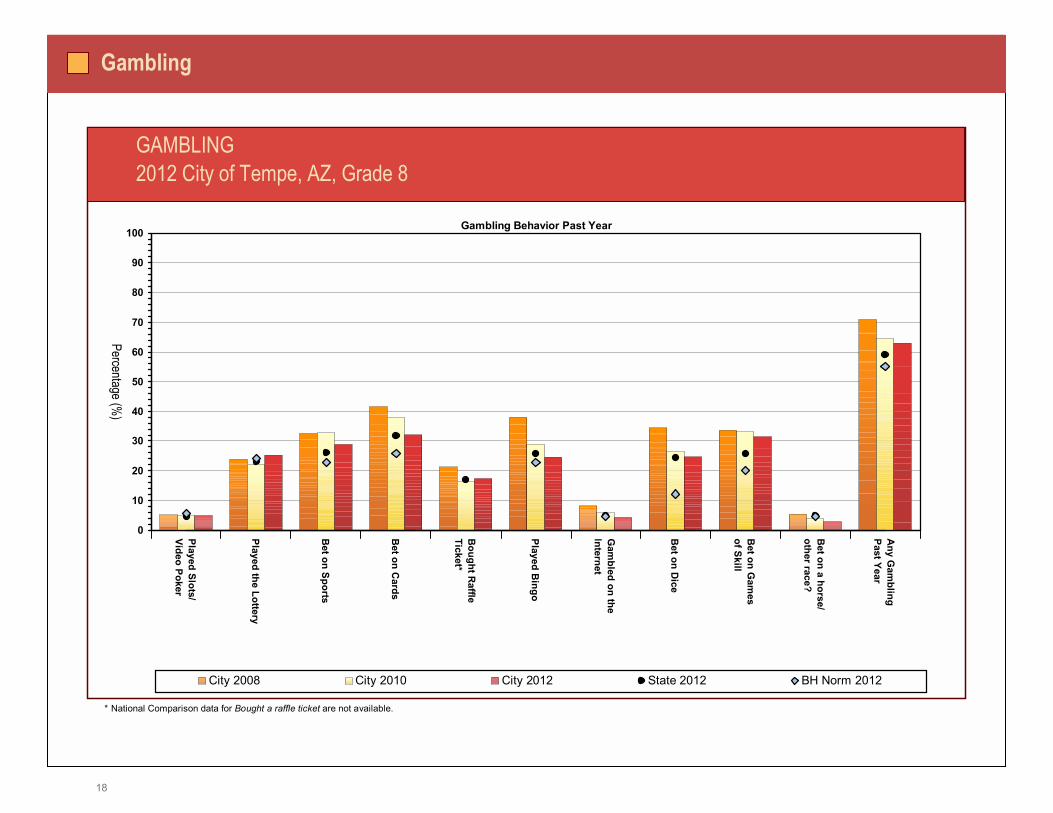
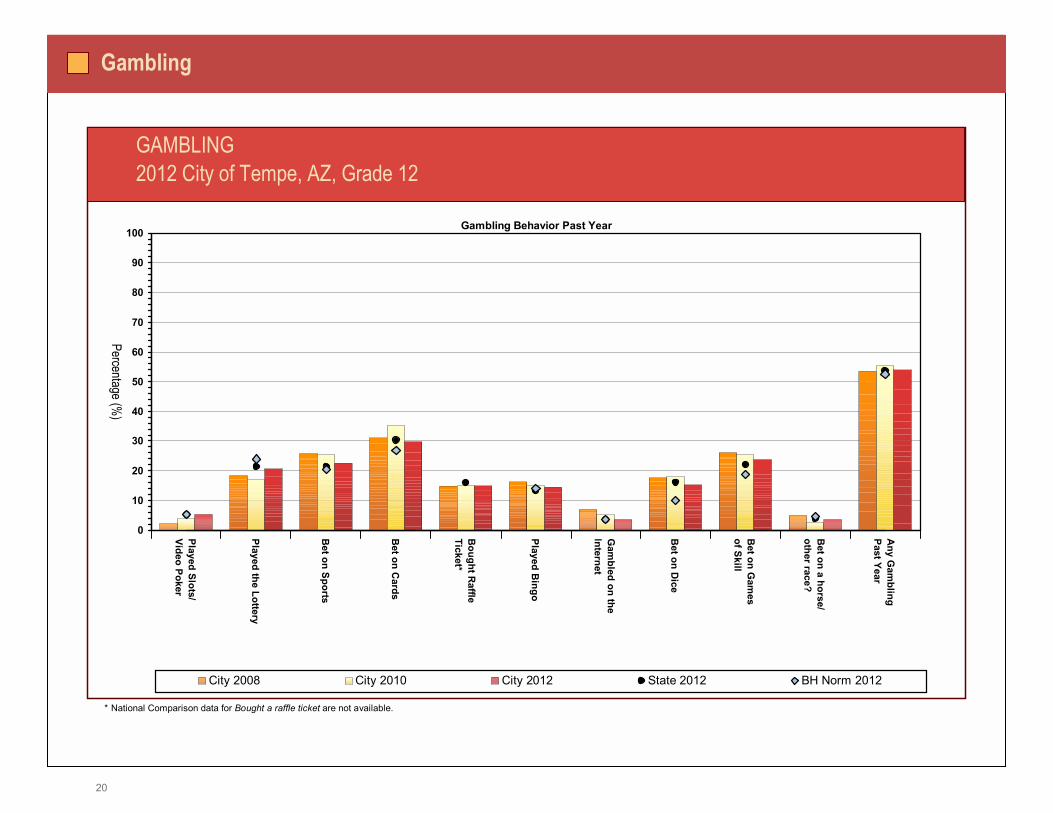
Gambling Gambling behavior charts show the percentage of students who engaged in each of the 10 types of gambling �for money, possessions, or anything of value� during the past year: played gambling machines, played the lottery, bet on sports, played cards, bought a raffle ticket, played bingo, gambled on the Internet, bet on a dice game, bet on a game of personal skill and bet on horse or other animal races. The chart also shows the percentage of students who engaged in any gambling behavior during the past year.
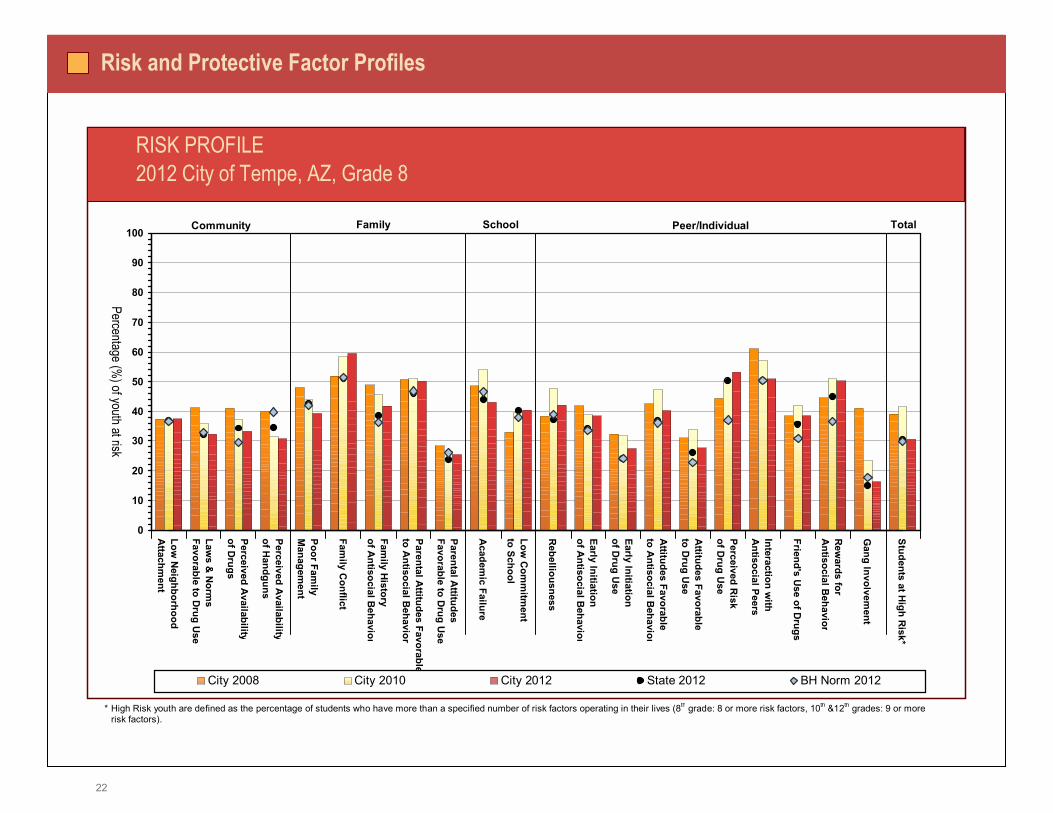
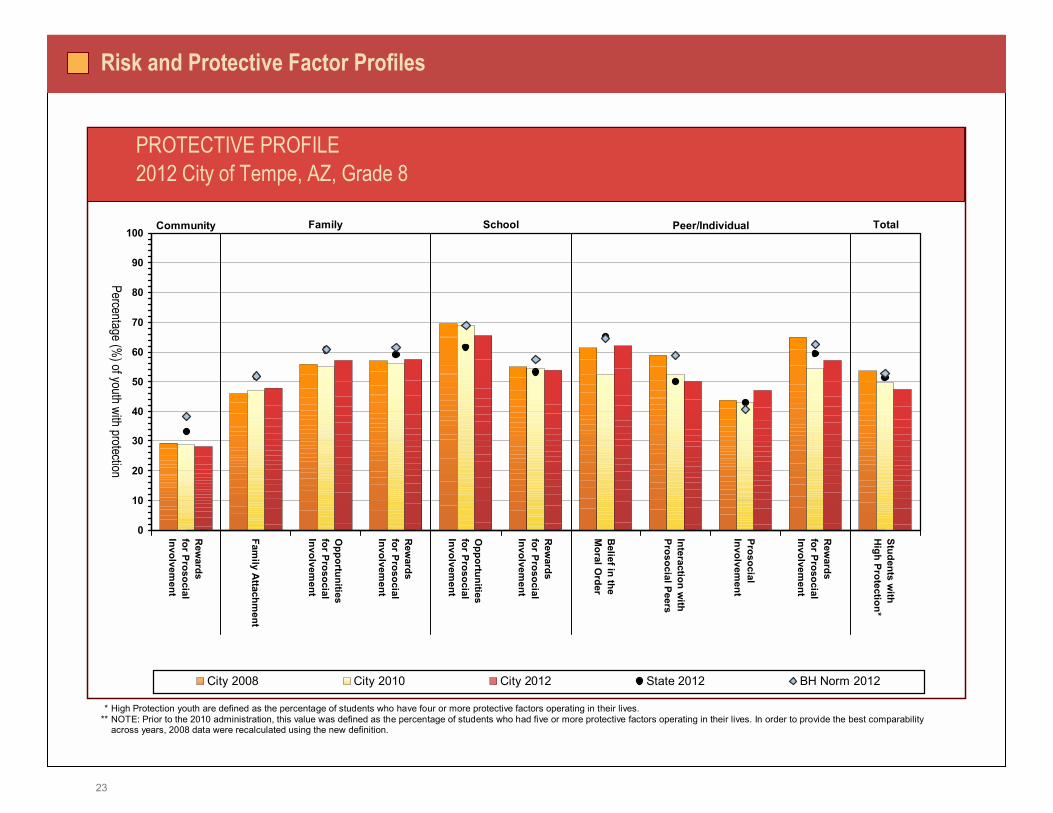
Risk and Protective Factor Profiles Risk and protective factor scales measure specific aspects of a youth�s life experience that can be used to predict whether he/she will engage in problem behaviors. The scales, defined in Table 3, are grouped into four domains: community, family, school, and peer/individual. The risk and protective factor charts show the percentage of students at risk and with protection for each of the scales.
Where Youth Obtained Alcohol, Marijuana and Prescription Drugs These charts display data regarding the ways that students obtained alcohol, marijuana and prescription drugs in the past 30 days. Each chart focuses on a
subgroup of students who indicated at least one means of obtaining alcohol, marijuana, or prescription drugs. (Students reporting no use of the relevant substance are not represented in these data.) The smaller the size of the subgroup (known as the sample size), the more dramatic the influence of a student's responses (e.g., if only one student in a particular grade reported where he/she obtained alcohol, each category would show up as either 0% or 100%). The chart legends indicate the sample size for each grade surveyed to help clarify the value of the data.
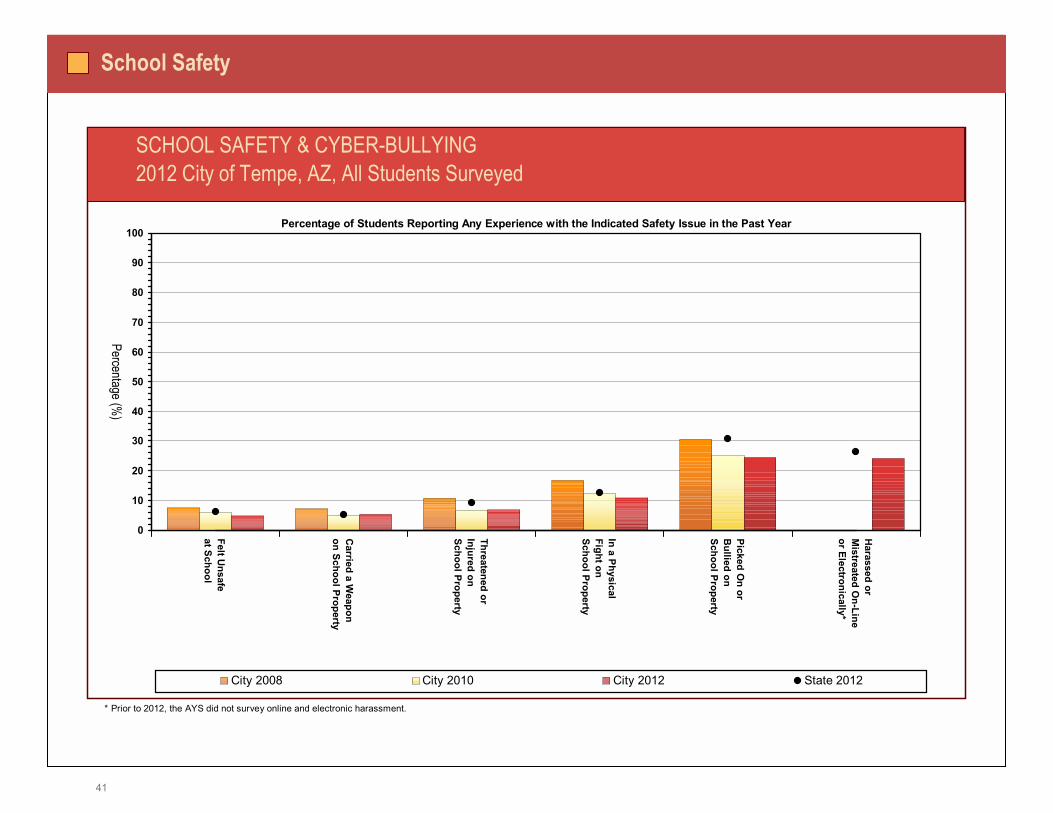
School Safety and Cyber-Bullying The school safety and cyber-bullying profile charts contain the percentages of students who felt unsafe at school or on the way to school, were threatened or injured with a weapon at school, were in a physical fight at school, carried a weapon to school, were picked on or bullied at school, or were harassed or mistreated while on-line or using an electronic device. The complete questions and values for each response option can be seen in Table 14.
Additional Data in this Report In addition to data presented in the charts and Tables 4 through 14, Tables 15 through 17 contain information useful for prevention planning and grant monitoring.
Table 15 contains the information that is required by communities with Drug Free Communities Grants, such as the perception of the risk of ATOD use, perception of parent and peer disapproval of ATOD use, past 30-day use, and average age of first use.
How to Read the Charts in this Report (cont�d)Charts and Tables in this Report (cont�d)
Supported by a grant from the Arizona Governor's Officefor Children, Youth and Families, the Community Data Project is a multi-agency effort to create a central repository for Arizona's substance abuse and crime data. Through a user-friendly web site, individuals have access to a one-stop portal where they can select the type of data they need, specific demographic characteristics, and their geographic level of interest. Various output options are offered, including data tables, graphs, and maps to cover a variety of reporting and visualization needs. The web site is a useful tool for practitioners and policymakers who are addressing substance abuse, juvenile delinquency, and crime and
the criminal justice system by providing them with a picture of the characteristics and needs of Arizona�s communities. Having data that are specific to the user�s geographic area of interest not only leads to an enhanced understanding of the community issues related to drugs and crime, but also maximizes data-for-decision-making capabilities for things such as the appropriate program content, identification of at-risk target areas and populations, grant writing and reporting,monitoring progress of prevention and intervention initiatives over time, and determining resource allocation. Please visit the Community Data Project at:www.azcjc.gov/ACJC.Web/sac/CommunDataPrj.aspx
The Community Data Project
8
The Arizona Substance Abuse Partnership
The Arizona Substance Abuse Partnership (ASAP) was established by Executive Order 2007-12 in June 2007. Currently chaired by the Director of the Governor�s Office for Children, Youth and Families, who also acts as the Governor�s Policy Advisor for Human Services, the ASAP serves as the single statewide council on substance abuse treatment, prevention, intervention/enforcement, and recovery issues. The ASAP brings together stakeholders at the federal, state, tribal, and local levels to improve coordination of efforts; and address identified gaps in prevention, treatment, enforcement, and recovery efforts. The ASAP utilizes data and practical expertise to develop effective methods for integrating and expanding services across Arizona, thereby maximizing available resources.
It is ASAP�s mission to ensure community-driven, agency-supported outcomes to prevent and reduce the negative impacts of alcohol, tobacco, and other drugs by building and sustaining partnerships between professionals in the substance abuse field. Through coordination and collaboration among its members and their respective agencies and organizations, the ASAP strives to ensure that substance abuse is addressed in a comprehensive manner and that funding is spent efficaciously and efficiently.
Recognizing that prescription drug abuse is a serious threat to the health and well-being of families and communities in Arizona, the ASAP is devoted to reducing prescription drug abuse.
There are currently two work groups that assist the ASAP in meeting its goals:
� Substance Abuse Epidemiology Work Group (Epi Work Group) � The Substance Abuse Epidemiology Work Group�s mission is to provide communities, policymakers and local, state and tribal officials with data on the use, consequences and context of alcohol and illicit, over-the-counter, and prescription drugs to inform their substance abuse prevention and intervention strategies. The Epi Work Group produces The Impact of Substance Abuse: A Snapshot of Arizona and behavioral health epidemiology profiles for use by community coalitions, agencies, and individuals in relevant fields. Additionally, the Epi Work Group conducts analyses of individual substance abuse issues, responds to ad hoc data requests and brings data to bear on ASAP�s policy decisions around its strategic plan and focus areas. Further, the Epi Work Group assists the ASAP to develop effective methods for integrating and expanding services across Arizona while maximizing available resources and supporting a data-driven decision-making process.
� Communities Preventing Substance Abuse Work Group (CPSAWG) � The Communities Preventing Substance Abuse Work Group is a merging of two former subcommittees of the ASAP, the Underage Drinking Prevention Committee and the Community Advisory Board. This group brings together representatives from community coalitions around the state and state agency representatives to provide an essential link between community and state-level efforts. The CPSAWG brings the community voice to the ASAP table; reports on important community issues that inform ASAP�s work; helps communities improve their capacity to identify emerging trends, as well as take action and report on them to the proper institutions/authorities; takes the data available through the Epi Work Group and the ASAP back to coalitions and communities to effectively target prevention, treatment, recovery, and enforcement activities; serves as a resource for communities and the state to identify the most effective ways to reduce substance abuse through collaborative efforts and by targeting limited resources where they are most needed; and elevates and recognizes the important work being carried out at the community level to ensure that state-level responses are cognizant of the impact of policies on individual communities. This work group assesses statewide epidemiological data, resources, strategies and policies, and builds relationships with tribes, youth, law enforcement, government agencies, and community coalitions. By combining resources, practice, and research, the work group collaborates to reduce substance abuse.
9
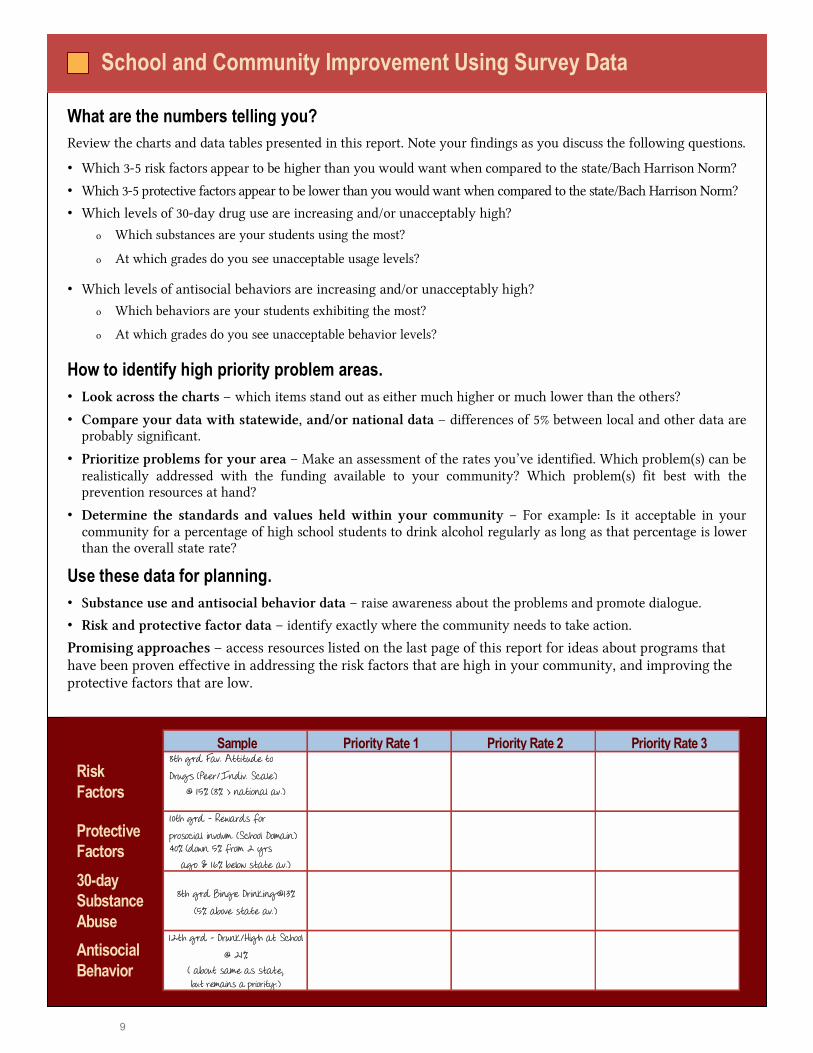
What are the numbers telling you? Review the charts and data tables presented in this report. Note your findings as you discuss the following questions.
� Which 3-5 risk factors appear to be higher than you would want when compared to the state/Bach Harrison Norm?
� Which 3-5 protective factors appear to be lower than you would want when compared to the state/Bach Harrison Norm?
� Which levels of 30-day drug use are increasing and/or unacceptably high?
o Which substances are your students using the most?
o At which grades do you see unacceptable usage levels?
� Which levels of antisocial behaviors are increasing and/or unacceptably high?
o Which behaviors are your students exhibiting the most?
o At which grades do you see unacceptable behavior levels?
How to identify high priority problem areas. � Look across the charts � which items stand out as either much higher or much lower than the others?
� Compare your data with statewide, and/or national data � differences of 5% between local and other data are probably significant.
� Prioritize problems for your area � Make an assessment of the rates you�ve identified. Which problem(s) can be realistically addressed with the funding available to your community? Which problem(s) fit best with the prevention resources at hand?
� Determine the standards and values held within your community � For example: Is it acceptable in your community for a percentage of high school students to drink alcohol regularly as long as that percentage is lower than the overall state rate?
Use these data for planning. � Substance use and antisocial behavior data � raise awareness about the problems and promote dialogue.
� Risk and protective factor data � identify exactly where the community needs to take action.
Promising approaches � access resources listed on the last page of this report for ideas about programs that have been proven effective in addressing the risk factors that are high in your community, and improving the protective factors that are low.
School and Community Improvement Using Survey Data
8th grd Fav. Attitude to Drugs (Peer/Indiv. Scale)
@ 15% (8% > national av.)
10th grd - Rewards for prosocial involvm. (School Domain) 40% (down 5% from 2 yrs
ago & 16% below state av.)
8th grd Binge Drinking@13%(5% above state av.)
12th grd - Drunk/High at School @ 21%
( about same as state,but remains a priority.)
30-day SubstanceAbuse
RiskFactors
ProtectiveFactors
AntisocialBehavior
Priority Rate 3Priority Rate 2Priority Rate 1 Sample
10
Alcohol
Cigarettes
Chew
ing Tobacco
Marijuana
Hallucinogens
Cocaine
Inhalants
Metham
phetamines
Heroin**
Ecstasy
Other C
lub Drugs*
Steroids
Prescription Pain Relievers�
Prescription Stimulants
Prescription Sedatives�
Prescription Drugs�
Over-the-C
ounter Drugs�
Synthetic Drugs*�
Alcohol
Cigarettes
Chew
ing Tobacco
Marijuana
Hallucinogens
Cocaine
Inhalants
Metham
phetamines
Heroin**
Ecstasy
Other C
lub Drugs*
Steroids
Prescription Pain Relievers�
Prescription Stimulants
Prescription Sedatives�
Prescription Drugs�
Over-the-C
ounter Drugs�
Synthetic Drugs*�
0
10
20
30
40
50
60
70
80
90
100
Percentage (%)
City 2008 City 2010 City 2012 State 2012 MTF 2011
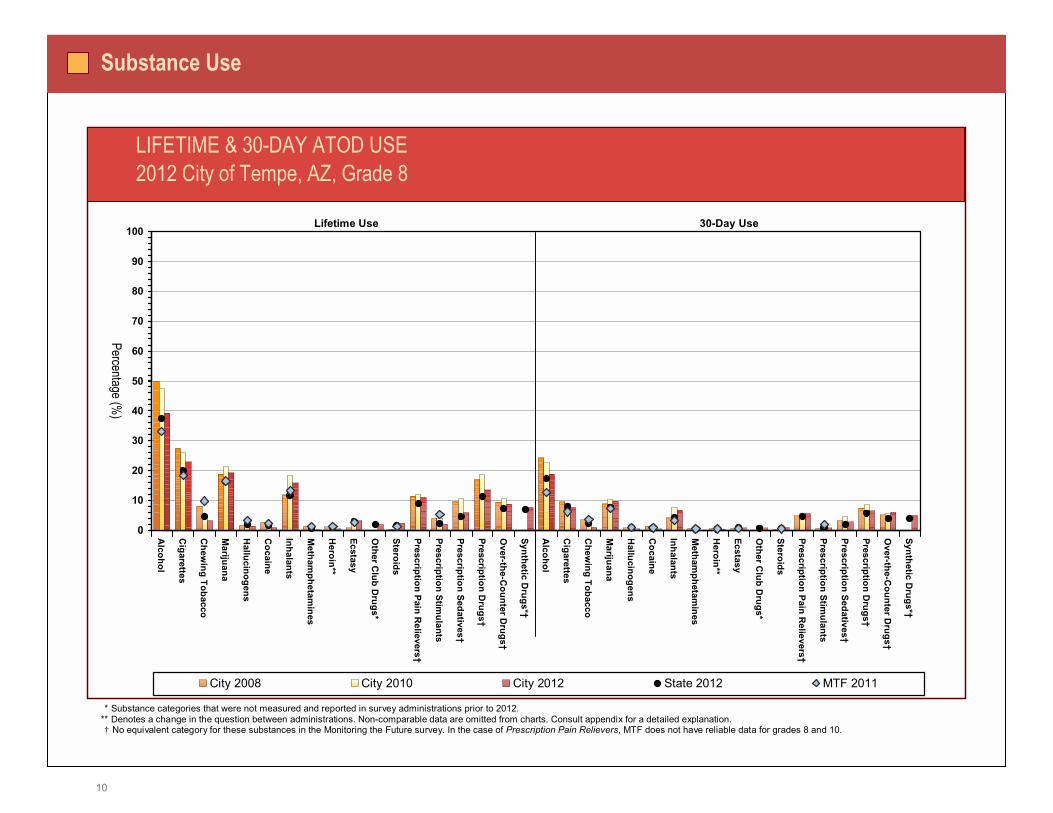
LIFETIME & 30-DAY ATOD USE2012 City of Tempe, AZ, Grade 8
Lifetime Use 30-Day Use
Substance Use
**(Substance categories that were not measured and reported in survey administrations prior to 2012. **(Denotes a change in the question between administrations. Non-comparable data are omitted from charts. Consult appendix for a detailed explanation. *�(No equivalent category for these substances in the Monitoring the Future survey. In the case of Prescription Pain Relievers, MTF does not have reliable data for grades 8 and 10.
11
**(Substance categories that were not measured and reported in survey administrations prior to 2012. **(Denotes a change in the question between administrations. Non-comparable data are omitted from charts. Consult appendix for a detailed explanation. *�(No equivalent category for these substances in the Monitoring the Future survey. In the case of Prescription Pain Relievers, MTF does not have reliable data for grades 8 and 10.
Substance Use
Alcohol
Cigarettes
Chew
ing Tobacco
Marijuana
Hallucinogens
Cocaine
Inhalants
Metham
phetamines
Heroin**
Ecstasy
Other C
lub Drugs*
Steroids
Prescription Pain Relievers�
Prescription Stimulants
Prescription Sedatives�
Prescription Drugs�
Over-the-C
ounter Drugs�
Synthetic Drugs*�
Alcohol
Cigarettes
Chew
ing Tobacco
Marijuana
Hallucinogens
Cocaine
Inhalants
Metham
phetamines
Heroin**
Ecstasy
Other C
lub Drugs*
Steroids
Prescription Pain Relievers�
Prescription Stimulants
Prescription Sedatives�
Prescription Drugs�
Over-the-C
ounter Drugs�
Synthetic Drugs*�
0
10
20
30
40
50
60
70
80
90
100
Percentage (%)
City 2008 City 2010 City 2012 State 2012 MTF 2011
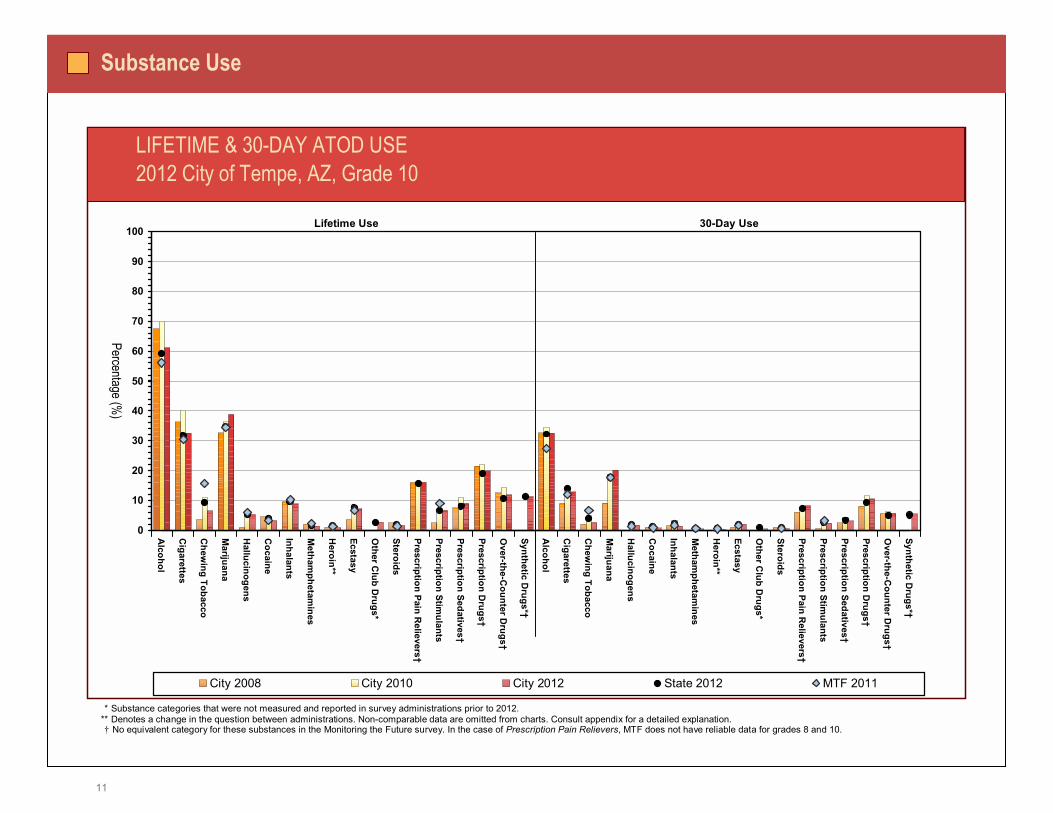
LIFETIME & 30-DAY ATOD USE2012 City of Tempe, AZ, Grade 10
Lifetime Use 30-Day Use

12
**(Substance categories that were not measured and reported in survey administrations prior to 2012. **(Denotes a change in the question between administrations. Non-comparable data are omitted from charts. Consult appendix for a detailed explanation. *�(No equivalent category for these substances in the Monitoring the Future survey. In the case of Prescription Pain Relievers, MTF does not have reliable data for grades 8 and 10.
Substance Use
Alcohol
Cigarettes
Chew
ing Tobacco
Marijuana
Hallucinogens
Cocaine
Inhalants
Metham
phetamines
Heroin**
Ecstasy
Other C
lub Drugs*
Steroids
Prescription Pain Relievers�
Prescription Stimulants
Prescription Sedatives�
Prescription Drugs�
Over-the-C
ounter Drugs�
Synthetic Drugs*�
Alcohol
Cigarettes
Chew
ing Tobacco
Marijuana
Hallucinogens
Cocaine
Inhalants
Metham
phetamines
Heroin**
Ecstasy
Other C
lub Drugs*
Steroids
Prescription Pain Relievers�
Prescription Stimulants
Prescription Sedatives�
Prescription Drugs�
Over-the-C
ounter Drugs�
Synthetic Drugs*�
0
10
20
30
40
50
60
70
80
90
100
Percentage (%)
City 2008 City 2010 City 2012 State 2012 MTF 2011
LIFETIME & 30-DAY ATOD USE2012 City of Tempe, AZ, Grade 12
Lifetime Use 30-Day Use
13
Alcohol
Cigarettes
Chew
ing Tobacco
Marijuana
Hallucinogens
Cocaine
Inhalants
Metham
phetamines
Heroin**
Ecstasy
Other C
lub Drugs*
Steroids
Prescription Pain Relievers�
Prescription Stimulants
Prescription Sedatives�
Prescription Drugs�
Over-the-C
ounter Drugs�
Synthetic Drugs*�
Alcohol
Cigarettes
Chew
ing Tobacco
Marijuana
Hallucinogens
Cocaine
Inhalants
Metham
phetamines
Heroin**
Ecstasy
Other C
lub Drugs*
Steroids
Prescription Pain Relievers�
Prescription Stimulants
Prescription Sedatives�
Prescription Drugs�
Over-the-C
ounter Drugs�
Synthetic Drugs*�
0
10
20
30
40
50
60
70
80
90
100
Percentage (%)
City 2008 City 2010 City 2012 State 2012 MTF 2011
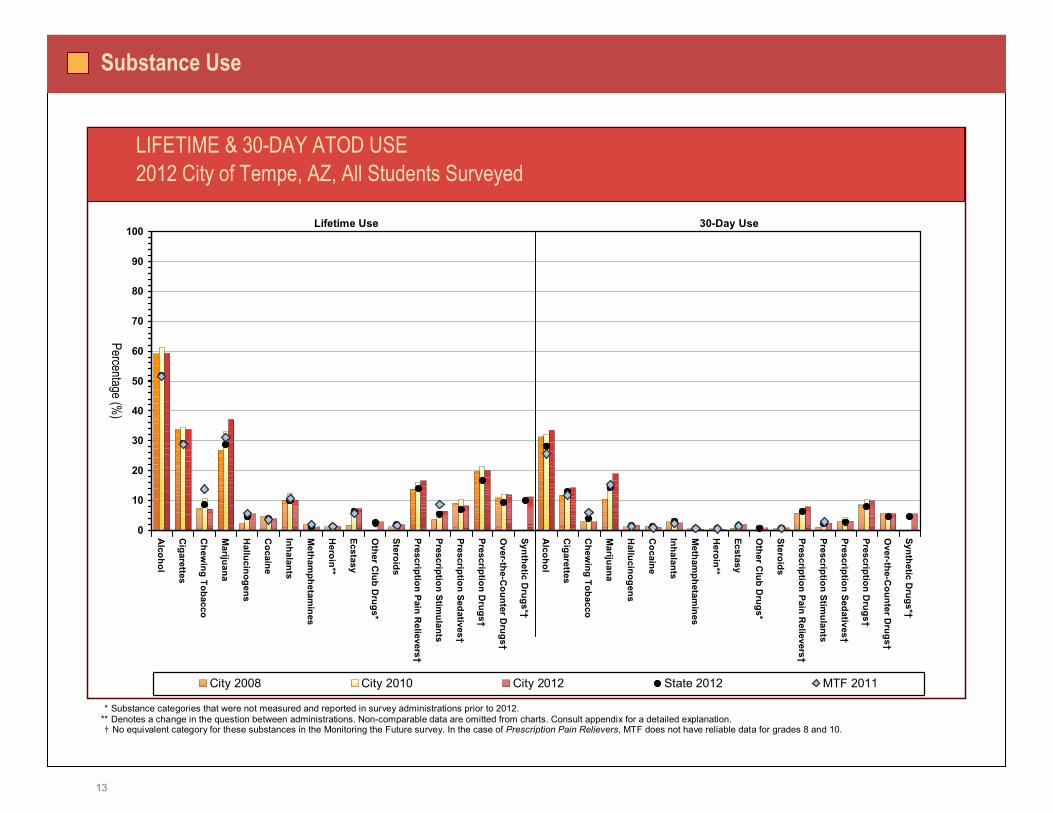
LIFETIME & 30-DAY ATOD USE2012 City of Tempe, AZ, All Students Surveyed
Lifetime Use 30-Day Use
Substance Use
**(Substance categories that were not measured and reported in survey administrations prior to 2012. **(Denotes a change in the question between administrations. Non-comparable data are omitted from charts. Consult appendix for a detailed explanation. *�(No equivalent category for these substances in the Monitoring the Future survey. In the case of Prescription Pain Relievers, MTF does not have reliable data for grades 8 and 10.

14
**(National Comparison data for Binge Drinking category are Monitoring the Future values. **(National Comparison data for Drinking & Driving and Antisocial Behavior category are Bach Harrison Norm values.
Heavy Substance Use and Antisocial Behavior
5 or more alcoholic
drinks in a row in
the past 2 weeks?
DR
IVE a car when
you had been drinking alcohol?
RID
E in a car driven by som
eonedrinking alcohol?
Drunk or H
ighat School
Suspended from
School
Sold Illegal Drugs
Stolen or Tried toSteal a M
otor Vehicle
Been A
rrested
Attacked Som
eonew
/ Idea of Seriously H
urting Them
Carried a H
andgun
Carried a H
andgunto School
0
10
20
30
40
50
60
70
80
90
100
Percentage (%)
City 2008 City 2010 City 2012 State 2012 MTF 2011*/BH Norm 2012**
BINGE DRINKING, DRINKING & DRIVING, & ANTISOCIAL BEHAVIOR2012 City of Tempe, AZ, Grade 8
Antisocial Behavior Past Year**Binge
Drinking* Drinking & Driving**
15
**(National Comparison data for Binge Drinking category are Monitoring the Future values. **(National Comparison data for Drinking & Driving and Antisocial Behavior category are Bach Harrison Norm values.
Heavy Substance Use and Antisocial Behavior
5 or more alcoholic
drinks in a row in
the past 2 weeks?
DR
IVE a car when
you had been drinking alcohol?
RID
E in a car driven by som
eonedrinking alcohol?
Drunk or H
ighat School
Suspended from
School
Sold Illegal Drugs
Stolen or Tried toSteal a M
otor Vehicle
Been A
rrested
Attacked Som
eonew
/ Idea of Seriously H
urting Them
Carried a H
andgun
Carried a H
andgunto School
0
10
20
30
40
50
60
70
80
90
100
Percentage (%)
City 2008 City 2010 City 2012 State 2012 MTF 2011*/BH Norm 2012**
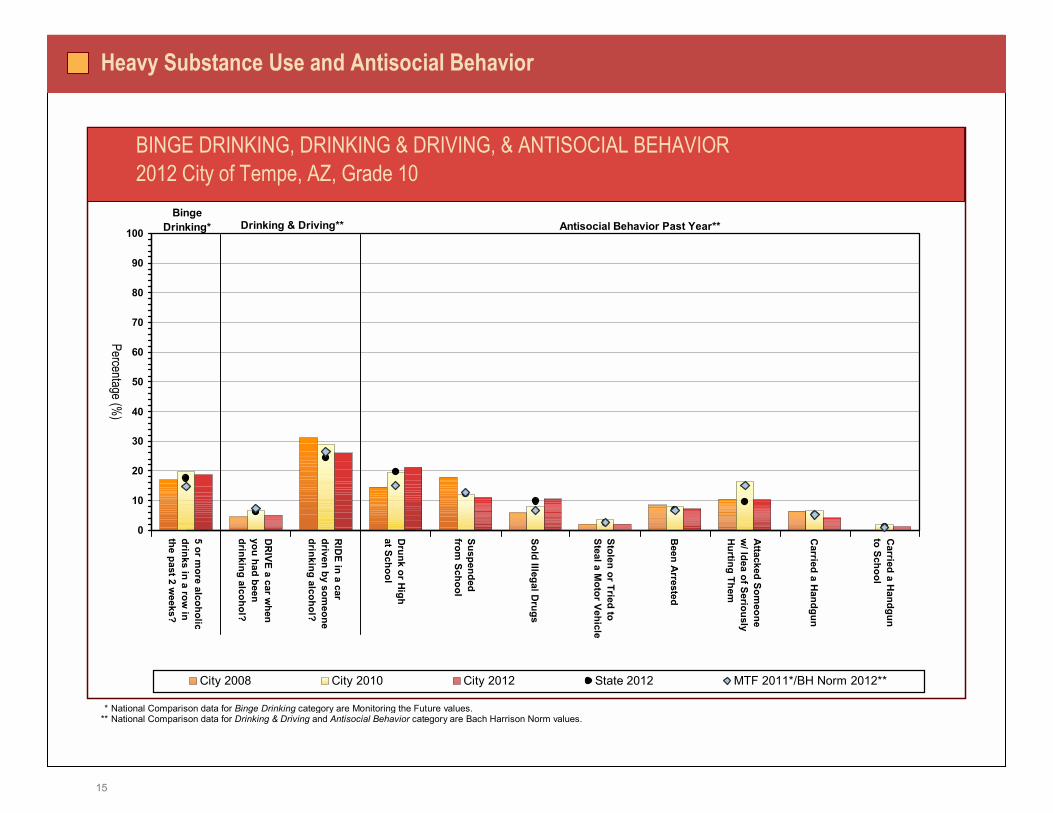
BINGE DRINKING, DRINKING & DRIVING, & ANTISOCIAL BEHAVIOR2012 City of Tempe, AZ, Grade 10
Antisocial Behavior Past Year**Binge
Drinking* Drinking & Driving**
16
**(National Comparison data for Binge Drinking category are Monitoring the Future values. **(National Comparison data for Drinking & Driving and Antisocial Behavior category are Bach Harrison Norm values.
Heavy Substance Use and Antisocial Behavior
5 or more alcoholic
drinks in a row in
the past 2 weeks?
DR
IVE a car when
you had been drinking alcohol?
RID
E in a car driven by som
eonedrinking alcohol?
Drunk or H
ighat School
Suspended from
School
Sold Illegal Drugs
Stolen or Tried toSteal a M
otor Vehicle
Been A
rrested
Attacked Som
eonew
/ Idea of Seriously H
urting Them
Carried a H
andgun
Carried a H
andgunto School
0
10
20
30
40
50
60
70
80
90
100
Percentage (%)
City 2008 City 2010 City 2012 State 2012 MTF 2011*/BH Norm 2012**
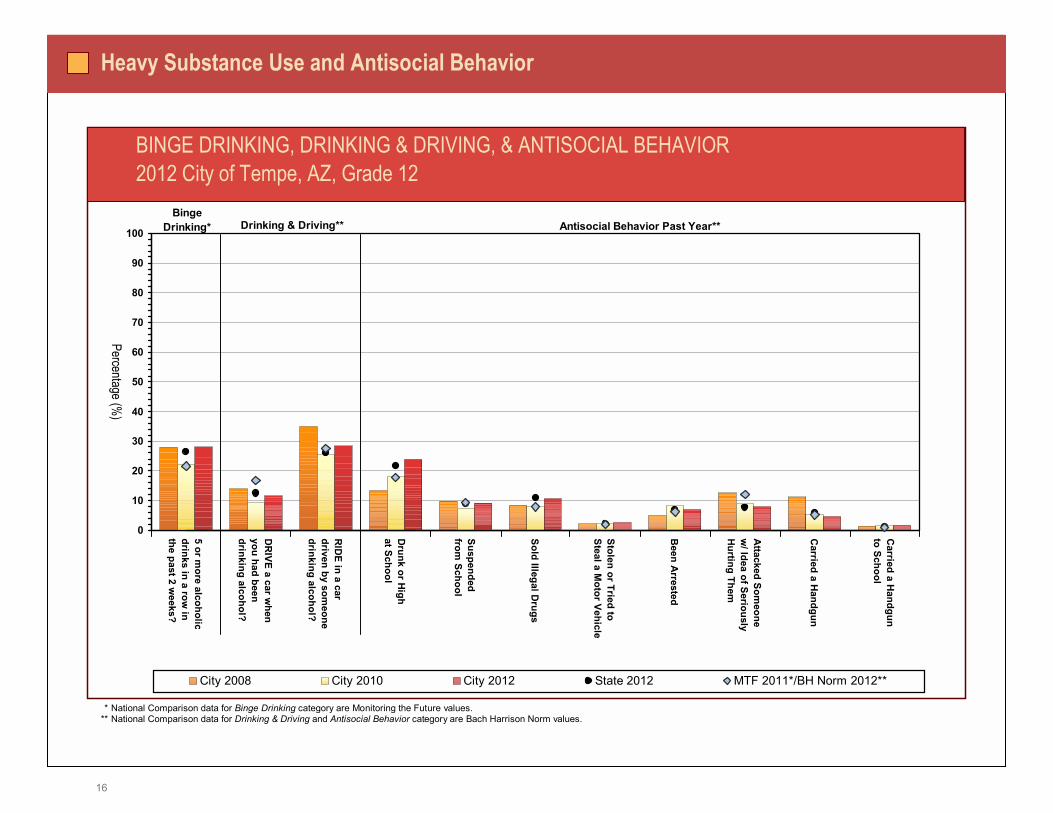
BINGE DRINKING, DRINKING & DRIVING, & ANTISOCIAL BEHAVIOR2012 City of Tempe, AZ, Grade 12
Antisocial Behavior Past Year**Binge
Drinking* Drinking & Driving**

17
**(National Comparison data for Binge Drinking category are Monitoring the Future values. **(National Comparison data for Drinking & Driving and Antisocial Behavior category are Bach Harrison Norm values.
Heavy Substance Use and Antisocial Behavior
5 or more alcoholic
drinks in a row in
the past 2 weeks?
DR
IVE a car when
you had been drinking alcohol?
RID
E in a car driven by som
eonedrinking alcohol?
Drunk or H
ighat School
Suspended from
School
Sold Illegal Drugs
Stolen or Tried toSteal a M
otor Vehicle
Been A
rrested
Attacked Som
eonew
/ Idea of Seriously H
urting Them
Carried a H
andgun
Carried a H
andgunto School
0
10
20
30
40
50
60
70
80
90
100
Percentage (%)
City 2008 City 2010 City 2012 State 2012 MTF 2011*/BH Norm 2012**
BINGE DRINKING, DRINKING & DRIVING, & ANTISOCIAL BEHAVIOR2012 City of Tempe, AZ, All Students Surveyed
Antisocial Behavior Past Year**Binge
Drinking* Drinking & Driving**
18
Gambling
**(National Comparison data for Bought a raffle ticket are not available.
Played Slots/Video Poker
Played the Lottery
Bet on Sports
Bet on C
ards
Bought R
affle Ticket*
Played Bingo
Gam
bled on the lnternet
Bet on D
ice
Bet on G
ames
of Skill
Bet on a horse/
other race?
Any G
ambling
Past Year
0
10
20
30
40
50
60
70
80
90
100
Percentage (%)
City 2008 City 2010 City 2012 State 2012 BH Norm 2012
GAMBLING2012 City of Tempe, AZ, Grade 8
Gambling Behavior Past Year

19
Gambling
**(National Comparison data for Bought a raffle ticket are not available.
Played Slots/Video Poker
Played the Lottery
Bet on Sports
Bet on C
ards
Bought R
affle Ticket*
Played Bingo
Gam
bled on the lnternet
Bet on D
ice
Bet on G
ames
of Skill
Bet on a horse/
other race?
Any G
ambling
Past Year
0
10
20
30
40
50
60
70
80
90
100
Percentage (%)
City 2008 City 2010 City 2012 State 2012 BH Norm 2012
GAMBLING2012 City of Tempe, AZ, Grade 10
Gambling Behavior Past Year
20
Gambling
**(National Comparison data for Bought a raffle ticket are not available.
Played Slots/Video Poker
Played the Lottery
Bet on Sports
Bet on C
ards
Bought R
affle Ticket*
Played Bingo
Gam
bled on the lnternet
Bet on D
ice
Bet on G
ames
of Skill
Bet on a horse/
other race?
Any G
ambling
Past Year
0
10
20
30
40
50
60
70
80
90
100
Percentage (%)
City 2008 City 2010 City 2012 State 2012 BH Norm 2012
GAMBLING2012 City of Tempe, AZ, Grade 12
Gambling Behavior Past Year

21
Gambling
**(National Comparison data for Bought a raffle ticket are not available.
Played Slots/Video Poker
Played the Lottery
Bet on Sports
Bet on C
ards
Bought R
affle Ticket*
Played Bingo
Gam
bled on the lnternet
Bet on D
ice
Bet on G
ames
of Skill
Bet on a horse/
other race?
Any G
ambling
Past Year
0
10
20
30
40
50
60
70
80
90
100
Percentage (%)
City 2008 City 2010 City 2012 State 2012 BH Norm 2012
GAMBLING2012 City of Tempe, AZ, All Students Surveyed
Gambling Behavior Past Year
22
Risk and Protective Factor Profiles
**(High Risk youth are defined as the percentage of students who have more than a specified number of risk factors operating in their lives (8th grade: 8 or more risk factors, 10th &12th grades: 9 or more risk factors).
Low N
eighborhoodA
ttachment
Laws &
Norm
s Favorable to D
rug Use
Perceived Availability
of Drugs
Perceived Availabilit y
of Handguns
Poor Family
Managem
ent
Family C
onflict
Family H
istoryof A
ntisocial Behavior
Parental Attitudes Favorable
to Antisocial B
ehavior
Parental Attitudes
Favorable to Drug U
se
Academ
ic Failure
Low C
omm
itment
to School
Rebelliousness
Early Initiationof A
ntisocial Behavior
Early Initiationof D
rug Use
Attitudes Favorable
to Antisocial B
ehavior
Attitudes Favorable
to Drug U
se
Perceived Risk
of Drug U
se
Interaction with
Antisocial Peers
Friend's Use of D
rugs
Rew
ards for A
ntisocial Behavior
Gang Involvem
ent
Students at High R
isk*
0
10
20
30
40
50
60
70
80
90
100
Percentage (%) of youth at risk
City 2008 City 2010 City 2012 State 2012 BH Norm 2012
RISK PROFILE2012 City of Tempe, AZ, Grade 8
Peer/IndividualCommunity Family School Total
23
Risk and Protective Factor Profiles
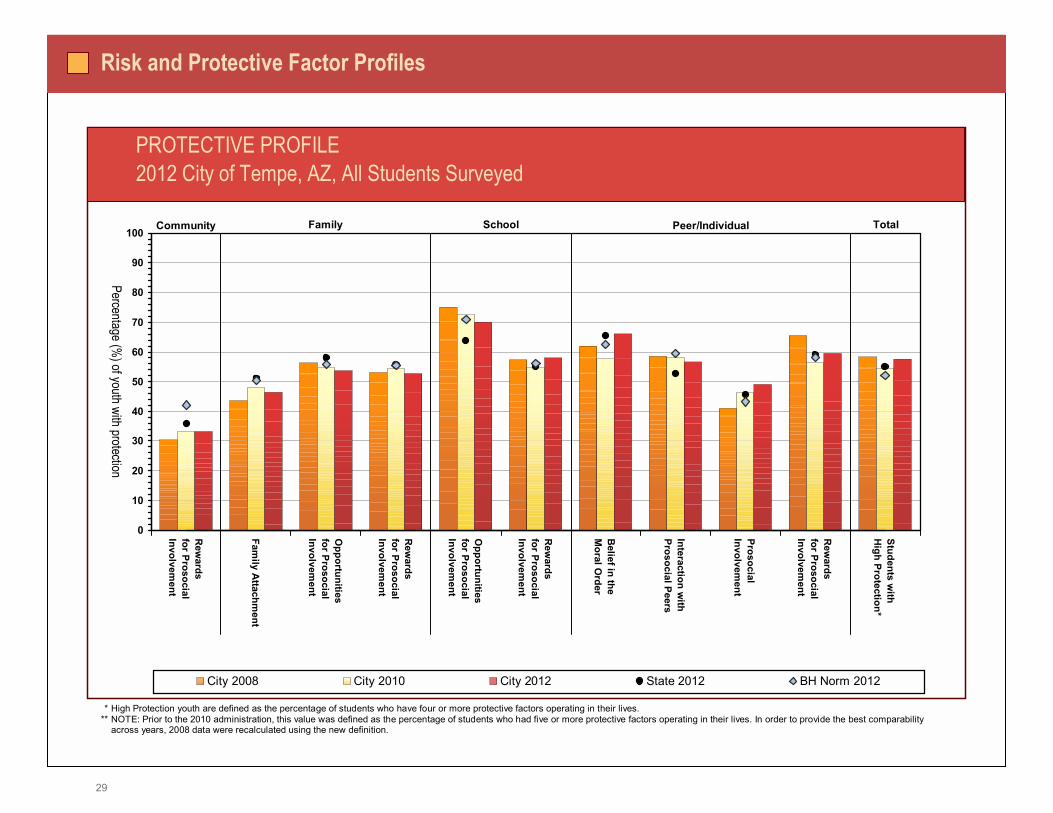
**(High Protection youth are defined as the percentage of students who have four or more protective factors operating in their lives. **(NOTE: Prior to the 2010 administration, this value was defined as the percentage of students who had five or more protective factors operating in their lives. In order to provide the best comparability **(across years, 2008 data were recalculated using the new definition.
Rew
ards for ProsocialInvolvem
ent
Family A
ttachment
Opportunities
for Prosocial Involvem
ent
Rew
ards for ProsocialInvolvem
ent
Opportunities
for Prosocial Involvem
ent
Rew
ards for ProsocialInvolvem
ent
Belief in the
Moral O
rder
Interaction with
Prosocial Peers
Prosocial Involvem
ent
Rew
ards for ProsocialInvolvem
ent
Students with
High Protection*
0
10
20
30
40
50
60
70
80
90
100
Percentage (%) of youth with protection
City 2008 City 2010 City 2012 State 2012 BH Norm 2012
PROTECTIVE PROFILE2012 City of Tempe, AZ, Grade 8
Peer/IndividualCommunity Family School Total
24
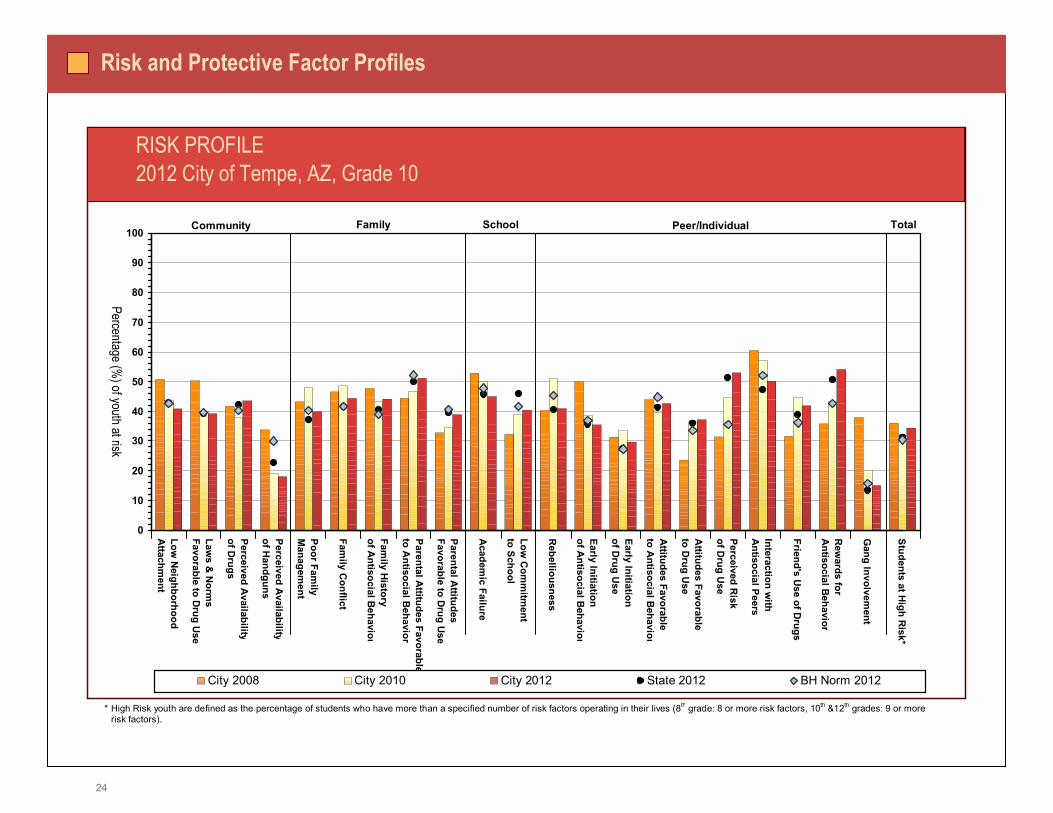
Risk and Protective Factor Profiles
**(High Risk youth are defined as the percentage of students who have more than a specified number of risk factors operating in their lives (8th grade: 8 or more risk factors, 10th &12th grades: 9 or more risk factors).
Low N
eighborhoodA
ttachment
Laws &
Norm
s Favorable to D
rug Use
Perceived Availability
of Drugs
Perceived Availabilit y
of Handguns
Poor Family
Managem
ent
Family C
onflict
Family H
istoryof A
ntisocial Behavior
Parental Attitudes Favorable
to Antisocial B
ehavior
Parental Attitudes
Favorable to Drug U
se
Academ
ic Failure
Low C
omm
itment
to School
Rebelliousness
Early Initiationof A
ntisocial Behavior
Early Initiationof D
rug Use
Attitudes Favorable
to Antisocial B
ehavior
Attitudes Favorable
to Drug U
se
Perceived Risk
of Drug U
se
Interaction with
Antisocial Peers
Friend's Use of D
rugs
Rew
ards for A
ntisocial Behavior
Gang Involvem
ent
Students at High R
isk*
0
10
20
30
40
50
60
70
80
90
100
Percentage (%) of youth at risk
City 2008 City 2010 City 2012 State 2012 BH Norm 2012
RISK PROFILE2012 City of Tempe, AZ, Grade 10
Peer/IndividualCommunity Family School Total

25
Risk and Protective Factor Profiles
**(High Protection youth are defined as the percentage of students who have four or more protective factors operating in their lives. **(NOTE: Prior to the 2010 administration, this value was defined as the percentage of students who had five or more protective factors operating in their lives. In order to provide the best comparability **(across years, 2008 data were recalculated using the new definition.
Rew
ards for ProsocialInvolvem
ent
Family A
ttachment
Opportunities
for Prosocial Involvem
ent
Rew
ards for ProsocialInvolvem
ent
Opportunities
for Prosocial Involvem
ent
Rew
ards for ProsocialInvolvem
ent
Belief in the
Moral O
rder
Interaction with
Prosocial Peers
Prosocial Involvem
ent
Rew
ards for ProsocialInvolvem
ent
Students with
High Protection*
0
10
20
30
40
50
60
70
80
90
100
Percentage (%) of youth with protection
City 2008 City 2010 City 2012 State 2012 BH Norm 2012
PROTECTIVE PROFILE2012 City of Tempe, AZ, Grade 10
Peer/IndividualCommunity Family School Total
26
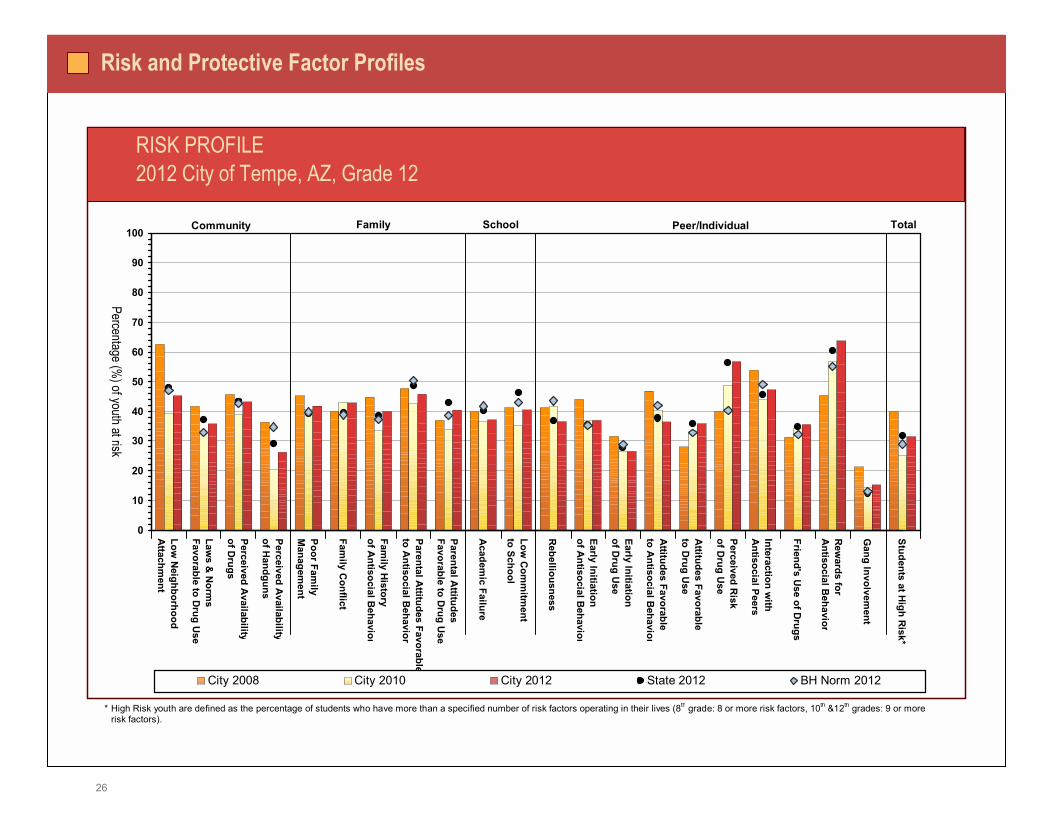
Risk and Protective Factor Profiles
**(High Risk youth are defined as the percentage of students who have more than a specified number of risk factors operating in their lives (8th grade: 8 or more risk factors, 10th &12th grades: 9 or more risk factors).
Low N
eighborhoodA
ttachment
Laws &
Norm
s Favorable to D
rug Use
Perceived Availability
of Drugs
Perceived Availabilit y
of Handguns
Poor Family
Managem
ent
Family C
onflict
Family H
istoryof A
ntisocial Behavior
Parental Attitudes Favorable
to Antisocial B
ehavior
Parental Attitudes
Favorable to Drug U
se
Academ
ic Failure
Low C
omm
itment
to School
Rebelliousness
Early Initiationof A
ntisocial Behavior
Early Initiationof D
rug Use
Attitudes Favorable
to Antisocial B
ehavior
Attitudes Favorable
to Drug U
se
Perceived Risk
of Drug U
se
Interaction with
Antisocial Peers
Friend's Use of D
rugs
Rew
ards for A
ntisocial Behavior
Gang Involvem
ent
Students at High R
isk*
0
10
20
30
40
50
60
70
80
90
100
Percentage (%) of youth at risk
City 2008 City 2010 City 2012 State 2012 BH Norm 2012
RISK PROFILE2012 City of Tempe, AZ, Grade 12
Peer/IndividualCommunity Family School Total
27
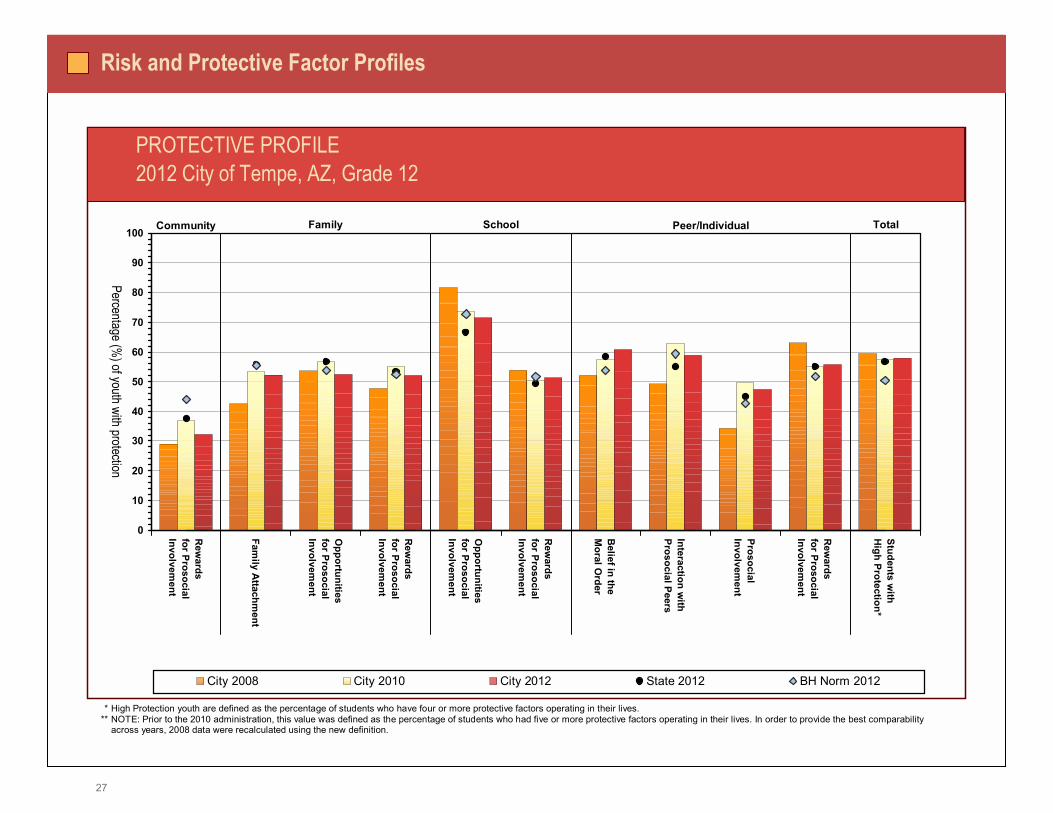
Risk and Protective Factor Profiles
**(High Protection youth are defined as the percentage of students who have four or more protective factors operating in their lives. **(NOTE: Prior to the 2010 administration, this value was defined as the percentage of students who had five or more protective factors operating in their lives. In order to provide the best comparability **(across years, 2008 data were recalculated using the new definition.
Rew
ards for ProsocialInvolvem
ent
Family A
ttachment
Opportunities
for Prosocial Involvem
ent
Rew
ards for ProsocialInvolvem
ent
Opportunities
for Prosocial Involvem
ent
Rew
ards for ProsocialInvolvem
ent
Belief in the
Moral O
rder
Interaction with
Prosocial Peers
Prosocial Involvem
ent
Rew
ards for ProsocialInvolvem
ent
Students with
High Protection*
0
10
20
30
40
50
60
70
80
90
100
Percentage (%) of youth with protection
City 2008 City 2010 City 2012 State 2012 BH Norm 2012
PROTECTIVE PROFILE2012 City of Tempe, AZ, Grade 12
Peer/IndividualCommunity Family School Total
28
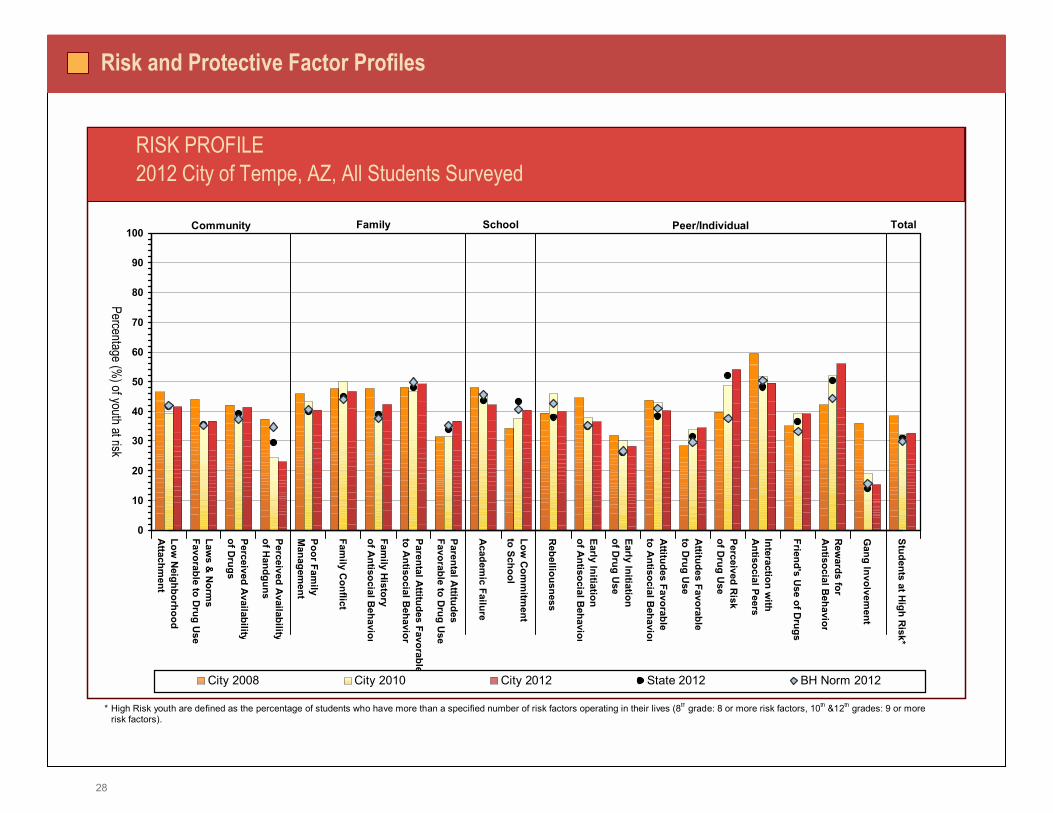
**(High Risk youth are defined as the percentage of students who have more than a specified number of risk factors operating in their lives (8th grade: 8 or more risk factors, 10th &12th grades: 9 or more risk factors).
Low N
eighborhoodA
ttachment
Laws &
Norm
s Favorable to D
rug Use
Perceived Availability
of Drugs
Perceived Availabilit y
of Handguns
Poor Family
Managem
ent
Family C
onflict
Family H
istoryof A
ntisocial Behavior
Parental Attitudes Favorable
to Antisocial B
ehavior
Parental Attitudes
Favorable to Drug U
se
Academ
ic Failure
Low C
omm
itment
to School
Rebelliousness
Early Initiationof A
ntisocial Behavior
Early Initiationof D
rug Use
Attitudes Favorable
to Antisocial B
ehavior
Attitudes Favorable
to Drug U
se
Perceived Risk
of Drug U
se
Interaction with
Antisocial Peers
Friend's Use of D
rugs
Rew
ards for A
ntisocial Behavior
Gang Involvem
ent
Students at High R
isk*
0
10
20
30
40
50
60
70
80
90
100
Percentage (%) of youth at risk
City 2008 City 2010 City 2012 State 2012 BH Norm 2012
RISK PROFILE2012 City of Tempe, AZ, All Students Surveyed
Peer/IndividualCommunity Family School Total
Sources of Alcohol Risk and Protective Factor Profiles
29
Risk and Protective Factor Profiles
**(High Protection youth are defined as the percentage of students who have four or more protective factors operating in their lives. **(NOTE: Prior to the 2010 administration, this value was defined as the percentage of students who had five or more protective factors operating in their lives. In order to provide the best comparability **(across years, 2008 data were recalculated using the new definition.
Rew
ards for ProsocialInvolvem
ent
Family A
ttachment
Opportunities
for Prosocial Involvem
ent
Rew
ards for ProsocialInvolvem
ent
Opportunities
for Prosocial Involvem
ent
Rew
ards for ProsocialInvolvem
ent
Belief in the
Moral O
rder
Interaction with
Prosocial Peers
Prosocial Involvem
ent
Rew
ards for ProsocialInvolvem
ent
Students with
High Protection*
0
10
20
30
40
50
60
70
80
90
100
Percentage (%) of youth with protection
City 2008 City 2010 City 2012 State 2012 BH Norm 2012
PROTECTIVE PROFILE2012 City of Tempe, AZ, All Students Surveyed
Peer/IndividualCommunity Family School Total
30
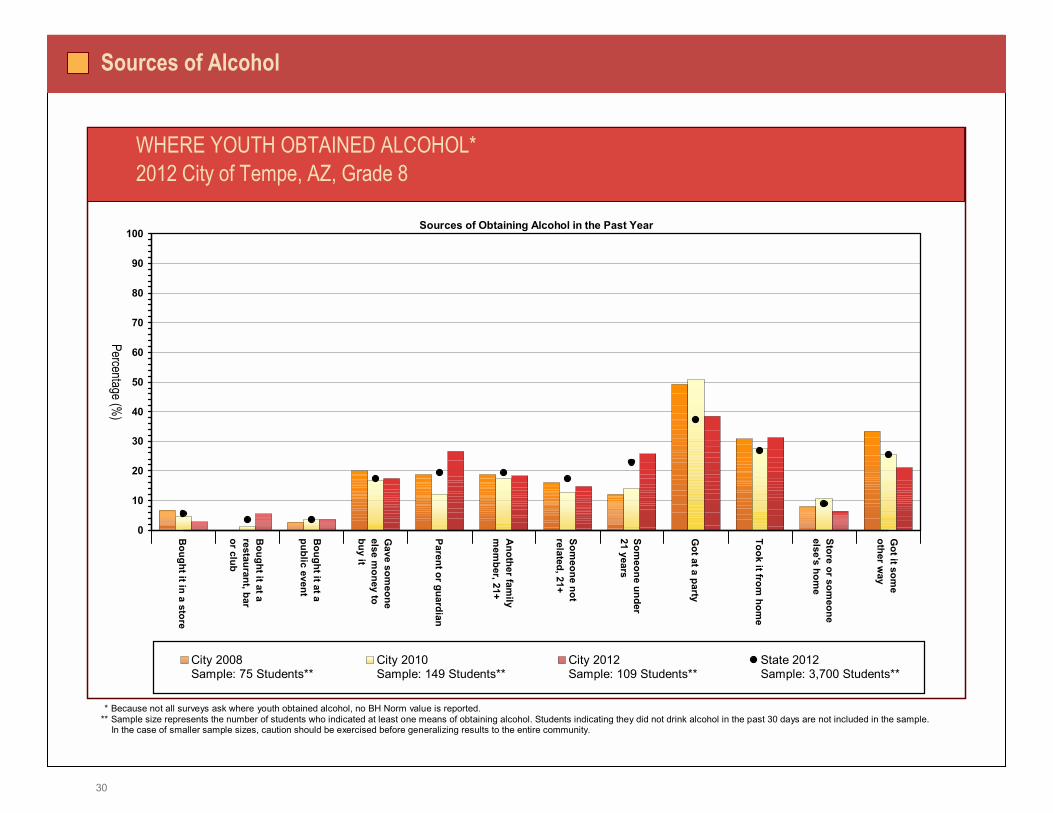
**(Because not all surveys ask where youth obtained alcohol, no BH Norm value is reported. **(Sample size represents the number of students who indicated at least one means of obtaining alcohol. Students indicating they did not drink alcohol in the past 30 days are not included in the sample. **(In the case of smaller sample sizes, caution should be exercised before generalizing results to the entire community.
Sources of Alcohol
Bought it in a store
Bought it at a
restaurant, bar or club
Bought it at a
public event
Gave som
eoneelse m
oney to buy it
Parent or guardian
Another fam
ily m
ember, 21+
Someone not
related, 21+
Someone under
21 years
Got at a party
Took it from hom
e
Store or someone
else's home
Got it som
e other w
ay
0
10
20
30
40
50
60
70
80
90
100
Percentage (%)
City 2008Sample: 75 Students**
City 2010Sample: 149 Students**
City 2012Sample: 109 Students**
State 2012Sample: 3,700 Students**
WHERE YOUTH OBTAINED ALCOHOL*2012 City of Tempe, AZ, Grade 8
Sources of Obtaining Alcohol in the Past Year
31
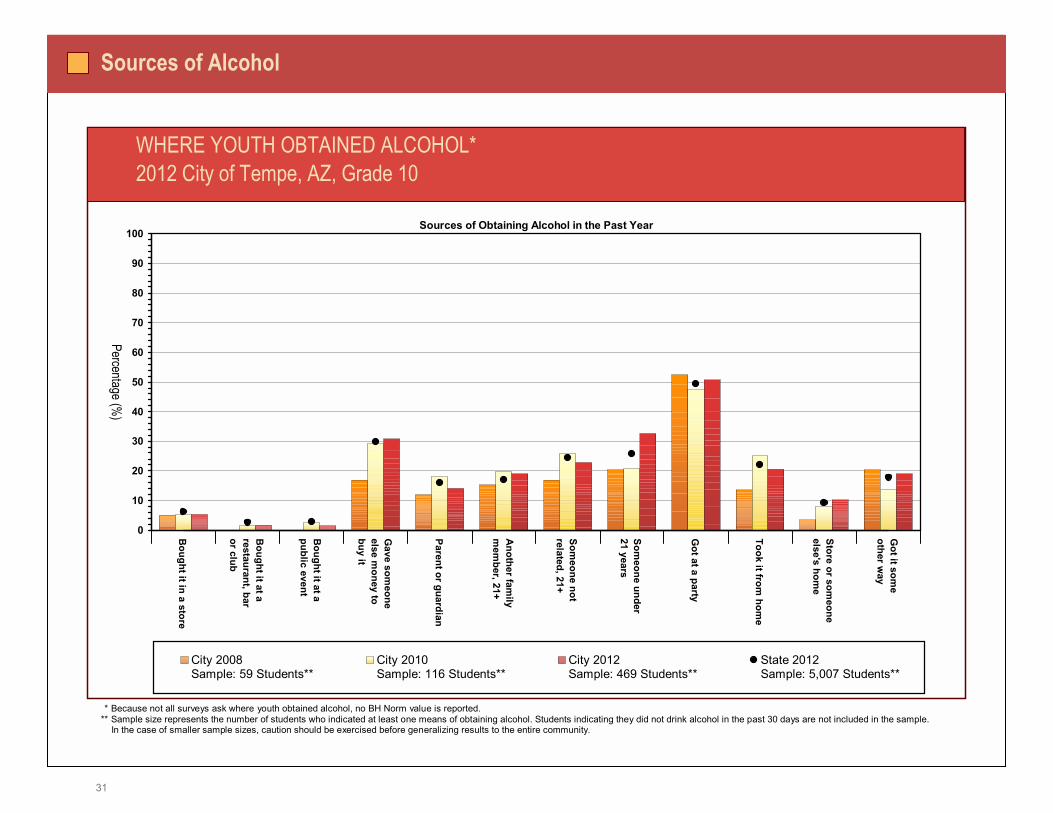
**(Because not all surveys ask where youth obtained alcohol, no BH Norm value is reported. **(Sample size represents the number of students who indicated at least one means of obtaining alcohol. Students indicating they did not drink alcohol in the past 30 days are not included in the sample. **(In the case of smaller sample sizes, caution should be exercised before generalizing results to the entire community.
Sources of Alcohol
Bought it in a store
Bought it at a
restaurant, bar or club
Bought it at a
public event
Gave som
eoneelse m
oney to buy it
Parent or guardian
Another fam
ily m
ember, 21+
Someone not
related, 21+
Someone under
21 years
Got at a party
Took it from hom
e
Store or someone
else's home
Got it som
e other w
ay
0
10
20
30
40
50
60
70
80
90
100
Percentage (%)
City 2008Sample: 59 Students**
City 2010Sample: 116 Students**
City 2012Sample: 469 Students**
State 2012Sample: 5,007 Students**
WHERE YOUTH OBTAINED ALCOHOL*2012 City of Tempe, AZ, Grade 10
Sources of Obtaining Alcohol in the Past Year
32
Sources of Alcohol
Bought it in a store
Bought it at a
restaurant, bar or club
Bought it at a
public event
Gave som
eoneelse m
oney to buy it
Parent or guardian
Another fam
ily m
ember, 21+
Someone not
related, 21+
Someone under
21 years
Got at a party
Took it from hom
e
Store or someone
else's home
Got it som
e other w
ay
0
10
20
30
40
50
60
70
80
90
100
Percentage (%)
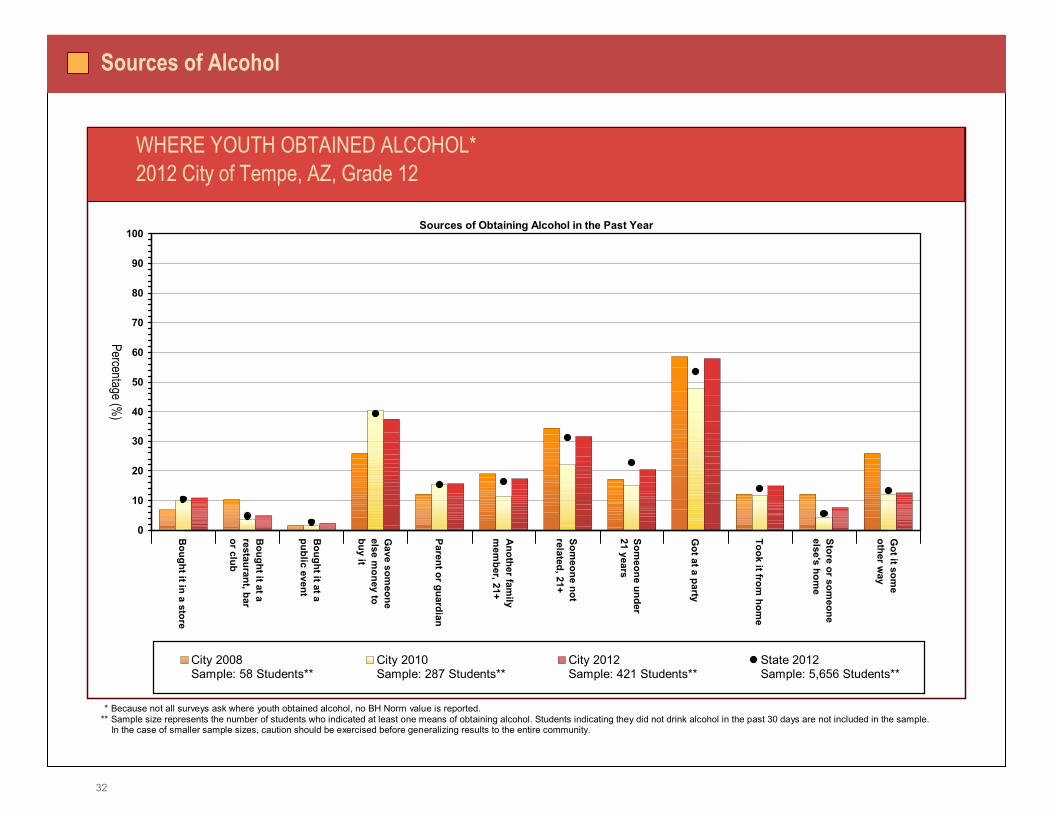
City 2008Sample: 58 Students**
City 2010Sample: 287 Students**
City 2012Sample: 421 Students**
State 2012Sample: 5,656 Students**
WHERE YOUTH OBTAINED ALCOHOL*2012 City of Tempe, AZ, Grade 12
Sources of Obtaining Alcohol in the Past Year
**(Because not all surveys ask where youth obtained alcohol, no BH Norm value is reported. **(Sample size represents the number of students who indicated at least one means of obtaining alcohol. Students indicating they did not drink alcohol in the past 30 days are not included in the sample. **(In the case of smaller sample sizes, caution should be exercised before generalizing results to the entire community.
33
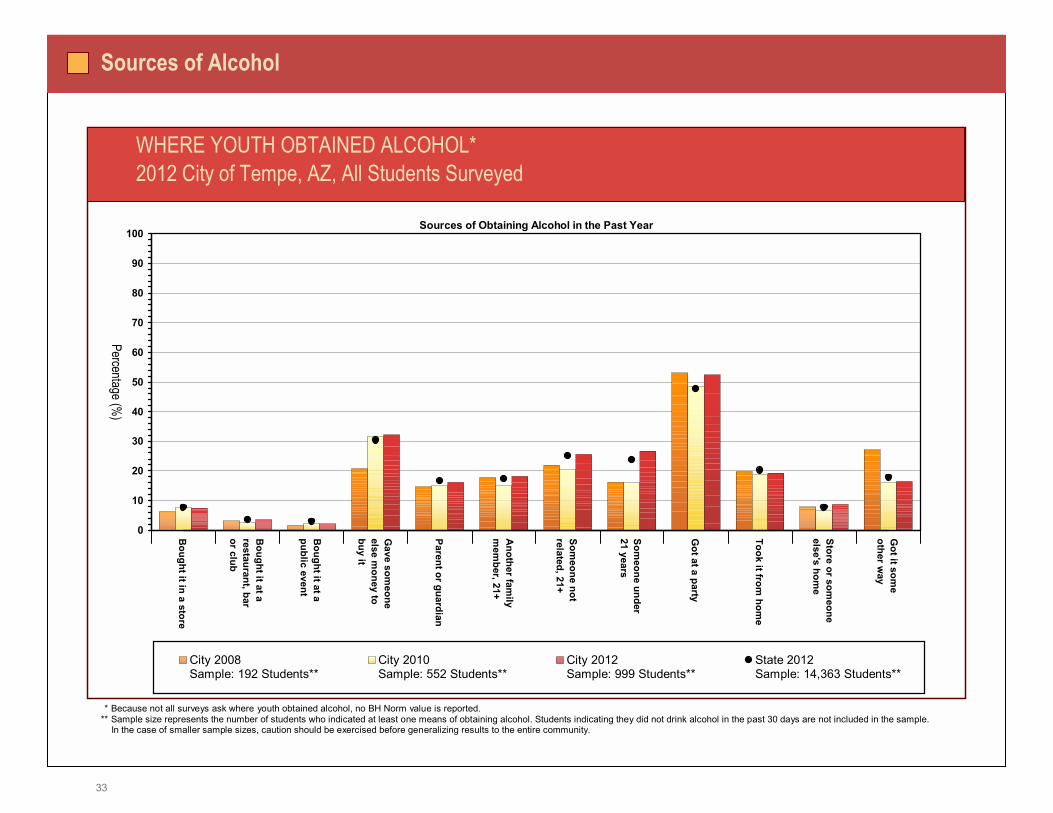
**(Because not all surveys ask where youth obtained alcohol, no BH Norm value is reported. **(Sample size represents the number of students who indicated at least one means of obtaining alcohol. Students indicating they did not drink alcohol in the past 30 days are not included in the sample. **(In the case of smaller sample sizes, caution should be exercised before generalizing results to the entire community.
Sources of Alcohol
Bought it in a store
Bought it at a
restaurant, bar or club
Bought it at a
public event
Gave som
eoneelse m
oney to buy it
Parent or guardian
Another fam
ily m
ember, 21+
Someone not
related, 21+
Someone under
21 years
Got at a party
Took it from hom
e
Store or someone
else's home
Got it som
e other w
ay
0
10
20
30
40
50
60
70
80
90
100
Percentage (%)
City 2008Sample: 192 Students**
City 2010Sample: 552 Students**
City 2012Sample: 999 Students**
State 2012Sample: 14,363 Students**
WHERE YOUTH OBTAINED ALCOHOL*2012 City of Tempe, AZ, All Students Surveyed
Sources of Obtaining Alcohol in the Past Year
34
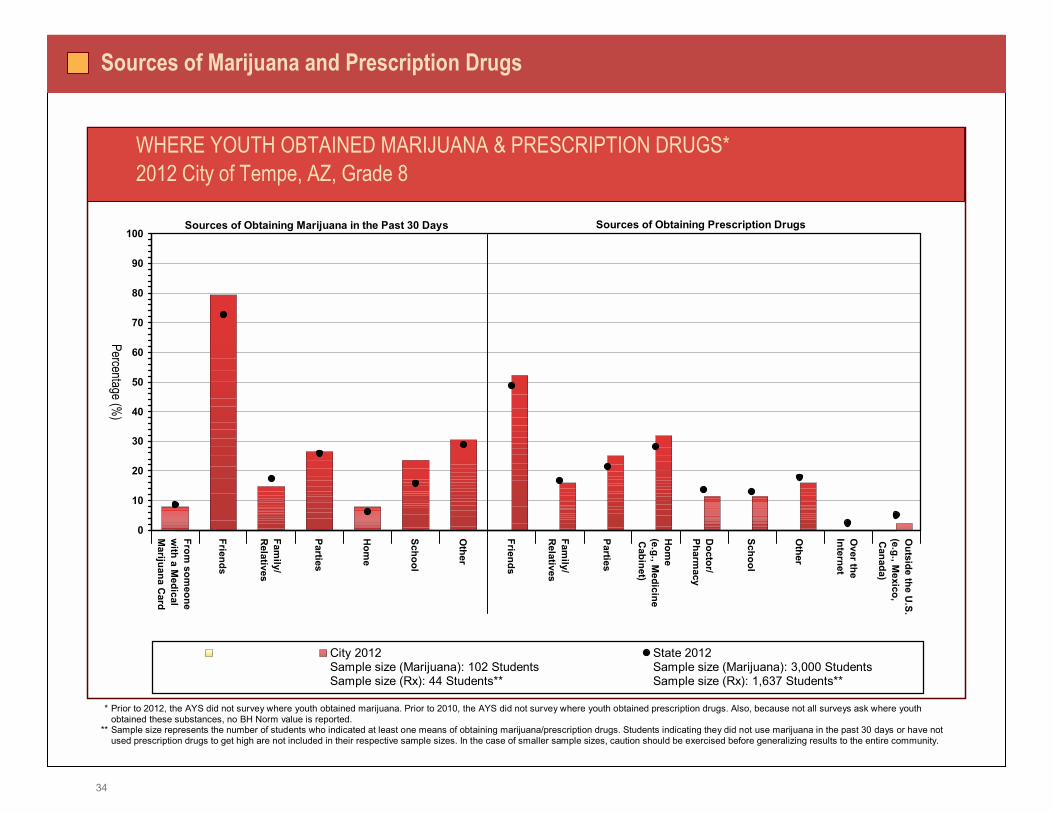
**(Prior to 2012, the AYS did not survey where youth obtained marijuana. Prior to 2010, the AYS did not survey where youth obtained prescription drugs. Also, because not all surveys ask where youth obtained these substances, no BH Norm value is reported. **(Sample size represents the number of students who indicated at least one means of obtaining marijuana/prescription drugs. Students indicating they did not use marijuana in the past 30 days or have not used prescription drugs to get high are not included in their respective sample sizes. In the case of smaller sample sizes, caution should be exercised before generalizing results to the entire community.
Sources of Marijuana and Prescription Drugs
From som
eone w
ith a Medical
Marijuana C
ard
Friends
Family/
Relatives
Parties
Hom
e
School
Other
Friends
Family/
Relatives
Parties
Hom
e (e.g., M
edicine C
abinet)
Doctor/
Pharmacy
School
Other
Over the
Internet
Outside the U
.S.(e.g., M
exico, C
anada)
0
10
20
30
40
50
60
70
80
90
100
Percentage (%)
City 2012Sample size (Marijuana): 102 StudentsSample size (Rx): 44 Students**
State 2012Sample size (Marijuana): 3,000 StudentsSample size (Rx): 1,637 Students**
WHERE YOUTH OBTAINED MARIJUANA & PRESCRIPTION DRUGS*2012 City of Tempe, AZ, Grade 8
Sources of Obtaining Marijuana in the Past 30 Days Sources of Obtaining Prescription Drugs
35
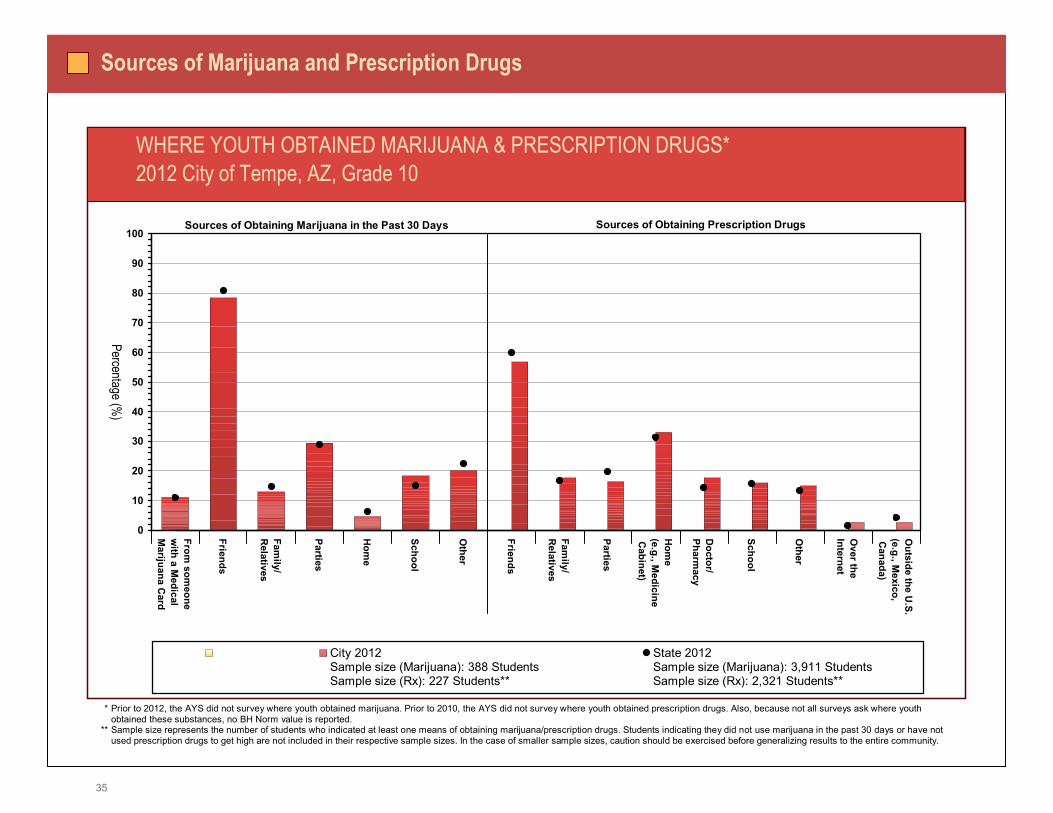
**(Prior to 2012, the AYS did not survey where youth obtained marijuana. Prior to 2010, the AYS did not survey where youth obtained prescription drugs. Also, because not all surveys ask where youth obtained these substances, no BH Norm value is reported. **(Sample size represents the number of students who indicated at least one means of obtaining marijuana/prescription drugs. Students indicating they did not use marijuana in the past 30 days or have not used prescription drugs to get high are not included in their respective sample sizes. In the case of smaller sample sizes, caution should be exercised before generalizing results to the entire community.
Sources of Marijuana and Prescription Drugs
From som
eone w
ith a Medical
Marijuana C
ard
Friends
Family/
Relatives
Parties
Hom
e
School
Other
Friends
Family/
Relatives
Parties
Hom
e (e.g., M
edicine C
abinet)
Doctor/
Pharmacy
School
Other
Over the
Internet
Outside the U
.S.(e.g., M
exico, C
anada)
0
10
20
30
40
50
60
70
80
90
100
Percentage (%)
City 2012Sample size (Marijuana): 388 StudentsSample size (Rx): 227 Students**
State 2012Sample size (Marijuana): 3,911 StudentsSample size (Rx): 2,321 Students**
WHERE YOUTH OBTAINED MARIJUANA & PRESCRIPTION DRUGS*2012 City of Tempe, AZ, Grade 10
Sources of Obtaining Marijuana in the Past 30 Days Sources of Obtaining Prescription Drugs
36
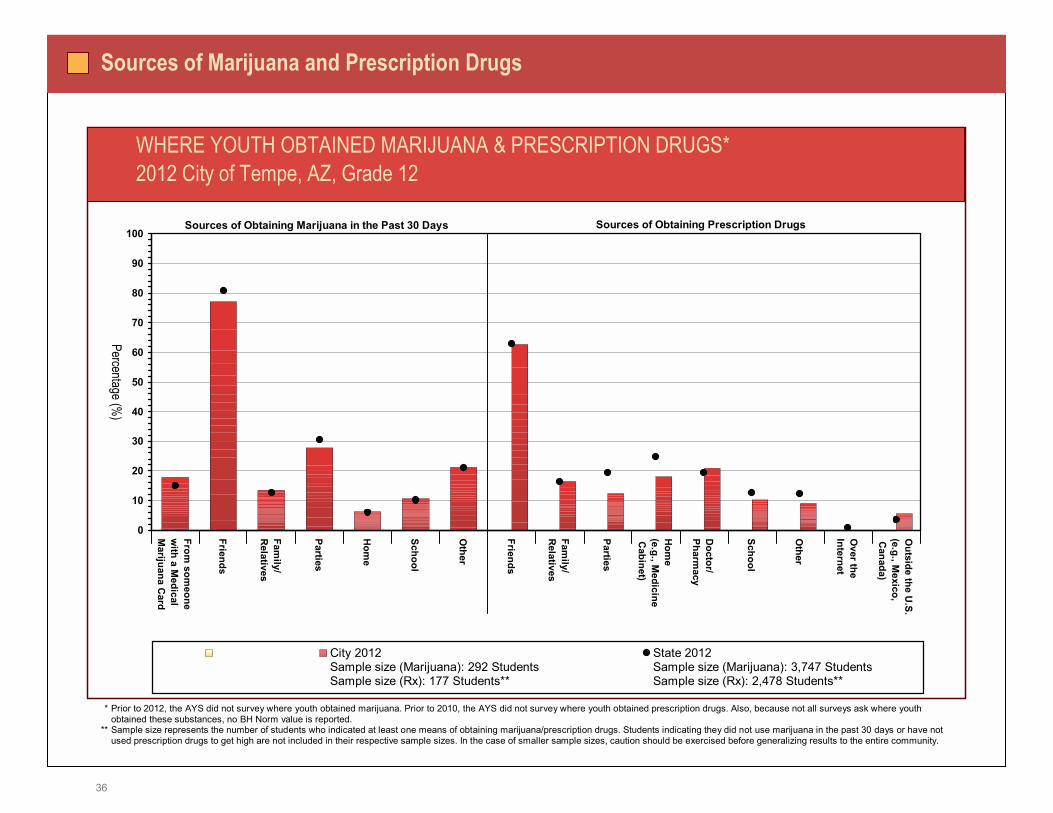
**(Prior to 2012, the AYS did not survey where youth obtained marijuana. Prior to 2010, the AYS did not survey where youth obtained prescription drugs. Also, because not all surveys ask where youth obtained these substances, no BH Norm value is reported. **(Sample size represents the number of students who indicated at least one means of obtaining marijuana/prescription drugs. Students indicating they did not use marijuana in the past 30 days or have not used prescription drugs to get high are not included in their respective sample sizes. In the case of smaller sample sizes, caution should be exercised before generalizing results to the entire community.
Sources of Marijuana and Prescription Drugs
From som
eone w
ith a Medical
Marijuana C
ard
Friends
Family/
Relatives
Parties
Hom
e
School
Other
Friends
Family/
Relatives
Parties
Hom
e (e.g., M
edicine C
abinet)
Doctor/
Pharmacy
School
Other
Over the
Internet
Outside the U
.S.(e.g., M
exico, C
anada)
0
10
20
30
40
50
60
70
80
90
100
Percentage (%)
City 2012Sample size (Marijuana): 292 StudentsSample size (Rx): 177 Students**
State 2012Sample size (Marijuana): 3,747 StudentsSample size (Rx): 2,478 Students**
WHERE YOUTH OBTAINED MARIJUANA & PRESCRIPTION DRUGS*2012 City of Tempe, AZ, Grade 12
Sources of Obtaining Marijuana in the Past 30 Days Sources of Obtaining Prescription Drugs
37
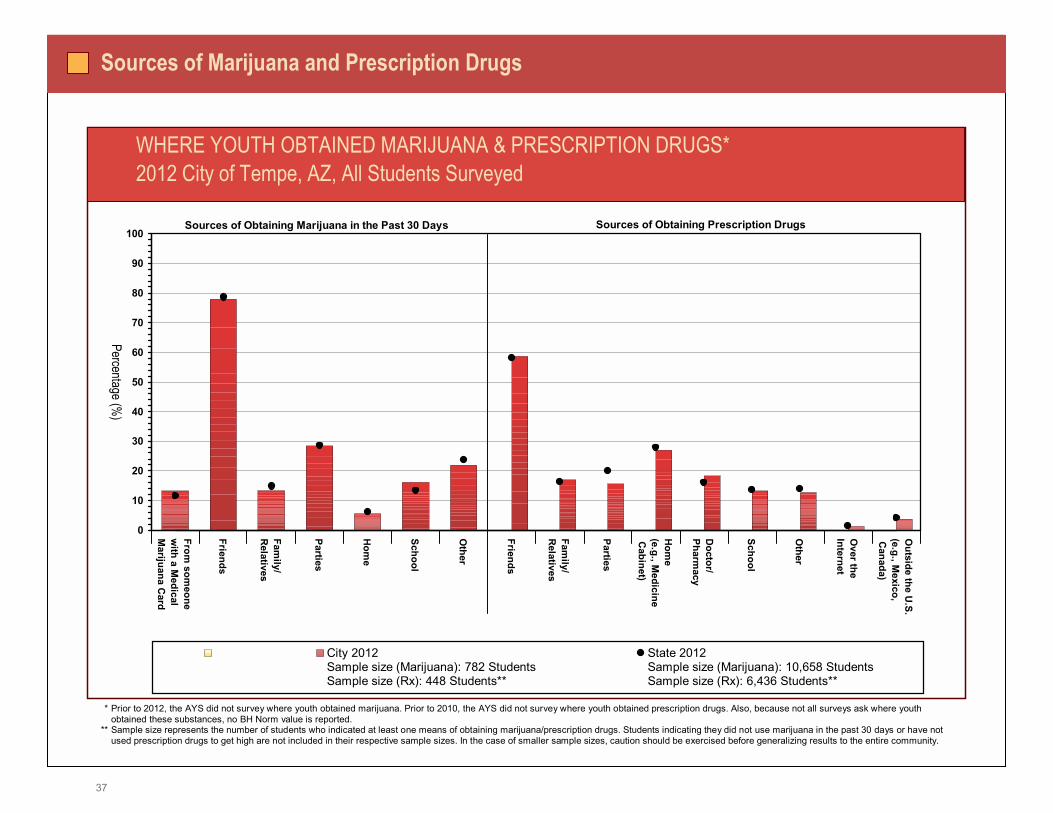
**(Prior to 2012, the AYS did not survey where youth obtained marijuana. Prior to 2010, the AYS did not survey where youth obtained prescription drugs. Also, because not all surveys ask where youth obtained these substances, no BH Norm value is reported. **(Sample size represents the number of students who indicated at least one means of obtaining marijuana/prescription drugs. Students indicating they did not use marijuana in the past 30 days or have not used prescription drugs to get high are not included in their respective sample sizes. In the case of smaller sample sizes, caution should be exercised before generalizing results to the entire community.
Sources of Marijuana and Prescription Drugs
From som
eone w
ith a Medical
Marijuana C
ard
Friends
Family/
Relatives
Parties
Hom
e
School
Other
Friends
Family/
Relatives
Parties
Hom
e (e.g., M
edicine C
abinet)
Doctor/
Pharmacy
School
Other
Over the
Internet
Outside the U
.S.(e.g., M
exico, C
anada)
0
10
20
30
40
50
60
70
80
90
100
Percentage (%)
City 2012Sample size (Marijuana): 782 StudentsSample size (Rx): 448 Students**
State 2012Sample size (Marijuana): 10,658 StudentsSample size (Rx): 6,436 Students**
WHERE YOUTH OBTAINED MARIJUANA & PRESCRIPTION DRUGS*2012 City of Tempe, AZ, All Students Surveyed
Sources of Obtaining Marijuana in the Past 30 Days Sources of Obtaining Prescription Drugs
38
School Safety
Felt Unsafe
at School
Carried a W
eapon on School Property
Threatened or Injured on School Property
In a Physical Fight on School Property
Picked On or
Bullied on
School Property
Harassed or
Mistreated O
n-Line or Electronically*
0
10
20
30
40
50
60
70
80
90
100
Percentage (%)
City 2008 City 2010 City 2012 State 2012
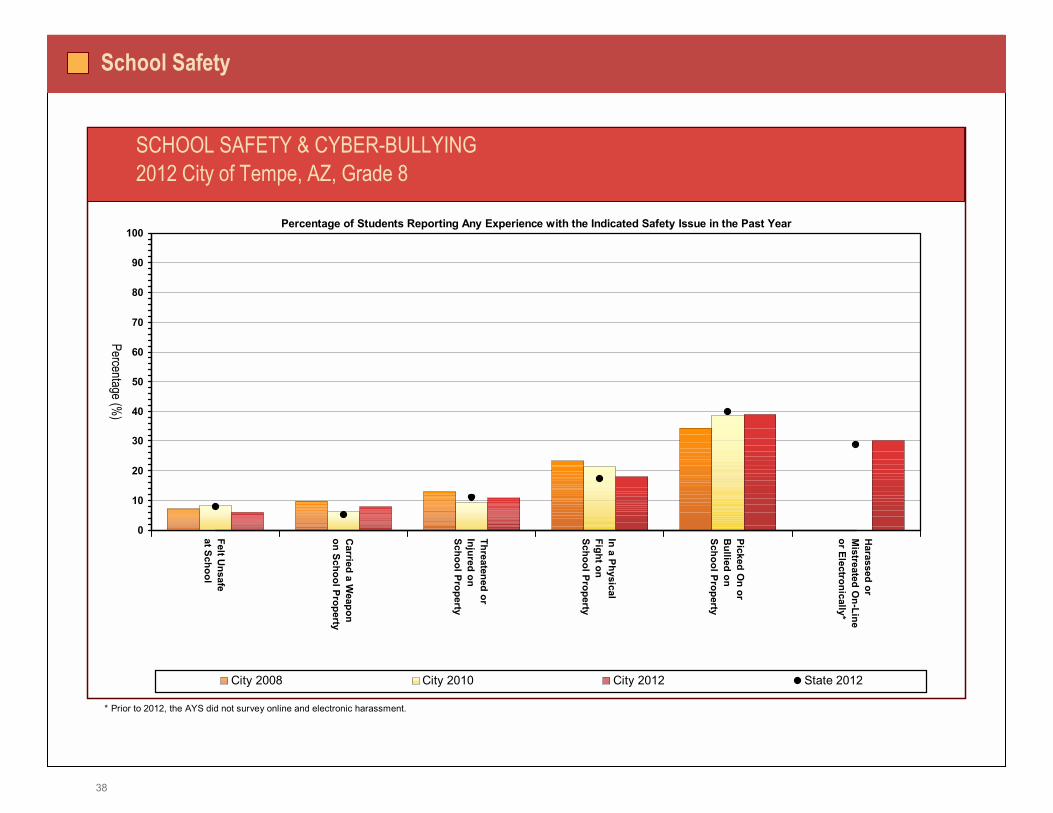
SCHOOL SAFETY & CYBER-BULLYING2012 City of Tempe, AZ, Grade 8
Percentage of Students Reporting Any Experience with the Indicated Safety Issue in the Past Year
**(Prior to 2012, the AYS did not survey online and electronic harassment.
39
School Safety
Felt Unsafe
at School
Carried a W
eapon on School Property
Threatened or Injured on School Property
In a Physical Fight on School Property
Picked On or
Bullied on
School Property
Harassed or
Mistreated O
n-Line or Electronically*
0
10
20
30
40
50
60
70
80
90
100
Percentage (%)
City 2008 City 2010 City 2012 State 2012
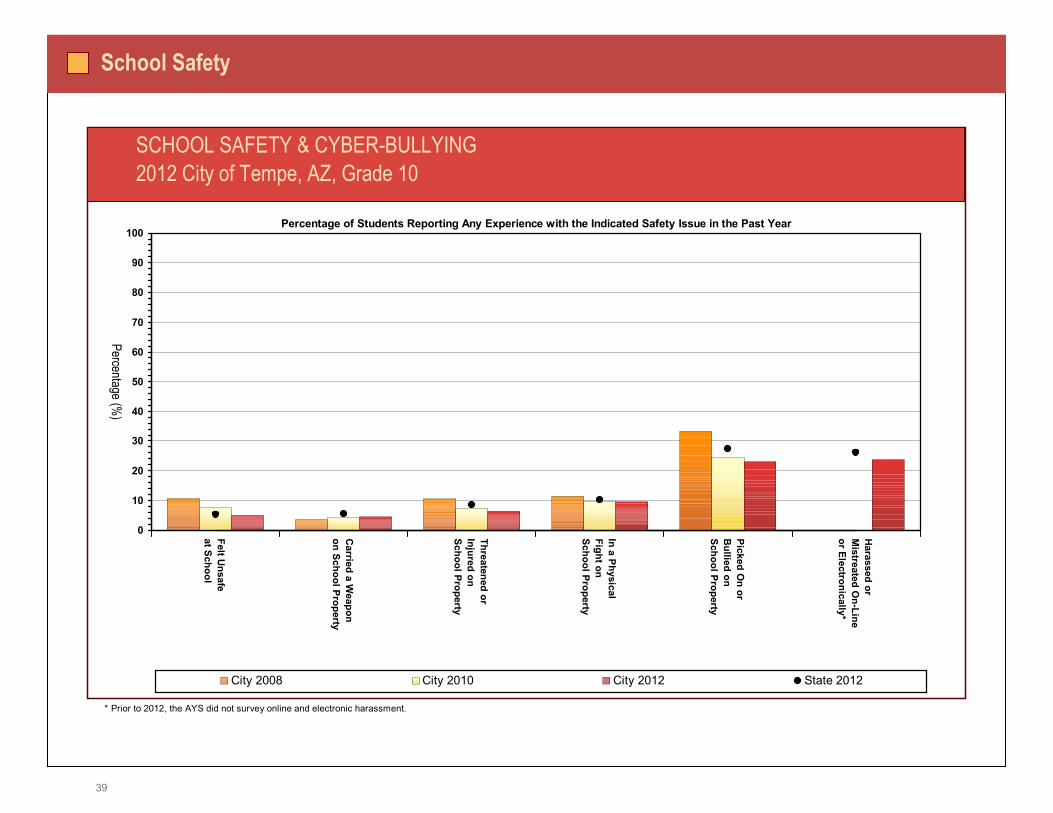
SCHOOL SAFETY & CYBER-BULLYING2012 City of Tempe, AZ, Grade 10
Percentage of Students Reporting Any Experience with the Indicated Safety Issue in the Past Year
**(Prior to 2012, the AYS did not survey online and electronic harassment.
40
School Safety
Felt Unsafe
at School
Carried a W
eapon on School Property
Threatened or Injured on School Property
In a Physical Fight on School Property
Picked On or
Bullied on
School Property
Harassed or
Mistreated O
n-Line or Electronically*
0
10
20
30
40
50
60
70
80
90
100
Percentage (%)
City 2008 City 2010 City 2012 State 2012
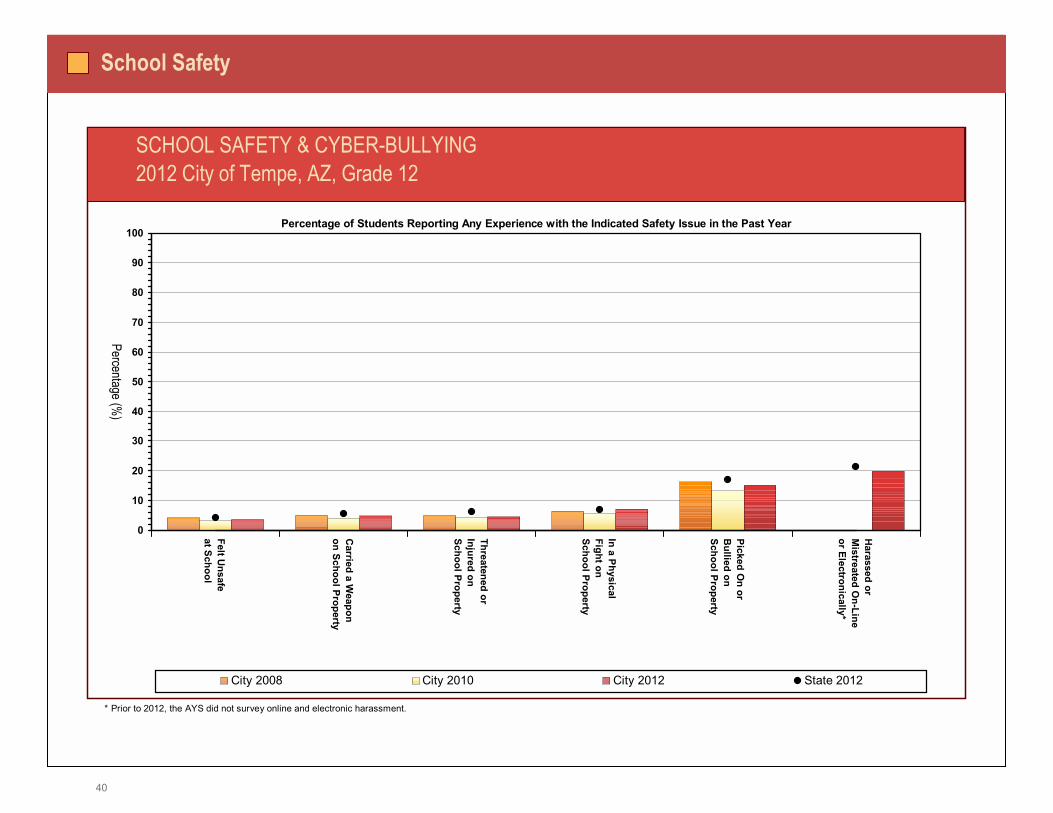
SCHOOL SAFETY & CYBER-BULLYING2012 City of Tempe, AZ, Grade 12
Percentage of Students Reporting Any Experience with the Indicated Safety Issue in the Past Year
**(Prior to 2012, the AYS did not survey online and electronic harassment.
41
School Safety
Felt Unsafe
at School
Carried a W
eapon on School Property
Threatened or Injured on School Property
In a Physical Fight on School Property
Picked On or
Bullied on
School Property
Harassed or
Mistreated O
n-Line or Electronically*
0
10
20
30
40
50
60
70
80
90
100
Percentage (%)
City 2008 City 2010 City 2012 State 2012
SCHOOL SAFETY & CYBER-BULLYING2012 City of Tempe, AZ, All Students Surveyed
Percentage of Students Reporting Any Experience with the Indicated Safety Issue in the Past Year
**(Prior to 2012, the AYS did not survey online and electronic harassment.
42
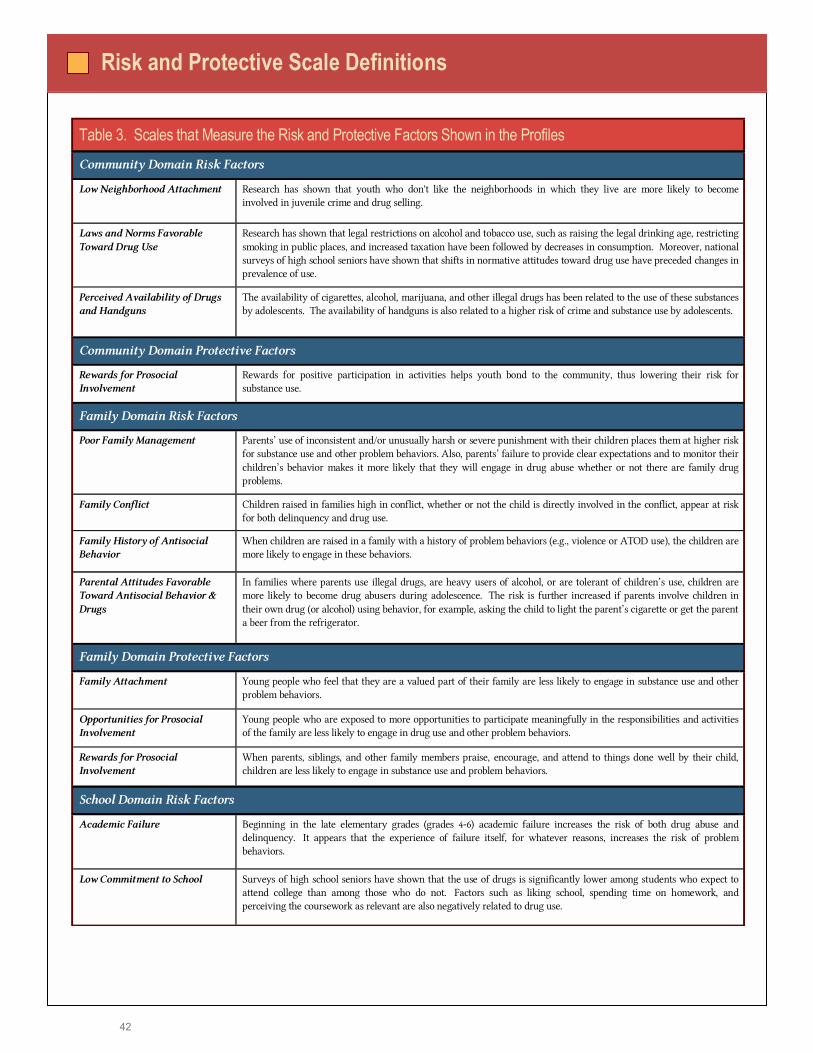
1 Low Neighborhood Attachment Research has shown that youth who don't like the neighborhoods in which they live are more likely to becomeinvolved in juvenile crime and drug selling.
11 Laws and Norms Favorable Toward Drug Use
Research has shown that legal restrictions on alcohol and tobacco use, such as raising the legal drinking age, restrictingsmoking in public places, and increased taxation have been followed by decreases in consumption. Moreover, nationalsurveys of high school seniors have shown that shifts in normative attitudes toward drug use have preceded changes inprevalence of use.
11 Perceived Availability of Drugs and Handguns
The availability of cigarettes, alcohol, marijuana, and other illegal drugs has been related to the use of these substancesby adolescents. The availability of handguns is also related to a higher risk of crime and substance use by adolescents.
1 Rewards for Prosocial Involvement
Rewards for positive participation in activities helps youth bond to the community, thus lowering their risk forsubstance use.
1 Poor Family Management Parents� use of inconsistent and/or unusually harsh or severe punishment with their children places them at higher riskfor substance use and other problem behaviors. Also, parents� failure to provide clear expectations and to monitor theirchildren�s behavior makes it more likely that they will engage in drug abuse whether or not there are family drugproblems.
1 Family Conflict Children raised in families high in conflict, whether or not the child is directly involved in the conflict, appear at riskfor both delinquency and drug use.
1 Family History of Antisocial Behavior
When children are raised in a family with a history of problem behaviors (e.g., violence or ATOD use), the children aremore likely to engage in these behaviors.
1 Parental Attitudes Favorable Toward Antisocial Behavior & Drugs
In families where parents use illegal drugs, are heavy users of alcohol, or are tolerant of children�s use, children aremore likely to become drug abusers during adolescence. The risk is further increased if parents involve children intheir own drug (or alcohol) using behavior, for example, asking the child to light the parent�s cigarette or get the parenta beer from the refrigerator.
1 Family Attachment Young people who feel that they are a valued part of their family are less likely to engage in substance use and otherproblem behaviors.
1 Opportunities for Prosocial Involvement
Young people who are exposed to more opportunities to participate meaningfully in the responsibilities and activitiesof the family are less likely to engage in drug use and other problem behaviors.
1 Rewards for Prosocial Involvement
When parents, siblings, and other family members praise, encourage, and attend to things done well by their child,children are less likely to engage in substance use and problem behaviors.
1 Academic Failure Beginning in the late elementary grades (grades 4-6) academic failure increases the risk of both drug abuse anddelinquency. It appears that the experience of failure itself, for whatever reasons, increases the risk of problembehaviors.
1 Low Commitment to School Surveys of high school seniors have shown that the use of drugs is significantly lower among students who expect toattend college than among those who do not. Factors such as liking school, spending time on homework, andperceiving the coursework as relevant are also negatively related to drug use.
Table 3. Scales that Measure the Risk and Protective Factors Shown in the ProfilesCommunity Domain Risk Factors
Community Domain Protective Factors
Family Domain Risk Factors
Family Domain Protective Factors
School Domain Risk Factors
Risk and Protective Scale Definitions
43
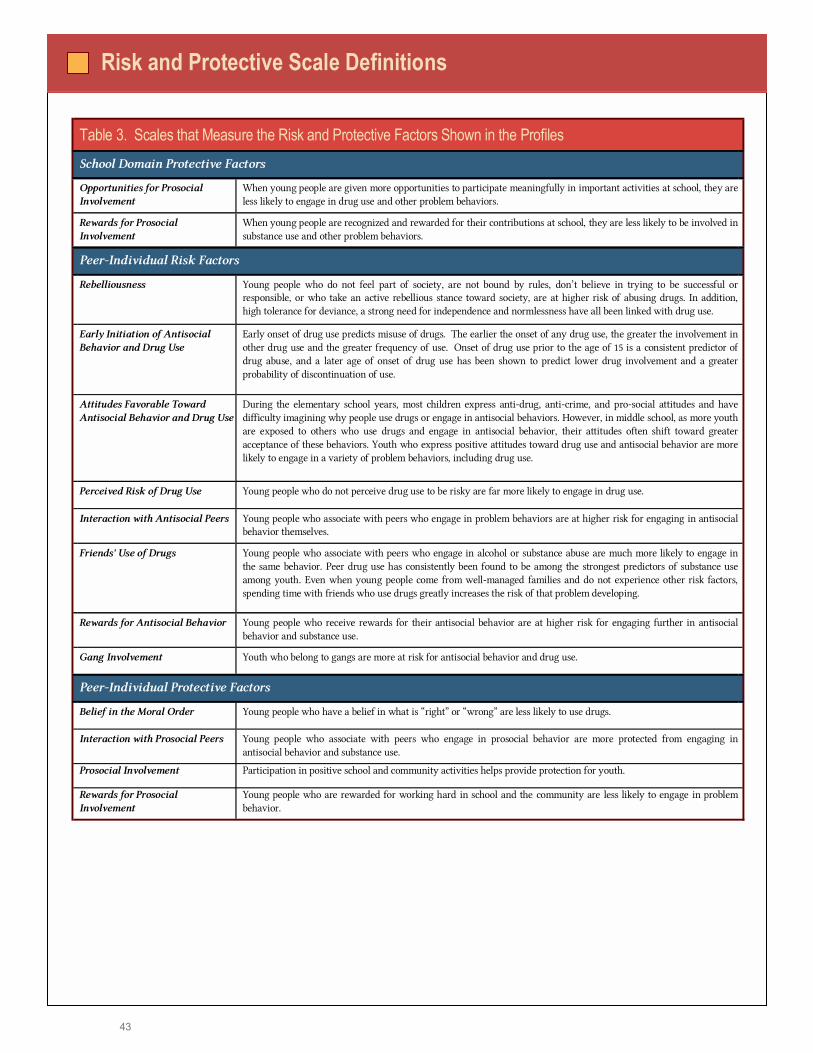
Risk and Protective Scale Definitions
1 Opportunities for Prosocial Involvement
When young people are given more opportunities to participate meaningfully in important activities at school, they areless likely to engage in drug use and other problem behaviors.
1 Rewards for Prosocial Involvement
When young people are recognized and rewarded for their contributions at school, they are less likely to be involved insubstance use and other problem behaviors.
1
1 Rebelliousness Young people who do not feel part of society, are not bound by rules, don�t believe in trying to be successful orresponsible, or who take an active rebellious stance toward society, are at higher risk of abusing drugs. In addition,high tolerance for deviance, a strong need for independence and normlessness have all been linked with drug use.
1
1 Early Initiation of Antisocial Behavior and Drug Use
Early onset of drug use predicts misuse of drugs. The earlier the onset of any drug use, the greater the involvement inother drug use and the greater frequency of use. Onset of drug use prior to the age of 15 is a consistent predictor ofdrug abuse, and a later age of onset of drug use has been shown to predict lower drug involvement and a greaterprobability of discontinuation of use.
1 Attitudes Favorable Toward Antisocial Behavior and Drug Use
During the elementary school years, most children express anti-drug, anti-crime, and pro-social attitudes and havedifficulty imagining why people use drugs or engage in antisocial behaviors. However, in middle school, as more youthare exposed to others who use drugs and engage in antisocial behavior, their attitudes often shift toward greateracceptance of these behaviors. Youth who express positive attitudes toward drug use and antisocial behavior are morelikely to engage in a variety of problem behaviors, including drug use.
1 Perceived Risk of Drug Use Young people who do not perceive drug use to be risky are far more likely to engage in drug use.
1 Interaction with Antisocial Peers Young people who associate with peers who engage in problem behaviors are at higher risk for engaging in antisocialbehavior themselves.
1 Friends' Use of Drugs Young people who associate with peers who engage in alcohol or substance abuse are much more likely to engage inthe same behavior. Peer drug use has consistently been found to be among the strongest predictors of substance useamong youth. Even when young people come from well-managed families and do not experience other risk factors,spending time with friends who use drugs greatly increases the risk of that problem developing.
1 Rewards for Antisocial Behavior Young people who receive rewards for their antisocial behavior are at higher risk for engaging further in antisocialbehavior and substance use.
1
1 Gang Involvement Youth who belong to gangs are more at risk for antisocial behavior and drug use.
1 Belief in the Moral Order Young people who have a belief in what is �right� or �wrong� are less likely to use drugs.
1 Interaction with Prosocial Peers Young people who associate with peers who engage in prosocial behavior are more protected from engaging inantisocial behavior and substance use.
1 Prosocial Involvement Participation in positive school and community activities helps provide protection for youth.
1 Rewards for Prosocial Involvement
Young people who are rewarded for working hard in school and the community are less likely to engage in problembehavior.
School Domain Protective Factors
Peer-Individual Protective Factors
Peer-Individual Risk Factors
Table 3. Scales that Measure the Risk and Protective Factors Shown in the Profiles

44
Data Tables
Table 4. Percentage of Students Who Used ATODs During Their Lifetime
City2008
City2010
City2012
State2012
MTF 2011
City2008
City2010
City2012
State2012
MTF 2011
City2008
City2010
City2012
State2012
MTF 2011
City2008
City2010
City2012
State2012
MTF 2011
Alcohol had alcoholic beverages (beer, wine or hard liquor) to drink - more than just a few sips? 50.0 47.6 39.3 37.3 33.1 67.5 70.0 61.1 59.1 56.0 71.6 69.7 71.1 69.2 70.0 59.0 61.3 59.2 51.7 51.5
Cigarettes smoked cigarettes? 27.4 25.9 22.8 19.7 18.4 36.3 40.2 32.4 31.7 30.4 46.4 39.4 44.5 42.1 40.0 33.7 34.4 33.8 28.8 28.7
Chewing Tobacco used smokeless tobacco (chew, snuff, plug, dipping tobacco, chewing tobacco)? 8.0 5.1 3.2 4.5 9.7 3.5 10.9 6.5 9.3 15.6 10.6 15.5 10.7 14.7 16.9 7.3 10.6 7.0 8.4 13.8
Marijuana used marijuana? 18.8 21.5 19.2 16.2 16.4 32.5 36.3 38.9 34.7 34.5 39.7 42.4 47.8 44.8 45.5 26.7 33.2 37.1 28.7 31.0
Hallucinogens used LSD or other hallucinogens? 1.6 3.1 1.4 1.7 3.3 1.0 5.1 5.2 5.2 6.0 5.7 7.1 8.9 8.4 8.3 2.2 5.2 5.4 4.4 5.7
Cocaine used cocaine or crack? 2.6 2.4 0.9 1.5 2.2 4.5 4.6 3.2 3.9 3.3 9.9 5.1 6.8 7.4 5.2 4.6 4.0 3.8 3.7 3.4
Inhalants sniffed glue, breathed the contents of an aerosol spray can, or inhaled other gases or sprays, in order to get high?
11.8 18.4 15.8 11.4 13.1 9.5 10.9 8.9 9.4 10.1 5.7 7.5 7.5 7.4 8.1 10.0 12.4 10.0 9.8 10.6
Methamphetamines used methamphetamines (meth, crystal meth)? 1.3 0.7 0.1 0.6 1.3 2.0 1.6 1.4 1.5 2.1 2.9 1.7 1.3 1.8 2.1 1.8 1.3 1.1 1.2 1.8
Heroin* used heroin? 1.1 1.2 0.4 0.7 1.2 1.0 2.3 0.9 1.4 1.2 1.4 2.4 2.1 1.8 1.4 1.1 1.9 1.2 1.2 1.2
Ecstasy used Ecstasy (�X�, �E�, or MDMA)? 0.8 3.3 3.2 2.8 2.6 3.5 7.9 7.1 7.4 6.6 1.4 7.5 10.6 10.4 8.0 1.7 6.0 7.3 6.1 5.5
Other Club Drugs** used other "club" drugs (such as Special K, Roofies, GHB, or Rohypnol)? n/a n/a 1.9 1.9 n/a n/a n/a 2.7 2.5 n/a n/a n/a 3.8 3.1 n/a n/a n/a 2.8 2.4 n/a
Steroids used steroids or anabolic steroids (such as Anadrol, Oxandrin, Durabolin, Equipoise or Depotesterone)? 0.3 1.6 2.4 1.5 1.2 2.5 0.7 1.6 1.8 1.4 1.4 1.1 1.8 1.9 1.8 1.1 1.2 1.8 1.7 1.5
Prescription Pain Relievers�
used prescription pain relievers (such as Vicodin, OxyContin, Percocet or Codeine) without a doctor telling you to take them?
11.4 12.1 11.0 8.8 n/a 15.9 15.4 16.0 15.6 n/a 17.1 19.5 21.3 20.7 13.0 13.8 15.9 16.5 13.8 n/a
Prescription Stimulants
used prescription stimulants (such as Ritalin, Adderall, or Dexedrine) without a doctor telling you to take them?
4.0 3.9 2.0 2.0 5.2 2.5 5.9 6.6 6.6 9.0 3.6 8.3 9.3 9.9 12.2 3.5 6.1 6.4 5.3 8.6
Prescription Sedatives�
used prescription sedatives (tranquilizers, such as Valium or Xanax, barbiturates, or sleeping pills)? 9.6 10.6 5.9 4.4 n/a 7.5 11.0 9.0 8.0 n/a 9.3 9.8 8.5 10.0 n/a 9.0 10.3 8.1 6.9 n/a
Prescription Drugs�
combined results of prescription stimulant, sedative and pain reliever questions (see appendix for details)
17.0 18.5 13.5 11.1 n/a 21.4 22.0 19.9 18.8 n/a 24.3 23.1 25.0 23.9 n/a 19.6 21.1 20.0 16.6 n/a
Over-the-Counter Drugs�
used over-the-counter drugs (such as cough syrup, cold medicine, or diet pills) for the purposes of getting high?
9.4 10.7 8.8 7.0 n/a 12.5 14.3 11.8 10.6 n/a 12.1 12.3 14.0 12.2 n/a 10.8 12.1 11.8 9.3 n/a
Synthetic Drugs**� used synthetic drugs (such as Bath Salts like Ivory Wave or White Lighting or herbal incense products like K2, Spice, or Gold)?
n/a n/a 7.6 6.9 n/a n/a n/a 11.2 11.1 n/a n/a n/a 13.5 13.9 n/a n/a n/a 11.1 9.9 n/a
***���
No equivalent category for these substances in the Monitoring the Future survey. In the case of Prescription Pain Relievers , MTF does not have reliable data for grades 8 and 10.
Grade 10Grade 8 Grade 12
State and national data for All Students Surveyed are drawn from grades 8, 10 and 12. Depending on which grades were surveyed in a particular report, (e.g., 8 and 10 only), caution should be exercised when comparing rates.
Denotes a change in the wording of the question between 2012 and prior administrations. Consult appendix for a detailed explanation.Substance categories that were not measured and reported in one or more survey administrations prior to 2012 (also denoted by 'n/a' in the data column).
In your lifetime, on how many occasions (if any) have you� (One or more occasions)
All Students Surveyed��
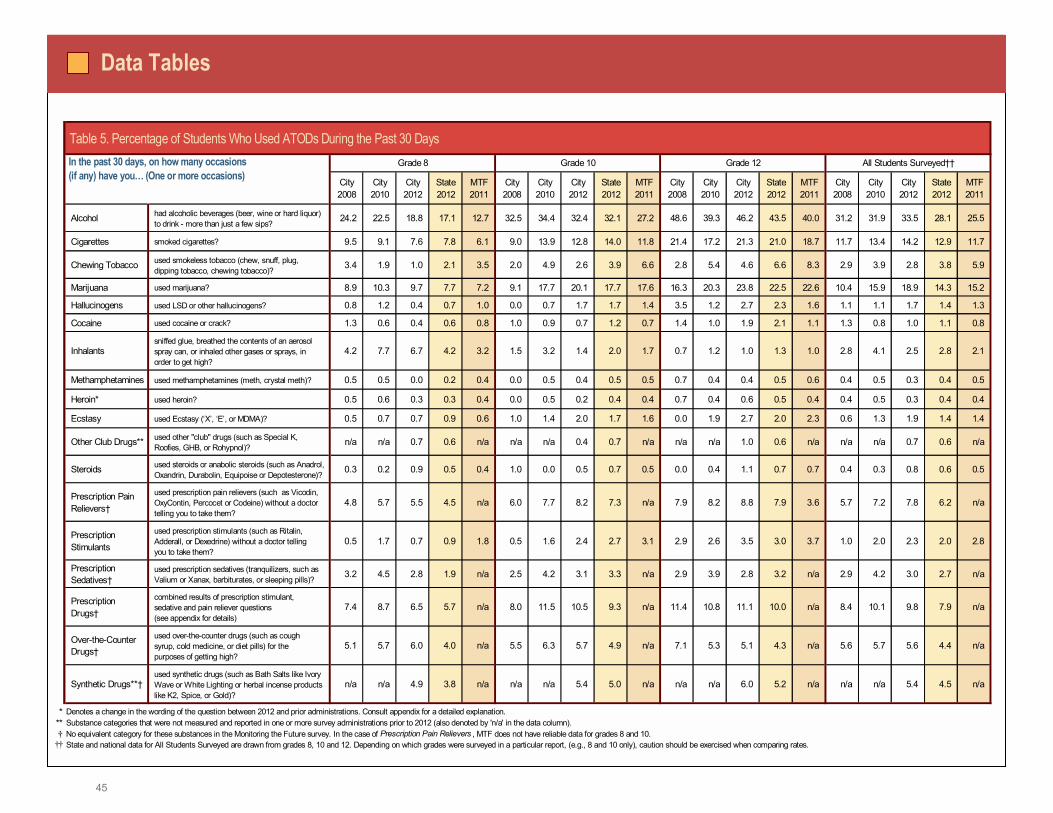
45
Data Tables
Table 5. Percentage of Students Who Used ATODs During the Past 30 Days
City2008
City2010
City2012
State2012
MTF 2011
City2008
City2010
City2012
State2012
MTF 2011
City2008
City2010
City2012
State2012
MTF 2011
City2008
City2010
City2012
State2012
MTF 2011
Alcohol had alcoholic beverages (beer, wine or hard liquor) to drink - more than just a few sips? 24.2 22.5 18.8 17.1 12.7 32.5 34.4 32.4 32.1 27.2 48.6 39.3 46.2 43.5 40.0 31.2 31.9 33.5 28.1 25.5
Cigarettes smoked cigarettes? 9.5 9.1 7.6 7.8 6.1 9.0 13.9 12.8 14.0 11.8 21.4 17.2 21.3 21.0 18.7 11.7 13.4 14.2 12.9 11.7
Chewing Tobacco used smokeless tobacco (chew, snuff, plug, dipping tobacco, chewing tobacco)? 3.4 1.9 1.0 2.1 3.5 2.0 4.9 2.6 3.9 6.6 2.8 5.4 4.6 6.6 8.3 2.9 3.9 2.8 3.8 5.9
Marijuana used marijuana? 8.9 10.3 9.7 7.7 7.2 9.1 17.7 20.1 17.7 17.6 16.3 20.3 23.8 22.5 22.6 10.4 15.9 18.9 14.3 15.2
Hallucinogens used LSD or other hallucinogens? 0.8 1.2 0.4 0.7 1.0 0.0 0.7 1.7 1.7 1.4 3.5 1.2 2.7 2.3 1.6 1.1 1.1 1.7 1.4 1.3
Cocaine used cocaine or crack? 1.3 0.6 0.4 0.6 0.8 1.0 0.9 0.7 1.2 0.7 1.4 1.0 1.9 2.1 1.1 1.3 0.8 1.0 1.1 0.8
Inhalants sniffed glue, breathed the contents of an aerosol spray can, or inhaled other gases or sprays, in order to get high?
4.2 7.7 6.7 4.2 3.2 1.5 3.2 1.4 2.0 1.7 0.7 1.2 1.0 1.3 1.0 2.8 4.1 2.5 2.8 2.1
Methamphetamines used methamphetamines (meth, crystal meth)? 0.5 0.5 0.0 0.2 0.4 0.0 0.5 0.4 0.5 0.5 0.7 0.4 0.4 0.5 0.6 0.4 0.5 0.3 0.4 0.5
Heroin* used heroin? 0.5 0.6 0.3 0.3 0.4 0.0 0.5 0.2 0.4 0.4 0.7 0.4 0.6 0.5 0.4 0.4 0.5 0.3 0.4 0.4
Ecstasy used Ecstasy (�X�, �E�, or MDMA)? 0.5 0.7 0.7 0.9 0.6 1.0 1.4 2.0 1.7 1.6 0.0 1.9 2.7 2.0 2.3 0.6 1.3 1.9 1.4 1.4
Other Club Drugs** used other "club" drugs (such as Special K, Roofies, GHB, or Rohypnol)? n/a n/a 0.7 0.6 n/a n/a n/a 0.4 0.7 n/a n/a n/a 1.0 0.6 n/a n/a n/a 0.7 0.6 n/a
Steroids used steroids or anabolic steroids (such as Anadrol, Oxandrin, Durabolin, Equipoise or Depotesterone)? 0.3 0.2 0.9 0.5 0.4 1.0 0.0 0.5 0.7 0.5 0.0 0.4 1.1 0.7 0.7 0.4 0.3 0.8 0.6 0.5
Prescription Pain Relievers�
used prescription pain relievers (such as Vicodin, OxyContin, Percocet or Codeine) without a doctor telling you to take them?
4.8 5.7 5.5 4.5 n/a 6.0 7.7 8.2 7.3 n/a 7.9 8.2 8.8 7.9 3.6 5.7 7.2 7.8 6.2 n/a
Prescription Stimulants
used prescription stimulants (such as Ritalin, Adderall, or Dexedrine) without a doctor telling you to take them?
0.5 1.7 0.7 0.9 1.8 0.5 1.6 2.4 2.7 3.1 2.9 2.6 3.5 3.0 3.7 1.0 2.0 2.3 2.0 2.8
Prescription Sedatives�
used prescription sedatives (tranquilizers, such as Valium or Xanax, barbiturates, or sleeping pills)? 3.2 4.5 2.8 1.9 n/a 2.5 4.2 3.1 3.3 n/a 2.9 3.9 2.8 3.2 n/a 2.9 4.2 3.0 2.7 n/a
Prescription Drugs�
combined results of prescription stimulant, sedative and pain reliever questions (see appendix for details)
7.4 8.7 6.5 5.7 n/a 8.0 11.5 10.5 9.3 n/a 11.4 10.8 11.1 10.0 n/a 8.4 10.1 9.8 7.9 n/a
Over-the-Counter Drugs�
used over-the-counter drugs (such as cough syrup, cold medicine, or diet pills) for the purposes of getting high?
5.1 5.7 6.0 4.0 n/a 5.5 6.3 5.7 4.9 n/a 7.1 5.3 5.1 4.3 n/a 5.6 5.7 5.6 4.4 n/a
Synthetic Drugs**� used synthetic drugs (such as Bath Salts like Ivory Wave or White Lighting or herbal incense products like K2, Spice, or Gold)?
n/a n/a 4.9 3.8 n/a n/a n/a 5.4 5.0 n/a n/a n/a 6.0 5.2 n/a n/a n/a 5.4 4.5 n/a
***���
In the past 30 days, on how many occasions (if any) have you� (One or more occasions)
Grade 10 All Students Surveyed��Grade 8 Grade 12
State and national data for All Students Surveyed are drawn from grades 8, 10 and 12. Depending on which grades were surveyed in a particular report, (e.g., 8 and 10 only), caution should be exercised when comparing rates.No equivalent category for these substances in the Monitoring the Future survey. In the case of Prescription Pain Relievers , MTF does not have reliable data for grades 8 and 10.Substance categories that were not measured and reported in one or more survey administrations prior to 2012 (also denoted by 'n/a' in the data column).Denotes a change in the wording of the question between 2012 and prior administrations. Consult appendix for a detailed explanation.
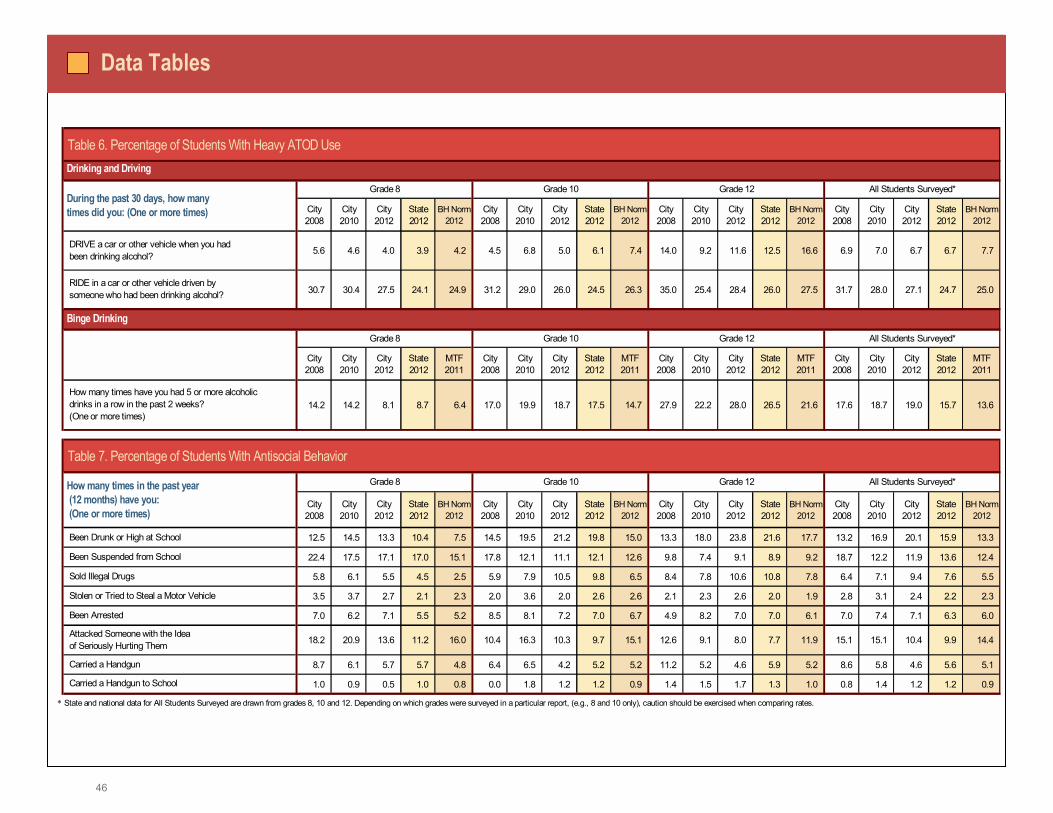
46
Data Tables
Table 6. Percentage of Students With Heavy ATOD Use
City2008
City2010
City2012
State2012
BH Norm 2012
City2008
City2010
City2012
State2012
BH Norm 2012
City2008
City2010
City2012
State2012
BH Norm 2012
City2008
City2010
City2012
State2012
BH Norm 2012
5.6 4.6 4.0 3.9 4.2 4.5 6.8 5.0 6.1 7.4 14.0 9.2 11.6 12.5 16.6 6.9 7.0 6.7 6.7 7.7
30.7 30.4 27.5 24.1 24.9 31.2 29.0 26.0 24.5 26.3 35.0 25.4 28.4 26.0 27.5 31.7 28.0 27.1 24.7 25.0
City2008
City2010
City2012
State2012
MTF 2011
City2008
City2010
City2012
State2012
MTF 2011
City2008
City2010
City2012
State2012
MTF 2011
City2008
City2010
City2012
State2012
MTF 2011
14.2 14.2 8.1 8.7 6.4 17.0 19.9 18.7 17.5 14.7 27.9 22.2 28.0 26.5 21.6 17.6 18.7 19.0 15.7 13.6
Table 7. Percentage of Students With Antisocial Behavior
City2008
City2010
City2012
State2012
BH Norm 2012
City2008
City2010
City2012
State2012
BH Norm 2012
City2008
City2010
City2012
State2012
BH Norm 2012
City2008
City2010
City2012
State2012
BH Norm 2012
12.5 14.5 13.3 10.4 7.5 14.5 19.5 21.2 19.8 15.0 13.3 18.0 23.8 21.6 17.7 13.2 16.9 20.1 15.9 13.3
22.4 17.5 17.1 17.0 15.1 17.8 12.1 11.1 12.1 12.6 9.8 7.4 9.1 8.9 9.2 18.7 12.2 11.9 13.6 12.4
5.8 6.1 5.5 4.5 2.5 5.9 7.9 10.5 9.8 6.5 8.4 7.8 10.6 10.8 7.8 6.4 7.1 9.4 7.6 5.5
3.5 3.7 2.7 2.1 2.3 2.0 3.6 2.0 2.6 2.6 2.1 2.3 2.6 2.0 1.9 2.8 3.1 2.4 2.2 2.3
7.0 6.2 7.1 5.5 5.2 8.5 8.1 7.2 7.0 6.7 4.9 8.2 7.0 7.0 6.1 7.0 7.4 7.1 6.3 6.0
18.2 20.9 13.6 11.2 16.0 10.4 16.3 10.3 9.7 15.1 12.6 9.1 8.0 7.7 11.9 15.1 15.1 10.4 9.9 14.4
8.7 6.1 5.7 5.7 4.8 6.4 6.5 4.2 5.2 5.2 11.2 5.2 4.6 5.9 5.2 8.6 5.8 4.6 5.6 5.1
1.0 0.9 0.5 1.0 0.8 0.0 1.8 1.2 1.2 0.9 1.4 1.5 1.7 1.3 1.0 0.8 1.4 1.2 1.2 0.9
* State and national data for All Students Surveyed are drawn from grades 8, 10 and 12. Depending on which grades were surveyed in a particular report, (e.g., 8 and 10 only), caution should be exercised when comparing rates.
All Students Surveyed*Grade 12
Carried a Handgun to School
How many times in the past year (12 months) have you: (One or more times)
Grade 8 Grade 10
Stolen or Tried to Steal a Motor Vehicle
Attacked Someone with the Idea of Seriously Hurting Them
Carried a Handgun
Sold Illegal Drugs
Drinking and Driving
RIDE in a car or other vehicle driven by someone who had been drinking alcohol?
DRIVE a car or other vehicle when you had been drinking alcohol?
During the past 30 days, how many times did you: (One or more times)
How many times have you had 5 or more alcoholic drinks in a row in the past 2 weeks? (One or more times)
All Students Surveyed*Grade 8 Grade 12Grade 10
Binge Drinking
Been Arrested
Been Drunk or High at School
Been Suspended from School
Grade 8 Grade 10 Grade 12 All Students Surveyed*
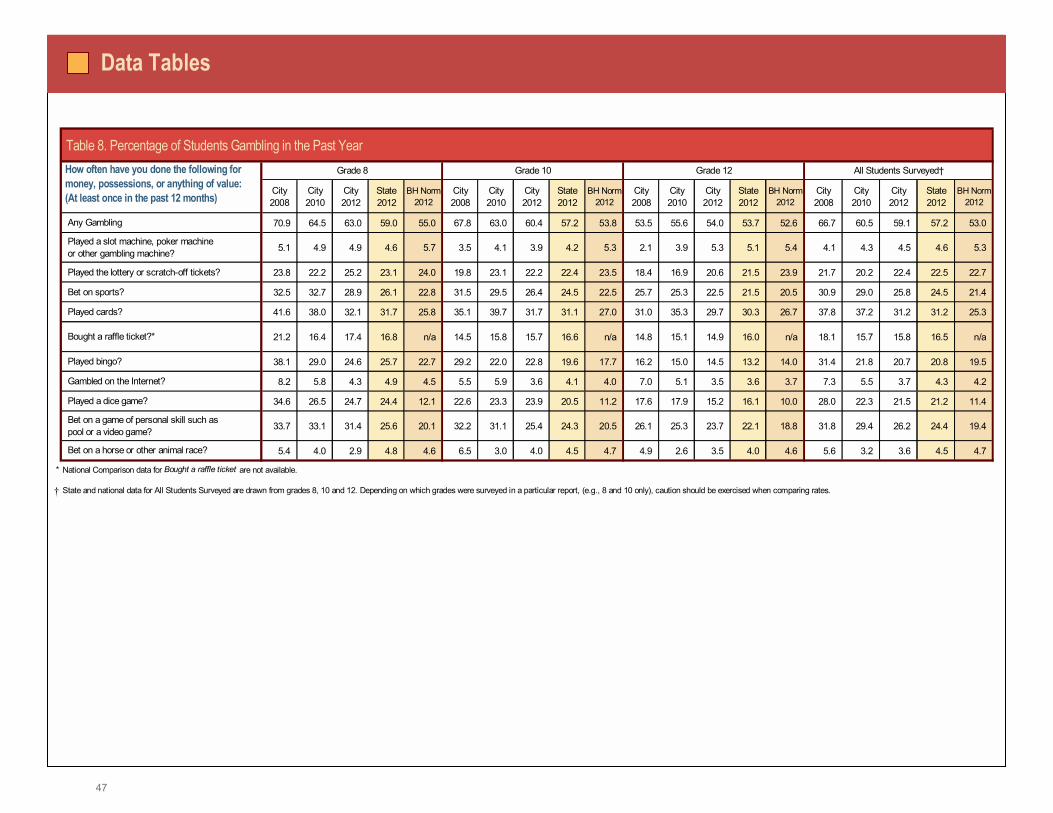
47
Data Tables
Table 8. Percentage of Students Gambling in the Past Year
City2008
City2010
City2012
State2012
BH Norm 2012
City2008
City2010
City2012
State2012
BH Norm 2012
City2008
City2010
City2012
State2012
BH Norm 2012
City2008
City2010
City2012
State2012
BH Norm 2012
70.9 64.5 63.0 59.0 55.0 67.8 63.0 60.4 57.2 53.8 53.5 55.6 54.0 53.7 52.6 66.7 60.5 59.1 57.2 53.0
5.1 4.9 4.9 4.6 5.7 3.5 4.1 3.9 4.2 5.3 2.1 3.9 5.3 5.1 5.4 4.1 4.3 4.5 4.6 5.3
23.8 22.2 25.2 23.1 24.0 19.8 23.1 22.2 22.4 23.5 18.4 16.9 20.6 21.5 23.9 21.7 20.2 22.4 22.5 22.7
32.5 32.7 28.9 26.1 22.8 31.5 29.5 26.4 24.5 22.5 25.7 25.3 22.5 21.5 20.5 30.9 29.0 25.8 24.5 21.4
41.6 38.0 32.1 31.7 25.8 35.1 39.7 31.7 31.1 27.0 31.0 35.3 29.7 30.3 26.7 37.8 37.2 31.2 31.2 25.3
21.2 16.4 17.4 16.8 n/a 14.5 15.8 15.7 16.6 n/a 14.8 15.1 14.9 16.0 n/a 18.1 15.7 15.8 16.5 n/a
38.1 29.0 24.6 25.7 22.7 29.2 22.0 22.8 19.6 17.7 16.2 15.0 14.5 13.2 14.0 31.4 21.8 20.7 20.8 19.5
8.2 5.8 4.3 4.9 4.5 5.5 5.9 3.6 4.1 4.0 7.0 5.1 3.5 3.6 3.7 7.3 5.5 3.7 4.3 4.2
34.6 26.5 24.7 24.4 12.1 22.6 23.3 23.9 20.5 11.2 17.6 17.9 15.2 16.1 10.0 28.0 22.3 21.5 21.2 11.4
33.7 33.1 31.4 25.6 20.1 32.2 31.1 25.4 24.3 20.5 26.1 25.3 23.7 22.1 18.8 31.8 29.4 26.2 24.4 19.4
5.4 4.0 2.9 4.8 4.6 6.5 3.0 4.0 4.5 4.7 4.9 2.6 3.5 4.0 4.6 5.6 3.2 3.6 4.5 4.7
*
�
National Comparison data for Bought a raffle ticket are not available.
State and national data for All Students Surveyed are drawn from grades 8, 10 and 12. Depending on which grades were surveyed in a particular report, (e.g., 8 and 10 only), caution should be exercised when comparing rates.
Bet on sports?
Played a dice game?
Bet on a game of personal skill such as pool or a video game?
Bet on a horse or other animal race?
Played cards?
Bought a raffle ticket?*
Played bingo?
Gambled on the Internet?
All Students Surveyed�
Any Gambling
Played a slot machine, poker machine or other gambling machine?
Played the lottery or scratch-off tickets?
How often have you done the following for money, possessions, or anything of value: (At least once in the past 12 months)
Grade 8 Grade 10 Grade 12
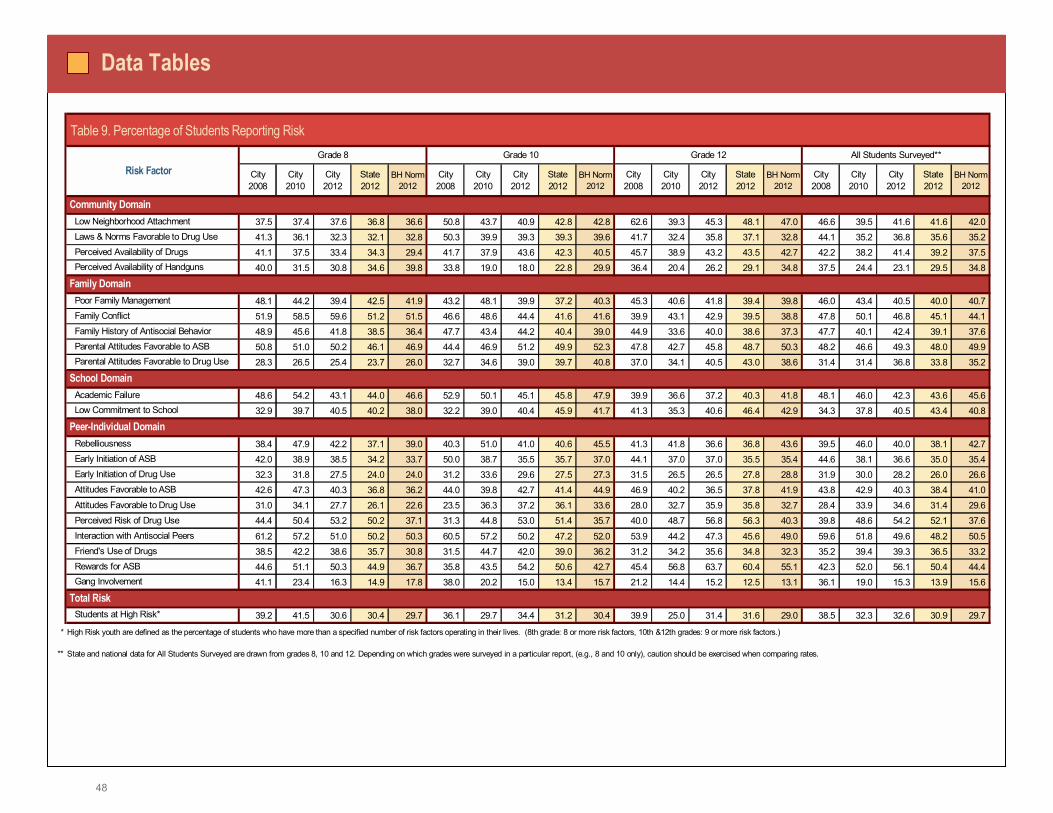
48
Data Tables
Table 9. Percentage of Students Reporting Risk
City2008
City2010
City2012
State2012
BH Norm 2012
City2008
City2010
City2012
State2012
BH Norm 2012
City2008
City2010
City2012
State2012
BH Norm 2012
City2008
City2010
City2012
State2012
BH Norm 2012
37.5 37.4 37.6 36.8 36.6 50.8 43.7 40.9 42.8 42.8 62.6 39.3 45.3 48.1 47.0 46.6 39.5 41.6 41.6 42.0 41.3 36.1 32.3 32.1 32.8 50.3 39.9 39.3 39.3 39.6 41.7 32.4 35.8 37.1 32.8 44.1 35.2 36.8 35.6 35.2 41.1 37.5 33.4 34.3 29.4 41.7 37.9 43.6 42.3 40.5 45.7 38.9 43.2 43.5 42.7 42.2 38.2 41.4 39.2 37.5 40.0 31.5 30.8 34.6 39.8 33.8 19.0 18.0 22.8 29.9 36.4 20.4 26.2 29.1 34.8 37.5 24.4 23.1 29.5 34.8
48.1 44.2 39.4 42.5 41.9 43.2 48.1 39.9 37.2 40.3 45.3 40.6 41.8 39.4 39.8 46.0 43.4 40.5 40.0 40.7 51.9 58.5 59.6 51.2 51.5 46.6 48.6 44.4 41.6 41.6 39.9 43.1 42.9 39.5 38.8 47.8 50.1 46.8 45.1 44.1 48.9 45.6 41.8 38.5 36.4 47.7 43.4 44.2 40.4 39.0 44.9 33.6 40.0 38.6 37.3 47.7 40.1 42.4 39.1 37.6 50.8 51.0 50.2 46.1 46.9 44.4 46.9 51.2 49.9 52.3 47.8 42.7 45.8 48.7 50.3 48.2 46.6 49.3 48.0 49.9 28.3 26.5 25.4 23.7 26.0 32.7 34.6 39.0 39.7 40.8 37.0 34.1 40.5 43.0 38.6 31.4 31.4 36.8 33.8 35.2
48.6 54.2 43.1 44.0 46.6 52.9 50.1 45.1 45.8 47.9 39.9 36.6 37.2 40.3 41.8 48.1 46.0 42.3 43.6 45.6 32.9 39.7 40.5 40.2 38.0 32.2 39.0 40.4 45.9 41.7 41.3 35.3 40.6 46.4 42.9 34.3 37.8 40.5 43.4 40.8
38.4 47.9 42.2 37.1 39.0 40.3 51.0 41.0 40.6 45.5 41.3 41.8 36.6 36.8 43.6 39.5 46.0 40.0 38.1 42.7 42.0 38.9 38.5 34.2 33.7 50.0 38.7 35.5 35.7 37.0 44.1 37.0 37.0 35.5 35.4 44.6 38.1 36.6 35.0 35.4 32.3 31.8 27.5 24.0 24.0 31.2 33.6 29.6 27.5 27.3 31.5 26.5 26.5 27.8 28.8 31.9 30.0 28.2 26.0 26.6 42.6 47.3 40.3 36.8 36.2 44.0 39.8 42.7 41.4 44.9 46.9 40.2 36.5 37.8 41.9 43.8 42.9 40.3 38.4 41.0 31.0 34.1 27.7 26.1 22.6 23.5 36.3 37.2 36.1 33.6 28.0 32.7 35.9 35.8 32.7 28.4 33.9 34.6 31.4 29.6 44.4 50.4 53.2 50.2 37.1 31.3 44.8 53.0 51.4 35.7 40.0 48.7 56.8 56.3 40.3 39.8 48.6 54.2 52.1 37.6
61.2 57.2 51.0 50.2 50.3 60.5 57.2 50.2 47.2 52.0 53.9 44.2 47.3 45.6 49.0 59.6 51.8 49.6 48.2 50.5 38.5 42.2 38.6 35.7 30.8 31.5 44.7 42.0 39.0 36.2 31.2 34.2 35.6 34.8 32.3 35.2 39.4 39.3 36.5 33.2 44.6 51.1 50.3 44.9 36.7 35.8 43.5 54.2 50.6 42.7 45.4 56.8 63.7 60.4 55.1 42.3 52.0 56.1 50.4 44.4 41.1 23.4 16.3 14.9 17.8 38.0 20.2 15.0 13.4 15.7 21.2 14.4 15.2 12.5 13.1 36.1 19.0 15.3 13.9 15.6
39.2 41.5 30.6 30.4 29.7 36.1 29.7 34.4 31.2 30.4 39.9 25.0 31.4 31.6 29.0 38.5 32.3 32.6 30.9 29.7
*
** State and national data for All Students Surveyed are drawn from grades 8, 10 and 12. Depending on which grades were surveyed in a particular report, (e.g., 8 and 10 only), caution should be exercised when comparing rates.
Perceived Risk of Drug Use
Students at High Risk*
Attitudes Favorable to ASB
Attitudes Favorable to Drug Use
Total Risk
Friend's Use of Drugs Rewards for ASB Gang Involvement
High Risk youth are defined as the percentage of students who have more than a specified number of risk factors operating in their lives. (8th grade: 8 or more risk factors, 10th &12th grades: 9 or more risk factors.)
All Students Surveyed**
Perceived Availability of Handguns
Community Domain Low Neighborhood Attachment
Perceived Availability of Drugs Laws & Norms Favorable to Drug Use
Grade 12
Risk FactorGrade 8 Grade 10
Family History of Antisocial Behavior Parental Attitudes Favorable to ASB
Family Domain Poor Family Management Family Conflict
Parental Attitudes Favorable to Drug Use
School Domain
Interaction with Antisocial Peers
Rebelliousness Early Initiation of ASB Early Initiation of Drug Use
Academic Failure Low Commitment to School
Peer-Individual Domain
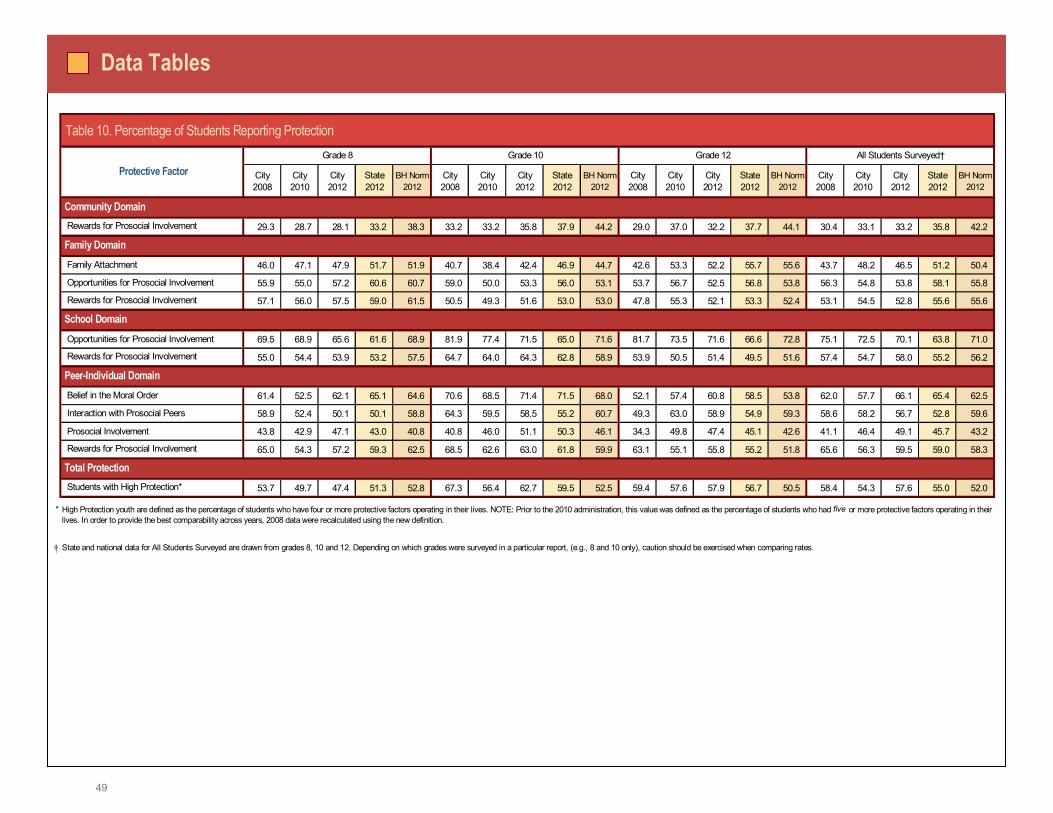
49
Data Tables
Table 10. Percentage of Students Reporting Protection
City2008
City2010
City2012
State2012
BH Norm 2012
City2008
City2010
City2012
State2012
BH Norm 2012
City2008
City2010
City2012
State2012
BH Norm 2012
City2008
City2010
City2012
State2012
BH Norm 2012
29.3 28.7 28.1 33.2 38.3 33.2 33.2 35.8 37.9 44.2 29.0 37.0 32.2 37.7 44.1 30.4 33.1 33.2 35.8 42.2
46.0 47.1 47.9 51.7 51.9 40.7 38.4 42.4 46.9 44.7 42.6 53.3 52.2 55.7 55.6 43.7 48.2 46.5 51.2 50.4
55.9 55.0 57.2 60.6 60.7 59.0 50.0 53.3 56.0 53.1 53.7 56.7 52.5 56.8 53.8 56.3 54.8 53.8 58.1 55.8
57.1 56.0 57.5 59.0 61.5 50.5 49.3 51.6 53.0 53.0 47.8 55.3 52.1 53.3 52.4 53.1 54.5 52.8 55.6 55.6
69.5 68.9 65.6 61.6 68.9 81.9 77.4 71.5 65.0 71.6 81.7 73.5 71.6 66.6 72.8 75.1 72.5 70.1 63.8 71.0
55.0 54.4 53.9 53.2 57.5 64.7 64.0 64.3 62.8 58.9 53.9 50.5 51.4 49.5 51.6 57.4 54.7 58.0 55.2 56.2
61.4 52.5 62.1 65.1 64.6 70.6 68.5 71.4 71.5 68.0 52.1 57.4 60.8 58.5 53.8 62.0 57.7 66.1 65.4 62.5
58.9 52.4 50.1 50.1 58.8 64.3 59.5 58.5 55.2 60.7 49.3 63.0 58.9 54.9 59.3 58.6 58.2 56.7 52.8 59.6
43.8 42.9 47.1 43.0 40.8 40.8 46.0 51.1 50.3 46.1 34.3 49.8 47.4 45.1 42.6 41.1 46.4 49.1 45.7 43.2
65.0 54.3 57.2 59.3 62.5 68.5 62.6 63.0 61.8 59.9 63.1 55.1 55.8 55.2 51.8 65.6 56.3 59.5 59.0 58.3
53.7 49.7 47.4 51.3 52.8 67.3 56.4 62.7 59.5 52.5 59.4 57.6 57.9 56.7 50.5 58.4 54.3 57.6 55.0 52.0
*
� State and national data for All Students Surveyed are drawn from grades 8, 10 and 12. Depending on which grades were surveyed in a particular report, (e.g., 8 and 10 only), caution should be exercised when comparing rates.
High Protection youth are defined as the percentage of students who have four or more protective factors operating in their lives. NOTE: Prior to the 2010 administration, this value was defined as the percentage of students who had five or more protective factors operating in their lives. In order to provide the best comparability across years, 2008 data were recalculated using the new definition.
Total Protection Students with High Protection*
Family Domain
Interaction with Prosocial Peers
School Domain Opportunities for Prosocial Involvement
Rewards for Prosocial Involvement
Belief in the Moral Order
Family Attachment
Opportunities for Prosocial Involvement
Rewards for Prosocial Involvement
Grade 12
Rewards for Prosocial Involvement
All Students Surveyed�Grade 8
Peer-Individual Domain
Rewards for Prosocial Involvement
Protective FactorGrade 10
Community Domain
Prosocial Involvement
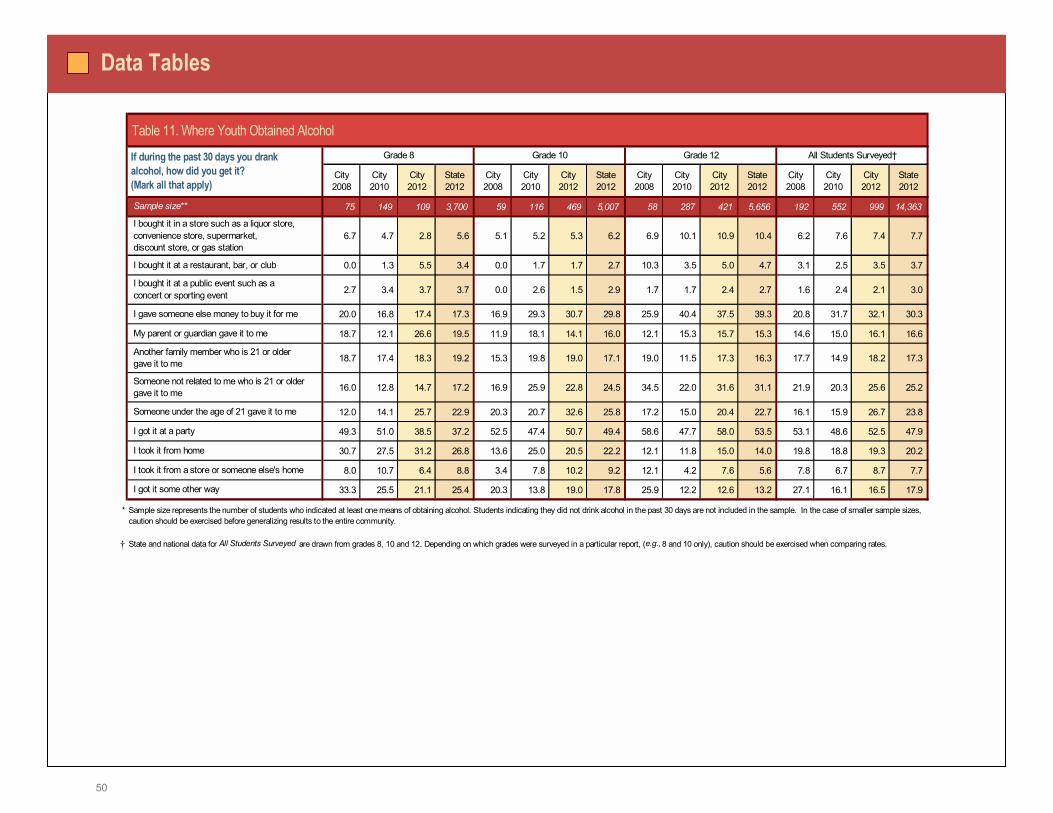
50
Data Tables
Table 11. Where Youth Obtained Alcohol
City2008
City2010
City2012
State2012
City2008
City2010
City2012
State2012
City2008
City2010
City2012
State2012
City2008
City2010
City2012
State2012
75 149 109 3,700 59 116 469 5,007 58 287 421 5,656 192 552 999 14,363
6.7 4.7 2.8 5.6 5.1 5.2 5.3 6.2 6.9 10.1 10.9 10.4 6.2 7.6 7.4 7.7
0.0 1.3 5.5 3.4 0.0 1.7 1.7 2.7 10.3 3.5 5.0 4.7 3.1 2.5 3.5 3.7
2.7 3.4 3.7 3.7 0.0 2.6 1.5 2.9 1.7 1.7 2.4 2.7 1.6 2.4 2.1 3.0
20.0 16.8 17.4 17.3 16.9 29.3 30.7 29.8 25.9 40.4 37.5 39.3 20.8 31.7 32.1 30.3
18.7 12.1 26.6 19.5 11.9 18.1 14.1 16.0 12.1 15.3 15.7 15.3 14.6 15.0 16.1 16.6
18.7 17.4 18.3 19.2 15.3 19.8 19.0 17.1 19.0 11.5 17.3 16.3 17.7 14.9 18.2 17.3
16.0 12.8 14.7 17.2 16.9 25.9 22.8 24.5 34.5 22.0 31.6 31.1 21.9 20.3 25.6 25.2
12.0 14.1 25.7 22.9 20.3 20.7 32.6 25.8 17.2 15.0 20.4 22.7 16.1 15.9 26.7 23.8
49.3 51.0 38.5 37.2 52.5 47.4 50.7 49.4 58.6 47.7 58.0 53.5 53.1 48.6 52.5 47.9
30.7 27.5 31.2 26.8 13.6 25.0 20.5 22.2 12.1 11.8 15.0 14.0 19.8 18.8 19.3 20.2
8.0 10.7 6.4 8.8 3.4 7.8 10.2 9.2 12.1 4.2 7.6 5.6 7.8 6.7 8.7 7.7
33.3 25.5 21.1 25.4 20.3 13.8 19.0 17.8 25.9 12.2 12.6 13.2 27.1 16.1 16.5 17.9
*
�
Sample size represents the number of students who indicated at least one means of obtaining alcohol. Students indicating they did not drink alcohol in the past 30 days are not included in the sample. In the case of smaller sample sizes, caution should be exercised before generalizing results to the entire community.
I got it some other way
Someone not related to me who is 21 or older gave it to me
Someone under the age of 21 gave it to me
I got it at a party
I took it from home
I gave someone else money to buy it for me
My parent or guardian gave it to me
I bought it at a restaurant, bar, or club
I bought it in a store such as a liquor store, convenience store, supermarket, discount store, or gas station
State and national data for All Students Surveyed are drawn from grades 8, 10 and 12. Depending on which grades were surveyed in a particular report, (e.g., 8 and 10 only), caution should be exercised when comparing rates.
Grade 10 All Students Surveyed� If during the past 30 days you drank alcohol, how did you get it? (Mark all that apply)
Grade 8 Grade 12
Sample size**
Another family member who is 21 or older gave it to me
I took it from a store or someone else's home
I bought it at a public event such as a concert or sporting event
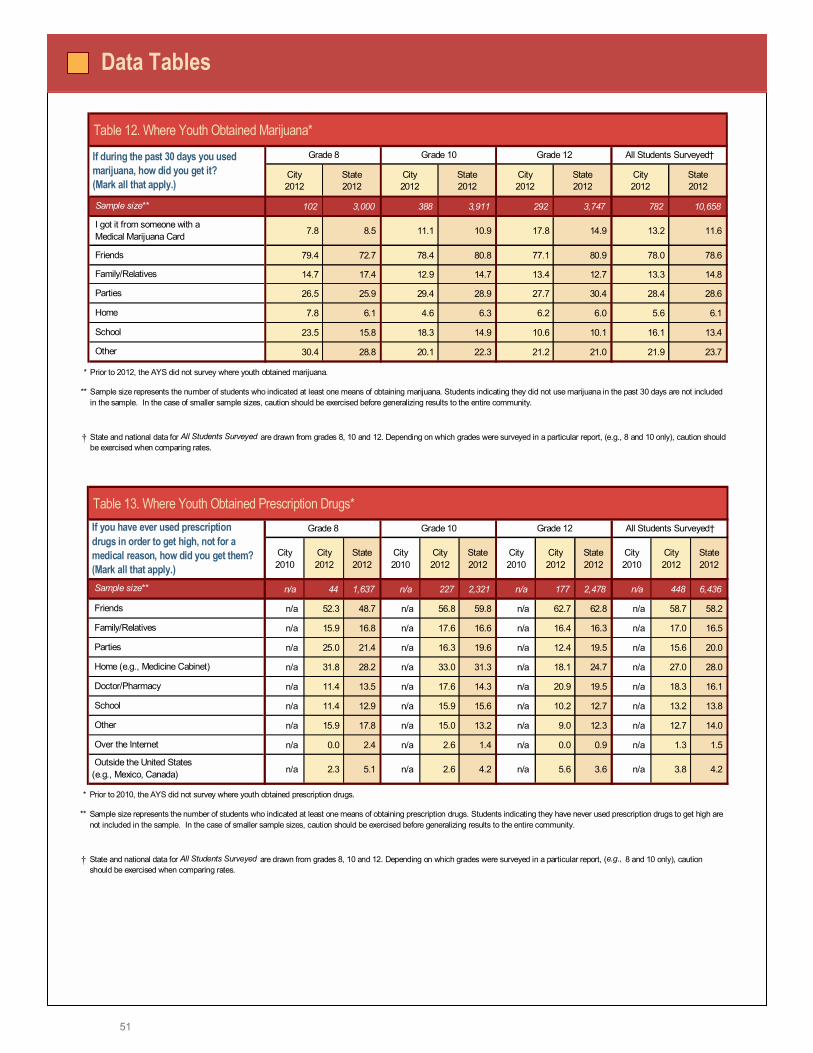
51
Table 12. Where Youth Obtained Marijuana*
City2012
State2012
City2012
State2012
City2012
State2012
City2012
State2012
102 3,000 388 3,911 292 3,747 782 10,658
7.8 8.5 11.1 10.9 17.8 14.9 13.2 11.6
79.4 72.7 78.4 80.8 77.1 80.9 78.0 78.6
14.7 17.4 12.9 14.7 13.4 12.7 13.3 14.8
26.5 25.9 29.4 28.9 27.7 30.4 28.4 28.6
7.8 6.1 4.6 6.3 6.2 6.0 5.6 6.1
23.5 15.8 18.3 14.9 10.6 10.1 16.1 13.4
30.4 28.8 20.1 22.3 21.2 21.0 21.9 23.7
*
**
� State and national data for All Students Surveyed are drawn from grades 8, 10 and 12. Depending on which grades were surveyed in a particular report, (e.g., 8 and 10 only), caution should be exercised when comparing rates.
Grade 10 All Students Surveyed� If during the past 30 days you used marijuana, how did you get it? (Mark all that apply.)
Grade 8 Grade 12
Sample size**
School
Sample size represents the number of students who indicated at least one means of obtaining marijuana. Students indicating they did not use marijuana in the past 30 days are not included in the sample. In the case of smaller sample sizes, caution should be exercised before generalizing results to the entire community.
Prior to 2012, the AYS did not survey where youth obtained marijuana.
Friends
I got it from someone with a Medical Marijuana Card
Other
Parties
Home
Family/Relatives
Data Tables
Table 13. Where Youth Obtained Prescription Drugs*
City2010
City2012
State2012
City2010
City2012
State2012
City2010
City2012
State2012
City2010
City2012
State2012
n/a 44 1,637 n/a 227 2,321 n/a 177 2,478 n/a 448 6,436
n/a 52.3 48.7 n/a 56.8 59.8 n/a 62.7 62.8 n/a 58.7 58.2
n/a 15.9 16.8 n/a 17.6 16.6 n/a 16.4 16.3 n/a 17.0 16.5
n/a 25.0 21.4 n/a 16.3 19.6 n/a 12.4 19.5 n/a 15.6 20.0
n/a 31.8 28.2 n/a 33.0 31.3 n/a 18.1 24.7 n/a 27.0 28.0
n/a 11.4 13.5 n/a 17.6 14.3 n/a 20.9 19.5 n/a 18.3 16.1
n/a 11.4 12.9 n/a 15.9 15.6 n/a 10.2 12.7 n/a 13.2 13.8
n/a 15.9 17.8 n/a 15.0 13.2 n/a 9.0 12.3 n/a 12.7 14.0
n/a 0.0 2.4 n/a 2.6 1.4 n/a 0.0 0.9 n/a 1.3 1.5
n/a 2.3 5.1 n/a 2.6 4.2 n/a 5.6 3.6 n/a 3.8 4.2
*
**
�
If you have ever used prescription drugs in order to get high, not for a medical reason, how did you get them? (Mark all that apply.)
Prior to 2010, the AYS did not survey where youth obtained prescription drugs.
Outside the United States (e.g., Mexico, Canada)
School
Other
Family/Relatives
Friends
Over the Internet
State and national data for All Students Surveyed are drawn from grades 8, 10 and 12. Depending on which grades were surveyed in a particular report, (e.g., 8 and 10 only), caution should be exercised when comparing rates.
Grade 10 All Students Surveyed�Grade 8 Grade 12
Sample size**
Sample size represents the number of students who indicated at least one means of obtaining prescription drugs. Students indicating they have never used prescription drugs to get high are not included in the sample. In the case of smaller sample sizes, caution should be exercised before generalizing results to the entire community.
Parties
Home (e.g., Medicine Cabinet)
Doctor/Pharmacy
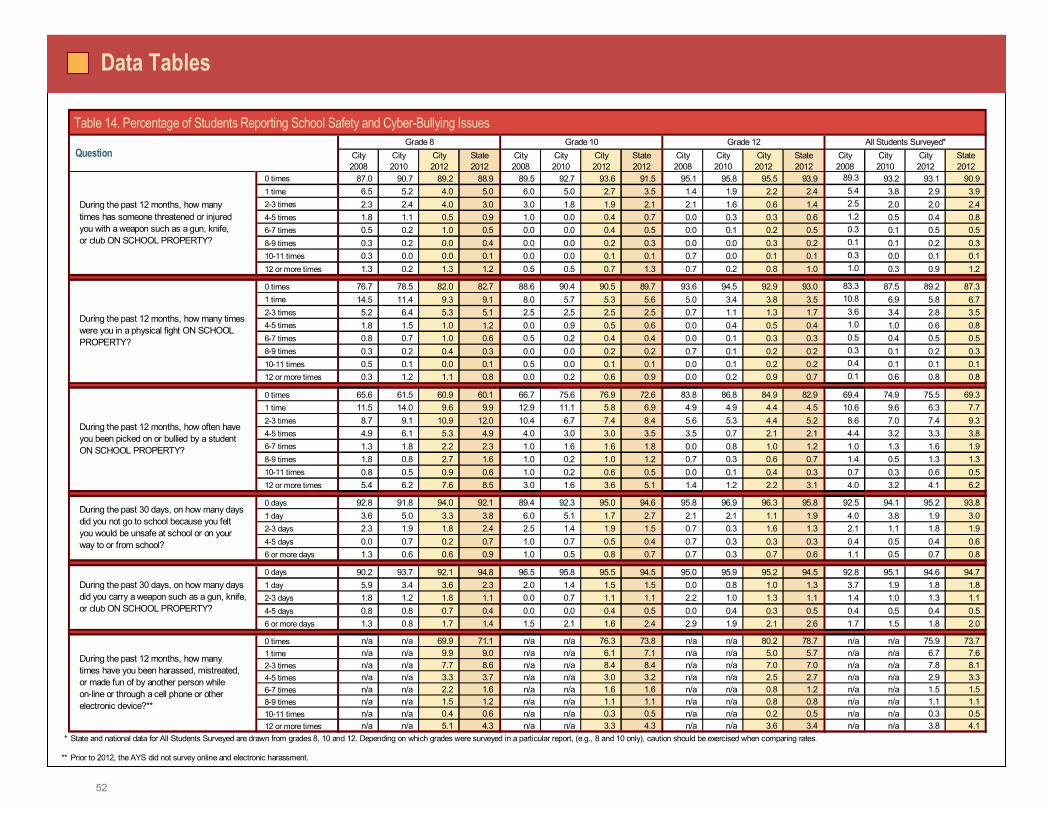
52
Data Tables
Table 14. Percentage of Students Reporting School Safety and Cyber-Bullying Issues
City2008
City2010
City2012
State2012
City2008
City2010
City2012
State2012
City2008
City2010
City2012
State2012
City2008
City2010
City2012
State2012
0 times 87.0 90.7 89.2 88.9 89.5 92.7 93.6 91.5 95.1 95.8 95.5 93.9 89.3 93.2 93.1 90.9 1 time 6.5 5.2 4.0 5.0 6.0 5.0 2.7 3.5 1.4 1.9 2.2 2.4 5.4 3.8 2.9 3.9 2-3 times 2.3 2.4 4.0 3.0 3.0 1.8 1.9 2.1 2.1 1.6 0.6 1.4 2.5 2.0 2.0 2.4 4-5 times 1.8 1.1 0.5 0.9 1.0 0.0 0.4 0.7 0.0 0.3 0.3 0.6 1.2 0.5 0.4 0.8 6-7 times 0.5 0.2 1.0 0.5 0.0 0.0 0.4 0.5 0.0 0.1 0.2 0.5 0.3 0.1 0.5 0.5 8-9 times 0.3 0.2 0.0 0.4 0.0 0.0 0.2 0.3 0.0 0.0 0.3 0.2 0.1 0.1 0.2 0.3 10-11 times 0.3 0.0 0.0 0.1 0.0 0.0 0.1 0.1 0.7 0.0 0.1 0.1 0.3 0.0 0.1 0.1 12 or more times 1.3 0.2 1.3 1.2 0.5 0.5 0.7 1.3 0.7 0.2 0.8 1.0 1.0 0.3 0.9 1.2
0 times 76.7 78.5 82.0 82.7 88.6 90.4 90.5 89.7 93.6 94.5 92.9 93.0 83.3 87.5 89.2 87.3 1 time 14.5 11.4 9.3 9.1 8.0 5.7 5.3 5.6 5.0 3.4 3.8 3.5 10.8 6.9 5.8 6.7 2-3 times 5.2 6.4 5.3 5.1 2.5 2.5 2.5 2.5 0.7 1.1 1.3 1.7 3.6 3.4 2.8 3.5 4-5 times 1.8 1.5 1.0 1.2 0.0 0.9 0.5 0.6 0.0 0.4 0.5 0.4 1.0 1.0 0.6 0.8 6-7 times 0.8 0.7 1.0 0.6 0.5 0.2 0.4 0.4 0.0 0.1 0.3 0.3 0.5 0.4 0.5 0.5 8-9 times 0.3 0.2 0.4 0.3 0.0 0.0 0.2 0.2 0.7 0.1 0.2 0.2 0.3 0.1 0.2 0.3 10-11 times 0.5 0.1 0.0 0.1 0.5 0.0 0.1 0.1 0.0 0.1 0.2 0.2 0.4 0.1 0.1 0.1 12 or more times 0.3 1.2 1.1 0.8 0.0 0.2 0.6 0.9 0.0 0.2 0.9 0.7 0.1 0.6 0.8 0.8
0 times 65.6 61.5 60.9 60.1 66.7 75.6 76.9 72.6 83.8 86.8 84.9 82.9 69.4 74.9 75.5 69.3 1 time 11.5 14.0 9.6 9.9 12.9 11.1 5.8 6.9 4.9 4.9 4.4 4.5 10.6 9.6 6.3 7.7 2-3 times 8.7 9.1 10.9 12.0 10.4 6.7 7.4 8.4 5.6 5.3 4.4 5.2 8.6 7.0 7.4 9.3 4-5 times 4.9 6.1 5.3 4.9 4.0 3.0 3.0 3.5 3.5 0.7 2.1 2.1 4.4 3.2 3.3 3.8 6-7 times 1.3 1.8 2.2 2.3 1.0 1.6 1.6 1.8 0.0 0.8 1.0 1.2 1.0 1.3 1.6 1.9 8-9 times 1.8 0.8 2.7 1.6 1.0 0.2 1.0 1.2 0.7 0.3 0.6 0.7 1.4 0.5 1.3 1.3 10-11 times 0.8 0.5 0.9 0.6 1.0 0.2 0.6 0.5 0.0 0.1 0.4 0.3 0.7 0.3 0.6 0.5 12 or more times 5.4 6.2 7.6 8.5 3.0 1.6 3.6 5.1 1.4 1.2 2.2 3.1 4.0 3.2 4.1 6.2
0 days 92.8 91.8 94.0 92.1 89.4 92.3 95.0 94.6 95.8 96.9 96.3 95.8 92.5 94.1 95.2 93.8 1 day 3.6 5.0 3.3 3.8 6.0 5.1 1.7 2.7 2.1 2.1 1.1 1.9 4.0 3.8 1.9 3.0 2-3 days 2.3 1.9 1.8 2.4 2.5 1.4 1.9 1.5 0.7 0.3 1.6 1.3 2.1 1.1 1.8 1.9 4-5 days 0.0 0.7 0.2 0.7 1.0 0.7 0.5 0.4 0.7 0.3 0.3 0.3 0.4 0.5 0.4 0.6 6 or more days 1.3 0.6 0.6 0.9 1.0 0.5 0.8 0.7 0.7 0.3 0.7 0.6 1.1 0.5 0.7 0.8
0 days 90.2 93.7 92.1 94.8 96.5 95.8 95.5 94.5 95.0 95.9 95.2 94.5 92.8 95.1 94.6 94.7 1 day 5.9 3.4 3.6 2.3 2.0 1.4 1.5 1.5 0.0 0.8 1.0 1.3 3.7 1.9 1.8 1.8 2-3 days 1.8 1.2 1.8 1.1 0.0 0.7 1.1 1.1 2.2 1.0 1.3 1.1 1.4 1.0 1.3 1.1 4-5 days 0.8 0.8 0.7 0.4 0.0 0.0 0.4 0.5 0.0 0.4 0.3 0.5 0.4 0.5 0.4 0.5 6 or more days 1.3 0.8 1.7 1.4 1.5 2.1 1.6 2.4 2.9 1.9 2.1 2.6 1.7 1.5 1.8 2.0
0 times n/a n/a 69.9 71.1 n/a n/a 76.3 73.8 n/a n/a 80.2 78.7 n/a n/a 75.9 73.7 1 time n/a n/a 9.9 9.0 n/a n/a 6.1 7.1 n/a n/a 5.0 5.7 n/a n/a 6.7 7.6 2-3 times n/a n/a 7.7 8.6 n/a n/a 8.4 8.4 n/a n/a 7.0 7.0 n/a n/a 7.8 8.1 4-5 times n/a n/a 3.3 3.7 n/a n/a 3.0 3.2 n/a n/a 2.5 2.7 n/a n/a 2.9 3.3 6-7 times n/a n/a 2.2 1.6 n/a n/a 1.6 1.6 n/a n/a 0.8 1.2 n/a n/a 1.5 1.5 8-9 times n/a n/a 1.5 1.2 n/a n/a 1.1 1.1 n/a n/a 0.8 0.8 n/a n/a 1.1 1.1 10-11 times n/a n/a 0.4 0.6 n/a n/a 0.3 0.5 n/a n/a 0.2 0.5 n/a n/a 0.3 0.5 12 or more times n/a n/a 5.1 4.3 n/a n/a 3.3 4.3 n/a n/a 3.6 3.4 n/a n/a 3.8 4.1
*
** Prior to 2012, the AYS did not survey online and electronic harassment.
During the past 12 months, how many times has someone threatened or injured you with a weapon such as a gun, knife, or club ON SCHOOL PROPERTY?
Question
During the past 30 days, on how many days did you not go to school because you felt you would be unsafe at school or on your way to or from school?
All Students Surveyed*Grade 10 Grade 12Grade 8
During the past 30 days, on how many days did you carry a weapon such as a gun, knife, or club ON SCHOOL PROPERTY?
During the past 12 months, how many times were you in a physical fight ON SCHOOL PROPERTY?
During the past 12 months, how often have you been picked on or bullied by a student ON SCHOOL PROPERTY?
State and national data for All Students Surveyed are drawn from grades 8, 10 and 12. Depending on which grades were surveyed in a particular report, (e.g., 8 and 10 only), caution should be exercised when comparing rates.
During the past 12 months, how many times have you been harassed, mistreated, or made fun of by another person while on-line or through a cell phone or other electronic device?**
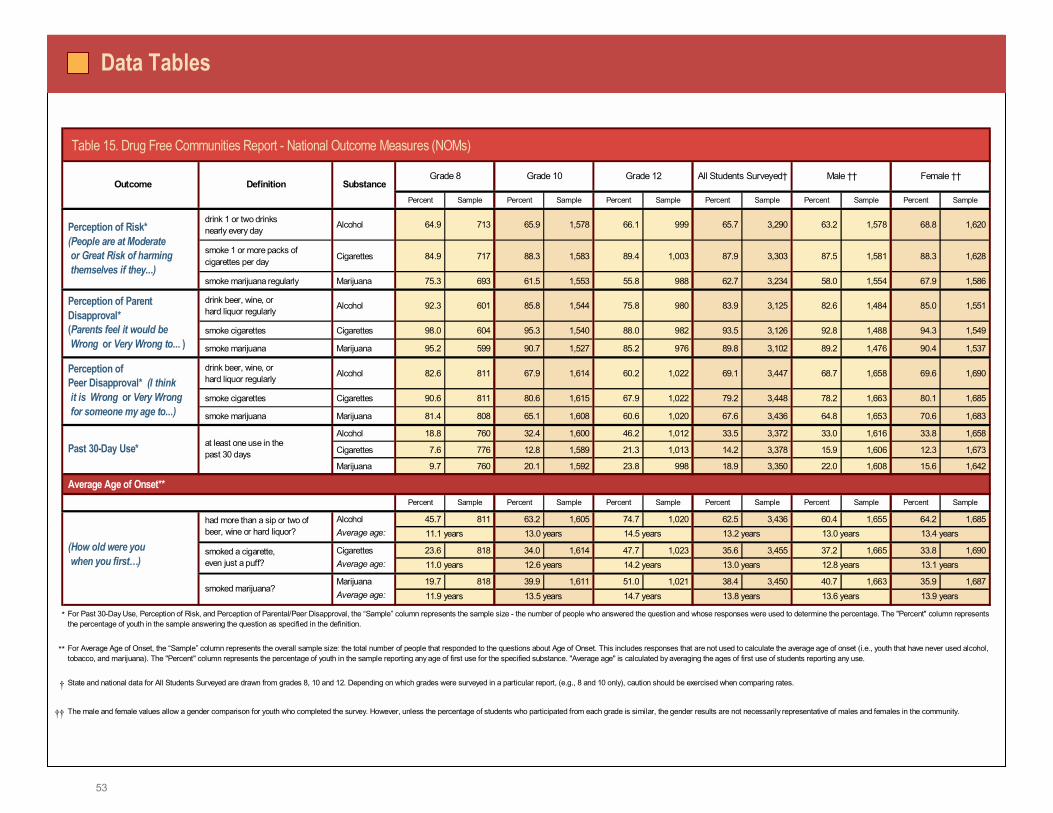
53
Data Tables
Table 15. Drug Free Communities Report - National Outcome Measures (NOMs)
Percent Sample Percent Sample Percent Sample Percent Sample Percent Sample Percent Sample
drink 1 or two drinks nearly every day
Alcohol 64.9 713 65.9 1,578 66.1 999 65.7 3,290 63.2 1,578 68.8 1,620
smoke 1 or more packs of cigarettes per day Cigarettes 84.9 717 88.3 1,583 89.4 1,003 87.9 3,303 87.5 1,581 88.3 1,628
smoke marijuana regularly Marijuana 75.3 693 61.5 1,553 55.8 988 62.7 3,234 58.0 1,554 67.9 1,586
drink beer, wine, or hard liquor regularly Alcohol 92.3 601 85.8 1,544 75.8 980 83.9 3,125 82.6 1,484 85.0 1,551
smoke cigarettes Cigarettes 98.0 604 95.3 1,540 88.0 982 93.5 3,126 92.8 1,488 94.3 1,549
smoke marijuana Marijuana 95.2 599 90.7 1,527 85.2 976 89.8 3,102 89.2 1,476 90.4 1,537
drink beer, wine, or hard liquor regularly Alcohol 82.6 811 67.9 1,614 60.2 1,022 69.1 3,447 68.7 1,658 69.6 1,690
smoke cigarettes Cigarettes 90.6 811 80.6 1,615 67.9 1,022 79.2 3,448 78.2 1,663 80.1 1,685
smoke marijuana Marijuana 81.4 808 65.1 1,608 60.6 1,020 67.6 3,436 64.8 1,653 70.6 1,683
Alcohol 18.8 760 32.4 1,600 46.2 1,012 33.5 3,372 33.0 1,616 33.8 1,658
Cigarettes 7.6 776 12.8 1,589 21.3 1,013 14.2 3,378 15.9 1,606 12.3 1,673
Marijuana 9.7 760 20.1 1,592 23.8 998 18.9 3,350 22.0 1,608 15.6 1,642
Average Age of Onset**Percent Sample Percent Sample Percent Sample Percent Sample Percent Sample Percent Sample
Alcohol 45.7 811 63.2 1,605 74.7 1,020 62.5 3,436 60.4 1,655 64.2 1,685 Average age:
Cigarettes 23.6 818 34.0 1,614 47.7 1,023 35.6 3,455 37.2 1,665 33.8 1,690 Average age:
Marijuana 19.7 818 39.9 1,611 51.0 1,021 38.4 3,450 40.7 1,663 35.9 1,687 Average age:
*
**
�
��
13.0 years
Grade 12 All Students Surveyed�Grade 10
11.1 years (How old were you when you first�)
11.9 years
11.0 years
13.5 years
12.6 years smoked a cigarette, even just a puff?
had more than a sip or two of beer, wine or hard liquor?
smoked marijuana?
at least one use in the past 30 daysPast 30-Day Use*
Outcome
Perception of Peer Disapproval* (I think it is Wrong or Very Wrong for someone my age to...)
Perception of Risk* (People are at Moderate or Great Risk of harming themselves if they...)
Perception of ParentDisapproval* (Parents feel it would be Wrong or Very Wrong to... )
Grade 8
13.6 years
Definition Substance
13.0 years 13.2 years
14.7 years 13.8 years
14.5 years
14.2 years 13.0 years 13.1 years
Male �� Female ��
12.8 years
13.9 years
13.4 years
The male and female values allow a gender comparison for youth who completed the survey. However, unless the percentage of students who participated from each grade is similar, the gender results are not necessarily representative of males and females in the community.
State and national data for All Students Surveyed are drawn from grades 8, 10 and 12. Depending on which grades were surveyed in a particular report, (e.g., 8 and 10 only), caution should be exercised when comparing rates.
For Average Age of Onset, the �Sample� column represents the overall sample size: the total number of people that responded to the questions about Age of Onset. This includes responses that are not used to calculate the average age of onset (i.e., youth that have never used alcohol, tobacco, and marijuana). The "Percent" column represents the percentage of youth in the sample reporting any age of first use for the specified substance. "Average age" is calculated by averaging the ages of first use of students reporting any use.
For Past 30-Day Use, Perception of Risk, and Perception of Parental/Peer Disapproval, the �Sample� column represents the sample size - the number of people who answered the question and whose responses were used to determine the percentage. The "Percent" column represents the percentage of youth in the sample answering the question as specified in the definition.
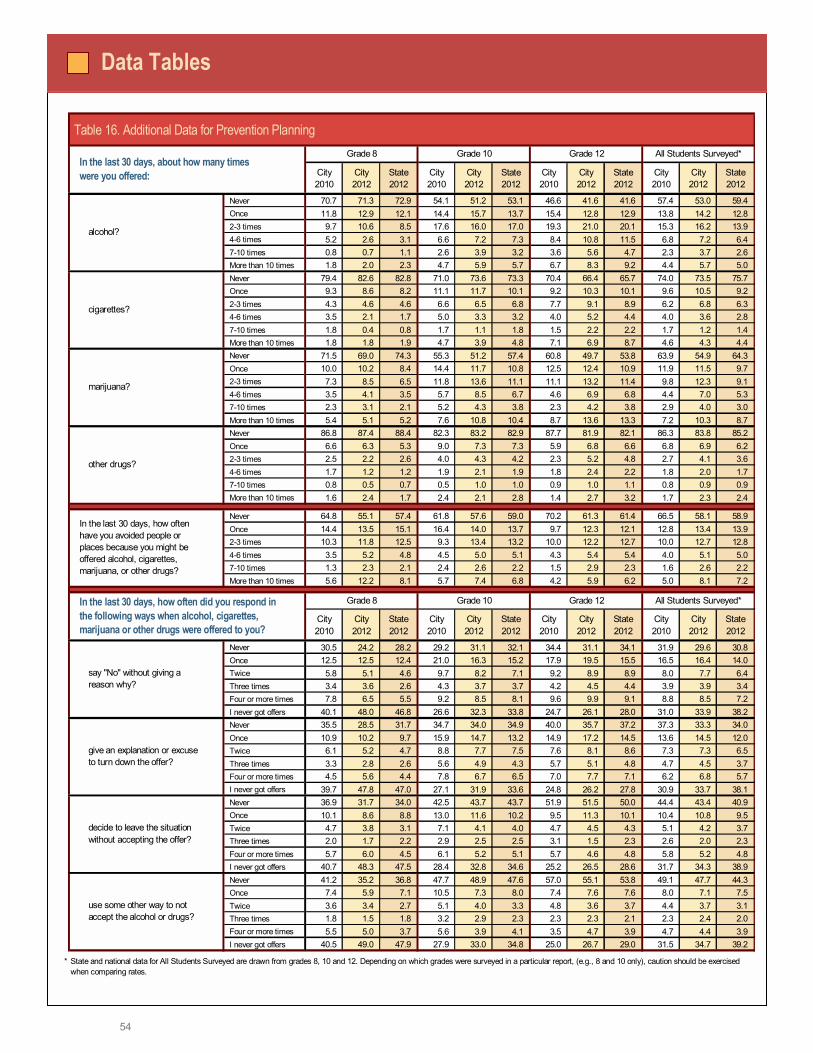
54
Data Tables
Table 16. Additional Data for Prevention Planning
City 2010
City2012
State2012
City 2010
City2012
State2012
City2010
City2012
State2012
City2010
City2012
State2012
Never 70.7 71.3 72.9 54.1 51.2 53.1 46.6 41.6 41.6 57.4 53.0 59.4 Once 11.8 12.9 12.1 14.4 15.7 13.7 15.4 12.8 12.9 13.8 14.2 12.8 2-3 times 9.7 10.6 8.5 17.6 16.0 17.0 19.3 21.0 20.1 15.3 16.2 13.9 4-6 times 5.2 2.6 3.1 6.6 7.2 7.3 8.4 10.8 11.5 6.8 7.2 6.4 7-10 times 0.8 0.7 1.1 2.6 3.9 3.2 3.6 5.6 4.7 2.3 3.7 2.6 More than 10 times 1.8 2.0 2.3 4.7 5.9 5.7 6.7 8.3 9.2 4.4 5.7 5.0 Never 79.4 82.6 82.8 71.0 73.6 73.3 70.4 66.4 65.7 74.0 73.5 75.7 Once 9.3 8.6 8.2 11.1 11.7 10.1 9.2 10.3 10.1 9.6 10.5 9.2 2-3 times 4.3 4.6 4.6 6.6 6.5 6.8 7.7 9.1 8.9 6.2 6.8 6.3 4-6 times 3.5 2.1 1.7 5.0 3.3 3.2 4.0 5.2 4.4 4.0 3.6 2.8 7-10 times 1.8 0.4 0.8 1.7 1.1 1.8 1.5 2.2 2.2 1.7 1.2 1.4 More than 10 times 1.8 1.8 1.9 4.7 3.9 4.8 7.1 6.9 8.7 4.6 4.3 4.4 Never 71.5 69.0 74.3 55.3 51.2 57.4 60.8 49.7 53.8 63.9 54.9 64.3 Once 10.0 10.2 8.4 14.4 11.7 10.8 12.5 12.4 10.9 11.9 11.5 9.7 2-3 times 7.3 8.5 6.5 11.8 13.6 11.1 11.1 13.2 11.4 9.8 12.3 9.1 4-6 times 3.5 4.1 3.5 5.7 8.5 6.7 4.6 6.9 6.8 4.4 7.0 5.3 7-10 times 2.3 3.1 2.1 5.2 4.3 3.8 2.3 4.2 3.8 2.9 4.0 3.0 More than 10 times 5.4 5.1 5.2 7.6 10.8 10.4 8.7 13.6 13.3 7.2 10.3 8.7 Never 86.8 87.4 88.4 82.3 83.2 82.9 87.7 81.9 82.1 86.3 83.8 85.2 Once 6.6 6.3 5.3 9.0 7.3 7.3 5.9 6.8 6.6 6.8 6.9 6.2 2-3 times 2.5 2.2 2.6 4.0 4.3 4.2 2.3 5.2 4.8 2.7 4.1 3.6 4-6 times 1.7 1.2 1.2 1.9 2.1 1.9 1.8 2.4 2.2 1.8 2.0 1.7 7-10 times 0.8 0.5 0.7 0.5 1.0 1.0 0.9 1.0 1.1 0.8 0.9 0.9 More than 10 times 1.6 2.4 1.7 2.4 2.1 2.8 1.4 2.7 3.2 1.7 2.3 2.4
0 Never 64.8 55.1 57.4 61.8 57.6 59.0 70.2 61.3 61.4 66.5 58.1 58.9 Once 14.4 13.5 15.1 16.4 14.0 13.7 9.7 12.3 12.1 12.8 13.4 13.9 2-3 times 10.3 11.8 12.5 9.3 13.4 13.2 10.0 12.2 12.7 10.0 12.7 12.8 4-6 times 3.5 5.2 4.8 4.5 5.0 5.1 4.3 5.4 5.4 4.0 5.1 5.0 7-10 times 1.3 2.3 2.1 2.4 2.6 2.2 1.5 2.9 2.3 1.6 2.6 2.2 More than 10 times 5.6 12.2 8.1 5.7 7.4 6.8 4.2 5.9 6.2 5.0 8.1 7.2
0
City 2010
City2012
State2012
City 2010
City2012
State2012
City2010
City2012
State2012
City2010
City2012
State2012
Never 30.5 24.2 28.2 29.2 31.1 32.1 34.4 31.1 34.1 31.9 29.6 30.8 Once 12.5 12.5 12.4 21.0 16.3 15.2 17.9 19.5 15.5 16.5 16.4 14.0 Twice 5.8 5.1 4.6 9.7 8.2 7.1 9.2 8.9 8.9 8.0 7.7 6.4 Three times 3.4 3.6 2.6 4.3 3.7 3.7 4.2 4.5 4.4 3.9 3.9 3.4 Four or more times 7.8 6.5 5.5 9.2 8.5 8.1 9.6 9.9 9.1 8.8 8.5 7.2 I never got offers 40.1 48.0 46.8 26.6 32.3 33.8 24.7 26.1 28.0 31.0 33.9 38.2 Never 35.5 28.5 31.7 34.7 34.0 34.9 40.0 35.7 37.2 37.3 33.3 34.0 Once 10.9 10.2 9.7 15.9 14.7 13.2 14.9 17.2 14.5 13.6 14.5 12.0 Twice 6.1 5.2 4.7 8.8 7.7 7.5 7.6 8.1 8.6 7.3 7.3 6.5 Three times 3.3 2.8 2.6 5.6 4.9 4.3 5.7 5.1 4.8 4.7 4.5 3.7 Four or more times 4.5 5.6 4.4 7.8 6.7 6.5 7.0 7.7 7.1 6.2 6.8 5.7 I never got offers 39.7 47.8 47.0 27.1 31.9 33.6 24.8 26.2 27.8 30.9 33.7 38.1 Never 36.9 31.7 34.0 42.5 43.7 43.7 51.9 51.5 50.0 44.4 43.4 40.9 Once 10.1 8.6 8.8 13.0 11.6 10.2 9.5 11.3 10.1 10.4 10.8 9.5 Twice 4.7 3.8 3.1 7.1 4.1 4.0 4.7 4.5 4.3 5.1 4.2 3.7 Three times 2.0 1.7 2.2 2.9 2.5 2.5 3.1 1.5 2.3 2.6 2.0 2.3 Four or more times 5.7 6.0 4.5 6.1 5.2 5.1 5.7 4.6 4.8 5.8 5.2 4.8 I never got offers 40.7 48.3 47.5 28.4 32.8 34.6 25.2 26.5 28.6 31.7 34.3 38.9 Never 41.2 35.2 36.8 47.7 48.9 47.6 57.0 55.1 53.8 49.1 47.7 44.3 Once 7.4 5.9 7.1 10.5 7.3 8.0 7.4 7.6 7.6 8.0 7.1 7.5 Twice 3.6 3.4 2.7 5.1 4.0 3.3 4.8 3.6 3.7 4.4 3.7 3.1 Three times 1.8 1.5 1.8 3.2 2.9 2.3 2.3 2.3 2.1 2.3 2.4 2.0 Four or more times 5.5 5.0 3.7 5.6 3.9 4.1 3.5 4.7 3.9 4.7 4.4 3.9 I never got offers 40.5 49.0 47.9 27.9 33.0 34.8 25.0 26.7 29.0 31.5 34.7 39.2
*
All Students Surveyed*
say "No" without giving a reason why?
In the last 30 days, how often did you respond in the following ways when alcohol, cigarettes, marijuana or other drugs were offered to you?
Grade 8 Grade 12
Grade 12
use some other way to notaccept the alcohol or drugs?
give an explanation or excuse to turn down the offer?
decide to leave the situation without accepting the offer?
Grade 10
State and national data for All Students Surveyed are drawn from grades 8, 10 and 12. Depending on which grades were surveyed in a particular report, (e.g., 8 and 10 only), caution should be exercised when comparing rates.
In the last 30 days, how oftenhave you avoided people or places because you might be offered alcohol, cigarettes, marijuana, or other drugs?
In the last 30 days, about how many times were you offered:
cigarettes?
alcohol?
marijuana?
other drugs?
Grade 8 Grade 10 All Students Surveyed*
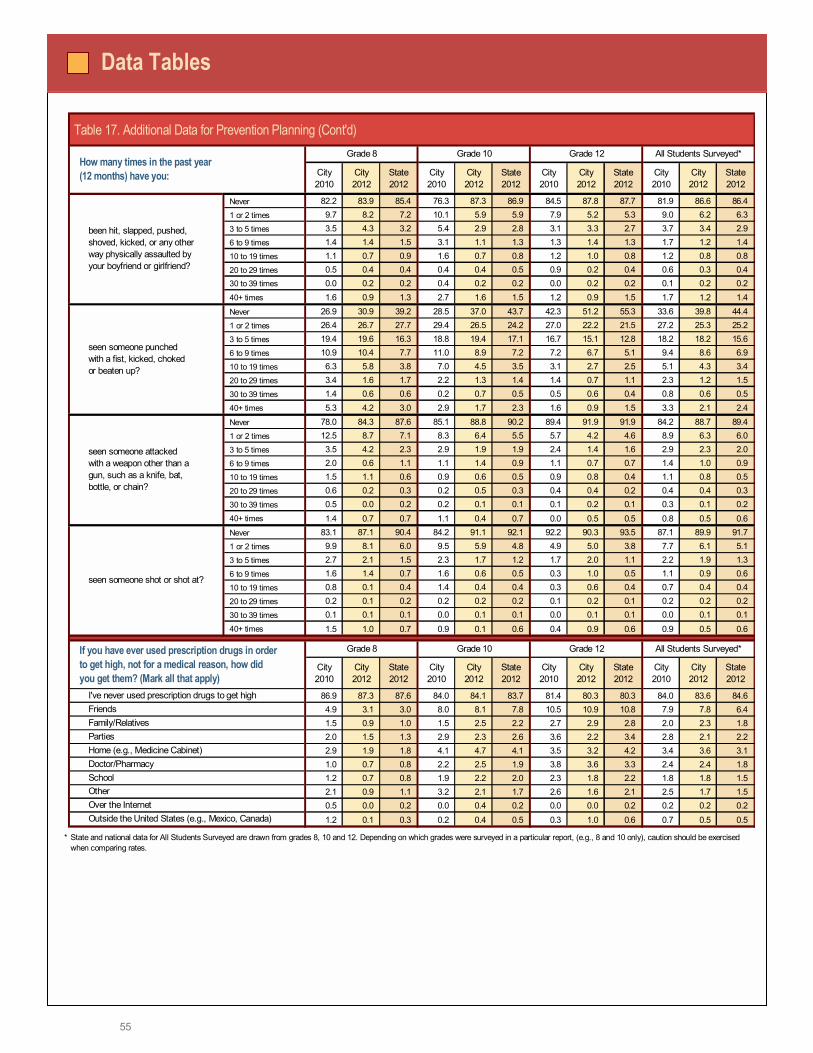
55
Data Tables
Table 17. Additional Data for Prevention Planning (Cont'd)
City 2010
City2012
State2012
City 2010
City2012
State2012
City2010
City2012
State2012
City2010
City2012
State2012
Never 82.2 83.9 85.4 76.3 87.3 86.9 84.5 87.8 87.7 81.9 86.6 86.4 1 or 2 times 9.7 8.2 7.2 10.1 5.9 5.9 7.9 5.2 5.3 9.0 6.2 6.3 3 to 5 times 3.5 4.3 3.2 5.4 2.9 2.8 3.1 3.3 2.7 3.7 3.4 2.9 6 to 9 times 1.4 1.4 1.5 3.1 1.1 1.3 1.3 1.4 1.3 1.7 1.2 1.4 10 to 19 times 1.1 0.7 0.9 1.6 0.7 0.8 1.2 1.0 0.8 1.2 0.8 0.8 20 to 29 times 0.5 0.4 0.4 0.4 0.4 0.5 0.9 0.2 0.4 0.6 0.3 0.4 30 to 39 times 0.0 0.2 0.2 0.4 0.2 0.2 0.0 0.2 0.2 0.1 0.2 0.2 40+ times 1.6 0.9 1.3 2.7 1.6 1.5 1.2 0.9 1.5 1.7 1.2 1.4 Never 26.9 30.9 39.2 28.5 37.0 43.7 42.3 51.2 55.3 33.6 39.8 44.4 1 or 2 times 26.4 26.7 27.7 29.4 26.5 24.2 27.0 22.2 21.5 27.2 25.3 25.2 3 to 5 times 19.4 19.6 16.3 18.8 19.4 17.1 16.7 15.1 12.8 18.2 18.2 15.6 6 to 9 times 10.9 10.4 7.7 11.0 8.9 7.2 7.2 6.7 5.1 9.4 8.6 6.9 10 to 19 times 6.3 5.8 3.8 7.0 4.5 3.5 3.1 2.7 2.5 5.1 4.3 3.4 20 to 29 times 3.4 1.6 1.7 2.2 1.3 1.4 1.4 0.7 1.1 2.3 1.2 1.5 30 to 39 times 1.4 0.6 0.6 0.2 0.7 0.5 0.5 0.6 0.4 0.8 0.6 0.5 40+ times 5.3 4.2 3.0 2.9 1.7 2.3 1.6 0.9 1.5 3.3 2.1 2.4 Never 78.0 84.3 87.6 85.1 88.8 90.2 89.4 91.9 91.9 84.2 88.7 89.4 1 or 2 times 12.5 8.7 7.1 8.3 6.4 5.5 5.7 4.2 4.6 8.9 6.3 6.0 3 to 5 times 3.5 4.2 2.3 2.9 1.9 1.9 2.4 1.4 1.6 2.9 2.3 2.0 6 to 9 times 2.0 0.6 1.1 1.1 1.4 0.9 1.1 0.7 0.7 1.4 1.0 0.9 10 to 19 times 1.5 1.1 0.6 0.9 0.6 0.5 0.9 0.8 0.4 1.1 0.8 0.5 20 to 29 times 0.6 0.2 0.3 0.2 0.5 0.3 0.4 0.4 0.2 0.4 0.4 0.3 30 to 39 times 0.5 0.0 0.2 0.2 0.1 0.1 0.1 0.2 0.1 0.3 0.1 0.2 40+ times 1.4 0.7 0.7 1.1 0.4 0.7 0.0 0.5 0.5 0.8 0.5 0.6 Never 83.1 87.1 90.4 84.2 91.1 92.1 92.2 90.3 93.5 87.1 89.9 91.7 1 or 2 times 9.9 8.1 6.0 9.5 5.9 4.8 4.9 5.0 3.8 7.7 6.1 5.1 3 to 5 times 2.7 2.1 1.5 2.3 1.7 1.2 1.7 2.0 1.1 2.2 1.9 1.3 6 to 9 times 1.6 1.4 0.7 1.6 0.6 0.5 0.3 1.0 0.5 1.1 0.9 0.6 10 to 19 times 0.8 0.1 0.4 1.4 0.4 0.4 0.3 0.6 0.4 0.7 0.4 0.4 20 to 29 times 0.2 0.1 0.2 0.2 0.2 0.2 0.1 0.2 0.1 0.2 0.2 0.2 30 to 39 times 0.1 0.1 0.1 0.0 0.1 0.1 0.0 0.1 0.1 0.0 0.1 0.1 40+ times 1.5 1.0 0.7 0.9 0.1 0.6 0.4 0.9 0.6 0.9 0.5 0.6
0
City 2010
City 2012
State 2012
City 2010
City 2012
State 2012
City 2010
City 2012
State 2012
City 2010
City 2012
State 2012
86.9 87.3 87.6 84.0 84.1 83.7 81.4 80.3 80.3 84.0 83.6 84.6 4.9 3.1 3.0 8.0 8.1 7.8 10.5 10.9 10.8 7.9 7.8 6.4 1.5 0.9 1.0 1.5 2.5 2.2 2.7 2.9 2.8 2.0 2.3 1.8 2.0 1.5 1.3 2.9 2.3 2.6 3.6 2.2 3.4 2.8 2.1 2.2 2.9 1.9 1.8 4.1 4.7 4.1 3.5 3.2 4.2 3.4 3.6 3.1 1.0 0.7 0.8 2.2 2.5 1.9 3.8 3.6 3.3 2.4 2.4 1.8 1.2 0.7 0.8 1.9 2.2 2.0 2.3 1.8 2.2 1.8 1.8 1.5 2.1 0.9 1.1 3.2 2.1 1.7 2.6 1.6 2.1 2.5 1.7 1.5 0.5 0.0 0.2 0.0 0.4 0.2 0.0 0.0 0.2 0.2 0.2 0.2 1.2 0.1 0.3 0.2 0.4 0.5 0.3 1.0 0.6 0.7 0.5 0.5
*
seen someone shot or shot at?
How many times in the past year (12 months) have you:
been hit, slapped, pushed, shoved, kicked, or any other way physically assaulted by your boyfriend or girlfriend?
seen someone punched with a fist, kicked, choked or beaten up?
seen someone attacked with a weapon other than a gun, such as a knife, bat, bottle, or chain?
Grade 8 Grade 10 All Students Surveyed*Grade 12
All Students Surveyed*
I've never used prescription drugs to get high
Home (e.g., Medicine Cabinet)
If you have ever used prescription drugs in order to get high, not for a medical reason, how did you get them? (Mark all that apply)
Grade 8 Grade 10 Grade 12
State and national data for All Students Surveyed are drawn from grades 8, 10 and 12. Depending on which grades were surveyed in a particular report, (e.g., 8 and 10 only), caution should be exercised when comparing rates.
Over the InternetOutside the United States (e.g., Mexico, Canada)
FriendsFamily/RelativesParties
Doctor/PharmacySchoolOther
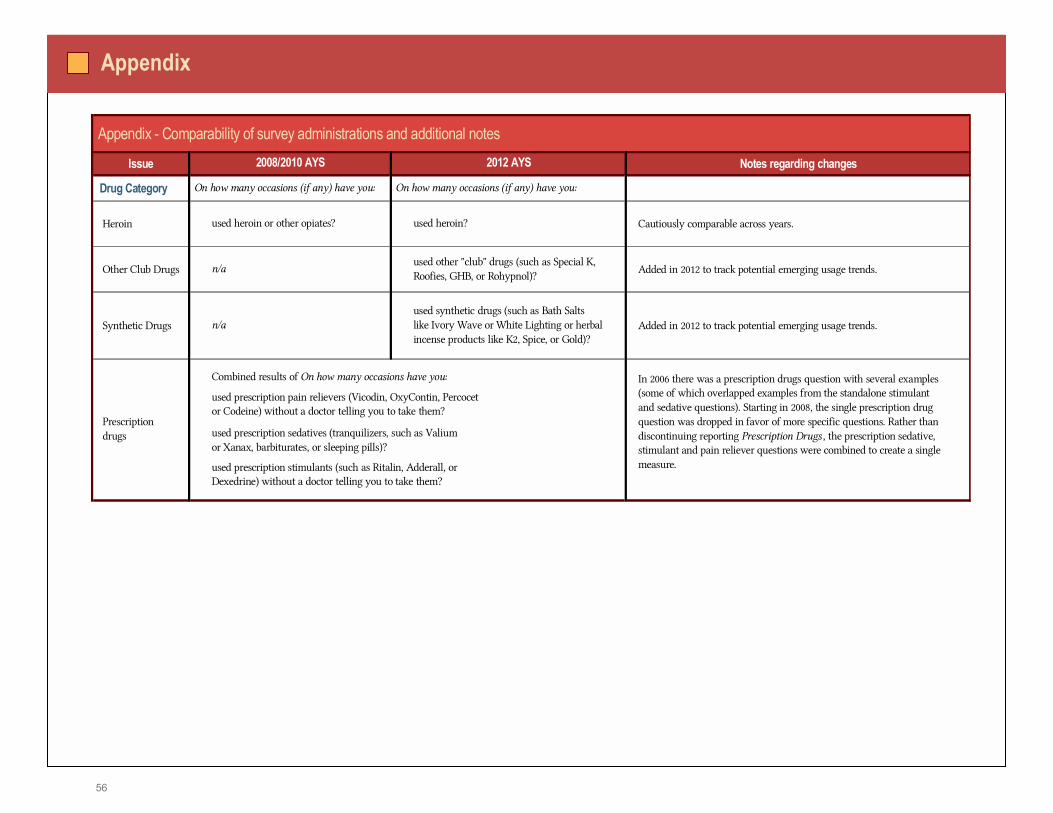
56
Appendix
Appendix - Comparability of survey administrations and additional notes
Issue Notes regarding changes
Drug Category
Heroin Cautiously comparable across years.
Other Club Drugs Added in 2012 to track potential emerging usage trends.
Synthetic Drugs Added in 2012 to track potential emerging usage trends.
On how many occasions (if any) have you:
used heroin or other opiates?
On how many occasions (if any) have you:
Combined results of On how many occasions have you:
used prescription pain relievers (Vicodin, OxyContin, Percocetor Codeine) without a doctor telling you to take them?
used prescription sedatives (tranquilizers, such as Valiumor Xanax, barbiturates, or sleeping pills)?
n/a
2008/2010 AYS
Prescription drugs
In 2006 there was a prescription drugs question with several examples (some of which overlapped examples from the standalone stimulant and sedative questions). Starting in 2008, the single prescription drug question was dropped in favor of more specific questions. Rather thandiscontinuing reporting Prescription Drugs , the prescription sedative,stimulant and pain reliever questions were combined to create a single measure.
used heroin?
2012 AYS
used prescription stimulants (such as Ritalin, Adderall, orDexedrine) without a doctor telling you to take them?
used other "club" drugs (such as Special K,Roofies, GHB, or Rohypnol)?
n/aused synthetic drugs (such as Bath Saltslike Ivory Wave or White Lighting or herbal incense products like K2, Spice, or Gold)?
57
Regional Prevention Contacts
Apache, Coconino, Mohave, Navajo, and Yavapai Counties Jacque Gencarelle Northern Arizona Regional Behavioral Health Authority (NARBHA) 928-226-6396
Cochise, Graham, Greenlee, Gila, La Paz, Pinal, Yuma and Santa Cruz Counties Linda Weinberg Cenpatico of Arizona 866-495-6738
Maricopa County Juan Aristizabal Magellan Health Services of Arizona 602-797-8256
Pima County Michael Pensak Community Partnership of Southern Arizona (CPSA) 520-618-8813
Gila River Indian Community Julie Jimenez Gila River Regional Behavioral Health Authority 520-562-3321 ext. 7031
Pascua Yaqui Tribe Ralph Cota Centered Spirit Program 480-768-2063
Other State and National Contacts:
Arizona Criminal Justice Commission Steve Irvine/Michelle Neitch/Phillip Stevenson 602-364-1173/602-364-1557/602-364-1157 www.azcjc.gov
Arizona Department of Education School Safety and Prevention www.ade.az.gov/sa/health/
Arizona Department of Gaming�s Office of Problem Gambling Kimberly Zill 602-255-3889 www.problemgambling.az.gov
Contacts for Prevention
Arizona Department of Health Services Division of Behavioral Health Services Lisa Shumaker 602-364-4594 www.azdhs.gov/bhs/index.htm
Center for Violence Prevention and Community SafetyCharles Katz 602-496-1471 cvpcs.asu.edu/
Governor�s Office of Children, Youth, and Families 602-542-4043 www.gocyf.az.gov
Partnership for a Drug Free America, Arizona AffiliateShelly Mowrey 602-264-5700 www.drugfreeaz.org
The Center for the Study and Prevention of Violence (Blueprints for Violence Prevention) www.colorado.edu/cspv/blueprints/
Center for Substance Abuse Prevention (CSAP) www.samhsa.gov/about/csap.aspx
Office of Juvenile Justice and Delinquency PreventionModel Programs Guide www.ojjdp.gov/mpg/
Office of Justice Programs Crime Solutions www.crimesolutions.gov
Safe and Drug Free Schools and Communities U.S. Department of Education www.ed.gov/offices/OESE/SDFS
Substance Abuse and Mental Health Services Administration (SAMHSA) Evidence Based Practices www.samhsa.gov/ebpwebguide/index.asp
Western Regional Center for the Application of Prevention Technologies (CAPT) casat.unr.edu/westcapt.html
Bach Harrison, L.L.C. R. Steven Harrison, Ph.D. 801-359-2064 www.bach-harrison.com