Banking Market in Poland 2010 - Inteliace
12
BANKING MARKET IN POLAND 2011-2013, UPDATE 1H 2011 CEE BANKING SERIES by Intelace Research October 2011 Version: 2011/II/3
Transcript of Banking Market in Poland 2010 - Inteliace
BANKING MARKET IN POLAND 2011-2013, UPDATE 1H 2011 CEE BANKING SERIES
by Intelace Research October 2011
Version: 2011/II/3
Intelace Research
Ban
king M
arket in P
olan
d 201
1–2013
2
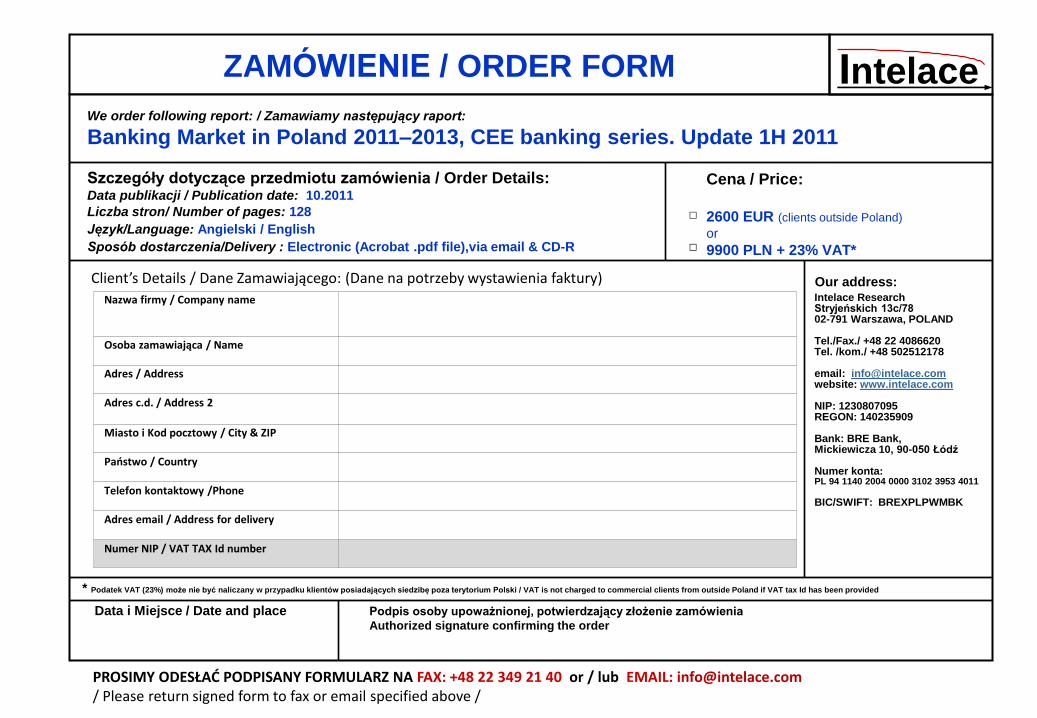
ZAMÓWIENIE / ORDER FORM
We order following report: / Zamawiamy następujący raport:
Banking Market in Poland 2011–2013, CEE banking series. Update 1H 2011
Szczegóły dotyczące przedmiotu zamówienia / Order Details: Data publikacji / Publication date: 10.2011
Liczba stron/ Number of pages: 128
Język/Language: Angielski / English
Sposób dostarczenia/Delivery : Electronic (Acrobat .pdf file),via email & CD-R
Client’s Details / Dane Zamawiającego: (Dane na potrzeby wystawienia faktury)
Nazwa firmy / Company name
Osoba zamawiająca / Name
Adres / Address
Adres c.d. / Address 2
Miasto i Kod pocztowy / City & ZIP
Państwo / Country
Telefon kontaktowy /Phone
Adres email / Address for delivery
Numer NIP / VAT TAX Id number
Cena / Price:
2600 EUR (clients outside Poland)
or
9900 PLN + 23% VAT*
* Podatek VAT (23%) może nie być naliczany w przypadku klientów posiadających siedzibę poza terytorium Polski / VAT is not charged to commercial clients from outside Poland if VAT tax Id has been provided
Data i Miejsce / Date and place Podpis osoby upoważnionej, potwierdzający złożenie zamówienia
Authorized signature confirming the order
PROSIMY ODESŁAĆ PODPISANY FORMULARZ NA FAX: +48 22 349 21 40 or / lub EMAIL: [email protected] / Please return signed form to fax or email specified above /
Intelace
Intelace Research Stryjeńskich 13c/78 02-791 Warszawa, POLAND Tel./Fax./ +48 22 4086620 Tel. /kom./ +48 502512178 email: [email protected] website: www.intelace.com NIP: 1230807095 REGON: 140235909 Bank: BRE Bank, Mickiewicza 10, 90-050 Łódź Numer konta: PL 94 1140 2004 0000 3102 3953 4011 BIC/SWIFT: BREXPLPWMBK
Our address:
□
□
Intelace Research
Ban
king M
arket in P
olan
d 201
1–2013
3
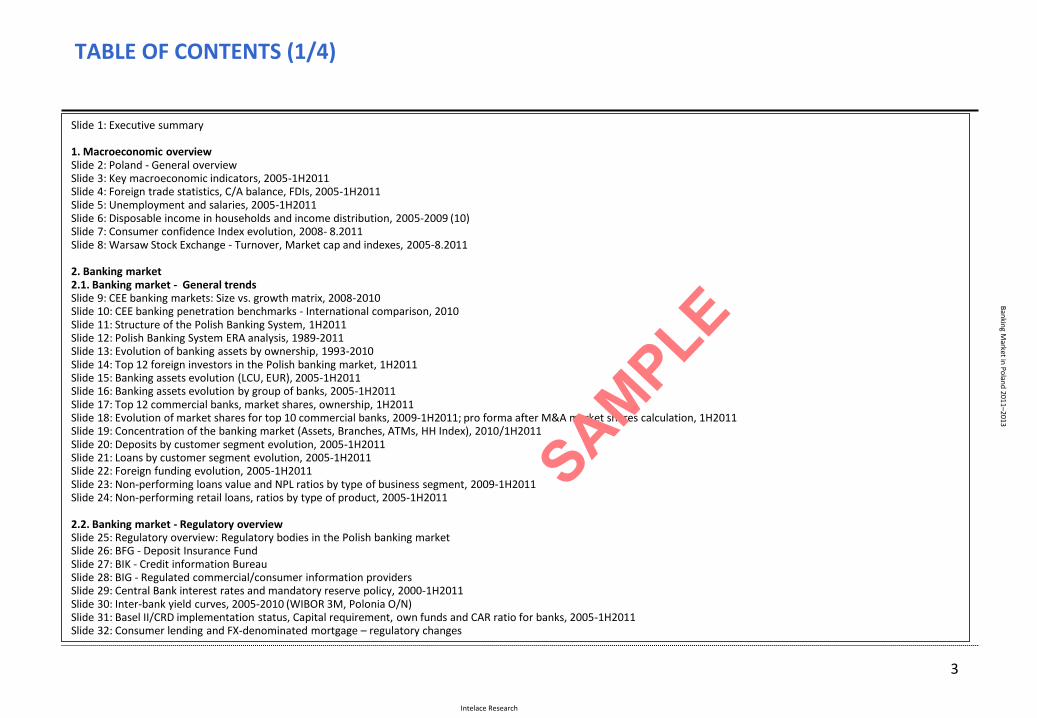
TABLE OF CONTENTS (1/4)
Slide 1: Executive summary 1. Macroeconomic overview Slide 2: Poland - General overview Slide 3: Key macroeconomic indicators, 2005-1H2011 Slide 4: Foreign trade statistics, C/A balance, FDIs, 2005-1H2011 Slide 5: Unemployment and salaries, 2005-1H2011 Slide 6: Disposable income in households and income distribution, 2005-2009 (10) Slide 7: Consumer confidence Index evolution, 2008- 8.2011 Slide 8: Warsaw Stock Exchange - Turnover, Market cap and indexes, 2005-8.2011 2. Banking market 2.1. Banking market - General trends Slide 9: CEE banking markets: Size vs. growth matrix, 2008-2010 Slide 10: CEE banking penetration benchmarks - International comparison, 2010 Slide 11: Structure of the Polish Banking System, 1H2011 Slide 12: Polish Banking System ERA analysis, 1989-2011 Slide 13: Evolution of banking assets by ownership, 1993-2010 Slide 14: Top 12 foreign investors in the Polish banking market, 1H2011 Slide 15: Banking assets evolution (LCU, EUR), 2005-1H2011 Slide 16: Banking assets evolution by group of banks, 2005-1H2011 Slide 17: Top 12 commercial banks, market shares, ownership, 1H2011 Slide 18: Evolution of market shares for top 10 commercial banks, 2009-1H2011; pro forma after M&A market shares calculation, 1H2011 Slide 19: Concentration of the banking market (Assets, Branches, ATMs, HH Index), 2010/1H2011 Slide 20: Deposits by customer segment evolution, 2005-1H2011 Slide 21: Loans by customer segment evolution, 2005-1H2011 Slide 22: Foreign funding evolution, 2005-1H2011 Slide 23: Non-performing loans value and NPL ratios by type of business segment, 2009-1H2011 Slide 24: Non-performing retail loans, ratios by type of product, 2005-1H2011 2.2. Banking market - Regulatory overview Slide 25: Regulatory overview: Regulatory bodies in the Polish banking market Slide 26: BFG - Deposit Insurance Fund Slide 27: BIK - Credit information Bureau Slide 28: BIG - Regulated commercial/consumer information providers Slide 29: Central Bank interest rates and mandatory reserve policy, 2000-1H2011 Slide 30: Inter-bank yield curves, 2005-2010 (WIBOR 3M, Polonia O/N) Slide 31: Basel II/CRD implementation status, Capital requirement, own funds and CAR ratio for banks, 2005-1H2011 Slide 32: Consumer lending and FX-denominated mortgage – regulatory changes
Intelace Research
Ban
king M
arket in P
olan
d 201
1–2013
4
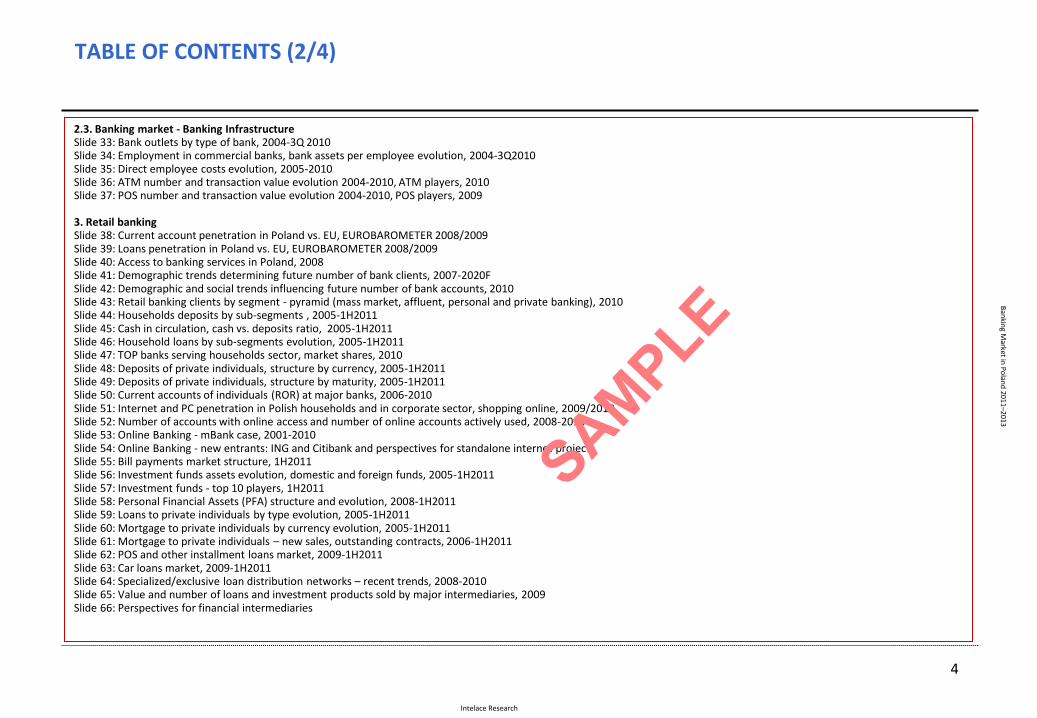
TABLE OF CONTENTS (2/4)
2.3. Banking market - Banking Infrastructure Slide 33: Bank outlets by type of bank, 2004-3Q 2010 Slide 34: Employment in commercial banks, bank assets per employee evolution, 2004-3Q2010 Slide 35: Direct employee costs evolution, 2005-2010 Slide 36: ATM number and transaction value evolution 2004-2010, ATM players, 2010 Slide 37: POS number and transaction value evolution 2004-2010, POS players, 2009 3. Retail banking Slide 38: Current account penetration in Poland vs. EU, EUROBAROMETER 2008/2009 Slide 39: Loans penetration in Poland vs. EU, EUROBAROMETER 2008/2009 Slide 40: Access to banking services in Poland, 2008 Slide 41: Demographic trends determining future number of bank clients, 2007-2020F Slide 42: Demographic and social trends influencing future number of bank accounts, 2010 Slide 43: Retail banking clients by segment - pyramid (mass market, affluent, personal and private banking), 2010 Slide 44: Households deposits by sub-segments , 2005-1H2011 Slide 45: Cash in circulation, cash vs. deposits ratio, 2005-1H2011 Slide 46: Household loans by sub-segments evolution, 2005-1H2011 Slide 47: TOP banks serving households sector, market shares, 2010 Slide 48: Deposits of private individuals, structure by currency, 2005-1H2011 Slide 49: Deposits of private individuals, structure by maturity, 2005-1H2011 Slide 50: Current accounts of individuals (ROR) at major banks, 2006-2010 Slide 51: Internet and PC penetration in Polish households and in corporate sector, shopping online, 2009/2010 Slide 52: Number of accounts with online access and number of online accounts actively used, 2008-2010 Slide 53: Online Banking - mBank case, 2001-2010 Slide 54: Online Banking - new entrants: ING and Citibank and perspectives for standalone internet projects Slide 55: Bill payments market structure, 1H2011 Slide 56: Investment funds assets evolution, domestic and foreign funds, 2005-1H2011 Slide 57: Investment funds - top 10 players, 1H2011 Slide 58: Personal Financial Assets (PFA) structure and evolution, 2008-1H2011 Slide 59: Loans to private individuals by type evolution, 2005-1H2011 Slide 60: Mortgage to private individuals by currency evolution, 2005-1H2011 Slide 61: Mortgage to private individuals – new sales, outstanding contracts, 2006-1H2011 Slide 62: POS and other installment loans market, 2009-1H2011 Slide 63: Car loans market, 2009-1H2011 Slide 64: Specialized/exclusive loan distribution networks – recent trends, 2008-2010 Slide 65: Value and number of loans and investment products sold by major intermediaries, 2009 Slide 66: Perspectives for financial intermediaries
Intelace Research
Ban
king M
arket in P
olan
d 201
1–2013
5
TABLE OF CONTENTS (3/4)
3.1. Payment cards Slide 67: Cards issued by type, 2004-2010 Slide 68: Card transactions by type (cashless, cash), share of cash transactions, 2006-2010 Slide 69: Credit card transactions , values, volumes, per card evolution, 2006-2010 Slide 70: Top players in credit cards business, co-branding partners, 2010 4. Corporate banking Slide 71: Corporate subjects by size, number, employment, revenues and profits, 2009 Slide 72: Corporate subjects, regional distribution, 2010 Slide 73: Corporate subjects, revenue and profit evolution, 2006-2010 Slide 74: Corporate deposits and loans evolution, 2005-1H2011 Slide 75: Top players in the corporate banking market, 2010 Slide 76: Brokerage business, top players, shares of investors groups, 2006-2010 Slide 77: Leasing market, structure by industry, top players, 2006-1H2011 Slide 78: Factoring market, 2006-2010 Slide 79: Non-treasury debt securities market, 2006-1H2011 5. Banks' profitability Slide 80: Nominal rates on loans and deposits by segment, implied margins evolution, 2009-8.2011 Slide 81: Commercial banks - profitability tree, 2008-1H2011 Slide 82: Commercial banks - revenue, costs and profits composition, 2010, 1H2011 Slide 83: Top 5 commercial banks profitability tree – peers comparison, 1H2011 Slide 84: Segment reporting (1/2): volumes, revenues and profit by segment (retail, corporate, other), 2010 Slide 85: Segment reporting (2/2): volumes, revenues and profit by segment (retail, corporate, other), 2010 6. Banks' valuation and M&A activity Slide 86: Share price performance in the stock market for key listed banks in Poland, 2010-9.2011 Slide 87: Market multiples for major listed banks in Poland, 9.2011 Slide 88: Strategic control map for major listed banks in Poland, 9.2011 Slide 89: Efficiency of top banks in Poland - Cost to income, Assets/Personnel/Branches benchmarks, 12/2010 Slide 90: Mergers in the Polish banking market, 2009/2010 Slide 91: Acquisition transactions in the Polish banking market (1/2), 2005-2008 Slide 92: Acquisition transactions in the Polish banking market (2/2), 2009-2011 Slide 93: Upcoming and speculated M&A deals .
Intelace Research
Ban
king M
arket in P
olan
d 201
1–2013
6
TABLE OF CONTENTS (4/4)
7. Top 5 banks - Profiles Slide 94-95: Bank profiles: PKO Bank Polski Slide 96-97: Bank profiles: Bank Pekao Slide 98-99: Bank profiles: BRE Bank Slide 100-101 Bank profiles: ING Bank Śląski Slide 102-103: Bank profiles: BZ WBK 8. Mid-term forecasts Slide 104: Banking assets forecast, 2011-2013 Slide 105: Key retail volumes forecast, 2011-2013 Slide 106: Key corporate volumes forecast, 2011-2013 9. Notes on methodology
Intelace Research
Ban
king M
arket in P
olan
d 201
1–2013
7
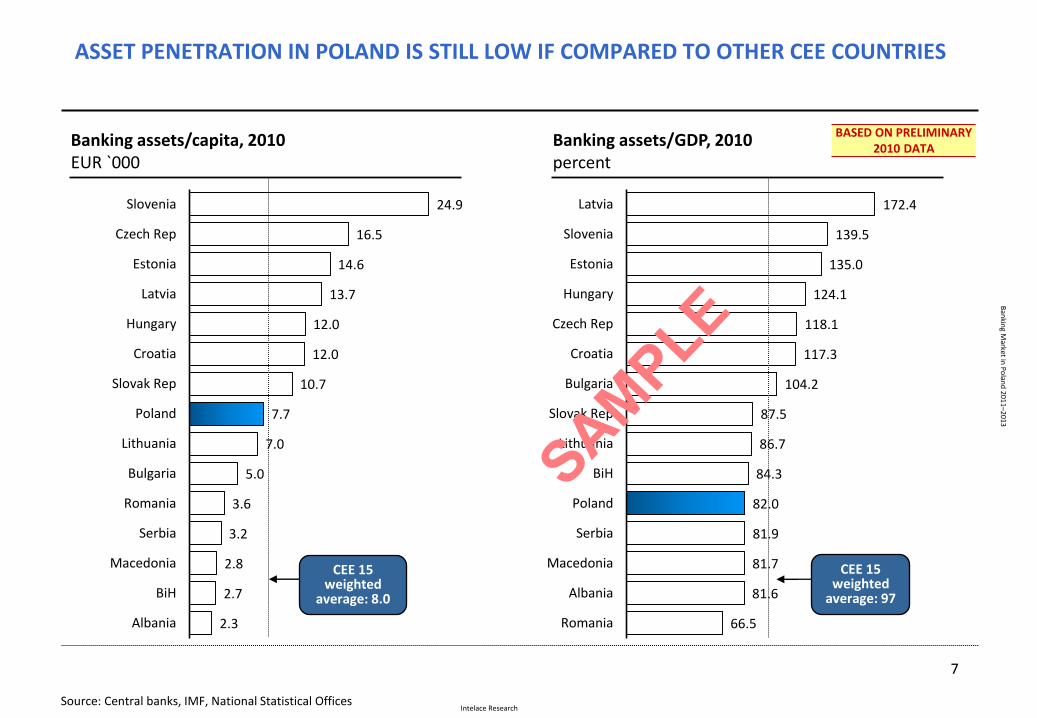
Banking assets/capita, 2010 EUR `000
Banking assets/GDP, 2010 percent
Source: Central banks, IMF, National Statistical Offices
ASSET PENETRATION IN POLAND IS STILL LOW IF COMPARED TO OTHER CEE COUNTRIES
24.9
16.5
14.6
13.7
12.0
12.0
10.7
7.7
7.0
5.0
3.6
3.2
2.8
2.7
2.3
Slovenia
Czech Rep
Estonia
Latvia
Hungary
Croatia
Slovak Rep
Poland
Lithuania
Bulgaria
Romania
Serbia
Macedonia
BiH
Albania
CEE 15 weighted
average: 97
CEE 15 weighted
average: 8.0
172.4
139.5
135.0
124.1
118.1
117.3
104.2
87.5
86.7
84.3
82.0
81.9
81.7
81.6
66.5
Latvia
Slovenia
Estonia
Hungary
Czech Rep
Croatia
Bulgaria
Slovak Rep
Lithuania
BiH
Poland
Serbia
Macedonia
Albania
Romania
BASED ON PRELIMINARY 2010 DATA
Intelace Research
Ban
king M
arket in P
olan
d 201
1–2013
8
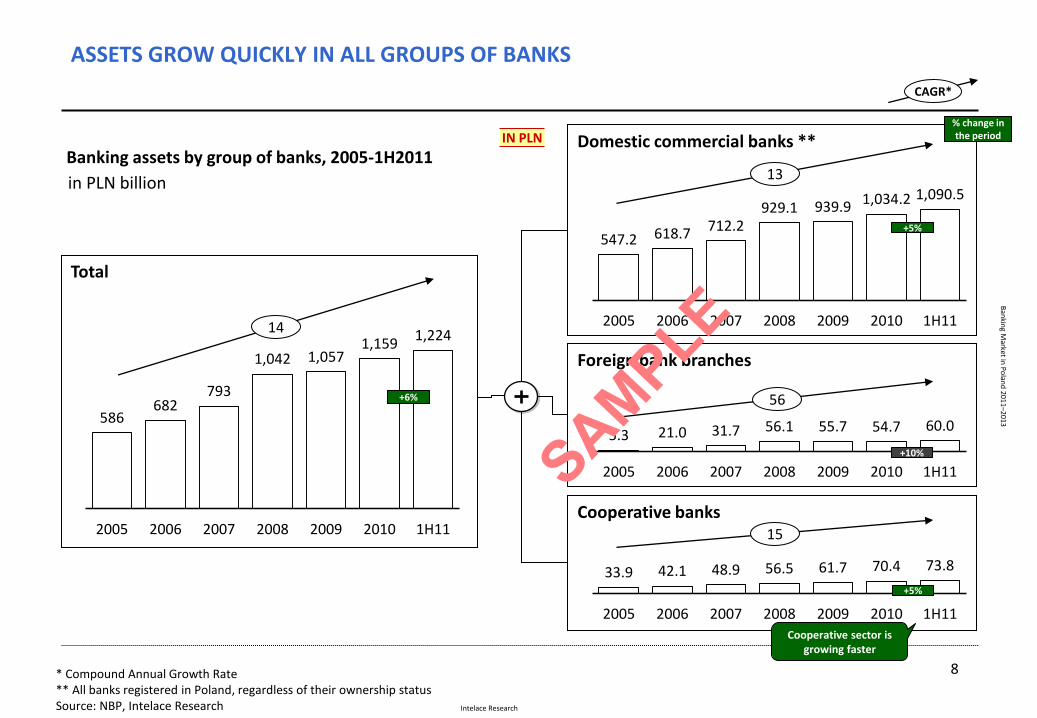
ASSETS GROW QUICKLY IN ALL GROUPS OF BANKS
CAGR*
Total
14
* Compound Annual Growth Rate ** All banks registered in Poland, regardless of their ownership status Source: NBP, Intelace Research
Domestic commercial banks **
Cooperative banks
Banking assets by group of banks, 2005-1H2011 13
15
Foreign bank branches 56
586 682
793
1,042 1,057 1,159
1,224
2005 2006 2007 2008 2009 2010 1H11
547.2 618.7 712.2 929.1 939.9 1,034.2 1,090.5
2005 2006 2007 2008 2009 2010 1H11
5.3 21.0 31.7 56.1 55.7 54.7 60.0
2005 2006 2007 2008 2009 2010 1H11
in PLN billion
33.9 42.1 48.9 56.5 61.7 70.4 73.8
2005 2006 2007 2008 2009 2010 1H11
IN PLN
+6%
% change in the period
+5%
+10%
+5%
Cooperative sector is growing faster
Intelace Research
Ban
king M
arket in P
olan
d 201
1–2013
9
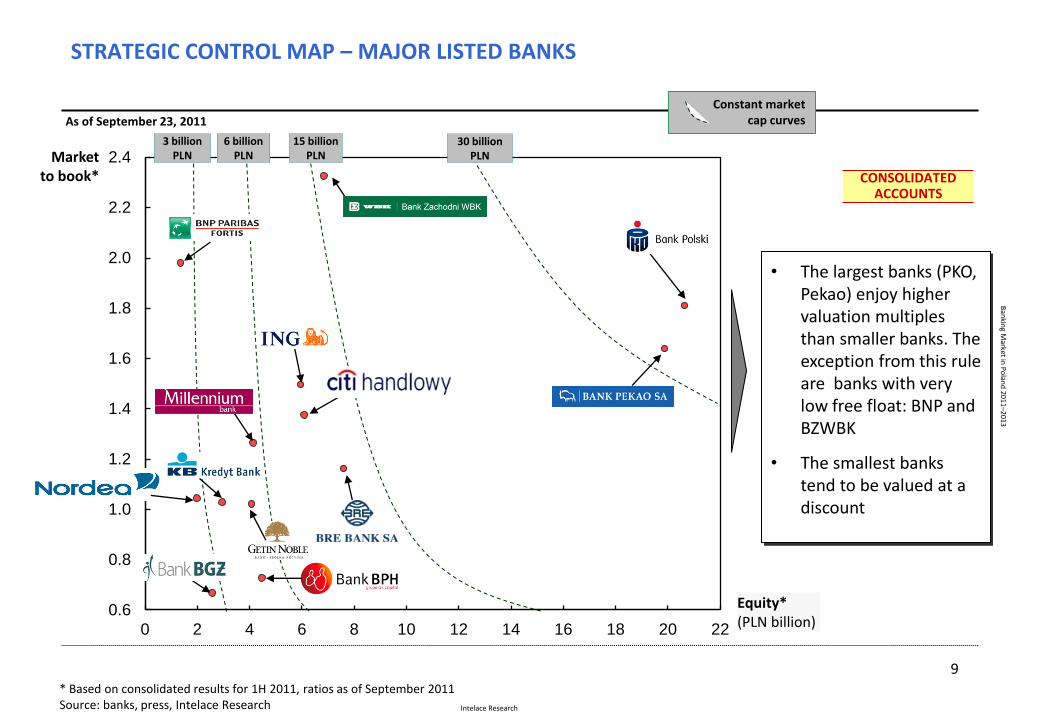
STRATEGIC CONTROL MAP – MAJOR LISTED BANKS
0.6
0.8
1.0
1.2
1.4
1.6
1.8
2.0
2.2
2.4
0 2 4 6 8 10 12 14 16 18 20 22
Equity* (PLN billion)
Market to book*
Constant market cap curves
* Based on consolidated results for 1H 2011, ratios as of September 2011 Source: banks, press, Intelace Research
• The largest banks (PKO, Pekao) enjoy higher valuation multiples than smaller banks. The exception from this rule are banks with very low free float: BNP and BZWBK
• The smallest banks tend to be valued at a discount
CONSOLIDATED ACCOUNTS
30 billion PLN
6 billion PLN
3 billion PLN
As of September 23, 2011
15 billion PLN
Intelace Research
Ban
king M
arket in P
olan
d 201
1–2013
10
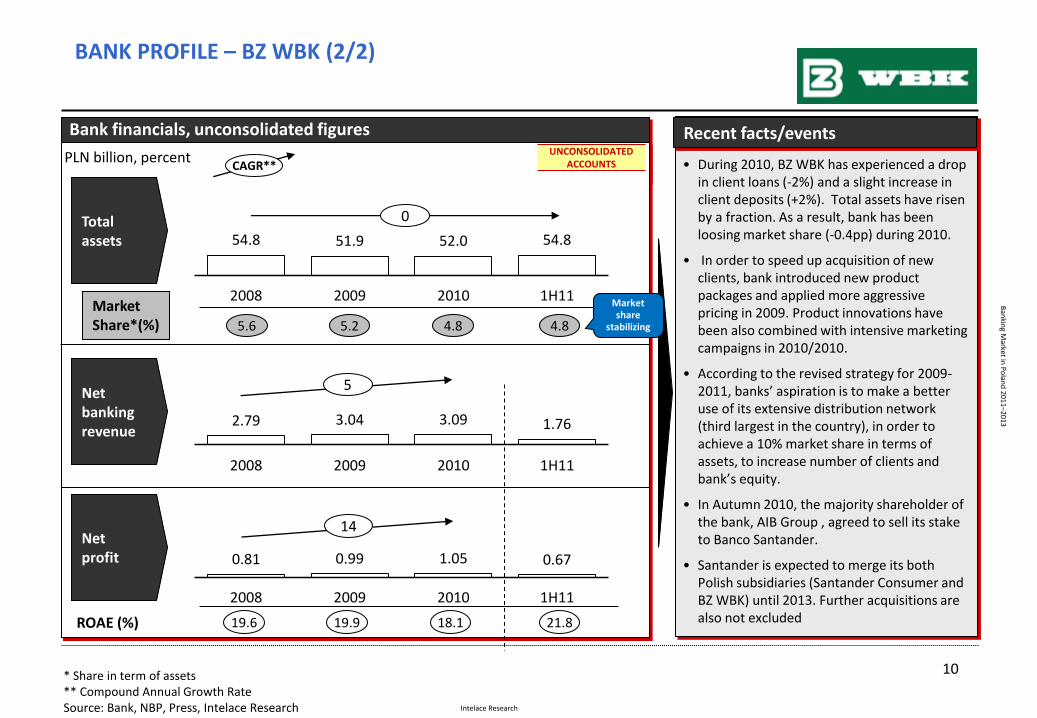
BANK PROFILE – BZ WBK (2/2)
Bank financials, unconsolidated figures
* Share in term of assets ** Compound Annual Growth Rate Source: Bank, NBP, Press, Intelace Research
Total assets
Net banking revenue
Net profit
• During 2010, BZ WBK has experienced a drop in client loans (-2%) and a slight increase in client deposits (+2%). Total assets have risen by a fraction. As a result, bank has been loosing market share (-0.4pp) during 2010.
• In order to speed up acquisition of new clients, bank introduced new product packages and applied more aggressive pricing in 2009. Product innovations have been also combined with intensive marketing campaigns in 2010/2010.
• According to the revised strategy for 2009-2011, banks’ aspiration is to make a better use of its extensive distribution network (third largest in the country), in order to achieve a 10% market share in terms of assets, to increase number of clients and bank’s equity.
• In Autumn 2010, the majority shareholder of the bank, AIB Group , agreed to sell its stake to Banco Santander.
• Santander is expected to merge its both Polish subsidiaries (Santander Consumer and BZ WBK) until 2013. Further acquisitions are also not excluded
Recent facts/events
ROAE (%)
Market Share*(%)
PLN billion, percent
4.8 5.6 4.8 5.2
18.1 19.6 21.8 19.9
CAGR** UNCONSOLIDATED
ACCOUNTS
0
54.8 51.9 52.0 54.8
2008 2009 2010 1H11
2.79 3.04 3.09 1.76
2008 2009 2010 1H11
0.81 0.99 1.05 0.67
2008 2009 2010 1H11
14
5
Market share
stabilizing
Intelace Research
Ban
king M
arket in P
olan
d 201
1–2013
11 Visit http://www.intelace.com for more details
Recent documents:
2010
• February - Mortgage Lending in Poland ’10
• April - Banking Market in Poland ’10
• June - Insurance Market in Poland ’10
• July - Banking outlets database ’10
• September - Top 200 CEE banks ’10
• October - Investment Funds and Asset Mgmt. ’10
• November - Banking Market in Ukraine ’10
2011
• February - Mortgage Lending in Poland ’11
• April - Banking Market in Poland ’11
• May - Bank outlets database ’11
• June - Insurance Market in Poland ’11
• August – Investment funds and Asset Management ’11
• September - Top 200 CEE banks ’11
OUR RECENT PUBLICATIONS
Intelace Research
Ban
king M
arket in P
olan
d 201
1–2013
Banks & other institutions mentioned in this report Narodowy Bank Polski , NBP Allied Irish Banks Allianz Bank Alior Bank AIG Bank Polska Bank BPH Bank Pekao Banco Santander BGK BGŻ Bank Gospodarki Żywnościowej BNP Paribas Fortis BRE Multibank BOŚ Bank BZ WBK , Bank Zachodni WBK Cetelem Citibank handlowy Commerzbank Deutshe Bank DnB Nord FM bank Fortis BNP Paribas GE Money Bank GIIF GMAC Getin Noble Bank Idea Bank
Intelace
IDM DM Ikea ING KBC Kredyt Bank KNF Lukas mBank Meritum Bank Millennium BCP Multibank Meritum Bank Nordea Open Finance PKO Bank Polski Pioneer Polbank EFG Rabobank Raiffeisen Bank Santander Consumer Bank UniCredit WestLB VW Bank


![Commercial Banking - Muz[1]](https://static.fdocuments.pl/doc/165x107/577d35951a28ab3a6b90d9b8/commercial-banking-muz1.jpg)