4Developers 2015: Measure to fail - Tomasz Kowalczewski
51
MEASURE TO FAIL DLACZEGO KLIENCI SIĘ CZEPIAJĄ JAK WYKRESY MÓWIĄ, ŻE APLIKACJA JEST SZYBKA?
Transcript of 4Developers 2015: Measure to fail - Tomasz Kowalczewski

M E A S U R E T O F A I L
D L A C Z E G O K L I E N C I S I Ę C Z E P I A J Ą J A K W Y K R E S Y M Ó W I Ą , Ż E
A P L I K A C J A J E S T S Z Y B K A ?

S U R V E Y
• Do you…

S U R V E Y
• Use graphite?
S U R V E Y
• Use graphite?
• Feed it with Coda Hale/Dropwizard metrics?
S U R V E Y
• Use graphite?
• Feed it with Coda Hale/Dropwizard metrics?
• Modify their source? Use nonstandard options?
S U R V E Y
• Use graphite?
• Feed it with Coda Hale/Dropwizard metrics?
• Modify their source? Use nonstandard options?
• Graph average? Median?
S U R V E Y
• Use graphite?
• Feed it with Coda Hale/Dropwizard metrics?
• Modify their source? Use nonstandard options?
• Graph average? Median?
• Percentiles?
S U R V E Y
• Use graphite?
• Feed it with Coda Hale/Dropwizard metrics?
• Modify their source? Use nonstandard options?
• Graph average? Median?
• Percentiles?
• Know the term “cargo cult”?

C A R G O C U L T
During the Middle Ages there were all kinds of
crazy ideas, such as that a piece of of
rhinoceros horn would increase potency. Then a
method was discovered for separating the
ideas- which was to try one to see if it worked,
and if it didn't work, to eliminate it. This method
became organized, of course, into science. And
it developed very well, so that we are now in the
scientific age. It is such a scientific age, in fact,
that we have difficulty in understanding how
witch doctors could ever have existed, when
nothing that they proposed ever really worked-or
very little of it did.
Richard Feynman
From a Caltech commencement address
given in 1974
M E A S U R I N G C O R R E C T L Y I S
I M P O R T A N T
• You get what you measure
• Predictable is better than fast
• One page display requires multiple calls (static and
dynamic resources)
• Multiple microservices are called to generate response
• Each user will do hundreds of displays of your
webpages
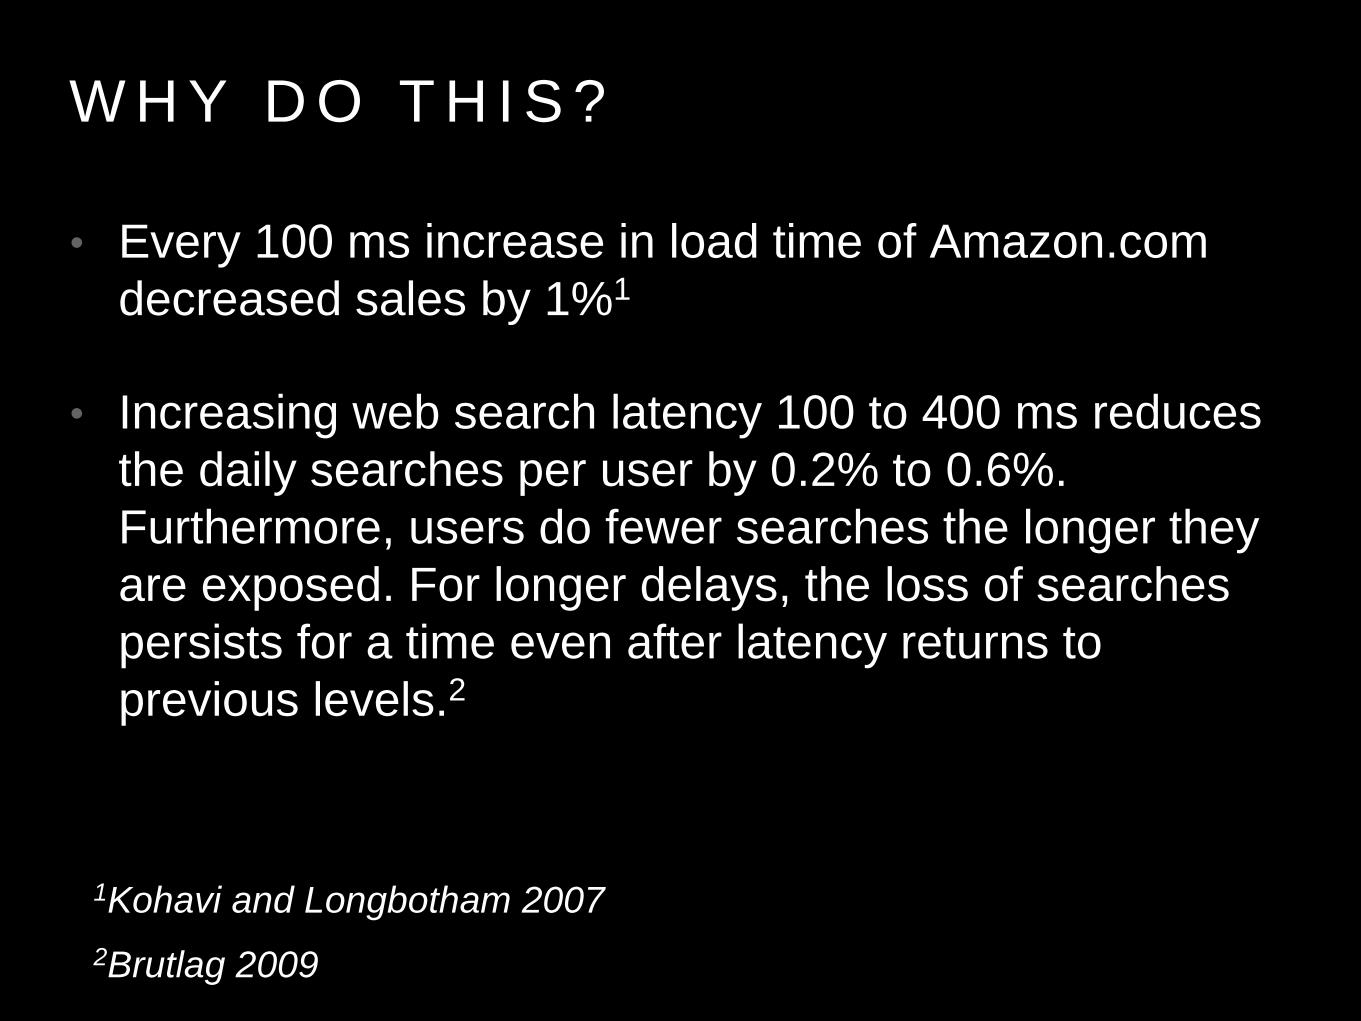
W H Y D O T H I S ?
• Every 100 ms increase in load time of Amazon.com
decreased sales by 1%1
• Increasing web search latency 100 to 400 ms reduces
the daily searches per user by 0.2% to 0.6%.
Furthermore, users do fewer searches the longer they
are exposed. For longer delays, the loss of searches
persists for a time even after latency returns to
previous levels.2
1Kohavi and Longbotham 2007
2Brutlag 2009
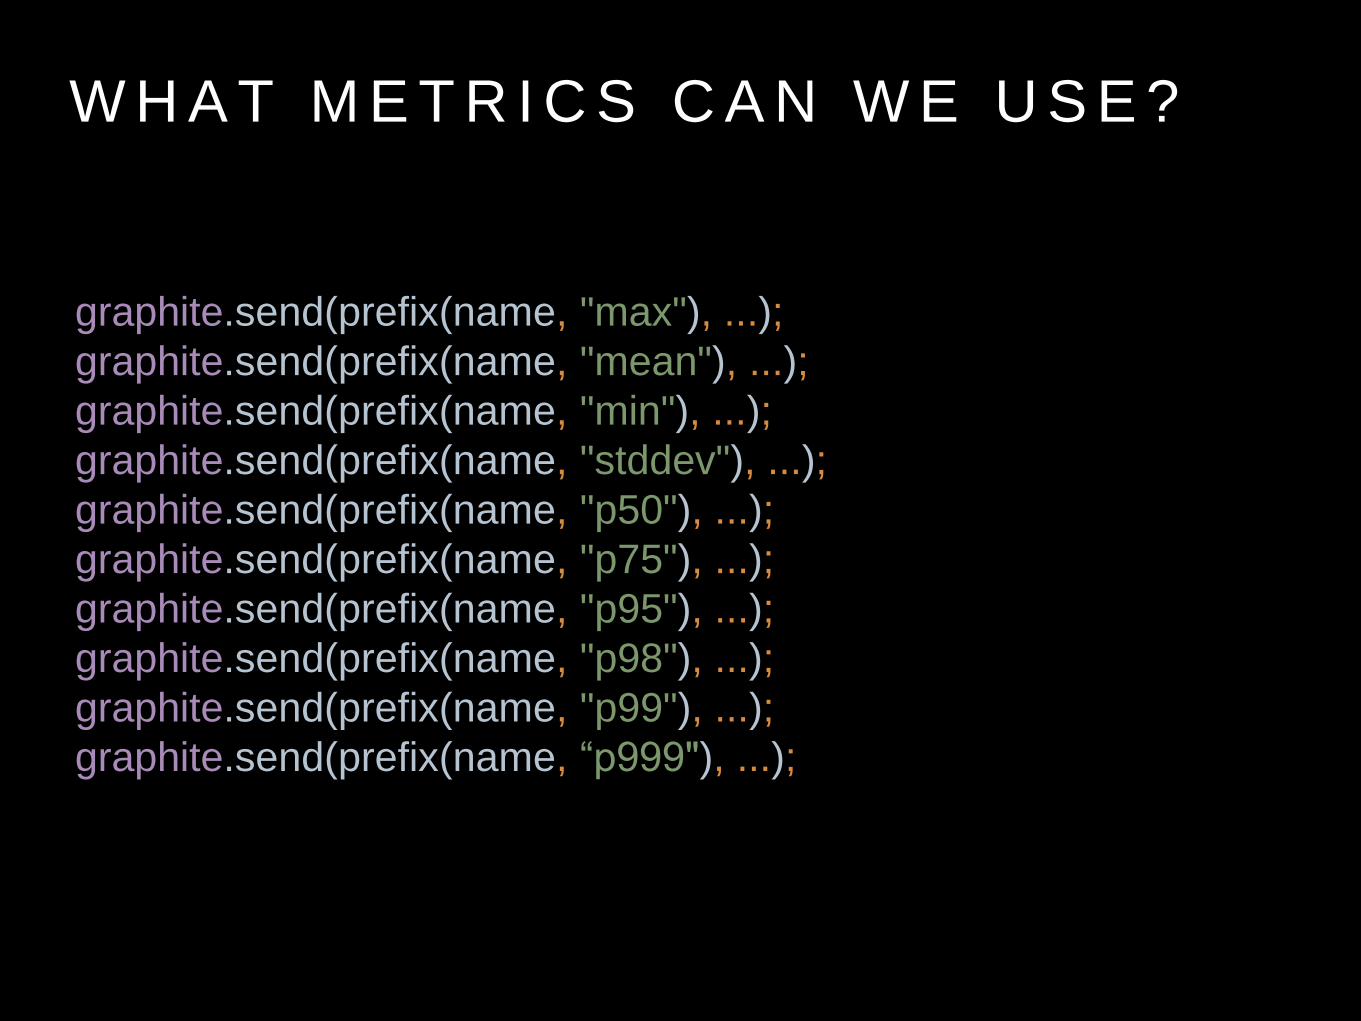
W H A T M E T R I C S C A N W E U S E ?
graphite.send(prefix(name, "max"), ...);
graphite.send(prefix(name, "mean"), ...);
graphite.send(prefix(name, "min"), ...);
graphite.send(prefix(name, "stddev"), ...);
graphite.send(prefix(name, "p50"), ...);
graphite.send(prefix(name, "p75"), ...);
graphite.send(prefix(name, "p95"), ...);
graphite.send(prefix(name, "p98"), ...);
graphite.send(prefix(name, "p99"), ...);
graphite.send(prefix(name, “p999"), ...);
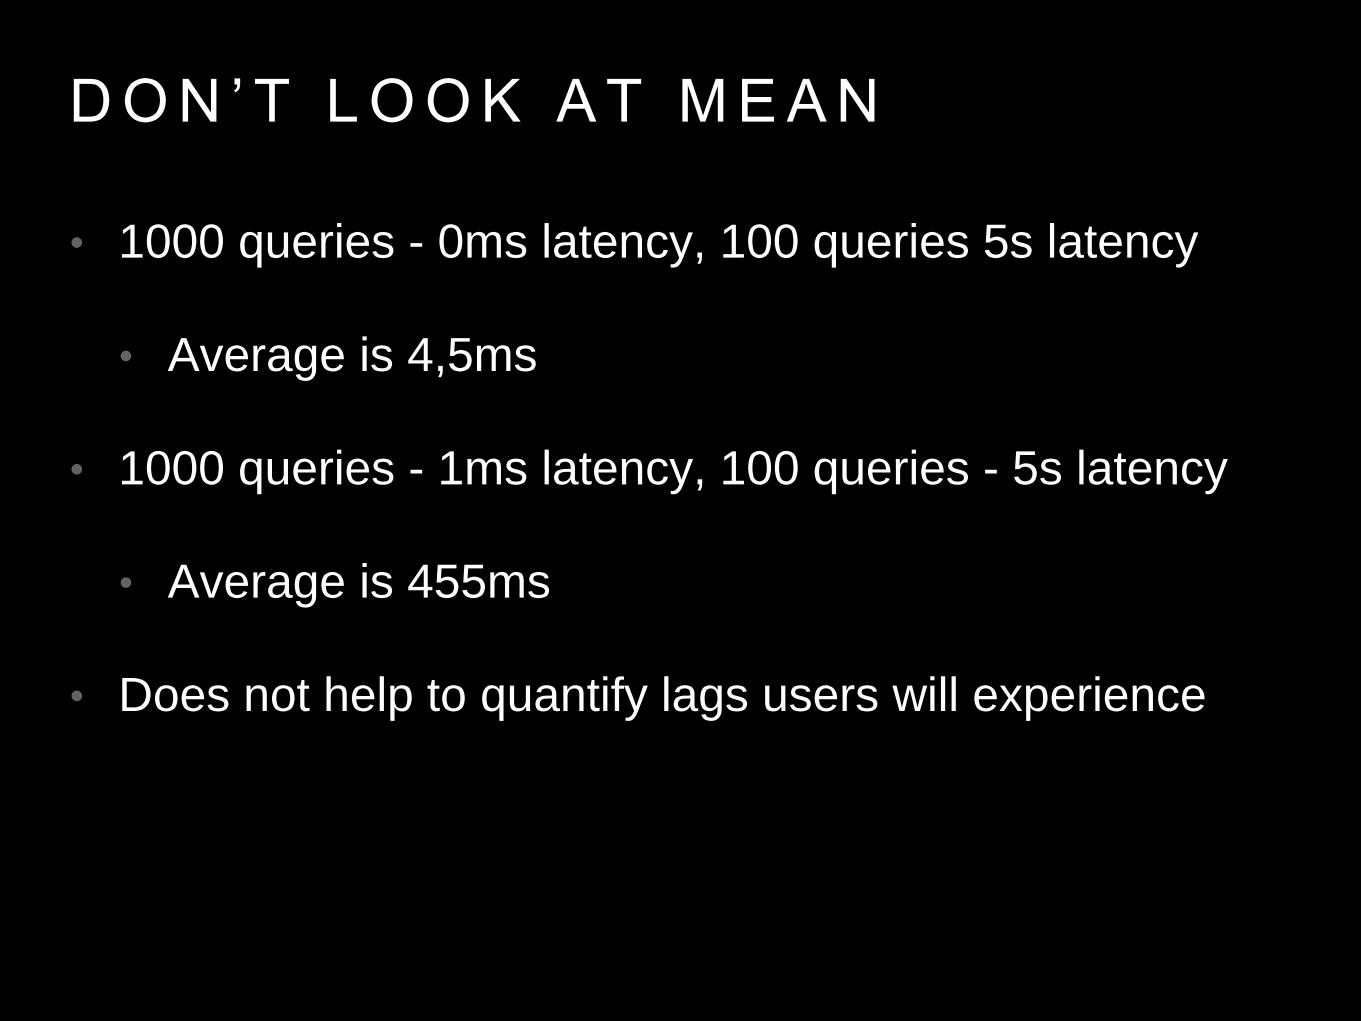
D O N ’ T L O O K A T M E A N
• 1000 queries - 0ms latency, 100 queries 5s latency
• Average is 4,5ms
• 1000 queries - 1ms latency, 100 queries - 5s latency
• Average is 455ms
• Does not help to quantify lags users will experience
P L O T T I N G M E A N I S F O R
S H O W I N G O F F T O M A N A G E M E N T
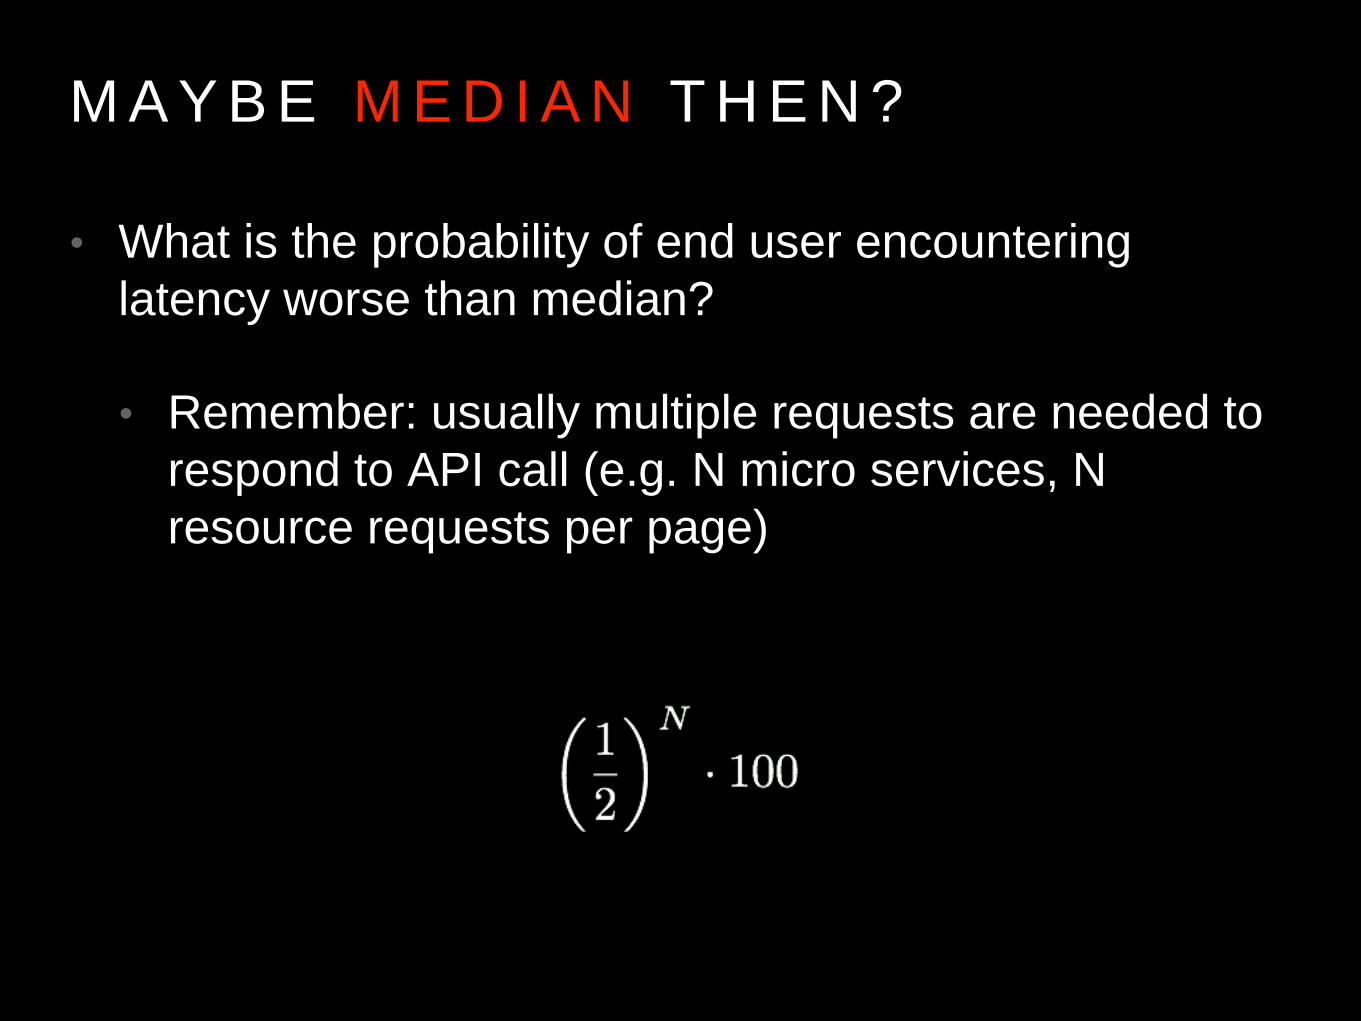
M A Y B E M E D I A N T H E N ?
• What is the probability of end user encountering
latency worse than median?
• Remember: usually multiple requests are needed to
respond to API call (e.g. N micro services, N
resource requests per page)

P R O B A B I L I T Y O F E X P E R I E N C I N G
L A T E N C Y B E T T E R T H A N M E D I A N
I N F U N C T I O N O F M I C R O S E R V I C E S I N V O L V E D
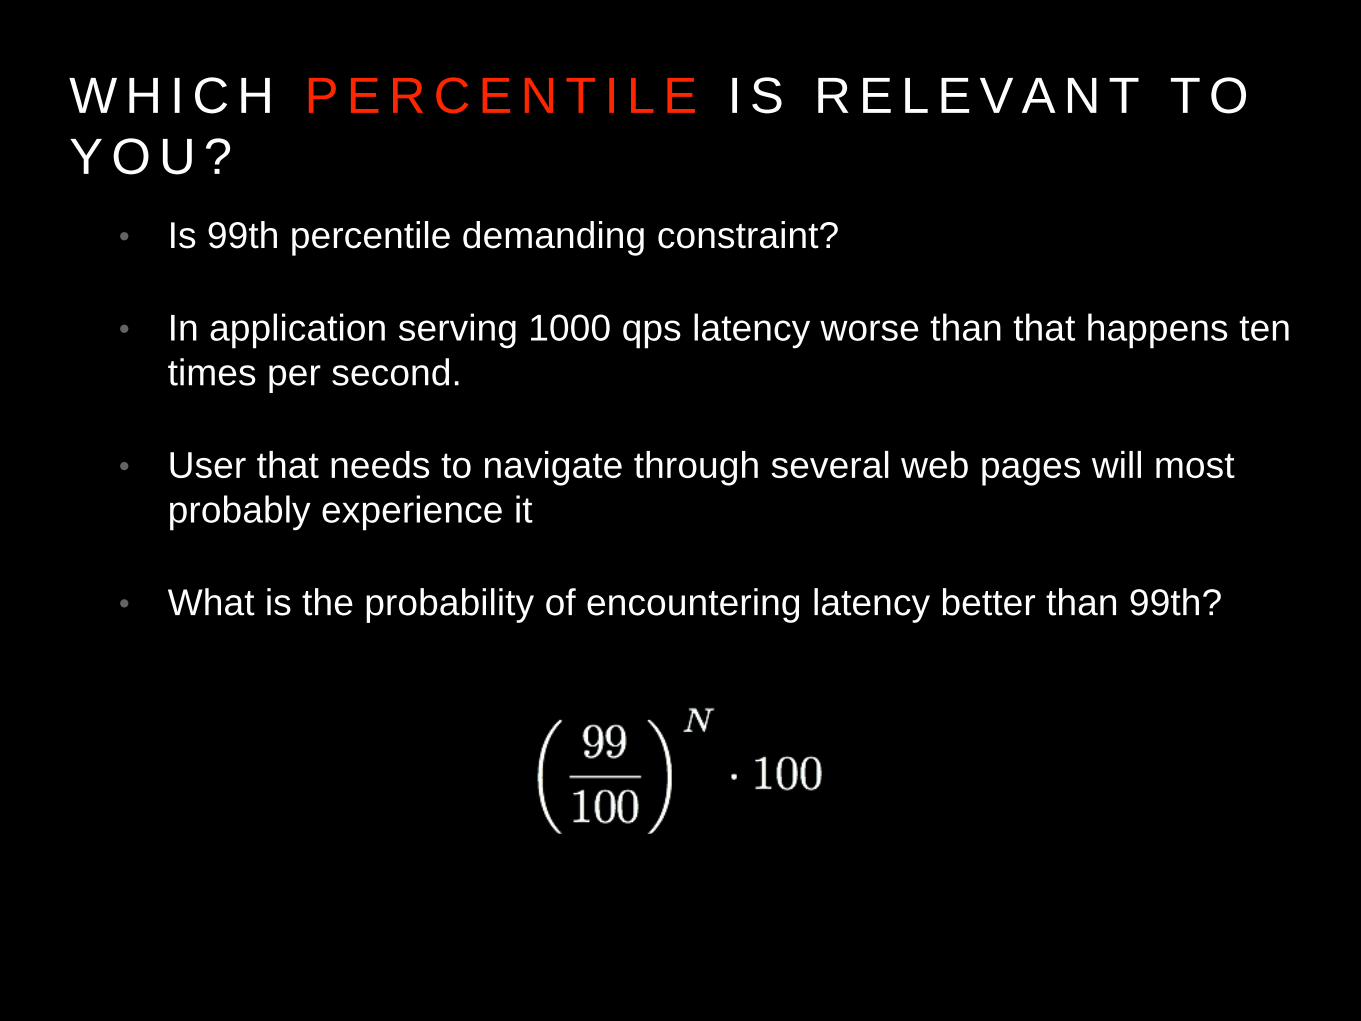
W H I C H P E R C E N T I L E I S R E L E V A N T T O
Y O U ?
• Is 99th percentile demanding constraint?
• In application serving 1000 qps latency worse than that happens ten
times per second.
• User that needs to navigate through several web pages will most
probably experience it
• What is the probability of encountering latency better than 99th?
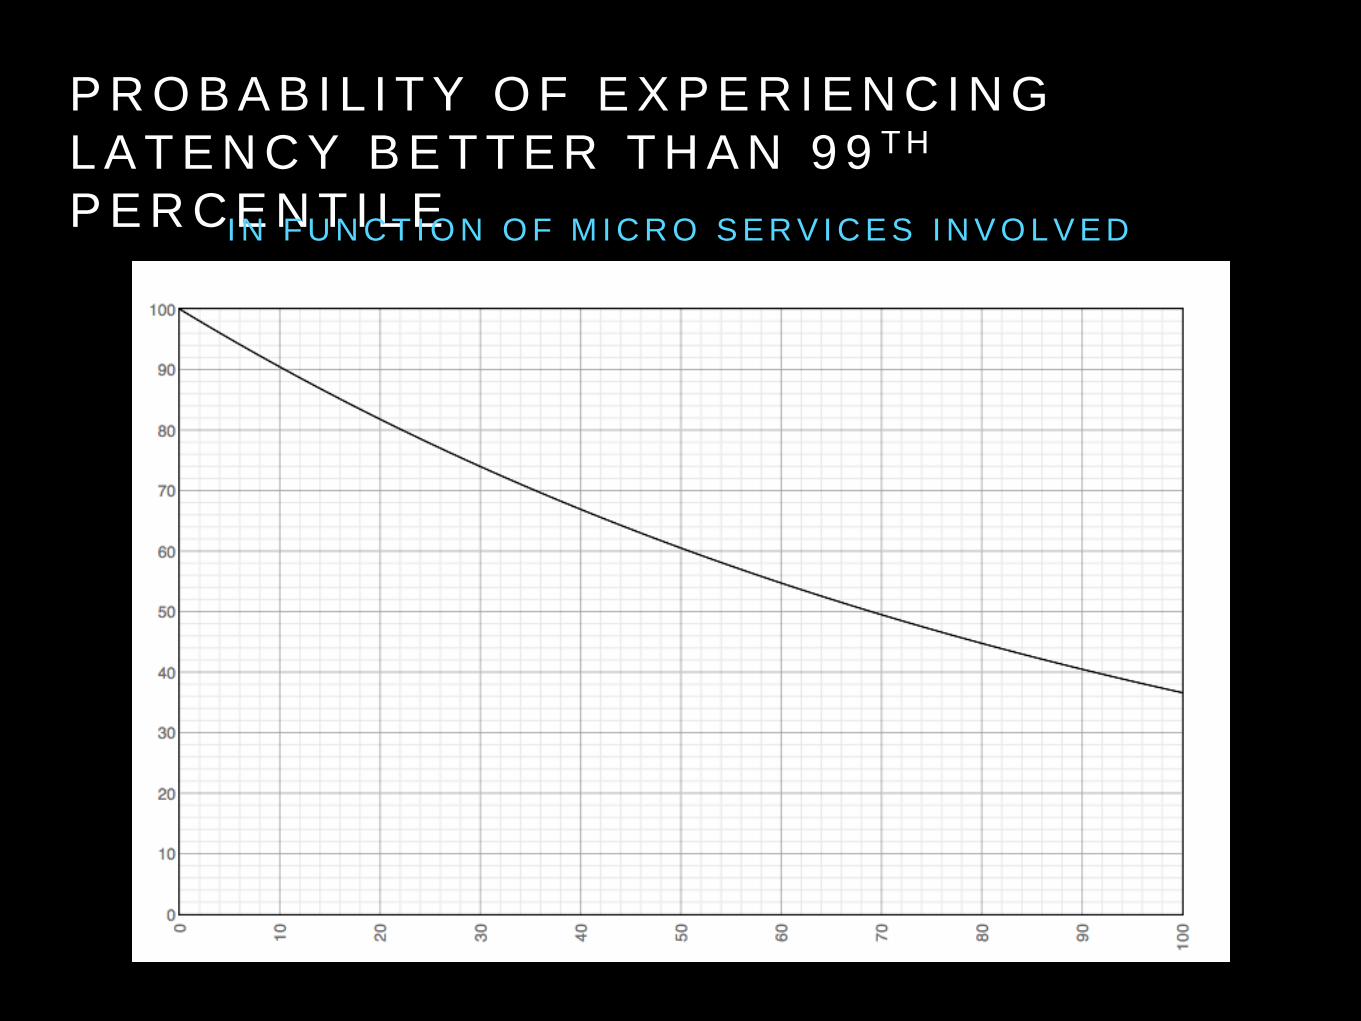
P R O B A B I L I T Y O F E X P E R I E N C I N G
L A T E N C Y B E T T E R T H A N 9 9 T H
P E R C E N T I L EI N F U N C T I O N O F M I C R O S E R V I C E S I N V O L V E D
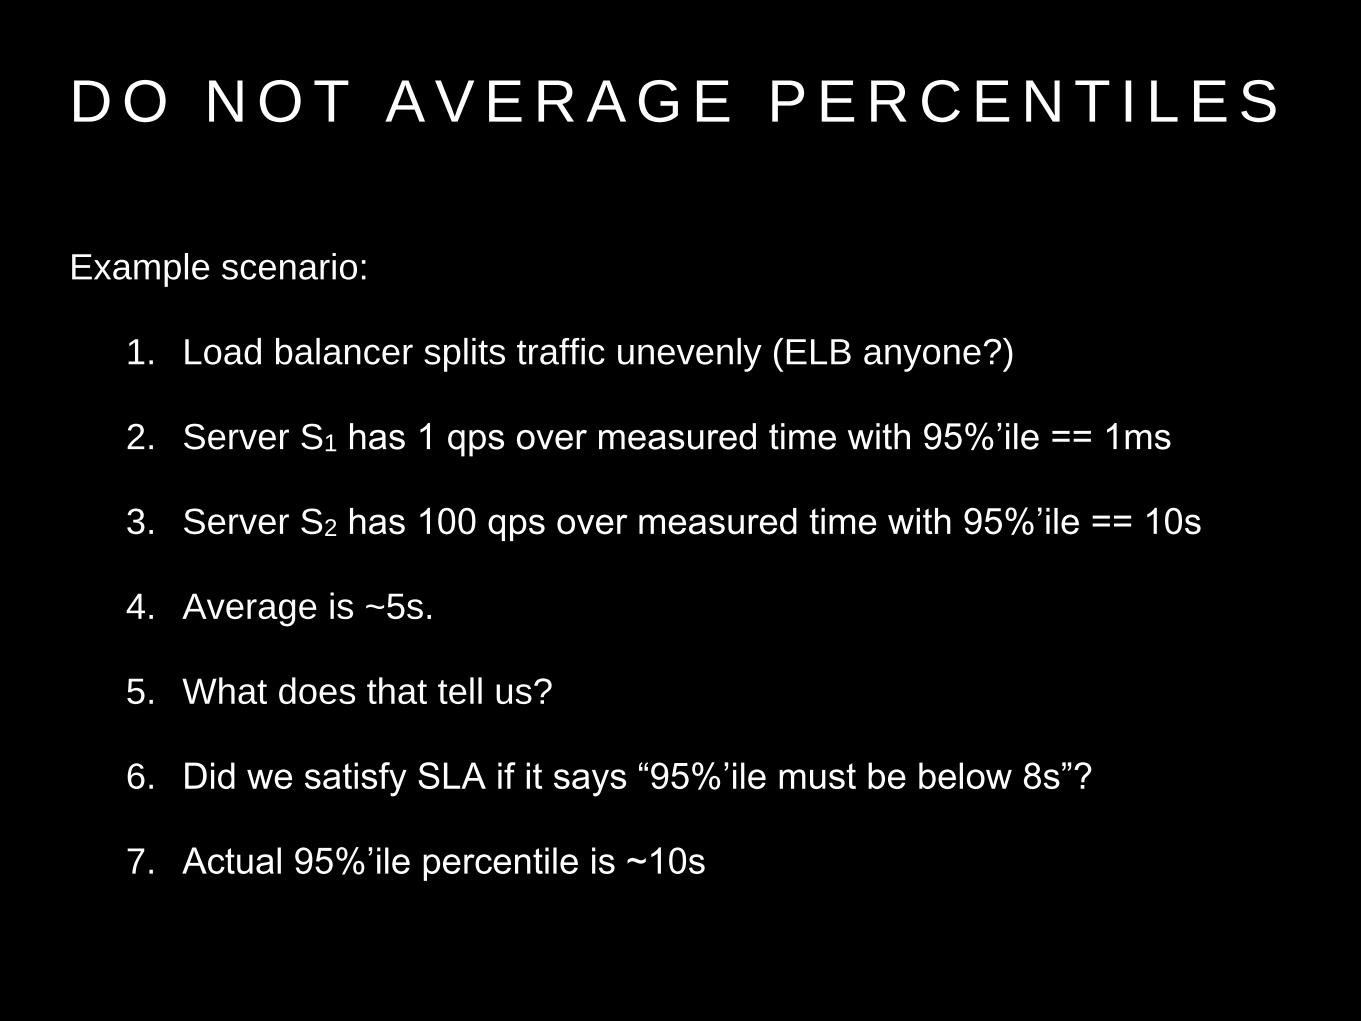
D O N O T A V E R A G E P E R C E N T I L E S
Example scenario:
1. Load balancer splits traffic unevenly (ELB anyone?)
2. Server S1 has 1 qps over measured time with 95%’ile == 1ms
3. Server S2 has 100 qps over measured time with 95%’ile == 10s
4. Average is ~5s.
5. What does that tell us?
6. Did we satisfy SLA if it says “95%’ile must be below 8s”?
7. Actual 95%’ile percentile is ~10s

– A L I C E ' S A D V E N T U R E S I N W O N D E R L A N D
“If there's no meaning in it,' said the King, 'that
saves a world of trouble, you know, as we
needn't try to find any”
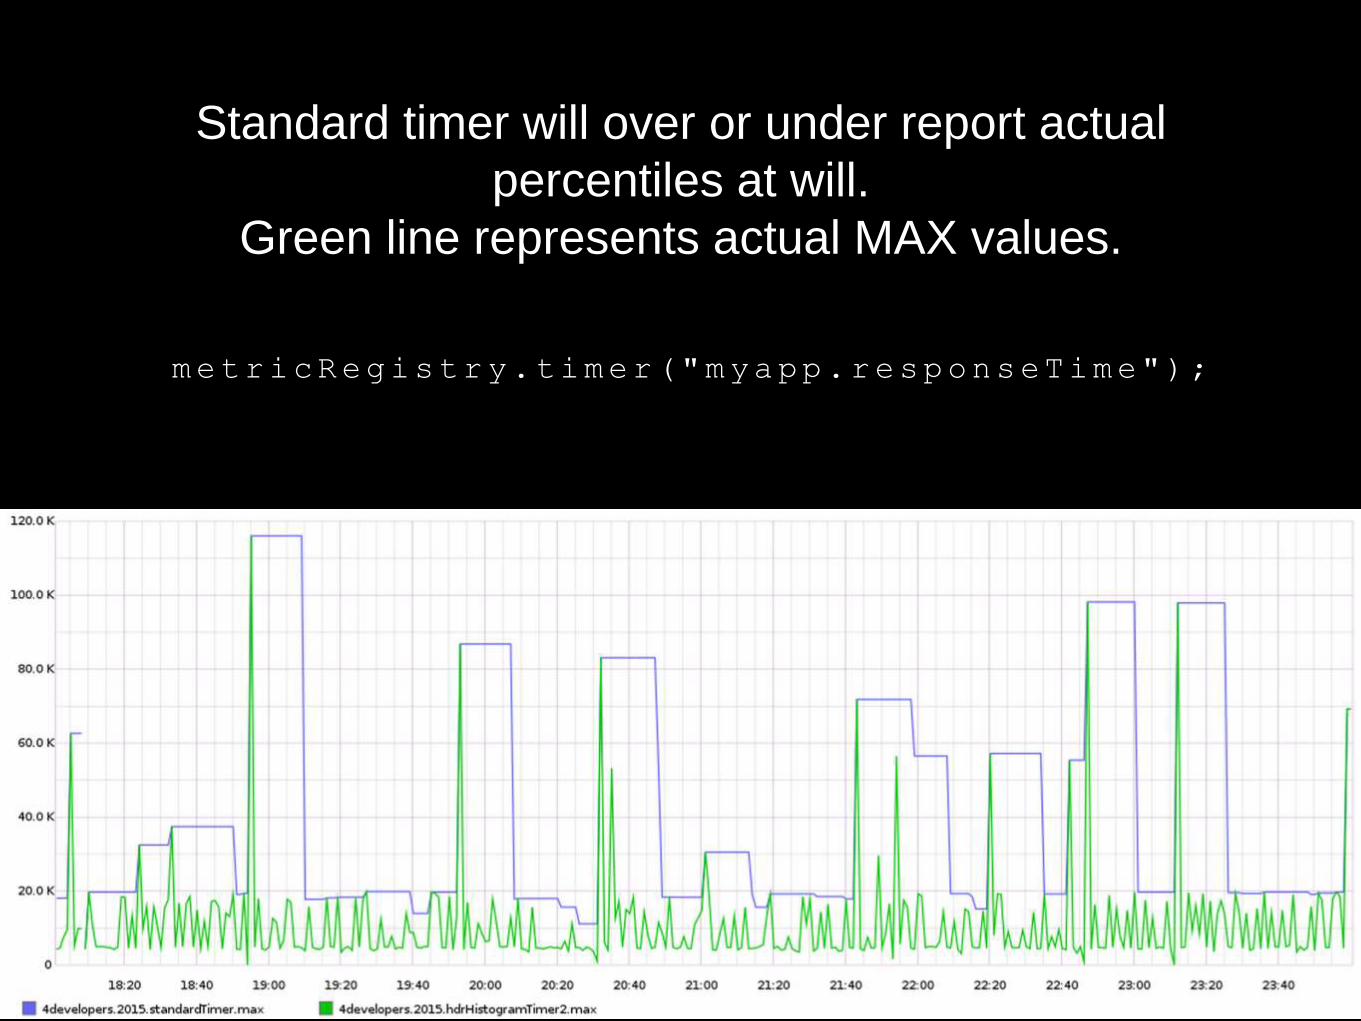
metricRegistry.timer("myapp.responseTime");
Standard timer will over or under report actual
percentiles at will.
Green line represents actual MAX values.
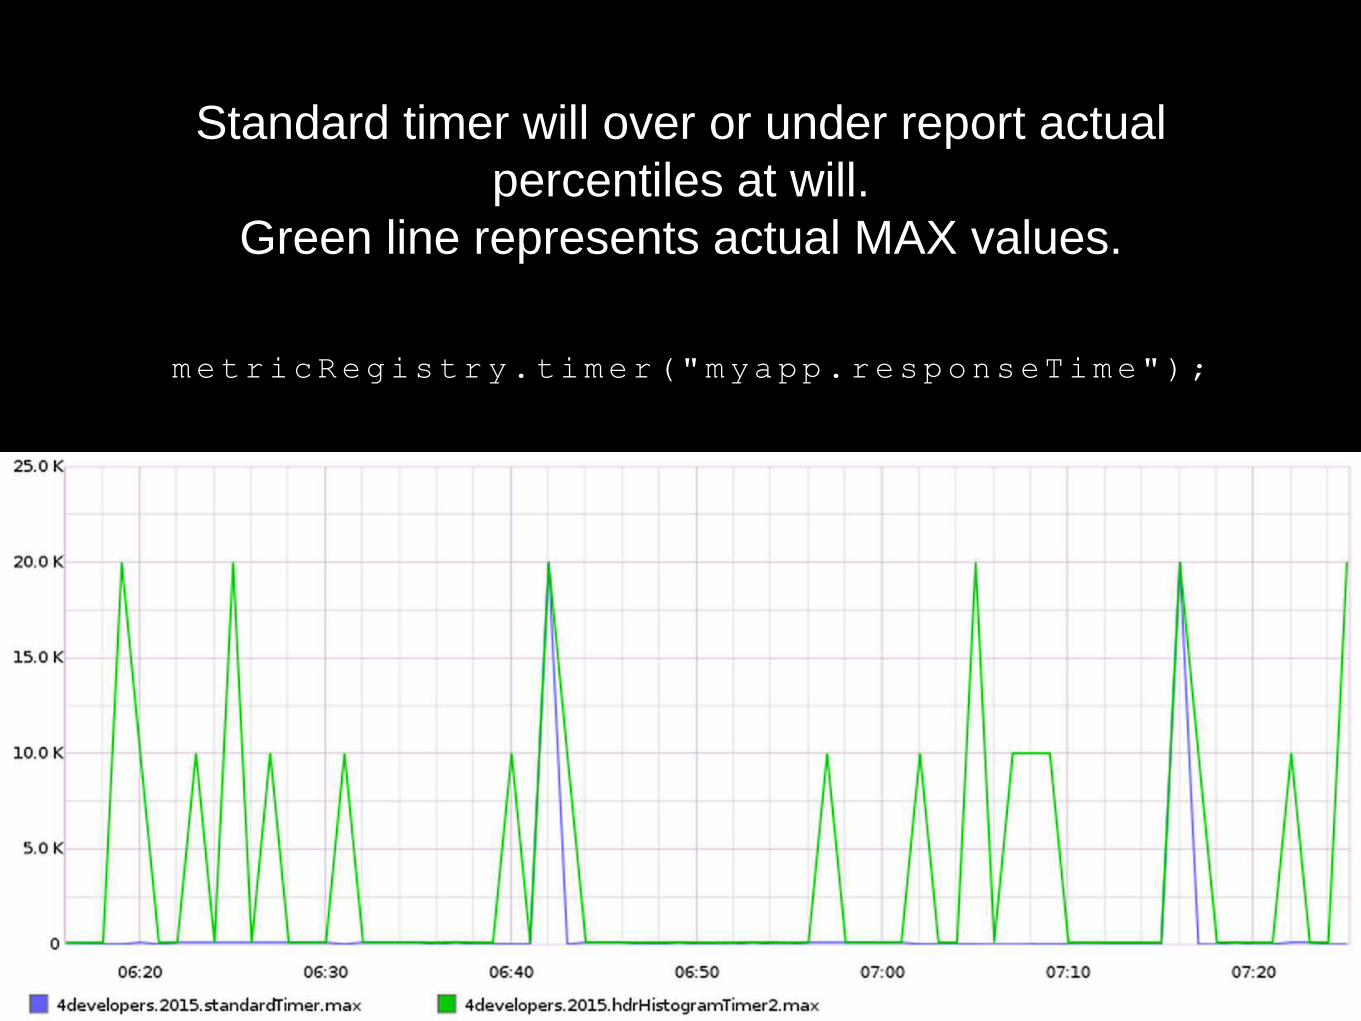
metricRegistry.timer("myapp.responseTime");
Standard timer will over or under report actual
percentiles at will.
Green line represents actual MAX values.
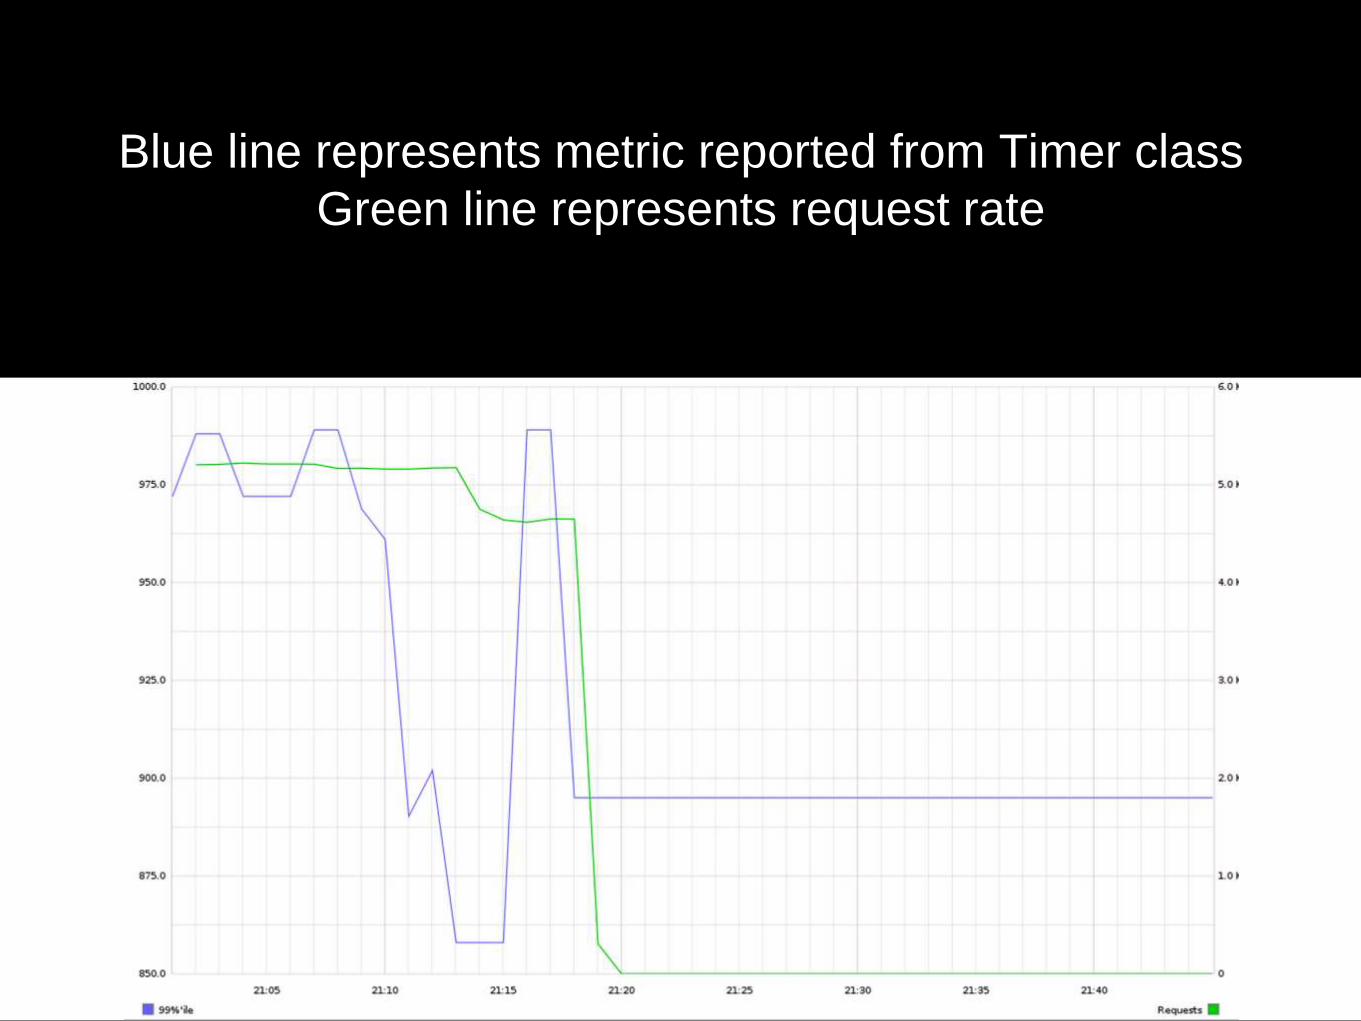
Blue line represents metric reported from Timer class
Green line represents request rate
T I M E R , T I M E R N E V E R
C H A N G E S …• Timer values decay exponentially
• giving artificial smoothing of values for server behaviour that
may be long gone
• Timer that is not updated does not decay
• If Timer is not updated (e.g. subprocess failed and we
stopped sending requests to it) its values will remain constant
• Check this post for potential solutions:
taint.org/2014/01/16/145944a.html
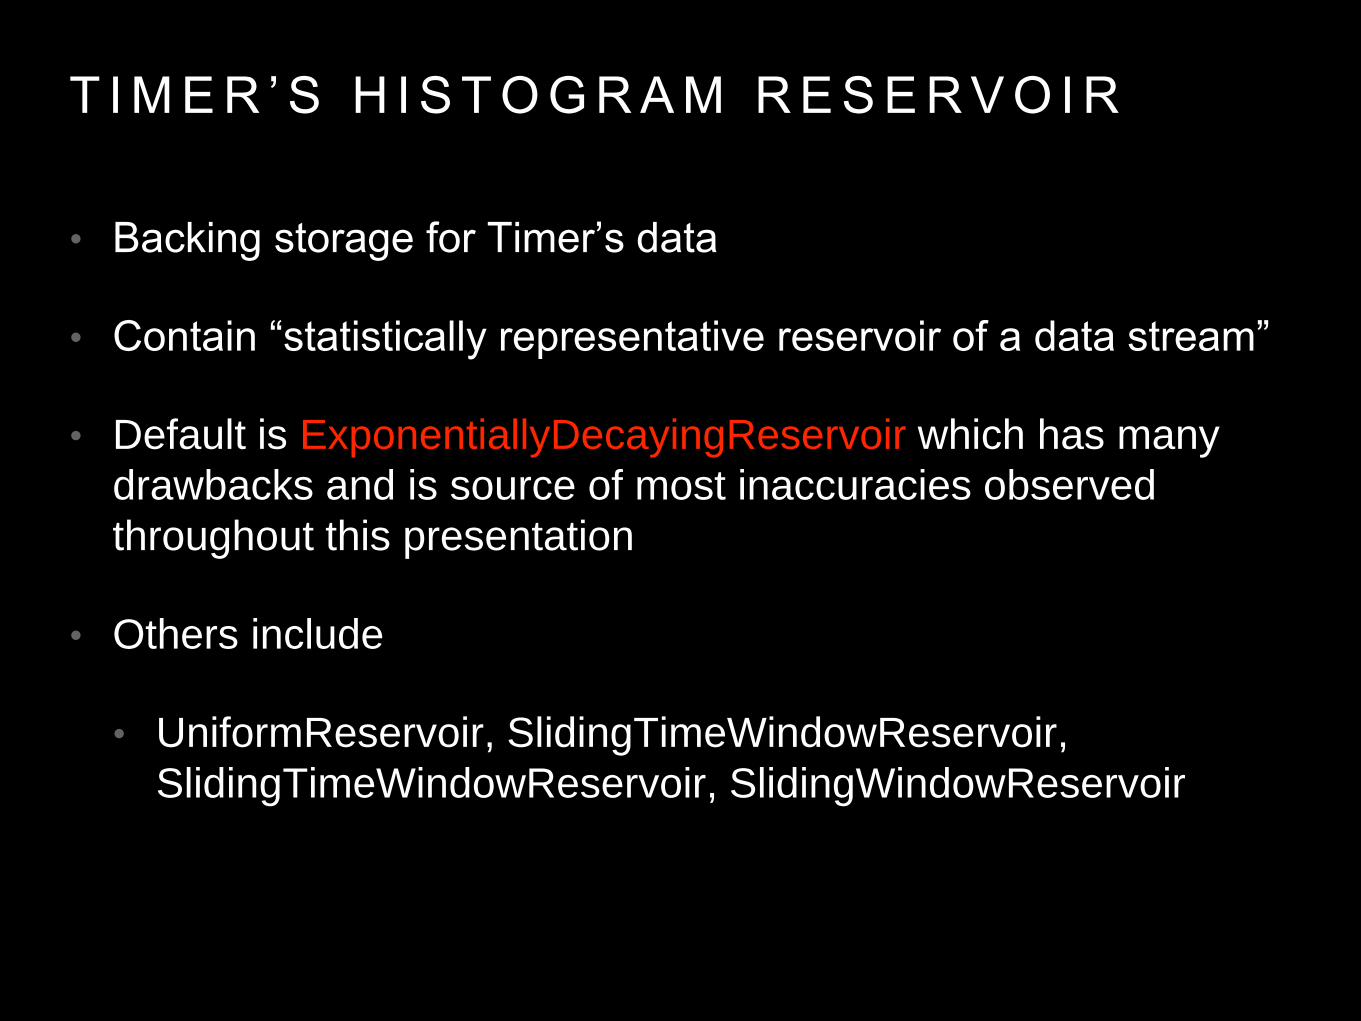
T I M E R ’ S H I S T O G R A M R E S E R V O I R
• Backing storage for Timer’s data
• Contain “statistically representative reservoir of a data stream”
• Default is ExponentiallyDecayingReservoir which has many
drawbacks and is source of most inaccuracies observed
throughout this presentation
• Others include
• UniformReservoir, SlidingTimeWindowReservoir,
SlidingTimeWindowReservoir, SlidingWindowReservoir
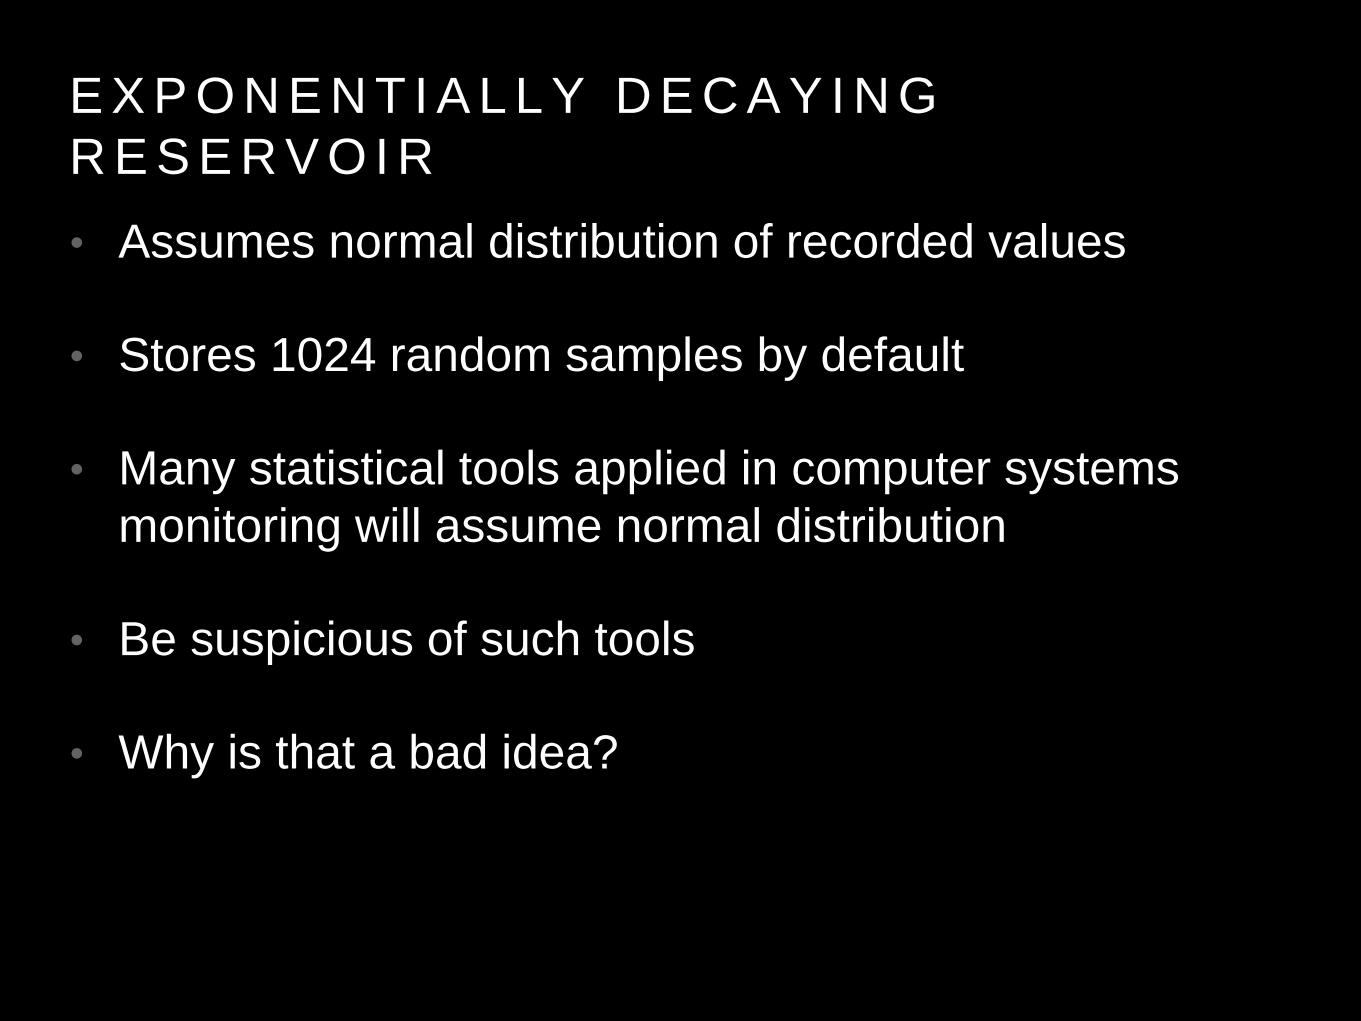
E X P O N E N T I A L L Y D E C A Y I N G
R E S E R V O I R
• Assumes normal distribution of recorded values
• Stores 1024 random samples by default
• Many statistical tools applied in computer systems
monitoring will assume normal distribution
• Be suspicious of such tools
• Why is that a bad idea?
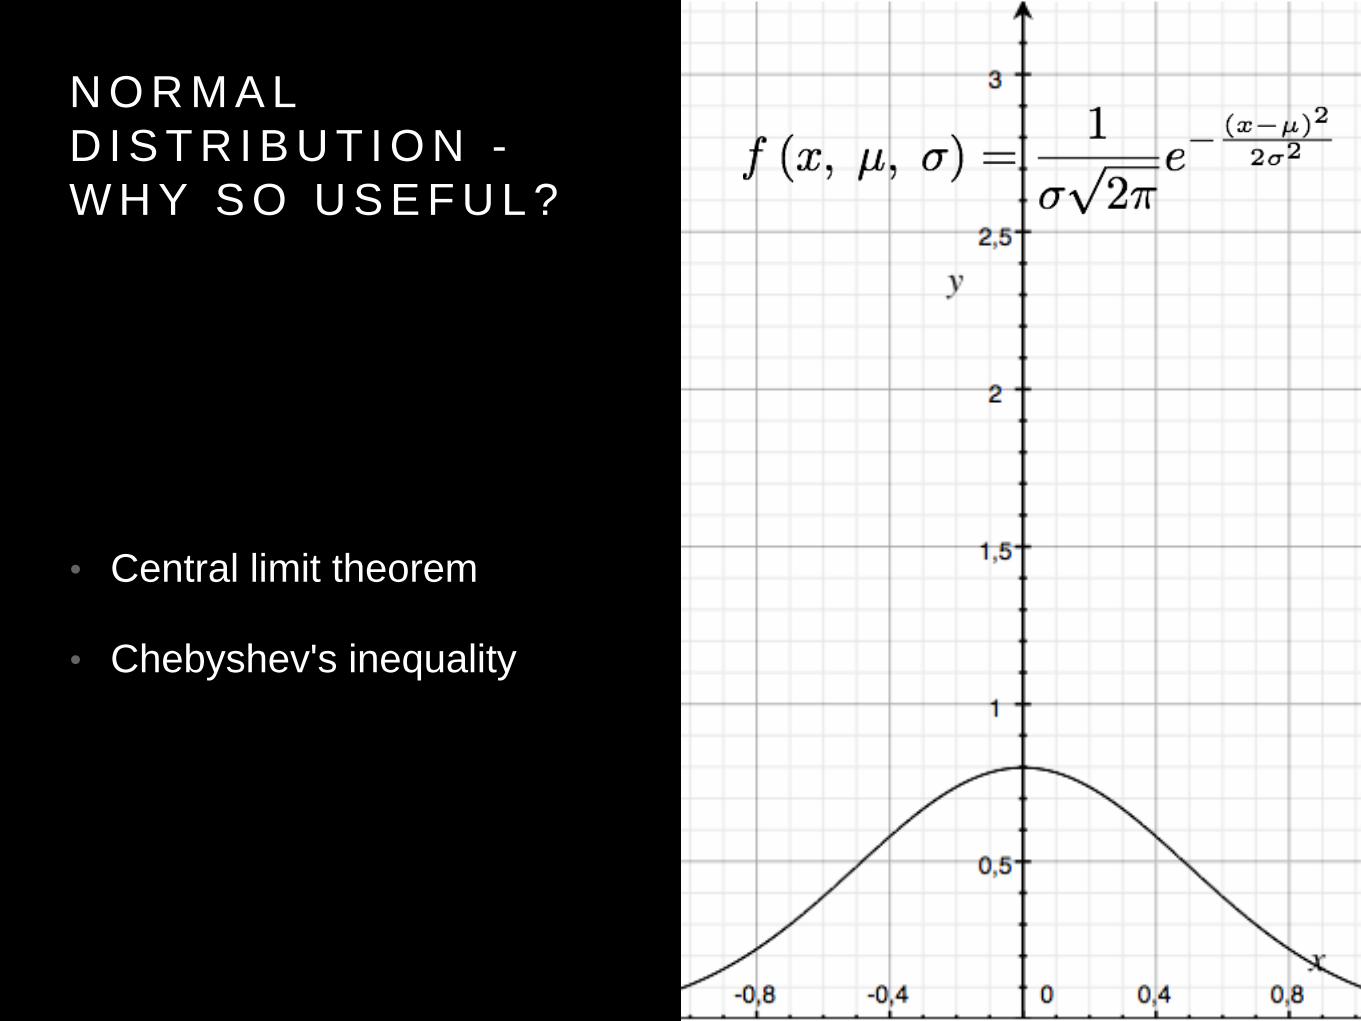
N O R M A L
D I S T R I B U T I O N -
W H Y S O U S E F U L ?
• Central limit theorem
• Chebyshev's inequality
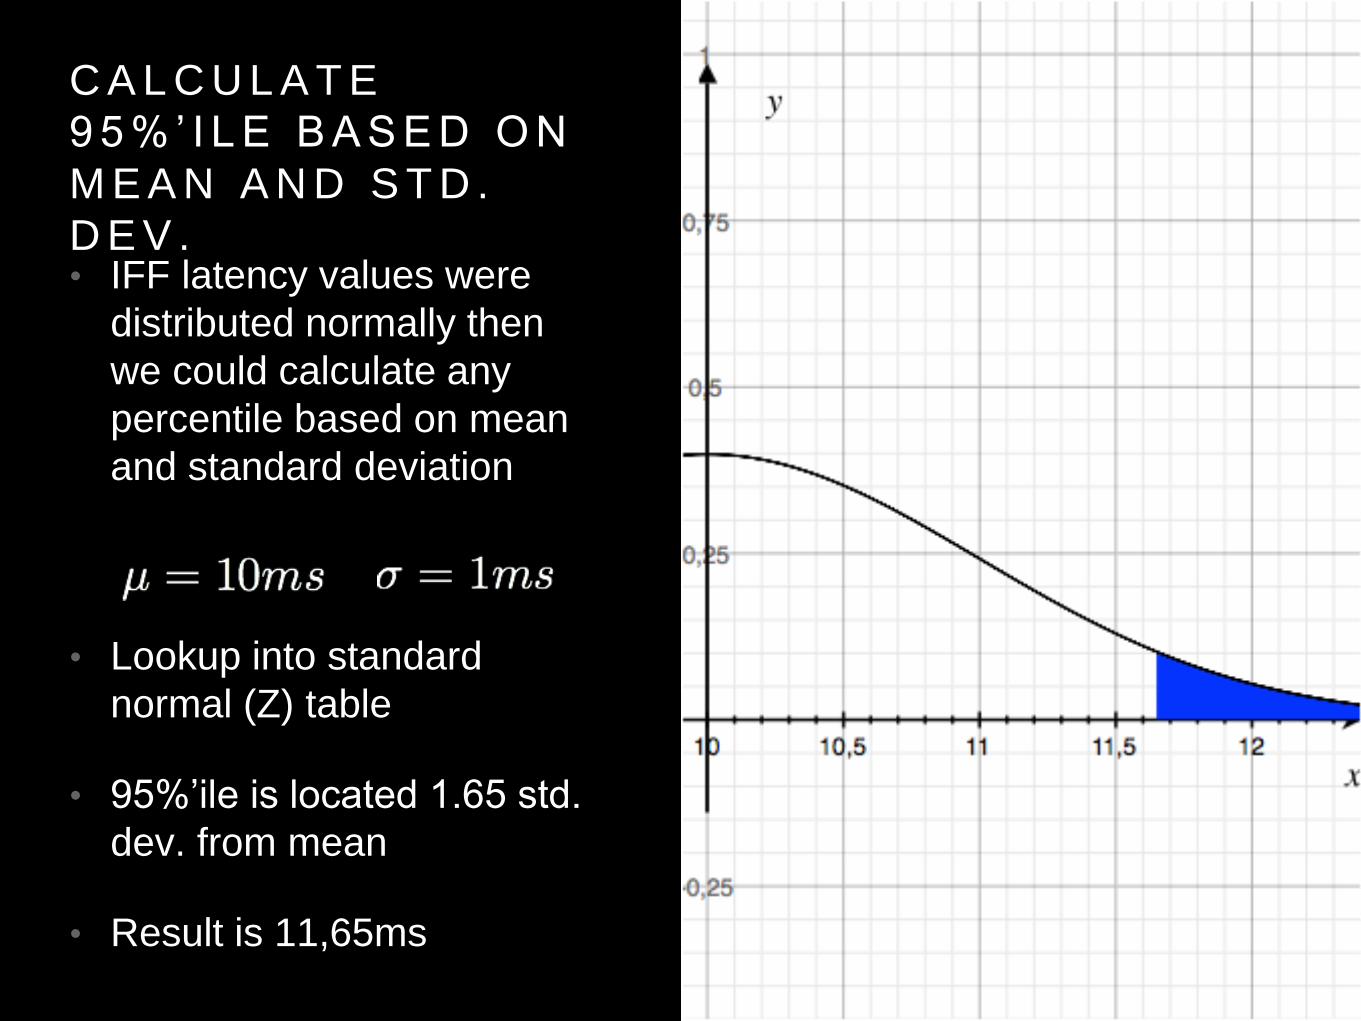
C A L C U L A T E
9 5 % ’ I L E B A S E D O N
M E A N A N D S T D .
D E V .• IFF latency values were
distributed normally then
we could calculate any
percentile based on mean
and standard deviation
• Lookup into standard
normal (Z) table
• 95%’ile is located 1.65 std.
dev. from mean
• Result is 11,65ms
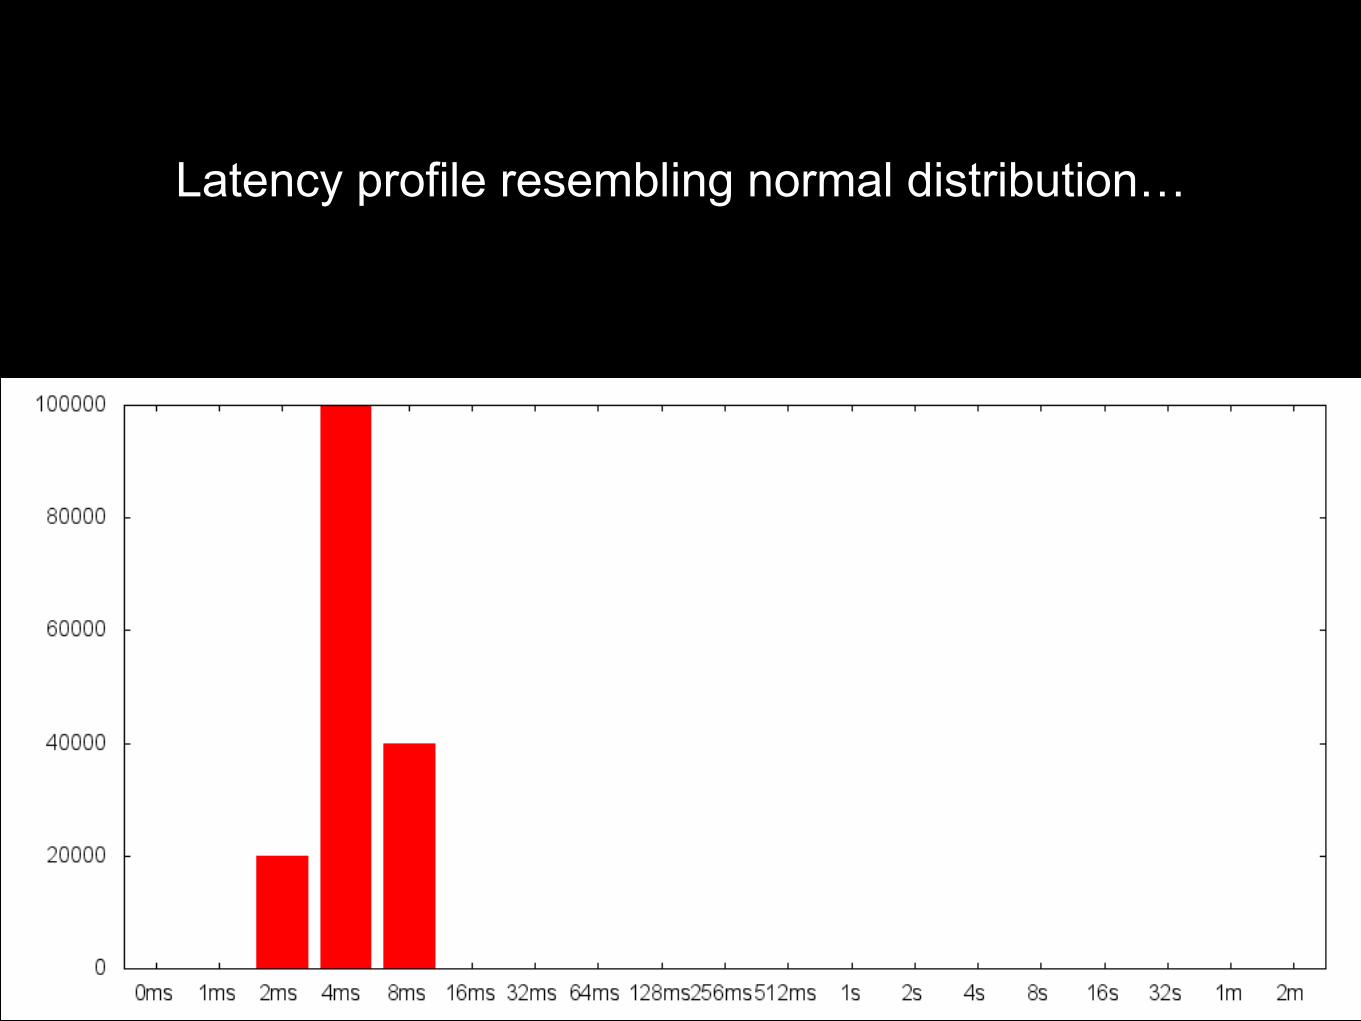
Latency profile resembling normal distribution…
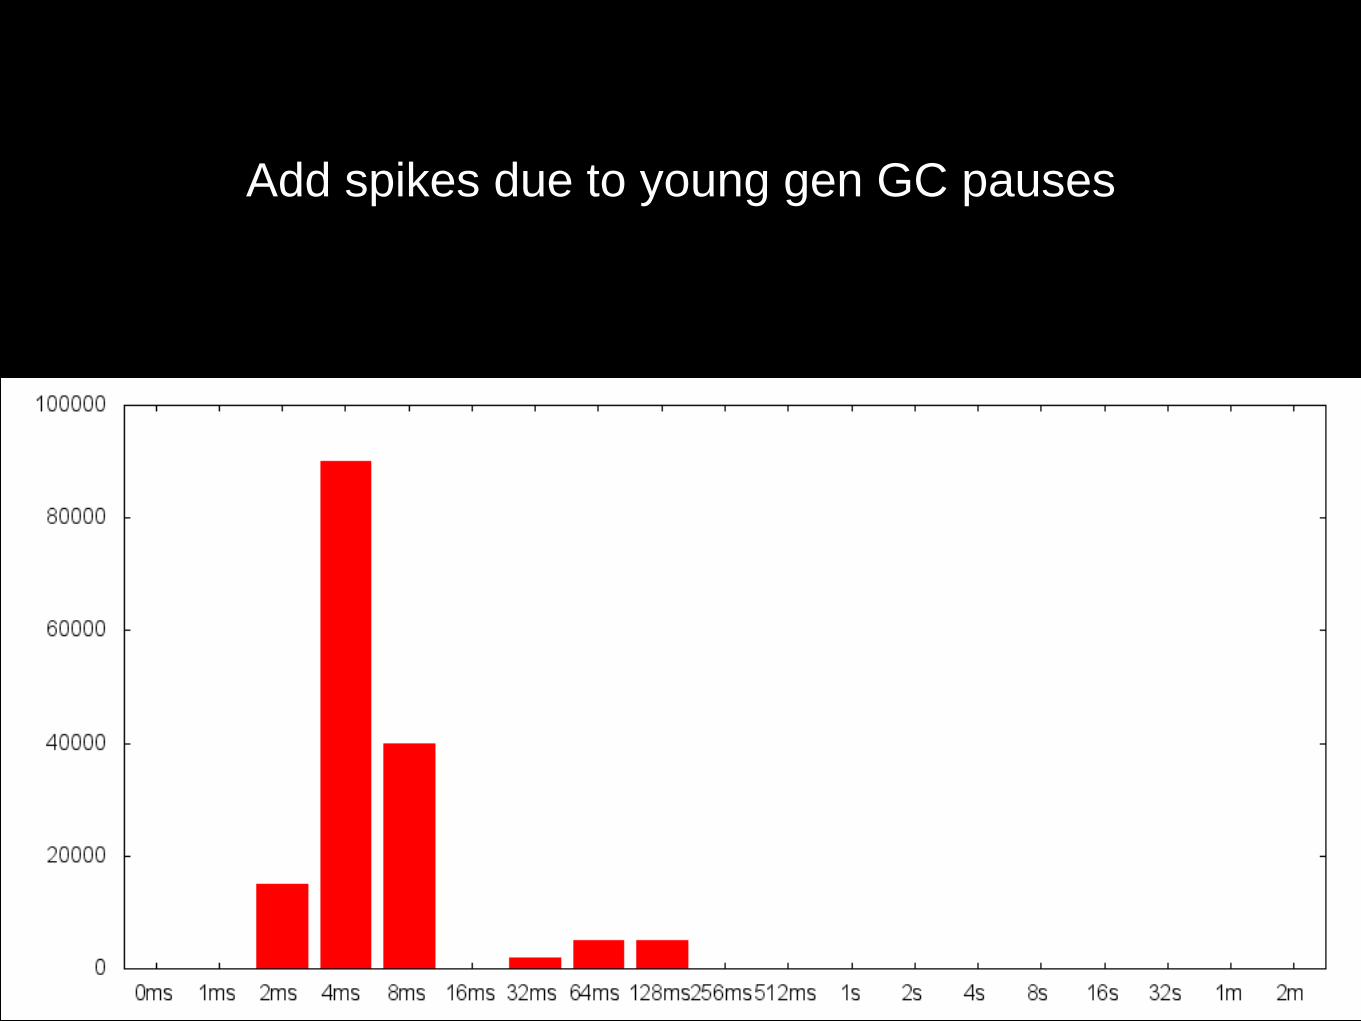
Add spikes due to young gen GC pauses
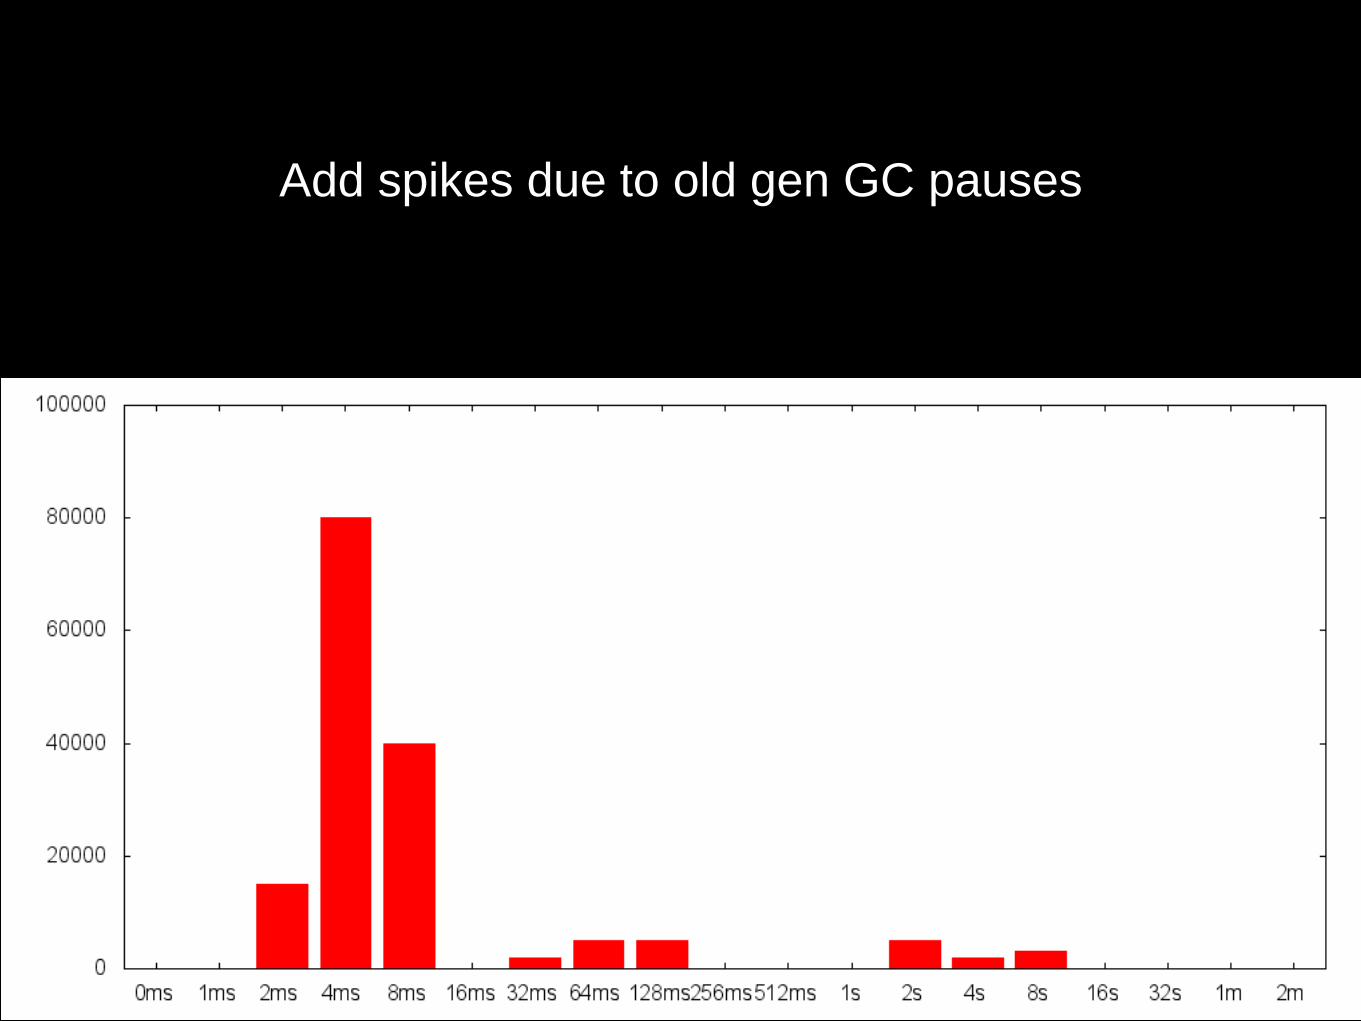
Add spikes due to old gen GC pauses
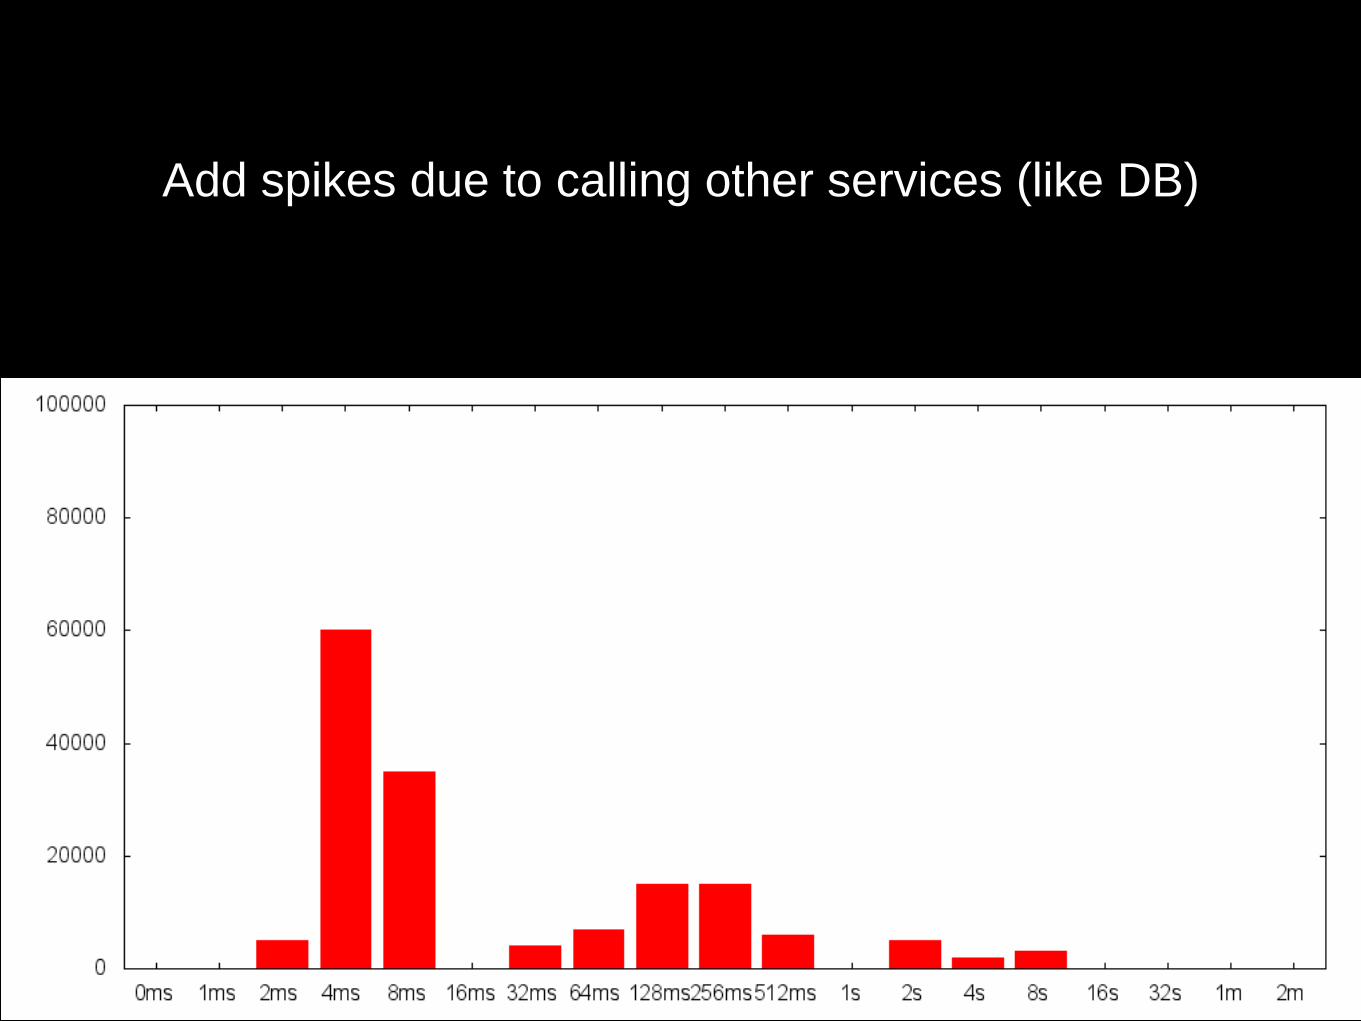
Add spikes due to calling other services (like DB)
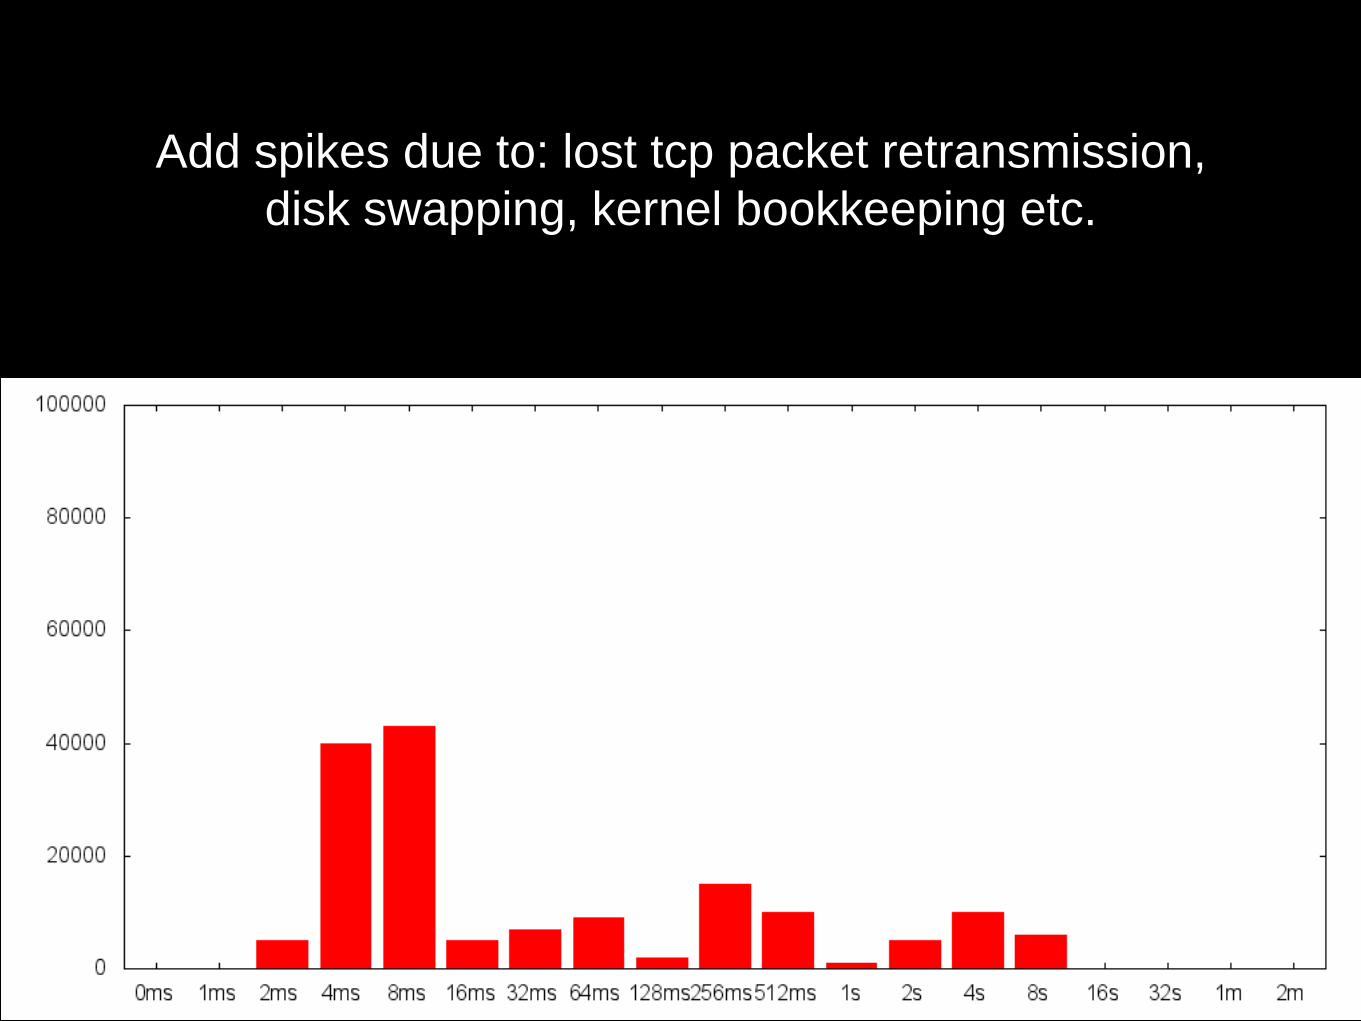
Add spikes due to: lost tcp packet retransmission,
disk swapping, kernel bookkeeping etc.
N O R M A L
D I S T R I B U T I O N -
W H Y N O T
A P P L I C A B L E ?
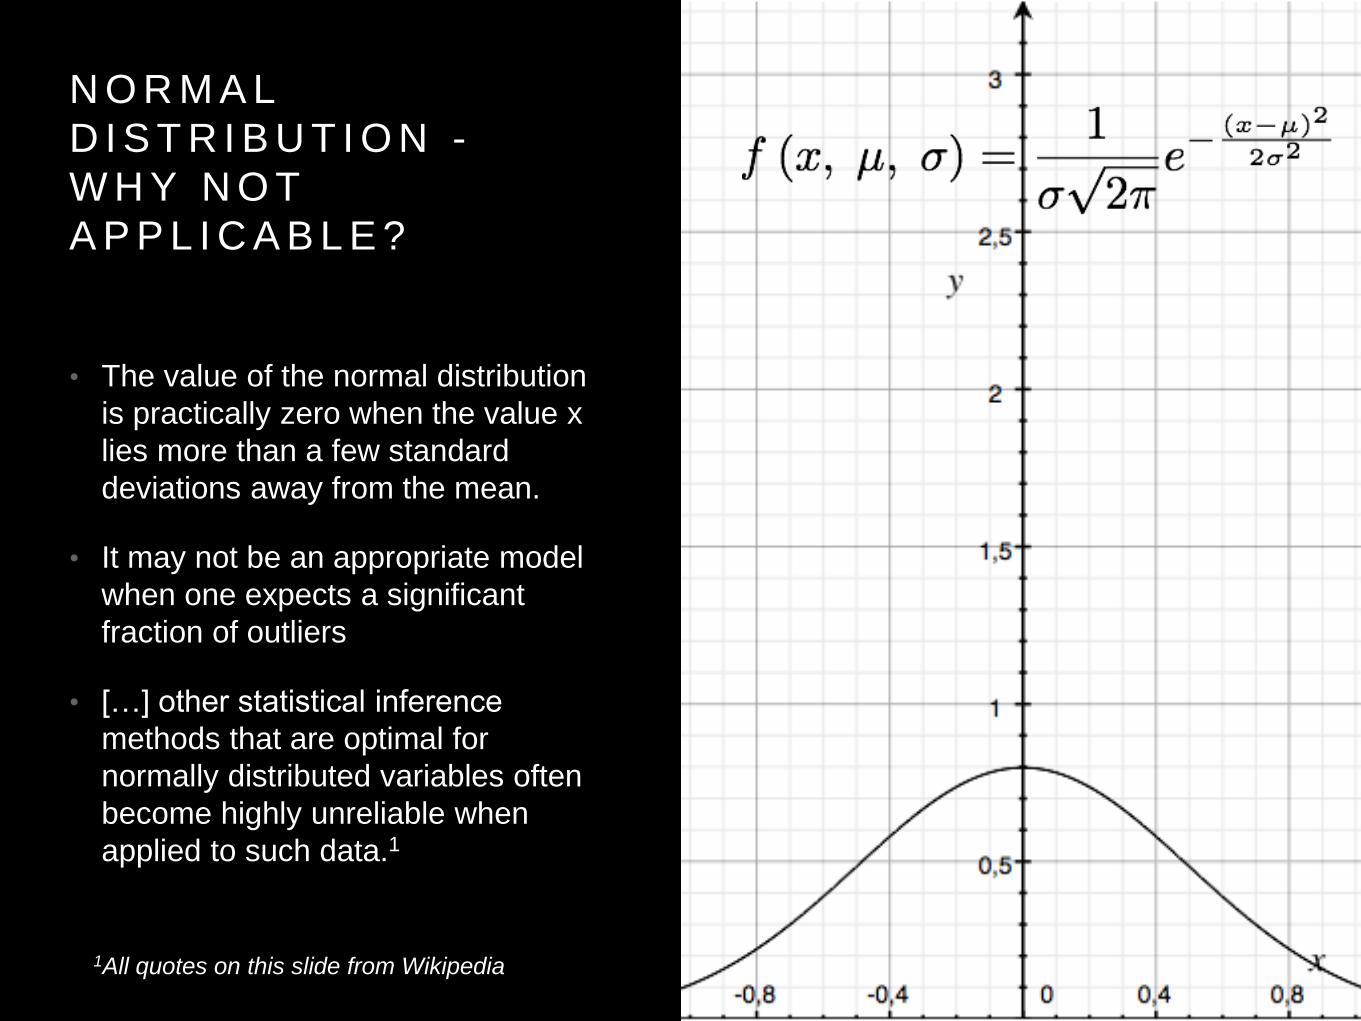
• The value of the normal distribution
is practically zero when the value x
lies more than a few standard
deviations away from the mean.
• It may not be an appropriate model
when one expects a significant
fraction of outliers
• […] other statistical inference
methods that are optimal for
normally distributed variables often
become highly unreliable when
applied to such data.1
1All quotes on this slide from Wikipedia
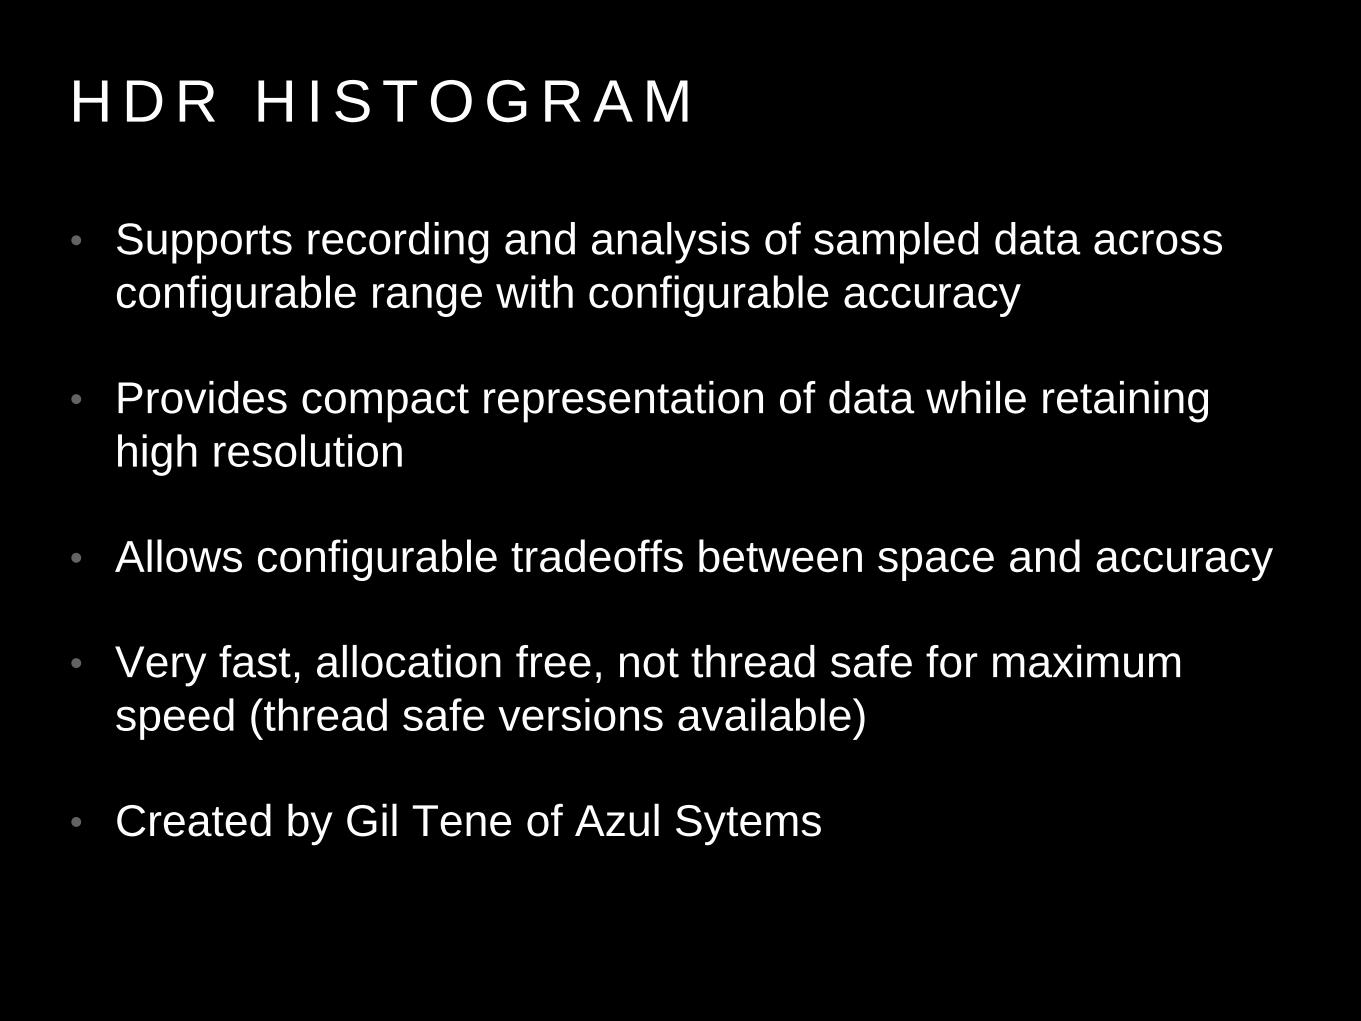
H D R H I S T O G R A M
• Supports recording and analysis of sampled data across
configurable range with configurable accuracy
• Provides compact representation of data while retaining
high resolution
• Allows configurable tradeoffs between space and accuracy
• Very fast, allocation free, not thread safe for maximum
speed (thread safe versions available)
• Created by Gil Tene of Azul Sytems
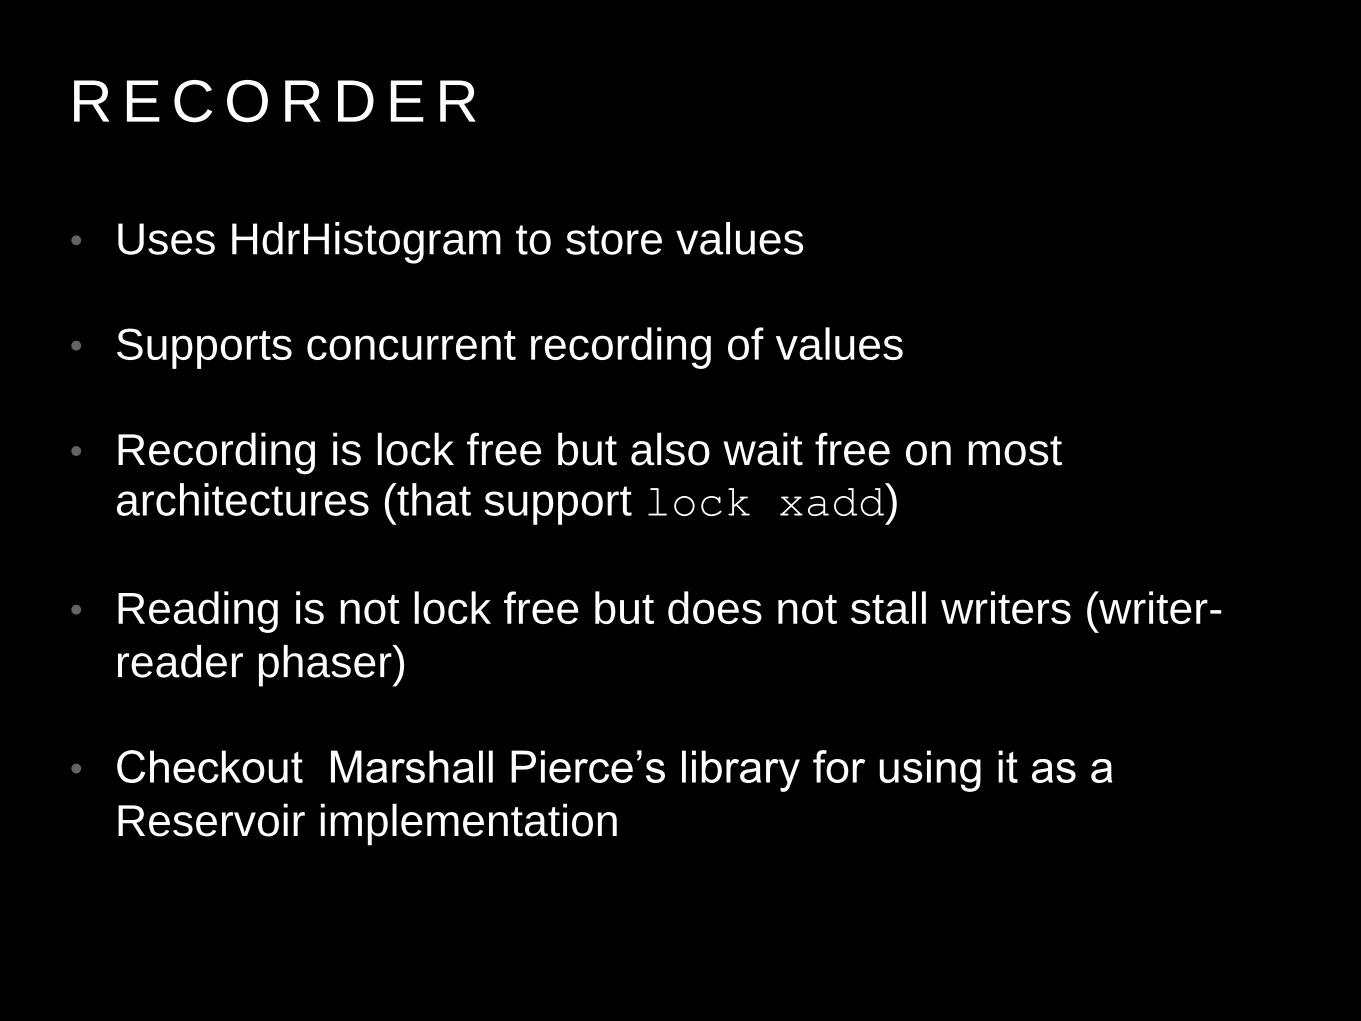
R E C O R D E R
• Uses HdrHistogram to store values
• Supports concurrent recording of values
• Recording is lock free but also wait free on most architectures (that support lock xadd)
• Reading is not lock free but does not stall writers (writer-
reader phaser)
• Checkout Marshall Pierce’s library for using it as a
Reservoir implementation
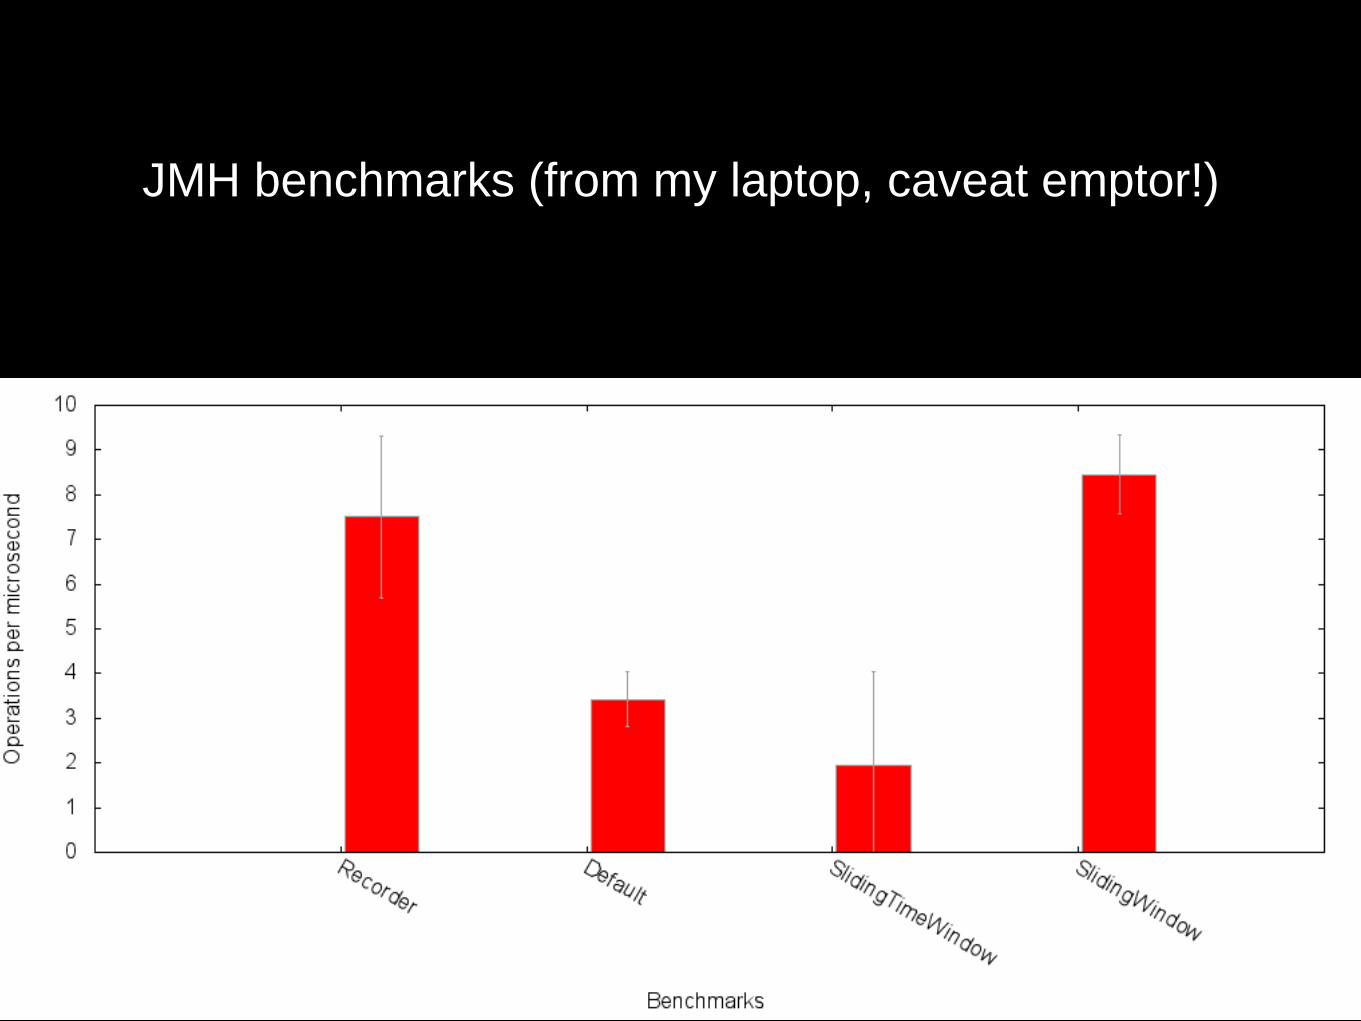
JMH benchmarks (from my laptop, caveat emptor!)
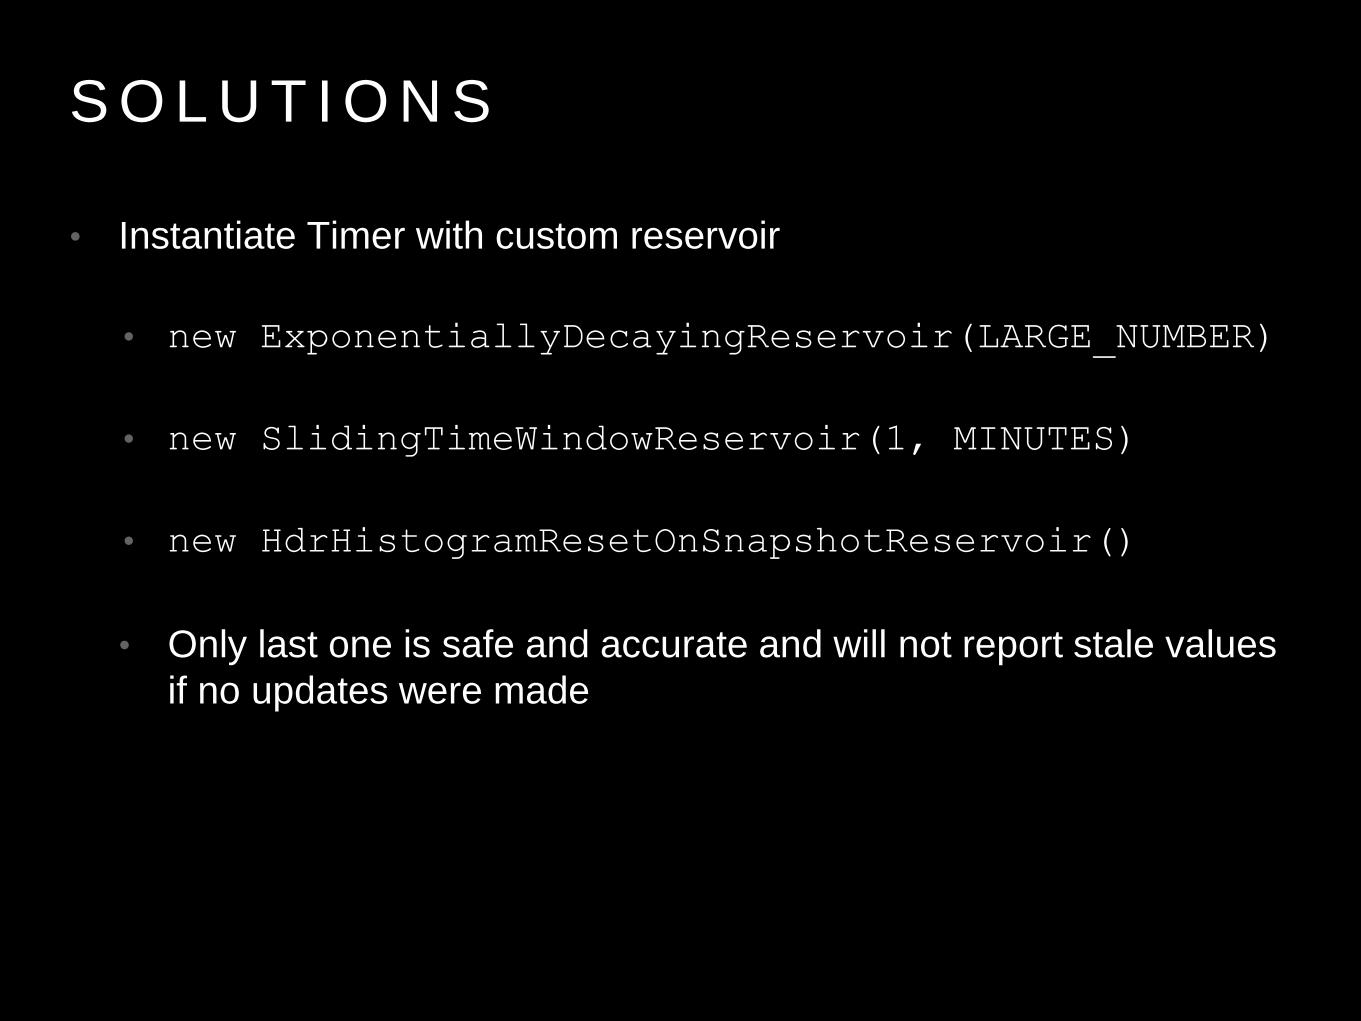
S O L U T I O N S
• Instantiate Timer with custom reservoir
• new ExponentiallyDecayingReservoir(LARGE_NUMBER)
• new SlidingTimeWindowReservoir(1, MINUTES)
• new HdrHistogramResetOnSnapshotReservoir()
• Only last one is safe and accurate and will not report stale values
if no updates were made
S M O K I N G B E N C H M A R K I N G I S T H E
L E A D I N G C A U S E O F S T A T I S T I C S I N
T H E W O R L D
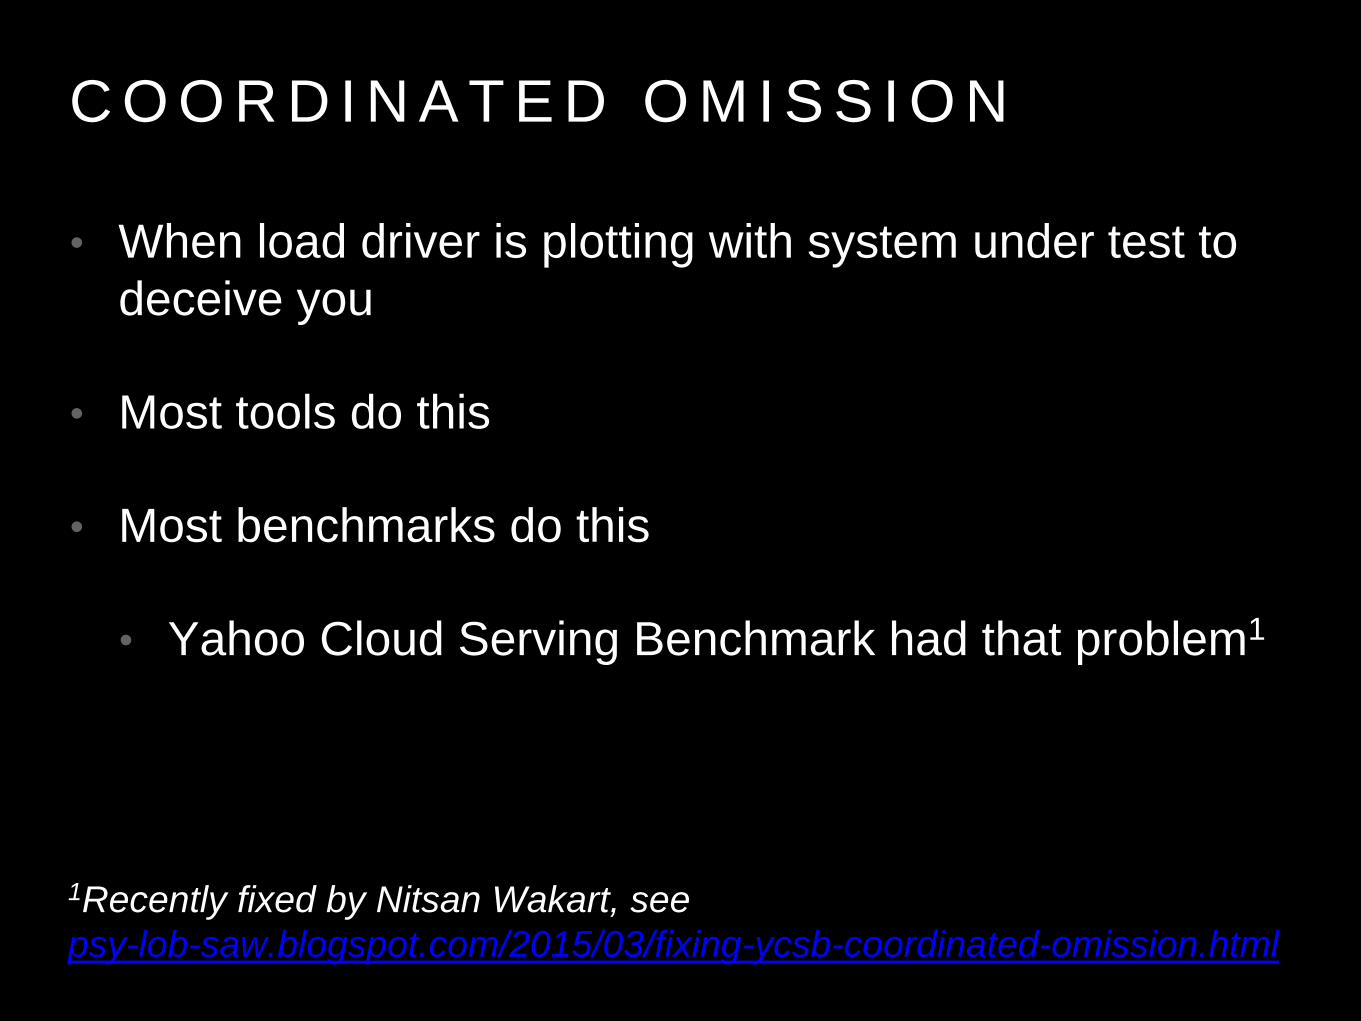
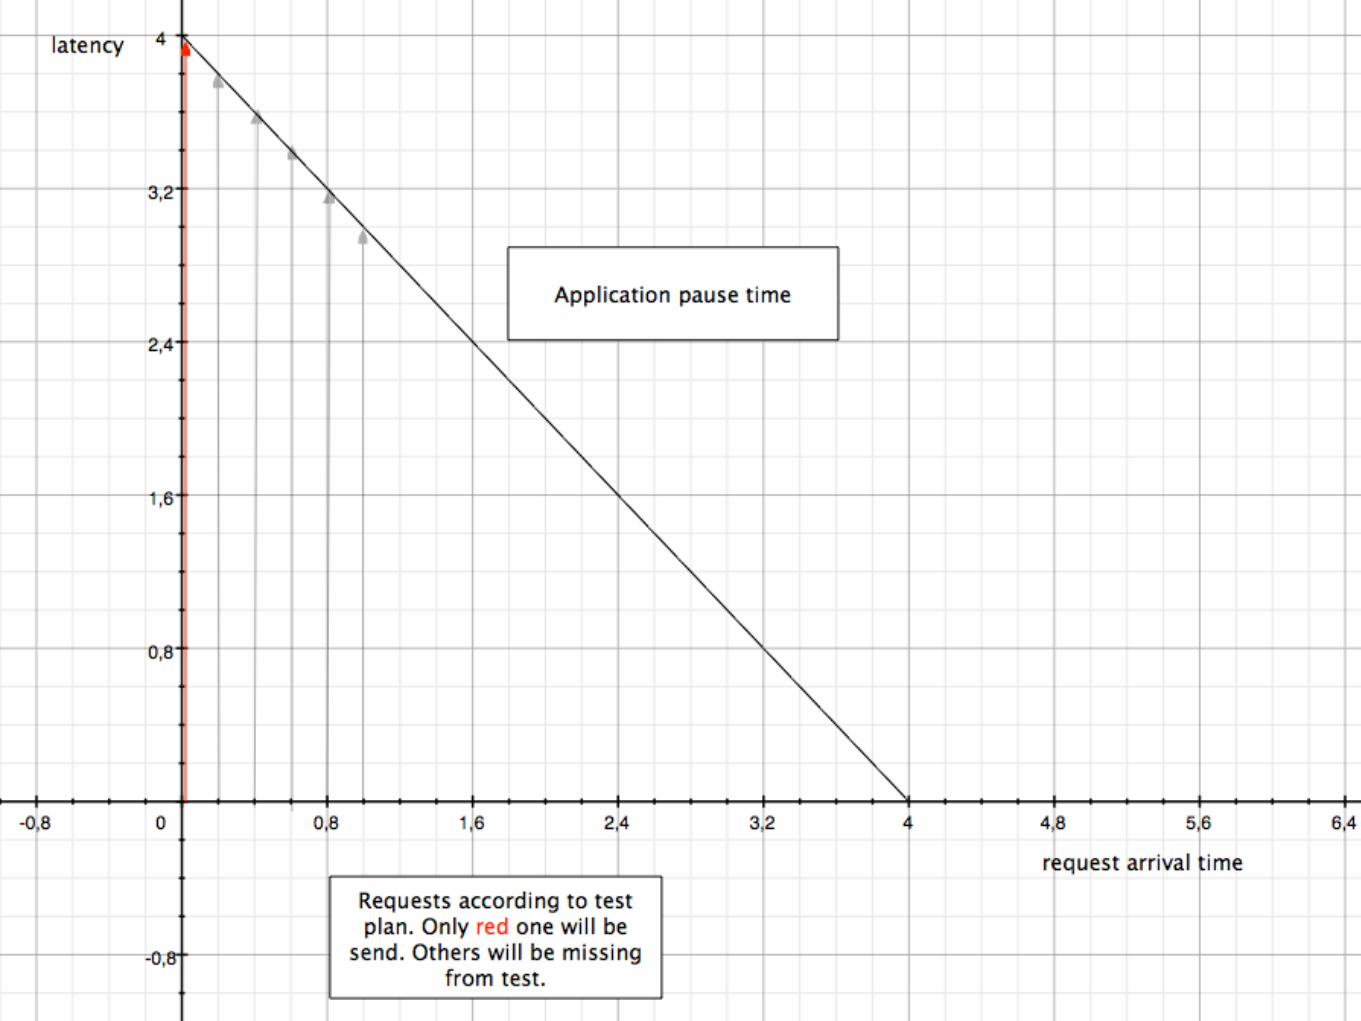
C O O R D I N A T E D O M I S S I O N
• When load driver is plotting with system under test to
deceive you
• Most tools do this
• Most benchmarks do this
• Yahoo Cloud Serving Benchmark had that problem1
1Recently fixed by Nitsan Wakart, see
psy-lob-saw.blogspot.com/2015/03/fixing-ycsb-coordinated-omission.html
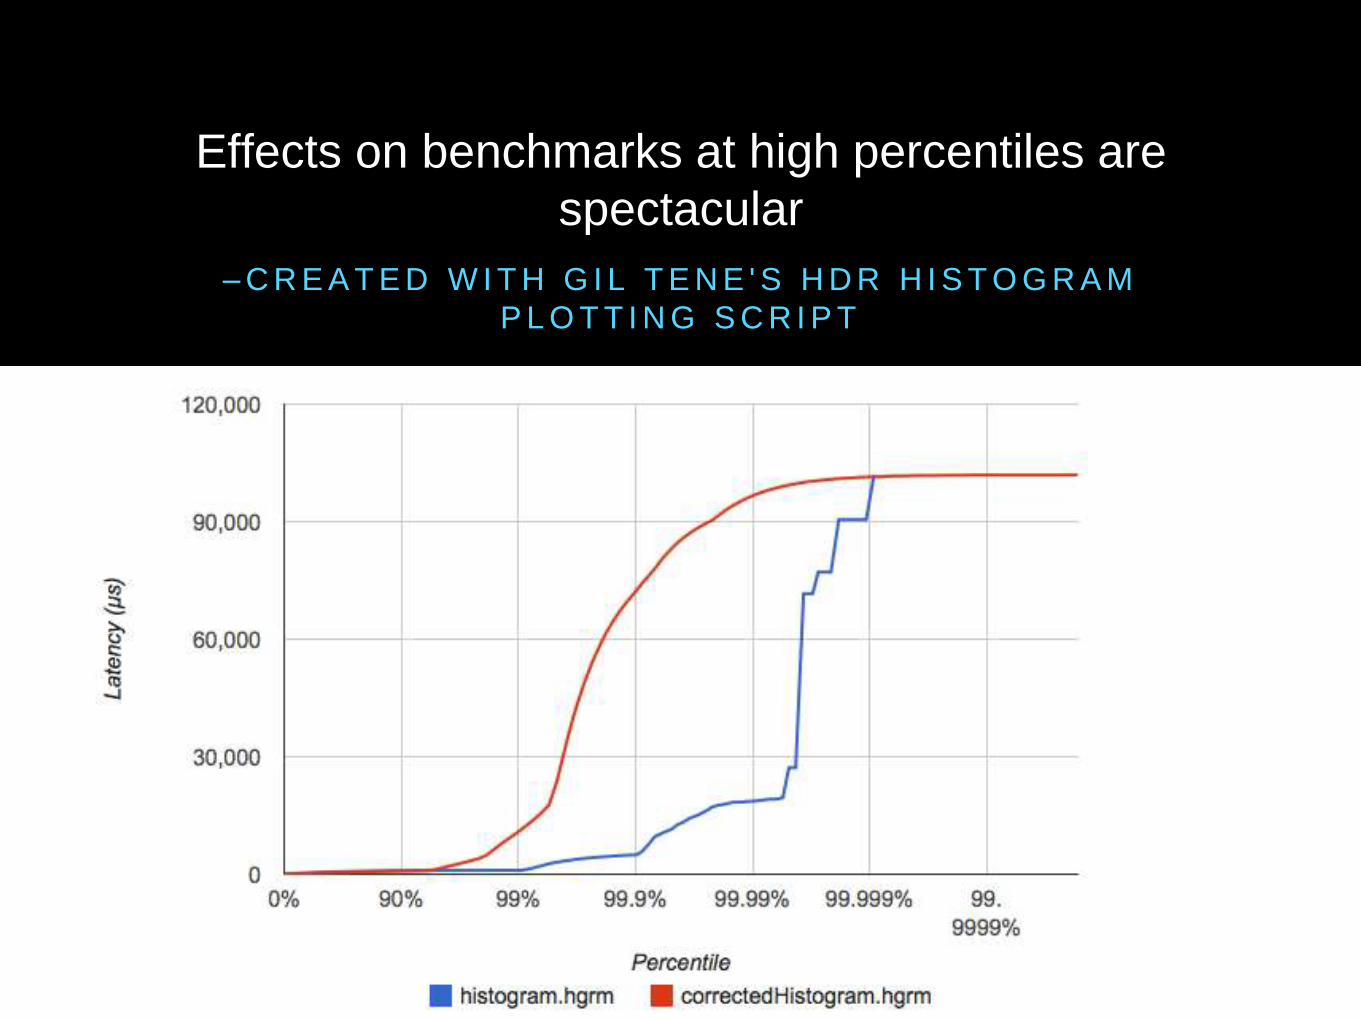
– C R E A T E D W I T H G I L T E N E ' S H D R H I S T O G R A M
P L O T T I N G S C R I P T
Effects on benchmarks at high percentiles are
spectacular
C O O R D I N A T E D O M I S S I O N
S O L U T I O N S
1. Ignore the problem!
perfectly fine for non interactive system where only
throughput matters
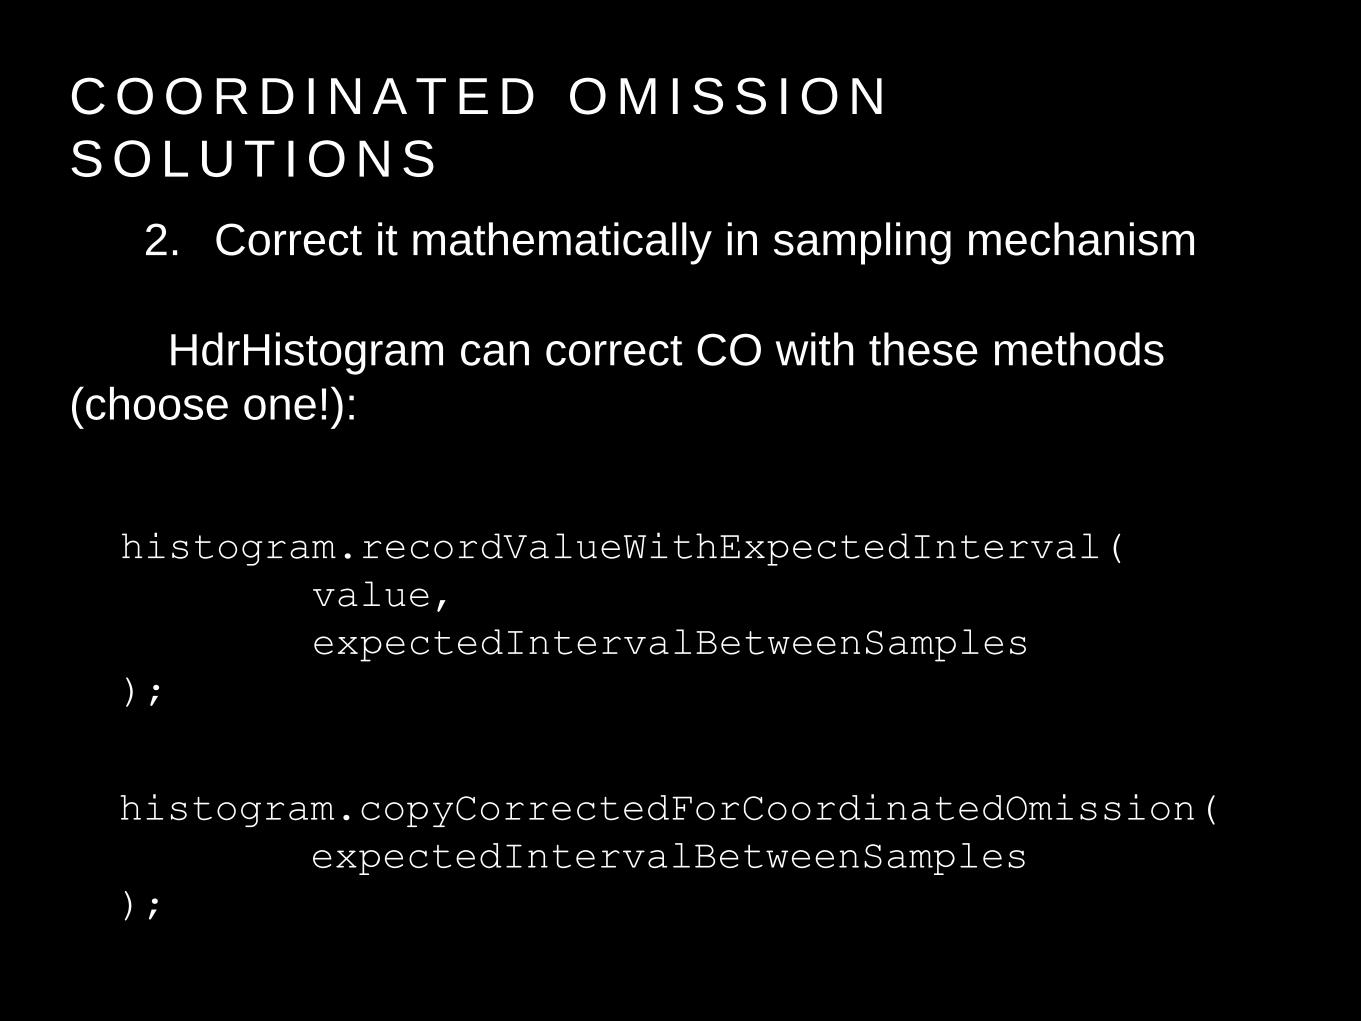
C O O R D I N A T E D O M I S S I O N
S O L U T I O N S
2. Correct it mathematically in sampling mechanism
HdrHistogram can correct CO with these methods
(choose one!):
histogram.recordValueWithExpectedInterval(
value,
expectedIntervalBetweenSamples
);
histogram.copyCorrectedForCoordinatedOmission(
expectedIntervalBetweenSamples
);
C O O R D I N A T E D O M I S S I O N
S O L U T I O N S
3. Correct it on load driver side
by noticing pauses between sent requests.
newly issued request will have timer that starts
counting from time it should have been sent but wasn't
C O O R D I N A T E D
O M I S S I O N
S O L U T I O N S
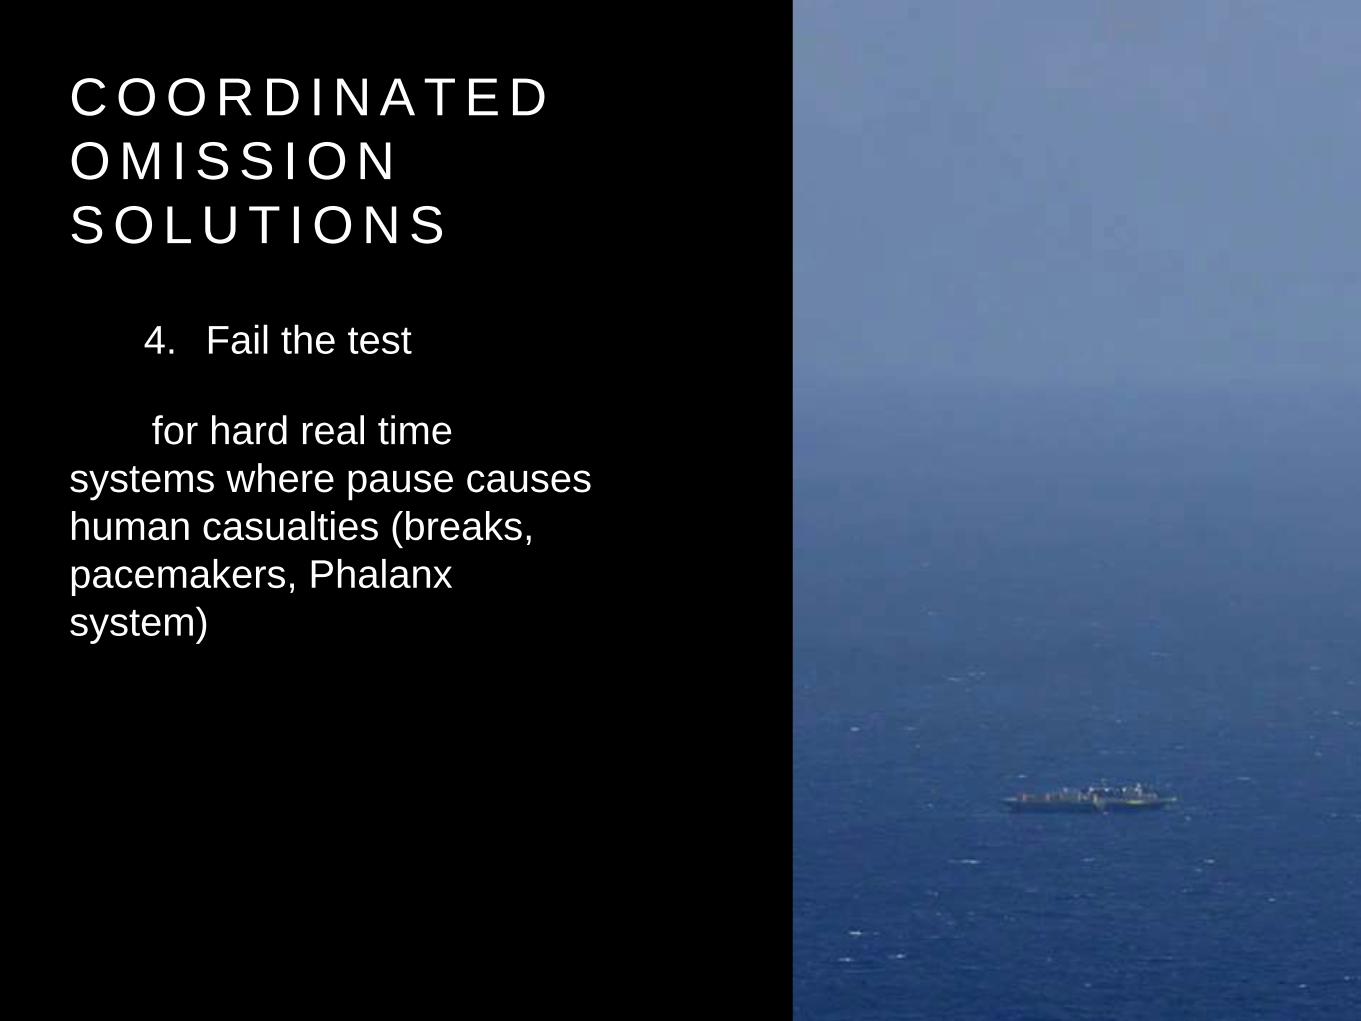
4. Fail the test
for hard real time
systems where pause causes
human casualties (breaks,
pacemakers, Phalanx
system)
C O O R D I N A T E D O M I S S I O N
• Mathematical solutions can overcorrect when load driver
has pauses (e.g. GC).
• Do not account for the fact that server after pause has no
work to do instead of N more requests waiting to be
executed
• In real world it might have never recovered
• Most tools ignore the problem
• Notable exception: Twitter Iago

– L O A D D R I V E R M O T T O
“Do not bend to the tyranny of reality”
S U M M A R Y
• Measure what is meaningful not just what is measurable
• Set SLA before testing and creating dashboards
• Do not trust Timer class, use custom reservoirs, HdrHistogram,
Recorder, never trust EMWA for request rate
• Do not average percentiles unless you need a random number
generator
• Do not plot averages unless you just want to look good on dashboards
• When load testing be aware of coordinated omission
S O U R C E S , T H A N K Y O U S A N D
R E C O M M E N D E D F O L L O W U P S
• Coda Hale for great metrics library
• Gil Tene
• latencytipoftheday.blogspot.de
• www.infoq.com/presentations/latency-pitfalls
• github.com/HdrHistogram/HdrHistogram
• Nitsan Wakart
• psy-lob-saw.blogspot.de/2015/03/fixing-ycsb-coordinated-omission.html
• and whole blog
• Matin Thompson et. al.
• groups.google.com/forum/#!forum/mechanical-sympathy

R E C O M M E N D E D
Great introduction to statistics
and queueing theory.
Performance Modeling and
Design of Computer Systems:
Queueing Theory in Action
Prof. Mor Harchol-Balter