


Języki
Strony
Prawny

8/7/2019 UML-STATE CHART DIAGRAM
http://slidepdf.com/reader/full/uml-state-chart-diagram 1/16
UML-STATE CHARTDIAGRAM.BY: Urvashi Koul.
81307107148CSE(6th).

8/7/2019 UML-STATE CHART DIAGRAM
http://slidepdf.com/reader/full/uml-state-chart-diagram 2/16
UML OVERVIEWUnified Modelling Language(UML) is a standard language forspecifying, visualizing, constructing, and documenting the artifactsof systems.It was created by Object Management Group (OMG) and UML 1.0specification draft was proposed to the OMG in January 1997.UML diagrams are not only made for developers but also forbusiness users, common people and anybody interested tounderstand the system. The system can be a software or nonsoftware. So it must be clear that UML is not a development methodrather it accompanies with processes to make a successful system.
It can be used to document object-oriented analysis and designresults obtained using any methodology.In conclusion, UML can be defined as a simple modeling mechanismto model all possible practical systems in today s complexenvironment.
8/7/2019 UML-STATE CHART DIAGRAM
http://slidepdf.com/reader/full/uml-state-chart-diagram 3/16
Why Construct A Model?Manages the complexity in a problem.
Facilitates arriving at good solution.
Reduces design costs.
It becomes easier in visualization and understanding of animplementation.
Helps to understand the entities in the real world and howthey interact with each other.
8/7/2019 UML-STATE CHART DIAGRAM
http://slidepdf.com/reader/full/uml-state-chart-diagram 4/16
UML DIAGRAMS
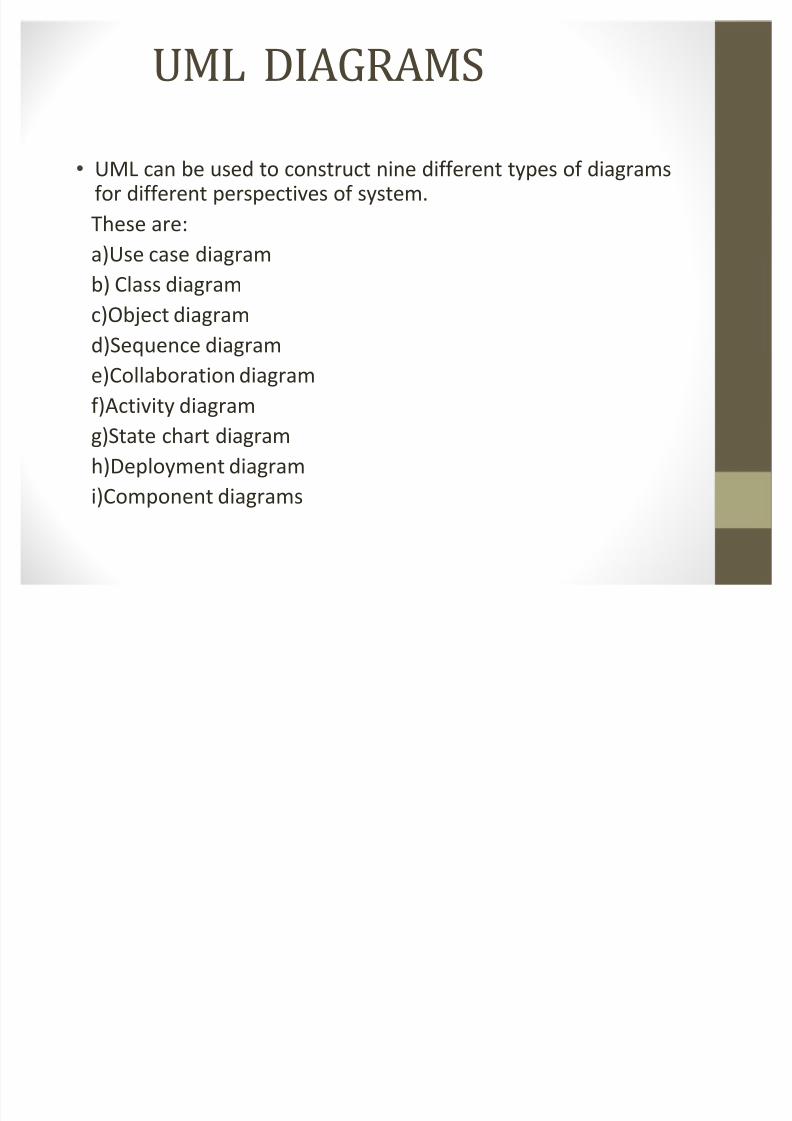
UML can be used to construct nine different types of diagramsfor different perspectives of system.These are:a)Use case diagramb) Class diagramc)Object diagramd)Sequence diagrame)Collaboration diagram
f)Activity diagramg)State chart diagramh)Deployment diagrami)Component diagrams
8/7/2019 UML-STATE CHART DIAGRAM
http://slidepdf.com/reader/full/uml-state-chart-diagram 5/16
UML STATE CHART DIAGRAM
(STD)Shows the sequences of states that objects of a class go throughduring its life cycle in response to external events and also theresponses and actions in reaction to an event.
These are good at describing how the behavior of an object changesacross several executions.
A State chart diagram describes a state machine.
8/7/2019 UML-STATE CHART DIAGRAM
http://slidepdf.com/reader/full/uml-state-chart-diagram 6/16
P URP OSES OF USING STD SState chart diagram is one of the five UML diagrams used tomodel dynamic nature of a system.
To describe different states of an object during its life time.
Define a state machine to model states of an object.
To model life time of a reactive system.
8/7/2019 UML-STATE CHART DIAGRAM
http://slidepdf.com/reader/full/uml-state-chart-diagram 7/16
MODEL ELEMENTS OF STDInitial state- the state of an object being modeled initially.
Intermediate state - is the condition of an object at a moment intime.
Event- is a significant or noteworthy occurrence, the time betweenevents.
Transition- is a relationship between two states that indicates thatwhen an event occurs, the object moves from the prior state to thesubsequent state.
Final state: The last state that is reached after occurrence of allpossible events.
8/7/2019 UML-STATE CHART DIAGRAM
http://slidepdf.com/reader/full/uml-state-chart-diagram 8/16
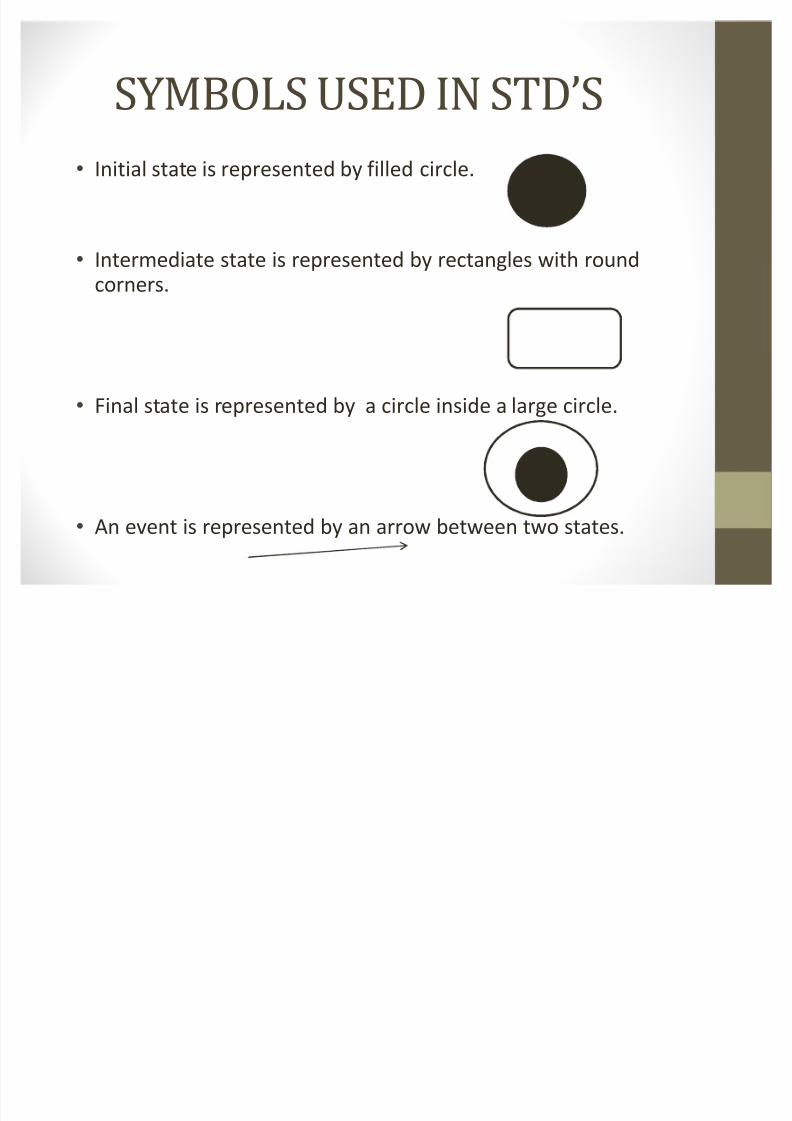
SYMBOLS USED IN STD SInitial state is represented by filled circle.
Intermediate state is represented by rectangles with roundcorners.
Final state is represented by a circle inside a large circle.
An event is represented by an arrow between two states.
8/7/2019 UML-STATE CHART DIAGRAM
http://slidepdf.com/reader/full/uml-state-chart-diagram 9/16
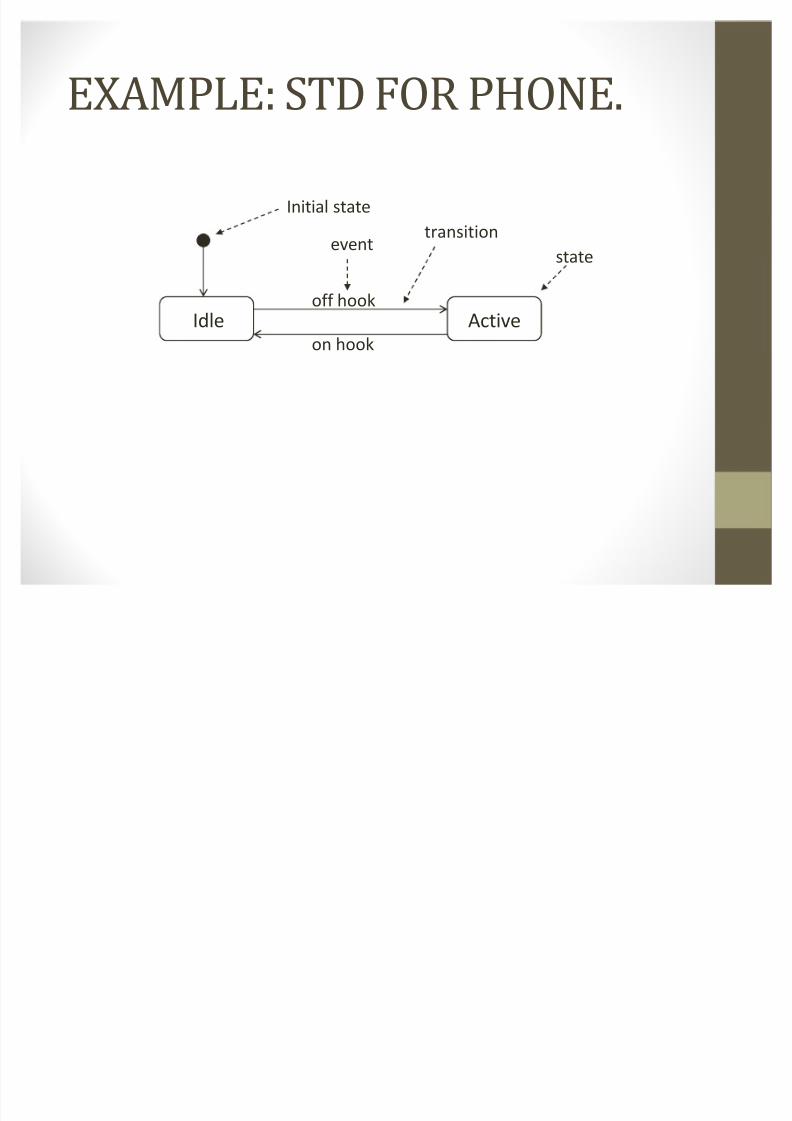
EXAMP LE: STD FOR P HONE.
Idle
Initial state
Activeoff hook
on hook
transitionevent
state
8/7/2019 UML-STATE CHART DIAGRAM
http://slidepdf.com/reader/full/uml-state-chart-diagram 10/16
TYP ES OF STD SState chart diagrams can represent two types of situations:
a) CONTINUOUS LOOPS:graph is a loopno definite start statenot concerned about how the loop starts
b) ONE-SHOT LIFE CYCLES:represents objects with finite livesinitial state entered on creation of objectentering final state destroys objectinitial state shown using solid circlefinal state(s) shown using bull s eye
8/7/2019 UML-STATE CHART DIAGRAM
http://slidepdf.com/reader/full/uml-state-chart-diagram 11/16
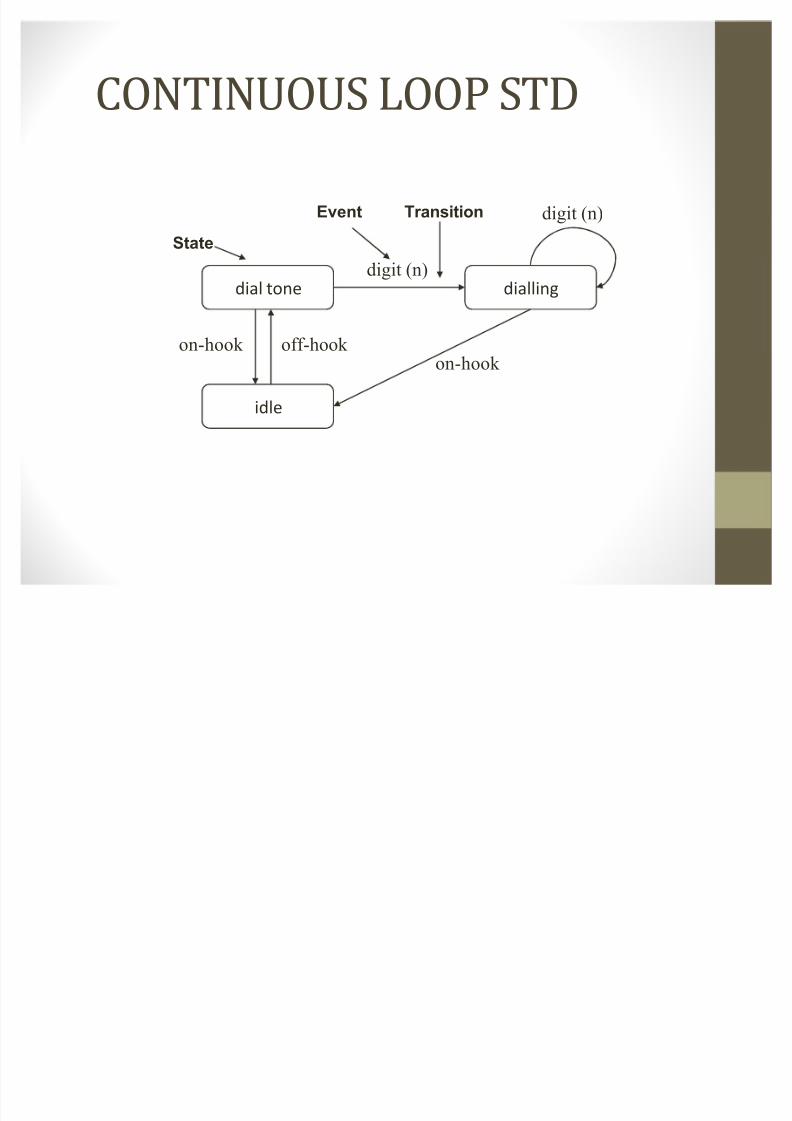
CONTINUOUS LOOP STD
dial tone
idle
diallingdigit (n)
on-hook on-hook
digit (n)State
TransitionEvent
off-hook
8/7/2019 UML-STATE CHART DIAGRAM
http://slidepdf.com/reader/full/uml-state-chart-diagram 12/16
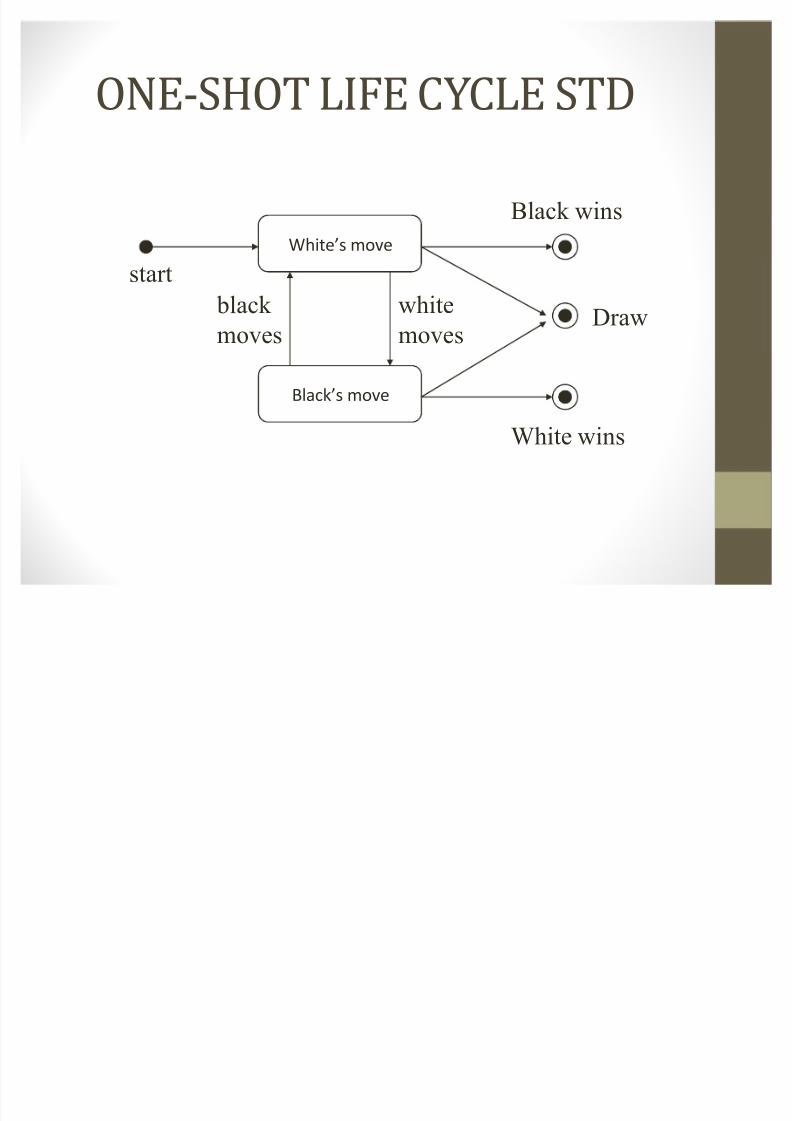
ONE-SHOT LIFE CYCLE STD
W hite s move
Black s move
s tartwhitemove s
bl ack move s
Bl ack win s
D raw
White win s
8/7/2019 UML-STATE CHART DIAGRAM
http://slidepdf.com/reader/full/uml-state-chart-diagram 13/16
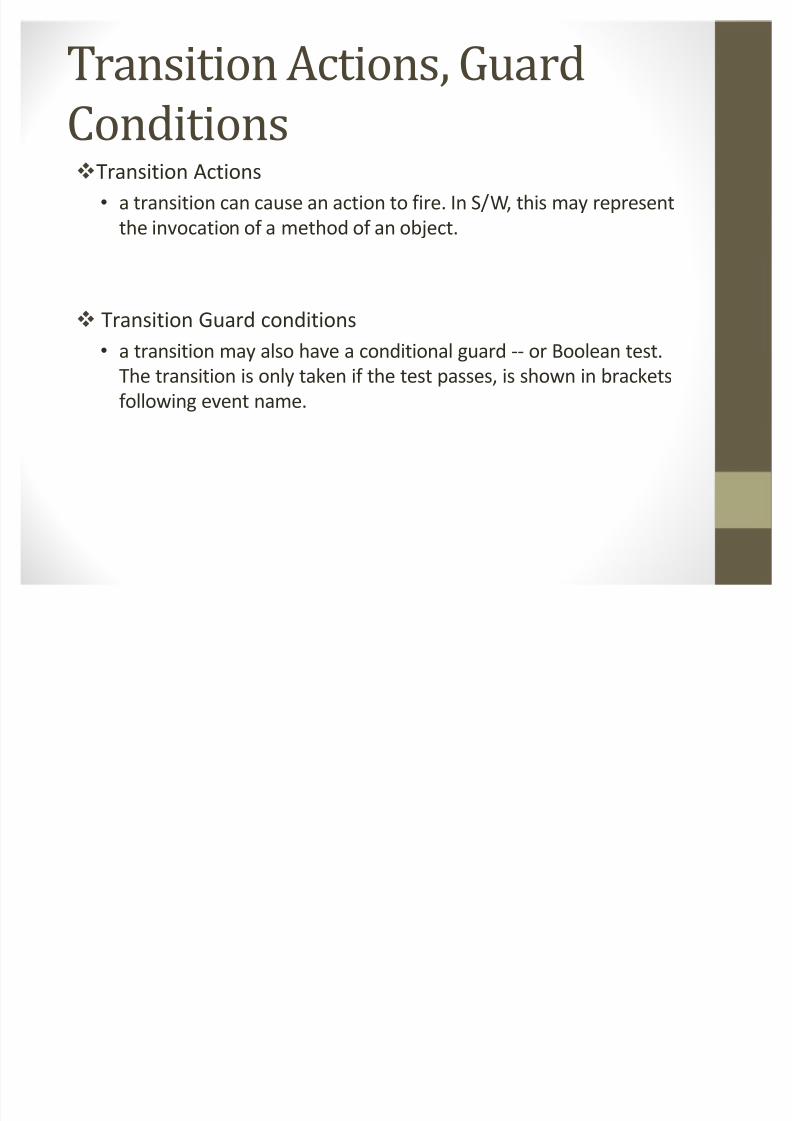
Transition Actions, Guard
ConditionsTransition Actionsa transition can cause an action to fire. In S/ W , this may representthe invocation of a method of an object.
Transition Guard conditionsa transition may also have a conditional guard -- or Boolean test.The transition is only taken if the test passes, is shown in bracketsfollowing event name.
8/7/2019 UML-STATE CHART DIAGRAM
http://slidepdf.com/reader/full/uml-state-chart-diagram 14/16
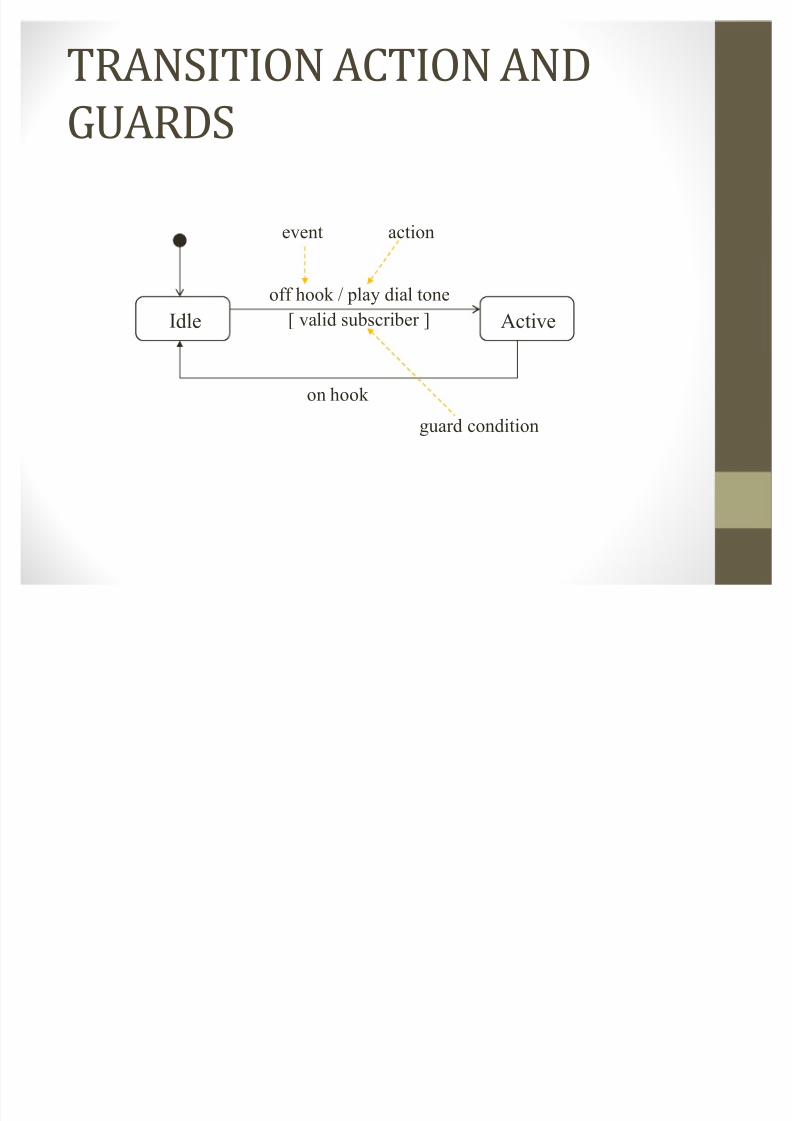
TRANSITION ACTION AND
GUARDS
I dle Activeoff hook / p lay dia l tone
on hook
event
[ va l id subs crib er ]
action
gu ard condition
8/7/2019 UML-STATE CHART DIAGRAM
http://slidepdf.com/reader/full/uml-state-chart-diagram 15/16
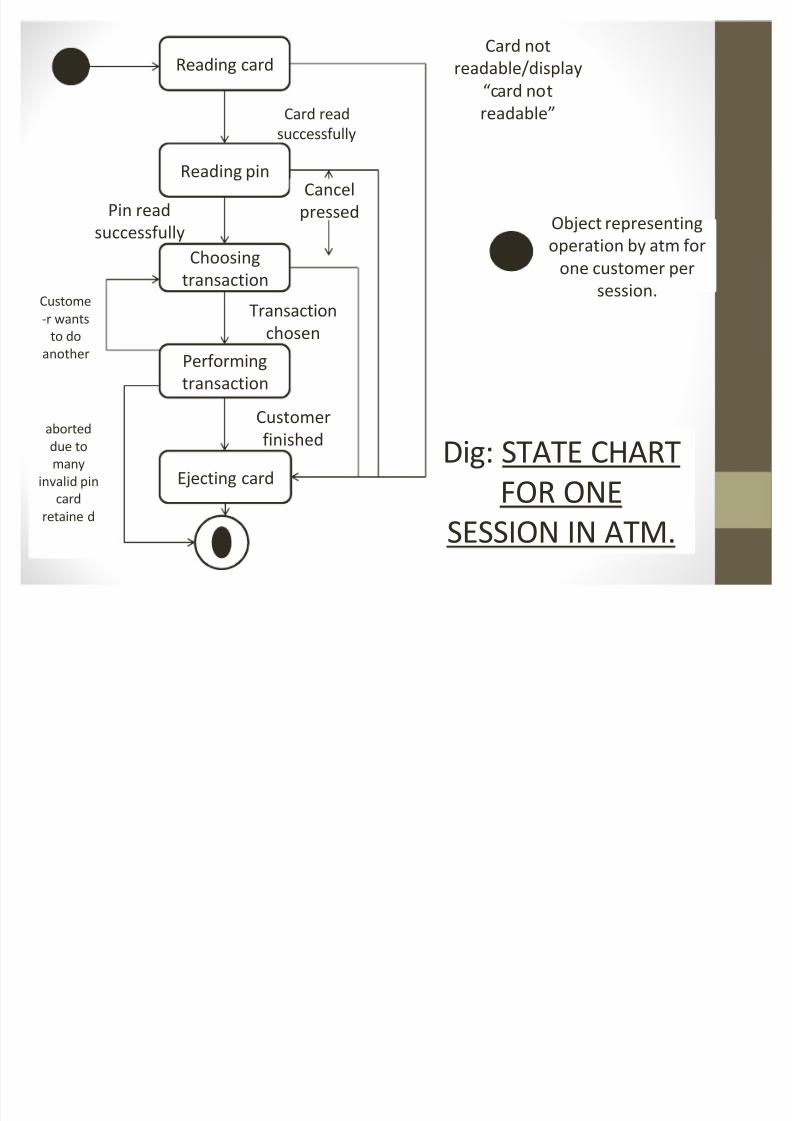
Reading card
Reading pin
Choosing
transaction
Performingtransaction
Ejecting card
Card notreadable/display
card notreadableCard read
successfully
Pin readsuccessfully
Cancelpressed
Transactionchosen
Customerfinished
aborteddue tomany
invalid pincard
retaine d
Custome-r wants
to doanother
Object representingoperation by atm for
one customer persession.
Dig: STATE CHARTFOR ONE
SESSION IN ATM.

8/7/2019 UML-STATE CHART DIAGRAM
http://slidepdf.com/reader/full/uml-state-chart-diagram 16/16
THE END
Top Related