Zarządzanie finansami firm – teoria i praktyka PAPERS of Wrocław ... The use of data envelopment...
18
Zarządzanie finansami firm – teoria i praktyka Tom 1 PRACE NAUKOWE Uniwersytetu Ekonomicznego we Wrocławiu RESEARCH PAPERS of Wrocław University of Economics 271 Redaktorzy naukowi Adam Kopiński, Tomasz Słoński, Bożena Ryszawska Wydawnictwo Uniwersytetu Ekonomicznego we Wrocławiu Wrocław 2012
Transcript of Zarządzanie finansami firm – teoria i praktyka PAPERS of Wrocław ... The use of data envelopment...
Zarządzanie finansami firm – teoria i praktykaTom 1
PRACE NAUKOWE Uniwersytetu Ekonomicznego we WrocławiuRESEARCH PAPERS of Wrocław University of Economics
271
Redaktorzy naukowi
Adam Kopiński, Tomasz Słoński, Bożena Ryszawska
Wydawnictwo Uniwersytetu Ekonomicznego we WrocławiuWrocław 2012
Redaktorzy Wydawnictwa: Elżbieta Kożuchowska, Aleksandra Śliwka
Redaktor techniczny: Barbara Łopusiewicz
Korektor: Justyna Mroczkowska
Łamanie: Adam Dębski
Projekt okładki: Beata Dębska
Publikacja jest dostępna w Internecie na stronach: www.ibuk.pl, www.ebscohost.com, The Central and Eastern European Online Library www.ceeol.com, a także w adnotowanej bibliografii zagadnień ekonomicznych BazEkon http://kangur.uek.krakow.pl/bazy_ae/bazekon/nowy/index.php
Informacje o naborze artykułów i zasadach recenzowania znajdują się na stronie internetowej Wydawnictwa www.wydawnictwo.ue.wroc.pl
Kopiowanie i powielanie w jakiejkolwiek formie wymaga pisemnej zgody Wydawcy
© Copyright by Uniwersytet Ekonomiczny we Wrocławiu Wrocław 2012
ISSN 1899-3192 ISBN 978-83-7695-219-2 (całość)ISBN 978-83-7695-223-9 t. 1
Wersja pierwotna: publikacja drukowana
Druk: Drukarnia TOTEM
Spis treści
Wstęp ................................................................................................................ 11
Abdul Nafea Al Zararee, Abdulrahman Al-Azzawi: The impact of free cash flow on market value of firm.............................................................. 13
Tomasz Berent, Sebastian Jasinowski: Financial leverage puzzle – prelimi-nary conclusions from literature review ..................................................... 22
Michał Buszko: Zarządzanie ryzykiem konwersji kapitału nieruchomości (equity release) ........................................................................................... 40
Magdalena Bywalec: Jakość portfela kredytów mieszkaniowych w Polsce w latach 2007-2011 ......................................................................................... 49
Jolanta Ciak: Model of public debt management institutions in Poland and the models functioning within the European Union ................................. 59
Leszek Czapiewski, Jarosław Kubiak: Syntetyczny miernik poziomu asy-metrii informacji (SMAI) .......................................................................... 68
Anna Doś: Low-carbon technologies investment decisions under uncertainty created by the carbon market ...................................................................... 79
Justyna Dyduch: Ocena efektywności kosztowej inwestycji proekologicz-nych ............................................................................................................. 88
Ewa Dziawgo: Analiza własności opcji floored .............................................. 100Ryta Dziemianowicz: Kryzys gospodarczy a polityka podatkowa w krajach
UE ............................................................................................................... 113Józefa Famielec: Finansowanie zreformowanej gospodarki odpadami komu-
nalnymi ...................................................................................................... 123Anna Feruś: The use of data envelopment analysis method for the estimation
of companies’ credit risk ............................................................................ 133Joanna Fila: Europejski instrument mikrofinansowy Progress wsparciem
w obszarze mikrofinansów ......................................................................... 144Sławomir Franek: Ocena wiarygodności prognoz makroekonomicznych –
doświadczenia paktu stabilności i wzrostu a wieloletnie planowanie bud- żetowe ......................................................................................................... 152
Paweł Galiński: Produkty i usługi bankowe dla jednostek samorządu teryto-rialnego w Polsce ........................................................................................ 162
Alina Gorczyńska, Izabela Jonek-Kowalska: Kwity depozytowe jako źród- ło finansowania podmiotów gospodarczych w warunkach globalizacji rynków finansowych .................................................................................. 172
Jerzy Grabowiecki: Financial structure and organization of keiretsu − Japa-nese business groups ................................................................................... 181
6 Spis treści
Sylwia Grenda: Ryzyko cen transferowych w działalności przedsiębiorstw powiązanych .............................................................................................. 191
Maria Magdalena Grzelak: Ocena związków pomiędzy nakładami na dzia-łalność innowacyjną a konkurencyjnością przedsiębiorstw przemysłu spożywczego w Polsce ................................................................................ 202
Agnieszka Jachowicz: Finanse publiczne w Polsce w świetle paktu stabilności 214Agnieszka Janeta: Rynkowe wskaźniki oceny stanu finansów publicznych
na przykładzie wybranych krajów strefy euro ........................................... 226Agnieszka Janeta: Obligacje komunalne jako instrument finansowania roz-
woju lokalnego i regionalnego .................................................................... 236Bogna Janik: Efficiency of investment strategy of Socially Responsible
Funds Calvert .............................................................................................. 247Anna Jarzęmbska: Obszary zarządzania płynnością finansową w publicz-
nej szkole wyższej ...................................................................................... 256Tomasz Jewartowski, Michał Kałdoński: Struktura kapitału i dywersyfika-
cja działalności spółek rodzinnych notowanych na GPW .......................... 265Marta Kacprzyk, Rafał Wolski, Monika Bolek: Analiza wpływu wskaźni-
ków płynności i rentowności na kształtowanie się ekonomicznej wartości dodanej na przykładzie spółek notowanych na GPW w Warszawie .......... 279
Arkadiusz Kijek: Modelowanie ryzyka sektorowego przy zastosowaniu me-tody harmonicznej ...................................................................................... 289
Anna Kobiałka: Analiza dochodów gmin województwa lubelskiego w latach 2004-2009 ................................................................................................... 302
Anna Korombel: Zarządzanie ryzykiem w praktyce polskich przedsię-biorstw ........................................................................................................ 313
Anna Korzeniowska, Wojciech Misterek: Znaczenie instytucji otoczenia biznesu we wdrażaniu innowacji MŚP ....................................................... 322
Magdalena Kowalczyk: Wykorzystanie narzędzi rachunkowości zarządczej w sektorze finansów publicznych ............................................................... 334
Mirosław Kowalewski, Dominika Siemianowska: Zarządzanie kosztami za pomocą zarządzania przez cele na przykładzie zakładu przetwórstwa mięsnego X ................................................................................................. 343
Paweł Kowalik, Błażej Prus: Analiza wyznaczania kwoty na wyrównanie dochodów w krajowych niemieckich systemach wyrównania finansowe-go na przykładzie 2011 roku ....................................................................... 353
Sylwester Kozak, Olga Teplova: Covered bonds and RMBS as secured fun-ding instruments for the real estate market in the EU ................................ 367
Małgorzata Kożuch: Preferencje podatkowe jako narzędzia subsydiowania przedsięwzięć ochrony środowiska ............................................................ 378
Marzena Krawczyk: Gotowość inwestycyjna determinantą pozyskiwania kapitału od aniołów biznesu ....................................................................... 388
Spis treści 7
Marzena Krawczyk: Teoria hierarchii źródeł finansowania w praktyce in-nowacyjnych MŚP w Polsce ....................................................................... 397
Jarosław Kubiak: Planowanie należności na podstawie cyklu ich rotacji określanego według zasady lifo oraz według wartości średniej ................ 407
Iwa Kuchciak: Crowdsourcing w kreowaniu wartości przedsiębiorstwa ....... 418Marcin Kuzel: Chińskie inwestycje bezpośrednie na świecie
– skala, kierunki i motywy ekspansji zagranicznej ................................... 427Katarzyna Lewkowicz-Grzegorczyk: Progresja podatkowa a redystrybucja
dochodów .................................................................................................... 439Katarzyna Lisińska: Struktura kapitałowa przedsiębiorstw produkcyjnych
w Polsce, Niemczech i Portugalii ............................................................... 449Joanna Lizińska: Problem doboru portfela porównawczego w długookreso-
wej ewaluacji efektów kolejnych emisji akcji ............................................ 459Bogdan Ludwiczak: Wykorzystanie metody VaR w procesie pomiaru ryzy-
ka................................................................................................................. 468Justyna Łukomska-Szarek: Ocena zadłużenia jednostek samorządu teryto-
rialnego w Polsce w latach 2004-2010 ........................................................ 480Agnieszka Majewska: Wykorzystanie opcji quanto w zarządzaniu ryzykiem
pogodowym w przedsiębiorstwach sektora energetycznego ...................... 490Monika Marcinkowska: Rachunkowość społeczna – czyli o pomiarze wyni-
ków przedsiębiorstw w kontekście oczekiwań interesariuszy .................. 502
Summaries
Abdul Nafea Al Zararee: Wpływ wolnych przepływów pieniężnych na wartość rynkową firmy .............................................................................. 21
Tomasz Berent, Sebastian Jasinowski: Dźwignia finansowa – wstępne wnioski z przeglądu literatury .................................................................... 39
Michał Buszko: Risk management of real estate equity release ..................... 48Magdalena Bywalec: The quality of the portfolio of housing loans in Poland
in 2007-2011 ................................................................................................ 58Jolanta Ciak: Model instytucji zarządzania długiem publicznym w Polsce na
tle modeli funkcjonujących w Unii Europejskiej ...................................... 67Leszek Czapiewski, Jarosław Kubiak: Synthetic measure of the degree of
information asymmetry .............................................................................. 78Anna Doś: Decyzje o inwestycjach w technologie obniżające emisję CO2
w warunkach niepewności stwarzanej przez europejski system handlu emisjami ...................................................................................................... 87
Justyna Dyduch: Assessment of cost effectiveness of proecological investments ................................................................................................. 99
Ewa Dziawgo: The analysis of the properties of floored options .................... 112
8 Spis treści
Ryta Dziemianowicz: Economic crisis and tax policy in the EU countries ... 123Józefa Famielec: Financing of reformed economy of municipal waste .......... 132Anna Feruś: Wykorzystanie metody granicznej analizy danych do oceny
ryzyka kredytowego przedsiębiorstw ......................................................... 143Joanna Fila: The European Progress Microfinance Facility as an example of
the support in microfinance ........................................................................ 151Sławomir Franek: Credibility of macroeconomic forecasts – experiences of
stability and growth pact and multi-year budgeting planning ................... 161Paweł Galiński: Banking products and services for local governments in
Poland ......................................................................................................... 171Alina Gorczyńska, Izabela Jonek-Kowalska: Depositary receipts as a
source of businesses entities financing in the conditions of globalization of financial markets .................................................................................... 180
Jerzy Grabowiecki: Struktura finansowa i organizacja japońskich grup kapitałowych keiretsu ................................................................................ 190
Sylwia Grenda: Transfer pricing risk in the activity of related companies .... 201Maria Magdalena Grzelak: Assessment of relationship between outlays on
innovation and competitiveness of food industry enterprises in Poland .... 213Agnieszka Jachowicz: Public finance in Poland in the perspective of the
Stability and Growth Pact .......................................................................... 225Agnieszka Janeta: Market indicators assessing the state of public finances:
the case of selected euro zone countries .................................................... 235Agnieszka Janeta: Municipal bonds as a financing instrument for local and
regional development .................................................................................. 246Bogna Janik: Efektywność strategii inwestycyjnych funduszy społecznie
odpowiedzialnych Calvert .......................................................................... 255Anna Jarzęmbska: Areas of liquidity management in public university ....... 264Tomasz Jewartowski, Michał Kałdoński: Capital structure and
diversification of family firms listed on the Warsaw Stock Exchange ...... 278Marta Kacprzyk, Rafał Wolski, Monika Bolek: Liquidity and profitability
ratios influence on economic value added basing on companies listed on the Warsaw Stock Exchange ....................................................................... 288
Arkadiusz Kijek: Sector risk modelling by harmonic method ...................... 301Anna Kobiałka: Analysis of revenue of Lublin Voivodeship communes in
2004-2009 ................................................................................................... 312Anna Korombel: Risk management in practice of Polish companies............. 321Anna Korzeniowska, Wojciech Misterek: The role of business environment
institutions in implementing SMEs’ innovations ....................................... 333Magdalena Kowalczyk: Using tools of managerial accounting in public
finance sector ............................................................................................. 342
Spis treści 9
Mirosław Kowalewski, Dominika Siemianowska: Cost management conducted with the utilization of Management by Objectives on an example of meat processing plant ............................................................... 352
Paweł Kowalik, Błażej Prus: The analysis of determining the amount of the financial equalization in German’s national financial equalization systems on the example of 2011 ............................................................................... 366
Sylwester Kozak, Olga Teplova: Listy zastawne i RMBS jako bezpieczne instrumenty finansujące rynek nieruchomości w UE ................................ 377
Małgorzata Kożuch: Tax preferences as the instrument of subsidizing of ecological investments ................................................................................ 387
Marzena Krawczyk: Investment readiness as a determinant for raising capital from business angels ....................................................................... 396
Marzena Krawczyk: Theory of financing hierarchy in the practice of innovative SMEs in Poland ......................................................................... 406
Jarosław Kubiak: The receivables level planning on the basis of cycle of rotation determined by the LIFO principles and by average value ............ 417
Iwa Kuchciak: Crowdsourcing in the creation of bank company value ......... 426Marcin Kuzel: Chinese foreign direct investment in the world – scale,
directions and determinants of international expansion ............................ 438Katarzyna Lewkowicz-Grzegorczyk: Tax progression vs. income
redistribution ............................................................................................... 448Katarzyna Lisińska: Capital structure of manufacturing companies in
Poland, Germany and Portugal ................................................................... 458Joanna Lizińska: The long-run abnormal stock returns after seasoned equity
offerings and the choice of the reference portfolio ..................................... 467Bogdan Ludwiczak: The VAR approach in the risk measurement ................ 479Justyna Łukomska-Szarek: Assessment of debt of local self-government
units in Poland in the years 2004-2010 ....................................................... 489Agnieszka Majewska: Weather risk management by using quanto options
in enterprises of the energy sector .............................................................. 501Monika Marcinkowska: “Social accounting” – or how to measure companies’
performance in the context of stakeholders’ expectations ......................... 525
PRACE NAUKOWE UNIWERSYTETU EKONOMICZNEGO WE WROCŁAWIU RESEARCH PAPERS OF WROCŁAW UNIVERSITY OF ECONOMICS nr 271 ● 2012
Zarządzanie finansami firm – teoria i praktyka ISSN 1899-3192
Anna FeruśRzeszów University of Technology
THE USE OF DATA ENVELOPMENT ANALYSIS METHOD FOR THE ESTIMATION OF COMPANIES’ CREDIT RISK*
Summary: The subject matter of the present article is suggesting new proceedings of credit risk forecast in Polish economic conditions. What favours the suggessted approach is the fact that in Poland, unlike in western countries, DEA method has not yet been implemented in order to assess credit risk that companies face. The research described in the article has been conducted on the basis of comparison of suggested DEA method with currently used procedures, namely point method, discriminative analysis and linear regression. Considering the research, it can be concluded that DEA method facilitates forecasting financial problems, including bankruptcy of companies in Polish economic conditions, and its effectiveness is comparable or even greater than approaches implemented so far.
Keywords: credit-scoring, credit risk, credit rating, Data Envelopment Analysis, technical effectiveness.
1. Introduction
Credit risk is inextricably linked with every bank’s activity. It is one of the basic ty-pes of credit risk. It is understood mainly as the risk of default by a borrower with remaining interest rates and commissions. Competent credit risk management plays the major role in the process of bank administration. All operations undertaken by a bank, especially those involving loans, are meant to reduce that risk. Using credit-scoring methods is believed to be one of the most accurate solutions, facilitating the process of credit risk management. It is worth mentioning that the procedure of cre-dit-scoring has become more significant since Basel Committee on Banking Super-vision published guidelines of New Basel Capital Accord, according to which credit-scoring is one of possible tools of assessing credit risk within internal ratings [Iwanicz-Drozdowska 2005, p. 130,150]. The procedure of using DEA model me-thod for credit-scoring suggested in the article may prove an effective tool in solving the problems of credit risk assessment in Polish banks.
* The article presents results of research conducted within research project # H02B 015 30 fi-nanced with educational sources.
134 Anna Feruś
2. Implementing DEA method in credit risk management
DEA method was first introduced in 1978 by the American economists Charnes, Cooper and Rhodes. Relying on productivity concept, formulated by G. Debreu (1951) and M.J. Farrel (1957), which defined efficiency measure as a quotient of singular input and singular output, they used it for a multidimensional situation in which there was more than one input as well as more than one output. Applying this inference they were able to propose a very practical system to measure efficiency. In DEA method efficiency is defined as following [Gospodarowicz 2002, p. 56]:
EFFICIENCYOUTPUT
INPUT
rr
s
r
i ii
m= =
=
∑
∑
µ
ν
1
1
, (1)
where: s – amount of outputs; m – amount of inputs, μr – measure demonstrating importance for each group of inputs; μr , νi – measure demonstrating importance for each group of outputs.
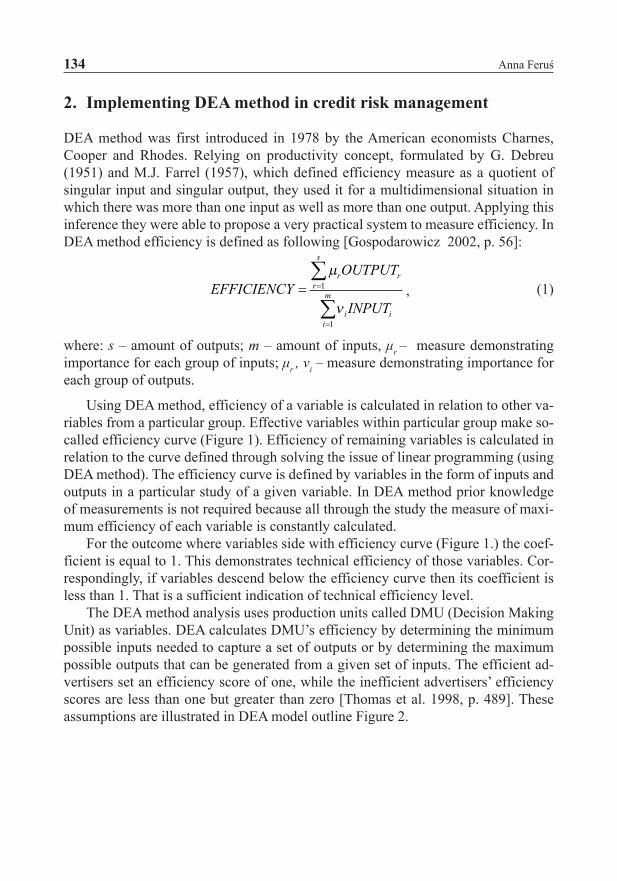
Using DEA method, efficiency of a variable is calculated in relation to other va-riables from a particular group. Effective variables within particular group make so-called efficiency curve (Figure 1). Efficiency of remaining variables is calculated in relation to the curve defined through solving the issue of linear programming (using DEA method). The efficiency curve is defined by variables in the form of inputs and outputs in a particular study of a given variable. In DEA method prior knowledge of measurements is not required because all through the study the measure of maxi-mum efficiency of each variable is constantly calculated.
For the outcome where variables side with efficiency curve (Figure 1.) the coef-ficient is equal to 1. This demonstrates technical efficiency of those variables. Cor-respondingly, if variables descend below the efficiency curve then its coefficient is less than 1. That is a sufficient indication of technical efficiency level.
The DEA method analysis uses production units called DMU (Decision Making Unit) as variables. DEA calculates DMU’s efficiency by determining the minimum possible inputs needed to capture a set of outputs or by determining the maximum possible outputs that can be generated from a given set of inputs. The efficient ad-vertisers set an efficiency score of one, while the inefficient advertisers’ efficiency scores are less than one but greater than zero [Thomas et al. 1998, p. 489]. These assumptions are illustrated in DEA model outline Figure 2.
The use of data envelopment analysis method for the estimation of companies’ credit risk 135
Figure 1. Efficiency Curve
Source: [Gospodarowicz 2000, p. 12].
Figure 2. DEA model outline
Source: [Gospodarowicz 2002, p. 57].
136 Anna Feruś
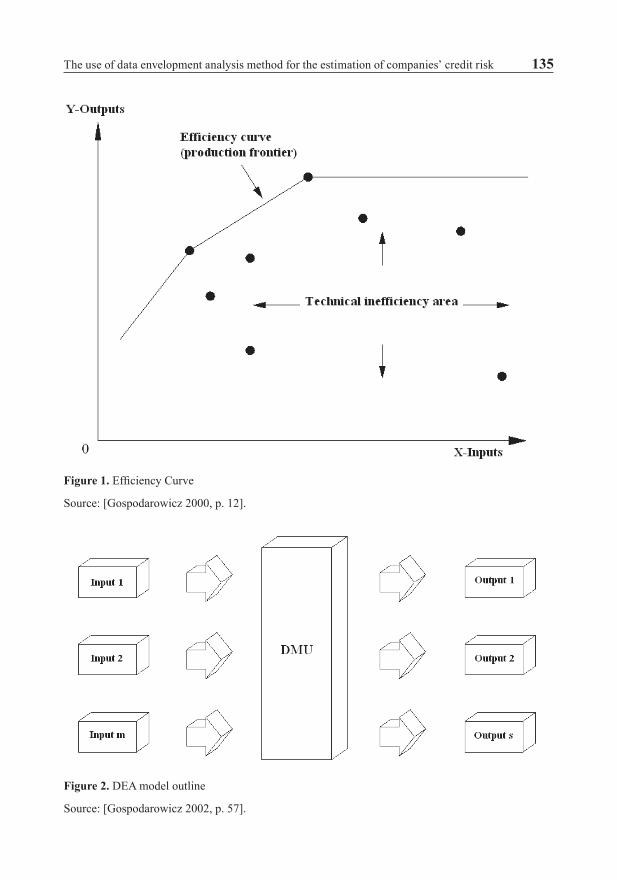
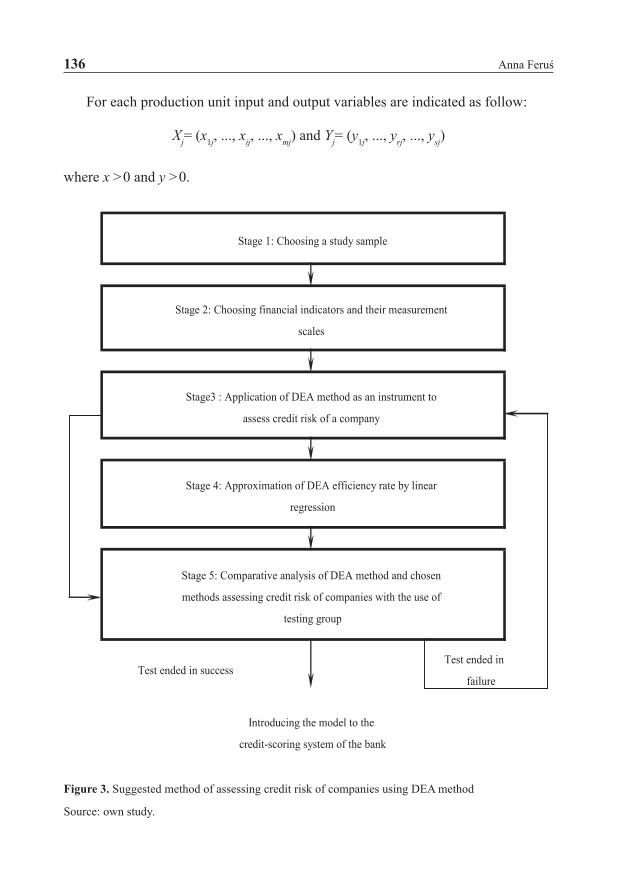
For each production unit input and output variables are indicated as follow:
Xj= (x1j, ..., xij, ..., xmj) and Yj= (y1j, ..., yrj, ..., ysj)
where x >0 and y >0.
Stage 5: Comparative analysis of DEA method and chosen
methods assessing credit risk of companies with the use of
testing group
Test ended in success
Introducing the model to the
credit-scoring system of the bank
Test ended in
failure
Stage 1: Choosing a study sample
Stage 2: Choosing financial indicators and their measurement
scales
Stage3 : Application of DEA method as an instrument to
assess credit risk of a company
Stage 4: Approximation of DEA efficiency rate by linear
regression
Figure 3. Suggested method of assessing credit risk of companies using DEA method
Source: own study.
The use of data envelopment analysis method for the estimation of companies’ credit risk 137
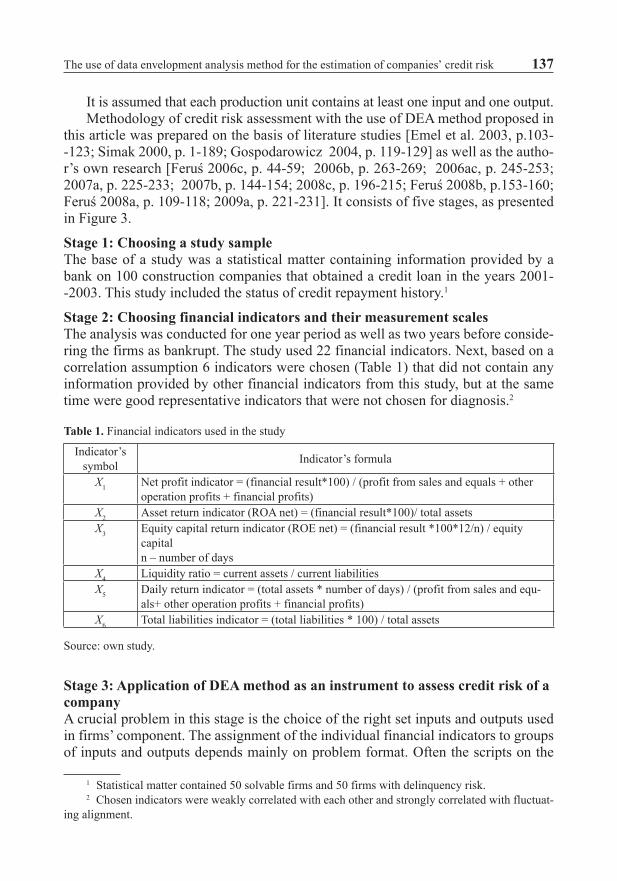
It is assumed that each production unit contains at least one input and one output.Methodology of credit risk assessment with the use of DEA method proposed in
this article was prepared on the basis of literature studies [Emel et al. 2003, p.103- -123; Simak 2000, p. 1-189; Gospodarowicz 2004, p. 119-129] as well as the autho-r’s own research [Feruś 2006c, p. 44-59; 2006b, p. 263-269; 2006ac, p. 245-253; 2007a, p. 225-233; 2007b, p. 144-154; 2008c, p. 196-215; Feruś 2008b, p.153-160; Feruś 2008a, p. 109-118; 2009a, p. 221-231]. It consists of five stages, as presented in Figure 3.
Stage 1: Choosing a study sampleThe base of a study was a statistical matter containing information provided by a bank on 100 construction companies that obtained a credit loan in the years 2001- -2003. This study included the status of credit repayment history.1
Stage 2: Choosing financial indicators and their measurement scalesThe analysis was conducted for one year period as well as two years before conside-ring the firms as bankrupt. The study used 22 financial indicators. Next, based on a correlation assumption 6 indicators were chosen (Table 1) that did not contain any information provided by other financial indicators from this study, but at the same time were good representative indicators that were not chosen for diagnosis.2
Table 1. Financial indicators used in the study
Indicator’s symbol Indicator’s formula
X1 Net profit indicator = (financial result*100) / (profit from sales and equals + other operation profits + financial profits)
X2 Asset return indicator (ROA net) = (financial result*100)/ total assetsX3 Equity capital return indicator (ROE net) = (financial result *100*12/n) / equity
capitaln – number of days
X4 Liquidity ratio = current assets / current liabilitiesX5 Daily return indicator = (total assets * number of days) / (profit from sales and equ-
als+ other operation profits + financial profits)X6 Total liabilities indicator = (total liabilities * 100) / total assets
Source: own study.
Stage 3: Application of DEA method as an instrument to assess credit risk of a companyA crucial problem in this stage is the choice of the right set inputs and outputs used in firms’ component. The assignment of the individual financial indicators to groups of inputs and outputs depends mainly on problem format. Often the scripts on the
1 Statistical matter contained 50 solvable firms and 50 firms with delinquency risk.2 Chosen indicators were weakly correlated with each other and strongly correlated with fluctuat-
ing alignment.
138 Anna Feruś
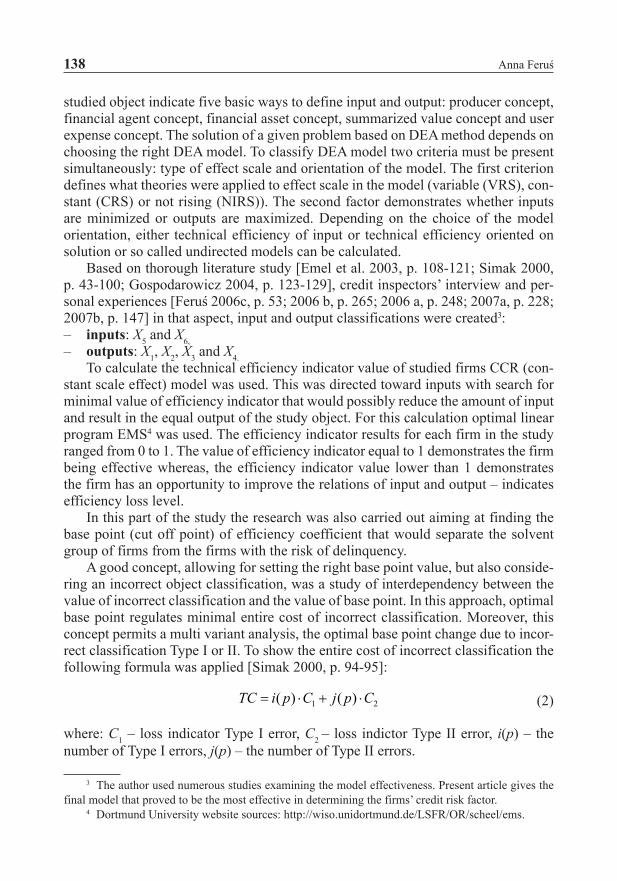
studied object indicate five basic ways to define input and output: producer concept, financial agent concept, financial asset concept, summarized value concept and user expense concept. The solution of a given problem based on DEA method depends on choosing the right DEA model. To classify DEA model two criteria must be present simultaneously: type of effect scale and orientation of the model. The first criterion defines what theories were applied to effect scale in the model (variable (VRS), con-stant (CRS) or not rising (NIRS)). The second factor demonstrates whether inputs are minimized or outputs are maximized. Depending on the choice of the model orientation, either technical efficiency of input or technical efficiency oriented on solution or so called undirected models can be calculated.
Based on thorough literature study [Emel et al. 2003, p. 108-121; Simak 2000, p. 43-100; Gospodarowicz 2004, p. 123-129], credit inspectors’ interview and per-sonal experiences [Feruś 2006c, p. 53; 2006 b, p. 265; 2006 a, p. 248; 2007a, p. 228; 2007b, p. 147] in that aspect, input and output classifications were created3: – inputs: X5 and X6, – outputs: X1, X2, X3 and X4.
To calculate the technical efficiency indicator value of studied firms CCR (con-stant scale effect) model was used. This was directed toward inputs with search for minimal value of efficiency indicator that would possibly reduce the amount of input and result in the equal output of the study object. For this calculation optimal linear program EMS4 was used. The efficiency indicator results for each firm in the study ranged from 0 to 1. The value of efficiency indicator equal to 1 demonstrates the firm being effective whereas, the efficiency indicator value lower than 1 demonstrates the firm has an opportunity to improve the relations of input and output – indicates efficiency loss level.
In this part of the study the research was also carried out aiming at finding the base point (cut off point) of efficiency coefficient that would separate the solvent group of firms from the firms with the risk of delinquency.
A good concept, allowing for setting the right base point value, but also conside-ring an incorrect object classification, was a study of interdependency between the value of incorrect classification and the value of base point. In this approach, optimal base point regulates minimal entire cost of incorrect classification. Moreover, this concept permits a multi variant analysis, the optimal base point change due to incor-rect classification Type I or II. To show the entire cost of incorrect classification the following formula was applied [Simak 2000, p. 94-95]:
TC i p C j p C= ⋅ + ⋅( ) ( )1 2 (2)
where: C1 – loss indicator Type I error, C2 – loss indictor Type II error, i(p) – the number of Type I errors, j(p) – the number of Type II errors.
3 The author used numerous studies examining the model effectiveness. Present article gives the final model that proved to be the most effective in determining the firms’ credit risk factor.
4 Dortmund University website sources: http://wiso.unidortmund.de/LSFR/OR/scheel/ems.
The use of data envelopment analysis method for the estimation of companies’ credit risk 139
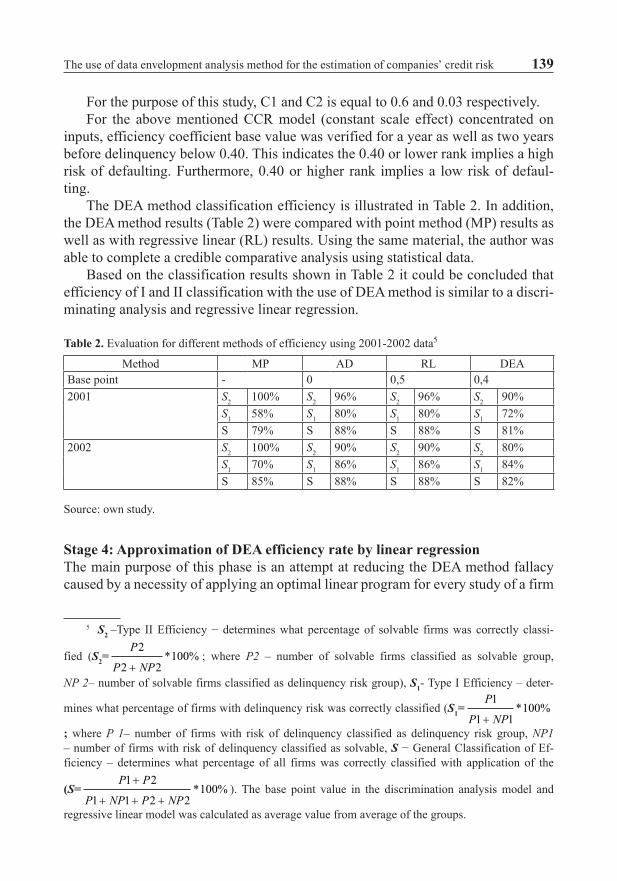
For the purpose of this study, C1 and C2 is equal to 0.6 and 0.03 respectively.For the above mentioned CCR model (constant scale effect) concentrated on
inputs, efficiency coefficient base value was verified for a year as well as two years before delinquency below 0.40. This indicates the 0.40 or lower rank implies a high risk of defaulting. Furthermore, 0.40 or higher rank implies a low risk of defaul-ting.
The DEA method classification efficiency is illustrated in Table 2. In addition, the DEA method results (Table 2) were compared with point method (MP) results as well as with regressive linear (RL) results. Using the same material, the author was able to complete a credible comparative analysis using statistical data.
Based on the classification results shown in Table 2 it could be concluded that efficiency of I and II classification with the use of DEA method is similar to a discri-minating analysis and regressive linear regression.
Table 2. Evaluation for different methods of efficiency using 2001-2002 data5
Method MP AD RL DEABase point - 0 0,5 0,42001 S2 100% S2 96% S2 96% S2 90%
S1 58% S1 80% S1 80% S1 72%S 79% S 88% S 88% S 81%
2002 S2 100% S2 90% S2 90% S2 80%S1 70% S1 86% S1 86% S1 84%S 85% S 88% S 88% S 82%
Source: own study.
Stage 4: Approximation of DEA efficiency rate by linear regressionThe main purpose of this phase is an attempt at reducing the DEA method fallacy caused by a necessity of applying an optimal linear program for every study of a firm
5 S2 –Type II Efficiency − determines what percentage of solvable firms was correctly classi-
fied (S2=P
P NP
2
2 2100
+* % ; where P2 – number of solvable firms classified as solvable group,
NP 2– number of solvable firms classified as delinquency risk group), S1- Type I Efficiency – deter-
mines what percentage of firms with delinquency risk was correctly classified (S1=P
P NP
1
1 1100
+* %
; where P 1– number of firms with risk of delinquency classified as delinquency risk group, NP1 – number of firms with risk of delinquency classified as solvable, S − General Classification of Ef-ficiency – determines what percentage of all firms was correctly classified with application of the
(S=P P
P NP P NP
1 2
1 1 2 2100
+
+ + +* % ). The base point value in the discrimination analysis model and
regressive linear model was calculated as average value from average of the groups.
140 Anna Feruś
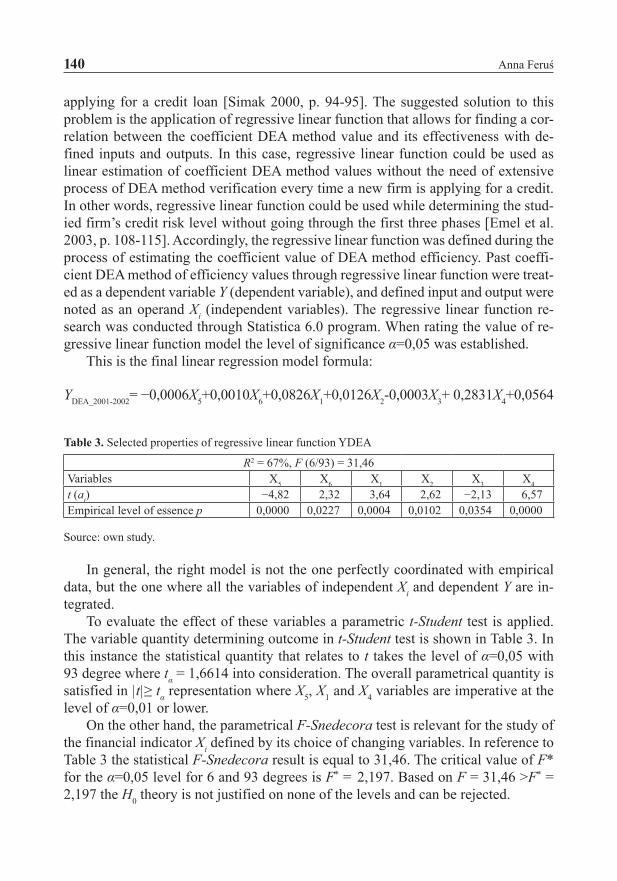
applying for a credit loan [Simak 2000, p. 94-95]. The suggested solution to this problem is the application of regressive linear function that allows for finding a cor-relation between the coefficient DEA method value and its effectiveness with de-fined inputs and outputs. In this case, regressive linear function could be used as linear estimation of coefficient DEA method values without the need of extensive process of DEA method verification every time a new firm is applying for a credit. In other words, regressive linear function could be used while determining the stud-ied firm’s credit risk level without going through the first three phases [Emel et al. 2003, p. 108-115]. Accordingly, the regressive linear function was defined during the process of estimating the coefficient value of DEA method efficiency. Past coeffi-cient DEA method of efficiency values through regressive linear function were treat-ed as a dependent variable Y (dependent variable), and defined input and output were noted as an operand Xi (independent variables). The regressive linear function re-search was conducted through Statistica 6.0 program. When rating the value of re-gressive linear function model the level of significance α=0,05 was established.
This is the final linear regression model formula:
YDEA_2001-2002= −0,0006X5+0,0010X6+0,0826X1+0,0126X2-0,0003X3+ 0,2831X4+0,0564
Table 3. Selected properties of regressive linear function YDEA
R2 = 67%, F (6/93) = 31,46Variables X5 X6 X1 X2 X3 X4
t (ai) −4,82 2,32 3,64 2,62 −2,13 6,57Empirical level of essence p 0,0000 0,0227 0,0004 0,0102 0,0354 0,0000
Source: own study.
In general, the right model is not the one perfectly coordinated with empirical data, but the one where all the variables of independent Xi and dependent Y are in-tegrated.
To evaluate the effect of these variables a parametric t-Student test is applied. The variable quantity determining outcome in t-Student test is shown in Table 3. In this instance the statistical quantity that relates to t takes the level of α=0,05 with 93 degree where tα = 1,6614 into consideration. The overall parametrical quantity is satisfied in |t|≥ tα representation where X5, X1 and X4 variables are imperative at the level of α=0,01 or lower.
On the other hand, the parametrical F-Snedecora test is relevant for the study of the financial indicator Xi defined by its choice of changing variables. In reference to Table 3 the statistical F-Snedecora result is equal to 31,46. The critical value of F* for the α=0,05 level for 6 and 93 degrees is F* = 2,197. Based on F = 31,46 >F* = 2,197 the H0 theory is not justified on none of the levels and can be rejected.
The use of data envelopment analysis method for the estimation of companies’ credit risk 141
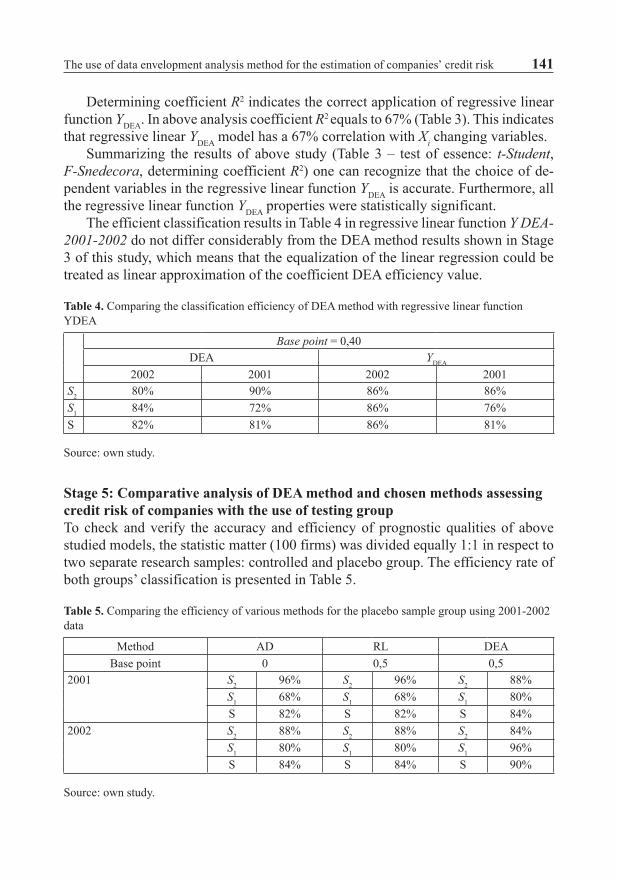
Determining coefficient R2 indicates the correct application of regressive linear function YDEA. In above analysis coefficient R2 equals to 67% (Table 3). This indicates that regressive linear YDEA model has a 67% correlation with Xi changing variables.
Summarizing the results of above study (Table 3 – test of essence: t-Student, F-Snedecora, determining coefficient R2) one can recognize that the choice of de-pendent variables in the regressive linear function YDEA is accurate. Furthermore, all the regressive linear function YDEA properties were statistically significant.
The efficient classification results in Table 4 in regressive linear function Y DEA-2001-2002 do not differ considerably from the DEA method results shown in Stage 3 of this study, which means that the equalization of the linear regression could be treated as linear approximation of the coefficient DEA efficiency value.
Table 4. Comparing the classification efficiency of DEA method with regressive linear function YDEA
Base point = 0,40DEA YDEA
2002 2001 2002 2001S2 80% 90% 86% 86%S1 84% 72% 86% 76%S 82% 81% 86% 81%
Source: own study.
Stage 5: Comparative analysis of DEA method and chosen methods assessing credit risk of companies with the use of testing groupTo check and verify the accuracy and efficiency of prognostic qualities of above studied models, the statistic matter (100 firms) was divided equally 1:1 in respect to two separate research samples: controlled and placebo group. The efficiency rate of both groups’ classification is presented in Table 5.
Table 5. Comparing the efficiency of various methods for the placebo sample group using 2001-2002 data
Method AD RL DEABase point 0 0,5 0,5
2001 S2 96% S2 96% S2 88%S1 68% S1 68% S1 80%S 82% S 82% S 84%
2002 S2 88% S2 88% S2 84%S1 80% S1 80% S1 96%S 84% S 84% S 90%
Source: own study.
142 Anna Feruś
Based on above classification results in Table 5 it can be determined that DEA method has superior prognostic indicators. It best minimizes type I errors where clas-sification efficiency was higher than 12% two years before delinquency and higher than 16% one year before delinquency. However, general classification efficiency of DEA method is similar to general classification for methods: discrimination and linear regression analysis.
3. Conclusion
Based on the analysis in this article it would be justified to say that a well reflected credit scoring model is reliable in differentiating potential high risk of default from low risk of default clients. Founded by the study, it can be concluded that DEA me-thod correctly predicts possible financial difficulties including a company’s ban-kruptcy risk in Polish economic situation. These results are comparable or even su-perior to other methods which are presently employed.
This study signifies the universal application of DEA method in analyzing large spectrum of credit risk uncertainty. It not only measures efficiency in respect to the use of financial risk indicators, but it facilitates accurate credit risk classification for corporations in the credit application process. This credit scoring method is very dynamic, very promising, and continually developing.
Literature
Emel A.B., Oral M., Reisman A., Yolalan R., A credit scoring approach for the commercial banking sector, “Socio-Economic Planning Sciences” 2003, no. 37.
Feruś A., Określanie poziomu ryzyka kredytowego przedsiębiorstw z wykorzystaniem metody DEA, [in:] Problemy zarządzania finansami we współczesnych przedsiębiorstwach, ed. P. Szczepankow-ski, VIZJA PRESS, Warszawa 2006a.
Feruś A., Szacowanie ryzyka kredytowego przedsiębiorstw z wykorzystaniem metody DEA, [in:] Finan-se przedsiębiorstwa, ed. P. Karpuś, UMCS, Lublin 2006b.
Feruś A., Szacowanie ryzyka kredytowego przedsiębiorstw ze szczególnym uwzględnieniem meto-dy DEA, [in:] Harmonizacja bankowości i ubezpieczeń w skali narodowej i europejskiej, eds. M. Marcinkowska, S. Wieteska, Difin, Warszawa 2007a.
Feruś A., The DEA method in managing the credit risk of companies, „Ekonomika” 2008a, no. 84. Feruś A., Wykorzystanie metody DEA do oceny ryzyka kredytowego przedsiębiorstw w ramach credit-
-scoringu, [in:] Zarządzanie finansami firm – teoria i praktyka, ed. W. Pluta, Prace Naukowe Akademii Ekonomicznej we Wrocławiu nr 1152, Wrocław 2007b.
Feruś A., Zarządzanie ryzykiem kredytowym przedsiębiorstw z wykorzystaniem metody DEA w ramach credit-scoringu, [in:] Zarządzanie finansami firm − teoria i praktyka, ed. B. Bernaś, Prace Nauko-we Akademii Ekonomicznej we Wrocławiu nr 1200, Wrocław 2008b.
Feruś A., Zarządzanie ryzykiem kredytowym przedsiębiorstw z wykorzystaniem metody DEA w ramach credit-scoringu, [in:] Zarządzanie finansami firm − teoria i praktyka, ed. B. Bernaś, Prace Nauko-we Akademii Ekonomicznej we Wrocławiu nr 48, Wrocław 2009a.
The use of data envelopment analysis method for the estimation of companies’ credit risk 143
Feruś A., Zastosowanie metody DEA do określania poziomu ryzyka kredytowego przedsiębiorstw, „Bank i Kredyt” 2006c, nr 7.
Feruś A., Управління Кредитними Ризиками Підприємств за Допомогою Методу DEA, [in:] Актуальні Проблеми Управління, Монографія, tom 2, Запоріжжя-Жешув 2008c.
Gospodarowicz A. (ed.), Analiza i ocena banków oraz ich oddziałów, Wydawnictwo Akademii Ekono-micznej we Wrocławiu, Wrocław 2002.
Gospodarowicz A., Możliwości wykorzystania metody DEA do oceny ryzyka kredytowego w kontekście Nowej Umowy Kapitałowej, [in:] Przestrzenno-czasowe modelowanie i prognozowanie zjawisk gospodarczych, ed. A. Zeliaś, Wydawnictwo Akademii Ekonomicznej w Krakowie, Kraków 2004.
Gospodarowicz M., Procedury analizy i oceny banków, Materiały i Studia, NBP, vol. 103, Warszawa 2000.
Iwanicz-Drozdowska M., Zarządzanie finansowe bankiem, PWE, Warszawa 2005.Simak P.C., Inverse and Negative DEA and their Application to Credit Risk Evaluation, Centre for
Management of Technology and Entrepreneurship, Faculty of Applied Sciences and Engineering, University of Toronto, Toronto 2000.
Thomas R.R., Barr R.S., Cron W.L., Slocum J.W., A process for evaluating retail store efficiency: a restricted DEA approach, “International Journal of Research in Marketing” 1998, no. 15.
WYKORZYSTANIE METODY GRANICZNEJ ANALIZY DANYCH DO OCENY RYZYKA KREDYTOWEGO PRZEDSIĘBIORSTW
Streszczenie: Celem niniejszego artykułu jest zaproponowanie nowego postępowania prognozującego ryzyko kredytowe przedsiębiorstw w polskich warunkach gospodarczych. Za podjęciem proponowanych badań przemawia fakt, iż w Polsce, w przeciwieństwie do krajów zachodnich, nie podejmowano prób zastosowania metody granicznej analizy danych DEA do oceny ryzyka kredytowego przedsiębiorstw. Badania w artykule zostały przeprowadzone na zasadzie porównania proponowanej metody DEA z metodami obecnie stosowanymi (takimi jak metoda punktowa, analiza dyskryminacyjna, regresja liniowa). Na podstawie przeprowadzonych badań można wnioskować, że metoda DEA umożliwia przewidywanie wystąpienia trudności finansowych, łącznie z zagrożeniem bankructwem przedsiębiorstw w polskich warunkach gospodarczych na poziomie porównywalnym z metodami dotychczas stosowanymi lub nawet przewyższającym.
Słowa kluczowe: credit-scoring, ryzyko kredytowe, zdolność kredytowa, DEA, efektywność techniczna.