
Warszawa, 23 kwietnia 2001 r - Narodowy Bank Polski · 2 The Act of 16 September 2011 (Journal of...
24
N a t i o n a l B a n k o f P o l a n d Economic Institute Jacek Łaszek, Hanna Augustyniak 5th July 2012 Krzysztof Olszewski, Krzysztof Gajewski Bureau of Macroprudential Policy Information on home prices and the situation in the residential and commercial real estate market in Poland 1 in 2012 Q1 The study provides a synthetic description of key developments affecting the housing market in Poland’s largest cities in 2012 Q1 and contains an appendix with charts and figures presenting: 1/ home prices (Figures 1-12), 2/ housing availability, loan availability, availability of loan-financed housing, loan limits and loan disbursements under the government-subsidized housing scheme Family on their own (Rodzina na Swoim - RNS) (Figures 13-24) 3/loan 1 The information was prepared by the Economic Institute for the NBP’s authorities needs and it presents the authors’ opinions. This document should not be read as an advisory material nor should be the basis for any investment decisions. 2 The Act of 16 September 2011 (Journal of Laws no. 232, item 1377) on the protection of home buyers’ rig hts, defines the real estate development contract and obliges the real estate developer to provide the buyer with appropriate protection measures. Summary The analysis of the situation in the Polish real estate market in 2012 Q1 leads to the following conclusions : The analysed period was marked by the growing risk of production oversupply by real estate developers, which is likely to result in a faster than previously observed price adjustment and may trigger problems in the construction sector; yet, at the same time, the majority of trends observed in the housing market since the beginning of 2011 continued, which may be viewed as the market’s shift toward a new equilibrium with lower home prices and falling production costs; the share of profits in the price per square meter of housing was still attractive to real estate developers, especially smaller-sized ones; despite the already existing large stock of housing and home construction contracts in place, high industry exit costs and the absence of possibilities to engage in alternative investment urged real estate developers to embark on new construction projects; increased housing production might also be attributed to the vacatio legis of the new act on real estate development 2 ; small nominal declines in home prices (both offer and transaction prices in the primary and secondary market) were noted in the largest cities; the sharpest declines in real terms were driven by rising wages and inflation; quarter-on-quarter growth in housing loan receivables from individuals was lower than during the past six years; the value of newly signed contracts hit its record low for the past three years; banks’ withdrawal from FX lending to households constituted an important factor supporting the security of the financial system; growing supply of housing contracts did not lead to an economic downturn in the real estate development sector; yet, growing supply and downwardly inflexible home prices might trigger sector problems in the future; the commercial real estate market saw a rise in the value of investment transactions, whereas capitalization on investment projects in prime locations remained stable.
Transcript of Warszawa, 23 kwietnia 2001 r - Narodowy Bank Polski · 2 The Act of 16 September 2011 (Journal of...
N a t i o n a l B a n k o f P o l a n d
E c o n o m i c I n s t i t u t e
Jacek Łaszek, Hanna Augustyniak 5th July 2012
Krzysztof Olszewski, Krzysztof Gajewski
Bureau of Macroprudential Policy
Information on home prices and the situation in the residential and
commercial real estate market in Poland1 in 2012 Q1
The study provides a synthetic description of key developments affecting the housing
market in Poland’s largest cities in 2012 Q1 and contains an appendix with charts and figures
presenting: 1/ home prices (Figures 1-12), 2/ housing availability, loan availability, availability of
loan-financed housing, loan limits and loan disbursements under the government-subsidized
housing scheme Family on their own (Rodzina na Swoim - RNS) (Figures 13-24) 3/loan
1 The information was prepared by the Economic Institute for the NBP’s authorities needs and it presents the
authors’ opinions. This document should not be read as an advisory material nor should be the basis for any
investment decisions. 2 The Act of 16 September 2011 (Journal of Laws no. 232, item 1377) on the protection of home buyers’ rights,
defines the real estate development contract and obliges the real estate developer to provide the buyer with
appropriate protection measures.
Summary
The analysis of the situation in the Polish real estate market in 2012 Q1 leads to the following
conclusions :
The analysed period was marked by the growing risk of production oversupply by real
estate developers, which is likely to result in a faster than previously observed price
adjustment and may trigger problems in the construction sector; yet, at the same time, the
majority of trends observed in the housing market since the beginning of 2011 continued,
which may be viewed as the market’s shift toward a new equilibrium with lower home
prices and falling production costs;
the share of profits in the price per square meter of housing was still attractive to real estate
developers, especially smaller-sized ones; despite the already existing large stock of
housing and home construction contracts in place, high industry exit costs and the absence
of possibilities to engage in alternative investment urged real estate developers to embark
on new construction projects; increased housing production might also be attributed to the
vacatio legis of the new act on real estate development2;
small nominal declines in home prices (both offer and transaction prices in the primary and
secondary market) were noted in the largest cities; the sharpest declines in real terms were
driven by rising wages and inflation;
quarter-on-quarter growth in housing loan receivables from individuals was lower than
during the past six years; the value of newly signed contracts hit its record low for the past
three years; banks’ withdrawal from FX lending to households constituted an important
factor supporting the security of the financial system;
growing supply of housing contracts did not lead to an economic downturn in the real
estate development sector; yet, growing supply and downwardly inflexible home prices
might trigger sector problems in the future;
the commercial real estate market saw a rise in the value of investment transactions,
whereas capitalization on investment projects in prime locations remained stable.
2 / 24
disbursements and real interest rates (Figures 25-46), 4/ operating profitability of real estate
development projects, costs of construction and assembly output and economic situation of real
estate developers in Poland (Figures 47-67), 5/ residential construction in Poland (Figures 68-79),
and 6/ commercial real estate (Figures 80-95).
This study was based on the data from the Real Estate Market Database BaRN3, the
database of offer prices of housing provided by PONT Info Nieruchomości, databases SARFIN
and AMRON of the Polish Banks’ Association (ZBP), collective data of the Credit Information
Bureau (Biuro Informacji Kredytowej), data presented by Sekocenbud, the Central Statistical
Office (GUS) and the National Bank of Poland (NBP). Offer prices of housing put on sale and
information concerning profitability of real estate development projects were based on the data
furnished by the Real Estate Advisory Service (REAS) and information supplied by the GUS (F01
and F02).
Information concerning the commercial real estate market4 was prepared on the basis of
data provided, on a voluntary basis, by commercial real estate agents and commercial real estate
management companies as well as companies involved in commercial real estate consultancy. The
analysis also draws on the expertise of experts of various consulting companies and the NBP. The
study relied on the data and information provided by the following consulting companies: CBRE,
Colliers International, Cushman & Wakefield, DTZ, Jones Lang LaSalle, Ober Haus and
associations: the Retail Research Forum of the Polish Council of Shopping Centres and the
Warsaw Research Forum. The authors also used Comparables.pl data base.
------------------------
The main risk factor to be noted in 2012 Q1 is growing imbalance in the market of real
estate developer housing in Poland’s largest cities (see Figure 73). This phenomenon, triggered by
the lending boom and the cycle in Poland’s housing markets has been steadily intensifying since
2009, to reach now worrying levels. Contrary to the previous business cycle (observed in 2005-
2009) which was primarily caused by the banking sector and foreign exchange loans, the currently
observed business cycle is supply-driven and is the effect of downwardly inflexible prices, time
lags between the investment decision and the investment project marketing as well as excessive
optimism of real estate developers. At the same time, inflationary processes ease tensions resulting
from price bubbles, therefore the risk of price bubble in the coming quarters is insignificant (see
Figure 1- Figure 12 and Figure 77).
The supply-driven business cycle is the classical cycle in the real estate market which was
already observed in Poland at the beginning of the first decade of the 21st century. It ended in a
classical way, namely, production collapse, providing conditions for the recent economic boom
(surge in demand following Poland’s entry into the European Union, coupled with low levels of
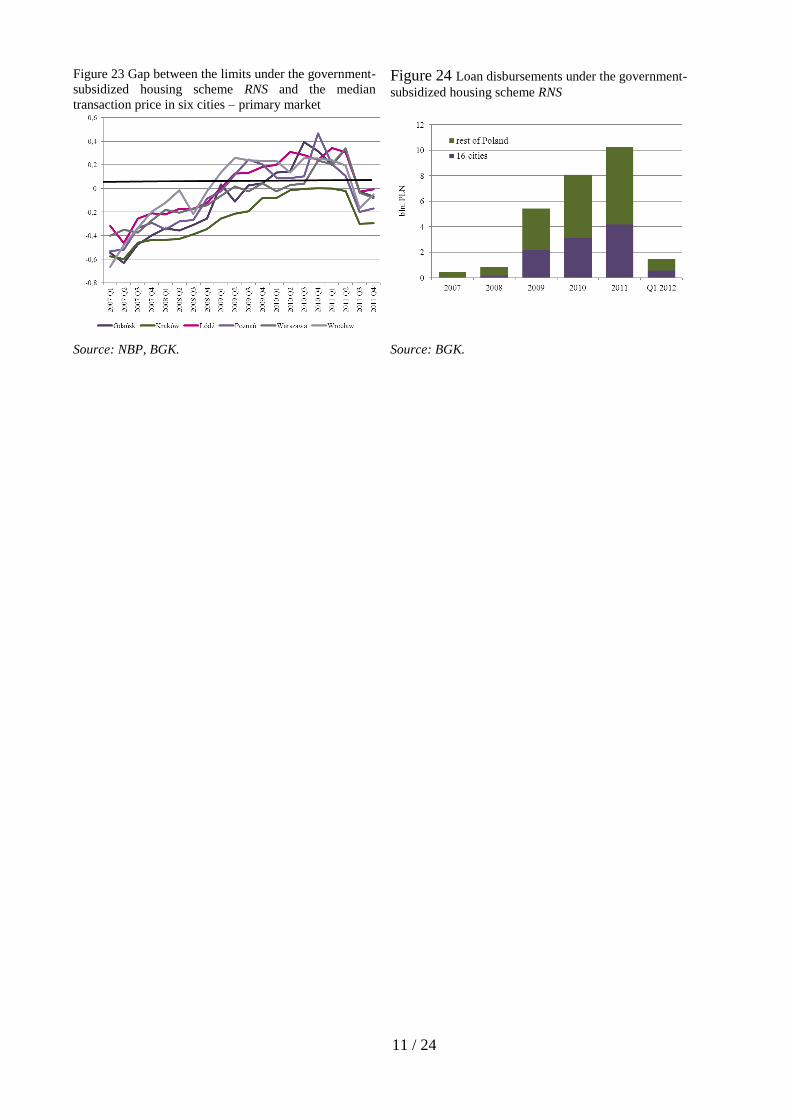
housing production). Slight acceleration in demand, followed by its subsequent reduction on
account of the government’s withdrawal from the government-subsidized housing scheme RNS at
the end of 2012 seems a likely development. Yet, this will not have any significant impact on the
existing surplus of housing on the market (see Figure 23 and Figure 24). We assume that the
3 The BaRN database of the National Bank of Poland is created thanks to voluntary provision of data by the real
estate agents and real estate developers with the participation of regional branches of the NBP; the study analyses
both home sales offers and transactions as well as home rentals within city limits of sixteen voivodeship cities, where
the majority of real estate deals are closed. 4 The study focuses on modern commercial real estate as they are the object of transactions conducted by large real
estate agents and since there is a strong and direct relationship between the scale of those transactions and the
domestic economy. Introductory information on the commercial real estate market, definitions and in-depth analysis
of major economic variables are presented in the NBP’s report: “Report on the situation in the residential and
commercial real estate market in Poland in 2010”, available on the NBP’s website.

3 / 24
overall situation in the construction sector, especially its deterioration as a result of depletion of
the pool of general construction contracts of the public sector is the factor boosting real estate
developer optimism more strongly than the government-subsidized housing scheme RNS. General
construction contracts, although hardly profitable, have always been considered by the
construction industry and real estate development sector as safe. Currently, some construction
companies are increasing their investment in the housing sector, which is fuelled by the
availability of production factors and flexibility of construction companies and real estate
development companies5. At the same time, these companies, given persistently positive
performance indicators of their housing projects, believe their prices will beat competitors.
Another factor also affecting the pace of deterioration in the market situation, namely oversupply
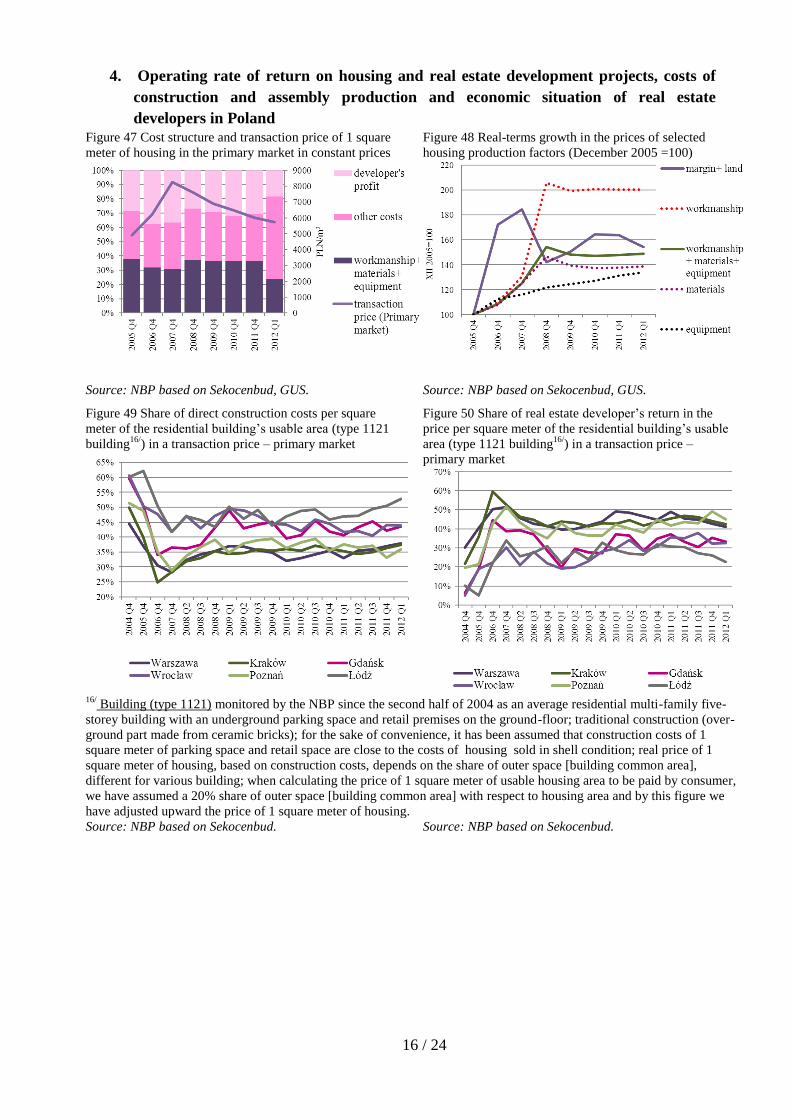
of new housing and falling profit margins (see Figure 47 and Figure 78, Figure 79), are decisions
made by developers in the previous years, i.e. under different economic conditions. Consequently,
the market abounds in unsold big apartments, built at high costs. So far, these phenomena
affecting the primary market, are part of the normal real estate cycle rather than a crisis. This is
due to a small impact of the real estate development sector on the economy, especially on the
financial sector6. The share of loans in the funding structure of large real estate developers in the
recent years ranged between 10-20% (see Figure 65), and their share in banks' portfolios did not
exceed 0.5%. Crisis phenomena, thus strongly impacting the whole economy, are usually
observed in the case of large scale tensions and accumulation of additional often external factors,
undermining economic sustainability.
At the same time, the situation of the largest real estate developers continues to be sound,
and the economic indicator analysis confirms the phenomena observed in the market (see Figure
59 - Figure 67). The decline in margins, i.e. falling share of profit in the price of housing, urged
companies to make necessary adjustments (see Figure 51 - Figure 56 and Figure 60). The share of
operating costs of a real estate development company (own costs) in the cost structure (see Figure
60 - Figure 64) shrank. Decline was also seen in the consumption of energy and materials for the
company’s own use (see Figure 59). The higher share of wages and third party services
(construction companies) is the consequence of expanding production scale (see Figure 61),
boosting both costs and revenues. In the case of production increase, real estate developers cannot
significantly cut personnel costs, particularly costs of staff engaged in investment project
operation; yet, they can and do reduce material and energy costs.
Despite the increase in work in progress, real estate developers managed to improve both
ROE and ROA ratios as compared to 2011 Q1; yet, these ratios continue to be worse than in the
previous quarter (see Figure 61 - Figure 63). Also the structure of liabilities does not raise any
major concerns. Companies are strongly capitalized, and almost half of the production is financed
with equity. Bank lending accounts for approximately 12% of funding, and remains below PLN 4
billion in absolute terms (see Figure 67). Under these conditions, the steadily growing share of
non-performing debts of real estate developers is of lesser concern (see Figure 66).
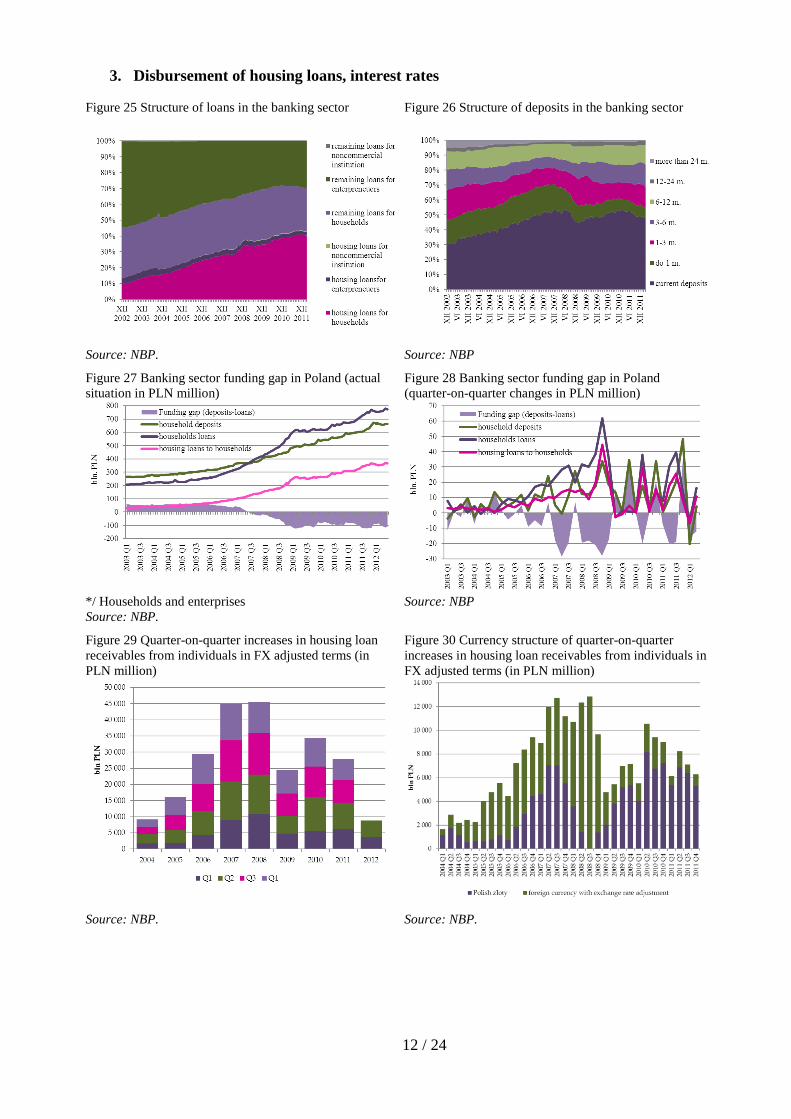
Quarter-on-quarter volume of lending went back to its 2005 levels, observed before the
start of the credit boom. This is the consequence of the falling loan availability as a result of
changes in their currency structure (see Figure 13 - Figure 22), new, more restrictive regulations,
market participants' expectations of further falls in home prices and banks’ concerns about these
portfolios.
In general, housing demand is stable, since nominal interest rate increases and the related
decline in credit availability are offset by declines in home prices in real terms, which means that
5 In classical terms, the real estate developer organises and finances the investment project, whereas the
construction company executes the investment project. Amidst market tightening or very good economic conditions
on the market, construction companies usually take over the real estate developers’ role. 6 See Chapter 4 and 5 in the “Information on home prices and the situation in the residential and commercial real
estate market in Poland in 2010”, NBP

4 / 24
availability of loan-financed housing, being an approximation of the demand, was quite stable
with a slight downward trend observed in 2012 Q1(see Figure 76). Amidst growing supply of
residential construction contracts (see Figure 72 and Figure 73), stable demand generates
continuous growth in unsold housing on the market (see Figure 73). The shortened home selling
period (see Figure 75), contrary to the opposite trend seen in the past two years, is probably driven
by a certain acceleration in home sales amidst the government’s withdrawal from the subsidized
housing scheme RNS and the intense promotion of real estate developers aiming to circumvent the
provisions of the Act on the protection of home buyers’ rights.
Other processes in the sector were largely the continuation of past trends, i.e. search for a
new long-term equilibrium between lending institutions, capital providers, real estate developers,
the building sector and consumers of housing services.
Home transaction prices in real terms continued to fall (see Figure 4), amidst stable level
or slight declines in transaction prices, including hedonic prices, i.e. quality-adjusted home prices
(see Figure 7, Figure 8, Figure 12). In some cities, real estate developers attempted to increase
price of housing newly put on the market (see Figure 1 and Figure 2); on the other hand, they also
offered promotional price cuts for housing awaiting to be sold. Consequently, the average level of
offer and transaction prices was slightly reduced.
The decline in loan availability was mainly due to the change in the loan structure and
interest rate increases. In 2012 Q1 the first-time decline in foreign currency loans was observed,
which means that the number of loans repaid or denominated in PLN exceeded the number of
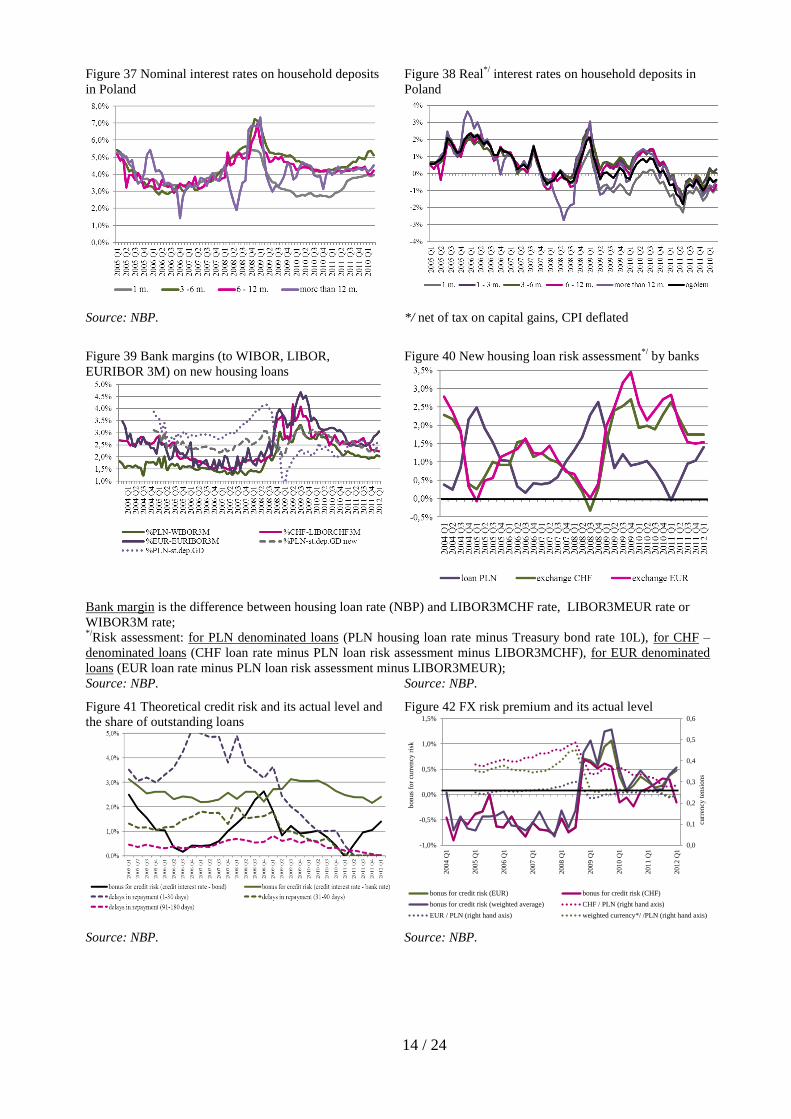
newly granted loans (see Figure 30). Real interest rates on zloty denominated loans (due to the
inflation effect) continued to be low, whereas the inflation-driven decline was halted and the real
costs of consumer loans followed an upward trend (see Figure 14). The nominal exchange rate of
zloty denominated housing loans rose in 2012 Q1 (see Figure 35 and Figure 36). An increase was
also recorded in margins charged on PLN loans, calculated both on interbank market rates, deposit
rates and bond yields (see Figure 39). Margin decomposition in terms of risk structure shows an
increase in loan risk premiums and a decline resulting from FX risk (see Figure 40). The analysis
of the actual risk as compared to the risk components shows that the risk growth was not offset by
the rise in risk premium (see Figure 40 - Figure 42).
The geographical breakdown of loans did not post any major changes (see Figure 31 and
Figure 32).
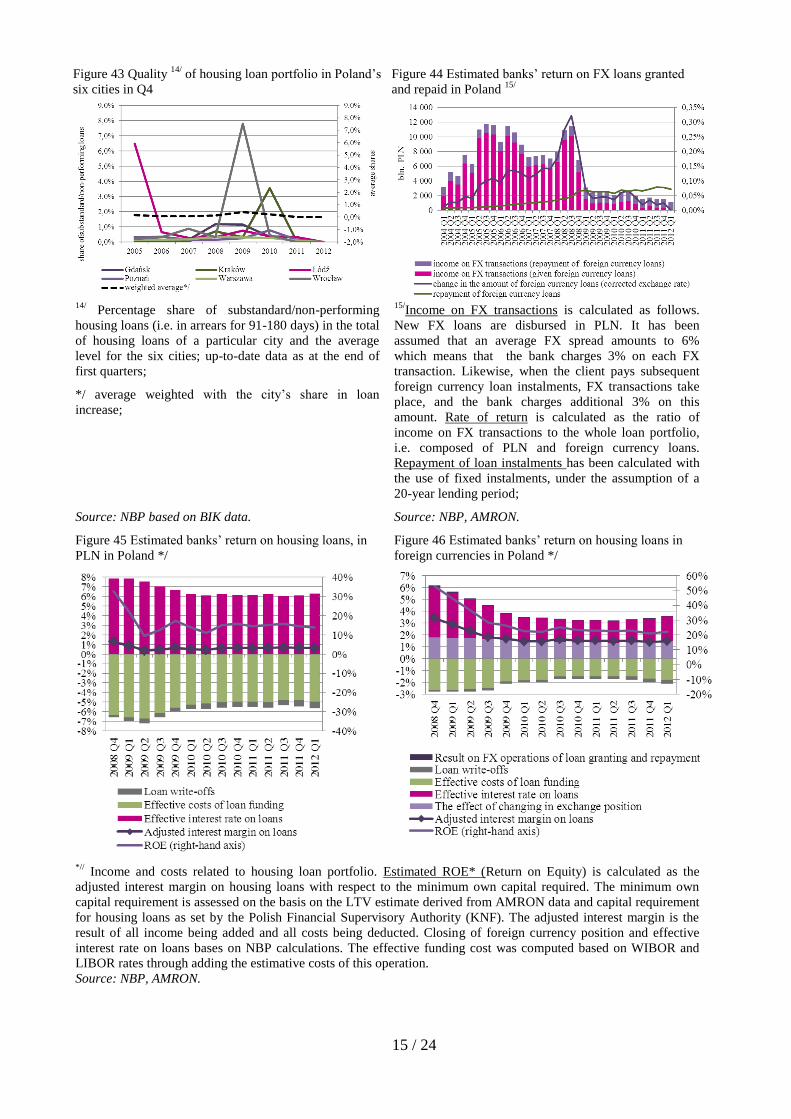
Despite a decline in lending, return on housing loans increased slightly as a result of higher
interest income amidst the fairly stable share of non-performing loans (see Figure 43, Figure 45,
Figure 46). Due to the falling number of newly granted foreign currency loans, banks’ income
from FX operations declined (see Figure 44).
These abovementioned processes going on in the real estate development and construction
sectors were reflected in housing sector developments. In the housing structure, the share of
residential housing built by real estate developers expanded (see Figure 68). Despite growing
housing stock in the market, the number of building permits and commenced projects also picked
up. This means there is a very high probability that the market of real estate developer contracts
for housing construction faces growing supply and surplus of unsold construction contracts.
Consequently, the period needed to reach the long-term equilibrium gets extended (see Figure 69
and Figure 73).
The situation in the market for housing construction contracts, which is the primary market
in Poland, does not have a current impact on residential construction completions. In line with
expectations, in 2012 Q1 the number of completed housing as compared to the previous year went
up (see Figure 69). Having in mind the historical numbers of commenced investments, this trend
is most likely to continue throughout the year and consequently, the number of completed housing
is likely to increase.
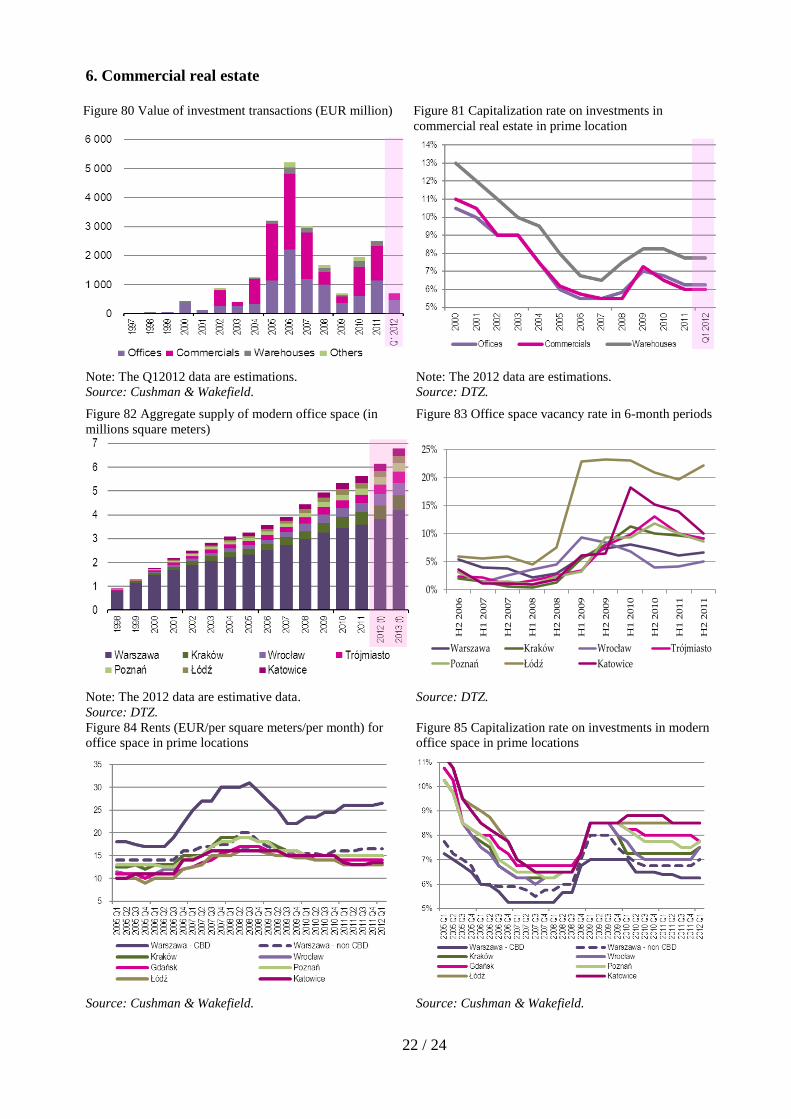
The commercial real estate market in 2012 Q1 continued to be marked by processes started
already in 2011. The value of investment in commercial real estates in 2012 Q1 reached EUR 0.7

5 / 24
billion, with the sale of Złote Tarasy Shopping Mall in Warsaw having a dominant share. Market
participants expect capitalization rates in all the sectors to remain at their 2011 level. Combined
with relatively stable rents in most markets, this may be indicative of a stable level of real estate
prices (see Figure 80 - Figure 81). It should be remembered that so far the commercial real estate
market has been dominated by foreign investors, whose investment decisions are largely
conditioned by the developments in the euro area.
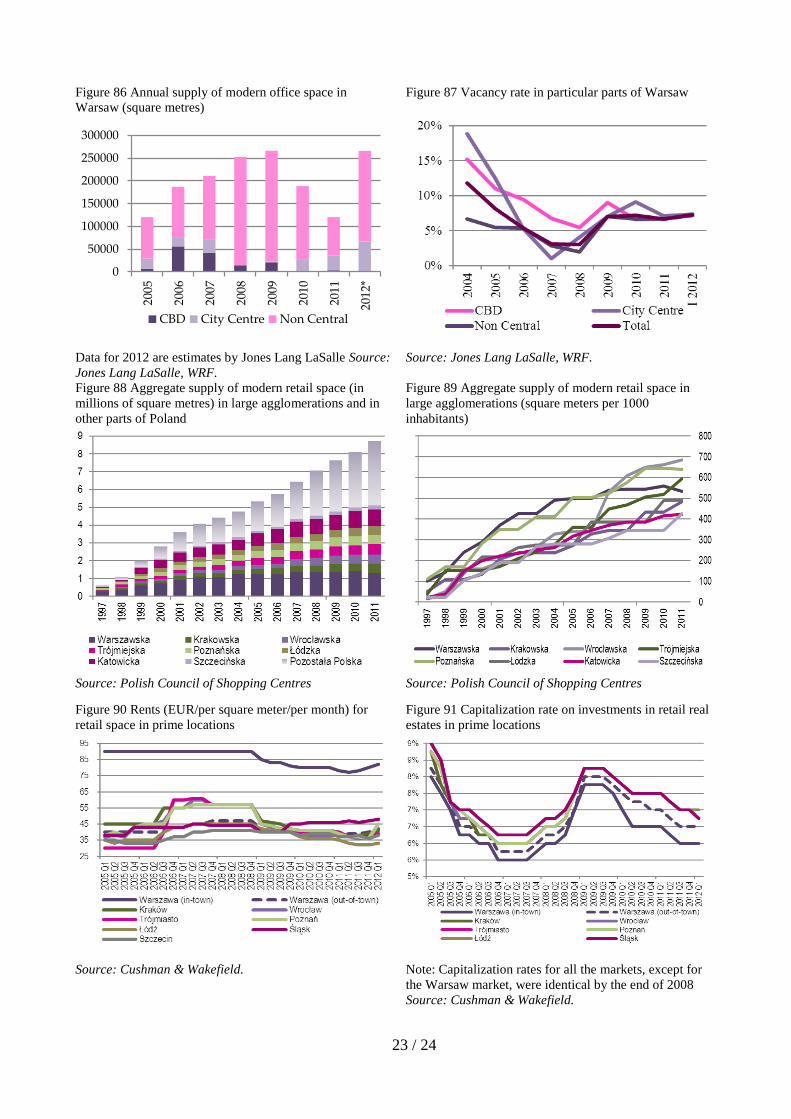
The situation in the office market did not change significantly (see Figure 82 - Figure 85).
Growth in office space in Warsaw in 2012 Q1 amounted to 50 thousand square meters. As
expected by Jones Lang LaSalle, in the entire 2012 the total of 250 thousand square meters of
office space will be completed and put on the Warsaw market. The vacancy rate remains stable
(see Figure 86 - Figure 87). According to the Cushman & Wakefield7 report, preliminary lease
contracts have already been signed for a certain part of completed office space in Warsaw. At the
same time, analysts point out that much of the built space is speculative in nature, that is, not
secured by lease contracts. In view of the sluggish economic activity, namely limited growth in
demand, it may boost the vacancy rate in the future. Rents in all markets remained stable, and
increased slightly in Warsaw's CBD. According to the CBRE report, more than 1 million square
meters of office space is under construction in Poland, of which 650 thousand square meters in
Warsaw alone.
In the modern retail market, 2012 Q1 saw a slight, amounting to approx. 90 thousand
square meters, increase in the size of retail space, which was located mainly outside large
agglomerations, especially in cities and towns below 100 thousand inhabitants. According to the
Colliers International report8, shopping malls scheduled to open in 2012 will be rather small (10-
30 thousand square meters). The market saw the continuation of the trend already started in 2011,
which may result from the fact that market participants observe some level of market saturation in
large cities and metropolitan areas (see DTZ report9). In the absence of direct competition, and
low prices of land in smaller cities, investors are more willing to take risks and invest in cities
where they can not necessarily reckon with wealthy clients and which are strongly dependent on
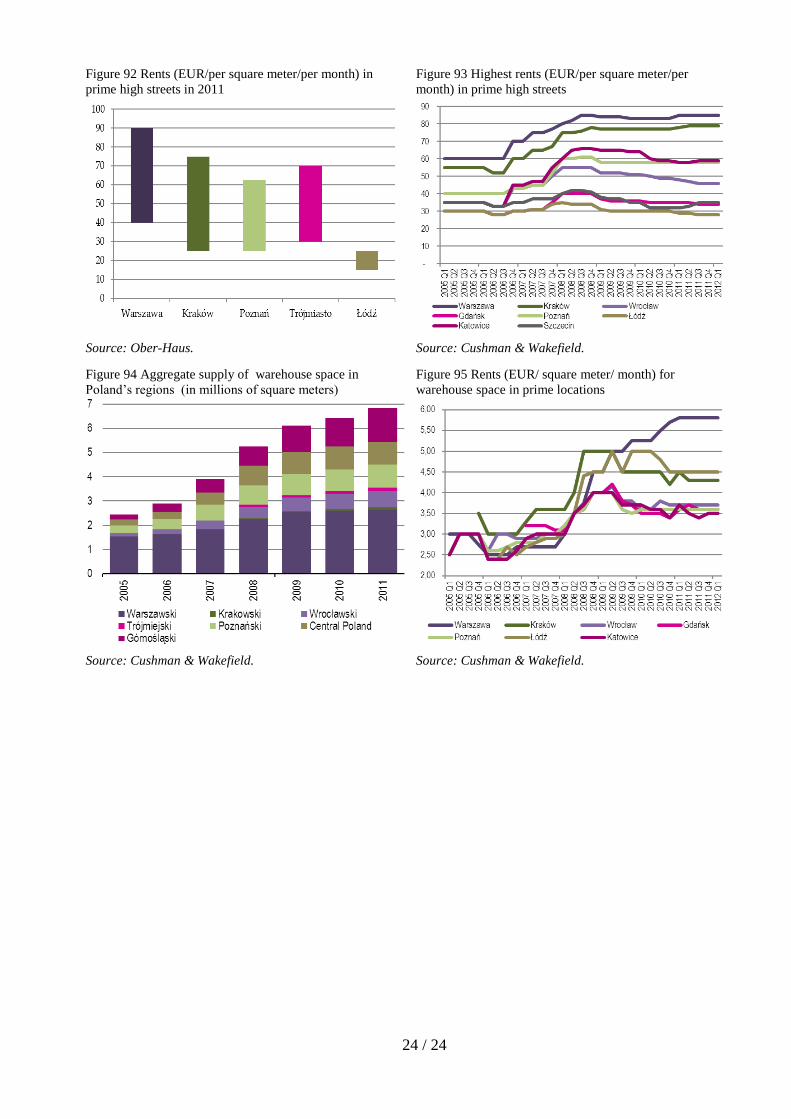
the economic situation. Since the second half of 2011, rents per square meter of retail space in
prime locations remained stable (see Figure 88 - Figure 89). In 2012 Q1, the capitalization rate
was further reduced (see Figure 91). Rents in the main streets in 2012 Q1 remained at the levels
observed since mid-2011, whereas rents in Łódź and Wrocław, which from the beginning of 2009
followed a slight downward trend, levelled off. The highest rents varied considerably across cities.
There were also major differences in rents between various shopping malls in those cities (see
Figure 92 and Figure 93).
The warehouse market in 2012 Q1 recorded growth in warehouse space by 215 thousand
square meters. According to the CBRE report10
, this accounts for 60% of the total warehouse
space completed in 2011. Yet, allowance should be made for the base effect, since, a result of the
crisis, warehousing space completed and put on the market in the years 2010 and 2011 was
considerably below the 2007-2009 level. Most of warehousing space (65%) was built-to-suit,
which greatly facilitated solicitation of new tenants. As expected by Cushman & Wakefield11
new
warehouse space supply in the whole of 2012 will be moderate. In the majority of markets, rents
for warehouse space remain stable (see Figure 94 and Figure 95).
7 Cushman & Wakefield „Marketbeat Office Snapshot Poland – Q1 2012”.
8 Collier International “Real Estate Review – 2012 Q1 – Commercial Market”
9 DTZ Property Times “Poland – Shopping centres in medium-sized cities. Steady growth of interest”, December
2011 10
CBRE “MarketView Warsaw & Poland Property 2012 Q1”. 11
Cushman & Wakefield „Marketbeat Industrial Snapshot Poland – Q1 2012”.
6 / 24
Appendix
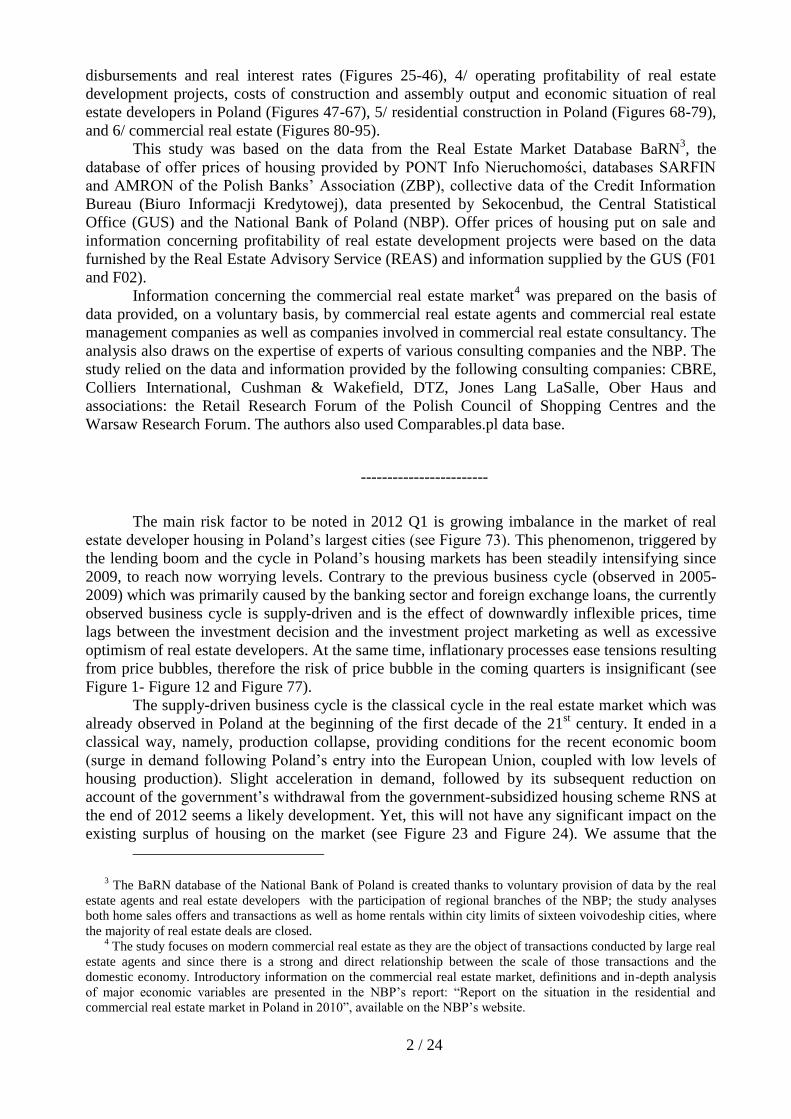
1. Offer, transaction and hedonic12
prices of housing, primary market and secondary
market Figure 1 Offer prices per square meter of housing –
primary market
Figure 2 Offer prices per square meter of housing as per
new contracts– primary market
Source: PONT Info Nieruchomości. Source: REAS.
Figure 3 Offer prices per square meter of housing –
secondary market
Figure 4 Weighted average*/ price per square meter of
housing and CPI-deflated price (2006 Q3 =100) – primary
market, transaction
Source: PONT Info Nieruchomości. */ Price weighted with the share of housing in the housing
stock;
Source: NBP.
7 cities: Warsaw, Cracow, Poznań, Wrocław, Łódź, Gdańsk, Gdynia;
10 cities: Białystok, Bydgoszcz, Kielce, Katowice, Lublin, Olsztyn, Opole, Rzeszów, Szczecin, Zielona Góra;
12 The hedonic price index is a measure reflecting the price change resulting from factors other than differences in
housing quality. The index accounts for changes in the quality of housing in the empirical samples in each period.
4 000
5 000
6 000
7 000
8 000
9 000
10 000
11 000
Q1
20
07
Q2
20
07
Q3
20
07
Q4
20
07
Q1
20
08
Q2
20
08
Q3
20
08
Q4
20
08
Q1
20
09
Q2
20
09
Q3
20
09
Q4
20
09
Q1
20
10
Q2
20
10
Q3
20
10
Q4
20
10
Q1
20
11
Q2
20
11
Q3
20
11
Q4
20
11
Q1
20
12
PL
N/m
2
Warszawa Kraków Trójmiasto
Poznań Wrocław Łódź

7 / 24
Figure 5 Transaction prices per square meter of housing –
primary market
Figure 6 Transaction prices per square meter of housing –
secondary market
Source: NBP. Source: NBP.
Figure 7 Average transaction price per square meter of
housing, and price adjusted with the hedonic index 12/
–
secondary market
Figure 8 Average transaction price per square meter of
housing, and price adjusted with the hedonic index12/
–
secondary market
Source: NBP. Source: NBP.
Figure 9 Growth (y/y) in average prices per square meter of
housing – primary market, offers and transactions
Figure 10 Growth (y/y) in average prices per square meter
of housing – secondary market, offers and transactions
7 cities: Warsaw, Cracow, Poznań, Wrocław, Łódź, Gdańsk, Gdynia;
10 cities: Białystok, Bydgoszcz, Kielce, Katowice, Lublin, Olsztyn, Opole, Rzeszów, Szczecin, Zielona Góra;
Source: NBP (transactions), PONT Info Nieruchomości
(offers).
Source: NBP (transactions), PONT Info Nieruchomości
(offers).

8 / 24
Figure 11 Average weighted*/ price per square meter of
housing – primary market, transactions
Figure 12 Average weighted*/ price per square meter of
housing and hedonic price – existing stock, transactions
Note: */ Price weighted with the share of housing in the housing stock;
Source: NBP.
3000
4000
5000
6000
7000
8000
9000
10000
200
7 Q
1
200
7 Q
2
200
7 Q
3
200
7 Q
4
200
8 Q
1
200
8 Q
2
200
8 Q
3
200
8 Q
4
200
9 Q
1
200
9 Q
2
200
9 Q
3
200
9 Q
4
201
0 Q
1
201
0 Q
2
201
0 Q
3
201
0 Q
4
201
1 Q
1
201
1 Q
2
201
1 Q
3
201
1 Q
4
201
2 Q
1
PL
N/m
2
Warszawa 7 cities 10 cities
3000
4000
5000
6000
7000
8000
9000
10000
200
7 Q
1
200
7 Q
2
200
7 Q
3
200
7 Q
4
200
8 Q
1
200
8 Q
2
200
8 Q
3
200
8 Q
4
200
9 Q
1
200
9 Q
2
200
9 Q
3
200
9 Q
4
201
0 Q
1
201
0 Q
2
201
0 Q
3
201
0 Q
4
201
1 Q
1
201
1 Q
2
201
1 Q
3
201
1 Q
4
201
2 Q
1
PL
N/m
2
Warszawa 7 cities 10 cities
Warszawa hed. 7 cities hed. 10 cities hed.
9 / 24
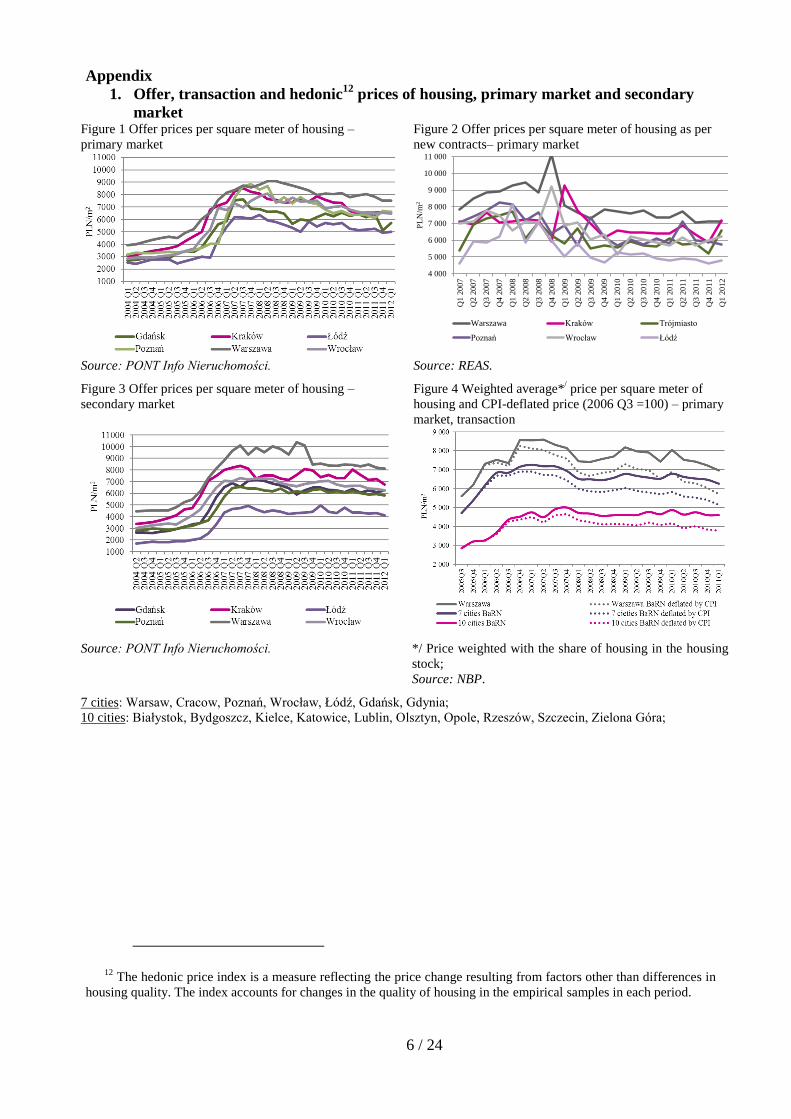
2. Housing availability, loan availability, availability of loan-financed housing
Figure 13 Housing availability in terms of a square
meter of housing for an average wage in the enterprise
sector
Figure 14 Costs of PLN housing loans for consumer as
deflated with CPI or wage growth
Housing availability – a measure of the potential ability to purchase housing space at offer prices for an average
monthly wage in the enterprise sector; it expresses the number of square metres of housing with an average offer
price in a particular market (PONT Info) , that can be purchased for an average wage in the enterprise sector in a
particular city (GUS);
Source: NBP, GUS, PONT Info Nieruchomości. Source: NBP, GUS, PONT Info Nieruchomości.
Figure 15 Available housing loan in PLN (in number of
average wage in the enterprises sector)
Figure 16 Availability of loan-financed housing per
square meter of housing (in the case of PLN loan)
Availability of loan-financed housing – a measure, specifying how many square metres of housing may be
purchased at an average offer price in a particular market (PONT Info), for a housing loan obtained basing on an
average monthly wage in the enterprises sector in a particular market (GUS), in view of bank’s lending requirements
and loan parameters (interest rate, depreciation period, social minimum understood as the minimum income
after payment of loan instalments). The pace of changes of the index and differences between particular markets
provide important information.
Source: NBP, GUS, PONT Info Nieruchomości. Source: NBP, GUS, PONT Info Nieruchomości.

10 / 24
Figure 17 Available housing loans in CHF (in PLN
thousand)
Figure 18 Availability of loan-financed housing per 1
square meter of housing (in the case of CHF-
denominated loan)
Source: NBP, GUS, PONT Info Nieruchomości. Source: NBP, GUS, PONT Info Nieruchomości.
Figure 19 Available housing loans in EUR(in PLN
thousand
Figure 20 Availability of loan-financed housing per 1
square meter of housing (in the case of EUR-
denominated loan)
Source: NBP, GUS, PONT Info Nieruchomości. Source: NBP, GUS, PONT Info Nieruchomości.
Figure 21 Available weighted housing loans 13/
(in PLN
thousand)
Figure 22 Availability of loan-financed housing per
square meter of housing (in the case of weighted
loans13/
)
13/
Loans weighted with FX structure of the quarterly increase in housing loans to individuals;
Source: NBP, GUS, PONT Info Nieruchomości.
Source: NBP, GUS, PONT Info Nieruchomości.
11 / 24
Figure 23 Gap between the limits under the government-
subsidized housing scheme RNS and the median
transaction price in six cities – primary market
Figure 24 Loan disbursements under the government-
subsidized housing scheme RNS
Source: NBP, BGK. Source: BGK.
12 / 24
3. Disbursement of housing loans, interest rates
Figure 25 Structure of loans in the banking sector
Figure 26 Structure of deposits in the banking sector
Source: NBP. Source: NBP
Figure 27 Banking sector funding gap in Poland (actual
situation in PLN million)
Figure 28 Banking sector funding gap in Poland
(quarter-on-quarter changes in PLN million)
*/ Households and enterprises
Source: NBP.
Source: NBP
Figure 29 Quarter-on-quarter increases in housing loan
receivables from individuals in FX adjusted terms (in
PLN million)
Figure 30 Currency structure of quarter-on-quarter
increases in housing loan receivables from individuals in
FX adjusted terms (in PLN million)
Source: NBP. Source: NBP.

13 / 24
Figure 31 Geographical breakdown of new housing
loans in Poland, in the first quarters
Figure 32 New housing loans in Poland’s six largest
cities, in the first quarters
Note: BIK data do not cover the total of housing loans
6 cities: Warsaw, Cracow, Poznań, Wrocław, Łódź,
Gdańsk;
10 cities: Białystok, Bydgoszcz, Kielce, Katowice,
Lublin, Olsztyn, Opole, Rzeszów, Szczecin, Zielona
Góra;
Source: NBP based on BIK data.
Source: NBP based on BIK data.
Figure 33 Structure of housing loan receivables from
individuals (in %)
Figure 34 New housing loans in terms of values and
quantities, quarter-on-quarter changes (in PLN billion)
Source: NBP. Source: ZBP.
Figure 35 Interest rates in the financial market in Poland
Figure 36 Interest rates on housing loans to households
in Poland
Source: NBP. Source: NBP.
14 / 24
Figure 37 Nominal interest rates on household deposits
in Poland
Figure 38 Real*/
interest rates on household deposits in
Poland
Source: NBP. */ net of tax on capital gains, CPI deflated
Figure 39 Bank margins (to WIBOR, LIBOR,
EURIBOR 3M) on new housing loans
Figure 40 New housing loan risk assessment*/
by banks
Bank margin is the difference between housing loan rate (NBP) and LIBOR3MCHF rate, LIBOR3MEUR rate or
WIBOR3M rate; */
Risk assessment: for PLN denominated loans (PLN housing loan rate minus Treasury bond rate 10L), for CHF –
denominated loans (CHF loan rate minus PLN loan risk assessment minus LIBOR3MCHF), for EUR denominated
loans (EUR loan rate minus PLN loan risk assessment minus LIBOR3MEUR);
Source: NBP. Source: NBP.
Figure 41 Theoretical credit risk and its actual level and
the share of outstanding loans
Figure 42 FX risk premium and its actual level
Source: NBP. Source: NBP.
0,0
0,1
0,2
0,3
0,4
0,5
0,6
-1,0%
-0,5%
0,0%
0,5%
1,0%
1,5%
200
4 Q
1
200
5 Q
1
200
6 Q
1
200
7 Q
1
200
8 Q
1
200
9 Q
1
201
0 Q
1
201
1 Q
1
201
2 Q
1
curr
ency
ten
sio
ns
bo
nus
for
curr
ency
ris
k
bonus for credit risk (EUR) bonus for credit risk (CHF)
bonus for credit risk (weighted average) CHF / PLN (right hand axis)
EUR / PLN (right hand axis) weighted currency*/ /PLN (right hand axis)
15 / 24
Figure 43 Quality 14/
of housing loan portfolio in Poland’s
six cities in Q4
Figure 44 Estimated banks’ return on FX loans granted
and repaid in Poland 15/
14/
Percentage share of substandard/non-performing
housing loans (i.e. in arrears for 91-180 days) in the total
of housing loans of a particular city and the average
level for the six cities; up-to-date data as at the end of
first quarters;
*/ average weighted with the city’s share in loan
increase;
15/Income on FX transactions is calculated as follows.
New FX loans are disbursed in PLN. It has been
assumed that an average FX spread amounts to 6%
which means that the bank charges 3% on each FX
transaction. Likewise, when the client pays subsequent
foreign currency loan instalments, FX transactions take
place, and the bank charges additional 3% on this
amount. Rate of return is calculated as the ratio of
income on FX transactions to the whole loan portfolio,
i.e. composed of PLN and foreign currency loans.
Repayment of loan instalments has been calculated with
the use of fixed instalments, under the assumption of a
20-year lending period;
Source: NBP based on BIK data.
Source: NBP, AMRON.
Figure 45 Estimated banks’ return on housing loans, in
PLN in Poland */
Figure 46 Estimated banks’ return on housing loans in
foreign currencies in Poland */
*// Income and costs related to housing loan portfolio. Estimated ROE* (Return on Equity) is calculated as the
adjusted interest margin on housing loans with respect to the minimum own capital required. The minimum own
capital requirement is assessed on the basis on the LTV estimate derived from AMRON data and capital requirement
for housing loans as set by the Polish Financial Supervisory Authority (KNF). The adjusted interest margin is the
result of all income being added and all costs being deducted. Closing of foreign currency position and effective
interest rate on loans bases on NBP calculations. The effective funding cost was computed based on WIBOR and
LIBOR rates through adding the estimative costs of this operation.
Source: NBP, AMRON.
16 / 24
4. Operating rate of return on housing and real estate development projects, costs of
construction and assembly production and economic situation of real estate
developers in Poland
Figure 47 Cost structure and transaction price of 1 square
meter of housing in the primary market in constant prices
Figure 48 Real-terms growth in the prices of selected
housing production factors (December 2005 =100)
Source: NBP based on Sekocenbud, GUS. Source: NBP based on Sekocenbud, GUS.
Figure 49 Share of direct construction costs per square
meter of the residential building’s usable area (type 1121
building16/
) in a transaction price – primary market
Figure 50 Share of real estate developer’s return in the
price per square meter of the residential building’s usable
area (type 1121 building16/
) in a transaction price –
primary market
16/
Building (type 1121) monitored by the NBP since the second half of 2004 as an average residential multi-family five-
storey building with an underground parking space and retail premises on the ground-floor; traditional construction (over-
ground part made from ceramic bricks); for the sake of convenience, it has been assumed that construction costs of 1
square meter of parking space and retail space are close to the costs of housing sold in shell condition; real price of 1
square meter of housing, based on construction costs, depends on the share of outer space [building common area],
different for various building; when calculating the price of 1 square meter of usable housing area to be paid by consumer,
we have assumed a 20% share of outer space [building common area] with respect to housing area and by this figure we
have adjusted upward the price of 1 square meter of housing.
Source: NBP based on Sekocenbud. Source: NBP based on Sekocenbud.

17 / 24
Figure 51 Warsaw- structure of price per square meter of
housing usable area (type 1121 building16/
) to be paid by
consumer
Figure 52 Cracow- structure of price per square meter of
housing usable area (type 1121 building16/
) to be paid by
consumer
17/In the legend to Figures 51-56 – aggregate gross profit of real estate developers (for the whole investment period) do not
account for investment risk provisions;
Note : data in Figure 51-56 since 2008 Q2 are presented in quarter-on-quarter terms, previously annualized data;
Source: NBP based on Sekocenbud, REAS.
Source: NBP based on Sekocenbud, REAS.
Figure 53 Gdańsk - structure of price per square meter of
housing usable area (type 1121 building 16/
) to be paid by
consumer
Figure 54 Poznań - structure of price per square meter of
housing usable area (type 1121 building 16/
) to be paid by
consumer
Source: NBP based on Sekocenbud, REAS. Source: NBP based on Sekocenbud, REAS.
Figure 55 Wrocław - structure of price per square meter of
housing usable area (type 1121 building 16/
) to be paid by
consumer
Figure 56 Łódź - structure of price per square meter of
housing usable area (type 1121 building 16/
) to be paid by
consumer
Source: NBP based on Sekocenbud, REAS. Source: NBP based on Sekocenbud, REAS.

18 / 24
Figure 57 Expected changes in the price of construction and
assembly production and growth in the costs of
construction of the residential building’s usable area (type
1121 building 16/
)
Figure 58 Cost of construction of square meter of the
residential building’s usable area (type 1121 building 16/
)
Source: NBP based on data published by the GUS (business
conditions survey), Sekocenbud.
Source: NBP based on Sekocenbud.
Figure 59 Costs incurred by a typical large real estate
development company (DF) 18/
in Q3
Figure 60 Share of own costs in the costs incurred by a
large real estate development company (DF) 18/
and the share
of real estate developer’s return in the price per square
meter of housing in the primary market
18/
According to the GUS, a large company employs on
average more than 50 persons;
Source: NBP based on GUS (F01).
Source: NBP based on GUS and Sekocenbud data.
Figure 61 Economic indicators of a typical large real estate
company18/
in the first quarters
Figure 62 Situation of a typical large real estate development
company18/
in the first quarters
Source: NBP based on GUS data (F01). Source: NBP based on GUS data (F01).
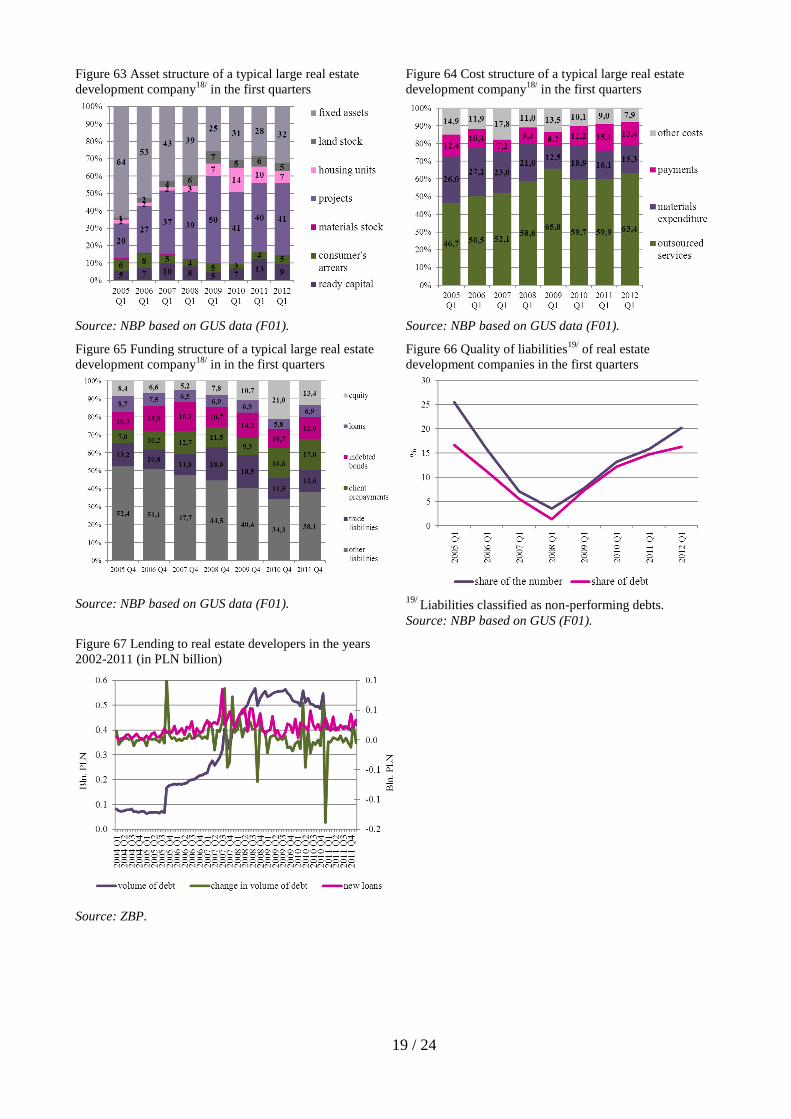
19 / 24
Figure 63 Asset structure of a typical large real estate
development company18/
in the first quarters
Figure 64 Cost structure of a typical large real estate
development company18/
in the first quarters
Source: NBP based on GUS data (F01). Source: NBP based on GUS data (F01).
Figure 65 Funding structure of a typical large real estate
development company18/
in in the first quarters
Figure 66 Quality of liabilities19/
of real estate
development companies in the first quarters
Source: NBP based on GUS data (F01). 19/
Liabilities classified as non-performing debts.
Source: NBP based on GUS (F01).
Figure 67 Lending to real estate developers in the years
2002-2011 (in PLN billion)
Source: ZBP.

20 / 24
5. Residential construction and housing market in Poland in selected cities
Figure 68 Poland – ownership structure of residential
construction in the first quarters in 2011 and 2012
Figure 69 Poland – completed housing in the first
quarters
Source: GUS. Source: GUS.
Figure 70 Poland – housing units under construction in the
first quarters
Figure 71 Poland – permits issued for housing
construction in the first quarters
Source: GUS. Source: GUS.
Figure 72 Housing market indicator20/
in Poland and in
Poland’s six largest cities */
(housing under construction
minus completed and sold housing)
Figure 73 Number of housing units put on the market,
both sold and offered for sale in Poland’s six largest
markets*/
20/
The index is a 12-month rolling number of dwellings;
*/Poland’s six largest cities: Warsaw, Cracow, Gdańsk,
Łódź, Poznań, Wrocław;
*/Poland’s six largest markets: Warsaw, Cracow,
Gdańsk- Sopot-Gdynia agglomeration, Wrocław,
Poznań, Łódź;
Source: NBP based on PABB and GUS.
Source: REAS.
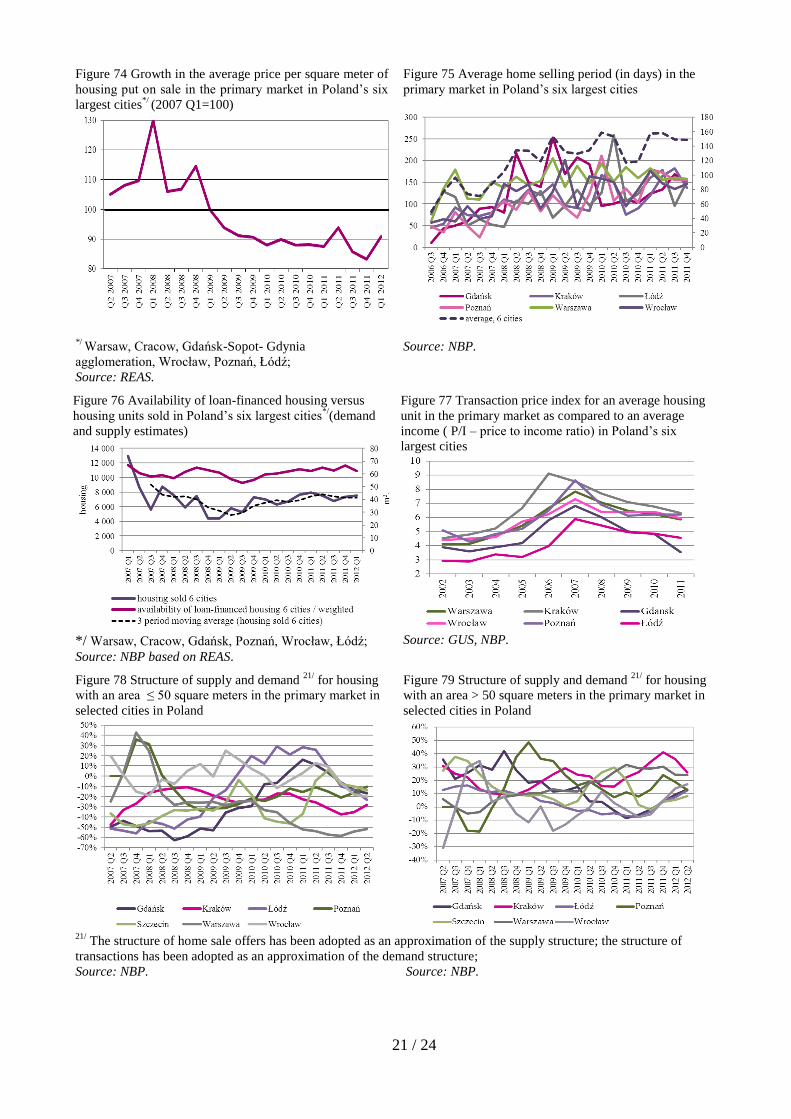
21 / 24
Figure 74 Growth in the average price per square meter of
housing put on sale in the primary market in Poland’s six
largest cities*/
(2007 Q1=100)
Figure 75 Average home selling period (in days) in the
primary market in Poland’s six largest cities
*/
Warsaw, Cracow, Gdańsk-Sopot- Gdynia
agglomeration, Wrocław, Poznań, Łódź;
Source: REAS.
Source: NBP.
Figure 76 Availability of loan-financed housing versus
housing units sold in Poland’s six largest cities*/
(demand
and supply estimates)
Figure 77 Transaction price index for an average housing
unit in the primary market as compared to an average
income ( P/I – price to income ratio) in Poland’s six
largest cities
*/ Warsaw, Cracow, Gdańsk, Poznań, Wrocław, Łódź;
Source: NBP based on REAS.
Source: GUS, NBP.
Figure 78 Structure of supply and demand 21/
for housing
with an area ≤ 50 square meters in the primary market in
selected cities in Poland
Figure 79 Structure of supply and demand 21/
for housing
with an area > 50 square meters in the primary market in
selected cities in Poland
21/
The structure of home sale offers has been adopted as an approximation of the supply structure; the structure of
transactions has been adopted as an approximation of the demand structure;
Source: NBP. Source: NBP.
22 / 24
6. Commercial real estate
Figure 80 Value of investment transactions (EUR million)
Figure 81 Capitalization rate on investments in
commercial real estate in prime location
Note: The Q12012 data are estimations.
Source: Cushman & Wakefield.
Note: The 2012 data are estimations.
Source: DTZ.
Figure 82 Aggregate supply of modern office space (in
millions square meters)
Figure 83 Office space vacancy rate in 6-month periods
Note: The 2012 data are estimative data.
Source: DTZ.
Source: DTZ.
Figure 84 Rents (EUR/per square meters/per month) for
office space in prime locations
Figure 85 Capitalization rate on investments in modern
office space in prime locations
Source: Cushman & Wakefield. Source: Cushman & Wakefield.
0%
5%
10%
15%
20%
25%H
2 2
00
6
H1
200
7
H2
200
7
H1
200
8
H2
200
8
H1
200
9
H2
200
9
H1
201
0
H2
201
0
H1
201
1
H2
201
1
Warszawa Kraków Wrocław Trójmiasto
Poznań Łódź Katowice
23 / 24
Figure 86 Annual supply of modern office space in
Warsaw (square metres)
Figure 87 Vacancy rate in particular parts of Warsaw
Data for 2012 are estimates by Jones Lang LaSalle Source:
Jones Lang LaSalle, WRF.
Source: Jones Lang LaSalle, WRF.
Figure 88 Aggregate supply of modern retail space (in
millions of square metres) in large agglomerations and in
other parts of Poland
Figure 89 Aggregate supply of modern retail space in
large agglomerations (square meters per 1000
inhabitants)
Source: Polish Council of Shopping Centres Source: Polish Council of Shopping Centres
Figure 90 Rents (EUR/per square meter/per month) for
retail space in prime locations
Figure 91 Capitalization rate on investments in retail real
estates in prime locations
Source: Cushman & Wakefield. Note: Capitalization rates for all the markets, except for
the Warsaw market, were identical by the end of 2008
Source: Cushman & Wakefield.
0
50000
100000
150000
200000
250000
30000020
05
2006
2007
2008
2009
2010
2011
2012
*
CBD City Centre Non Central
24 / 24
Figure 92 Rents (EUR/per square meter/per month) in
prime high streets in 2011
Figure 93 Highest rents (EUR/per square meter/per
month) in prime high streets
Source: Ober-Haus. Source: Cushman & Wakefield.
Figure 94 Aggregate supply of warehouse space in
Poland’s regions (in millions of square meters)
Figure 95 Rents (EUR/ square meter/ month) for
warehouse space in prime locations
Source: Cushman & Wakefield. Source: Cushman & Wakefield.


![D -04.00.00 Podbudowa - bip.borekwlkp.plbip.borekwlkp.pl/files/1377/d_-04.00.00_podbudowa.pdf · kruszyw stabilizowanych mechanicznie wg PN-S-06102 [21] i obejmuj ą ST: D-04.04.04](https://static.fdocuments.pl/doc/165x107/5c7925eb09d3f200208c1d4d/d-040000-podbudowa-bip-kruszyw-stabilizowanych-mechanicznie-wg-pn-s-06102.jpg)


![County Mayo · 2020. 6. 11. · MAYO COUNTY COUNCIL SPECIAL SPEED LIMIT BYE-LAWS 2017 [Housing Estates] Mayo County Council in exercise of the powers conferred on them by Section](https://static.fdocuments.pl/doc/165x107/60db73804aae3420d96813d7/county-mayo-2020-6-11-mayo-county-council-special-speed-limit-bye-laws-2017.jpg)