Turystyka zeszyt 3 wer 1 - WZiEU · 1 Za: S. Kauf, Koncepcja marketingu jako determinanta wzrostu...
177
UNIWERSYTET SZCZECI Ń SKI ZESZYTY NAUKOWE NR 592 EKONOMICZNE PROBLEMY TURYSTYKI NR 14 POTENTIAL OF TOURISM POTENCJAŁ TURYSTYCZNY SZCZECIN 2010
-
Upload
trinhtuyen -
Category
Documents
-
view
213 -
download
0
Transcript of Turystyka zeszyt 3 wer 1 - WZiEU · 1 Za: S. Kauf, Koncepcja marketingu jako determinanta wzrostu...
U N I W E R S Y T E T S Z C Z E C IŃS K I
ZESZYTY NAUKOWE NR 592
EKONOMICZNE PROBLEMY TURYSTYKI NR 14
POTENTIAL OF TOURISM
POTENCJAŁ TURYSTYCZNY
SZCZECIN 2010

Rada Wydawnicza Urszula Chęcińska, Inga Iwasiów, Danuta Kopycińska, Izabela Kowalska-Paszt
Piotr Niedzielski, Ewa Szuszkiewicz, Dariusz Wysocki Edward Włodarczyk – przewodniczący Rady Wydawniczej
Aleksander Panasiuk – przewodniczący Senackiej Komisji ds. Wydawnictw Edyta Łongiewska-Wijas – redaktor naczelna Wydawnictwa Naukowego
Recenzenci Barbara Marciszewska, Beata Meyer, Aleksander Panasiuk, Jan Sikora
Rada Naukowa Stefan Bosiacki – AWF Poznań, Jerzy Gospodarek – SGH Warszawa,
Alexandru Ilies – Uniwersytet Oradea, Irena Jędrzejczyk – SGGW Warszawa, Barbara Marciszewska – AWFiS Gdańsk, Beata Meyer – Uniwersytet Szczeciński,
Agnieszka Niezgoda – UE Poznań, Aleksander Panasiuk – Uniwersytet Szczeciński – przewodniczący,
Andrzej Rapacz – UE Wrocław, Maija Rozite – Business and Administration School Turiba, Jacek Ruszkowski – WSZMiJO Katowice, Jan Sikora – UE Poznań,
Antoni Szreder – WHSZ Słupsk, Jerzy Wyrzykowski – Uniwersytet Wrocławski, Dawid Milewski – Uniwersytet Szczeciński – sekretarz
Redaktor naukowy Beata Meyer, Aleksander Panasiuk
Sekretarz naukowy Dawid Milewski
Redaktor
Iwona Milewska
Korektor Natalia Walińska
Skład komputerowy Maciej Czaplewski
Piotr Ładny
Projekt okładki Paweł Kozioł
Copyright by Uniwersytet Szczeciński, Szczecin 2010
Publikacja finansowana ze środków Wydziału Zarządzania i Ekonomiki Usług Uniwersytetu Szczecińskiego
ISSN 1640-6818 ISSN 1644-0501
WYDAWNICTWO NAUKOWE UNIWERSYTETU SZCZECIŃSKIEGO
Wydanie I. Ark. wyd. 8,5. Ark. druk. 11,1. Format B5. Nakład 150 egz.

SPIS TREŚCI
INTRODUCTION .................................................................................................... 5
WSTĘP ..................................................................................................................... 7
EMILIA BAREJ
IDENTYFIKACJA PODSTAWOWYCH CZYNNIKÓW ROZWOJU KONKURENCYJNOŚCI MIAST ........................................................................... 9
KRESHNIK BELLO, ARLINDA HOTI, JONIDA KELLEZI
THE GLOBAL FINANCIAL CRISES IMPACT ON THE TOURISM INDUSTRY IN ALBANIA AND ITS FUTURE TREND ..................................... 19
NERINE BRESLER
THE TOURISM DEVELOPMENT POTENTIAL OF A MEGA SPORT EVENT: 2010 FIFA WORLD CUP ....................................................................... 29
AGITA DONIŅA
TOURISM CLUSTERS AS A BENEFIT FOR TOURISM ENTREPRENEURS IN LATVIA ............................................................................................................ 43
ANDRIS KLEPERS
PROBLEMS OF CREATING MICRO-CLUSTERS IN SMALL-SCALE TOURISM DESTINATIONS ................................................................................ 51
RIDVAN KOZAK, MEDET YOLAL
EFFECTIVENESS OF DOMAIN NAMES: AN ANALYSIS OF THE COUNTRY DESTINATION WEB SITES ................................................... 61
IRENEUSZ MARGANIEC
TRENDY W OBSŁUDZE PODRÓŻNYCH ZWIĄZANE Z KRYZYSEM GOSPODARCZYM ORAZ WYZWANIA, JAKIE STOJĄ PRZED BRANŻĄ TURYSTYCZNĄ I KADRĄ ZWIĄZANĄ Z TURYSTYKĄ............................... 69
PETER MAYER, ADAM PAWLICZ
FINANCING TOURIST INFORMATION SERVICE. COMPARATIVE STUDY OF WEST POMERANIA PROVINCE, POLAND AND LAKE BALATON, HUNGARY ....................................................................................... 89
AMANDA MIEZE
NEGLECTED USE OF CREATIVE INDUSTRY’S PRODUCTS IN RIGA’S TOURISM OFFER ............................................................................................... 101
ALEKSANDER PANASIUK
PERSONNEL AS A DETERMINANT OF SHAPING INNOVATIVENESS OF REGIONAL TOURISM ECONOMY ............................................................ 111

Spis treści 4
MARGARITA PLATACE
SERVICE VALUE IN HOSPITALITY INDUSTRY .......................................... 123
MAIJA ROZITE, JURIS OZOLS, DAINA VINKLERE
QUALITY ASPECTS AND ASSESSMENT OF RURAL TOURISM ENTERPRISES OF LATVIA .............................................................................. 133
JOANNA JULIA SIENKIEWICZ
POTENCJAŁ TURYSTYCZNY JAKO OBSZAR BADAWCZY NAUK EKONOMICZNYCH ........................................................................................... 141
ADAM R. SZROMEK
WSPÓŁCZYNNIK Α-CRONBACHA W BADANIACH ZJAWISK TURYSTYCZNYCH ........................................................................................... 153
JĒKABS TRUŠIŅS, EDVĪNS BUKA
PRECONDITIONS AND PROBLEMS OF CREATING THE RECREATION AND TOURISM SPATIAL SYSTEM IN LATVIA ........................................... 163
WOJCIECH WIESNER, JACEK GROBELNY, PIOTR ZARZYCKI
EDUKACJA TURYSTYCZNA STUDENTÓW AWF WE WROCŁAWIU – REFLEKSJE PEDAGOGICZNE ...................................................................... 169

INTRODUCTION This Scientific Journal constitutes one of three volumes of conference mate-rials prepared for the Sixth Scientific Conference organized by the Chair of Tour-ism Management of University of Szczecin. The conference “Potential of Tourism” is held on 19-21 May 2010 in Międzyzdroje, Poland. The hereby presented journal consists of varied articles, mainly from foreign conference participants that cover different aspects of tourism economy. The contribution of Latvian, Albanian, Hungarian, Turkish and South African authors enabled the conference to gain an international dimension. Thus, the discus-sion of theoretical and practical issues of potential of tourism has been expanded and covers not only the experience of Polish scientists but also those coming from other, sometimes non-European countries. The organizers of the conference wish to thank the representatives of varied universities for the scientific interest on the publication in our scientific journal and participating in the conference. Special word of thanks is directed to the Reviewers of articles especially to Prof. Maija Rozite from School of Business Administration Turiba and to Alexandru Ilies from Oradea University in Romania. We believe that the discussions held during the conference will increase rela-tively little known and disseminated issues of tourist potential and thus will provide a practical contribution to the shape of the interdisciplinary study of tourism.
Aleksander Panasiuk

WSTĘP Niniejszy Zeszyt Naukowy jest jednym z trzech tomów materiałów konferen-cyjnych przygotowanych na VI Konferencję Naukową pt. „Potencjał turystyczny”, organizowaną przez Katedrę Zarządzania Turystyką Uniwersytetu Szczecińskiego w dniach 19-21 maja 2010 roku w Międzyzdrojach. W niniejszym zbiorze zostały zamieszczone teksty o zróżnicowanej tematyce, głównie artykuły zagranicznych uczestników konferencji oraz inne polskich auto-rów, dotyczące bardziej ogólnych obszarów związanych z funkcjonowaniem go-spodarki turystycznej. Dzięki opracowaniom w języku angielskim, przygotowanym przez autorów z zagranicznych ośrodków naukowych: Łotwy, Albanii, Republiki Południowej Afryki i Węgier, ranga tegorocznej konferencji zyskała zasięg międzynarodowy. Tym samym dyskusja nad problematyką teoretyczną i praktyczną potencjału tury-stycznego została rozszerzona nie tylko o doświadczenia polskie, ale także innych krajów, również pozaeuropejskich. Organizatorzy konferencji pragną podziękować przedstawicielom środowiska nauk o turystyce, którzy odpowiedzieli tak dużym zainteresowaniem na ofertę pu-blikacji artykułu i udziału w konferencji. Szczególne słowa podziękowań kierujemy do członków Rady Programowej Konferencji oraz recenzentów artykułów, a zwłaszcza Pani Prof. Maiji Rozite z School of Business Administration Turiba z Rygi na Łotwie i Panu Prof. Alexandru Ilies z Oradea University w Rumunii. Mamy nadzieję i przekonanie, że prowadzone obrady i dyskusje pogłębią stosunkowo mało rozpoznaną i rozpropagowaną problematykę potencjału tury-stycznego, a tym samym będą stanowić konkretny wkład w kształtującą się interdy-scyplinarną naukę o turystyce.
Aleksander Panasiuk


ZESZYTY NAUKOWE UNIWERSYTETU SZCZECIŃSKIEGO NR 592 EKONOMICZNE PROBLEMY TURYSTYKI NR 14 2010
EMILIA BAREJ Zachodniopomorski Uniwersytet Technologiczny w Szczecinie
IDENTYFIKACJA PODSTAWOWYCH CZYNNIKÓW ROZWOJU KONKURENCYJNOŚCI MIAST
Wprowadzenie Ekspansja rynków zbytu oraz nieograniczona mobilność czynników produkcji pomiędzy poszczególnymi krajami spowodowały nie tylko nasilenie się walki kon-kurencyjnej pomiędzy przedsiębiorstwami, ale również regionami miejskimi repre-zentującymi podaż miejsc lokalizacji. W walce tej miasta konkurują o kapitał inwe-stycyjny i o możliwości generowania dochodów1. Rozwój miast opiera się przede wszystkim na wykorzystaniu przewagi konku-rencyjnej tkwiącej w otoczeniu. Konkurencyjność to zdolność do zaspokajania potrzeb na określonym poziomie jakościowym zarówno w stosunku do społeczeń-stwa, jak i podmiotów gospodarczych, przez daną jednostkę samorządową, rozpa-trywana w odniesieniu do innych jednostek samorządowych2. Zmieniające się wa-runki, takie jak m.in. nowy podział administracyjny, spowodowały nasilenie się walki konkurencyjnej pomiędzy poszczególnymi regionami, jak również miastami. Wykorzystując pojęcie konkurencyjności – jako zdolności do osiągania sukcesu w gospodarczej rywalizacji – konkurencję miast można traktować jako ich zdolność do tworzenia w stosunku do innych miast możliwie najkorzystniejszej pozycji ran-kingowej w rozgrywającym się między nimi współzawodnictwie o wspieranie coraz
1 Za: S. Kauf, Koncepcja marketingu jako determinanta wzrostu konkurencyjności miast,
w: Zarządzanie gospodarką miejską i prawne podstawy funkcjonowania miasta, red. J. Słodczyk, Z. Jakubczyk, Wydawnictwo Uniwersytetu Opolskiego, Opole 2002, s. 243–244.
2 B. Filipiak, Polityka finansowa władz samorządowych jako narzędzie podnoszenia kon-kurencyjności miast polskich, w: Konkurencyjność i potencjał rozwoju polskich metropolii – szanse i bariery, red. S. Korenik, K. Szołek, KPZR PAN, Warszawa 2004, s. 67.

Emilia Barej 10
to nowych impulsów rozwojowych3. Potrzeba sprostania wymogom narastającej konkurencji pomiędzy miastami pociąga za sobą konieczność wykorzystania wielu instrumentów, do których zaliczyć należy także instrumenty finansowe, takie jak wydatki na inwestycje oraz promocję. Wykorzystanie finansowych czynników konkurencyjności miast oraz dobór odpowiednich technik i instrumentów zarządza-nia miastem, stała diagnoza sytuacji miasta, jego pozycji wobec innych, mniejszych czy większych ośrodków miejskich wpływają coraz częściej na proces podejmowa-nia decyzji przez inwestorów, przedsiębiorców, turystów czy samych mieszkańców. Celem artykułu jest zbadanie, w jakim stopniu miasta wykorzystują finansowe instrumenty, aby „wypracować” własną markę mającą na celu wyróżnienie się spo-śród konkurencji i zainteresowanie potencjalnych klientów. Do badania przyjęto dwa miasta województwa zachodniopomorskiego – Kołobrzeg i Międzyzdroje, działające w podobnych warunkach geograficzno-społecznych. 1. Promocja miast Istotnym czynnikiem wspierającym pozycję konkurencyjną miast jest promo-cja. Promocja miast nie jest zadaniem własnym władz lokalnych zapisanym w ustawie o samorządzie gminnym oraz w ustawie o samorządzie powiatowym ani nie stanowi zadania zleconego, przekazanego przez administrację centralną. Jednak żaden z aktów prawnych regulujących warunki funkcjonowania władz samorządo-wych nie wyklucza prowadzenia działalności promocyjnej. Promocja jest to kom-pozycja form i sposobów komunikacji miasta ze swoimi klientami w celu zaspoko-jenia ich potrzeb. Dzięki promocji miasta informują otoczenie o swoim istnieniu i właściwościach swoich produktów. Promocja ma na celu takie oddziaływanie na klientów, by za pomocą dostarczenia informacji, argumentacji i obietnic skłonić ich do kupna oferowanych produktów oraz wytwarzania pozytywnej opinii o mieście. Za pomocą promocji w odpowiednim stopniu zwiększa się wiedza odbiorców na temat walorów miast, by doprowadzić do zwiększenia popytu na ich ofertę4. Pro-mocja pociąga za sobą koszty, które należy akceptować, oczekując efektów prze-kraczających wartość nakładów. Dobra kampania promocyjna może przesądzić o wyborze miejsca inwestycji. Promocja to także kształtowanie wizerunku gminy
3 Z. Zioło, Konkurencyjność miast w układach przestrzennych, w: Konkurencyjność miast
i regionów, red. Z. Szymla, Wydawnictwo Akademii Ekonomicznej w Krakowie, Kraków 2001, s. 33.
4 G. Rosa, Promocja jako czynnik kształtowania wizerunku miast i gmin województwa za-chodniopomorskiego, Zeszyty Naukowe US nr 526, WNUS, Szczecin 2009, s. 362.

Identyfikacja podstawowych czynników rozwoju… 11
jako miejsca właściwego dla odpowiednich działań5. Najczęściej stosowanymi technikami prowadzenia promocji miast są:
spotkania przedstawicieli władz z mieszkańcami, strony internetowe, informacje w prasie, udział w targach, konferencjach, seminariach, imprezy promocyjne dla mieszkańców oraz gości, punkty informacyjne o mieście, ogłoszenia w mediach.
W rozważaniach nad promocją warto używać słowa „klient” na oznaczenie każdego, kto wkłada kapitał, pracę, umiejętności w przedsięwzięcia gospodarcze, a także wykorzystuje warunki występujące w danym mieście. Najważniejszą kwe-stią promocji jest to, aby klient mógł uzyskać informacje o walorach lokalnych. Natomiast sama promocja powinna być ściśle podporządkowana określonym ce-lom, zapisanym w ten sposób, aby można je było kontrolować. Potrzeba sprostania wymogom narastającej konkurencji pomiędzy regionami miejskimi pociąga za sobą konieczność stosowania promocji i uwzględnienia jej sposobów w strategiach roz-woju regionu. Przeniesienie idei marketingu (poprzez promocję) na funkcjonowanie miast wymusza konieczność skoncentrowania działań na jak najlepszym zaspoko-jeniu oraz kreowaniu potrzeb i życzeń docelowych grup nabywców. Jedynie takie podejście do problematyki zagwarantuje długotrwałe i sprawne funkcjonowanie miasta oraz zapewni długotrwałą przewagę konkurencyjną, przyczyniając się jed-nocześnie do wzrostu atrakcyjności miasta w oczach klientów6. 2. Inwestycje Rozpatrując aspekt konkurencyjności z punktu widzenia finansów, można zauważyć, że najbardziej konkurencyjne są te jednostki, które inwestują. Wydatki na inwestycje są składnikiem wydatków majątkowych jednostki samorządu teryto-rialnego7. Inwestując, tworzy się nową jakość, która przyciąga klientów i pozwala na rozwój miasta. Finansowanie inwestycji jednostek samorządu terytorialnego należy rozumieć jako pokrycie zapotrzebowania na kapitał, wynikającego z zakresu przyjętych do realizacji zadań. Inwestycje samorządowe to w większości przypad-
5 M. Huczek, Promocja gminy jako sposób wspierania lokalnego rozwoju społeczno-
gospodarczego, Zeszyty Naukowe Wyższej Szkoły Humanitas w Sosnowcu 1/2007, Sosnowiec 2007, s. 109–110.
6 S. Kauf, Koncepcja marketingu jako determinanta wzrostu konkurencyjności miast, w: Zarządzanie gospodarką miejską…, op.cit., s. 247.
7 Do wydatków majątkowych zalicza się również dotacje inwestycyjne udzielane podmio-tom spoza sektora publicznego oraz wydatki kapitałowe.

Emilia Barej 12
ków inwestycje infrastrukturalne, które cechuje wysoka kapitałochłonność, ograni-czona podzielność, długi okres realizacji oraz wysokie koszty, przekraczające moż-liwości finansowe rocznego budżetu. Ich realizacja jest warunkiem wzrostu lokalnej i regionalnej bazy ekonomicznej oraz czynnikiem przyciągającym nowych klien-tów, co w dłuższym okresie prowadzi do wzrostu potencjału dochodowego budżetu (nowe inwestycje to zwiększona baza podatkowa)8. Miasta, przejmując zadania inwestorów i dokonując nakładów w obrębie sektora publicznego, powiększają zasoby umiejscowionych w nich środków trwałych. Inwestycje miast dotyczą przede wszystkim budowy dróg, sieci wodno-kanalizacyjnej, systemów energetyki, urządzeń gospodarki wodnej, szkół, szpitali, obiektów służących różnym formom pomocy społecznej, budynków mieszkalnych. Stopień realizacji inwestycji zależy od możliwości pozyskiwania środków finansowych niezbędnych na ten cel. Jednostki samorządu terytorialnego dysponują szeroką gamą form finansowania przedsięwzięć. Podstawowy podział źródeł finan-sowania inwestycji wyróżnia wewnętrzne oraz zewnętrzne źródła finansowania. Wewnętrzne źródła finansowania stanowią własne środki budżetów gmin, pocho-dzące przede wszystkim z podatków i opłat. Natomiast zewnętrzne źródła finanso-wania inwestycji można podzielić na9:
a. bezzwrotne źródła finansowania, w tym: dotacje, subwencje, fundusze strukturalne UE;
b. zwrotne źródła finansowania, w tym: pożyczki, kredyty (preferencyjne oraz komercyjne), obligacje komunalne;
c. nowe formy finansowania, w tym: partnerstwo publiczno-prywatne, leasing komunalny, faktoring.
Wydatki inwestycyjne zaliczane są do najbardziej efektywnych instrumentów oddziaływania na rozwój gospodarki. Warunkują one rozwój poszczególnych pod-miotów, a także stanowią źródło przewagi konkurencyjnej wobec innych miast. Przedsięwzięcia lokalne są konkretne oraz ogniskują w swoim kształcie i przezna-czeniu kierunki przemian i cele przyjęte do realizacji przez władze lokalne10. Spe-
8 Nowe zarządzanie publiczne w polskim samorządzie terytorialnym, red. A. Zalewski,
SGH w Warszawie, Warszawa 2007, s. 164. 9 Por. ibidem, s. 170–717. 10 K. Tekla, Infrastruktura komunalna determinantą rozwoju społeczno-gospodarczego
gmin, w: Społeczno-gospodarcze aspekty kreowania rozwoju lokalnego, WNUS, Szczecin 2006, s. 284.
Identyfikacja podstawowych czynników rozwoju… 13
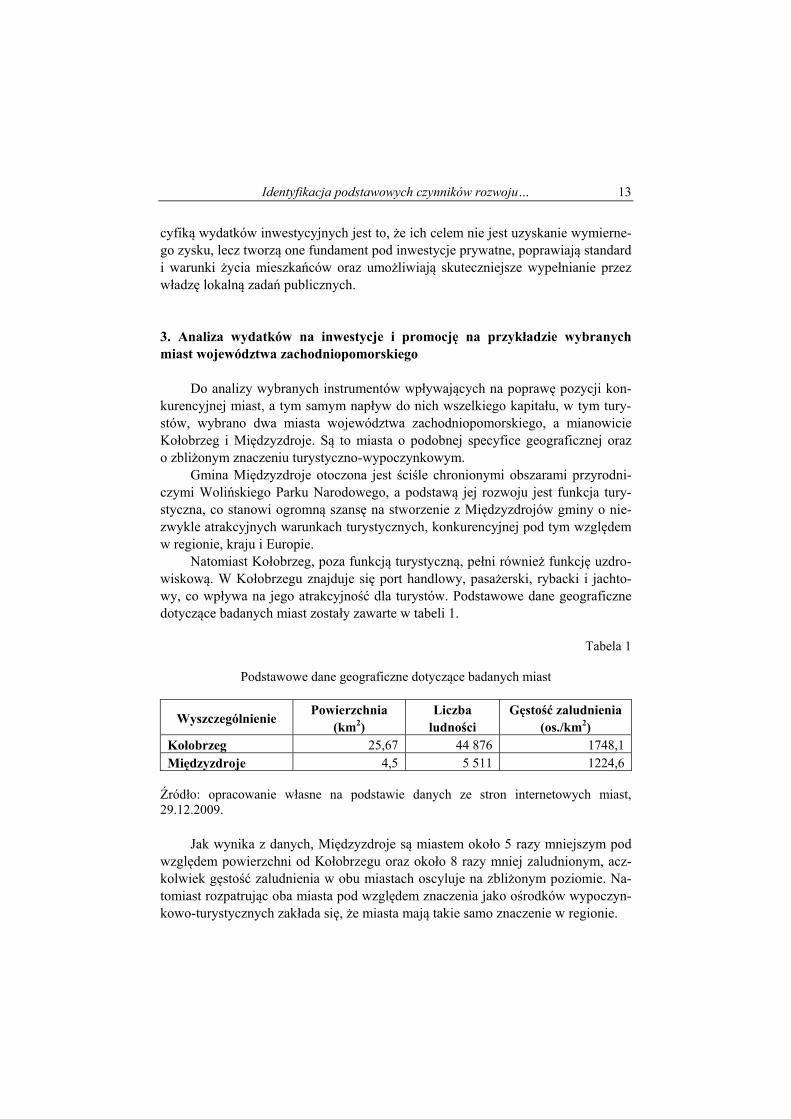
cyfiką wydatków inwestycyjnych jest to, że ich celem nie jest uzyskanie wymierne-go zysku, lecz tworzą one fundament pod inwestycje prywatne, poprawiają standard i warunki życia mieszkańców oraz umożliwiają skuteczniejsze wypełnianie przez władzę lokalną zadań publicznych. 3. Analiza wydatków na inwestycje i promocję na przykładzie wybranych miast województwa zachodniopomorskiego Do analizy wybranych instrumentów wpływających na poprawę pozycji kon-kurencyjnej miast, a tym samym napływ do nich wszelkiego kapitału, w tym tury-stów, wybrano dwa miasta województwa zachodniopomorskiego, a mianowicie Kołobrzeg i Międzyzdroje. Są to miasta o podobnej specyfice geograficznej oraz o zbliżonym znaczeniu turystyczno-wypoczynkowym. Gmina Międzyzdroje otoczona jest ściśle chronionymi obszarami przyrodni-czymi Wolińskiego Parku Narodowego, a podstawą jej rozwoju jest funkcja tury-styczna, co stanowi ogromną szansę na stworzenie z Międzyzdrojów gminy o nie-zwykle atrakcyjnych warunkach turystycznych, konkurencyjnej pod tym względem w regionie, kraju i Europie. Natomiast Kołobrzeg, poza funkcją turystyczną, pełni również funkcję uzdro-wiskową. W Kołobrzegu znajduje się port handlowy, pasażerski, rybacki i jachto-wy, co wpływa na jego atrakcyjność dla turystów. Podstawowe dane geograficzne dotyczące badanych miast zostały zawarte w tabeli 1.
Tabela 1
Podstawowe dane geograficzne dotyczące badanych miast
Wyszczególnienie Powierzchnia
(km2) Liczba
ludności Gęstość zaludnienia
(os./km2) Kołobrzeg 25,67 44 876 1748,1 Międzyzdroje 4,5 5 511 1224,6
Źródło: opracowanie własne na podstawie danych ze stron internetowych miast, 29.12.2009. Jak wynika z danych, Międzyzdroje są miastem około 5 razy mniejszym pod względem powierzchni od Kołobrzegu oraz około 8 razy mniej zaludnionym, acz-kolwiek gęstość zaludnienia w obu miastach oscyluje na zbliżonym poziomie. Na-tomiast rozpatrując oba miasta pod względem znaczenia jako ośrodków wypoczyn-kowo-turystycznych zakłada się, że miasta mają takie samo znaczenie w regionie.

Emilia Barej 14
Do przeprowadzenia analizy wykorzystano takie czynniki wpływające na konkurencyjność, jak wydatki na inwestycje oraz promocję. W tabelach 2 i 3 zosta-ły zawarte dane dotyczące wykorzystania nakładów na promocję oraz na inwestycje w badanych miastach, a także ich udział w wydatkach ogółem. Analizując dane, należy zauważyć, iż miasto Kołobrzeg przeznacza kwotowo większe środki na inwestycje oraz promocję. Natomiast rozpatrując udział środków na inwestycje i promocję w wydatkach ogółem, należy zauważyć, iż oba miasta w podobnym stopniu do wydatków ogółem finansują promocję. Udział wydatków na inwestycje w wydatkach ogółem w ciągu badanego okresu w Międzyzdrojach dwukrotnie przewyższył udział Kołobrzegu. W 2005 roku Kołobrzeg przeznaczał dwa razy więcej na inwestycje w stosunku do wydatków ogółem niż Międzyzdroje, natomiast już w 2008 roku sytuacja się odwróciła. Znaczne różnice odnotowuje się również w udziale wydatków na inwestycje w wydatkach ogółem, w przypadku Kołobrzegu udział ten wzrósł w ciągu 4 lat o 10%, w przypadku Międzyzdrojów zaś o około 45%.
Tabela 2
Wydatki na promocję i na inwestycje w mieście Kołobrzeg w latach 2005–2008
Wyszczególnienie 2005 2006 2007 2008
Wydatki ogółem (w zł) 100 604 444 122 784 932 138 520 176 141 189 492
Wydatki na promocję (w zł) 1 962 600 2 166 248 1 687 581 1 773 349
Wydatki na inwestycje (w zł) 16 297 919 31 636 022 39 062 689 36 901 952
Udział wydatków na promocję
w wydatkach ogółem (w %) 1,95 1,76 1,22 1,26
Udział wydatków na inwestycje
w wydatkach ogółem (w %) 16,2 25,77 28,2 26,14
Źródło: opracowanie własne na podstawie sprawozdań z wykonania budżetów miasta, www.bip.gov.pl, 29.12.2009. Inwestycje w Międzyzdrojach w dużej mierze wiążą się z modernizacją i przebudową dróg. Ze specyfiki inwestycji technicznych wynika ich kapitałochłon-ność, dlatego też stanowią one znaczną część ogółu inwestycji.
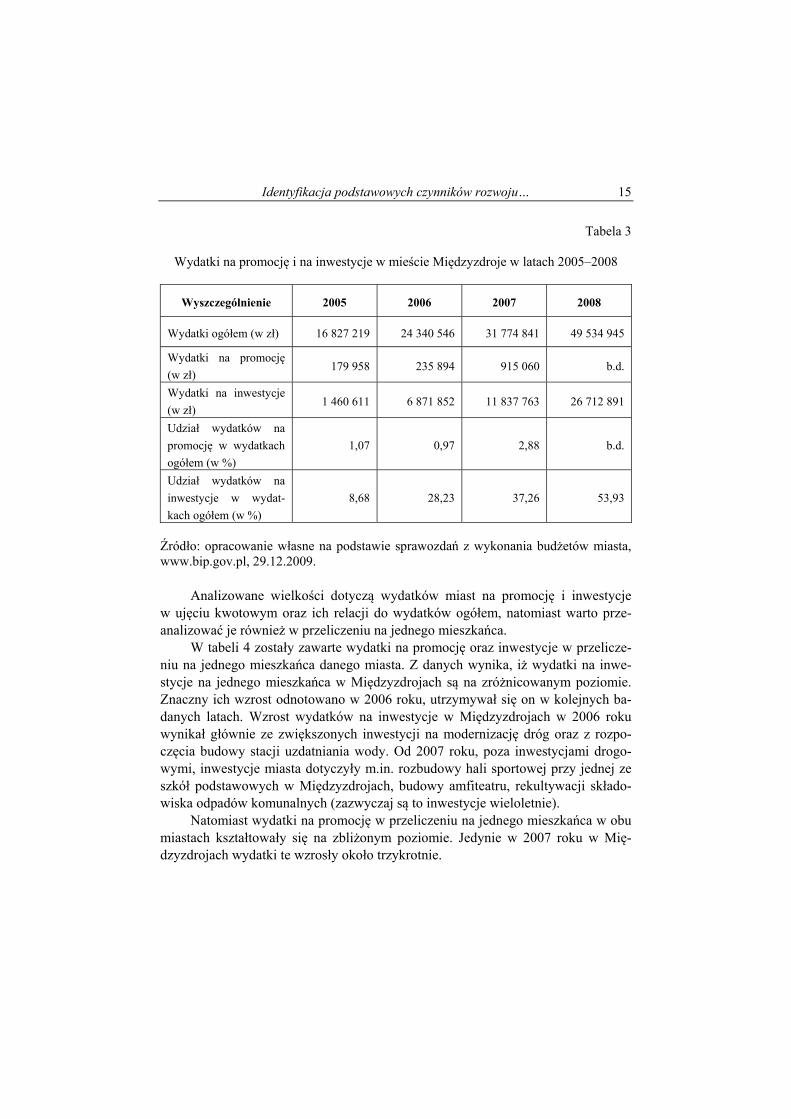
Identyfikacja podstawowych czynników rozwoju… 15
Tabela 3
Wydatki na promocję i na inwestycje w mieście Międzyzdroje w latach 2005–2008
Wyszczególnienie 2005 2006 2007 2008
Wydatki ogółem (w zł) 16 827 219 24 340 546 31 774 841 49 534 945
Wydatki na promocję
(w zł) 179 958 235 894 915 060 b.d.
Wydatki na inwestycje
(w zł) 1 460 611 6 871 852 11 837 763 26 712 891
Udział wydatków na
promocję w wydatkach
ogółem (w %)
1,07 0,97 2,88 b.d.
Udział wydatków na
inwestycje w wydat-
kach ogółem (w %)
8,68 28,23 37,26 53,93
Źródło: opracowanie własne na podstawie sprawozdań z wykonania budżetów miasta, www.bip.gov.pl, 29.12.2009. Analizowane wielkości dotyczą wydatków miast na promocję i inwestycje w ujęciu kwotowym oraz ich relacji do wydatków ogółem, natomiast warto prze-analizować je również w przeliczeniu na jednego mieszkańca. W tabeli 4 zostały zawarte wydatki na promocję oraz inwestycje w przelicze-niu na jednego mieszkańca danego miasta. Z danych wynika, iż wydatki na inwe-stycje na jednego mieszkańca w Międzyzdrojach są na zróżnicowanym poziomie. Znaczny ich wzrost odnotowano w 2006 roku, utrzymywał się on w kolejnych ba-danych latach. Wzrost wydatków na inwestycje w Międzyzdrojach w 2006 roku wynikał głównie ze zwiększonych inwestycji na modernizację dróg oraz z rozpo-częcia budowy stacji uzdatniania wody. Od 2007 roku, poza inwestycjami drogo-wymi, inwestycje miasta dotyczyły m.in. rozbudowy hali sportowej przy jednej ze szkół podstawowych w Międzyzdrojach, budowy amfiteatru, rekultywacji składo-wiska odpadów komunalnych (zazwyczaj są to inwestycje wieloletnie). Natomiast wydatki na promocję w przeliczeniu na jednego mieszkańca w obu miastach kształtowały się na zbliżonym poziomie. Jedynie w 2007 roku w Mię-dzyzdrojach wydatki te wzrosły około trzykrotnie.
Emilia Barej 16
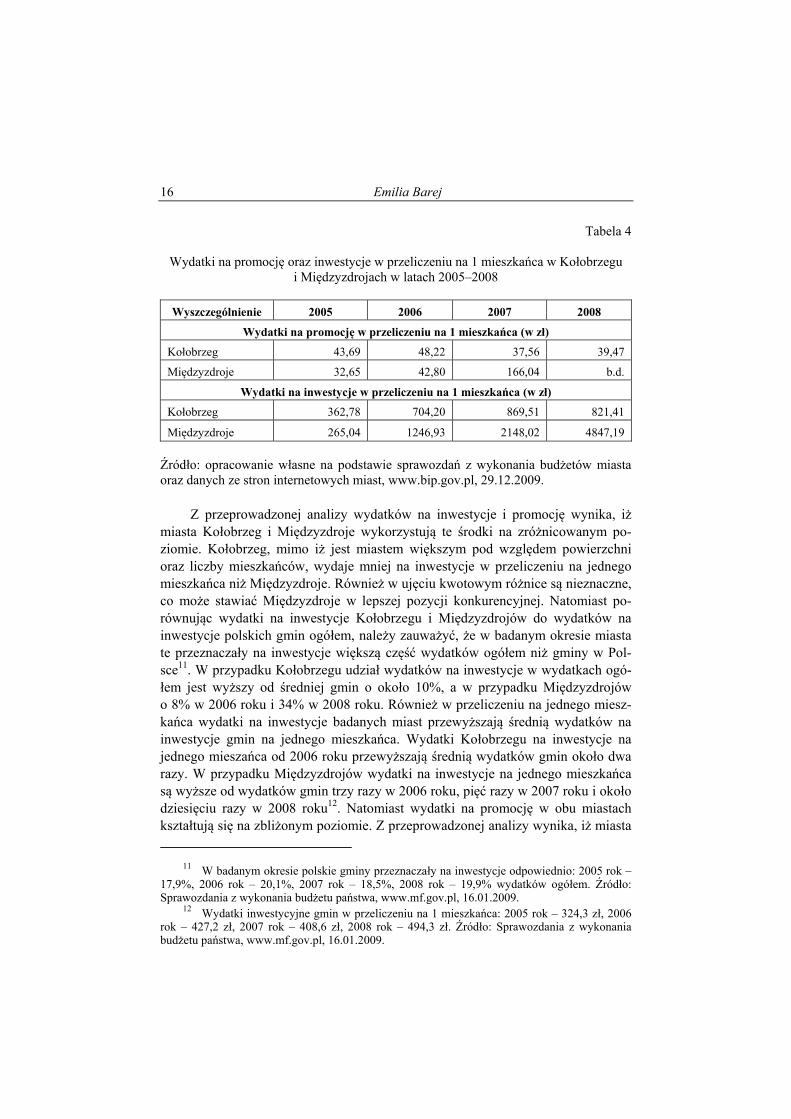
Tabela 4
Wydatki na promocję oraz inwestycje w przeliczeniu na 1 mieszkańca w Kołobrzegu i Międzyzdrojach w latach 2005–2008
Wyszczególnienie 2005 2006 2007 2008
Wydatki na promocję w przeliczeniu na 1 mieszkańca (w zł)
Kołobrzeg 43,69 48,22 37,56 39,47
Międzyzdroje 32,65 42,80 166,04 b.d.
Wydatki na inwestycje w przeliczeniu na 1 mieszkańca (w zł)
Kołobrzeg 362,78 704,20 869,51 821,41
Międzyzdroje 265,04 1246,93 2148,02 4847,19
Źródło: opracowanie własne na podstawie sprawozdań z wykonania budżetów miasta oraz danych ze stron internetowych miast, www.bip.gov.pl, 29.12.2009. Z przeprowadzonej analizy wydatków na inwestycje i promocję wynika, iż miasta Kołobrzeg i Międzyzdroje wykorzystują te środki na zróżnicowanym po-ziomie. Kołobrzeg, mimo iż jest miastem większym pod względem powierzchni oraz liczby mieszkańców, wydaje mniej na inwestycje w przeliczeniu na jednego mieszkańca niż Międzyzdroje. Również w ujęciu kwotowym różnice są nieznaczne, co może stawiać Międzyzdroje w lepszej pozycji konkurencyjnej. Natomiast po-równując wydatki na inwestycje Kołobrzegu i Międzyzdrojów do wydatków na inwestycje polskich gmin ogółem, należy zauważyć, że w badanym okresie miasta te przeznaczały na inwestycje większą część wydatków ogółem niż gminy w Pol-sce11. W przypadku Kołobrzegu udział wydatków na inwestycje w wydatkach ogó-łem jest wyższy od średniej gmin o około 10%, a w przypadku Międzyzdrojów o 8% w 2006 roku i 34% w 2008 roku. Również w przeliczeniu na jednego miesz-kańca wydatki na inwestycje badanych miast przewyższają średnią wydatków na inwestycje gmin na jednego mieszkańca. Wydatki Kołobrzegu na inwestycje na jednego mieszańca od 2006 roku przewyższają średnią wydatków gmin około dwa razy. W przypadku Międzyzdrojów wydatki na inwestycje na jednego mieszkańca są wyższe od wydatków gmin trzy razy w 2006 roku, pięć razy w 2007 roku i około dziesięciu razy w 2008 roku12. Natomiast wydatki na promocję w obu miastach kształtują się na zbliżonym poziomie. Z przeprowadzonej analizy wynika, iż miasta
11 W badanym okresie polskie gminy przeznaczały na inwestycje odpowiednio: 2005 rok –
17,9%, 2006 rok – 20,1%, 2007 rok – 18,5%, 2008 rok – 19,9% wydatków ogółem. Źródło: Sprawozdania z wykonania budżetu państwa, www.mf.gov.pl, 16.01.2009.
12 Wydatki inwestycyjne gmin w przeliczeniu na 1 mieszkańca: 2005 rok – 324,3 zł, 2006 rok – 427,2 zł, 2007 rok – 408,6 zł, 2008 rok – 494,3 zł. Źródło: Sprawozdania z wykonania budżetu państwa, www.mf.gov.pl, 16.01.2009.
Identyfikacja podstawowych czynników rozwoju… 17
Kołobrzeg i Międzyzdroje zabiegają o pozyskiwanie „klientów” poprzez kreowanie dobrego wizerunku, a tym samym uzyskanie przewagi konkurencyjnej. Podsumowanie Efektywne wykorzystanie przez miasta instrumentów finansowych przyczynia się do wzrostu atrakcyjności regionalnej, a co za tym idzie do zwiększenia ich konku-rencyjności. Tylko miasta konkurencyjne mogą zapewnić swoim klientom dogodne warunki wypoczynkowe oraz turystyczne. Korzystny obraz miasta wpływa na spo-sób oceny określonych zjawisk i faktów na temat danej jednostki terytorialnej nie tylko przez społeczność lokalną, ale również przez osoby z zewnątrz (np. turystów czy przedsiębiorców).
INVESTMENT AND PROMOTION AS A FINANCIAL ASPECTS OF COMPETITIVENESS OF CITIES
Summary The paper presents the rules of image creation of cities. The cities play significant role in building the economy based on knowledge providing the highest technological and scientific potential. The main attention is put on financial aspects of competitive-ness growth. Author presents definitions and meaning of territorial units competitive-ness mainly of the local level and the competitiveness factors. The article describes financial aspects which the cities Kołobrzeg and Międzyzdroje are using to rise of their competitiveness.
Translated by Emilia Barej


ZESZYTY NAUKOWE UNIWERSYTETU SZCZECIŃSKIEGO NR 592 EKONOMICZNE PROBLEMY TURYSTYKI NR 14 2010
KRESHNIK BELLO, ARLINDA HOTI, JONIDA KELLEZI University of Vlore
THE GLOBAL FINANCIAL CRISES IMPACT ON THE TOURISM INDUSTRY IN ALBANIA AND ITS FUTURE TREND
1. The Albanian economy short overview The economy of Albania has improved substantially over the recent years and has outperformed many other countries in the region. According to the Bank of Albania, the income per capita in 2008 was 2400 Euro1. According to some prelim-inary data by the World Bank's Poverty Assessment Program, 12,4% of the popula-tion lived below the poverty line in 2008, marking a considerable improvement from 25,4% in 2002. The official unemployment rate is 12,7%. Almost 60% of the whole workers are employed in the agricultural sector, although the construction and service industries have been expanded recently. The Tourism has been boosted significantly by ethnic Albanian tourists, main-ly from Kosovo and FYROM. The GDP is comprised of services (50%), agriculture (19%), industry (12%), construction (14%), and transport and communication (6%). The Albanian economy has been partially sheltered from the global financial crisis and the economic downturn. In April 2009, the International Monetary Fund (IMF) predicted that Albania would be one of the two countries in Europe (the other one is Poland) to enjoy a positive growth rate for 2009, but lower remittances from Alba-nian workers abroad (approximately 9,6% of the GDP in 2008), mostly in Greece and Italy, and smaller exports will put a strain on the economic activity.
1 2008 Yearly Report, Bank of Albania.
Kreshnik Bello, Arlinda Hoti, Jonida Kellezi 20
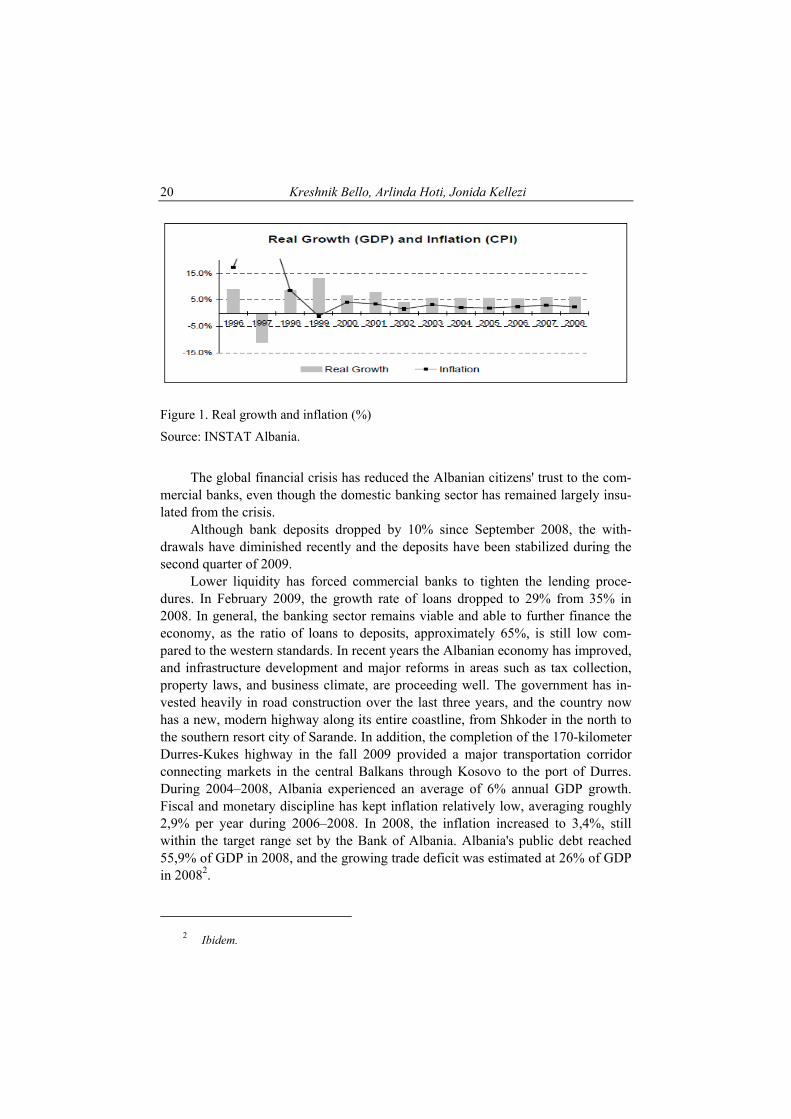
Figure 1. Real growth and inflation (%)
Source: INSTAT Albania.
The global financial crisis has reduced the Albanian citizens' trust to the com-mercial banks, even though the domestic banking sector has remained largely insu-lated from the crisis. Although bank deposits dropped by 10% since September 2008, the with-drawals have diminished recently and the deposits have been stabilized during the second quarter of 2009. Lower liquidity has forced commercial banks to tighten the lending proce-dures. In February 2009, the growth rate of loans dropped to 29% from 35% in 2008. In general, the banking sector remains viable and able to further finance the economy, as the ratio of loans to deposits, approximately 65%, is still low com-pared to the western standards. In recent years the Albanian economy has improved, and infrastructure development and major reforms in areas such as tax collection, property laws, and business climate, are proceeding well. The government has in-vested heavily in road construction over the last three years, and the country now has a new, modern highway along its entire coastline, from Shkoder in the north to the southern resort city of Sarande. In addition, the completion of the 170-kilometer Durres-Kukes highway in the fall 2009 provided a major transportation corridor connecting markets in the central Balkans through Kosovo to the port of Durres. During 2004–2008, Albania experienced an average of 6% annual GDP growth. Fiscal and monetary discipline has kept inflation relatively low, averaging roughly 2,9% per year during 2006–2008. In 2008, the inflation increased to 3,4%, still within the target range set by the Bank of Albania. Albania's public debt reached 55,9% of GDP in 2008, and the growing trade deficit was estimated at 26% of GDP in 20082.
2 Ibidem.
The global financial crises impact… 21
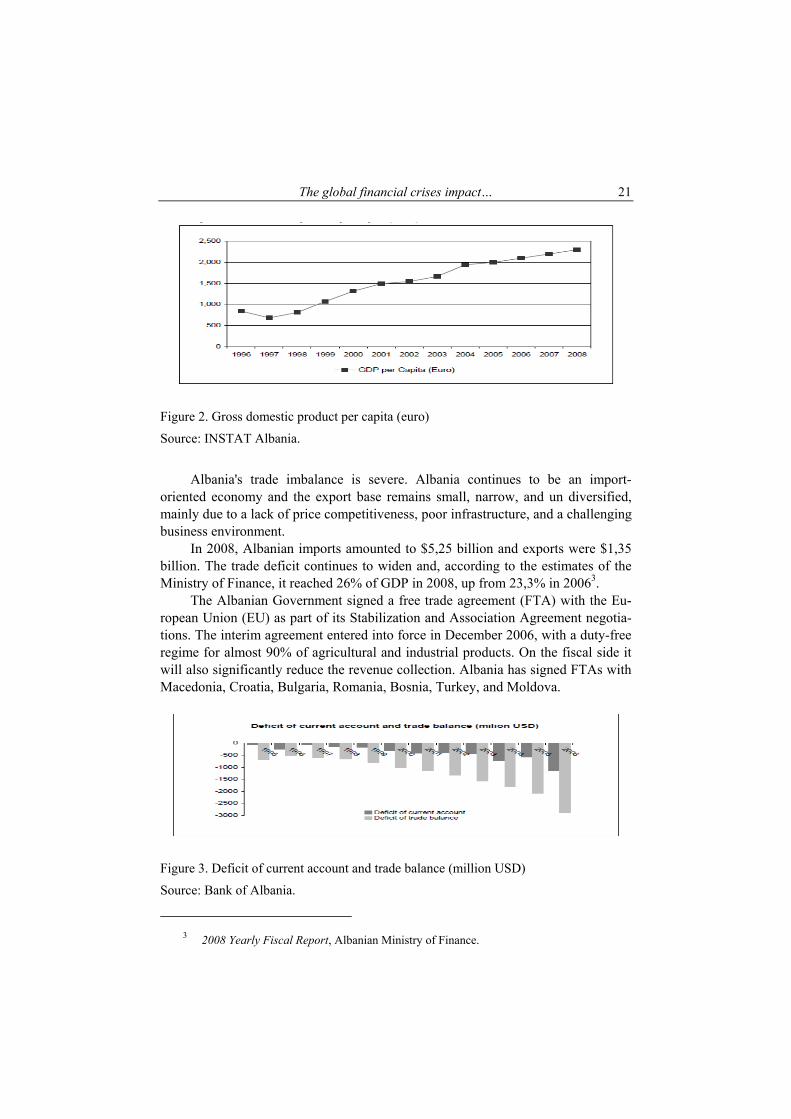
Figure 2. Gross domestic product per capita (euro)
Source: INSTAT Albania.
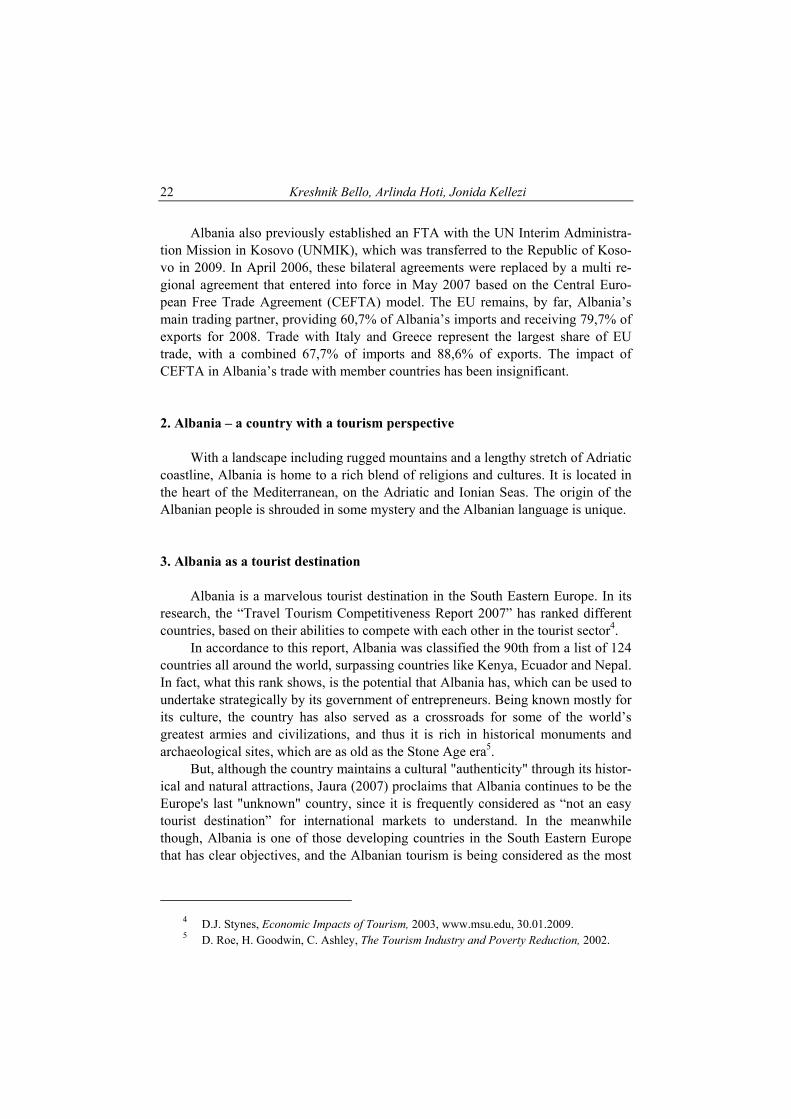
Albania's trade imbalance is severe. Albania continues to be an import-oriented economy and the export base remains small, narrow, and un diversified, mainly due to a lack of price competitiveness, poor infrastructure, and a challenging business environment. In 2008, Albanian imports amounted to $5,25 billion and exports were $1,35 billion. The trade deficit continues to widen and, according to the estimates of the Ministry of Finance, it reached 26% of GDP in 2008, up from 23,3% in 20063. The Albanian Government signed a free trade agreement (FTA) with the Eu-ropean Union (EU) as part of its Stabilization and Association Agreement negotia-tions. The interim agreement entered into force in December 2006, with a duty-free regime for almost 90% of agricultural and industrial products. On the fiscal side it will also significantly reduce the revenue collection. Albania has signed FTAs with Macedonia, Croatia, Bulgaria, Romania, Bosnia, Turkey, and Moldova.
Figure 3. Deficit of current account and trade balance (million USD)
Source: Bank of Albania.
3 2008 Yearly Fiscal Report, Albanian Ministry of Finance.
Kreshnik Bello, Arlinda Hoti, Jonida Kellezi 22
Albania also previously established an FTA with the UN Interim Administra-tion Mission in Kosovo (UNMIK), which was transferred to the Republic of Koso-vo in 2009. In April 2006, these bilateral agreements were replaced by a multi re-gional agreement that entered into force in May 2007 based on the Central Euro-pean Free Trade Agreement (CEFTA) model. The EU remains, by far, Albania’s main trading partner, providing 60,7% of Albania’s imports and receiving 79,7% of exports for 2008. Trade with Italy and Greece represent the largest share of EU trade, with a combined 67,7% of imports and 88,6% of exports. The impact of CEFTA in Albania’s trade with member countries has been insignificant. 2. Albania – a country with a tourism perspective With a landscape including rugged mountains and a lengthy stretch of Adriatic coastline, Albania is home to a rich blend of religions and cultures. It is located in the heart of the Mediterranean, on the Adriatic and Ionian Seas. The origin of the Albanian people is shrouded in some mystery and the Albanian language is unique. 3. Albania as a tourist destination Albania is a marvelous tourist destination in the South Eastern Europe. In its research, the “Travel Tourism Competitiveness Report 2007” has ranked different countries, based on their abilities to compete with each other in the tourist sector4. In accordance to this report, Albania was classified the 90th from a list of 124 countries all around the world, surpassing countries like Kenya, Ecuador and Nepal. In fact, what this rank shows, is the potential that Albania has, which can be used to undertake strategically by its government of entrepreneurs. Being known mostly for its culture, the country has also served as a crossroads for some of the world’s greatest armies and civilizations, and thus it is rich in historical monuments and archaeological sites, which are as old as the Stone Age era5. But, although the country maintains a cultural "authenticity" through its histor-ical and natural attractions, Jaura (2007) proclaims that Albania continues to be the Europe's last "unknown" country, since it is frequently considered as “not an easy tourist destination” for international markets to understand. In the meanwhile though, Albania is one of those developing countries in the South Eastern Europe that has clear objectives, and the Albanian tourism is being considered as the most
4 D.J. Stynes, Economic Impacts of Tourism, 2003, www.msu.edu, 30.01.2009. 5 D. Roe, H. Goodwin, C. Ashley, The Tourism Industry and Poverty Reduction, 2002.

The global financial crises impact… 23
optimal strategy for achieving these objectives, as well as for improving the coun-try’s overall economy6.
In fact, the data provided by different research show that the tourist sector is one of the fast growing industries in the country and it has strongly benefited from the EU integration process, making the country one of the main destinations to be discovered. The tourist GDP is counted to be 3,8-4% and its contribution to the whole economy is about 11%. The tourist agencies in the country, which have grown in number and counted 116 in the year 2007 compared to 60 in the year 2004, have been promoting the most attractive places of the country, such as Bu-trint, Gjirokastra and Berat7. However, other very favorite tourist destinations remain the splendid virgin beaches and the Albanian Riviera, as well as the snowy resort of the Albanian Alps. 4. International tourism in Albania The development of the tourist sector in Albania has its own history, which dates back in the ’20. Albania is not considered as an easy tourist destination from the international markets. The country offers potential for different activities in different locations. Individually all these activities are interesting, but only a few of them really attract the attention of the international tourists. However, Albania, through its natural and cultural attractions, aims to grab the attention of those international tourists that are educated, relatively wealthy and adventurous8. The focus toward this specific demographic group is due to the fact that those are more likely to spend on tourist products, and their expenditures are favorable for the development of the country. Indeed, these groups of tourists interact directly with the shops, restaurants, and other local businesses and they attempt to buy more products and services that are available locally. These incomes from the international tourism contribute to the overall eco-nomic conditions of one country9. Specifically, the incomes that generate from international tourism are generally in the foreign currency, such as American Dollar or Euro. These incomes, once within the Albanian territory, become part of the monetary offer in this market; there they are transformed in a financial source for purchasing goods or services, or even for loans10. On the other hand, having more
6 K. Gorica, Issues of European Integration for Tourism Challenges of Albania as an
Emerge Destination, 2006. 7 UNDP, Unknown Albania, 2009. 8 B. Mirbabayev, M. Shagazatova, The Economic and Social Impact of Torusim, 2008. 9 D. Roe, H. Goodwin, C. Ashley, op.cit.
Kreshnik Bello, Arlinda Hoti, Jonida Kellezi 24
disposable income, the Albanian consumers will consume more compared to the incomes that they would have generated from the national tourism11.
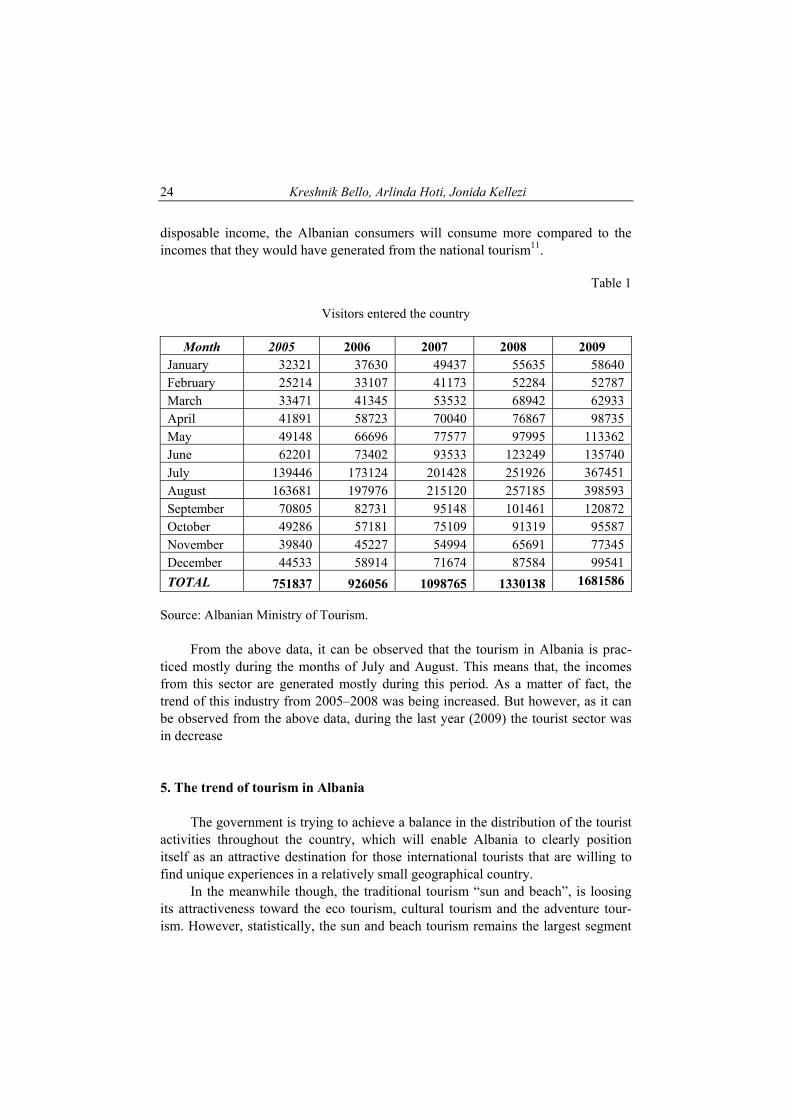
Table 1
Visitors entered the country
Month 2005 2006 2007 2008 2009 January 32321 37630 49437 55635 58640 February 25214 33107 41173 52284 52787 March 33471 41345 53532 68942 62933 April 41891 58723 70040 76867 98735 May 49148 66696 77577 97995 113362 June 62201 73402 93533 123249 135740 July 139446 173124 201428 251926 367451 August 163681 197976 215120 257185 398593 September 70805 82731 95148 101461 120872 October 49286 57181 75109 91319 95587 November 39840 45227 54994 65691 77345 December 44533 58914 71674 87584 99541
TOTAL 751837 926056 1098765 1330138 1681586
Source: Albanian Ministry of Tourism. From the above data, it can be observed that the tourism in Albania is prac-ticed mostly during the months of July and August. This means that, the incomes from this sector are generated mostly during this period. As a matter of fact, the trend of this industry from 2005–2008 was being increased. But however, as it can be observed from the above data, during the last year (2009) the tourist sector was in decrease 5. The trend of tourism in Albania The government is trying to achieve a balance in the distribution of the tourist activities throughout the country, which will enable Albania to clearly position itself as an attractive destination for those international tourists that are willing to find unique experiences in a relatively small geographical country. In the meanwhile though, the traditional tourism “sun and beach”, is loosing its attractiveness toward the eco tourism, cultural tourism and the adventure tour-ism. However, statistically, the sun and beach tourism remains the largest segment
The global financial crises impact… 25
in the international tourism, but in the last years it has been increased by 2 to 4 per-cent per year. On the other hand, it is believed that the cultural tourism is represented by more than 60 million tourists per year (or 15%), which is the main reason why the neighboring countries, such as Greece, Turkey and Croatia, are being focused mostly in the sun and beach tourism9. Regardless of this, the culture, the adventures and the eco tourism are considered to be the markets with a rapid development in the tourism worldwide. From this discussion, it can be easily no-ticed that one of the main reasons for developing the tourism sector in Albania, is to increase the quality of the living of its inhabitants. The development of the natural and cultural tourism in Albania, aims to improve the living standards of the local communities, which are faced even today with limited economic capabilities. In addition to this, it is suggested that the development of this sector should be meas-ured in respect to its ability to improve the wellness of the Albanian citizens, in the long run. In the past four years, the Albanian government has invested most of its budget in the country’s road infrastructure, such as the highway Durres – Kukes. This high way is planned to finish in the year 2010 and it will reduce the distance by 5 hours, traveling from Kosovo to Durres in only 3 hours (now is 8 hours). Also, during the 2010, Albania’s citizens will benefit from the visas liberalization process with EU. In this context, those who will benefit more from this process will be the tourist agencies specializing in outgoing tourism mostly with Greece and Italy but as well as to other European countries10.
Table 2
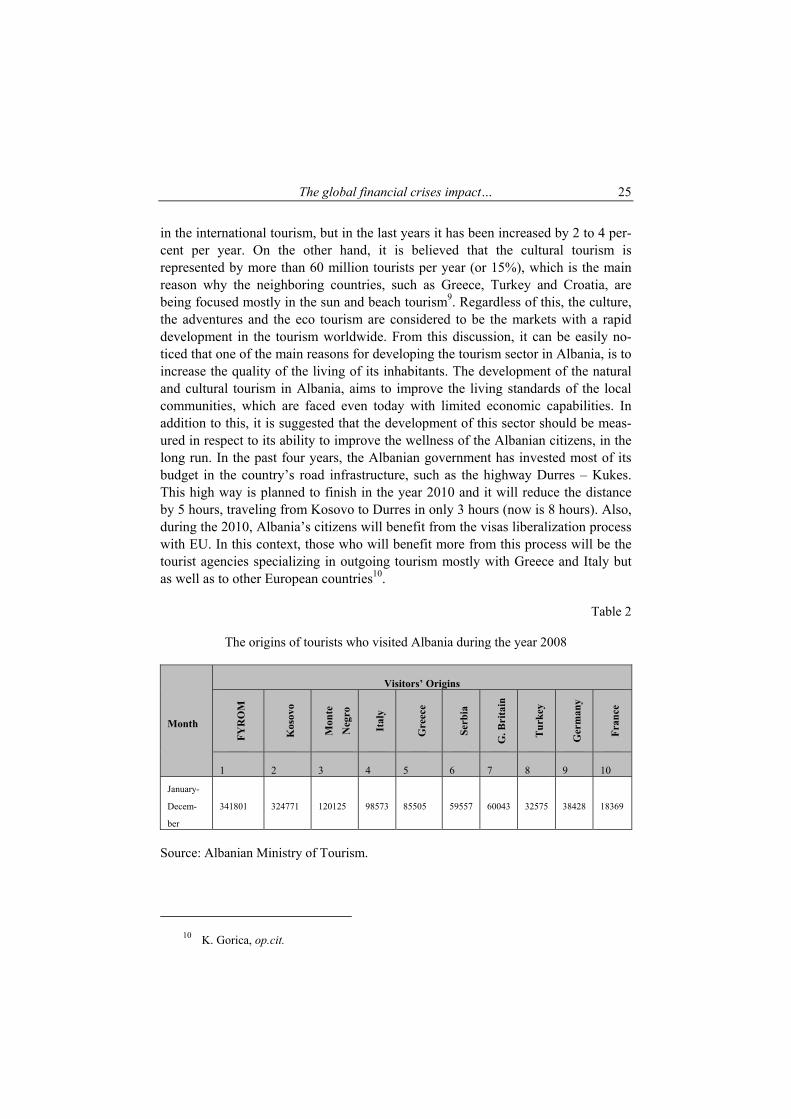
The origins of tourists who visited Albania during the year 2008
Month
Visitors’ Origins
FY
RO
M
Kos
ovo
Mon
te
Neg
ro
Ital
y
Gre
ece
Ser
bia
G. B
rita
in
Tu
rkey
Ger
man
y
Fra
nce
1 2 3 4 5 6 7 8 9 10
January-
Decem-
ber
341801 324771
120125
98573 85505 59557 60043 32575 38428 18369
Source: Albanian Ministry of Tourism.
10 K. Gorica, op.cit.

Kreshnik Bello, Arlinda Hoti, Jonida Kellezi 26
From the above table, it can be observed that most of the tourists are from FYROM and Kosovo. But, considering the fact that these countries are being influ-enced by the international financial crises, this will also influence on their expendi-tures on tourism. Therefore, in the 2008 the official unemployment rate in Macedo-nia was 33% and in the consecutive year it increased by 2%. More on this, as far as it concerns the GDP of Macedonia, the European Commission has stated that it declined by 0,3% during 2009. In the meanwhile, UNDP declares that Kosovo was facing the highest unemployment rate in Western Balkans. The registered unem-ployment rate in the first half of 2009 remains very high, estimated at 40%, un-changed compared to 2008. Thus, total revenues decreased from 25,9% of GDP in 2007 to 25,3% of GDP in 2008. Starting from the data given about these countries, it can be concluded that the number of tourists from these countries will be lower in the coming months of the 2010 year. Conclusions and Suggestions
1. The decreasing of the economic indexes in the neighboring countries as Kosovo and Macedonia, will influence in the decrease of the number of tourists coming to Albania, and as a result the decrease of the incomes, coming from tourism.
2. The improvement of the road infrastructure in general and putting into function the highway Durres – Kukes in particular, will help positively in the flow of the road transport, and so we suppose an increase of the tour-ists, that come through this land road.
3. The liberalization of visas in the middle of the year 2010, may influence in the increase of the incomes from the tourism sector.
4. Albania should invest in different resources that are critical for the success of this sector, and the first resource that they should consider is human re-source. The travel agencies, should be focused more in the country tourism and should create very well prepared “tourist guides”.
5. The country should invest more in promoting its natural beauties, both na-tionally and internationally.
6. Create a marketing campaign to increase the knowledge of the international tourists about the infrastructure, telecommunication and internet, which are important elements in promoting this sector. Afterwards, focus the cam-paign more on eco tourism, since now days this is the most requested type of tourism.
7. Increasing the products for the new types of tourism, like winter tourism, cultural tourism, etc., might make it possible to have a flux of tourists also in the other months of the year.
The global financial crises impact… 27
WPŁYW GLOBALNEGO KRYZYSU NA GOSPODARKĘ TURYSTYCZNĄ ALBANII
Streszczenie Turystyka stanowi istotny element gospodarki, którego stopa wzrostu jest ściśle skorelowana ze stopą wzrostu PKB w krajach generujących najwyższy ruch turystycz-ny. W artykule przedstawiono stan obecny albańskiej gospodarki oraz wpływ turystyki na jej wzrost między 2000 a 2008 rokiem.
Tłumaczył Adam Pawlicz


ZESZYTY NAUKOWE UNIWERSYTETU SZCZECIŃSKIEGO NR 592 EKONOMICZNE PROBLEMY TURYSTYKI NR 14 2010
NERINE BRESLER University of Johannesburg
THE TOURISM DEVELOPMENT POTENTIAL OF A MEGA SPORT EVENT: 2010 FIFA WORLD CUP
Introduction There are only two mega sport events namely the FIFA Wold Cup and the Olympics based on the scale of media interest1. FIFA owns the event and provides the entertainment extravaganza in the form of football, for profit generation. Their costs are covered mainly by television broadcasting and marketing rights. Host cities are required to provide the infrastructure and services. Hosting the event promises to the nation, not only the excitement of the media exposure, but the ex-pectation of a positive return on the considerable investment. However, this may not result to growth benefits in the short term, for one, because of displacement of business-related tourism. But, the success SA wish to attain is the longer term in-tangible and ambiguous benefit of reducing the widespread legacy of Afro-pessimism, by proving that it can manage the event to world standards2. This cannot be done through marketing campaigns, but only through lived experiences of such an event. This paper will endeavour to elicit the risk of not reducing the legacy of Afro-pessimism from a visitor perspective. It will focus on the experience of predomi-nantly international visitors to a comparable event in SA and their perception of the destination. In order to do so the paper is structured as follows: firstly a brief over-
1 U. Davies, Managing the alchemy of the 2010 Football World Cup, in: Development and
dreams: the urban legacy of the 2010 football world cup, U. Pillay, R. Tomlinson, & O. Bass (eds), HSRC Press, Cape Town 2009, pp. 33–34; Development and dreams..., op.cit., p. 5.
2 A. Czeglédy, World Cup in the construction of African Reality, in: Development and dreams..., op.cit., p. 294.

Nerine Bresler 30
view will be given of hosting mega events, followed by a description of the motives of event tourists, and then the challenges of delivering the desired experiences. The significance of the contribution lies in synthesizing various theories from a visitor perspective to elucidate challenges and successes in preparation for the 2010 World Cup, and in contextualising international literature. The findings can be used to iron out problems and to promote experiences that are deliverable. 1. Hosting a mega sport event Given the capacity to draw visitors mega events has become a prominent component of many economic development plans3. They are likely to have long-term positive consequences for the cities and communities that stage them and pro-vide opportunities for increased international publicity and recognition, by attract-ing attention to the locality4. They can also be strategically leveraged for business and investment development5. However, Crompton (1995) is of the opinion that the validity of many eco-nomic studies is less than reliable. In this regard, Tomlinson6 refers to lack of trans-parency and considerable secrecy, and Pillay et al.7 to deliberate misrepresentation. The benefit calculations thus cast a dark shadow on the return on investment claims. For example, studies mainly relate to the expenditure associated with the tourists who are attracted to the event, and care is needed in measuring the amount of ex-penditure that would not have occurred in the absence of the event. Lee and Taylor8 did that when they estimated the impact of the 2002 World Cup, by using an input-output model, but conclude that measuring all the economic impacts associated with a mega event is an impossible task. According to Daniels9 meaningful economic impacts seldom result from mega events such as the World Cup, because site op-
3 Clark, Local development benefits from staging major events, Organisation for Economic
Co-operation and Development, p. 11; Kotler, Haider & Rein, Marketing places: attracting in-vestment, industry, and tourism to cities, states and nations, Free Press, New York 2008.
4 C. Deccio, & S. Baloglu, Non-host community resident reactions to the 2002 Winter Olympics: the spill-over impacts, “Journal of Travel Research”, No. 41; Keller, Introductory report: World conference on sport and tourism, Barcelona 2002, World Tourism Organisation, 2001, p. 31.
5 O’Brien, Event business leverage; the Sydney 2000 Olympic Games, “Annals of Tourism Research” 2006, No. 33 (1), p. 241.
6 R. Tomlinson, Anticipating 2011, in: Development and dreams..., op.cit., p. 33. 7 Development and dreams..., op.cit., p. 6. 8 C. Lee, T. Taylor, Critical reflections of the economic impact assessment of mega-event;
the case of 2002 FIFA World Cup, “Tourism Management” 2005, No. 25, pp. 596–602. 9 M.J. Daniels, Central place theory and sport tourism impacts, “Annals of Tourism Re-
search” 2007, No. 34 (2), p. 335.

The tourism development potential… 31
tions are narrowed by the necessity of sophisticated infrastructure and significant public investment. Central cities consequently gain more than remote ones because of their location. Sport tourism may thus exacerbate regional imbalances in devel-opment10. Daniels11 therefore suggests that planners of mega sport events should work closely with Destination Marketing Organisations (DMOs) from different areas, to ensure that all areas realize an equitable share of the event’s cost and bene-fits. Rogerson supports this argument, but base it on the size of the enterprises and not the cities. On the enterprise level, there are also risks. For example, accommodation occupancy the eight weeks before and after a mega event may be down compared to the same time the previous year, as was the case in Germany in 200612. But, reve-nue per available room will be up because of rising prices. A study among operators in the major source markets also ascertained fear about disrupted supply and dis-placed business as a result of the 2010 FIFA World Cup, and only 56% of SA-based operators thought the event would be good for their business13. With respect to the less tangible benefits, Rogerson14 is of the opinion that mega events are increasingly significant phenomena because they can generate long-term outcomes for the host locality by enhancing and regenerating it, and pro-moting or re-creating its image. For example, the UK redefined soccer in the 1990 World Cup, by using Pavarotti’s Nessun Dorma as the BBC’s theme tune, and moved it away from its former associations with violent masculine thuggery15. Un-fortunately, previous studies suggest that mega events may not translate into image enhancement that translate into tourist visitation16 and may have profound negative impacts as they are likely to result in such problems as traffic congestion, difficul-ties of law enforcement, and increased crime. They may damage the image of the host destination or diminish its attractiveness because of inadequate infrastructure, poor facilities or improper practices17. Negative impacts are often ignored prior to
10 Development and dreams..., op.cit., p. 11, 77. 11 M.J. Daniels, op.cit., p. 344. 12 S. Du Plessis, & W. Maennig, South Africa 2010: Initial deams and sobering economic
perspectives, in: Development and dreams..., op.cit., p. 68; P. Van Meerendonk, 2010 FIFA World Cup South Africa; winning strategies for revenue optimization, “Minneapolios” 2009, No. 24, p. 2.
13 Now Media, SA Tourism Update; marketing index, Now Media, Grant Thornton & SA Tourism Service Association, 24 July, 2008, p. 27.
14 C.M. Rogerson, Mega-events and small enterprise development: the 2010 FIFA World Cup opportunities and challenges, “Development Southern Africa” 2009, No. 26 (3), p. 337.
15 D. Whitelegg, Going for gold: Atlanta’s bid for fame, “International Journal of Urban and Regional Research” 2000, No. 24, p. 803.
16 A. Smith, Reimaging the city; the value of sport initiatives, “Annals of Tourism Re-search” 2005, No. 32 (1), p. 227.
17 Keller, op.cit., p. 40; B. Mihalik, Host population perception of the 1996 Atlanta Olym-pics: support, benefits and liabilities, “Tourism Analysis” 2000, No. 5; J.R.B. Ritchie, Assessing
Nerine Bresler 32
hosting a mega event while glorifying the expected benefits18. To limit this risk, it is necessary ascertain cautionary pointers from a visitor perspective, prior to hosting a mega event and to establish what motivates them to attend. 2. Motives of event tourists and intent to attend Event spectator appeal will affect the visitor attendance19, and the destination development that an event engenders is largely driven by the attendance it is ex-pected to generate20. Estimating visitation is not an easy task. For example, the actual foreign arrivals of 403,466 to the 2002 World Cup was 37% less than the 640,000 the organising committee predicted, and of these, only 57,7% (232,800) were direct football tourists21. Travel intentions are influenced by both pull and push factors22. Pull factors are related to external sources, including destination attributes, and push factors are commonly studied with reference to reasons, or motives for travel, but motivation is an insufficient basis for understanding the drivers of sport event attendance. The most common response obtained by sport motivation researchers, why visitors at-tend, is that it is fun, but fun explains nothing23; the relationships between motives and behaviour are complexly determined24. A conceptual model of event interest and intent to attend is depicted in figure 1. Besides demographic variables that in-fluence event attendance; there are five other types: fan motives, travel motives, event interest, travel constraints and attendance intentions. Fan motives are multi-dimensional which include aesthetic experience (beauty and grace of soccer), vi-carious achievement (sense of personal achievement, or status a spectator feels when his team wins), eustress (stimulation and arousal from watching soccer), in-
the impact of hallmark events: conceptual and research issues, “Journal of Travel Research” 1984, No. 22 (1).
18 H.J. Kim, D. Gursoy, S. Lee, The impact of the 2002 World Cup on South Korea: com-parison of pre- and post-games, “Tourism Management” 2006, No. 27, p. 88.
19 Passion, pride, and profit: a survey of football, “The Economist” 30 May 2003, p. 2. 20 N. Kim, L. Chalip, Why travel to the FIFA World Cup? Effects of motives, background,
interest, and constraints, “Tourism Management” 2003, No. 27, p. 695. 21 C. Lee, T. Taylor, Critical reflections of the economic impact assessment of a mega-
event; the case of 2002 FIFA World Cup, “Tourism Management” 2005, No. 25, p. 599 ,601. 22 J.L. Crompton, S.L. McKay, Motives of visitors attending festivals and events, “Journal
of Sport Management” 1997, No. 9 (1), p. 425; Y. Yoon, M. Uysal, An examination of the effects of motivation and satisfaction on destination loyalty: a structural model, “Tourism Management” 2005, No. 26, p. 54.
23 B.C. Green, L. Chalip, Sport tourism as a celebration of subculture, “Annals of Tourism Research” 1998, p. 287.
24 J.L. Crompton, S.L. McKay, op.cit., p. 427.
The tourism development potential… 33
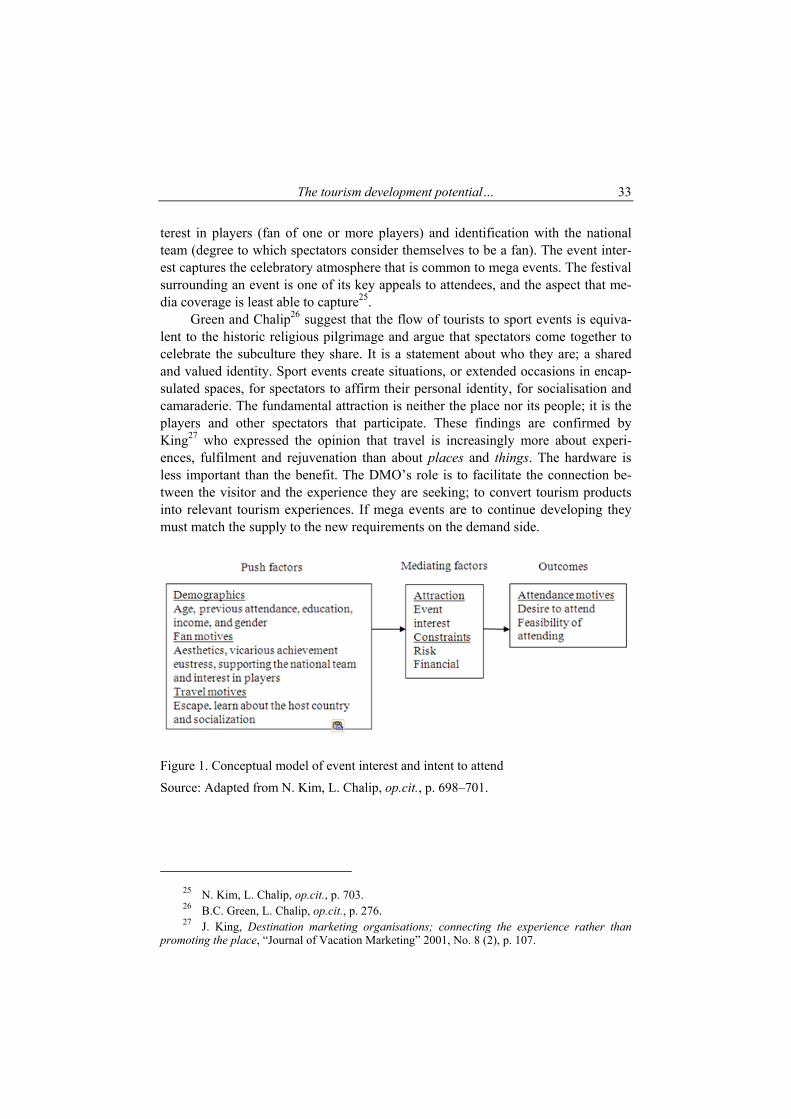
terest in players (fan of one or more players) and identification with the national team (degree to which spectators consider themselves to be a fan). The event inter-est captures the celebratory atmosphere that is common to mega events. The festival surrounding an event is one of its key appeals to attendees, and the aspect that me-dia coverage is least able to capture25. Green and Chalip26 suggest that the flow of tourists to sport events is equiva-lent to the historic religious pilgrimage and argue that spectators come together to celebrate the subculture they share. It is a statement about who they are; a shared and valued identity. Sport events create situations, or extended occasions in encap-sulated spaces, for spectators to affirm their personal identity, for socialisation and camaraderie. The fundamental attraction is neither the place nor its people; it is the players and other spectators that participate. These findings are confirmed by King27 who expressed the opinion that travel is increasingly more about experi-ences, fulfilment and rejuvenation than about places and things. The hardware is less important than the benefit. The DMO’s role is to facilitate the connection be-tween the visitor and the experience they are seeking; to convert tourism products into relevant tourism experiences. If mega events are to continue developing they must match the supply to the new requirements on the demand side.
Figure 1. Conceptual model of event interest and intent to attend
Source: Adapted from N. Kim, L. Chalip, op.cit., p. 698–701.
25 N. Kim, L. Chalip, op.cit., p. 703. 26 B.C. Green, L. Chalip, op.cit., p. 276. 27 J. King, Destination marketing organisations; connecting the experience rather than
promoting the place, “Journal of Vacation Marketing” 2001, No. 8 (2), p. 107.
Nerine Bresler 34
Only a small portion of the total revenue from mega sport events comes from ticket sales28. Visitors typically spend money in eight categories; transportation, accommodation, food and beverage, recreation/entertainment, tour/sightseeing, game tickets, retail shopping, services (such as laundry), and miscellaneous29. Eco-nomic impact research revealed that visitors who travel greater distances to an event typically spend more than tourists from nearer the host economy and that first time event visitors spend considerably more than repeat visitors30. Visitors to hallmark events travel longer distances to attend, and are more likely to be first time visitors. Similarly, the perceived attractiveness of the host community (i.e. alternative attrac-tions, climate, proximity to relatives, friends, etc.) may elicit larger visitor groups, and the nature of its tourism accommodation may stimulate more spending. With respect to activity patterns, first time visitors spend more time at the attraction and visit more attractions. They are inclined to explore more possibilities and the difference in the activity patterns of first-time and repeat visitors is moder-ated by the use of information about the available activities31. In addition, many other exogenous factors may influence activity patterns such as economic consid-erations, accessibility and the reputation of the destination. For example, SA has gained a reputation for being an unsafe place to go on holiday; especially going out after dark and using public transport, and this will limit visitor activities32. 3. The challenges in delivering on the desired experience South Africa is to host the 2010 FIFA World Cup which has the potential to raise its profile as a tourist destination, if it delivers on the desired experience33. This is in line with the broader objectives for tourism in SA, namely to ensure a lasting social legacy, to advance the competitiveness agenda, to maximise tourism value during the event, and to maximise value for SA after the event; in sustainable
28 U. Davies, op.cit., p. 34. 29 M.J. Daniels, op.cit., p. 339; M.J. Daniels, W.C. Norman, M.S. Henry, Estimating the in-
come effects of a sport tourism event, “Annals of Tourism Research” 2004, No. 31 (1), pp. 185–186; C. Lee & T. Taylor, op.cit., p. 598.
30 Q. Tang, D.M. Turco, Spending behaviours of event tourists, “Journal of Convention and Exhibition Management” 2001, No. 3 (2), p. 33.
31 A.D.A.M. Kemperman, C. Joh, H.J.P. Timmermans, Comparing first-time and repeat visitors activity patterns, “Tourism Analysis” 2003, No. 8, pp. 1–6.
32 G. George, Tourist’s perceptions of safety and security while visiting Cape Town, “Tour-ism Management” 2003, p. 576, 581.
33 A. Williams, Tourism and hospitality marketing: fantasy, feeling and fun, “International Journal of Contemporary Hospitality Management” 2002, No. 18 (6), p. 493.
The tourism development potential… 35
GDP growth, redistribution and transformation34. SA Tourism35 concede to the following ten challenges for 2010: 1) poor access to channels of tourism informa-tion, 2) insufficient accommodation, 3) insufficient compelling attractions and ac-tivities, 4) inadequate service levels and skills shortage, 5) inadequate public trans-port, 6) insufficient focus on tourist safety and security, 7) limited institutional ca-pacity, 8) managing expectations, 9) demand management and 10) displacement of general tourists. The support of the host community is also important for success. According to an opinion survey commissioned by FIFA, 83% of the respondents felt SA will be ready to host the 2010 Cup, and 94% were proud that SA is hosting the event, 89% said it would bring long term benefits to the country, 92% believed it will lead to an upgrade in infrastructure, notably public transport, roads and telecommunications, and 86% said their interest were unaffected by the performance of the national team36. Whilst 90% believed it would improve SA’s image abroad, 59% had a con-cern for inflated prices, and 58% thought crime would be a concern for visitors, and anticipate increased congestion problems. In the opinion of SA tour operators Value for money experiences is the main consideration (91%) for travellers considering SA as a destination, and according to them, crime reduction (78%) and better priced air access would help increase busi-ness37. This study (among 280 local and overseas tour operators and specialist Af-rica retailers), further purports that value for money is one of the most important factors when considering a destination for visitors from Germany, the Rest of Europe, UK and USA. By contrast, about a decade ago, value for money was a strength (96,77%) in terms of SA’s competitiveness, among 150 inbound tour op-erators38. 4. The purpose of the empirical study, research method and sample The primary purpose of the research was to ascertain if the target market for a mega sport event, namely the 2010 FIFA World Cup were of the opinion that SA could host it successfully, and if not, what had to be improved upon prior to the
34 The Marketing Growth Strategy; gearing up to be globally competitive, 2008-2010, SA
Tourism 2004, 3rd edition, pp. 85–90; The Marketing Growth Strategy for South Africa, SA Tour-ism 2008, pp. 91–97.
35 SA Tourism, op.cit., p. 97. 36 Ke Nako, Celebrate Africa’s humanity, “2010 World Cup Update Magazine” 2009,
June/July, FIFA, p. 4. 37 Now Media, op.cit., p. 26. 38 M. Saayman, E. Du Plessis, Competitiveness of South Africa as a tourist destination, “SA
Journal for Research in Sport, Physical Education and Recreation” 2003, No. 25 (2), p. 60.

Nerine Bresler 36
event. The secondary purpose was to uncover how the target market experienced a similar sport event, namely the SA 2009 FIFA Confederations Cup to uncover the image and possible testimonials to promote the event on aspects that were deliver-able. The study is based on secondary sources, supplemented by an empirical study. It is an exploratory, descriptive, and predominantly qualitative study, and the sam-ple was a non-probability, convenience sample; it was assumed to represent the target audience. Spectators to the penultimate match were interviewed, whilst wait-ing to enter the stadium, and completed the questionnaire with the assistance of the fieldworker. It was piloted, and improvements were made; especially with respect to directing questions specifically to SA residents or foreigners. A total of 205 spec-tators took part in the study and the composition is reflected in table 1.
Table 1
Composition of the sample
Source: own elaboration. The questions posed were both fixed response and open ended, and for pur-poses of this paper can be grouped into three categories. The first encapsulated the demographic and geographic profile of the respondents and included questions about gender, age, home language, matches attended, duration of visit and country of residence. These are disclosed in table 1. The second category uncovered visi-tors’ perceptions about SA as a host and tourist destination, on a 5-point Likert scale which ranged from strongly disagree (1) to strongly agree (5), and the inten-sions of overseas spectators to revisit SA for the 2010 FIFA World Cup, or recom-mending it. The last category of questions elicited their most positive and most negative experience and suggestions for improvement.

The tourism development potential… 37
5. Findings: Perception of SA as a host to a mega sport event and tourist desti-nation A brief overview of the most pertinent findings will be given. Visitors were asked to express their opinions on SA’s ability to successfully host the 2010 World Cup. A summary of the perceptions is reflected in table 2. The sample size for statements varies as it consolidates the responses of domestic and foreign visitors and some applied to the latter only. The highest weighted average of 93,9% was received for the belief expressed by 205 respondents that SA will be able to suc-cessfully host the 2010 FIFA Wold Cup, and the lowest score, for the how well 192 spectators believed transport was well organised and easy to use. The average rating of all the statements was a high 84,1%.
Table 2
Perception of SA as a host to a mega sport event and tourist destination
Source: own elaboration. Respondents were of the opinion that the matches were well organised (90,1%). As was expected, the services provided by private businesses were per-

Nerine Bresler 38
ceived to be delivered better than those provided by the public sector. The compara-tive figures were ranked 85,4 and 77,7%, by 164 and 176 respondents respectively. In order to triangulate/validate the findings, respondents were asked to rate their overall experiences during the SA 2009 Confederations Cup on a scale of 1 to 10 where ten was the highest, and the average rating was 7,84. 6. Most positive experience of visitors Visitors were asked to describe their most positive experience during the SA 2009 Confederations Cup. Foreign visitors were also asked if they would revisit SA for the 2010 Cup, to substantiate why/or why not, and if they would recommend visiting SA for the upcoming cup. The purpose was to uncover their emotional feel-ings; what was good and fun as this tells one more about the target market and what is the core product39. In addition, this question elicits testimonials of promises that are deliverable as well as what spectators would tell their friends; if their experi-ences relegated pervasive images of the past of what Africa can, and cannot do, to the past. The answers may be used by DMOs as themes that would render promo-tional material truthful. The responses were categorised in two dimensions, namely the games itself, and SA as tourist destination. Experiences about the games can be classified as either emotional or cognitive/technical, that is the service delivery itself. The Con-federations Cup created for the respondents moments of intense excitement, identity formation, and patriotism that transcended social cleavages. The positive emotional experiences can be classified as excitement (eustress) or belonging, which includes identification with the national team. Excitement was described by words such as: “The atmosphere was great, or electric, it was festive or awesome and the vibe at the stadiums enjoyable”. The following words were used to describe belonging: “Bringing the nation together, the integration of people, having met lots of friendly and helpful people, and seeing South Africans united.” Identification with soccer and the national team was for some respondents the highlight, and to see SA going through to the semi-finals. For others it was the opportunity to watch international teams and to see real superstars on the field. With respect to the technical service delivery, comments on the organisation of the tournament and the infrastructure were positive, especially the unique and striking stadiums. The smooth delivery and organisation was described by words such as: “Everything was well organised, smart and glamorous, everyone was work-ing together to ensure success and safety in the stadium was impressive. The park and drive initiative was brilliant”. The most positive experience with respect to of
39 B.C. Green, L. Chalip, op.cit., p. 286; Y. Yoon & M. Uysal, op.cit., p. 54.
The tourism development potential… 39
SA as a tourist destination was for many foreign tourists the diversity it offers. SA was considered exceptional. Most of the foreign respondents (76) said that they would visit SA again in 2010. The reasons given were similar to the most positive experiences which validate the findings. All (86), but one foreign respondent indi-cated that they would recommend SA for the 2010 World Cup. 7. Most negative experience of visitors With respect to the most negative experience during the SA 2009 Confedera-tions Cup and suggestions for improvement, the crime rate and public transport was by far the most disappointing. Some spectators said it was the outcome of poor service delivery. Smoking in the stands and the vuvuzelas caused a nuisance for many international visitors. Others mentioned the empty stands, and lack of support from volunteers. Some said that the pricing of tickets were too high and this could even be considered as exploitation. Transportation and internet access was also described as very expensive. Recommendations for improvement, confirmed these very negative experiences. 8. Discussion and management implications An overwhelming 93,9% of respondents believed SA will successfully host the mega event which is much more positive than the findings of the FIFA study40, where 83% felt their country will be ready to host it. This is congruent with the demographic push factors illustrated in figure I. FIFA succeeded in providing enter-tainment. The experience of respondents in this study was very emotional in that it generated excitement and a sense of belonging and thus achieved one of the SA Tourism’s objectives, namely to ensure a lasting social legacy. The results further confirms that the benefits spectators seeked were all delivered in terms of fan mo-tives; namely eustress, supporting the national team, interest in players and aesthet-ics. The fundamental satisfaction was derived from the mediating factor, namely the players and spectators of the event itself, not the place. This is in line with the find-ings of Green and Chalip41 that spectators come together to affirm their personal identity, for socialisation and camaraderie, as well as the opinion of King42 that tourists segment themselves in terms of who they are and the experience they seek.
40 Ke Nako, op.cit., p. 4 41 B.C. Green, L. Chalip, op.cit., p. 286. 42 J. King, op.cit., p. 108.
Nerine Bresler 40
Public transport remained to be a challenge as was elicited in the FIFA43 study. This perception tarnishes the image of SA as a tourist destination since the turn of the century and requires serious interventions before the 2010 mega event. This is also one of the FIFA infrastructure requirements44. It would seem as if event organisers are able to make visitors feel safe whilst at the event, even though SA suffers from the general perception of being crime ridden45. An overwhelming majority would recommend SA as a tourist destination, and many intends to come back to SA for the 2010 Cup. However, research indicates that destination revisit intention, based on satisfaction, is a short-term intention, because of novelty seeking46. Concluding remarks SA must get the basics right in terms of world-class facilities and services if it wants to achieve the legacy that had only been vaguely defined at the outset. The major challenge lies in the improvement of public services such as transport, safety and security. In order to deepen the destination brand and to ameliorate, rather than reinforce geographical and enterprise differentiation, it is suggested that extended length packages be developed outside the match days because most spectators will be coming from outside Africa. Transient leisure travellers attending matches may combine the trip with sight-seeing and other tourist related activities, and first-time visitors are inclined to explore more possibilities than repeat visitors. Tourism enterprises can create public viewing areas where shared enjoyment and heightened emotive experiences could arise, as well as sentiments of patriotism, and ownership of the event itself and the community of which they are part. But, they must keep their base business happy; to ensure long term loyalty of existing customers. The changed economic climate will impact on the performance of hotels during the 2010 event and the ability to outperform competitors will depend on the revenue management experience and skills of hoteliers, restauranteurs and transport operators.
43 Ke Nako, op.cit., p. 5. 44 U. Davies, op.cit., p. 34. 45 G. George, op.cit., p. 576; M. Saayman, E. Du Plessis, op.cit., p. 60. 46 S. Jang, R. Feng, Temporal destination revisit intention: the effects of novelty seeking
and satisfaction, “Tourism Management” 2007, No. 28, p. 586.
The tourism development potential… 41
ROZWÓJ POTENCJAŁU TURYSTYCZNEGO NA PRZYKŁADZIE MISTRZOSTW ŚWIATA W PIŁCE NOŻNEJ W REPUBLICE POŁUDNIOWEJ
AFRYKI - 2010 FIFA WORLD CUP
Streszczenie Możliwość organizacji wydarzenia turystycznego o skali globalnej niewątpliwie wpływa na potencjał turystyczny regionu. Właściwe wykorzystanie wydarzenia wyma-ga dostarczenia turystom doznań o oczekiwanej przez nich jakości, tak aby osiągnąć wzrost popytu turystycznego również po zakończeniu wydarzenia. W artykule przed-stawiono porównanie potencjału turystycznego RPA dostarczanego przez sektor pry-watny i publiczny na bazie badań ankietowych.
Tłumaczył Adam Pawlicz


ZESZYTY NAUKOWE UNIWERSYTETU SZCZECIŃSKIEGO NR 592 EKONOMICZNE PROBLEMY TURYSTYKI NR 14 2010
AGITA DONIŅA School of Business Administration Turiba, Latvia
TOURISM CLUSTERS AS A BENEFIT FOR TOURISM ENTREPRENEURS IN LATVIA Introduction Tourism takes an important role in the national economy of Latvia – in 2007 export of tourism related services reached 343 mil. Lats or 18,1%1 of total Latvia’s service export. From the estimation of Central Statistical Bureau in 2004 and 2005 GDP of characteristic tourism sectors density constitute respectively 2,98% and 5,03%2. From the World Travel and Tourism Council estimation density of direct Latvian tourism sector GDP (Gross Domestic Product) in 2008 was 1,5%, while the tourism sector-specific contribution to the national economy could be much higher – 7,5% (2008)3. In comparison with previous years, the contribution of GDP has declined, despite the relatively high potential for tourism development in the country. Reduc-tion of tourism contribution to GDP, is caused by not only the foreign tourist flow reduction, but also possibly ineffective management of tourism enterprises. By seeking new forms of development, tourism industry professionals as one of the possible options have mentioned the need for deeper cooperation, which could re-sult in better tourism product development, cost optimization and joint marketing activities. So far, there is no detailed, individual research done on tourism destina-tions and tourism enterprises network. Following scientific researches and practices carried out in other countries, where as a successful example of collaboration clus-
1 Data from Central Statistical Bureau, www.csb.gov.lv. 2 Latvijas Tūrisma attīstības pamatnostādņu 2009–2015, gadam kopsavilkums, Ministry of
Economics of the Republic of Latvia, 2009. 3 World Travel and Tourism Council, Tourism economic research, Latvia 2008.
Agita Donina 44
ters are mentioned, this study is to evaluate the cluster concept and its applications in the management of tourism destination and enterprises. 1. Literature review on the cluster concept Many authors, starting from the last century’s 80ies and 90ies, have described, analyzed and tried to define clusters in different industries and different countries. The best known are the mega-clusters as Silicon Valley, several bio-technological clusters in many countries worldwide. Definitions of the cluster approach differs by many authors, however, it is believed that the authors have done their research based on M.E. Porter’s developed concept. M.E. Porter in his study „Clusters and the New Economics of Competition” has defined clusters as geographic concentra-tions of interconnected companies and institutions in a particular field un they have to „include governmental and other institutions – such as universities, standard – setting agencies, think tanks, vocational training providers, and trade associations – that provide specialized training, education, information, research, and technical support4. Looking to given definitions of different authors (for example, Porter; Swann and Prevezer5) it is possible to conclude that different authors as main feature has defined either geographically united enterprises within one industry or existence of cooperation between companies and organizations. For example, in the book „The dynamics of industrial clustering. International comparisons in computing and bio-technology”6 authors Swann and Prevezer say that clusters means a large group of firms in related industries as a particular location. Whereas other authors as a priori-ty defining clusters have stated cooperation and networking. Roelandt and den Her-tag7 have defined clusters as following: „Clusters can be characterized as networks of producers of strongly interdependent firms (including specialized suppliers) linked each other in a value-adding production chain”. More precise cooperation types and organizations have been marked out by W. Elsner, who considers that clusters should include organizations and institutions with recurrent, stable and long-term interaction and this interaction should be between near-by located suppli-
4 M.E. Porter, Clusters and the New Economics of Competition, „Harvard Business
Review” 1998, No. 76/6, pp. 77–90. 5 P. Swann, M. Prevezer, D. Stout, The dynamics of industrial clustering. International
comparisons in computing and biotechnology, Oxford University Press 1998. 6 Ibidem. 7 T. Roelandt, P. den Hertog, Cluster analyses and cluster – based policy making in OECD
countries: an introduction to the theme, in Boosting Innovation: the cluster approach, OECD, 1999, pp. 9–23.

Tourism clusters as a benefit… 45
ers, service providers, customers, competitors and different societal and public agents8. This definition, from the view of the author, by trying to list potential organi-zations and institutions, limits the principles of clustering and the possible forma-tion of a methodology for their detection. Author agrees with researchers who with-out defining specific companies, put emphasis on the nature of the cooperation. Simmie9 notes that interconnection among local actors should be based on competitive – cooperative relationship, which leads to better overall performance of every participant, raise of productivity, introduction of innovations. Looking at made or derived definitions by different authors, it appears that they are by essence very similar. Some authors (C. Santos, A. Almeida, A. Teixeira10) have pointed out that clusters definitions is too diffuse and doesn’t give a clear methodology how to evaluate clusters. Dahl11 considers, that many definitions, particularly the one M.E. Porter has done, is rather broad, but at the same time doesn’t allow to cluster be broader than a single definition. From the definitions results that it is possible to set up the main characteristics for defining clusters. These features are:
geographical concentration, core industries, mutual network and cooperation.
It is possible to conclude, that cluster should comprise the inter-connection feature, with consubstantiates itself in gains that go beyond the gains derivable from simple agglomeration. (Santos, Almeida, Teixeira12). 2. Tourism clusters Concept of clusters traditionally has been applied to different manufacturing sectors – microelectronics, biotechnology, pharmaceuticals etc. (Jacson and Mur-phy13, Cuhna and Cuhna14). It can also be applied to different sectors of services
8 W. Elsner, Real-World Economics Today: The new Complexity, Co-ordination and
Policy, „Review of social economy”, vol. LXIII, No. 1, March 2005, pp. 19–53. 9 J. Simmie, Innovation and clustering in the globalised international economy, “Urban
studies” 2004, No. 41 (5/6), pp. 1095–1112. 10 C. Santos, A. Almeida, A. Teixeira, Searching for clusters in tourism. A quantitative me-
thodological proposal, 2008, pp. 1–38. 11 M. Dahl, Synopsis for the Danish Cluster Studies, Aalborg University, 2000. 12 C. Santos, A. Almeida, A. Teixeira, op.cit., pp. 1–38. 13 J. Jackson, P. Murphy, Tourism destinations as clusters: Analytical experiences from the
New World, “Tourism and Hospitality Research” 2002, Vol. 4, No. 1, pp. 36–52.

Agita Donina 46
and particularly – to the tourism sector. Tourism cluster formation and analysis in the world is growing, given the importance of tourism sector growth in the overall national development. Still it is neglected area of research as well as practical im-plementation (S. Nordin15). Starting from 80ies – 90ies of the last century, several authors analyzed cluster concepts and clustering possibilities in tourism sector. The tourism cluster concept can be defined as a complex group of different elements, including services carried out by tourism companies or business (lodging, restora-tion, travel agencies, aquatic and theme parks, etc…); richness provided by tourist holiday experiences; multidimensional gathering of interrelated companies and industries; communication and transportation infrastructures; complementary activi-ties (commercial allotment, holiday traditions, etc.); supporting services (formation and information, etc); and natural resources and institutional policies. (Cunha and Cunha/ Montfort) More general definition is given by Dias16, who says that the tourism cluster may be perceived as a geographical concentration of cultural, social, environmental, economic and labor intensive activities where local actors and institutions interact and cooperate as to increase the value of a product. Cunha and Cunha17 propose definition that predicts that cluster is formed by companies bound up to tourism products and these companies and institutions are spatially concentrated and have vertical and horizontal relationships. The relations between enterprises and institutions and a tourism cluster can be understood in two ways (Cunha and Cunha/Rodrigues18:
1. Horizontal – by the creation of strategic alliances, where agreements can be between enterprises that have the same principal activity or between enter-prises working with the same group of customer satisfaction, but offering different product components to the customers.
2. Vertical – by the creation of strategic nets, where there is the establishment of a unilateral supplier customer relation among the partners in such a way that the object activities of the agreement are fulfilled by one of the parts, which gives its output to the other in exchange for a payment (Cunha and Cunha/ Rodrigues19).
14 S. Cunha, J. Cunha, Tourism Cluster Competitiveness and Sustainability: Proposal for
a systemic model to measure the impact of tourism on local development, “Brazilian Administra-tion Review” 2005.
15 S. Nordin, Tourism clustering and innovation – path to economic growth and develop-ment, ETOUR, 2003.
16 A. Dias, Tourism as a leverage sector in the new model of economic growth. 17 S. Cunha, J. Cunha, op.cit. 18 Ibidem. 19 Ibidem.
Tourism clusters as a benefit… 47
Cunha and Cunha20 stress that tourism clusters generally can include: a) a set of tourist attractions that draw non-resident attention; b) the concentration of tour-ism service companies: restaurants, accommodation, transport services, crafts, tra-vel agencies etc.; c) sectors providing support to tourism services; d) suitable and low-cost infrastructure (roads, energy, sanitation, health services, etc.); e) compa-nies and institutions that provide specialized qualification, information and financial capital; f) intern agents organized into class associations; g) government agencies and other regulating bodies that impact tourism agglomerations. Jackson and Murphy21 have stated the main characteristics of clusters. The authors believe that tourism cluster should present following characteristics:
firms’ interdependence or „complementarities” as stated by M.E. Porter22, flexible firm boundaries, by this understanding also temporal, spatial and
functional flexibility23, cooperative competition, trust in sustained collaboration, community culture and supportive public policies, where government sup-
port is focused more on improving the business environment, understanding of ethics, private sector leadership, wide involvement of cluster participants, incorporating in the cluster all in-
dustries and institutions, institutionalization of relationships, emphasizing on people and manage-
ment. The most important question is why it would be necessary to be in the cluster – what kind of benefits will have local municipality and enterprises themselves. Porter expresses the view that regions which have established clusters develop more successfully than others do (M. Porter 2003)24. From the works of several authors (M. Porter, A. Klepers, S. Nordin25 etc.) it is possible to conclude, that main bene-fits from clusters are:
increased efficiency, company growth in terms of product quality, growth of technological and organizational know-how, create economies of scale,
20 Ibidem. 21 J. Jackson, P. Murphy, op.cit., pp. 36–52. 22 M.E. Porter, op.cit., pp. 77–90. 23 A.M. Hjalager, Tourism destinations and the concept of industrial districts, “Tourism
and Hospitality research”, Vol. 2, No. 3, pp. 199–213. 24 M. Porter, The Economic Performance of Regins, “Reginal Studies”, No. 37, pp. 549–
578. 25 S. Nordin, op.cit.
Agita Donina 48
better marketing possibilities for region, positive effects on territorial economy.
The main idea, defining the potential benefits, is that it should be based on potential strength of the region. Then cluster should be identified and effort must be made to promote this cluster. Therefore region will benefit from being economical-ly active and developed. 3. Tourism clusters in Latvia The concept of clusters, and particularly, the mutual network and characteris-tics, related to it, encourage author to analyze possible tourism clusters in Latvia and potential benefit from this. So far in Latvia such research has been made only by A. Klepers26 who in his research determines tourism clusters geographically. As the case study he used research about tourism cluster in Sigulda and it’s surround-ing, identifying the spatial structure of the tourism sector in this region. In his re-search the geographical concentration as well as cooperation between cluster’s firms and organizations as main characteristic were used. There are two main starting points in a cluster identification study: 1) a case study approach, with a prior cluster suspicion or 2) a general approach, without any prior judgment regarding any agglomeration27. Author for future research plans to use first approach – investigates already set up cluster in Sigulda. The research’s aim is to study internal structure, forms and efficiency of cooperation within cluster and in the following studies to fortify the advantages of clusters and to explore its possible use in management of enterprises. Within this study author has explored definitions and determination of tourism clusters as well as identify what informa-tion is necessary for further research and what methods should be used. As main characteristics should be researched to determine clusters competitive advantages are:
26 A. Klepers, M. Rozīte, The Regional Development of Tourism and the Emergence of
Clusters in Latvia: The Example of Sigulda, „Research Papers of the Latvian Geographical Society” 2009.
27 C. Santos, A. Almeida, A. Teixeira, op.cit., pp. 1–38.

Tourism clusters as a benefit… 49
Table 3
Cluster competitive advantages
Characteristic Main indicators
Geographic density Location, distance, size, character
Cooperation network Forms, sustainability, formality
Core industries Number of industries and size, turnover
Institutions Tourism information centres, NGOs
Source: own elaboration. Taking into account statistic peculiarities and information available in enter-prises, there will be necessary through qualitative and quantitative data gathering. Choosing a study method, certainly, it is important to take into account which data is available, but no less important is the purpose of the study – results which scien-tist trying to acquire. In quantitative studies, the emphasis is placed on the explana-tion of the reasons, assuming other factors remain unchanged, but in the qualitative studies – the complex mutual interconnections. For evaluation of networking within cluster, in-depth interviews will be car-ried out. Attitudes, opinions and experience studies as main method will be used in the following case studies. Quantitative research methods will be used to analyze and evaluate quantitatively measurable magnitudes, such as distance, size, turnover etc. As etalon cluster author will use Sigulda and its surroundings, as it is set up by A. Klepers28 as one of the biggest and more visible cluster in Latvia. Sigulda is a tourism centre with a high level of economic activity. In 2007, 34 286 tourists spent the night in Sigulda. In 2008 – 36 09329, which is approximately 5% increase in a time, when mostly tourism enterprises in Latvia had decrease of visitors. Coop-eration among enterprises is indicated by the establishment of an NGO (non go-vernmental organizations) in 2000 that is called the Sigulda Region Tourism Asso-ciation. There are 48 members, most of whom are businesspeople; others are repre-sentatives of local governments.
28 A. Klepers, M. Rozīte, op.cit., pp. 24–37. 29 Data from Sigulda Tourism Information Center, http://www.tourism.sigulda.lv/ pub-
lic/lat/jaunumi/535.

Agita Donina 50
Conclusion
1. Concept of clusters has developed and analyzed for different industries, like computer technologies, biomechanics. It starts to be applied also in tourism.
2. There are started cluster studies in Latvia, but so far is not done any deeper research about their internal structure and cooperation possibilities.
3. It is needed to work out methodology for research, develop main characte-ristics and indicators to measure them and approbate them to one of tour-ism clusters in Latvia, particularly, Sigulda. As main characteristics, should be analyzed, can be mentioned geographic density; cooperation network between different companies, municipality etc.; core industries within clus-ter and institutions operating within clusters, for example, professional as-sociations.
MOŻLIWOŚCI TWORZENIA KLASTRÓW TURYSTYCZNYCH NA ŁOTWIE
Streszczenie Turystyka jest sektorem gospodarki, w którym oczekiwana stopa wzrostu jest bardzo wysoka, niemniej jednak w czasie ostatnich 3 lat udział turystyki w PKB Łotwy zmniejsza się. Jedną z przyczyn jest brak struktur klastrowych. Celem artykułu jest analiza klastrów turystycznych na Łotwie. W wyniku przeprowadzonych badań stwierdzono, że klastry zdecydowanie częściej powstają w branżach dóbr przemysłowych niż w sektorze turystycznym.
Tłumaczył Adam Pawlicz

ZESZYTY NAUKOWE UNIWERSYTETU SZCZECIŃSKIEGO NR 592 EKONOMICZNE PROBLEMY TURYSTYKI NR 14 2010
ANDRIS KLEPERS University of Latvia
PROBLEMS OF CREATING MICRO-CLUSTERS IN SMALL-SCALE TOURISM DESTINATIONS
Introduction The issues of promotion of local economic development or tourism growth on the micro-scale do not have simple answers. Local economic developement and growth is the main concern not only of small businesses, but also of the public sec-tor in rural societies. Rural tourism in the post-Soviet countries has developed par-tially on improvement of the basis accumulated during these times. In most cases, entrepreneurs (average age of the rural tourism entrepreneur in Latvia is 44,5 years (n = 194) according to the author’s research) involved in rural tourism have some experience of the Soviet collectivisation policy – the establishment and pseudo-activity of kolkhozy. Today these processes are often interpreted in a negative sense. Therefore, shares of private capital, knowledge and income are challenging in rural societies. Despite that, small-scale “cooperation & competition” strategies as an overall tendency are becoming more brought into effect in different sectors. Do the entrepreneurs accept the so-called co-opetition idea or are there any obstacles hold-ing them back from achieving larger objectives? The objective of this article is to analyze processes occurring in small-scale destinations that conform to tourism micro-cluster criteria and to research the spatial volume of these structures. Post-soviet countries in general have had a very good tradition of regionalization of tour-ism based on resources and planned tourist flows; yet the social processes have not been reflected in the geography of tourism. As the German geographer Schamp
Andris Klepers 52
says, “social sciences in particular have a great role to play in explaining the con-temporary processes of economic geography today”1. Another aspect here is communication across distances, which is encouraged by new technological tools, but also slowed down by the lack of a reliable road infrastructure and administrative boundaries. 1. Theoretical Substantiation Clustering and networking is difficult to analyze because it is an amalgama-tion of geographic, social and psychological processes. There are different views on the size and form of the cluster of tourism services. Can we identify the size and approximate boundaries of the cluster? Probably it is not a major problem – because of the informal character of the cluster it is a subject to change. At the same time, it is important to see it more accurately defined when we speak about promotion of tourism destinations – what size of territory should we promote and how to organize that? Hence, social networking and clustering can be perceived as one of the most useful insights for organising tourism destinations on a local scale. Defining the destination, Davidson and Maitland (19972) have mentioned an “active private sec-tor” as one of the important characteristics for recognizing tourism destinations. Hall (20003) added direction to that activity of private sector advising to ability of supporting tourism marketing and planning initiatives. Post-structuralist approach to places and spaces of tourism considers their presentation, production and consumption to be a socio-cultural process (Darcy & Small, 20084). Place is not something “out there” but it is socially constructed and therefore unstable, fluid and not fixed (Blunt & Rose, 20045). Discussion about measurement and borders of any spatial element becomes unnecessary when the concept of space is a fuzzy logic element with vague boundaries. That is supported by Michael (20076), who calls perceptions of regionality “artificial”. However, from
1 E.W. Schamp, Vernetzte Produktion. Industriegeographie aus institutioneller Perspekti-
ve, Darmstadt: Wissenschaftliche Buchgesellschaft, Darmstadt 2000, p. 5. 2 R. Davidson, R. Maitland, Tourism destinations, Hodder & Stoughton, London 2007. 3 C.M. Hall, Tourism Planning. Policies, Processes and Relationships, Pearson Education,
Singapore 2000. 4 S. Darcy, J. Small, Theorizing Precincts: Disciplinary Perspectives, in: City Spaces –
Tourist Places: Urban Tourism Precincts, B. Hayllar, T. Griffin, D. Edwards (eds), Elsevier, Oxford 2008, pp. 63–93.
5 A. Blunt, G. Rose, Introduction: women’s colonial and postcolonial geographies, in: Writing Women and Space: Colonial and Postcolonial Geographies, A. Blunt, G. Rose (eds), The Guilford Press, New York 1994, pp. 1–25.
6 E. Michael, Micro-Clusters and Networks: The Growth of Tourism (1st ed.), Elsevier Science, Oxford 2007.

Problems of creating micro-clusters… 53
the perspective of marketing it can be important. Here, the positivists’ “mind map-ping” approach (Pearce, 19777; Fridgen, 19878; Walmsley & Jenkins, 19929) can be used in regard to segmentation. From the marketing perspective, to accept adminis-trative borders as the only logical framework to be analyzed is to ignore the demand principles – tourists’ perception of place. Business networks are created disregard-ing the administrative borders of various areas, creating a different view of space, calling some areas “my territory” and “extraneous territory”. That leads to spatial analysis of the size of the cluster. Are clustering of the space and tourists’ percep-tions of the same space related? Porter (199010) defined a cluster as a group of companies, suppliers, service providers and institutions that are interrelated in a single sector, are in geographic proximity and engage both in mutual competition and co-operation. Geographic co-location may well be a necessary condition for effective clustering to occur, but it is not sufficient by itself (Michael, 200711). Furthermore, Michael (200712) speaks about co-location pools that could be interpreted both from the point of view of economy and space. Law (200213) says that cluster can be defined as a group of firms in a geographically concentrated space which are linked through a focus on a particular activity and which gain their strength and potential for growth through those links. Kelly (200814) adopts the same idea for city precincts. Besides spatial barriers we can also recognize limitations to informal cooperation. Some of these barriers are related to administrative and political boundaries in the destination, the blending of core and peripheral stakeholders, financial and administrative support to cluster formation, physical barriers or the absence of a champion (Mitchell & Schreiber, 200715; Klepers & Rozīte, 200916). Describing various industrial clusters,
7 P. L. Pearce, Mental souvenirs: a study of tourists and their city maps, “Australian Jour-
nal of Psychology” 1977, No. 29 (3), pp. 203–210. 8 J.D. Fridgen, Use of Cognitive Maps to Determine Perceived Tourism Region, “Leisure
Sciences” 1987, No. 9, pp. 101–117. 9 D.J. Walmsley, J.M. Jenkins, Tourism cognitive mapping of unfamiliar environments,
“Annals of Tourism Research” 1992, No. 19 (2), pp. 268–286. 10 M.E. Porter, The Competitive Advantage of Nations, The Free Press, New York 1990. 11 E. Michael, Micro-Clusters and Networks: The Growth of Tourism (1st ed.), Elsevier
Science, Oxford 2007. 12 Ibidem. 13 C.M. Law, Urban tourism: The Visitor Economy and the Growth of Large Cities (2nd
ed.), London 2002, Continuum. 14 I. Kelly, Precincts within the Urban Form: Relationships with the City, in: City Spaces...,
op.cit., pp. 107–127. 15 R. Mitchel, C. Schreiber Wine Tourism Networks and Clusters: Operation and Barriers
in New Zealand, in: City Spaces..., op.cit., pp. 79–106 16 A. Klepers, M. Rozīte, The Regional Development of Tourism and the Emergence of
Clusters in Latvia: The Example of Sigulda, in: Ģeogrāfiski Raksti, Folia Geographica XIV, Latvian Geographical Society, Riga 2009, pp. 24–37.

Andris Klepers 54
the geographical nearness as an important criterion is often ignored, clustering together firms even several hundred kilometres apart (Boroņenko, 200717), in size of a regional administrative entity like Bavaria (Genosko, 200618), within several local authorities (Mitchell & Schreiber, 200719). Michael (200720) focuses on the contribution of the cluster and network theory to the analysis and promotion of growth and local economic development in small tourism destinations. He writes that the cluster and network theory is a tool, among other strategic and analytical tools, for policy practices and regional economic de-velopment and growth. The notion of micro-cluster is defined as “geographic concentration of a small number of firms in a cohesive local environment, where the complementary interac-tion between those firms contributed to an enhanced level of local specialisation”21. The micro-cluster approach is based on the assumption that successful micro-clustering “might deliver superior community benefits in comparison with more traditional growth pole strategies”22. The concept of growth poles developed in the 1960s tried to deal with links between economic growth and spatial structures. One of the basic ideas in this concept of growth poles is that innovations are interrupted in time and space and that growth starts from the larger centre, which is linked with a higher density of population (Lasuén, 196923; Paelinc, 197724). Therefore, the micro-cluster approach is useful because small communities take control of the development process and create their own regional competitive advantage. However, some criticism here comes from the doubt about the possibilities to stimulate cluster formation and present clear solutions (Campos, 200925). Wei-denfeld, Butler and Williams (200926) argue that cumulative attraction or compati-
17 V. Boroņenko, The Role of Clusters in the Development of Regional Copetitiveness,
Summary of the Doctoral Thesis, Latvijas Lauksaimniecības Universitāte, Jelgava 2009. 18 J. Genosko, Clusterentwicklung in Bayern – Probleme und Perspektiven der Umsetzung,
in: Standortwettbewerb und Tourismus: Regionale Erfolgsstrategien, H. Pechlaner, E. Fischer, E. Hammann (eds), Erich Scmidt Verlag, Berlin 2006, pp. 61–77.
19 R. Mitchel, C. Schreiber, Wine Tourism Networks and Clusters: Operation and Barriers in New Zealand, in: City Spaces..., op.cit., pp. 79–106.
20 E. Michael, op.cit. 21 Ibidem, p. 2–3. 22 Ibidem, p. 128. 23 J.R. Lasuen, On Growth Poles, “Urban Studies” 1969, No. 6 (2), pp. 137–161. 24 J.H.P. Paelinck, Über Wachstum und Wachstumslenkungen. Investitionen,
Industriensiedlungen, Güterverflechtungen, Institut Wirtschaftspolitik und Wirtschaftsforschung der Universität Karlsruhe, Karlsruhe 1977.
25 M.J.Z. Campos, A Review of “Micro-clusters and Networks: the Growth of Tourism”, “Journal of Sustainable Tourism” 2009, No. 17 (4), pp. 525–528.
26 A. Weidenfeld, R.W. Butler, A.M. Williams, Clustering and Compatibility between Tourism Attractions, “International Journal of Tourism Research” 2009, No. 1-16, www3.interscience.wiley.com/journal/10009388/home.
Problems of creating micro-clusters… 55
bility is a powerful factor for decisions about the location of retail outlets, stressing that studies largely ignore the impact of spatial and thematic clustering on compati-bility between tourism businesses. According to Lynch and Morisson (200727), networks and networking are seen as mechanisms to enhance competitiveness and growth in destinations, the basis that might lead to the creation of a business cluster. The concepts of networking (formal, semi-formal and informal) and the role of trust are explored to explain co-operative behaviour of small tourism firms. The evolu-tion of informal networks and the consequent strengthening of social capital and trust are seen as the basis for potential formal networks and cluster formation. Case studies show how networks can operate as trust-building mechanisms (Lynch & Morisson, 200728). Among the forms of clustering, diagonal clustering (Michael, 200729) is com-mon practice in local destinations. That provides a solution how to turn competition into a united power to raise the competitiveness of the destination in general. That is well characterized with a culinary metaphor by Brandenburger and Nalebuff (199630): “Thinking complements is a different way of thinking about business. It’s about finding ways to make the pie bigger rather than fighting with competitors over a fixed pie. To benefit from this insight, think about how to expand the pie by developing new complements or making existing complements more affordable.” (Brandenburger & Nalebuff, 199631) They have also used the term “co-opetition”, describing hybrid behaviour comprising competition and cooperation at the same time (Brandenburger & Nale-buff, 199632), which is widely described by several scholars (Lado, Boyd & Hanlon, 199733; Gnyawali & Madhavan, 200134; Dagnino & Padula, 200235) that try to give more insights into this phenomenon.
27 P. Lynch, A. Morisson, The Role of Networks, in: Micro-Clusters and Networks: The
Growth of Tourism, E. Michael (ed.), 1st ed., Elsevier Science, Oxford 2007, pp. 43–63. 28 Ibidem. 29 E. Michael, op.cit. 30 A.M. Brandenburger, B.J. Nalebuff, Co-opetition, Foreword ed., Currency Doubleday,
New York 1996. 31 Ibidem, p. 14–15. 32 Ibidem. 33 A.A. Lado, N. Boyd, S.C. Hanlon, Competition, Cooperation, and the Search for Eco-
nomic Rents: A Syncretic Model, “Academy of Management Review” 1997, No. 22 (1), pp. 110–141.
34 D.R. Gnyawali, R. Madhavan, Cooperative Networks and Competitive Dynamics: A Structural Embeddedness Perspective, “Academy of Management Review” 2001, No. 26 (3), pp. 431–445.
35 G.B. Dagnino, G. Padula, Coopetition Strategy a new kind of Interfirm Dynamics for Value Creation, http://www.altruists.org/static/files/coopetition%20strategy.pdf, 10.01.2010.
Andris Klepers 56
As the discussion above shows, it is clear that clustering can be one of the solutions to raise competitiveness of small-scale rural tourism destinations. Due to criticism of the possibilities to stimulate clustering, a case study was carried out to analyze processes. 2. Methods Micro-cluster analysis was chosen to research options to enhance the level of economic opportunity for a rural community. It included in-depth interviews with local entrepreneurs to research the strength of networking and basis for co-opetition within a micro-cluster. Content analysis of websites of the businesses of the re-spondents revealed how formal the co-operation is. At the same time, mind-mapping of tourists was carried out – i.e., an investigation of how the tourists per-ceive the places. The cognitive mapping and perceptual regionalization method based on Fridgen’s (198736) advice gave some insights into marketing segmentation strategies. Altogether 97 tourists in various sights of the Lake Usma destination were interviewed. The bulk of them were family members (48%) and small groups of friends (45%) – in total 428 visitors mostly from the capital city (42%). Lake Usma– the second largest lake of Latvia – was used as a case study to analyse micro-cluster processes. There were several criteria for choosing this place:
the area is distant from larger towns and tourist attractions; the area has had a significant tourism growth within the last 15 years; the area is located in periphery of three different administrative counties –
it is administratively fragmented; the territory does not have any specific characteristics that could prevent
the results from being generalized about other small-scale destinations. Research was done in the tourism season of 2009. 3. Results and Discussion Lake Usma can be identified as a small-scale destination with the area of 120 km2 mainly experiencing domestic tourism flows. Similar areas are found in any other country. There are 19 different places of accommodation offering approx. 700 beds located in geographic proximity (see Figure 1). Every place also offers differ-ent primary tourist attractions: angling, boating, sailing, wellness and SPAs, etc.
36 J.D. Fridgen, Use of Cognitive Maps to Determine Perceived Tourism Region, “Leisure
Sciences” 1987, No. 9, pp. 101–117.

Problems of creating micro-clusters… 57
The lake, the homogeneity of the surrounding landscape, concentration of entrepre-neurship are promising prerequisites for a spatial structure of the micro-cluster.
Figure 1. Location of accommodation in the Lake Usma destination
Tourists confirmed that the place is generally perceived as a destination sepa-rate from other tourism centres (52%). Three other spatial perceptions were identi-fied (about 20% of opinions each) including a lake destination with one of the near-est towns in a distance of 22 km (Figure 2). Perceptions were differently influenced by experience, interests, direction of driving and less by gender and age. Approx. half of the tourists (44,8%) had returned to the area repeatedly, having good impres-sions about the place. However, 54% could not recognize the administrative county where they stayed overnight, but from the rest that were well-informed, 22% recog-nized it false. According to the perceptions of the destination, we get more argu-ments for the place promotion tactics.

Andris Klepers 58
Figure 2. The perceptual region of Lake Usma
In contrast, management of the destination is much more complex. Since the destination spans three municipalities, promotion activities are carried out by tourist information centres located in the nearest towns in a distance of 22 kilometres or are fragmented and performed by every single business entity. Informal networking and clustering is very weak. Two nuclei of diagonal clustering were identified as well as a few horizontal clustering examples in the accommodation sector. Coop-eration is evident in the high season in cases of overbooking, mainly when the tour-ist flows are usually shared by the nearest competitors. However, content analyses of websites did not confirm that, which proved the informal character of any coop-eration. Only two cases out of 19 indicated a partnership with others nearby. Entre-preneurs mainly do not associate with their colleagues in the opposite bank of the lake even if there is just a few kilometre distance in-between. Boats are not used as means of transport to establish communication yet, and because of the less inhab-ited peripheries of the municipalities, the poor state of the road infrastructure is a physical factor slowing down any active contacts. The first step to establish pro-motion of the lake as a single destination has been misused. Co-operation ceased after the first formal meeting and the first published brochure that received financial support to encourage clustering.
Problems of creating micro-clusters… 59
The main barriers for co-opetition strategies indicated by entrepreneur in the interviews are the following:
an unsatisfactory road infrastructure; non-existing traditions of co-operation or negative experience of the Soviet
model of kolkhozy; distrust of the quality of the product of the potential partners and their atti-
tude to clients; lack of communication between local and non-local entrepreneur; misinterpretation of competitiveness and business secrets; envy of leaders and a tendency to restrained individualism, which probably
is related to the mentality of the nation. That proves that stimulation by way of enhanced communication and some financial support for activities implemented together is not enough. At the same time, the respondents rated willingness to co-operate more by 7,6 points out of 10, boosting hope for micro-clustering in future (including some sceptics). The size of the destination is adequate for the structure of a micro-cluster, allowing physical communication in order to establish good relationships and increase trust in co-opetition. Daily routes to the nearest centres (different places depending on the location at the lake) of services covered 22 kilometres on average, which is an op-timal distance for physical communication to encourage trust and informal deals. Nevertheless, the distance also points to some limitations to stimulating a micro-cluster environment. One of the main requirements to make networking stronger is good road infrastructure. That allows for even more potential of the new communi-cation technologies to expand. Nevertheless, as the only factor for establishing trust and a basis for fruitful networking, expansion of technologies is regarded with dis-trust in this rural society at the moment. Conclusions
1. Concentration of related tourism businesses in geographic proximity in small-scale rural tourism destinations does not guarantee emergence of mi-cro-clusters and active networking.
2. The optimal size of the micro-cluster should not exceed the daily driving distances of the entrepreneur since physical communication is of great value in this rural society. However, further research regarding that is nec-essary.
3. There are different obstacles to networking, some of them physical like the lack of a reliable road infrastructure; nevertheless, social barriers dominate. That gives more credibility to pro-micro-cluster arguments – it is clear that micro-clustering can help solve the issues pertaining to social barriers.

Andris Klepers 60
4. The perceptual regionalization method can give some valuable insights into the marketing possibilities of the destination.
5. The analyzed example does not give a clear answer to the doubts about the possibility to engage the entrepreneur’s interest efficiently in the idea that a micro-cluster and co-opetition strategies can bring success to every par-ticipant. Further research should be undertaken. Existence of organised mi-cro-cluster activities in tourism destinations fosters higher development level of the destination promotion than without micro-cluster activities.
PROBLEMY BUDOWANIA KLASTRÓW TURYSTYCZNYCH W NIEWIELKICH REGIONACH TURYSTYCZNYCH
Streszczenie Problemy wzrostu gospodarczego w małych regionach turystycznych dotyczą w równym stopniu sektora małych i średnich przedsiębiorstw, jak i samorządu terytorialnego. W artykule przedstawiono problemy budowania klastrów turystycznych oraz wpływ samorządu terytorialnego na omawiany proces na przykładzie jeziora Usma na Łotwie. W wyniku przeprowadzonej analizy stwierdzono, że duża koncentracja przedsiębiorstw turystycznych nie gwarantuje sukcesu w formowaniu klastra turystycznego.
Tłumaczył Adam Pawlicz

ZESZYTY NAUKOWE UNIWERSYTETU SZCZECIŃSKIEGO NR 592 EKONOMICZNE PROBLEMY TURYSTYKI NR 14 2010
RIDVAN KOZAK, MEDET YOLAL Anadolu University
EFFECTIVENESS OF DOMAIN NAMES: AN ANALYSIS OF THE COUNTRY DESTINATION WEB SITES
Introduction Destination marketing is increasingly becoming competitive worldwide. Tour-ism destination marketing has traditionally been heavily oriented towards the pro-motion function, a tendency that will no doubt continue well into the future1. Pro-viding innovative and well coordinated tourism products is therefore exceedingly important for tourism destination2. An integral component of building a global brand name or a global destination brand includes the use of the Internet to commu-nicate to audiences all over the world. In the particular case of tourism, the Internet has helped its expansion by disseminating information3. Web based destination marketing has become a reality for most Destination Marketing Organizations (DMOs) and simultaneously constitutes a great opportunity for these organizations4. According to the Travel Industry Association of America, 67% of online travelers in the USA search for information on destinations or check prices or schedules via
1 R.J.B. Ritchie, J.R.B. Ritchie, A framework for an industry supported destination mar-
keting information system, “Tourism Management” 2002, No. 23, pp. 439–454. 2 D. Buhalis, Marketing the competitive destination of the future, “Tourism Management“
2000, No. 21, pp. 97–116. 3 R.K. Gertner, K.A. Berger, D. Gertner, Country-dot-com: Marketing and branding desti-
nations online, “Journal of Travel & Tourism Marketing” 2006, No. 21 (2/3), pp. 105–116. 4 U. Gretzel, Y. Yuan, D.R. Fesenmaier, Preparing for the new economy: advertising
strategies and change in destination marketing organizations, “Journal of Travel Research” 2000, No. 39, pp. 146–156.
Ridvan Kozak, Medet Yolal 62
the Internet; 41% book tickets, rooms, or car rentals in 20055. As Web based mar-keting strategies have become more widely adopted, pressure on DMOs to account for investments in their Web sites has increased6. Gertner et al. (2006) assert that to succeed in their efforts to attract visitors, destinations must design sound online marketing and branding strategies. Yet with the fierce competition for Internet users, online marketers must secure memorable Web name domains and addresses. Country-dot-com provides ease of access for the consumer without use of a search engine. In addition, by having a country portal with the country name-dot-com domain a country has the opportunity to achieve potential synergies among all its tourism activities in the marketing of itself on the Internet to global audiences. Regarding the unique domain names, the truth is that almost every word in the dictionary and even advisable combination of words had already been registered by most domain name investors or speculators (for checking, see www.register.com). Good domain names could only be purchased from secondary markets. On this basis, for example, fund.com was sold in the year 2008, at an incredible price. Ac-cording to media reports7, israel.com was sold for 5,88 million USD to an unidenti-fied buyer by its previous owner. In addition to this sale, we can also mention mel-bourne.com (700 000 USD), gibraltar.com (360 000 USD), buckhead.com (250 000 USD), perth.com (200 000 USD) zimbabwe.com for (130 000 USD)8. It can be stated that geographic domain names (geodomains), which contain the names of cities, states or countries, have emerged as one of the strongest focus for serious domainers. It may be argued that such domain names have been the ‘jewels in the crown’ in the market. It is clear that many Web site searchers use search engines to locate online information or service9. Search engines provide easy access to Web resources, as nearly 70 percent of Web visitors use a search engine as their starting point10. At this point it should be underlined that search engines are primarily information re-trieval tools rather than instruments of navigation or transaction/commerce. Accord-ing to Cutrell and Guan (2007), when consumers could not find the target results for navigational search, they usually select the first result or switch to a new query.
5 B. Pan, T. Maclaurin, J.C. Crotts, Travel blogs and the implications for destination mar-keting, “Journal of Travel Research” 2007, No. 46, pp. 35–45.
6 Y.A. Park, U. Gretzel, Success factors for destination marketing web sites: A qualitative meta-analysis, “Journal of Travel Research” 2007, No. 46, pp. 46–63.
7 http://www.haaretz.com/hasen/spages/989326.html. 8 http://www.dnjournal.com/archive/domainsales-archive-2007.htm 9 B. Jansen, A. Spink, How are we searching the World Wide Web? A comparison of nine
search engine transaction logs, “Information Processing and Management” 2006, No. 42, pp. 248–263.
10 D. Sullivan, Nielsen/NetRatings search engine ratings, (2006), http://searchenginewatch.com/showPage.html?page=2156451, 12.09.2008.

Effectiveness of domain names… 63
Consequently, “findability” is an important feature for the success of the destination Web sites. Therefore the aim of the paper is to provide a framework for compre-hending the effectiveness of a domain name and examine the effectiveness of geo-domains. The paper reports the findings of a survey conducted on the effectiveness of destination Web site domain names providing tourist information in Europe and Asia. Finally, the paper concludes on the findings and suggestions for destination managers and further research. 1. Methodology The aim of this research is to create a model for evaluating the effectiveness of domain names, and also to analyze the country destination Web site domain names (URL) providing tourist information in Europe and Asia. The Web sites of the countries are selected from the URL on the first page of an organic search results of a certain search term/keyword which is a country name, be it Turkey, Japan, France, and others in a leading search engine, Google. On the other hand, we need to emphasize that being prominent on the first page doesn’t mean these sites are absolutely providing satisfied or eye-catching content to their visitors. Its engine ranks pages largely on the basis of how many other sites are linked to them, sending the most popular pages to the top. 2. Data Collection and Rating System When determining the Web site domain names focusing on the tourism infor-mation about the countries as tourism destinations, the Google’s keyword tools were used to receive keywords. Taking into consideration on the descriptive key-words ideas, it has been decided to use the original name of a country (for example; Turkey, Japan, Germany and so on) as the most popular keyword. To determine the most concerned ones (tourism Web site-URL) in appearing domain names on the first page of search results, two research assistants were em-ployed, whose expertise is in the field of e-tourism. Considering the fact that meta-data contributes to the information search process by creating first impressions about respective Web pages, the keyword was entered in Google’s toolbars to cap-ture the Web sites (URLs), and then the search results were examined from the point of the intensity of persuasiveness of metadata presented in the search results. After this stage, a Web site was determined having one of gTLD extensions, respec-tively .com, .travel, .net, .org and related country extension and selected for the analysis.

Ridvan Kozak, Medet Yolal 64
Furthermore, the assistants were also asked to rate (from 5 - excellent to 1- very poor) the selected destination Web site names considering the effectiveness criteria listed below:
It is an excellent (5) domain name if a domain has a geographic dictionary name with one of .com or .travel extension types, into standard ASCII, with only letters, and also at a structure of formal, conventional.
It is a good (4) domain if a domain has a geographic dictionary name with all gTLDs except for .com and .travel, an advisable combination of two words with .com or .travel, a root word with prefix and suffix (ie.emarketing.com) and also it is a sub-domain of an excellent generic name (dictionary name) related to a industry.
It is a fair (3) domain if a domain has an advisable combination of two words with all extension except for .com or .travel or a combination of two words including a hyphen with .com or .travel, a combination of three words with .com or .travel, and also it is a sub-domain of a good generic name (dictionary name) related to a industry (i.e. turkey.tourism.net).
It is a poor (2) domain if a domain has a combination of two words includ-ing a hyphen and a combination of three words with gTLDs except for .com and .travel or a combination of many words with .com or .travel, and also include repeated characters, abbreviated words, numbers or hyphens.
It is a very poor (1) domain if a domain has a combination of many words with all extensions except for .com or .travel, and also include repeated characters, abbreviated words, numbers or hyphens.
The data obtained from the rating system were coded, verified and keyed into a computer data file. The descriptive statistics of mean, and standard deviation were computed from the ratings. A (t) test, at the 0,05 confidence level, was used to de-termine any significant differences between the groups of Asian and European countries. All data were analyzed using the SPSS version 10. 3. Findings When considering the behaviors of the Web searchers, there is no doubt that once a site is positioned in the top 10 for a keyword search, it attracts more visitors and people are satisfied if they can find what they are looking for in the first page. In this regard DMOs should strive for placing their Web sites on the top ten results of a keyword search. Also, needless to say, these domain names incorporate the appropriate site design techniques having the greatest impact on Google organic search rankings. Because of the technical nature of organic search optimization these domain names are incorporated in the lists of a total of ten links to sites in the natural or organic

Effectiveness of domain names… 65
listings. Also they have the intensity of persuasiveness of metadata presented in the search result by creating first impressions about respective Web sites. As can be traced from Table 1, merely seven domain names for Asia (12%), namely Nepal, Bangladesh, Myanmar, Georgia, Turkmenistan, South and North Cyprus are excellent. In the same vein, five domain names out of 45 European countries (11,1%) are ranked as excellent, and these countries are France, Hungary, Netherlands, Russia and Slovakia. Good domain names dominate both continents: 33% of Asian and 60% of European countries’ domain names are ranked good. Regarding the poor and very poor domain names, European countries are better than the Asian countries. Since, 33% of Asian countries are ranked as poor and very poor, this rate drops to 20% for the European countries. Also, an examination re-garding to the constitutive and formative properties of the selected domains is given below in Table 1.
Table 1
Attributes/traits of Tourism Website Domains Relating CONSTITUTIVE PROPERTIES
EUROPE (n=45)
ASIA (n=55)
FORMATIVE SPECIFICATIONS
EUROPE (n=45)
ASIA (n=55)
Domain Exten-sion Status
n % n % Name Conforma-tions
n % n %
ccTLDs 9 20 10 18 Conventional 45 100 55 100 General ccTLDs 9 100 10 100 Unconventional - - - - Country-Specific ccTLDs
- - - - Name Classes
gTLDs 36 80 45 82 Dictionary/generic names
5 11 6 11
Unsponsored gTLDs
36 100 45 100 Combination of words 40 89 49 89
.Com 24 68 33 73 Name Compositions
.org 7 19 9 20 Only letters 42 93 46 84
.info 3 8 - - including hyphen or number
3 7 9 16
.Net 2 5 3 7 GRADUATION Sponsored gTLDs - - - - Very Poor Domains 4 9 8 15 Domain Name Languages
Poor Domains 5 11 10 18
Into standard ASCII
45 100 55 100 Fair Domains 4 9 12 22
Internationalized - - - - Good Domains 27 60 18 33 Domain Name styles
Excellent Domains 5 11 7 12
Formal Domains 45 100 55 100 Structured/Sub-domain
- - - -
Source: own elaboration.
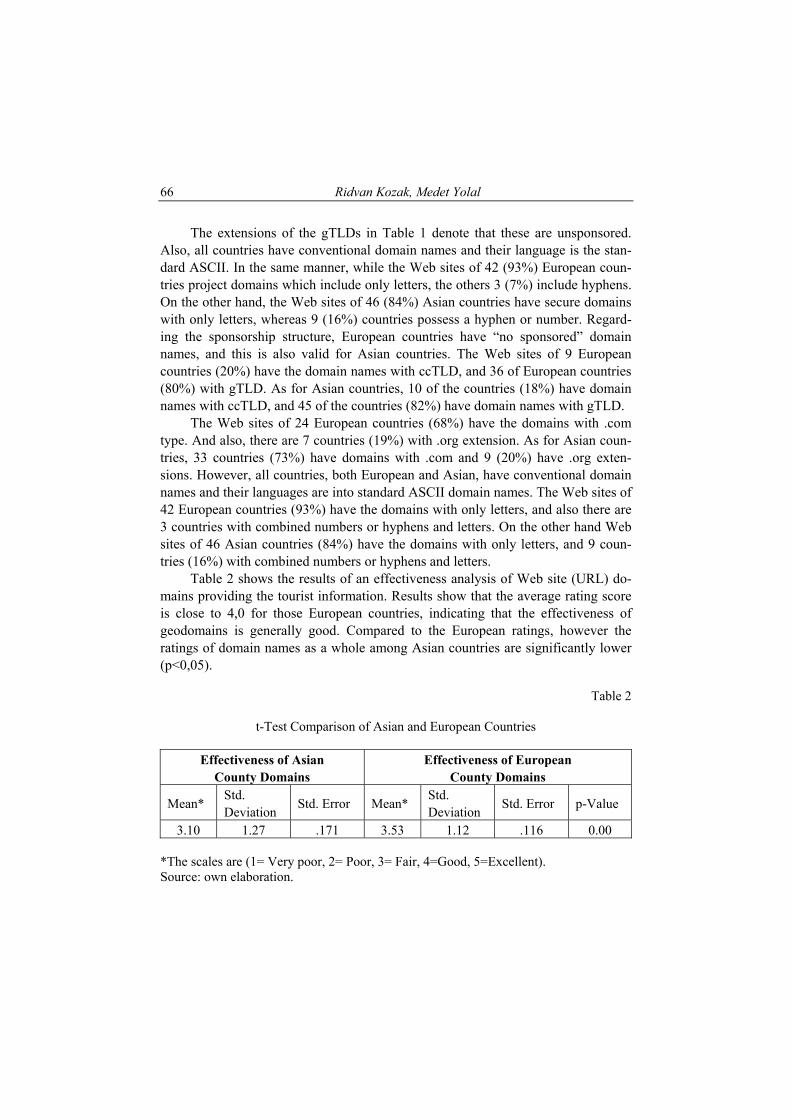
Ridvan Kozak, Medet Yolal 66
The extensions of the gTLDs in Table 1 denote that these are unsponsored. Also, all countries have conventional domain names and their language is the stan-dard ASCII. In the same manner, while the Web sites of 42 (93%) European coun-tries project domains which include only letters, the others 3 (7%) include hyphens. On the other hand, the Web sites of 46 (84%) Asian countries have secure domains with only letters, whereas 9 (16%) countries possess a hyphen or number. Regard-ing the sponsorship structure, European countries have “no sponsored” domain names, and this is also valid for Asian countries. The Web sites of 9 European countries (20%) have the domain names with ccTLD, and 36 of European countries (80%) with gTLD. As for Asian countries, 10 of the countries (18%) have domain names with ccTLD, and 45 of the countries (82%) have domain names with gTLD. The Web sites of 24 European countries (68%) have the domains with .com type. And also, there are 7 countries (19%) with .org extension. As for Asian coun-tries, 33 countries (73%) have domains with .com and 9 (20%) have .org exten-sions. However, all countries, both European and Asian, have conventional domain names and their languages are into standard ASCII domain names. The Web sites of 42 European countries (93%) have the domains with only letters, and also there are 3 countries with combined numbers or hyphens and letters. On the other hand Web sites of 46 Asian countries (84%) have the domains with only letters, and 9 coun-tries (16%) with combined numbers or hyphens and letters. Table 2 shows the results of an effectiveness analysis of Web site (URL) do-mains providing the tourist information. Results show that the average rating score is close to 4,0 for those European countries, indicating that the effectiveness of geodomains is generally good. Compared to the European ratings, however the ratings of domain names as a whole among Asian countries are significantly lower (p<0,05).
Table 2
t-Test Comparison of Asian and European Countries
Effectiveness of Asian County Domains
Effectiveness of European County Domains
Mean* Std. Deviation
Std. Error Mean* Std. Deviation
Std. Error p-Value
3.10 1.27 .171 3.53 1.12 .116 0.00 *The scales are (1= Very poor, 2= Poor, 3= Fair, 4=Good, 5=Excellent). Source: own elaboration.
Effectiveness of domain names… 67
Conclusion For businesses to communicate effectively on the Internet, it is essential that they have a unique “address” that is easily recognizable to customers11. This is also true for the tourism destinations which are striving in a fierce competition. As such, the only way to secure specific words or word combinations is to purchase them from the current owner or wait for someone who accidentally forgets to renew their registration for them. Apparently, rather than chasing and following the expired domains, the real players, that is the potential domain investors have to head to-wards the domain speculation market. A lot of appealing domain names can be bought secondhand at Sedo or similar domain name collectors. The findability problem is more drastic for the tourism destinations and busi-nesses. Consequently, this study aimed to provide a framework for comprehending the effectiveness of a domain name and examined the effectiveness of geodomains in Europe and Asia. The study offered a five point effectiveness criteria from very poor to excellent. The analysis of the domain names of European and Asian coun-tries showed that almost one tenth of destination domain names are in an excellent structure while half of the domain names are good. On the other hand poor domain names dominate the Asian countries. In this regard, it is found that European geo-domains were more or less in a better position compared to Asian countries. This study is limited to the domain names of European and Asian countries. However there is a need for further studies covering all the countries around the world. Further studies may also deal with the contents of destination Web sites and the usability of those Web sites. On the other hand trust on such destination web-sites is an important issue to understand. Future studies may also research on the trust of the users on destination websites. Such studies will enhance our understand-ing of the Internet use and contribute to both practitioners and academics. EFEKTYWNOŚĆ DOMEN INTERNETOWYCH NA PRZYKŁADZİE BADAŃ
STRON INTERNETOWYCH WYBRANYCH KRAJÓW
Streszczenie Nazwy domen internetowych są niewątpliwie dobrem rzadkim, co implikuje konieczność ich efektywnego wykorzystania. W artykule przedstawiono autorską koncepcję mierzenia efektywności domen na przykładzie wybranych państw z Europy
11 C.F. Hamilton, F.F. Wang, Domain names management and legal protection, “Interna-
tional Journal of Information Management” 2005, No. 26, pp. 116–127.

Ridvan Kozak, Medet Yolal 68
i Azji. W wyniku badań stwierdzono znaczne różnice w efektywności stron internetowych pomiędzy państwami leżącymi w Europie i Azji.
Tłumaczył Adam Pawlicz

ZESZYTY NAUKOWE UNIWERSYTETU SZCZECIŃSKIEGO NR 592 EKONOMICZNE PROBLEMY TURYSTYKI NR 14 2010
IRENEUSZ MARGANIEC Amadeus Polska sp. z o.o.
TRENDY W OBSŁUDZE PODRÓŻNYCH ZWIĄZANE Z KRYZYSEM GOSPODARCZYM ORAZ WYZWANIA, JAKIE STOJĄ PRZED BRANŻĄ
TURYSTYCZNĄ I KADRĄ ZWIĄZANĄ Z TURYSTYKĄ 1. Rozwój technologii wymusza zmiany Trudno dziś wyobrazić sobie funkcjonowanie biura podróży bez wykorzysta-nia nowoczesnych technologii informatycznych. Dzięki istnieniu systemów będą-cych olbrzymimi bazami danych nawet niewielkie agencje mają stały dostęp do milionów ofert różnorodnych przedsiębiorstw turystycznych sprzedających swoje usługi na całym świecie. Agent turystyczny, który chce zapewnić swoim klientom możliwość zakupu biletów lotniczych, nie musi być już zrzeszony w IATA. Firmy GDS (Global Di-stribution Systems) umożliwiają korzystanie ze swoich systemów także biurom non-IATA, dzięki czemu liczba agentów oferujących m.in. przeloty regularnych przewoźników może się stale powiększać. 2. Ewolucja systemów Podstawowym celem firm GDS jest dostarczanie rozwiązań dla biur podróży, dzięki którym możliwe jest realizowanie potrzeb turystów biznesowych oraz indy-widualnych. Systemy te były początkowo dość skomplikowane w obsłudze i działały tylko w trybie tekstowym, co wymagało znajomości wielu komend. Wraz z rozwojem technologii korzystanie z nich stało się łatwiejsze. Z punktu widzenia agenta, systemy rezerwacyjne są coraz bogatsze w oferty i możliwości automatyza-cji pracy. Dla wygody użytkownika najbardziej popularny system

Ireneusz Marganiec 70
w Polsce – Amadeus Selling Platform – posiada dwa interfejsy, umożliwiające zarówno pracę w tradycyjny sposób, jak i korzystanie z rozwiązania zwanego Gra-phical User Interface, które logiką i strukturą funkcjonowania przypomina przeglą-darki internetowe. Rozwój rynku turystycznego, a także ogólny dostęp do Internetu sprawiły, że globalne systemy dystrybucji zaczęły oferować swoim agentom produkty umożli-wiające im rozszerzenie zakresu usług. Dziś podróżny nie musi już dzwonić do agencji turystycznej w jej godzinach pracy. Dzięki specjalnie przygotowanym stro-nom internetowym dostęp do ofert znajdujących się w bazach systemów GDS ma nie tylko pracownik biura podróży, ale także turysta, który może przez 24 godziny na dobę i 7 dni w tygodniu przeglądać i rezerwować połączenia lotnicze oraz miej-sca w hotelach, a także wynajmować samochody. Według danych Instytutu Tury-styki, obecnie za pośrednictwem systemów GDS przez serwisy internetowe (on-line + call center) sprzedaje się około 13 proc. biletów lotniczych w Polsce. Mimo wy-sokiej dynamiki rynek wciąż jest w fazie rozwoju, a klienci dopiero przekonują się, że kupno biletu lotniczego za pośrednictwem Internetu jest szybkie, skuteczne, bezpieczne i bardzo wygodne. Rynek systemów GDS jest dostosowany do bardzo wysokiego poziomu konkurencyjności w branży. Firmy GDS zdają sobie sprawę, że przy tak silnej rywalizacji biura podróży nie potrzebują jedynie systemu dystry-bucji, ale partnera technologicznego, dlatego oferowane są rozwiązania nie tylko do tradycyjnych kanałów dystrybucyjnych, ale także do sprzedaży on-line przez agen-cje. To właśnie na takich rozwiązaniach opierają swoje wyszukiwarki popularne portale turystyczne. Tego typu produkty sprzedaje np. Traveltainment, firma nale-żąca do utworzonej w 2008 roku nowej jednostki biznesowej Amadeusa, The Ama-deus Leisure Group. Portfolio produktowe firm z rynku GDS jest o wiele szersze, niż może się wydawać. Poza bodajże najbardziej standardowymi produktami, jak Amadeus Sel-ling Platform, Galileo Desktop, Worldspan Go! i rozwiązaniami Sabre (to cztery główne firmy GDS), pojawiają się także nowe, wspomagające codzienną pracę biur podróży. Wraz z rozwojem branży i zachodzącymi zmianami coraz większym zain-teresowaniem cieszą się inne rozwiązania z zakresu business management, e-commerce oraz usługi konsultingowe i szkoleniowe. Co prawda dystrybucja na-rzędzi służących do obsługi podróży biznesowych pozostaje głównym polem dzia-łania firm GDS, zauważamy jednak coraz większe zapotrzebowanie na produkty typu midoffice, backoffice czy CRM. Widoczna jest też nieustająca konsolidacja. Rynek GDS w Polsce poddaje się stałym procesom przemiany, podobnie jak inne sektory biznesu. Aby na nim konku-rować, firmy tworzą nowe produkty, silniejsi wykupują inne marki działające na rynku, tworząc tym samym olbrzymie korporacje oferujące całą gamę rozwiązań zarówno dla małych, jak i dużych sieci biur podróży.

Trendy w obsłudze podróżnych… 71
3. Wyzwania stojące przed firmami, które opracowują i wdrażają technologie e-commerce Gospodarka 2.0 To globalna sieć, której węzłami są nie tylko przedsiębiorstwa i instytucje rządowe, ale też aktywni konsumenci wpływający na rynki, których są częścią. Aktualny kryzys swoje apogeum osiągnął w najbardziej rozwiniętych krajach i tym samym ujawnił, że tradycyjne instytucje kapitalizmu – rynki, regulatorzy i przed-siębiorstwa – nie są wystarczająco przygotowane do wyzwań, przed jakimi stawia ich Gospodarka 2.0. Budowanie społeczności 2.0 Informatyczne narzędzia współpracy, takie jak sieci społecznościowe, strony typu wiki i blogi, gwałtownie zwiększają tempo tworzenia się wspólnot, ich oddzia-ływanie i zasięg. Nowe społeczności tworzą się szybko i z podobną prędkością się rozprzestrzeniają. Ich liderzy często się zmieniają. Dzięki aplikacjom przystosowa-nym do urządzeń mobilnych członkowie są stale w pogotowiu, zdolni do natych-miastowego zbierania informacji lub działania. Platformy mediów społecznościowych wzmacniają wspólnoty internetowe na cztery sposoby: krzewią głębokie relacje, umożliwiają szybkie mobilizowanie sił, ułatwiają tworzenie i syntetyzowanie wiedzy oraz pozwalają na lepsze filtrowanie informacji. Jaki będzie profil konsumenta po kryzysie?
amator-expert w podróży, elastyczna podróż, nisze małe i duże.
Według Paula Flattersa i Michaela Willmotat – partnerów firmy doradczej Trajectory, „zachowania nabywców będzie kształtować poszukiwanie oszczędności i dążenie do prostoty połączone ze stłumionym popytem”. 4. Trendy w obsłudze podróżnych po kryzysie Latem 2007 roku, gdy na Wall Street zauważono pierwsze niepokojące obja-wy kryzysu, na drugim końcu Stanów Zjednoczonych miała miejsce ogromna klę-ska żywiołowa. Miliony hektarów amerykańskiego Zachodu trawiły pożary, które miały okazać się drugimi co do wielkości pod względem wielkości zniszczeń od 1960 roku, kiedy to zaczęto dokumentować straty. Ogień szalał również po drugiej stronie Atlantyku – według European Forest Fire Information System (Europejski System Informacji o Pożarach Lasów) w lipcu 2007 roku ogień przyniósł najwięk-sze straty w całej historii.

Ireneusz Marganiec 72
Pożary lasów, podobnie jak recesja, mają bolesne i tragiczne skutki. W niniej-szym artykule, bazującym na raporcie opublikowanym przez firmę Amadeus o nazwie „Amator-Ekspert w Podróży”, staramy się spojrzeć w przyszłość, poza horyzont zniszczeń spowodowanych kryzysem i globalną recesją. Próbujemy przyj-rzeć się trendom i innowacjom, które mogą rozwinąć się po zakończeniu recesji w branży turystycznej. Kryzysy, wbrew powszechnym przekonaniom, nie muszą tłumić innowacji. Firmy, takie jak Hewlett-Packard, Geophysical Service (obecnie Texas Instru-ments), Polaroid czy Revlon, powstały właśnie w czasach Wielkiego Kryzysu. Również Microsoft i The Gap Limited założono podczas późniejszych recesji. W istocie okresy dekoniunktury pod pewnymi względami sprzyjają zakładaniu nowych firm – pracy poszukuje wówczas większa liczba utalentowanych ludzi, dostawcy są bardziej otwarci na negocjacje, a klienci bardziej zainteresowani no-wymi produktami czy usługami, które pozwalają ograniczać wydatki. Niall Ferguson, historyk finansów z Harvard University, stwierdza podobień-stwo między ewolucją w przyrodzie i w biznesie: „(...) zazwyczaj prawdziwymi czynnikami rozwoju w gospodarce są procesy powstawania gatunków – nowego rodzaju firm – oraz »twórczej destrukcji« – gdy słabsze przedsiębiorstwa »wymie-rają« lub zostają »zjedzone«”. W niniejszej publikacji opisuję trzy istotne trendy, które mają obecnie wpływ na branżę turystyczną, a są to: wzrastające doświadczenie klientów, narastający wpływ technologii na podróżowanie oraz rozwój „niszowych” podróży – które, jak przewidujemy, ulegną nasileniu pod wpływem obecnego spowolnienia gospo-darczego. W celu wyciągnięcia powyższych wniosków, firma Amadeus zrobiła badania, których wyniki i omówienie zostanie przedstawione w tej publikacji. Przeprowa-dzono wywiady z 30 osobami z grona najwyższych kadr menadżerskich w firmach z branży turystycznej, a także badania ankietowe wśród 2 719 profesjonalistów z całego świata, pytając ich o trendy panujące w branży turystycznej. Następnie dokonano dokładnej analizy otrzymanych wyników, aby ustalić możliwy wpływ recesji na owe trendy. Amator-ekspert w podróży: dzięki Internetowi typowy podróżnik posiada dziś łatwy dostęp do ogromnych ilości informacji – czy to pochodzących z profesjonalnie przygotowanych witryn, czy też z opinii konsumentów, sponta-nicznie umieszczanych na portalach społecznościowych. Wobec wszechobecnej tendencji do oszczędzania pieniędzy zarówno przez firmy, jak również osoby pry-watne, motywacja do wykorzystania owej wiedzy jest większa niż kiedykolwiek. Elastyczna podróż: rozwiązania technologiczne zdecydowanie usprawniły procesy rezerwacji, jednak samo podróżowanie wciąż pozostawia wiele miejsca na techniczne nowinki. Takie innowacje są polem do popisu dla utalentowanych me-
Trendy w obsłudze podróżnych… 73
nedżerów, którzy wykorzystają recesję jako okazję do wprowadzenia korzystnych zmian. Nisze małe i duże: firmy turystyczne będą coraz intensywniej szukać możli-wości wykorzystania nisz rynkowych oraz starać się rozszerzać swoje oferty o no-we usługi dające dodatkowe przychody, a także oferować usługi specjalistyczne, generujące dodatkowe przychody. Uważam, że tak jak pożary lasów stanowią ważny element naturalnego proce-su regeneracji środowiska, tak samo obecna recesja oczyści pole dla innowacji w branży turystycznej. 5. Amator-ekspert w podróży Pod koniec lat 90. ubiegłego wieku lekarze zaczęli zauważać ciekawe zjawi-sko: pacjenci coraz częściej wiedzieli o swych dolegliwościach niemal tak wiele, jak oni sami, mający przecież za sobą lata studiów medycznych. Zjawisko to można tłumaczyć działaniem dwóch czynników. Po pierwsze, w miarę wzrostu średniej długości życia, więcej osób cierpi na choroby przewlekłe, z którymi żyją przez lata, podczas gdy lekarze mają o nich jedynie teoretyczną wie-dzę. W środowiskach medycznych tacy ludzie zyskali miano „pacjentów-ekspertów”. Po drugie, Internet umożliwił pacjentom lepszy dostęp do informacji, co pozwoliło im samodzielnie diagnozować swoje dolegliwości. W ten sposób po-wstała tzw. „medycyna uczestnicząca” (ang. participatory medicine), w której za-miast pasywnego chorego występującego naprzeciw wszystkowiedzącego lekarza, stanął zespół obejmujący świadomego, zaangażowanego pacjenta, specjalistyczne sieci społecznościowe oraz badaczy klinicznych. Powstały układ można określić jako „stosunek współpracy oparty na wzajemnym poszanowaniu”. Podobne zjawi-ska zachodzą w branży turystycznej. Pomijając obecną recesję, intensywność po-dróżowania zwiększyła się kolosalnie w ciągu minionych 10-15 lat. Podobnie jak ktoś przewlekle chory, osoba często podróżująca posiada zwykle więcej informacji o celu swojej podróży oraz sposobach dotarcia do celu niż pracownik biura podró-ży. Dotyczy to zarówno podróży służbowych, jak i turystyki wypoczynkowej. Analogicznie jak w przypadku chorych, Internet umożliwił dostęp do wiedzy, sieci społecznościowych, opinii internautów oraz innych rozmaitych zasobów także osobom podróżującym. Połowa ekspertów biorących udział w naszym panelu spo-dziewa się, że w ciągu następnych dziesięciu lat nastąpi znaczna zmiana w świado-mości konsumentów w zakresie dostępnych możliwości podróżowania. Jednocześnie połowa naszych ekspertów w ciągu najbliższych dziesięciu lat oczekuje istotnej zmiany oczekiwań klientów w stosunku do jakości usług. Będzie to po części efektem „wyścigu zbrojeń”, w którym firmy z branży turystycznej będą starać się przyciągnąć klientów wyższą jakością oferowanych usług. Ze strony

Ireneusz Marganiec 74
klientów spowoduje to wzrost ich oczekiwań. „Problem polega na tym, że im wię-cej oferuje się klientom, tym więcej od nas żądają” – twierdzi Paul Ellerby z easy-Cruise. Mniejsza, choć wciąż istotna liczba naszych ekspertów przewiduje, że oso-by podróżujące będą w przyszłości mniej zainteresowane poradami pracowników firm turystycznych. 6. Nowe kierunki Prawdopodobnie podróżujący staną się w przyszłości bardziej żądni przygód. Biorąc pod uwagę, że „ostrzeżony, znaczy uzbrojony”, wyposażeni w większą wie-dzę turyści będą bardziej skłonni udawać się w miejsca, o których wcześniej wie-dzieli niewiele. Według Światowej Organizacji Turystyki ONZ (ang. UN World Tourism Or-ganization) rosnące zainteresowanie nowymi, niezwykłymi miejscami wyjazdów nie słabnie, mimo recesyjnego, spadkowego trendu całkowitej liczby podróżują-cych. Porównując pierwsze cztery miesiące 2008 roku do tego samego okresu 2009 roku, można zauważyć, że turystyka międzynarodowa spadła o 8% w skali świato-wej. Natomiast w tym samym czasie liczba wyjazdów do Afryki wzrosła o 3%, na co największy wpływ miały wyjazdy do Afryki Północnej (+ 6%) oraz powrót tury-stów do Kenii po zakończeniu zamieszek w 2008 roku. Jak twierdzi cytowany przez Business Week Gerard Bellino, wiceprezes dzia-łu turystyki rekreacyjnej w Carlson Wagonlits, recesja może napędzać nawet roz-wój podróży w nietypowe miejsca: „Ludzie wykorzystują spadek popytu na rzeczy, na które w przeszłości musieliby długo oszczędzać”.
W takiej sytuacji nie dziwi fakt, że na zmianach zwyczajów turystów mogą skorzystać Chiny. Według Światowej Organizacji Turystyki, najczęściej odwiedza-nymi na świecie krajami są obecnie Francja, Hiszpania i Stany Zjednoczone. Po-mimo że nasi specjaliści nie oczekują wielkich zmian w upodobaniach wycieczko-wiczów, spodziewają się jednak, że Chiny mają dużą szansę stać się ważnym miej-scem wyjazdów. Zapytani o to, jakie trzy kraje będą najczęściej odwiedzane w 2020 roku, ankietowani podawali zwykle Stany Zjednoczone (76%), Francję (66%) i właśnie Chiny (52%). Hiszpania spadła na czwarte miejsce (28%). 7. Wzrost gospodarek BRIC Podróżujący będą w przyszłości nie tylko bardziej świadomi i chętni do po-znawania nowych miejsc – będą również pochodzić z nowych krajów. Spowoduje to wzrost klasy średniej w krajach przeżywających obecnie dynamiczny wzrost
Trendy w obsłudze podróżnych… 75
gospodarczy, takich jak: Brazylia, Rosja, Indie i Chiny (BRIC), co doprowadzi do nasilenia się przyjazdów z tych właśnie krajów. Kraje rozwijające się odgrywają coraz większą rolę jako źródło turystów i osób podróżujących służbowo. Liczba wyjazdów z Chin wrosła w okresie 2002–2008 o średnio 27% rocznie. Co roku świat odwiedza 45 milionów turystów z Chin – to więcej od całej ludności Hiszpanii, drugiego pod względem popularności wśród turystów kraju na świecie. W latach 2000–2007 ruch turystyczny z Rosji zwiększał się w tempie 9,4% w skali rocznej, zaś ilość pieniędzy wydawanych przez Rosjan za granicą wzrastała w tym okresie o 14% w ciągu roku. W 2007 roku Rosja zajęła 9. miejsce pod względem liczby osób odwiedzających inne kraje. Zaskakujące dane na temat wzrostu i potencjału rozwijających się rynków – szczególnie Brazylii, Chin, Indii i Rosji – przyciągały uwagę konsultantów i dzien-nikarzy przez większość obecnego stulecia. Do tej pory dotyczyły one jednak okre-su poprzedzającego recesję. Czy wzrost rozwijających się gospodarek będzie postępował także po ustąpie-niu recesji? Opinie co do tego są podzielone, jednak recesja może przyspieszyć przesuwanie się światowej gospodarki na Wschód. Choć obecne spowolnienie go-spodarcze ma bez wątpienia zasięg globalny, jego efekt nie jest jednolity. Ogólnie mówiąc, gospodarki Zachodu skurczyły się, podczas gdy kraje BRIC doznały zale-dwie spowolnienia spektakularnego tempa wzrostu. Międzynarodowy Fundusz Walutowy (ang. The International Monetray Fund) spodziewa się w roku 2009 spadku dochodu gospodarek Stanów Zjednoczonych i Europy odpowiednio o 1,6% i 2,0% – za to gospodarki Chin i Indii mają w tym roku odnotować zaledwie 6,7% i 5,1% wzrost. Podczas gdy gospodarstwa domowe Zachodu ograniczają wydatki i odkrywają na nowo zalety życia na miarę swoich możliwości finansowych, chińscy konsu-menci w pełni korzystają ze swych oszczędności i imponujących, rządowych pakie-tów stymulacyjnych. I tak, jeśli pominąć pojazdy kategorii SUV (Sports Utility Vehicles), w 2009 roku w Chinach sprzedano niemal tyle samo samochodów, co w Ameryce. W roku 2006 Amerykanie kupili ich dwa razy więcej. Jeśli chodzi o przewozy lotnicze, w pierwszych czterech miesiącach 2009 roku linie Air China, China Eastern i China Southern odnotowały na trasach krajowych wzrosty przy-chodów wynoszące odpowiednio 16%, 25% i 6% w przeliczeniu na pasażerokilo-metr. Rosnące znaczenie kultur innych niż zachodnia wśród klientów światowej turystyki ma dla tej branży istotne konsekwencje. Opublikowane na początku 2009 roku badanie, przeprowadzone przez Economist Intelligence Unit na zamówienie firmy Amadeus wykazało, że podróżujący służbowo Azjaci przywiązują więcej uwagi do renomy marki hoteli niż Europejczycy czy Amerykanie. W sytuacji, gdy coraz więcej podróżujących wyrusza na dłuższe i bardziej egzotyczne wyjazdy, wzrasta liczba podróżnych z krajów rozwijających się, a przy
Ireneusz Marganiec 76
tym nasila się wpływ Internetu na sposób korzystania z usług. Rynek podróży staje się coraz bardziej globalny, a granice geograficzne przestają mieć znaczenie. W tym kontekście pojawia się potrzeba innego sposobu zróżnicowania klientów. Osiemna-stoletni Chińczyk może mieć więcej wspólnego z osiemnastolatkiem z USA niż z czterdziestoletnim mieszkańcem swojego kraju. Ponad 80% ekspertów zgadza się z tą tezą, przy czym większość z nich – całkowicie. 8. Budowanie marki w świecie on-line W sytuacji, gdy coraz więcej interesów przeprowadza się za pośrednictwem Internetu, a marki internetowe obejmują coraz większą część rynku podróży, związki firm turystycznych z klientami stają się bardziej kruche. Większość naszych ekspertów potwierdza, że budowanie lojalności poprzez Internet jest trudniejsze niż przy stosunkach bezpośrednich. Marilu Ngo z Griffin Sierra Travel na Filipinach podsumowuje krótko: „W sieci jest tyle treści genero-wanych przez internautów, że straciliśmy lojalność klientów w tym środowisku – czynnikiem decydującym o utrzymaniu klienta jest obecnie cena usług”. Respondenci za przyczyny tego zjawiska podają większą fragmentację rynku, dużą ilość możliwości dostępnych dla klienta „od ręki”, utratę osobistego kontaktu, ilość generowanych opinii przez internautów oraz większą konkurencję cenową. Henry Harteveldt z Forrester Research wyjaśnia: „Internet pozwala łatwiej znaleźć możliwości, o istnieniu których ludzie wcześniej nie wiedzieli. (...) W sieci znacznie łatwiej jest wyrażać swoje zdanie i poznawać opinie innych, pod wpły-wem których dokonuje się wyboru spośród znalezionych ofert”. Według ekspertów, dwoma najważniejszymi czynnikami budowania marki zarówno działającej w sieci, jak i tradycyjnie, są zgodność oferty z rzeczywistością oraz zadowolenie klienta. Argumentacja słowna i efektywna promocja uważane są za nieco ważniejsze w środowisku on-line, zaś budowanie związków emocjonal-nych z marką ma większe znaczenie w kontaktach osobistych. W badaniach zleconych przez firmę Amadeus próbowano znaleźć odpowiedź na pytanie, czy opinie internautów istotnie mogą ograniczyć kontrolę firmy nad własną marką. Gonzalo Undurraga z LAN Chile uważa, że tak właśnie jest: „Nie sądzę, żeby firma miała kontrolę nad swoją marką. Słowa klientów mają większą moc, działają szybciej, brzmią głośniej”. Jednak, jak twierdzi Dhruv Shringi z Yatra Online w Indiach, „Pozostałe, kluczowe aspekty marki – usługi i produkty – znajdują się wciąż w dużym stopniu pod kontrolą firmy. Opinie użytkowników tylko je odzwierciedlają”. Dla Shringi opinie klientów to objaw, a nie przyczyna, „(...) więc jeśli firma panuje nad pozo-stałymi aspektami swojej działalności, to treści zamieszczone przez użytkowników

Trendy w obsłudze podróżnych… 77
w sieci są tylko wynikiem jej funkcjonowania i nie stanowią większego zagroże-nia”. Większość z naszych ekspertów uważa, że komentarze użytkowników stano-wią raczej czynnik pozytywny, sprzyjający wzrostowi jakości i oczekiwań wobec marki (73%), niż zagrożenie dla reputacji marki (13%). Respondenci badania inter-netowego podzielają tę opinię. Szczególnie dotyczy to przedstawicieli wypożyczal-ni samochodów (42% odpowiedzi jako „bardzo pozytywne” w porównaniu ze średnią 27%) i internetowych biur podróży (39%). Opinie internautów jako „zagrożenie” postrzega mniej niż jedna piąta respon-dentów, choć najbardziej obawiają się ich tradycyjne biura podróży (25%). Gonzalo Undurruga, LAN Chile: „To będzie uzupełnienie naszej oferty, dają-ce klientom dodatkowe informacje, które pomogą podjąć im decyzję o wyborze podróży. Pełniejsze informacje będzie można również wykorzystać do oceny zado-wolenia klientów”. Brian Harniman, Kayak, USA: „Uważam, że dostawcy usług turystycznych powinni wykorzystywać opinie użytkowników. Myślę, że powinni udostępniać klientom takie opinie i oparte na nich dane demograficzne”. Alan Josephs z e-Bookers, UK: „Myślę, że hotelarze odczują jeszcze większą presję, by zapewnić swoim klientom obiecane, komfortowe warunki, skoro mogą oni zorientować się w rzeczywistej jakości usług jeszcze przed skorzystaniem z oferty”. 9. Elastyczna podróż Wpływ nowoczesnych technologii koncentruje się przede wszystkim na wy-szukiwaniu i rezerwowaniu połączeń i miejsc, nie zaś na samej podróży. Według ekspertów, ma się to zmienić. Planes, Trains and Automobiles to film z 1987 roku opowiadający o tym, jak Neal Page, nerwowy dyrektor z branży reklamowej, pró-buje wrócić z podróży służbowej do Nowego Jorku na Święto Dziękczynienia do swej rodziny w Chicago. Szereg niepomyślnych zbiegów okoliczności sprawia, że zamiast trwającego godzinę i 45 minut lotu przeżywa trzydniową gehennę, podczas której najpierw zamiast miejsca w klasie biznes dostaje miejsce w klasie ekono-micznej, a następnie lot zostaje odwołany. Potem czeka go jeszcze obrzydliwy po-kój w motelu, koszmarna jazda pociągiem i denerwujący towarzysz podróży. Mimo znacznego wpływu nowoczesnych technologii na jakość podróżowania, taki scena-riusz jest wciąż zupełnie możliwy.

Ireneusz Marganiec 78
10. Technologia a jakość podróżowania Technologia udostępnia szereg możliwości poprawy jakości podróżowania przed, w czasie i po powrocie z wyjazdu. Profesjonaliści z branży turystycznej, biorący udział w tych badaniach, twierdzą, że jest to sposób na zwiększenie obro-tów, a 79% z nich uważa, że technologia pomoże także rozwiązać problem lojalno-ści klientów internetowych. Według ekspertów, najbardziej oczywiste możliwości, jakie oferuje technolo-gia, widoczne są na etapie projektowania podróży, sprawdzania cen i dostępności informacji oraz rezerwacji wyjazdu. Aby je najlepiej wykorzystać, branża tury-styczna musi sięgnąć po nowe rozwiązania, które uczynią podróż bardziej komfor-tową, bezpieczną i dostosowaną do indywidualnych potrzeb. Wobec coraz szybszego rozwoju technologii, nasi eksperci uważają, że naj-większe znaczenie będą miały narzędzia pozwalające wyeliminować najbardziej dotkliwe problemy, dotyczące niezadowolenia klientów i uczynić rozwiązania on-line bardziej spersonalizowanymi i łatwiejszymi w użyciu. Najważniejsze wśród nich będą zapewne doskonalsze systemy informacji klientów, selekcjonujące oferty w oparciu o indywidualne preferencje, a także intu-icyjne interfejsy, zapewniające nowe sposoby interakcji z systemami komputero-wymi, takie jak ekrany dotykowe nowej generacji i urządzenia do sterowanie gło-sem. Niemal jedna trzecia ekspertów przewiduje również, że istotną rolę może tu odegrać rzeczywistość wirtualna. Internet jest jednak zjawiskiem podlegającym nieustannej ewolucji i nawet na dojrzałych rynkach rozwiązania, takie jak Web 2.0, sieci społecznościowe i techno-logie mobilne pozostają czynnikami wzrostu. Eksperci przewidują, że do 2020 roku technologia zapewni istotny wzrost możliwości dostawcom usług, sprzedawcom i konsumentom we wszystkich obszarach branży turystycznej – w szczególności pozwoli sprzedawcom oferować klientom większy wybór produktów, zaś konsu-mentom wymieniać się między sobą informacjami o dostawcach – takie wnioski przewijały się także w innych punktach badania. Niemal wszyscy uczestnicy badania są zgodni co do tego, że Web 2.0 „znacz-nie” (69%) lub „trochę” (28%) poprawia przejrzystość informacji, choć jeden z nich twierdzi, że jest przeciwnie. Około 80% z nich już wzbogaciło lub rozważa wzbo-gacenie swych witryn internetowych o narzędzia społecznościowe lub opinie użyt-kowników. Linie lotnicze spóźniają się nieco pod tym względem, jednak także rozważają takie posunięcie. Eksperci zgadzają się bez wyjątku co do tego, że do 2020 roku Web 2.0 po-prawi jakość podróżowania – „radykalnie” (17%), „bardzo” (59%) lub „trochę” (24%). W szczególności uważają oni Web 2.0 za odpowiedź na problemy z jakością usług, które mogą spowalniać rozwój usług internetowych.

Trendy w obsłudze podróżnych… 79
Przede wszystkim użytkownicy zyskają lepszy dostęp do informacji, które będą lepiej zorganizowane, łatwiej dostępne i bardziej interaktywne, co zapewni im większe zadowolenie z korzystania z usług on-line. „Nastąpi radykalna zmiana sposobu wyszukiwania i organizacji treści. Klienci mają wciąż znaczne trudności z wyszukiwaniem informacji, ich definiowaniem i wykorzystywaniem. Z czasem wszystkie te czynniki zmienią się diametralnie i (...) będą bardzo łatwo dostępne. (...) Technologie znacznie usprawnią organizowanie danych i sposób prezentowania ich konsumentom” (Dhruv Shringi, Yatra Online, India). Niektórzy wskazują również na większe możliwości personalizacji i wyboru informacji najbardziej istotnych z punktu widzenia danego użytkownika oraz dzie-lenia się doświadczeniami. Jak twierdzą Timir Bhose i Pia Viljaniemi z linii Finnair, zapoznawanie się z opiniami użytkowników „(...) ułatwia konsumentom wstępne rozpoznanie, a zatem i planowanie podróży z wyprzedzeniem, a także pozwala zgromadzić pełniejszą wiedzę o doświadczeniach innych konsumentów”. Podobnie jak w przypadku innych zmian związanych z wykorzystaniem Inter-netu, ważna jest nie tyle sama technologia, co wspierane przez nią działania. Za-uważa to trafnie Kerry Cannon z iM@, mówiąc: „Treści tworzone przez użytkow-ników istniały zawsze, jako opnie krążące z ust do ust. Technologia jest tylko wy-godniejszym medium... umożliwiającym zapoznanie się z opiniami większej liczby osób i radykalnie zwiększającym zasięg tych wypowiedzi”. Albo, jak ujmuje to medioznawca Clay Shirky, „media społecznościowe nie będą interesujące ze spo-łecznego punktu widzenia, dopóki nie staną się nudne jako technologia”.
Oczekując dalszej ewolucji treści tworzonych przez użytkowników, Nikos Goulis z greckiej firmy E Travel SA spodziewa się ich ciągłego rozwoju. „Treści te zawierać będą więcej danych – tekstów, obrazów, wideo i muzyki. Uważam, że będą do nas docierać niemal niedostępne dziś treści z miejsc, które nie są obecnie popularne (...), a z miejsc popularnych uzyskamy różnorodny przekaz, którego dziś nam brak”. (Nikos Goulis, E Travel SA, Greece). Joe Bous z amerykańskiego biura podróży Wholesale Travel Center uważa, że problemem nie jest zdobycie większej ilości treści, a znalezienie sensu w treściach, którymi dysponujemy. „Można wyszukać 4 000 opinii – i co z nimi zrobić? Wszystko i tak sprowadzi się do oceny 3,5 gwiazdkowej. To w zasadzie bezwarto-ściowe”. Odpowiedź sprowadza się po części do wiedzy, kto napisał daną opinię. Jak zauważa Brian Harniman z firmy Kayak: „Mogę szukać opinii osób podobnych do mnie i wierzyć ich zdaniu bardziej niż pozostałym. Jeśli ktoś podróżuje z innych niż ja powodów, może uznać hotel za dobry, podczas gdy dla mnie będzie on okropny”. Joe Bous sądzi, że inteligentne technologie będą w stanie wydobyć sens z masy dostępnych już treści. „Technologie nowych generacji będą mogły za po-
Ireneusz Marganiec 80
mocą analizy semantycznej określić pewne wskaźniki, pozwalające zrobić użytek z całej tej internetowej paplaniny, z którą codziennie mamy do czynienia”. Ostatnie słowo na temat podróży służbowych. Komentarze internautów mają obecnie korzystny wpływ głównie na turystykę wypoczynkową, jednak dwie trzecie naszych ekspertów widzi niewykorzystany potencjał tego rodzaju treści jako czyn-nik zwiększający jakość podróży służbowych. W sytuacji, gdy przedsiębiorstwa bardziej niż kiedykolwiek starają się ograni-czać koszty do minimum, mechanizm pozwalający pracownikom dzielić się radami na temat oszczędności, zaś osobom odpowiedzialnym za zarządzanie podróżami zbierać opinie delegowanych, które mogą być przydatne w negocjowaniu z dostaw-cami usług, staje się coraz bardziej atrakcyjny. 11. W oczekiwaniu na rozwiązania mobilne Niemal jedna trzecia respondentów naszego badania internetowego sądzi, że urządzenia mobilne będą miały w przyszłości większy wpływ na sposób planowa-nia podróży i dokonywanie rezerwacji niż sieci społecznościowe, opinie internau-tów, udostępnianie wideo czy narzędzia wizualizacyjne. Według International Tele-communications Union (Międzynarodowy Związek Telekomunikacyjny), liczba abonentów telefonów komórkowych przekroczyła w roku 2008 połowę wielkości populacji świata. Sytuację tę w znacznym stopniu zawdzięczamy krajom BRIC – na te cztery kraje przypada jedna trzecia wszystkich użytkowników telefonów komór-kowych na świecie. W raporcie opublikowanym w marcu 2009 roku firma PhoCusWright nazywa urządzenia mobilne „nową platformą podróży”, zaś Samsung – producent elektro-niki – spodziewa się, że wielkość rynku smartfonów, łączących możliwości telefo-nu z pocztą elektroniczną i dostępem do Internetu, zwiększy się ze 170 milionów w 2009 roku do 500 milionów w roku 2012. Po długim okresie oczekiwania mobilny Internet wreszcie zaczyna nabierać rozpędu. Jak zauważa PhoCusWright, „dzieje się tak w miarę powstawania typowo mobilnych zastosowań wychodzących poza zmianę kanału, bardziej atrakcyjnych niż proste przeniesienie rezerwacji ze stacjonarnego Internetu na urządzenia mobil-ne, i dzięki temu generujących wcześniej nieosiągalne obroty”.
Oczywiście twórcy aplikacji doskonale to rozumieją. Obecnie na witrynie Apple można znaleźć ponad 3 700 wspomagających podróżowanie aplikacji dla iPhone'a – od narzędzia do sprawdzania opóźnień lotów, przez wyszukiwarki naj-tańszych stacji benzynowych, po mapę Chin przeznaczoną dla fanów kung fu. Henry Harteveldt z Forrester Research zauważa, że znaczenie związku pomię-dzy mobilnym Internetem a treściami tworzonymi przez użytkowników będzie coraz większe. „Turystyka to jedna z branż, która bardzo wiele zawdzięcza treściom
Trendy w obsłudze podróżnych… 81
tworzonym przez użytkowników oraz dzieleniu się przez nich pomysłami, opiniami i sugestiami. (...) Ważnym czynnikiem sprzyjającym temu wzrostowi będzie rozwój mobilnych urządzeń internetowych, ukierunkowanych bardziej na przesyłanie waż-nych danych, niż wiadomości głosowych. Umożliwią one przesyłanie komunikatów mających postać tekstu, głosu, SMS-ów lub innych danych między osobami lub w grupach. Jednocześnie nastąpi pojawianie się nowych rodzajów witryn interneto-wych”. Faktycznie, niektóre z najbardziej interesujących aplikacji dla iPhone łączą właściwości mobilne z treściami tworzonymi przez użytkowników. „Roadtrippr” to coś w rodzaju systemu wiki, opisującego miejsca warte odwiedzenia podczas po-dróżowania. Użytkownicy wzbogacają system w informacje na temat najciekaw-szych atrakcji w swoich miastach, zaś sami mogą korzystać z jego zasobów w cza-sie wyjazdów. Aplikacja uruchomiona na iPhone pokazuje aktualne miejsce pobytu użytkownika i dostosowuje do niego odpowiednie treści. 12. Spojrzenie w przyszłość Futurolog Ray Kurzweil („The Age of Spiritual Machines: Timeline”) przewi-duje, że w ciągu najbliższych dziesięciu lat komputery przestaną być dla nas wi-doczne i będą wbudowane w ściany, meble, ubrania, a nawet w ciała. Kurzweil dokładnie przewidział pojawienie się Internetu, jak i upadku Związku Radzieckie-go, warto więc go posłuchać. Co więcej, jego wizja wbudowanych komputerów już staje się rzeczywistością. Popatrzmy na samochody – w 1978 roku Cadillac Seville był pierwszym samochodem wyposażonym w jeden mikroprocesor, będący sercem jego komputera pokładowego. Po trzydziestu latach nawet najtańszy nowy samo-chód świata – Tata Nano – ma na pokładzie dwanaście mikroprocesorów. Wypoży-czalnie samochodów oferują już opcjonalne urządzenia GPS, które nie tylko poka-zują drogę do hotelu, ale i potrafią zaproponować pobliskie atrakcje turystyczne. Podobnie jak w przypadku komputerów osobistych w latach dziewięćdziesią-tych, traktowanie samochodów jako węzłów sieciowych odkrywa nowe, cenne możliwości. Inrix to nowa firma gromadząca dane o ruchu drogowym z systemów GPS zainstalowanych w pojazdach, stacjonarnych czujnikach ruchu i innych źró-dłach. Zebrane informacje trafiają ponownie do samochodowych systemów GPS i mogą być wykorzystywane przez osoby prywatne lub przewoźników. Tego rodza-ju rozwiązania mogą nawet zmieniać nasze postrzeganie samochodów – Zipcar to usługa współdzielenia pojazdów, przedstawiana jako alternatywa dla posiadania czy wypożyczania samochodów. Jej użytkownicy otrzymują elektroniczne karty umoż-liwiające korzystanie z dowolnego z 6 000 samochodów w Ameryce Północnej i Londynie. Pojazdy raportują swoje pozycje do centrali, dzięki czemu klienci mogą się dowiedzieć, gdzie znajduje się najbliższy wolny samochód. Klienci mogą wy-

Ireneusz Marganiec 82
pożyczyć samochód zarówno na godziny, jak i dni, odbierając go z miejsca, w któ-rym pozostawił go poprzedni klient. Taki model, dzięki uproszczeniu procesów logistycznych, może uwolnić wypożyczalnie samochodów od konieczności utrzy-mywania dużych parków samochodowych. Analogicznie wypożyczalnie samocho-dów mogą gromadzić historyczne dane o położeniu wszystkich posiadanych samo-chodów, łączyć je z danymi o aktualnej pozycji samochodów oraz wykorzystywać je komercyjnie, np. by polecać rozmaite usługi nie tylko z uwzględnieniem blisko-ści, ale i popularności wśród wcześniejszych klientów: „kierowcy, którzy nocowali w tym motelu, jadali w Grill-Barze u Gerarda”. 13. Ale czy nie lepiej (zostać) w domu? Zaawansowana technologia udostępni wszelkie korzyści z podróżowania, bez konieczności opuszczania komfortowego domu czy biura. Kurzweil przewiduje, że w ciągu zaledwie kilku lat trójwymiarowe ekrany rzeczywistości wirtualnej, wbu-dowane w okulary czy szkła kontaktowe, będą służyły na co dzień jako podstawo-we interfejsy komunikacji. Dodatkowo wysokorozdzielcze środowiska rzeczywisto-ści wirtualnej, działające na wszystkie zmysły, pozwolą użytkownikom robić wszystko w dowolnym towarzystwie, bez względu na odległość. Rozwój narzędzi wizualizacyjnych i wirtualnej rzeczywistości może całkowicie zmienić pojęcie podróżowania. Wrażeń z wyjazdów będzie można zakosztować już podczas doko-nywania wyboru miejsca, zaś „wirtualne” podróże (wideokonferencje, spotkania holograficzne itp.) będą mogły całkowicie przewartościować dotychczasowe wzor-ce. Dostępną obecnie technologią tego rodzaju jest wysokiej jakości system tele-konferencyjny TelePresence, wprowadzony trzy lata temu przez firmę Cisco. Ze względu na wciąż wysoką cenę rozwiązanie to jest używane głównie przez większe firmy. Oczywiście to nie powód, by o nim zapomnieć – w miarę upowszechniania się systemu jego koszty będą spadać. Pozostaje tylko pytanie, czy rozwiązanie za-stąpi podróże służbowe? Szefowie sieci Starwood i Marriott uważają, że nie – hote-le obu marek oferują już usługi TelePresence. Klientami docelowymi mają być mniejsze firmy i lokalne oddziały korporacji, które nie mogą pozwolić sobie na własne instalacje TelePresence, jednak chciałyby korzystać z wirtualnych spotkań „twarzą w twarz”. Przy cenie 500 USD za godzinę usługa ta nie jest tania, jednak wciąż sporo tańsza niż na przykład lot z Nowego Jorku do Londynu. Jest mało prawdopodobne, by rozwiązania typu TelePresence całkowicie za-stąpiły podróże służbowe, a tym bardziej zagraniczne wakacje. Od momentu wyna-lezienia telegrafu postępowi telekomunikacji towarzyszył wzrost intensywności podróżowania, wspierany między innymi przez rozwój technologii transportu, in-
Trendy w obsłudze podróżnych… 83
ternacjonalizację i globalizację biznesu oraz – po prostu – potrzebę oderwania się od tego wszystkiego. Bo podróżować jest po prostu fajnie. 14. Rezerwacje – doświadczenia konsumentów Jednym z najwyraźniejszych kluczowych komunikatów, jakie usłyszeliśmy podczas tego badania, było stwierdzenie, że dostawcy muszą ciężko popracować nad zwiększeniem zadowolenia klientów. Nasi eksperci uważają, że zadowolenie klientów jest najważniejszym czynnikiem budującym lojalność wobec marki w Internecie. W niniejszym podrozdziale dowiemy się, w jaki sposób firmy turystyczne mogą zapewnić zadowolenie klientów w świecie Internetu. Coraz ważniejszymi sprawami w tej kwestii są:
łatwość korzystania z witryn, szybkość i łatwość dostępu za pośrednictwem wielu kanałów, brak technicznych komplikacji.
Jak mówi Jasmeet Singh z indyjskiej firmy Make My Trip: „Dokonując re-zerwacji, klienci nie powinni napotykać żadnych technicznych komplikacji. Można oferować najróżniejsze rabaty, ale tym, co liczy się najbardziej, jest skuteczna i bezproblemowa rezerwacja on-line”. Wśród następnych istotnych elementów należy wymienić:
bogactwo informacji, pozwalające łatwo wybrać właściwy produkt za wła-ściwą cenę,
przejrzystość oraz możliwość znalezienia wszystkich niezbędnych infor-macji w jednym miejscu; Alan Josephs, wieloletni pracownik firmy eBo-okers, mówi: „Kluczem jest stuprocentowa koncentracja na zadowoleniu użytkowników. (...) Szybkość i możliwość łatwego znalezienia właściwego produktu”,
elastyczność i personalizacja, wykorzystanie narzędzi customer intelligence do lepszego zaspokajania in-
dywidualnych potrzeb, dostarczanie przydatnych informacji i trafnych sugestii.
Wszystkie powyższe stwierdzenia zgrabnie podsumowuje Andy Bateman z amerykańskiej firmy Interbrand: „Chodzi o znakomitą obsługę, zaspokajającą potrzeby klientów, a nie o wmuszanie im zbędnych treści, które tylko przeszkadzają im w realizacji swoich zamierzeń”. Poniżej przedstawiamy konkretne działania, które mogą pomóc firmom w poprawieniu lojalności swoich klientów w Internecie. Budowanie zaufania i komfortu klientów w kwestii danych osobowych oraz płatności kartami kredytowymi, szczególnie w rejonie Azji i Pacyfiku: „Należy
Ireneusz Marganiec 84
uwolnić klientów od wątpliwości co do podawania danych kart kredytowych przez Internet. To nie nastąpi z dnia na dzień, będzie to proces stopniowy” (Jasmeet Sin-gh, Make My Trip, Indie). Tworzenie ofert ponaglających i zachęt, takich jak promocje, rabaty i dodat-kowe korzyści, sprzyjających zawarciu transakcji: „Trzeba od razu dać klientowi to, czego chce i nie kazać mu długo szukać. Warto stosować oferty ponaglające – obietnice dodatkowych korzyści dla klientów, którzy dokonają zakupu w określo-nym czasie. To, co działa przy tradycyjnej sprzedaży, może równie dobrze spraw-dzać się w Internecie” (Helen Demetriou, Travel.com.au, Australia). „Oferowanie lepszych warunków przy dokonaniu natychmiastowej rezerwacji – to stara i sprawdzona metoda” (Abdulla Abikhamseen, Kanoo Travel, Arabia Saudyjska). Zapewnienie odpowiednich cen, nie tylko przejrzystość, ale też – jeśli to moż-liwe – gwarancja najniższych cen: „Klienci, nawet gdy oferuje się im najkorzyst-niejsze warunki cenowe, wciąż pytają w innych miejscach czy możliwe są jeszcze niższe ceny? Gwarancja najniższych cen i dobry opis produktu zapewniają osią-gnięcie sukcesu” (Timir Bhose i Pia Viljaniemi, Finnair, Finlandia). Udostępnienie klientom kompleksowej oferty, łączącej produkty od różnych dostawców i zawierającej konkurencyjne propozycje. Taka oferta umożliwi klien-tom tworzenie własnych, dopasowanych do indywidualnych potrzeb pakietów, bez konieczności odwiedzania wielu różnych witryn internetowych: „Dostawcy, którzy umieszczą na swojej stronie różne produkty, muszą zapewnić klientom możliwość obszernego wyszukiwania, by móc zaprezentować oferty różnych linii lotniczych” (Marilu Ngo, Griffin Sierra Travel, Filipiny). „Trzeba udostępnić kompleksową ofertę, obejmującą nie tylko podróże, ale również produkty pomocnicze. (...) To musi być taki rodzaj supermarketu, do któ-rego klient przychodzi z całą listą rzeczy do kupienia” (Ratan Ratnaker, Kingfisher Airline, Indie). Jakość produktów – oferowanie i zróżnicowanie produktów niszowych, bez ograniczania do popularnych produktów dla rynku masowego: „Powinno się ofero-wać produkty niszowe i oryginalne. Często zdarza się, że internetowe biura podróży i touroperatorzy, mający w ofercie wiele produktów masowych, nie mają pojęcia co proponują klientom i nawet gdy uda im się sprzedać klientowi rezerwację, za rok ten sam klient już do nich nie wróci. Stąd nasze hasło brzmi »klasa, a nie masa«”. (Pascal Zahn, Olimar Reisen, Niemcy). Pomoc klientom w przejściu procesu krok po kroku, wyraźne informowanie o zakończeniu każdego etapu, zapewnianie wsparcia tam, gdzie jest ono konieczne i ewentualne zapewnienie tradycyjnej pomocy.
Trendy w obsłudze podróżnych… 85
15. Nisze małe i duże Doniesienia o upadku biur podróży są w znacznej mierze przesadzone. We-dług PhoCusWright, „Radykalna zmiana proporcji udziałów sprzedaży internetowej na korzyść witryn dostawców, która miała miejsce w pierwszej połowie dekady, uległa spowolnieniu bądź zatrzymaniu”. PhoCusWright przewiduje przesunięcie proporcji z powrotem na korzyść internetowych biur podróży, ponieważ spowol-nienie gospodarcze sprzyja poszukiwaniu okazji i porównywaniu ofert różnych dostawców. Co więcej, wielu rezerwacji wciąż dokonuje się w sposób tradycyjny. PhoCus-Wright szacuje, że w USA w 2007 roku 49% (wartościowo) rezerwacji – będących najlepiej spenetrowanym aspektem branży turystycznej przez Internet – dokonano w sposób tradycyjny. Czy przesunięcie w stronę Internetu zatrzyma się, czy też będzie dążyć do osiągnięcia 100% rezerwacji on-line? Trzy czwarte respondentów naszego globalnego badania internetowego uważa, że do stuprocentowej penetracji nigdy nie dojdzie. Co dziesiąty respondent uważa, że maksimum zostało już osiągnięte, a nawet można spodziewać się spadku. Poglądy te przeważają u przedstawicieli tradycyj-nych biur podróży – i podziela je niemal jedna piąta Amerykanów. Jak twierdzi Kerry Cannon z firmy iM@, „Istnieje i będzie istnieć grupa klientów, którzy nigdy nie użyją Internetu w celu dokonania rezerwacji. Bez względu na przyjazność wi-tryn internetowych dla użytkownika, zawsze znajdą się osoby, które wolą zapłacić, byle tylko ktoś załatwił za nich rezerwację. (...) Internet zmienił wiele rzeczy, ale nie należy do nich natura ludzka”. Zdecydowana większość respondentów – 65% – uważa jednak, że ilość re-zerwacji dokonywanych przez Internet będzie niewielka. Marilu Ngo z filipińskiej firmy Griffin Sierra Travel twierdzi, że różnice kul-turowe mogą powodować nierównomierną penetrację branży przez Internet w róż-nych częściach świata: „W południowo-wschodniej Azji kwestie kulturowe w ogromnym stopniu definiują sposób świadczenia usług. (…) Sprzedajemy, opie-rając się na interakcji międzyludzkiej. Nawet, jeśli produkty i sposób korzystania z Internetu będą zhumanizowane, ludziom będzie brakować rozmowy z drugim człowiekiem (...) z tego nie da się zrezygnować”. Bez względu na to, gdzie przebiega linia równowagi między sprzedażą inter-netową i tradycyjną, nasi eksperci spodziewają się zwiększenia wydatków na in-formatykę, które przeznaczone będą na wsparcie strategii internetowej. Internet umożliwił innym branżom wydłużenie krzywej rozkładu, czyli sprze-dawanie większej liczby produktów, na które popyt jest mniejszy – zjawisko to spopularyzował redaktor magazynu Wired, Chris Anderson, w książce „The Long Tail: Why the Future of Business Is Selling Less of More”. Przykładowo 30% obro-
Ireneusz Marganiec 86
tów firmy Amazon.com pochodzi ze sprzedaży książek, których nie opłaca się sprzedawać największej w świecie sieci tradycyjnych księgarni – Walmart. Jedna trzecia respondentów badania internetowego przytakuje tradycyjnemu modelowi sprzedaży, osiągając 80% obrotów ze sprzedaży zaledwie 20% oferowa-nych produktów. Jednak dla niemal 40% respondentów 80% obrotów pochodzi ze sprzedaży 60% oferowanych produktów, co zbliża się już do modelu ukazanego przez Andersona. Internetowe biura podróży zajmują raczej część spektrum odpowiadającą re-gułom „długiego ogona”, przy czym 30% z nich deklaruje, że sprzedaż 80% ofero-wanych produktów dostarcza 80% obrotów. Eksperci ogólnie zgadzali się z poglądem, że „przyszłością branży turystycz-nej są miliony rynków niszowych na płytkim końcu krzywej rozkładu” (ukazanej na diagramie PhoCusWright po prawej). Z tym stwierdzeniem zgadzały się dwie trze-cie badanych, zaś nie zgadzała się z nim zaledwie jedna trzecia (w szczególności przedstawiciele linii lotniczych). Choć większość uczestników badania wciąż uważa znakomicie sprzedające się produkty za dające największą szansę zarobku, około połowa upatruje znacz-nych możliwości sprzedaży większej ilości niszowych produktów i obsłudze niszo-wych klientów. Jakie mogą to być nisze? Choć turystyka rodzinna jest wciąż postrzegana jako źródło największych możliwości – i nie jest w istocie niszą – eksperci widzieli po-tencjał między innymi w wyprawach przygodowych (83%), podróżach religijnych (55%) oraz ślubach (45%). Sprzedawanie produktów niszowych wiąże się z dwoma oczywistymi proble-mami: ich niewielką ilością i koniecznością znalezienia wystarczającej liczby klien-tów. Według definicji, produktów niszowych nie da się sprzedawać w dużych ilo-ściach. Aby się rozwinąć, firma musi wypracować sposób standardowej obsługi liczby nisz pozwalającej uzyskać efekt skali. Dzięki temu suma niewielkich obro-tów w każdej z nisz zapewni dużą dochodowość. Dobrym przykładem takiego dzia-łania w branży turystycznej są tani przewoźnicy, obsługujący sieć połączeń do mniejszych miast: liczba pasażerów na każdym z połączeń może być niewielka, jednak dopóki są one dochodowe, przewoźnik może uzyskiwać duże łączne docho-dy. Inną strategią jest specjalizacja. Biorące udział w badaniu firmy, takie jak Trailfinders, która specjalizuje się w wyprawach przygodowych, czy Griffin Mari-ne, specjalizująca się w podróżach morskich, mogą zaoferować wiedzę ekspercką w określonej dziedzinie, co przy podejmowaniu decyzji o wyborze usługi może być bardziej istotne niż cena. To również sposób budowania lojalności. Przykładem spoza branży turystycz-nej może być producent samochodów Subaru, z powodzeniem operujący w obsza-rze niszowym. Firma specjalizuje się w pojazdach dla miłośników wypraw i „ama-
Trendy w obsłudze podróżnych… 87
torów wrażeń”. Financial Times cytuje Tima Mahoneya, dyrektora marketingu Subaru na obszar USA: „Jesteśmy marką niszową, jednak nie ma to nic wspólnego ze skalą naszego działania. Chodzi bardziej o znalezienie względnie bezpiecznego miejsca na rynku, gdzie możemy spokojnie egzystować”. W tym samym artykule wypowiada się John Wolkonowicz, analityk w zajmującej się analizami finanso-wymi i badaniami rynku firmie konsultingowej IHS Global Insight, który wyjaśnia: „Nie sądzę, aby dało się znaleźć wierniejszą grupę klientów niż posiadacze Subaru, może z wyjątkiem BMW”. W coraz bardziej wirtualnym świecie, w którym trudno zdobyć i łatwo stracić lojalność klientów, wejście na rynek nie wymaga pokonania wielkich barier, skala, specjalizacja lub połączenie obu tych czynników to jedna z nielicznych dróg, pro-wadząca do dochodowości i rozwoju firmy.
TRENDS FOR TRAVELERS AFTER ECONOMIC DOWNTURN AND CHALLENGES FACED BY TRAVEL INDUSTRY AND TRAVEL
PROFESSIONALS IN FORESEEABLE FUTURE
Summary Global Distribution System for travel industry are evolving rapidly in terms of technology and content. This article describes key elements of that evolution and chal-lenges travel professionals and companies who developing e-commerce solutions are facing. Explosion of the Internet and related content providers as well as Internet com-munities has created a virtual community with broad interactions to all industries, com-panies, institutions and active consumers. This is called Economy 2.0. As an outcome of expansion of Economy 2.0 it is fast development of Community 2.0 with all its blogs, wiki pages, community portals etc. There is also a discussion what will be the future of travelers, their travel behavior, trends in travelling etc. This article describes three broad trends influencing the travel industry today – increasingly expert customers, the ever more technological trip expe-rience and the growth of „niche” travel – that we believe are being accelerated by the current downturn. Article is based on research made by Amadeus GDS done among 2719 travel professional worldwide about a series of key trends in the travel industry. As an outcome it has been extensive desk research done to understand how these trends might be affected by the recession.
Translated by Ireneusz Marganiec

ZESZYTY NAUKOWE UNIWERSYTETU SZCZECIŃSKIEGO NR 592 EKONOMICZNE PROBLEMY TURYSTYKI NR 14 2010
PETER MAYER University of Pannonia, Hungary
ADAM PAWLICZ University of Szczecin
FINANCING TOURIST INFORMATION SERVICE. COMPARATIVE STUDY OF WEST POMERANIA PROVINCE, POLAND AND LAKE BALATON, HUNGARY
Introduction Although new information technologies completely changed the way tourist information service is provided, the problems with its funding remained mostly the same and resemble the problems of funding destination marketing activities. Be-cause commercial actors in the destination are unwilling to support service of tour-ist information and it is difficult to exclude them from potential benefits generated by its existence, provision of tourist information is often compared to the provision of a public good. It upkeep and development is indispensable for achieving a high consumer satisfaction and desired tourist flow and expenditure. In the paper the authors assume that on the regional and local level an appro-priately constructed tourist information system may positively influence tourist arrivals and expenditure. The authors see the quality of public private cooperation and institutional framework that regulates funding and creation of the system as critical factors influencing the efficiency of a tourist information system. In the article theoretical considerations are illustrated with the comparative survey of tourist information system in West Pomerania province in Poland and Lake Balaton in Hungary. Authors chose these examples because of certain simi-larities between this two tourist destinations such as domination of 3S tourism, similar level of local GDP and similar political background. The remainder of this paper is organized as follows Section 2 evaluates a theoretical framework of a place of tourist information as a part of the tourist

Peter Mayer, Adam Pawlicz 90
potential. Section 3 deals with problems of interconnections between Destination Marketing Organization (henceforth DMO) and Tourist Information Centres (TIC) and the general Tourist Information System. Section 4 presents a comparative study of Tourist Information Systems in Lake Balaton, Hungary and West Pomerania province in Poland. Authors conclude the paper in Section 5 with a summary and outlook for future research. 1. Tourist information service as a part of tourist potential of the region Tourism is often considered as an ‘experience industry’ where traded is rather information and intangibilities than tangible elements of total tourism product of a destination. N. Vanhove1 provide a seminal review of all elements of total tourist product and stress that its intangible elements such as image, hospitality, friendli-ness, courtesy, ambiance, security and understanding are as important as tangible part of a product. The quality of intangible part of tourist product depends on the social interrelations between tourists companies2 and on the quality and quantity of information available to tourists before they consume a product, as basic definition of quality is the difference between expectations and a product received3. A reduc-tion of information asymmetry on the tourism market is therefore a sine qua non to achieve a high quality of tourism experience. The very semantic understanding of the term ‘tourist information’ would im-ply that it is any information received by a tourist, i.e. any tourist company can generate it and deliver to the actual tourist. The information issued by a tourism company is, however, biased with the commercial interest of its sender and is of limited value to potential tourist. For that reason the term ‘tourist information’ usu-ally comprises of information that is neutral, i.e. it does not give any preference to the particular tourism company, and is usually generated by some public or semi-public institution which does not represent, at least explicitly, tourism branch. Pro-vision of tourist information is, most often, described by tourism researchers within the context of destination marketing4 especially as public private collaborative ap-proach5. Instead C. Hall argues that provision of visitor centres is public duty be-
1 N. Vanhove, The economics of tourism destinations, Butterworth Heinemann, Oxford 2005, pp. 78–86.
2 See. Y. Grangsjö, Destination networking, Co-opetition in periherial surroundings, “In-ternational Journal of Physical Distribution & Logistics Management” 2003, vol. 33, pp. 427–448.
3 Ching-Fu Chen, Fu-Shian Chen, Experience quality, perceived value, satisfaction and behavioral intentions for heritage tourists, “Tourism Management” 2010, No. 31, pp. 29–35.
4 A. Fyall, B. Garrod, Tourism marketing: a collaborative approach, Channel View Publi-cations, 2005, p. 306.
5 See: S. Williams, Tourism: The nature and structure of tourism, London 2004, p. 37.
Financing tourist information service… 91
cause of market failure (tourism branch will not provide neutral service in the free market)6. Most commentators such as Ch. Copper and S. Wanhill7 consider asym-metry reduction of information as a government policy instrument that serves to manage tourism demand. Sometimes tourist information system can be seen as an additional intermediary between tourism demand and supply, i.e. a part of tourism market. Tourist information centres, however, disseminate rather information than products per se, and do not charge provision for its service, so it is difficult to treat them as a competition to traditional travel agents. Tourist information system which, as a term, is as ambiguous as ‘tourism sys-tem’8 usually encompasses traditional and digital part. Tourist information points, signage and all informative material that is distributed by tourist information centres are considered as traditional part of tourist information while info-kiosks and all information available via internet site constitute a digital part of tourist informa-tion9. This study will focus mostly on traditional part of tourist information which can be hardly replaced by a digital one10. Tourists information centres (TICs), called sometimes “Welcome Centers” or “Visitors Centre” according to Encyclopedia of Tourism11 “provide information and reservations for destinations and tourism enterprises. Run by local, regional or na-tional organizations, they aim to facilitate a visit for consumers and to assist organi-zations to implement their policies, by increasing tourists’ length of stay and expen-diture or by discouraging them from visiting environmentally sensitive areas”. This definition presents a TIC as an institution not only financed but also organized by an undefined tourism organization. Hence, TICs are just one channel through which necessary information reaches tourists. Most authors would agree that provision of tourist information in a destination should be financed by public authorities responsible for tourism development in the region. Its institutional framework is, however, shaped differently according to local social and economic environment. While there has been little detailed research on the role of tourist information on the tourism market, there has been deafening si-lence in tourism literature about institutional framework in which tourist informa-tion centres operate.
6 C. Hall, Tourism planning: policies, processes and relationships, Pearson, Essex 2008, pp. 47–57.
7 Ch. Copper, S. Wanhill, Tourism: principles and practice, Pearson, Essex 2008, pp. 448–450.
8 Comp.: N. Vanhove, op.cit. 9 R. Ziółkowski, Zarządzanie informacją regionie turystycznym, Wydawnictwo Politech-
niki Białostockiej, Białystok 2007, pp. 41–42. 10 Comp.: R. Malaka, A. Zipf, Challenging IT research in the framework of a tourist infor-
mation system, http://interaction.zhdk.ch/projects/mobility2018/wp-content/uploads/2006/11/challenging_it_research.pdf DoA, 20.08.2009.
11 Encyclopedia of Tourism, J. Jafari (ed.), Routledge 2000, p. 307.
Peter Mayer, Adam Pawlicz 92
2. Tourist information centre as a DMO activity It is widely acknowledged that during the last decades tourism became in-creasingly turbulent. Sun-sea-sand destinations re-define themselves as golf hot-spots, former industrial regions develop modern art and architecture initiatives and laid back agricultural hinterland are suddenly rediscovered as an oasis of health and wellness. Themes are not only constantly invented but also mixed up or layered upon the geographical surface. As of spring, 2008, Austrian Styria promises to be a destination for families, for the youth, the elderly, for skiing, wine tasting, health and wellness, golf, trekking, cycling and biking, horse riding, for activities and for relaxation. In each of these markets it is competing with European and overseas destinations by managing information – both in terms of producing a unique tour-ism experience from traditions and cutting-edge trends and technologies and also in effective and competitive ways of managing visitor flows. With these developments it is more and more the destination management organization that becomes the focal point in these transformations. What we observe here is not a unique practice but a general trend: sole services are more and more difficult to market. Destination management is emerging as a new supply side integrative modus of tourism, par-tially replacing the demand side operator-type integration. This means that all-encompassing, structured and easy-to-use information service emerges as an alter-native to manage a tour: in case of single-destination trips referring to a DMO may be as convenient and secure for the tourist as the service of a tour operator12. According to Carter and Fabricius13 destination management involves coordi-nating activities of all the basic elements that make up a destination such as the attractions, amenities, accessibility, image and price. Destination management should ensure a long-term prosperity and development of local community and also contribute to the sustainable balance between economic, socio-cultural and envi-ronmental impacts. In an earlier study of Hungarian DMO’s the following areas of activity have been identified (figure 1)14:
place-marketing activities to attract people to visit destination (such as stra-tegic branding, as well, as more actual advertisement and sales),
co-ordinating other tourism actors’ marketing activities, delivery of services on the ground in order to exceed the expectations of
visitors by attractions-, event development etc., and
12 P. Mayer, A termékintegráció üzleti modelljei a turizmusban (Product integration
business models in tourism), in: Gazdaság, Verseny, Vállalkozás, Vol. 1, Budapest 2009, pp. 45–53.
13 C. Carter, M. Fabricius, Destination management – an overview, UNWTO Conference, „Creating competitive advantage for your destination”, Bp., 7th February 2007.
14 A. Jancsik, E. Madarász, P. Mayer, Cs. Raffay, Tourinform offices’ attitudes towards change and innovations, in: Kultúrák találkozása, Nyugat-Magyarországi Egyetem, Győr 2009.

Financing tourist information service… 93
creating suitable physical, economic and social environment which con-tributes to the tourism development with the help of various tools such as policies, legislation, regulations, taxation, infrastructure and product devel-opment, etc.; aiming at the sustainable use of resources.
Figure 1. DMO’s areas of activity
Source: own elaboration.
Beside the marketing approach UNWTO takes, destination management is defined by the United Nations Environmental Program’s tourism library as “… an important part of controlling tourism's environmental impacts. Destination man-agement can include land use planning, business permits and zoning controls, envi-ronmental and other regulations, business association initiatives, and a host of other techniques to shape the development and daily operation of tourism-related activi-ties.” Here it is rather the empowerment aspect of cooperative and collaborative action that is emphasized: with the successful application of destination manage-ment methods and tasks the actors involved will be more capable to control the impacts of tourism development and operation in their own area. Information service is a central component of destination management organi-zations. The term “information service” refers to a series of activities underlying the DMO’s ability to dynamically develop and present the tourism offer of a destina-tion. We can distinguish the following activities:
1. Networking is necessary to the development of links to all kinds of actors within the local tourism industry. Optimally, information service is based on some level of institutionalization of the destination network, that is, the existence of a formal or informal organization is more effective than ad hoc contacts.

Peter Mayer, Adam Pawlicz 94
2. Collecting information involves regularly contacting the actors in order to update the information available about them.
3. Controlling the collected information is an essential step in information service. For the tourist who is a stranger in the destination, one of the key roles of the DMO is that of a semi-external, non-commercial validation of the tourism offer. Although this is not a legally bounding warranty, DMO’s are still considered as exercising some level of authority over the informa-tion content they provide. Controlling may occur via the establishment of local or the application of national or international quality standards.
4. Structuring the information is the necessary step in preparation to informa-tion provision. Structuring does not only mean the allocation of information sources and types to pre-set categories (such as experiences, accommoda-tion, transportation, etc.) but also the thematic elaboration of a set and hier-archy of such categories. Also, it is essential to define the set of data to be collected on each component, as well as the relations among the data col-lected.
5. Providing information is considered to be the central task of tourism infor-mation centers. It is, however, obvious that without the preceding activities no high quality information services is possible.
Spatially we can distinguish between centralized, de-centralized and de-localized provision of tourist information15. Centralized provision refers to a model of where the task of informing tourists is solely dedicated to a single – central – tourist information office. The advantage of this model is that tourist contact a pro-fessional information provision service, optimally at a facility providing not only information but also interpretation of the area. The de-centralized model, in turn, is characterized by a central tourist office and a number of satellite information points in the field (as in accommodation units, at attractions, public transport nodes and the like). The advantage of this model is that it brings information “closer” to the tourist visiting the area, thus reducing the traffic flows to and in the central area of the destination as well as increasing the chances of contacting an information point and enhancing the quality of the trip. De-localized models are based on latest mo-bile technology and thus are rather new to emerge. As opposed to the centralized and de-centralized pull models, where tourists contact the information centers and points, this is a push model, where the information is brought to the tourist (or to its mobile device). Selective, event-driven and localized information directly targets the tourists’ appreciated needs.
15 A. Jancsik, P. Mayer, Fürdőigazgatóságok a Balaton Régióban (DMO’s in Balaton
Region), Study prepeared for the Lake Balaton Tourism Council, University of Veszprém, Veszprém 2003.

Financing tourist information service… 95
3. Tourist information service in West Pomerania and Lake Balaton West Pomerania West Pomerania province is situated in North-West Poland and is the fifth largest province in Poland. Since the province is endowed with many lakes, a long stretch of the Baltic coast, the Odra and other rivers, it is considered by many Poles as an attractive destination for a holiday. While there are numerous cultural attrac-tions in West Pomerania, tourist product is, nevertheless, based mainly on natural attractions, which implies high spatial (most tourists visit coastal part plus lakes and biggest cities) and temporal seasonality (peak summer season lasts approximately 2 months). In the province there are over 100 thousand places in collective accommo-dation establishments, which constitutes nearly 1/5 of the total number for Poland. Still, only less than a half is open all the year round. West Pomerania is administra-tively divided into 21 counties, which are further divided into 114 communes. Not surprisingly visitor centres in the surveyed communes were financed mainly from public funds, i.e. from a communes’ budget. Figure 2 shows the per-centage of communes’ contribution to TICs budget.
2 1 1 1 2 1
18
0
5
10
15
20
100% 99% 90% 85% 80% 70% 0%
Figure 2. Number of Tourist Information Centres benefiting from a given share of pub-lic sources budget (n=26)
Source: own elaboration.
In 77% of the communes surveyed visitor centres were entirely or almost en-tirely (99%) financed from communes resources and an average percentage of pub-lic funds in visitor centre’s budget was 92%. Just in one case a visitor centre was financed by an independent branch organization. In one commune a respondent refused to answer this question. Both representatives of communes and tourism entrepreneurs were asked whether they would like to participate in and finance a new potential Internet Sys-tem of Tourist Information (ISIT). A great majority declared their participation but only a small percentage of both communes’ representatives and entrepreneurs de-clared any financial support to such an initiative (figure 3).

Peter Mayer, Adam Pawlicz 96
23%20%20%
37%
57%
43%
0%
10%
20%
30%
40%
50%
60%
Communes Tourism branch
Yes
No
Do not know
Figure 3. Declared willingness to finance a potential Internet System of Tourist Information among representatives of communes and tourism entrepreneurs (n=30 and n=119 respectively)
Source: own elaboration.
Both groups of respondents were also asked to indicate on the Likert scale who should bear the costs of ISIT. Respondents see the communes and other units of public administration as the main investors, although some private input is also expected (figure 4). It is worth noting, that both communes representatives and entrepreneurs expect the other side to provide more funds than they would allocate themselves.
3,56 3,323,81
2,93
3,873,39 3,20
2,19
0,00
1,00
2,00
3,00
4,00
5,00
Communes Counties Province Tourism branch
Communes Tourism branch
Figure 4. Declared share in financing ISIT by different bodies in the opinion of repre-sentatives of communes and tourism enterprises.
0 means no contribution while 5 a highest share in financing ISIT. Figure presents ave-rage values.
Source: own elaboration.

Financing tourist information service… 97
Lake Balaton Lake Balaton is situated in the centre of Western Hungary and is the main Hungarian holiday tourism destination, administratively divided among three de-velopment regions (Central-, Southern- and Western-Transdanubia). As a shallow lake it is mainly a summer tourism destination, with the majority of visitors enjoy-ing seaside tourism. Most tourists visit the narrow strip along the shore during the main season July-August. In order to tackle the thematic, spatial and temporal con-centration of visitor flows, considerable efforts have been made during the last dec-ade to the increase and diversify the attractiveness of the area by developing sailing, as well, as cultural tourism, ecotourism, outdoor tourism in the wider area. The region features 31 000 places in hotels, and 29 000 places in campings, as well as 137 000 places in private accommodation. Currently, tourist information service is being restructured in Hungary. The former system is based on a national network of tourist information offices, called “Tourinform”. Under a franchise agreement The Tourinform offices were solely financed by the local communes and professionally co-ordinated by the National Destination Marketing Organization, Hungary Tourism Ltd. The system was based on a three-level hierarchy, with NUTS1 (national) level providing information on the international level (via a network of foreign representatives), NUTS3 (county) level coordinating domestic information services on a territorial basis, whereas the information offices themselves were affiliated with local communities. All three level were public bodies, founded, managed and fully financed by national or local authorities. The current scheme envisages the bottom-up development of local and regional DMO’s based on active participation of actors from the tourism field. It is argued that NGO’s co-founded by tourism ventures and the local authorities should take over the Tourinform offices and thus the responsibility of tourist information service. Parallel to this, also the financial background of destination management should be re-organized, to – at least partially – replace public spending with contri-butions of tourism ventures. Although referred to as “bottom-up”, the new scheme has been initiated by the national tourism authority. New DMO’s were established on NUTS4 (“small region”) level, and their development is financed and in rela-tionship to regional development, also coordinated on NUTS2 level. Thus, the role of the counties, which were pivotal actors previously, became ambiguous. As the overall existence of the counties as an administrative level is disputed, it is unlikely that they will play an important role in the future in tourist information service. The role of the communes is more problematic. It is envisaged that communes should apport their resources to the new DMO’s which than take over information service. This poses spatial and financial questions. Spatially the main problem that now becomes more evident is the unequal distribution of Tourinform offices. There have been 18 DMO’s established around the lake, whereas the number Tourinform of-fices is only 10. Furthermore there are some DMOs manage more than one (up to 4)

Peter Mayer, Adam Pawlicz 98
Tourinform’s, but many of the newly established DMOs do not provide tourist in-formation right now. Thus, on the one hand side, in some cases there is a new need to coordinate the work of more Tourinform offices now managed by one DMO, which necessarily pushes the whole system towards the de-centralized model. In other areas there are DMO’s established which do not ’inherit’ any Tourinform office. These, of course, face different problems and will have to take more initial steps towards developing tourist information service. It is open yet, if they will go the same way, establishing one central information center first, or they will be able to skip this step and launch de-centralized and possibly even de-localized model of information provision. Financially the involvement of new actors from the tourism branch raises the question if the material resources available to DMO’s in general and tourist infor-mation service in particular can be extended. It is also obvious that more funding can only come from the private sector as local communities’ budgets are constantly under pressure. However, in most cases, the tourism branch is more eager to co-decide then to co-finance. Based on a study of tourist information centres at Lake Balaton it is clear that tourism enterprises are willing to provide financial means to the new DMOs. 7 out of 8 offices responding to the study accepted the need to con-tribute with financial means. However this mainly happens in the form of member-ship fees, which are not related to the actual costs. The bulk of financing, 40-60% is still provided by the local authorities. In all cases direct income from tourism enter-prises and their associations is less than 20% of the overall budget. Regional devel-opment – in frame of the national development plan – provides additional 15-20%, mainly to cover one-time set-up costs associated with the launch of the new system. A promising development however is that the DMOs could generate income from the market by providing value added services to the tourists, such as mediating services, selling souvenirs and providing own services (e.g. guided tours). This kind of income covered 15% of the overall budget (figure 4).
Figure 4. Average financing of tourist information service (n=8)
Source: own elaboration.

Financing tourist information service… 99
Limitations and conclusions Tourism information service undergoes rapid changes both in Poland and Hungary. Established Western-European destination management models, involv-ing a participatory management scheme of tourist information provision were intro-duced. One of the clear advantages of the model is that it forces destination market-ing into a more market-oriented operation. The input from for-profit organizations de-politicizes destination marketing, provides a closer relationship to the customer and a more direct control over effectiveness. On the other hand, the sense of owner-ship on behalf of the participating enterprises is limited yet. Financing, as the most important indicator of this, clearly suggest that the successful application of busi-ness models is culturally embedded. It is easier to set up the legal and administra-tive framework then to change the attitudes of the actors involved. In light of the recent developments of the tourism market this underlying cul-tural features seem to be a major obstacle. Clearly a number of emerging destina-tion marketing solutions are only viable in a supporting environment where the relationship of the actors involved is equal and democratic, best described with the network metaphor. The growing importance of place-brands in marketing tourism services, as well as the involvement of the consumer in providing and marketing tourism services – as with web 2.0 and social media solutions – require a more pro-active participation of enterprises in destination marketing.
FINANSOWANIE OBIEKTÓW INFORMACJI TURYSTYCZNEJ W WOJEWÓDZTWIE ZACHODNIOPOMORSKIM ORAZ
W REGIONIE JEZIORA BALATON (WĘGRY)
Streszczenie W artykule przedstawiono aspekty teoretyczne finansowania obiektów informacji turystycznej, które stanowią istotny element potencjału turystycznego regionu. Rozwa-żania teoretyczne zostały zilustrowane badaniami funkcjonowania informacji turystycz-nej w województwie zachodniopomorskim oraz w regionie jeziora Balaton (Węgry). Przedstawione badania koncentrują się na instytucjonalnych aspektach funkcjonowania systemu informacji turystycznej, a w szczególności na problemach jego finansowania.
Tłumaczył Adam Pawlicz


ZESZYTY NAUKOWE UNIWERSYTETU SZCZECIŃSKIEGO NR 592 EKONOMICZNE PROBLEMY TURYSTYKI NR 14 2010
AMANDA MIEZE School of Business Administration Turība, Riga, Latvia
NEGLECTED USE OF CREATIVE INDUSTRY’S PRODUCTS IN RIGA’S TOURISM OFFER
Introduction In recent years all over the world culture has proved to be a factor for econom-ic development and the meaning of culture as a former of creative potential has been growing as it has been considered the base for development of creative indus-tries as well as an important tourism resource in every country. Dramatic growth in the variety and availability of cultural products has led to cultural explosion. Important elements of changes which relate to the development of cultural tourism include increasing merging between previously separate social and economic spheres, such as culture and economy, and tourism and culture. 1. Creative industries The Department for Culture, Media and Sport of the United Kingdom (DCMS) in 1998 and 2001 was the first who developed the definition of creative industries, which underlies for defining creative industries in other countries. Ac-cording to DCMS creative industries are those industries that are based on individu-al creativity, skill and talent; and also those that have the potential to create wealth and jobs through developing intellectual property. They include: advertising; film and video; architecture; music; art and antiques markets; performing arts; computer and video games; publishing; crafts; software; design; television and radio; designer

Amanda Mieze 102
fashion1. Creative industries can be defined as the cycles of creation, production and distribution of goods and services that use creativity and intellectual capital as primary inputs. They comprise a set of knowledge-based activities that produce tangible goods and intangible intellectual or artistic services with creative content, economic value and market objectives. Creative industries constitute a vast and heterogeneous field dealing with the interplay of various creative activities; this sector has a flexible and modular market structure that ranges from independent artists and small-business enterprises at one extreme to some of the world’s largest conglomerates at the other. All 13 creative industries are often perceived to have as many differences as similarities and the ways of further creation vary according to the sector, however, they have the following characteristics:
1. The capacity to generate new ideas through technical or marketing re-quirements which are prescriptive (design, advertising, TV production, computer animation); or through individual creation (literary, music au-thors, visual artists, composers, film directors, screenwriters, games devel-opers, fashion designers). New ideas can be generated “in-house” (design in car manufacturing, fashion design, a play in a theatre) or outsourced (ex-clusively contracted with a company like artists in music, independent de-signers and visual artists).
2. Identifying and managing talent – ability to retain talents and to network with the talent community whether creators, independent producers or managers. The creative industries are people-based businesses; creation is less managed, rather supported, encouraged and promoted.
3. Financial expertise in understanding the investment value of creative ideas – the ability to provide budgeting and forecasting that relates the amount invested in creative projects to its market potential (both for production and distribution). It involves the willingness to take and accept risks as creative ideas can never guarantee success. The ratio between success and failure is rather high in the creative sector, which implies the need for a long term vi-sion and the tolerance of failure in creative output2.
4. Decentralized production coexisting with centralized administrative and of-ten distribution functions3.
The notion and creation of expressive values in economics is mapped in a series of concentric circles radiating out of the core expressive value creation and shown in Figure 1.
1 http://www.culture.gov.uk/what_we_do/creative_industries/default.aspx, 15.01.2010. 2 F. Kolbērs, Ž. Nantels, S. Bilodū, D. Ričs, Kultūras un mākslas mārketings, RD Rīgas
Kongresu nams, Rīga, 2007. 3 The Impact of Culture on Creativity, A Study prepared for the European Commission,
2009, http://ec.europa.eu/culture/key-documents/doc/study_impact_cult_creativity_06_09.pdf.
Neglected use of creative… 103
Figure 1. A stylized typology of the creative industries
Source: Economic Performance of the UK`s Creative Industries, 2007, http://www.culture.gov.uk/reference_library/publications/3672.aspx, 15.01.2010.
Core creative fields represent generation of pure creative content – the domain of the author, painter, film-maker, dancer, composer, performer and software writer. Cultural industries focus primarily or solely on the commercialization of pure ex-pressive value – such as music, television, radio, publishing, computer games and film. Creative industries – architecture, design, fashion, computer software services and advertising deliver both expressive and functional value, and constitute inter-mediate input in sectors in the wider economy. Creative industries’ sector is one of the fastest growing sectors of the world economy. Over the period of 2000–2005, trade in creative goods and services increased at average annual rate of 8,7%. The world exports of creative products were valued at $424,4 billion in 2005 as com-pared to $227,5 billion in 1996, according to UNCTAD figures. Creative services in

Amanda Mieze 104
particular enjoyed rapid export growth – 8,8% annually between 1996 and 2005. This positive trend is expected to continue into the next decade, assuming that the global demand for creative goods and services continues to rise4. This growth is accounted for by rapid techno-economic change in products, distribution and mar-keting; the increasing commercialization of intellectual property, particularly copy-right; the shift towards a post-industrial economy where personal, recreational and audio-visual services have expanded as a share of the economy; the strong cross-promotional linkages with sectors like tourism; and the convergence of media, the increasing concentration of large firms and the expansive growth of the digital economy that allows for easier production, distribution, consumption of cultural products, services and intellectual property5. The idea of culture as an engine for regeneration has become the norm. As mentioned in the United Kingdom strategic document for the Creative Industries „Creative Britain – New Talents for the New Economy”, carried out in 2008, two million people are employed in creative jobs and the sector contributes £60 billion a year (7,3%) to the British economy. Over the past decade, the creative sector has grown at twice the rate of the economy as a whole and is well placed for continued growth as the demand for creative content grows6. Cultural industries are increa-singly seen as a tool for economic development, poverty reduction, and the assur-ance of cultural diversity. In addition, they are closely linked to participation in the post-industrial economy and the knowledge-based society. Accordingly, there is a new focus on the potential of mainstreaming cultural industries into national de-velopment plans as a means of achieving more sustainable development. Cultural vitality is considered as synonymous with innovation and diversification7. Diversity as a cultural dimension of the creative industries has become more prominent in recent years. The Universal Declaration on Cultural Diversity8 sees diversity as being embodied in the “uniqueness and plurality” of the identities of various societies and groups, a common heritage of humankind. Since culture itself is intrinsic to the realization of human aspirations, it is argued that cultural diversity will be an important factor in promoting economic, social and cultural development.
4 The Creative Economy Report 2008, http://www.unctad.org/en/docs/ditc20082
cer_en.pdf , 15.01.2010. 5 K. Nurse, Culture as the Fourth Pillar of Sustainable Development, Prepared for Com-
monwealth Secretariat, Malborough House, Pall Mall, June 2006, London, UK, http://www.fao.org/SARD/common/ecg/2785/en/Cultureas4thPillarSD.pdf, 15.01.2010.
6 Creative Britain – New Talents for the New Economy, http://www.culture.gov.uk/reference_ library/publications/3572.aspx, 15.01.2010.
7 Address by Mr Koïchiro Matsuura, Director-General of UNESCO, at the opening of the first UNESCO World Forum on Culture and Cultural Industries, Monza, Italy, 24 September 2009, http://unesdoc.unesco.org/images/0018/001841/184196e.pdf, 15.01.2010.
8 Unesco Universal Declaration on Cultural Diversity, 2001, http://unesdoc.unesco.org/-images/0012 /001271/127160m.pdf, 15.01.2010.
Neglected use of creative… 105
These sentiments were in turn given substance in the Convention on the Protection and Promotion of the Diversity of Cultural Expressions9, where the cultural indus-tries are specifically identified as essential to the achievement of the benefits of cultural diversity. The creative industries depend upon diversity for their success. There is a complex and critical relationship between creativity and diversity, whose centrality to the creative process cannot be underestimated10. A noteworthy aspect of cultural industries is cultural tourism. There is no doubt that culture is an important tourism resource in every country. 2. Cultural tourism, policy planning and Riga’s tourism offer A growing trend within the tourism industry has been to focus regionally on an area’s cultural appeal. The term ‘cultural tourism’ has been used to describe the consumption of art, heritage, folklore, and a whole range of other cultural manife-stations by tourists. As cultural tourism gains in popularity, the demand for high-quality authentic experiences is on the rise. A growing number of cities are basing their tourism development strategies on the promotion of cultural heritage, and the number of cultural attractions is growing rapidly11. Starting from the early 1990s, spatial economic sciences shifted focus towards the role of culture in urban and regional development. This cultural turn is embed-ded in societal changes like increasing welfare levels, the increasing opportunities for interaction due to information and communication technologies (ICT), and the increasing networking of people, information, goods and services concerning ag-glomeration and urban development12. One aspect is associated with the potential role of culture to differentiate competing cities with respect to inward investment or tourism. The other aspect concerns city development; here cultural activity is an agent for improved urban life. In addition to its economic impact, tourism and cul-ture can improve quality of life and build community. If arts and tourism communi-ties work together to highlight the unique character of a city, they can harness mar-ket forces to educate and entertain visitors, preserve cultural assets, and create community pride in its heritage and way of life.
9 Convention on the Protection and Promotion of the Diversity of Cultural Expressions,
2005, http://portal.unesco.org/en/ev.php-URL_ID=31038&URL_DO=DO_TOPIC&URL_-SECTION=201.html, 15.01.2010.
10 The Difference: How the Power of Diversity Creates Better Groups, Team, Schools and Societies, S. Page (ed.), Princeton University Press, 2007.
11 R. Greg, Cultural Tourism in Europe, CAB International, Wallingford, UK, 1996. 12 Creative Cities, Cultural Clusters and Local Economic Development, Ph. Cooke, L. Laz-
zeretti (eds), http://www.springerlink.com/content/y400v28709246857/fulltext.pdf, 15.01.2010.
Amanda Mieze 106
Riga – the city of inspiration – is one of the slogans currently used by the city government. The Long-Term Development Strategy of Riga until Year 2025 stresses the geographic location of Riga, emphasizing the fact that the city will de-velop as the cultural, educational and tourism centre of the Baltic region. Imple-mentation of the Strategy is ensured by The Development Programme of Riga for 2006–2012 which indicates that the city’s economic competitiveness and interna-tional identity will be promoted by culture and tourism – they will serve as a source of revenue and as a means of forming a positive image of the city13. The basic prin-ciples, goals and action targets for the development of tourism are defined in The Riga City Tourism Guidelines for years 2008–201214. They suggest the vision for Riga as an attractive and diversified tourism destination, attracting foreign and do-mestic tourists by forming of the city’s image, informing about tourism opportuni-ties and offering a variety of tourism products in a secure and orderly environment. Also Riga’s Tourism Coordination and Information Centre has been working since 2002 – it renders information about tourism offers to travelers. Riga is the most important tourist destination of Latvia. According to Central Statistical Bureau15 (CSB) data 34% of lodging capacity in 2008 was concentrated in Riga and two thirds of foreign guests have chosen to stay there overnight. Also the number of lodging units, the number of guests serviced and the number of ser-vices offered since 1991 has increased every year. During the last ten years the lodging capacity in Riga has doubled while the number of overnight visitors has tripled. The main target markets for Riga in the year 2008 were mainly European countries – Germany, Lithuania, Finland, Estonia, Russia, Sweden, Norway and Great Britain. Traditionally tourism in Riga has been based on its cultural and historical resources and architectural attractions which are primarily located in Old Town16. The historic centre of the city is listed as part of UNESCO’s World Heritage sites because of unique and preserved structure of town planning. Also more than one third of Old Town buildings are built in well known art nouveau architecture thus representing Riga as one of the main European art nouveau centers. There are more than 50 museums in the capital and the thematic range of them is extensive – they cover branches such as history, art, literature, medicine and nature. Riga also has deep theatre traditions – 5 repertory theatres and 5 music institutions, including The Latvian National Opera work in the city. The National Song and Dance Festival which takes place every four years is recognized by UNESCO as a unique cultural
13 Development Program of Riga for 2006–2012, Riga City Council, 2005. 14 The Riga City Tourism Guidelines for years 2008–2012, www.riga.lv, 15.01.2010. 15 www.csb.gov.lv, 15.01.2010. 16 M. Rozite, Tourism Development, Pitfalls and Future Opportunities in Riga – the City of
Inspiration, University of Latvia, Riga 2008.

Neglected use of creative… 107
event. Noteworthy becomes annual Riga’s Opera music festival – this tradition was established in 1998 to promote cultural tourism and The Latvian National Opera abroad. Cultural tourism is becoming more and more popular – a survey conducted by Marketing and Public Opinion Research Centre17 SKDS in 2008 among Nordic (Finland, Sweden, Norway) and Russian tourists visiting Riga shows that cultural heritage, architecture and cultural events are primary attractions for 62% tourists from Nordic countries and 58% from Russia. The findings of the research showed that Internet is the most popular source of information (for 74% Russian and 80% Nordic tourists) and the lack of information about events is mentioned as one of the serious obstacles for tourists willing to visit the capital of Latvia. The city exists and ‘lives’ on numerous websites. Those provided by the city government and pub-lic organizations have the express purpose of marketing and presenting the city. However, there is no single website where foreign tourists could find all-embracing information about various cultural activities in the city. Unfortunately the processes in tourism and cultural industry have been af-fected by the lack of funding that would facilitate renovation and creation of tour-ism and culture infrastructure. However, trends of tourism development foster crea-tion of new products, forming new territorial units. Such privately financed ongoing example in Riga is Spīķeru area, where old historic warehouses are being renovated and transformed in culture centre with such activities like museums, cinemas, exhi-bition halls and art galleries. Also a small street – Mūrnieku Street is a good exam-ple – it is being renovated in its authentic shape and will be turned into a street of craftsmanship devised for tourists. Traditional cultural institutions like theatres are not widely involved in tour-ism and recognized as considerable resources for cultural tourism. This results from the lack of collaboration models among local government institutions and cultural institutions. Also cooperation among private tourism agencies and cultural institu-tions would contribute to foster cultural tourism in Riga. For establishing Riga as internationally recognized tourist destination devel-opers of Riga city should represent the role cultural aspect plays in the city man-agement. Riga will be European Capital of Culture in 2014, the formal nomination of Riga by the EU Council of Ministers is expected in May 2010. This is a great opportunity for the city to offer purposefully not only traditional forms of art and culture, but also stress the role of creative industries for the development of the city.
17 Krievijas un Skandināvijas tūristu aptauja, Sabiedriskās domas pētījumu centrs, Rīga
2008.
Amanda Mieze 108
Conclusions In the contemporary world, a new development paradigm is emerging that links the economy and culture, embracing economic, cultural, technological and social aspects of development at both the macro and micro levels. Central to the new paradigm is the fact that creativity, knowledge and access to information are increasingly recognized as drivers for economic growth and promoting develop-ment in the global world. Culture is a source of creativity and innovation that feeds the cultural and creative industries. It is not a sector of secondary importance; rather it constitutes a key component of the economy. Therefore cultural industries should be viewed as a critical strategic resource in the move towards creating sustainable development options. Riga is the true capital of culture and the arts with strong cultural traditions in branches like theaters, museums, music and opera, as well as cultural resources – architecture, historical resources and museums, but the potential of the cultural sector in general and the cultural industries in particular is largely unrecognized and under-exploited. In order to support contribution the cultural industries contribute in tourism, action must be targeted by using opportunities of ICT for improving the city’s websites and developing collaboration models between tourism conducing local government institutions and cultural institutions as well as cultural institutions and private tourism agencies. Also programs and funds should aim to support en-terprises that draw on culture-based creative inputs, territories using culture as a tool for development and cultural co-operation across different territories. Culture is now becoming an essential element in tourism policies at all levels. The synergy between culture and economic development is promising. It is possible to promote innovative cultural activities based on cultural tourism which will be capable of revitalizing culturally rich areas experiencing difficulties in emerging from economic decline. European Cultural Capital event provides a prime example of the changing role of cultural tourism – this event is viewed as a tool for econom-ic regeneration rather than purely cultural manifestation. Tourism and culture together become major drivers of destination attractive-ness and competitiveness. A strong link exists between tourism and culture, and it can be fostered to help city become more attractive to tourists and also increase it’s competitiveness as a location to live, visit, work and invest in.

Neglected use of creative… 109
ISTOTA ELEMENTÓW KULTURALNYCH W PRODUKCIE TURYSTYCZNYM RYGI
Streszczenie W ostatnich dekadach sztuka i kultura stają się coraz ważniejsze dla produktu turystycznego dużych miejscowości. Kultura, obejmująca zarówno elementy niemate-rialne, jak i materialne, używana jest jako główny element w przekazach promocyjnych. Celem artykułu jest ocena wpływu kultury na wielkość popytu turystycznego w stolicy Łotwy.
Tłumaczył Adam Pawlicz


ZESZYTY NAUKOWE UNIWERSYTETU SZCZECIŃSKIEGO NR 592 EKONOMICZNE PROBLEMY TURYSTYKI NR 14 2010
ALEKSANDER PANASIUK University of Szczecin
PERSONNEL AS A DETERMINANT OF SHAPING INNOVATIVENESS OF REGIONAL TOURISM ECONOMY
1. Tourism economy Tourism economy appears in every sphere of economy: production of goods and services, their division, exchange and consumption1; it also occurs in the major-ity of the national economy branches, that directly or indirectly refer to the meeting of tourist demand. In a system approach, tourism economy is defined as a system of correlations emerging during the process of fulfilling tourists’ needs, correlations between insti-tutions and organizations realizing the process2. This system includes all activities aiming at meeting touristic demand, from a natural environment adaptation for the needs of touristic movement to bringing conditions enabling tourism development. Tourism sector is one of the elements of national economy structure, which penetrate other sectors and is supported by other economic sectors. The majority of economic processes in tourism sector is realized by direct tourism economy and its representatives, touristic entrepreneurs. Territorial self-government units and tourist organizations play a significant role in formation of economic processes in tourism sector on the local level. State, understood as a set of political institutions that operate in relation with civil society, is a regulator of tourism economy processes. In that approach, term
1 T. Łobożewicz, G. Bieńczyk, Podstawy turystyki, WSE, Warszawa 2001, p. 71. 2 A. Nowakowska, Gospodarka turystyczna w ujęciu systemowym, Folia Eeconomica
Cracoviensia 1988, vol. XXI, pp. 169–171.
Aleksander Panasiuk 112
state comprises the whole system of exercising public power, system that mainly consists of elected politicians and entities of public sector (state’s institutions)3. In the totality of activities of tourism economy entities, a special role should be ascribed to the personnel, namely human potential of tourism economy entities. The aim of this publication is presentation of the role of personnel in affecting innova-tiveness of regional tourism economy. 2. Production factors in tourism economy Alike in the whole economy, production factors are essential for realization of final effects also in the tourism sector. Production factors are all inputs involved in the production of goods and services. In the classic economy there are differed three basic production factors: labor, land and capital4. In the modern approaches they are completed with the fourth that has different names. Beginning with technical and organizational progress which is a logic extension of coexistence and cooperation of three basic factors, ending with information and knowledge – treated as the most modern factors of production in so called new economy5. Innovations should be also placed within the meanings of that factor. Drawing 1 presents a system of production factors in the tourism economy. Considerations taken up in this paper refer to the relations between two, from pre-sented on the drawing 1, production factors in tourism economy:
labor – personnel employed in the tourist companies, employees responsi-ble for tourism in the territorial self-government units, employees of re-gional tourist organizations and other tourist organizations and associations operating in region,
information, knowledge, innovations.
3 Zarządzanie turystyką, L. Pender, R. Sharpley (eds), PWE, Warszawa 2008, p. 270. 4 Ekonomika turystyki, A. Panasiuk (ed.), Wydawnictwo Naukowe PWN, Warszawa 2007,
p. 60. 5 Przedsiębiorstwo usługowe. Ekonomika, B. Filipiak, A. Panasiuk (eds), Wydawnictwo
Naukowe PWN, Warszawa 2008, pp. 127–129.

Personnel as a determinant of shaping innovativeness… 113
Figure 1. Relations in he structure of production factors of regional tourism economy
Source: own elaboration.
3. Personnel in tourism Human factor plays a significant role in services what distinguish this sphere of economy among the others. Number and qualifications of employed employees are basic indicators of the level of services supply. Value of work is a dominating element of cost structure in most services, especially in entities providing services. It should also be underlined that services usually require highly qualified work, more complicated than most areas of material production. Real situation on the

Aleksander Panasiuk 114
service market can be judged through the prism of changes in the sphere of em-ployment6. In the tourism sector, potential of labor is formed by employees of particular entities, especially of tourist companies7 and territorial self-government units. In case of companies – labor is human’s intentional operation consisting in changing natural goods and adjusting them to fulfilling human’s needs, which is usually paid. It can be considered in a quantitative approach as well as qualitative. Rate of employed is used in quantitative estimation while education and seniority are taken into consideration in qualitative estimation. Company should employ personnel in a proper number and suitably qualified in order to operate effectively in the market economy. Activities related to the operation of direct tourism economy are mainly taken up by: companies’ owners, managers, units’ directors. This personnel create the range of cooperation with other participants of supply side of the tourism market and they take part in tasks initiated by territorial self-government, tourist organiza-tions. Realization of exploitive tasks lies in the competences of front personnel and influences the level of meeting tourists’ needs8. Beside personnel of entities providing tourist services, employees of territorial self-government have significant influence on the shape of regional tourism econo-my. They are responsible for the range of creation of tourist function. Their compe-tences refer mainly to the municipal and city areas and regions (self-government voivodeships). Among basic competences of employees of units responsible for tourism development are: influencing creation of local infrastructure including tour-ist tracks, tourist information, tourism promotion, events organization, cooperation with other entities (entrepreneurs and organizations). Affecting development of local and regional tourism economy lies within the competences of self-government authorities: village-mayors, mayors, presidents and marshals and councils of all levels. Effects of their activities are: description of tourism development strategy, conducting tourism policy, current decisions and direct cooperation with representatives of other entities, i.a. within the operation of local and regional tourist organizations. Significant competences in the field of regional tourism economy are also possessed by the representatives of tourist organizations (managements) including local and regional and also by tourist sectoral self-government. It should be as-
6 A. Panasiuk, Personel jako instrument marketingu usług turystycznych, Ekonomiczne
Problemy Turystyki nr 1, Wydawnictwo Naukowe Uniwersytetu Szczecińskiego, Szczecin 2002, pp. 82–85.
7 A. Tokarz, Zarządzanie zasobami ludzkimi w sektorze turystycznym, Difin, Warszawa 2008, pp. 32–33.
8 A. Tokarz, Personel hotelowy, in: Hotelarstwo. Usługi, eksploatacja, zarządzanie, A. Panasiuk (ed.), Wydawnictwo Naukowe PWN, Warszawa 2008, pp. 151–157.

Personnel as a determinant of shaping innovativeness… 115
sumed that the basic range of competences of tourist organizations’ personnel is related to taking up wide cooperation with representatives of other institutions and companies in local, regional, domestic and international dimension. Cooperation is concentrated on joint initiatives related to the creation of tourist products, financing of those activities, tourism promotion etc. The final effect of tourist personnel operation is integrated tourist product, which is result of joint activities based on the agreement and seeking for joint bene-fits for entities of supply side of tourism market, considering needs of tourists get-ting to the places of tourist reception. 4. Information, knowledge, innovations in tourism economy The last, from presented on the drawing 1, factors of production is informa-tion/knowledge/innovations. In the modern economy, this factor, used in economic processes, is decisive for social and economic development. Significant influence is visible especially in a long term. Resources of that factor, not natural resources, decide on the economic position of particular national economy. Widely understood information with included aspects of knowledge and inno-vations become a basic production resource in economic processes. Not every in-formation appearing in the economy is production factor. Production factor is only that kind of information that has features of economic resource. Information eco-nomic resource are every potentially useful collections of information, gathered and stored in time, place and by means of technologies and by organizations enabling their utilization by final users operating as economic entities in the economy. In the other words, production factor is knowledge about how to utilize labor, land and capital in order to provide services. In the conditions of tourist services market, information is utilized as:
knowledge, namely potential which should be properly managed, basis for taking up market decisions, by means of market researches aimed
at competition and consumers, data base on potential of tourist areas (tourist virtues, tourism infrastruc-
ture, entities’ tourist offer), form (technology) of contact, offer presentation and finalizing transactions
with consumers and partners by means of modern reservation systems and the Internet,
subject of entities’ operation on tourism market, especially services in the field of tourist information in a wide meaning.
Without current and reliable information clients would have limited possibili-ties of their tourist needs creation and finding offers fulfilling those needs. On the

Aleksander Panasiuk 116
other hand, entities offering tourist services wouldn’t be able to create tourist offers and effectively realize them on the market. From the point of view of tourism economy entities, information is an element of economic process thanks to which it is possible to take up fast and effective mar-ket decisions in contacts with clients and partners. It allows tourism economy, in aerial approach, for forming the whole processes of tourist products creation, their market identification, image creation and integration of cooperation between partic-ular entities of tourism economy: entrepreneurs, self-government units, tourist or-ganizations. One of the most significant issue in that field will be activity related to the research projects with participation of tourism sector entities, territorial self-government and other institutions aiming at development of local and regional tour-ism economy (including scientific units). Information, thus, is entrepreneurs’ tool by means of which it is possible to take up decisions about changes in the company. Initial condition for implementing changes is entrepreneurship. Entrepreneur creates innovative9 atmosphere and ne-cessary structures gaining knowledge and capital. Change in the company becomes innovation in a proper scale only then, when it is accepted by stakeholders and strengthen in the form of new standard practices, procedures and products. Innova-tions in services can take the following forms10:
organizing solutions for a new problem, new problems can be formulated by clients or created by innovative service providers who foresee demand changes. Identification of problems can result from the interactions be-tween provider and client,
more effective way of finding solutions of problem of known type (changes in methods, processes, technical systems).
First type of innovation is described as product innovation while second as process innovation. Innovativeness in tourism economy can be expressed by11:
1. Implementation of new goods and services or improving existing ones, e.g. new forms of hotel guests servicing.
2. Implementation of new methods of productions, e.g. low-budget hospitali-ty.
3. Opening of new markets for tourist movement from the western countries, e.g. Eastern Europe countries,
4. New sources of products supply, e.g. local victuals. 5. Creation of the new type of organization, e.g. law cost airlines.
9 P.F. Drucker, Innowacje i przedsiębiorczość, PWE, Warszawa 1992, p. 29. 10 Przedsiębiorstwo turystyczne. Ujęcie statyczne i dynamiczne, G. Gołembski (ed.), PWE,
Warszawa 2007, p. 62. 11 S.J. Page, Tourism Management. Managing for Change, Butterworth Heinemann, Ox-
ford 2005, p. 267.

Personnel as a determinant of shaping innovativeness… 117
Creation of friendly environment for companies, especially from MSE sector lies within the competences of the institutions of business surrounding. Supporting centers are the most often defined as institutions aiming at widely understood entre-preneurship support. Those units operation consists in12:
supporting entrepreneurship, self-employment, enabling start and help for newly created, private companies; promotion and improvement of SME competitiveness;
bringing conditions for the transfer of new technological solutions to the economy and realization of innovative ventures;
lifting the quality of human resources by education, training and consulting and popularization of positive acting patterns;
utilization of resources and realization of infrastructural undertakings; creation of network of cooperation and partnership between many entities
operating for the development acceleration, increase of prosperity and wealth of inhabitants13.
Effect of cooperation between companies and entities of business surrounding in the aspect of innovative processes are cluster structures. Cluster is a group of companies and connected with them institutions, laying in the geographical neigh-borhood, operating in a particular field, linked together by similarities and mutually completing. An essential element of cooperation within tourist cluster is continuous flow of knowledge and information14. Cluster is a spatial concentration of companies, institutions and organizations mutually linked with expanded net of formal and informal relations, based on joint way of development (e.g. technological, joint target markets etc.), competing and cooperating in some aspects of operation at the same time. Cluster can be a tool of increasing competitiveness and innovativeness of local tourism economies. It is also a kind of not wholly formalized net of economic entities and supporting organiza-tions, linked together by informal exchange of knowledge and information15. From the point of view of tourism economy, an access to the natural resources or existence of specific natural conditions on particular field of regional economy, is a decisive factor for clusters emergence. In case of that cluster, important ele-ments are tourist virtues, around which tourism infrastructure is created, infrastruc-
12 Innowacje i transfer technologii. Słownik pojęć, K.B. Matusiak (ed.), Polska Agencja
Rozwoju Przedsiębiorczości, Warszawa 2005, p. 107. 13 P. Niedzielski, A. Dołowy, D. Milewski, D. Szostak, Innowacyjność i struktury klastro-
we w województwie zachodniopomorskim. Turystyka, Wydawnictwo Naukowe Uniwersytetu Szczecińskiego, Szczecin 2008.
14 D. Milewski, A. Panasiuk, D. Szostak, Zachodniopomorski klaster turystyczny, Uniwer-sytet Szczeciński, Zachodniopomorska Regionalna Organizacja Turystyczna, Szczecin 2005.
15 Polski klaster morski. Założenia programowe. Wydawnictwo Instytutu Polska Sieć Go-spodarki Morskiej. Gdańsk 2004, p. 4.

Aleksander Panasiuk 118
ture enabling consumption of benefits related to the utilization of those virtues. On the particular area with tourist meaning many stricte touristic entities can operate, which mainly provide tourist services (hotels, entities from the gastronomical sec-tor, tourist organizers and operators, transport systems entities, entities managing tourist attractions), as well as around – touristic, supporting operation of typical tourist companies16. 5. Models of personnel relations in tourism economy The structure of production factors in tourism economy decides on its operat-ing. Cooperative relations between representatives of:
economic entities of direct tourism economy, territorial self-government units of every level, economic self-government units in tourism, regional and local tourist organizations;
have a decisive meaning in that field. Cooperation generally refers to the following aspects of tourism economy functioning:
offer and complete tourist products creation, development of tourism infrastructure, including creation of tourist trails, applying for financing, especially for European funds, local and regional tourism promotion, tourist personnel training, over regional, cross- boarding, Euro-regional and international aspects, taking up innovative activities.
Basic platform of cooperation are local and regional tourist organizations. It can also refers to the other form of cooperation, e.g. by means of economic self-governments or single initiatives. Cooperation between representatives of companies, organizations and terri-torial self-government units comprises mainly activities taken up on the highest level, namely owners and management of economic entities, representatives of self-government authorities, directors of units responsible for creation of tourist product, authorities of economic self-government organizations and tourist associations, regional authorities and local tourist organizations. There are possible the following model concepts of personnel relations on local and regional level:
model of tight cooperation, model of limited cooperation,
16 Gospodarka turystyczna, A. Panasiuk (ed.), Wydawnictwo Naukowe PWN, Warszawa
2008.

Personnel as a determinant of shaping innovativeness… 119
model of disintegration, model of competition, model of conflict and crisis.
The first from mentioned models – of tight cooperation is related to the agreement between cadres of particular companies and institutions and to the reali-zation of joint market policy. It consists in good human relations and integration around common goals. In that field, realization of innovative goals in tourism econ-omy is the easiest for cadres. In practice, that model can be applied in regional and local tourist organizations, where economic entities, self government entities and organizations are strongly represented and realized aims reflect interests of sur-rounding entities and inhabitants possibly widely. Moreover, their activity is not determined by political goals. Second model – of limited cooperation is partial version of the first one. Its existence results from the limited representation of entities involved in tourism economy development what causes that realized tasks don’t reflect all interests. This model is the most often applied in practice of operation of regional tourist organizations in Poland. Next model – of disintegration consists in the lack of agreement and forms of cooperation between representatives of tourism sector. Activities in the field of tourism economy development are taken up individually by representatives of par-ticular entities. That system can be observed in situation when institutional forms of cooperation haven’t been established in regions or when there is not enough entities in regional tourist organizations and there are any certain results of cooperation. Model of competition can be observed in two situations, namely in the condi-tions of:
operating and conducting effective activities by regional tourist organiza-tions,
limited scale of operation of regional tourist organizations or in the situa-tion when organization hasn’t been established yet.
In both situations, market entities: mainly entrepreneurs but also self-governments and tourist organizations, can take up competitive activities related to the chosen aspects of tourist product creation or to the all tasks, even competitive to the tasks of organization they are part of. Examples of those activities refer espe-cially to the competition between tourist entrepreneurs and they aim at market gain-ing, and in case of self-governments at gaining funds for development. Competing for obtaining the right to the realization of tasks and their financing can be an ex-ample here. Model of conflict and crisis could be:
deepen model of competition and then representatives of tourist entities concentrate on their own goals and limit a market position of other market participants,

Aleksander Panasiuk 120
an obvious action of representatives of companies, self-governments and organizations against representatives of another, it consists in fighting for a position in an environment and especially it refers to the trials of elimina-tion of activities directed at implementation of innovations in tourism economy (activities taken up by other companies).
It leads to the disintegration of activities directed at the tourism economy de-velopment until a crisis in operation of regional tourist organizations and at the end to the limitation of their functions, even to the possible break of their operation. Undoubtedly, the best effects can be achieved by means of model of tight operation. From the point of view of market effects, using the model of competition could also be beneficial and it could result in a wider offer with better prices. Model of conflict and crisis, noticed often in practice beside some of its positive effects, in the scale of the whole tourist area, leads to the adverse situation and may cause the damage of other entities’ effects and consequently may limit the effectiveness of regional tourism economy operation and limit pro-innovative activities. A basic problem in that field is linking or even identifying the tasks of regional tourist or-ganizations with the tasks of regional self-governments. Conclusion Presented considerations could be a basis for an attempt to description which model of personnel relations occurs in a regional tourism economy and how the particular model influence innovative processes. As it results from the considera-tions above, pro-innovative policy can develop in the circumstances of full coopera-tion between entities of regional tourism economy. A basis for activity is an innova-tive consciousness, thanks to which it is possible to form a competitiveness toward other tourism economies, especially neighboring. Knowledge and access to the finance as well as personnel should be ranked as a basic condition for implementa-tion of innovative activities on the regional tourism economy level. From the insti-tutional point of view, pro-innovative activities in regional tourism economy should be led by tourist companies on the micro level and by regional self-government and regional tourist organizations on the mezzo level. Parallel form to the operation of regional tourist organizations could also be tourist clusters.

Personnel as a determinant of shaping innovativeness… 121
KADRY JAKO DETERMINANTA KSZTAŁTOWANIA INNOWACYJNOŚCI REGIONALNEJ GOSPODARKI TURYSTYCZNEJ
Streszczenie Sektor turystyczny jest jednym z elementów struktury gospodarki narodowej, przenikającym się i wspomaganym w ramach swoich funkcji z innymi sektorami go-spodarczymi. Zasadnicza część procesów gospodarczych w sektorze turystycznym jest realizowana przez bezpośrednią gospodarkę turystyczną i reprezentujących ją przedsię-biorców turystycznych. Na poziomie lokalnym istotną rolę w kształtowaniu procesów gospodarczych w sektorze turystycznym odgrywają jednostki samorządu terytorialnego i organizacje turystyczne. W opracowaniu przedstawiono zagadnienia roli kadr w oddziaływaniu na innowa-cyjność regionalnej gospodarki turystycznej, wskazując na: podstawowe zagadnienia funkcjonowania gospodarki turystycznej, klasyfikację czynników produkcji w gospo-darce turystycznej (uwzględniając miejsce kadr oraz innowacyjności). W całokształcie działań podmiotów gospodarki turystycznej szczególną rolę należy przypisać kadrom, tj. potencjałowi ludzkiemu tych podmiotów. Za cel opracowania należy zatem uznać modelowe przedstawianie roli kadr w oddziaływaniu na innowacyjność regionalnej gospodarki turystycznej.
Tłumaczył Aleksander Panasiuk


ZESZYTY NAUKOWE UNIWERSYTETU SZCZECIŃSKIEGO NR 592 EKONOMICZNE PROBLEMY TURYSTYKI NR 14 2010
MARGARITA PLATACE Kolonna Hotels Group School of Business Administration Turiba
SERVICE VALUE IN HOSPITALITY INDUSTRY Introduction The study of value for customers has become a central theme in business and is interesting for both – researchers and managers and is regarded as the next source of competitive advantage. Customer value and service quality have also been of great interest to hospitality researchers1. The main responsibility of hoteliers is the delivery of quality service to customers. Therefore to be successful in the industry, hoteliers must provide superior customer value and this must be done continuously and efficiently. A value is essentially relevant to service2. To achieve good results, hotel managers need to have profound knowledge of customers’ needs, behaviour, and preferences and be aware of the ways in which the services delivered create value for the customers and then stimulate their retention and loyalty3. Hoteliers need to put more emphasizes on improving the quality of their services offerings and on ensuring that the needs and expectations of their guests are being met4. This
1 Y. Ekinci, P. Prokopaki, C. Cobanoglu, Service quality in Cretan accommodations: mar-
keting strategies for UK holiday market, “International Journal of Hospitality Management” 2003, No. 22, pp. 47–66.
2 B. Looy, Service Management. An integrated Approach, Pearson Education Limited, 2003.
3 V. Minghetti, Building customer value in the hospitality industry: towards the definition of a customer-centric information system, “Information Technology & Tourism” 2003, No. 6, pp. 141–152.
4 H. Nasution, F. Mavondo, Customer value in the hotel industry: What managers believe they deliver and what customer experience, “International Journal of Hospitality Management” 2008, No. 27, pp. 204–213.

Margarita Platace 124
especially is true because the hotel sector is highly competitive and is central to the success of the tourism industry According to Nasution and Mavondo5 service provi-sion can be viewed from two different perspectives: that of the service provider or that of the customer, gaps might arise between expectations and actual perform-ance6. This paper seeks to investigate different perceptions of value chain of ser-vices, the connection and co-creation between service deliverers and customers in hotel establishments. The context of this study can become an important component of the tourism industry in Latvia on the hotel sector. The main reason for choosing the hotel indus-try as the research context in that the hotel industry is an increasingly important sector of tourism industry in Latvia.
Table 1
Total number of lodging properties in Latvia and number of hotels
2004 2005 2006 2007 2008
Lodging total 22 171 24 045 24 489 25 696 29 591
Hotels 12164 13004 16439 17738 19961 Source: www.hotel.lv/?id=244&top=&sa=223&, 15.01.2010.
Table 2
Room nights spent in all lodging properties and hotels in Latvia
2004 2005 2006 2007 2008
Room nights total 901400 1 154 700 1 329 900 1 487 400 1 555 900
Hotels 726300 923700 1 034 800 1 171 300 1 204 600 Source: www.hotel.lv/?id=244&top=&sa=223&, 15.01.2010. The tables 1 and 2 show that in the period from 2004 until 2008 a number of hotels increased by 33%, but a number of nights spent in the hotels increased by 72%. The year 2009 will present different figures, a forecast shows that a growth of new hotels had almost stopped and a number of room nights spent in the hotels were decreasing significantly. Similar situation was with room prices in hotels, which declined for about 30% and so hotels informed about turnover increase for
5 Ibidem, pp. 204–213. 6 F. Saleh, C. Ryan, Analyzing service quality in the hospitality industry using the
SERQUAL model, “Service Industries Journal” 1991, No. 11, pp. 324–343.

Service value in hospitality industry 125
30-40%. A situation in hotel business is at the moment not satisfactory, but many hotel managers understand the situation and pay more attention to things that can bring additional value, increase the quality and strengthen customer loyalty. 2. The purpose of the research and methodology The purpose of the paper is to study scientific research about value chain for services and investigate an opinion of hotel managers in Latvia about it. A meth-odological framework is based on content analyses of theoretical articles in scien-tific magazines and professional journals. Substantial terms for customer value, service, and value chain have been investigated and explained. A survey for hotel managers – members of Association of Hotels and Restaurants in Latvia was con-ducted; the aim of the survey was to determine the most important components in the value chain regarded by hotel managers. 3. Conceptual background The concept of value has been applied in various fields such as economics, social science, accounting, finance, strategy, product management, information system, and marketing and in tourism research7. There are various definitions of value by different scholars. Holbrook8 defines customer value as “an interactive relativistic preference experience”; Zeithalm9 identifies four diverse meanings of value: value is a low price; value is whatever one wants in a product; value is the quality that the customer receives for the price paid; value is what the consumer gets for what they give. Flint et al.10 suggest that value can be classified as values, desired values, and value judgments. The notion of value judgment is the customer’s assessment of what has happened (benefits and sacrifices). This implies that value is a process of interpretation of what a customer feels concerning the product or service consumed, relative to the sacrifices (generally price or time).
7 J. Sanchez, L. Callarisa, R.M. Rodriguez, M.A. Moliner, Perceived value of the purchase
of a tourism product, “Tourism Management” 2005, No. 27, pp. 394–409. 8 H. Nasution, F. Mavondo, Customer value in the hotel industry: What managers believe
they deliver and what customer experience, “International Journal of Hospitality Management” 2008, No. 27, pp. 204–213.
9 Ibidem. 10 D.J. Flint, R.B. Woodruff, S.F. Gardial, Customer value change in industrial marketing
relationships: a call for new strategies and research, “Industrial Marketing Management” 1997, No. 26 (2), pp. 163–175.

Margarita Platace 126
Professor Elisante ole Gabriel marks out, that value is the customer’s percep-tion about whole bundle of benefits, being tangible or intangible, which satisfy the needs of the customer timely, effectively and efficiently11. Value needs to be co-created, though value is considered as a bundle of bene-fits, customer has incurred some costs to obtain the value12. These costs can be in form of money, efforts, time, opportunity, costs, etc. Therefore, for the customer to be satisfied or dissatisfied depends on the net value between the total customer value and total customer cost. According to Professor Elisante ole Gabriel13.
Customer delivered Value (net value) = CV (Customer Value) – CC (Customer Costs).
In other words Customer value = quality – price
Customer value is created when customer perceives that the benefit of consuming products/services exceeds the perspective, benefit is identified as quality, while sacrifice is represented as a price14.
Notions of trade-off = benefit – sacrifices Several scholars have tried to define the notion. Quinn and Gagon defined services by saying what they are not: “Services are actually all those economic activities in which the primary output is neither a product nor a construction”15. A service is a complicated phenomenon, which is normally perceived in a subjective manner. When customers describe a service, expressions such as ex-periences, trust, feelings, and security are used. More communication oriented is definition by Gronroos: “A service is an activity or series of more or less intangible nature that, normally, but not necessarily, take place in interactions between the customer and the service employee and/or physical resources or goods and/or sys-tems of the service provider which are provided as solutions to customer prob-lems”16. The above definitions state that services are activities or processes character-ized by two central notions: intangibility and simultaneity.
11 E. Gabriel, op.cit., pp. 59–64. 12 P. Kotler, Marketing Management: Analysis, Planning, Implementation and Control,
Englewood Clifs, Prentice-Hall, NJ 1997. 13 E. Gabriel, Choosing an Epistemic Stance, “The African Journal of Finance and Man-
agement” 2003, No. 11, pp. 59–64. 14 S.F. Slater, J.C. Narver, Intelligence generation and superior customer value, “Journal of
Academy of Marketing Science” 2000, No. 28, pp. 120–127. 15 J.B. Quinn, C.E. Cagnon, Will services follow manufacturing into decline? “Harvard
Business Review”, Nov–Dec 1986, pp. 95–103. 16 C. Gronroos, Service Management and Marketing: Managing the Moments of Truth in
Service Competition, John Wiley & Sons, 1990.

Service value in hospitality industry 127
Intangibility simply means that the result of a service transaction is not a transfer of ownership, as in the case of physical goods. A service is a process or an act. Simultaneity means that the realisation of a service implies the presence of provider as well as consumer; both play an active role in the realization of services. Production and consumption are intertwined and services come into being in the simultaneous interaction between consumer and provider. To summarize this all services can thus be defined as: all those economic ac-tivities that are intangible and imply an interaction to be realised between service provider and consumer. Service management is a total organizational approach that makes quality of service, as perceived by the customer, the number one driving force for the opera-tion of the business17. To ensure that the expectations of customer are met timely is a need of having a specific value chain for service, which will integrate all activi-ties/attributes, which are necessary for the qualitative delivery systems of service. Gabott and Hogg tried to find an answer – what are the characteristics of ser-vices – and they found out thirteen answers, which indicate that services manage-ment is very complicated and that there is a need to understand the customer with his/her specific needs before serving him/her. (Elisante ole Gabriel/M.Gabott and H.Hogg 1997)18. In service management interactive communication should not be a choice but a must. This will make the customers feel active participants of service creation and delivery system. (Elisante ole Gabriel, 2009)19. As stipulated in characteristics above, services are produced and consumed simultaneously. Therefore, there is a need for the value to be created both by ser-vice provider and service user. If there is no co-creation of value, there is great chance of mismatch in the delivery system20. This in any case will lead to dissatis-faction of customers, since they will be passive in the system. Every hotel manager has to ensure that co-creation becomes a joint job of everyone involved in the ser-vice delivery system. The service system will therefore consist of value co-creation and value co-delivery system. An important part of value co-creation system is value chain, which can be very different as it depends to whom a value will be delivered – to guests, to service providers, to employers. The term “Value Chain” was first used by Michael Porter21. He classified all activities generally as either primary (inbound logistics, operations, outbound logis-
17 M. Bruhn, Services Marketing: Managing the Service Value Chain, FT Prentice Hall,
2005. 18 http://www.docstoc.com, 15.01.2010. 19 Ibidem. 20 Ibidem. 21 M.E. Porter, Competitive Advantage: Creating and sustaining superior Performance,
The Free Press, New York 1985.

Margarita Platace 128
tics, marketing and sales, service) or support activities (procurement, human re-source management, technological development, and infrastructure). For a long time this model has been used as the generic one, but as it was mentioned before, the business world has now changed and has become more so-phisticated. In the service industry we do not have the real operations of inbound or outbound logistics, the operations cannot take place in isolation from the customer, production and usages of the service occur simultaneously. Professor Elisante ole Gabriel22 indicates that the infrastructure required in the service industry might be different from that of the manufacturing industry and comes forward with his offer of value chain for services (VACSE) and points out five primary attributes and four supporting attributes. The shape of the VACSE is the same as that one by Porter but the most impor-tant things are the components of the new model. Primary Attributes of VACSE – Service Design, Knowledge Management, Delivery Systems Management, Moment of Truth management, Service Competition Management. Supporting Attributes – People (Human Resource Management), Physical Aspects, Process Information, Punctuality & Reliability. According to Elisante ole Gabriel certain components (refer to Table 3), need to be integrated in the service industry when it is necessary to create value – Investors, Product Designers, Service Providers, Supporting Systems, Target Markets and Environment.
Table 3
Value Co-creation Model for Services SERVICE SECTOR
INVESTORS SERVICE
DESIGNERS
SERVICE
PROVIDERS
SUPPORTING
SYSTEMS
TARGET
MARKETS
CO-
CREATED
VALUE
ENVIROMENT (Micro&Macro)
Source: www.docstoc.com. It is therefore clear that Porter’s value chain cannot do the whole thing in the value system of the service sector. However it has built a good foundation to this new dimension. Value co-creation and co-delivery will always lead to mutual satis-
22 www.docstoc.com, 15.01.2010.

Service value in hospitality industry 129
faction. This means both service providers (marketers) and service users (custom-ers) will be satisfied. The unique characteristics of service made it necessary to propound a new dimension of value chain. These characteristics include as it was mentioned before – intangibility, inseparability, heterogeneity, perishability. 4. Characteristics of Surveyed Enterprises and Findings To find out, if this theoretical research could be improved in practical life, a survey was prepared and presented to Hotel managers during the annual meeting of members of Association of Hotels and Restaurants of Latvia. In Latvia there are very few studies about service value or customer value or value management in hospitality industry. After a brief presentation of this topic most hotel managers were ready to participate. 50 hotel managers responded to the survey. The distribution was as follows: 30 questionnaires were from Riga – capital, 10 questionnaires were from other ci-ties of Latvia, and 10 were from country side. According to the level of service – 3 questionnaires were from five star hotel managers, 8 from four star hotel managers, 25 – from three star hotel managers, 4 – from two star hotel managers and 10 – from guest house managers. The largest group – 30 entities comprised small size hotels (10-50 rooms), 5 hotels were big according to Latvia standards and had 100-550 rooms, and 15 were medium size hotels with 50-100 rooms. 3 hotels had man-agement contracts with known international chains, while 10 other were in Baltic or local chains. 30 hotels had less than 50 employees. The finfings are shown in table 4. The respondents were grouped into five groups according to service level of the hotel. Hotel managers were asked to name components, which could be impor-tant for a hotel business and could form a value chain. Each component had to be evaluated with five points. About 40 different factors were analyzed in detail; ac-cording to frequency twelve were selected and ordered. The differences persist across different classes of hotels, especially when valuating reputation, not so valu-able by two star hotels; training courses for employees, not so valuable by two star hotels and guest houses, support systems – the same as before. Five components are evaluated with a higher mark – guest service, guests, employees, variable offers, value for money, reputation. Many hotel managers mentioned communication and cooperation as very valuable components. This correspondent with a Value Co-creation Model for Services given in the theoretical part and testifies, that further investigations are required and important, especially examination of value from two perspectives, i.e. that of the service provider and that of the customer.

Margarita Platace 130
Table 4
Components of the value chain in hotel business (n=50)
VALUE CHAIN FOR HOTELS (1-5)
5*
(3)
4*
(8)
3*
(25)
2*;
hostels (4)
Guest
house (10)
Reputation 5 5 4 3 4 4,2
Owners 4 4 3 3 5 3,8
Investors 4 4 1 0 0 1,8
Managers 5 5 4 2 4 4
Employees 5 5 4 3 5 4,4
Training courses 5 4 3 2 2 3,2
IT, support systems 5 5 4 2 2 3,6
Guests (customers) 5 5 4 3 5 4,4
Environment 4 5 4 2 4 3,8
Value for money 4 4 4 4 5 4,2
Guest service 5 5 5 4 5 4,8
Variable offers 5 5 4 3 4 4,2 Source: own elaboration. Conclusions The unique characteristics of service, which include – intangibility, insepara-bility, heterogeneity, perishability, made it necessary to propound a new dimension of value chain. The value chain required in the service industry is different from that of the manufacturing industry and is built up on value co-creation system. The research conducted does not give a complete picture about the situation on the hotel market in Latvia, but it gives an overview, what the main values for hotel managers in Latvia are. As it was mentioned before there are very few inves-tigations about customer value and services value, further work should be done and the information gained will be used during the next stage of the research, which is to develop a model for maximizing a service value in hospitality industry.

Service value in hospitality industry 131
WARTOŚĆ DLA KLIENTA W SEKTORZE HOTELARSKIM
Streszczenie Dostarczenie klientowi produktu o odpowiednim współczynniku „cena – jakość” jest kluczem do sukcesu w wielu sektorach gospodarki. Również menedżerowie przed-siębiorstw hotelarskich powinni w swoich działaniach uwzględniać elementy łańcucha wartości. W artykule przedstawiono przykłady polityki jakości w przedsiębiorstwach hotelarskich zrzeszonych w Łotewskim Związku Hotelarzy i Restauratorów.
Tłumaczył Adam Pawlicz

ZESZYTY NAUKOWE UNIWERSYTETU SZCZECIŃSKIEGO NR 592 EKONOMICZNE PROBLEMY TURYSTYKI NR 14 2010
MAIJA ROZITE, JURIS OZOLS, DAINA VINKLERE School of Business Administration Turiba, Latvia
QUALITY ASPECTS AND ASSESSMENT OF RURAL TOURISM ENTERPRISES OF LATVIA
Introduction At the time of economic crisis quality of services can become a crucial factor for enterprise’s survival in its competition with other destinations or other busi-nesses. Quality in tourism is also important because its service is not tangible or verifiable at the moment of its purchase. It is one of the reasons why World Tour-ism Organisation (UN WTO) has paid particular attention to this issue by develop-ing a work programme “Quality in Tourism: a Conceptual Framework Document” and by creating its Quality Support Committee1 In the European context Eu-roGites2, Association of European Country Tourism Federations has defined coun-try tourism as one of its priorities for developing common quality standards. Its member in Latvia is a professional rural tourism association “Countryside Travel-ler” and the organisation has adopted a targeted approach in implementing these standards in the country 3. In order to assess the existing level of understanding about the issues of qual-ity and its various evaluation aspects, a survey of guest houses was conducted. This survey is particularly topical since the School of Business Administration Turiba
1 Quality in Tourism: A Conceptual Framework UNWTO, 2003,
http://www.unwto.org/quality/std/en/std_01.php?op=1&subop=1. 2 Qualitool project EuroGites, 2008, http://www.eurogites.org/new.php?lang=EN&id=-
56&show=EN. 3 Project “Transfer of Quality Ensurance Tools for European Rural Tourism Sector”: a
professional rural tourism association “Countryside Traveller”, http://www.celotajs.lv/cont/prof-/proj/Leonardo2008/Leonardo2008.html.
Maija Rozite, Juris Ozols, Daina Vinklere 134
(SBAT) in cooperation with 5 foreign partners and “Countryside Traveller” has obtained support for its Leonardo da Vinci project AURORA II. This project envis-ages development of instructional material for existing and potential country tour-ism entrepreneurs aiming at raising of their competitiveness and overall quality of services in this particular sector. 1. Materials and methods According to “Countryside Traveller” classification, guest houses are recrea-tional objects in the countryside, at villages or in towns for a larger number of guests consisting of at least five rooms for accommodation, a bathhouse, rooms for public events, seminars as well as opportunities for recreation. The paper has sur-veyed 32 enterprises evaluated by industry experts. Out of this number 13 enter-prises were assessed by “mystery guests”, while 12 guest houses were assessed on the basis of client surveys. Geographical distribution of guest houses was selected proportionally to their location. Selection took place on the basis of random selec-tion methodology. Methodology of evaluation was based on theoretical understanding of service process and various aspects of its quality and it was conducted by assessing quality at three stages: assessment of actions and processes before providing of services, at the time when they were provided and after the service transaction had already taken place4. At the first stage of assessment homepages of a place of accommodation to-gether with publicly available information on the internet, e-mail replies and tele-phone communication were surveyed. Services offered and provided by guest houses were assessed from the point of view of service providers (entrepreneurs, employees), experts (3rd year School of Business administration Turiba students who has acquired study course “Rural Tourism”) and clients (clients encountered and enterprises and the “mystery guest”). When conducting the survey experts con-centrated on the aspects of accessibility of a destination, opportunities for effective booking, visual appearance of the place of accommodation, reception, layout of premises and cleanliness, catering facilities, skills and attitude of personnel and environmental friendliness. Due to the fact that repeated visits of clients and the overall number of regular clients are strong indicators of service quality, the survey also concentrated on post-service activities: interest in learning client opinions, production of client databases, special offers and rebates.
4 Turisma uznemumiem pieskirs kvalitates zimi, „Turisms” 2008, No. 2&3, p. 9.
Quality aspects and assessment… 135
The authors admit that results obtained can vary if some destinations were surveyed at peek periods of a holiday season when service quality may objectively decrease. Results obtained at the first stage of the survey were analysed with a help of statistical data processing methods. Due to the fact that the survey is still ongoing, further data processing will contain establishing of correlation between various assessments, calculating weighted averages and assessing compliance of data to regular breakdown curves. 2. Results 2.1. Assessment of service quality prior to its receiving Only experts were involved at this stage of the survey process. It was com-menced by evaluating information on an enterprise which could be obtained in the internet sources. 19% of all enterprises surveyed did not have their own homepages. Information on them could be found at regional or city homepages (37% of all cases), internet reference portals (29%) and specialized portals (24%). Homepages of 23 tourism enterprises were rated as visually appealing. Two thirds of homepages analysed contained information in three or more languages, while 5 homepages contained information only in the Latvian language. 7 enterprises (17% of all sur-veyed) offered direct booking opportunities. Almost all pages contained photo gal-leries, but only half of them had uploaded information (or references to other sources of information) on the surrounding and sites of interest. Despite the latest tendencies of consumer behaviour testifying an increased trust in opinions of other tourists5, only 9 guest houses offered a possibility of posting and viewing client comments on their web pages. Swiftness and quality of service were assessed by sending an e-mail asking for information on availability of vacant rooms, prices, additional services and booking opportunities. 83% of enterprises replied to these requests. 10% replied within 20 minutes, 37%: at the second half of the day while 53%: within 24 hours. Majority of enterprises were capable of providing the information requested, while contents of 10% of replies was assessed as insufficient. Skills and competences of employees were also tested with a help of phone calls requesting similar information on the phone. In 70% of cases guest houses could be reached at the first attempt and re-plies followed already after the first or the second tone. Almost all employees ex-pressed interest in providing not only the information requested (72%), but also by
5 Handbook on E-marketing for Tourism Destinations, World Tourism Organization and
European Travel Commission, 2008, pp. 4–5.

Maija Rozite, Juris Ozols, Daina Vinklere 136
offered additional services (28%). Only on two occasions callers were asked to forward their questions by e-mail. 2.2. Assessment of quality at the time pf providing service Questionnaire of guest houses and quality of service were assessed by experts and entrepreneurs themselves according to uniform criteria. 40% of enterprises included in the survey were also assessed by a “mystery guest” or client. When analysis assessment provided by such a diverse group of people one could observe the high degree of similarities among them with the average value of 3,2 (on a five grade scale). Points of view of experts were slightly different, since this group was more critical in its approach compared to other surveyors. On average expert as-sessment were 2,9. Entrepreneurs themselves provided the highest evaluation of all quality aspects: 3,7 points. Guest rooms were assessed according to 16 quality criteria, including their layout and furnishing and equipment as well as opportunities of making use of addi-tional services. These quality criteria can be divided in two groups by singling out the classic quality aspects formed by rooms, their equipment and cleanliness. The second group of quality aspects is related to such criteria as access to phone and internet services, availability of information materials, opportunities to use other additional services. Quality of basic services has generally been assessed more posi-tively. See Figure 1.
0
1
2
3
4
5
Cleaness Facilities Room
Assessment
Client
Mystery guest
Expert
Employee
Figure 1. Quality assessment of basic services provided by country guest houses accord-ing to groups of surveyors
Source: own elaboration.

Quality aspects and assessment… 137
While assessing country guest houses, students – experts provided the highest grades to booking opportunities, employee courtesy and competence (according to the following grading: “very poor”, “poor”, “good”, “very good”, and “excellent”). In 80% of cases these aspects were assessed as “excellent” and “very good”. Visual appearance of staff members and their courtesy were assessed as “very good” while knowledge of languages in some cases received also negative assessment (6% and 9% of cases). The second highest rating was granted to cleanliness and order in sanitation areas. Among these quality criteria situation in ventilation areas and availability of accessories (soap, shampoo, towels) were rated lower than other aspects. Overall, room preparation for receiving guests had acquired positive assess-ment (“excellent” and “very good”) paying attention to room cleanliness, installa-tion of category-conformable equipment and lighting. Flooring of rooms, ventila-tion possibilities and availability of information were mostly assessed as “good”. In some country guest houses certain services were only partially available in rooms, e.g. internet access or ability to choose smoking or smoke free rooms or room ser-vice. This is why these aspects were rated lower (See Figure 2).
0
1
2
3
4
5
Assessment
Client
Mystery guest
Expert
Employee
Figure 2. Expert assessment of additional services and their quality
Source: own elaboration.
In guest houses offering catering services the highest ratings were obtained by such quality criteria as appearance and ambiance of dining areas (in 70% of cases rated as being “very good” and “excellent”), consultation on the choice of meals and level of service. Variety and quality of food and drinks, adequacy of price vs.

Maija Rozite, Juris Ozols, Daina Vinklere 138
offer, dishes and cutlery, food decoration (67% of cases) was mostly assessed as “good” and “very good”. The lowest ratings (41% of “poor” and “very poor”) were received in respect to compatibility between price and offer, availability daily or weekly specials and vegetarian meal offers. The largest part of guest houses surveyed were located in attractive surround-ings, and their appearance, entrance and accessibility were mostly rated as “very good” and “excellent”. Nevertheless, 9 guest houses (constituting 31% of the total number) did not offer signposts in the vicinity, while 7 (22%) did not have a clearly visible or comprehensible names. Guest rooms and environmental friendliness received a larger deal of criti-cism. When evaluating this aspect of quality, presence or absence of the “Green Certificate” was taken into account. Also aspects like natural lighting, appeal to clients to save resources and reduce pollution or use of energy saving technologies were all taken into account. For one third of guest houses surveyed this criterion was assessed as “very poor”. Self-assessment has been allotted an important role in quality assessment, including the “Q-Latvia”6, system. Entrepreneurs assessed their guest houses simi-larly to experts, providing higher degree of grades to such criteria as guest recep-tion, courtesy of employees and their overall proficiency. However, one must note that their evaluation was slightly more positive and grades like “very poor” or “poor” were almost never applied. Comparing client assessment to the ones pro-vided by entrepreneurs, one can conclude that clients had been more demanding in respect to quality of service provided. For instance, 12% of client assessment con-tained “very poor” grades while entrepreneurs provided similar grades only in two instances. See Figure 3. Reality proves that, when quality systems are applied, entrepreneurs and em-ployees themselves become increasingly demanding towards themselves and their own assessment can be more critical in comparison to an external observer. Provid-ers of country tourism surveyed, were more critical when assessing visual appear-ance of accommodations, areas of common use and sanitation areas in guest rooms. Part of the guest houses surveyed was assessed by their clients who had just used the respective services and a “mystery guest” who used the facilities and ser-vices with a clear knowledge of criteria for assessment. Clients were generally more positive regarding visual appearance of accommodations, sanitation areas and em-ployees although assessment of all criteria was slightly lower than the ones pro-vided by surveyors and entrepreneurs. The lowest grades were received for room layout and opportunities for obtaining extra services. For instance, in 67% of cases
6 I. Sirava, Turisma pakalpojumu kvalitates sistemas “Q-Latvia” apraksts, “Turisms”
2008, No. 4-6, pp. 14–15.
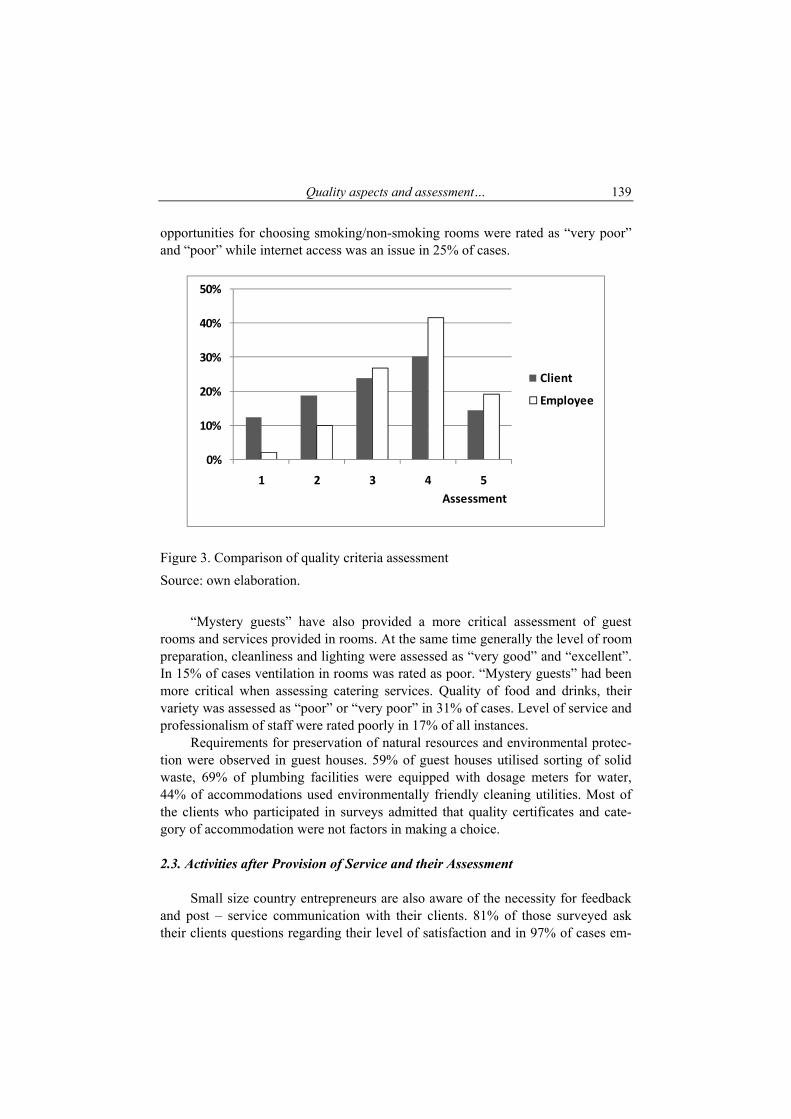
Quality aspects and assessment… 139
opportunities for choosing smoking/non-smoking rooms were rated as “very poor” and “poor” while internet access was an issue in 25% of cases.
0%
10%
20%
30%
40%
50%
1 2 3 4 5
Assessment
Client
Employee
Figure 3. Comparison of quality criteria assessment
Source: own elaboration.
“Mystery guests” have also provided a more critical assessment of guest rooms and services provided in rooms. At the same time generally the level of room preparation, cleanliness and lighting were assessed as “very good” and “excellent”. In 15% of cases ventilation in rooms was rated as poor. “Mystery guests” had been more critical when assessing catering services. Quality of food and drinks, their variety was assessed as “poor” or “very poor” in 31% of cases. Level of service and professionalism of staff were rated poorly in 17% of all instances. Requirements for preservation of natural resources and environmental protec-tion were observed in guest houses. 59% of guest houses utilised sorting of solid waste, 69% of plumbing facilities were equipped with dosage meters for water, 44% of accommodations used environmentally friendly cleaning utilities. Most of the clients who participated in surveys admitted that quality certificates and cate-gory of accommodation were not factors in making a choice. 2.3. Activities after Provision of Service and their Assessment Small size country entrepreneurs are also aware of the necessity for feedback and post – service communication with their clients. 81% of those surveyed ask their clients questions regarding their level of satisfaction and in 97% of cases em-

Maija Rozite, Juris Ozols, Daina Vinklere 140
ployees as their customers to write a comment in their visiting books. 69% of enter-prises produce their client databases while half of all enterprises inform their clients about their special offers and provide rebates. One fourth of all enterprises have formed their own loyalty programmes. Conclusions 1. Results of the first stage of the survey show that country tourism guest houses
of Latvia provide high quality service, which are in sync with client needs. 77% of “mystery guests” and 58% of clients have admitted that services re-ceived at their places of accommodation corresponded to their expectations, while 92% of clients and all “mystery guests” pointed out that they would rec-ommend their respective guest houses to their friends and would like to make a return trip in future.
2. This survey proves that presently (at the time of limited access to financial resources) open visits of experts can be used for the purposes of quality as-sessment since their evaluation is objective and similar (or even slightly more critical) to assessments provided by “mystery guests”.
3. It is necessary to educate entrepreneurs in order to ensure that they remain independent, objective and capable of evaluating critically quality aspects of the businesses and adapt to the changing needs of clients.
OCENA JAKOŚCI USŁUG AGROTURYSTYCZNYCH NA ŁOTWIE
Streszczenie Celem artykułu jest wypracowanie i ocena mierników jakości w łotewskich go-spodarstwach agroturystycznych. W artykule dokonano oceny jakości 32 przedsię-biorstw na podstawie badań ekspertów, gości (turystów), tajemniczego klienta oraz ocen samych przedsiębiorców. W wyniku badań stwierdzono, że gospodarstwa agrotu-rystyczne oferują usługi o poziomie jakości spełniającym oczekiwania klientów. Z przeprowadzonych badań wynika również, iż badani przedsiębiorcy mieli ograniczo-ny dostęp do szkoleń oraz funduszy na rozwój działalności.
Tłumaczył Adam Pawlicz

ZESZYTY NAUKOWE UNIWERSYTETU SZCZECIŃSKIEGO NR 592 EKONOMICZNE PROBLEMY TURYSTYKI NR 14 2010
JOANNA JULIA SIENKIEWICZ Zachodniopomorski Uniwersytet Technologiczny w Szczecinie
POTENCJAŁ TURYSTYCZNY JAKO OBSZAR BADAWCZY NAUK EKONOMICZNYCH
Wprowadzenie Fenomen turystyki jako zjawiska wielopłaszczyznowego sprowadza się nie tylko do trudności i sporów interpretacyjnych nad problemem stworzenia jednolitej, w miarę spójnej i wyczerpującej definicji turystyki1, ale także do konstatacji, że ustalenia wielu dyscyplin naukowych zajmujących się tą sferą rzeczywistości spo-łeczno-gospodarczej doprowadzają do ogromnego zróżnicowania terminów, pojęć, jak też zastosowanych metod badawczych, które owocują nierzadko rozbieżnymi ustaleniami, a w konsekwencji rozmaitymi wnioskami natury ogólnej. Ponadto turystyka jest zjawiskiem dynamicznym, zmiennym w czasie i przestrzeni, co znaj-duje swój wyraz w zmieniającym się stopniu oddziaływania poszczególnych nauk na nastawienie badawcze poszczególnych uczonych, zespołów badawczych lub szkół, a także stosunku instytucji, organów administracji, państwa (w rozumieniu oddziaływania otoczenia zewnętrznego turystyki). Za W.W. Gaworeckim przyjmiemy, że interesujący nas potencjał turystyczny jest syntezą trzech podstawowych grup czynników, tj.:
atrakcyjnych walorów turystycznych, przyrodniczych i kulturowych, bazy obiektów turystycznych i wczasowo-wypoczynkowych, usług i infra-
struktury ogólnej, istnienia zróżnicowanych rynków turystycznych2.
1 Opinię o niemożliwości stworzenia jednolitej definicji turystyki powtarzamy za K. Prze-
cławskim, Człowiek a turystyka. Zarys socjologii turystyki, Albis, Kraków 1996, s. 27 i nast. 2 W.W. Gaworecki, Turystyka, Polskie Wydawnictwo Ekonomiczne, Warszawa 2007,
s. 129.

Joanna Julia Sienkiewicz 142
Interesujące dla ekonomisty było i jest to, na ile teoretyczne pojęcie „potencja-łu” jest mierzalne i czy potencjał turystyczny można „wycenić”. Innymi słowy, stajemy wobec dylematu, co w takim rozumieniu „potencjału turystycznego” jest obiektywne, które elementy uznać za subiektywne i jaka jest gradacja oraz oddzia-ływanie wzajemne czynników (a także ich ilość) wpływających na potencjał tury-styczny, do czego wrócimy w dalszej części pracy. Jak wspomniano powyżej, turystyką zajmują się liczne dyscypliny naukowe, z rozmaitą projekcją pojęć i kategorii turystyki, zaś analiza przeogromnej literatury nierzadko nastręcza trudności w uchwyceniu zasadniczych wątków dyskusji, nie-mniej jednak można zaryzykować stwierdzenia, iż: 1. Dla geografii turystyki centralnym zagadnieniem jest pojęcie, wymiar i cechy
„przestrzeni turystycznej, w ramach której potencjał turystyczny jest – obok atrakcji turystycznych i infrastruktury – zasadniczym elementem składowym (rozumianym jednak wężej niż w ujęciu badaczy ekonomiki turystyki). Na niż-szym stopniu ogólności pozostają cechy przestrzeni turystycznej (siedem cech)3, z których na uwagę zasługuje cecha głosząca, że przestrzeń turystyczna jest wykorzystywana sezonowo i podlega ekonomicznym cyklom koniunktu-ralnym – jest zastanawiające, że ten czynnik uwypuklają geografowie, nato-miast znikł on z pola widzenia ekonomistów (specjalistów z ekonomiki tury-styki), w sytuacji gdy teoria cykli koniunkturalnych ma w naukach ekono-micznych niezaprzeczalne miejsce i dorobek, stąd próby przeorientowania spojrzenia na szereg kategorii ekonomicznych w sytuacji kryzysu 2008–2009.
2. W naukach ekonomicznych jednym z najważniejszych problemów badaw-czych współczesności stała się kategoria konkurencji (konkurencyjności) – w rozmaitych przekrojach i na różnych poziomach (od skali globalnej, przez konkurencję państw, do poziomu przedsiębiorstwa), czego dowodem jest praca zespołu toruńskiego M.J. Stankiewicza z jego 4-elementowym modelem kon-kurencyjności przedsiębiorstw4. Istotą analizy konkurencyjności stało się opra-cowanie wieloczynnikowej metodyki nadawczej, a w dalszej kolejności zajęto się ustalaniem kluczowych czynników wpływu na konkurencyjność przedsię-biorstwa. Nie popełnimy błędu, gdy per analogiam potrzebę wieloczynnikowej analizy przeniesiemy na sferę potencjału turystycznego i jego struktury – również pod-dawanego zjawiskom konkurencyjności – tak aby wychodząc od wieloczynni-kowego modelu, poznać kluczowe czynniki determinujące w danym momencie
3 Przy referowaniu wyżej wymienionej problematyki posłużono się ciekawą pracą
B. Włodarczyka, Przestrzeń turystyczna - pojęcie, wymiary, cechy, „Turyzm” 2007, nr 1-2 (17), s. 145–158 z bogatą literaturą przedmiotu.
4 Por. Budowanie potencjału konkurencyjności przedsiębiorstwa. Stan i kierunki rozwoju potencjału konkurencyjności polskich przedsiębiorstw w kontekście dostosowywania gospodarki do wymogów Unii Europejskiej, red. M.J. Stankiewicz, TNOiK Dom Organizatora, Toruń 1999.
Potencjał turystyczny jako obszar badawczy nauk ekonomicznych 143
czasowym poziom konkurencyjności potencjału turystycznego kraju, regionu, miasta itd., ale też sektora, np. turystyki zdrowotnej, zdając sobie sprawę z re-latywnego znaczenia „konkurencyjności”. Dodajmy, że takie próby w Polsce powstały, do czego wrócimy.
3. Jest interesujące, iż w 2010 roku mija 30 lat od momentu opublikowania przez Michaela E. Portera pierwszej pracy stanowiącej podwaliny problematyki kon-kurencyjności5, 15 lat od chwili, gdy T.C. Middleton formułuje 5-składnikowy model ogólnego produktu turystycznego6 oraz 10 lat od momentu, w którym J.R. Ritchie i G.I. Crouch wprowadzają do badań nad turystyką pojęcie konku-rencyjności destynacji7. W efekcie w okresie ostatnich 30 lat punkt ciężkości analiz przesunął się na poszukiwanie i udokumentowanie wpływu subiektyw-nych czynników (po stronie popytu i podaży turystycznej) na takie kategorie, jak produkt turystyczny czy konkurencyjność destynacji.
4. W sytuacji oddziaływania wielu nauk na kategorię potencjału turystycznego rodzi się potrzeba interdyscyplinarnego spojrzenia na to pojęcie – co wydaje się problemem niezwykle skomplikowanym, wymagającym przyjęcia wielu kompromisów w sprawach definicji, metodologii i wnioskowania. Jednakże jest to zagadnienie wykraczające poza problematykę niniejszego artykułu, stąd koncentracja na wybranych problemach usytuowania potencjału turystycznego pomiędzy triadą: nauki ekonomiczne, nauka(i) o zarządzaniu i marketing.
1. Potencjał turystyczny i jego elementy między ekonomią (ekonomiką tury-styki), marketingiem i naukami o zarządzaniu – w poszukiwaniu metody ba-dawczej, doświadczenia i refleksje Analiza współczesnej literatury z dziedziny zarządzania wskazuje, że przy-znanie marketingowi znaczącej roli w oddziaływaniu na przestrzeń zarządzania może być utożsamiane ze zlaniem się przestrzeni marketingu z przestrzenią zarzą-dzania, a na szczeblu przedsiębiorstwa – z filozofią zarządzania. Celem zarządzania stały się już cele marketingowe, czyli:
utrzymywanie lub poszerzanie udziału w rynku, kreowanie rzeczywistych wartości dla klientów,
5 M.E. Porter, Competitive Strategy, Techniques for Analyzing Industries and Competitors,
The Free Press, New York 1980. 6 T.C. Middleton, Managing the Marketing Mix, w: Tourism Marketing and Management
Handbook, red. S.F. Witt, L. Moutinho, Prentice Hall, London–New York–Toronto–Sydney–Tokyo–Singapore–Madrid–Mexico City–Munich1995.
7 J.R. Ritchie, G.I. Crouch, The competitive destination: A sustainability perspective, “Tourism Management” 2000, No. 21 (1).

Joanna Julia Sienkiewicz 144
liczne próby modyfikacji produktów8. Często przyjmuje się, że marketing należy uznać za wyspecjalizowaną dzie-dzinę zarządzania, obok np. zarządzania strategicznego9. Jednak wielu znawców zarządzania twierdzi, że stopniowe przenikanie marketingu w poprzek przedsiębior-stwa pozwoliło M.E. Porterowi wykreować łańcuch wartości dla firmy. W konse-kwencji oznaczało to wywieranie przez marketing coraz większego wpływu na decyzje strategiczne przedsiębiorstwa (firmy), co w dalszej kolejności spowodowa-ło przesunięcie marketingowej koncepcji zarządzania marką (strategicznymi jed-nostkami biznesu) na poziom strategii firmy (top managementu). Widocznym skutkiem marketingu strategicznego na poziomie domeny jest – według P. Kotlera – ogólne pozycjonowanie produktu (marki) w branży, czyli ten czynnik, który M.E. Porter nazwał ogólnymi strategiami w skali sektora – przy-wództwo kosztowe, strategia zróżnicowania (dyferencjacji) oraz nisza rynkowa. Niezależnie więc od szczegółowych poglądów przedstawicieli nauk o zarządzaniu, to, co definiuje się jako business strategy, w rzeczywistości stało się strategią mar-ketingową. Kolejnym widocznym znakiem wpływu marketingu na postawy badaczy za-gadnień turystyki stało się stopniowe podmienianie pojęć i terminów – zamiast potencjałowi turystycznemu coraz większą wagę przypisuje się takim pojęciom, jak: atrakcje turystyczne, czy marketingowym koncepcjom produktu turystycznego obszaru oraz marketingu terytorialnego tożsamego z marketingiem strategicznym. Można więc mówić o asymilacji poglądów zarówno Regisa McKenny, który wprost stwierdził, że wszystko jest marketingiem, a marketing jest wszystkim10, jak też stanowiska przedstawicieli marketingu głoszących, że produktem jest wszystko to, co stanowi przedmiot transakcji, a więc wszystko, co oferowane jest na rynku jako godne uwagi, nabycia lub konsumpcji dla zaspokojenia potrzeb i wymagań konsu-menta11. Nie dziwi więc podejście S.A. Bąka, który w pakiecie produktu turystycz-nego widzi trzy składniki:
8 Szczegółowo problematykę styku marketingu z zarządzaniem przedsiębiorstwem opisał
już pod koniec XX wieku M. Grzesiowski w: Strategie marketingowe, w: Strategie marketingo-we, red. R. Krupski, Leopoldinum, Wrocław 1998. oraz M. Grzesiowski, Strategie marketingowe, w: Zarządzanie strategiczne. Koncepcje. Metody, red. R. Krupski, Wydawnictwo AE, Wrocław 1998, s. 201–244.
9 Trzeba pamiętać, że w zarządzaniu w rozumieniu marketingowym od wielu lat pojawia się definicja M. Prymona, który stwierdza, iż „zarządzanie marketingowe jest normatywną nauką obejmującą skuteczne kreowanie i oferowanie wartości w celu stymulowania pożądanych trans-akcji. W szczególności zarządzanie marketingowe jest uporządkowanym przeglądem zagadnień osiągania specyficznych reakcji rynkowych innych podmiotów, poprzez kreowanie i oferowanie wartości”, por. M. Prymon, Strategia marketingowa, Wydawnictwo AE, Wrocław 1991, s. 15.
10 Por. R. McKenna, Marketing is Everything, “Harvard Business Review” 1991, nr 69. 11 Ph. Kotler, J. Bowen, J. Makens, Marketing for hospitality and tourism, Prentice Hall,
Upper Sadle River 1999, s. 14.

Potencjał turystyczny jako obszar badawczy nauk ekonomicznych 145
atrakcyjność walorów miejsca docelowego podróży włącznie z wyobraże-niem o nich potencjalnego turysty (image),
usługi i urządzenia umożliwiające i uprzyjemniające przebywanie w miej-scu czasowego pobytu (facilities), zakwaterowanie, wyżywienie, rozrywka i rekreacja,
dostępność miejsca docelowego podróży (accessibility)12, czyli podstawo-we elementy potencjału turystycznego.
Jeszcze odważniej ujął problem T. Studzienicki, zdaniem którego zasadniczy produkt turystyczny to przekształcony w wyniku transformacji potencjał turystycz-ny13. Jak już wspomniano we wstępie, kluczowym momentem dopingującym bada-czy do opracowania nowych metod badania w turystyce stały się – za J. Ritchiem i G. Crouchem – koncepcje „destynacji turystycznej” i „konkurencyjności destyna-cji turystycznej”. Destynacja turystyczna jest postrzegana i definiowana najczęściej jako miejsce docelowe podróży turysty (czyli państwo, region, miejscowość lub wycinek terenu), z tego względu destynacje jako swoiste „produkty” są uczestni-kami gry rynkowej w przyciągnięciu coraz większej liczby turystów (kuracjuszy) na dany obszar. Konkurencyjność destynacji uzewnętrznia się w trzech podstawo-wych wymiarach:
1. Jako konkurencyjność produktowa – produkt (towar, usługa) podlega oce-nie na podstawie jego cech jakościowo-ilościowych (cena, relacje między użytecznością, jakością i ceną). Ogólnie produkt (państwo, region, uzdro-wisko) jest tym bardziej konkurencyjny, im więcej turystów go wybiera.
2. Jako konkurencyjność producentów – producenci dóbr i usług (np. usługi uzdrowiskowe) tego samego rodzaju lub zbliżonych do siebie konkurują między sobą, stąd producent jest tym bardziej konkurencyjny, im większe osiąga korzyści ze swojej działalności.
3. Konkurencyjność (konkurencja) warunków i walorów naturalno-przyrodniczych. Atrakcyjność warunków przyrodniczych stawia w lepszej sytuacji jednych producentów, inni są w sytuacji gorszej. Czynnikiem ła-godzącym wspomniane kontrasty może stać się dostępność do elementów dziedzictwa kulturowego (narodowego). Jest oczywiste, że dla kurortów (uzdrowisk) takie walory, jak klimat, położenie, wody mineralne z ich leczniczymi właściwościami są nie do przecenienia.
Ukoronowaniem teoretycznym koncepcji konkurencyjności destynacji tury-stycznej stały się modele Kima oraz J. Ritchiego i G. Croucha14, znane i wielowąt-
12 S.A. Bąk, Promocja produktu turystycznego w obrocie z krajami o gospodarce rynkowej,
Monografie – Ruch Turystyczny, z. 26, SGPIS, Warszawa 1990, s. 27. 13 T. Studzieniecki, Markowy produkt turystyczny basenu Morza Bałtyckiego, w: Tworzenie
regionalnego produktu turystycznego gminy, red. M. Boruszczak, AWF w Gdańsku, Stegna, Gdańsk 1998, s. 96–97.

Joanna Julia Sienkiewicz 146
kowo opisane w literaturze przedmiotu, które zostaną omówione jako studium przypadku nr 1. 2. Studium przypadku nr 1 1. Przedmiot badań – analiza produktu turystycznego Polski oraz siedmiu euro-
pejskich krajów odniesienia (Francja, Niemcy, Hiszpania, Irlandia, Czechy, Węgry, Słowacja) przy zastosowaniu metody benchmarkingu (uzupełnionej o metodę punktową) – porównanie jakościowe i ilościowe wybranych czynni-ków określających atrakcyjność produktu turystycznego, z tą uwagą, że auto-rzy mieli świadomość, iż ocena atrakcyjności turystycznej ma i zawsze będzie miała w dużym stopniu charakter subiektywny.
2. Porównanie z innymi metodami mierzenia konkurencyjności – autorzy zajęli się badaniem: pozycji konkurencyjnej, przewagi konkurencyjnej, zdolności do konkurowania.
W tym ujęciu założenia były w części zbieżne np. z modelem zespołu M.J. Stankiewicza, nie uwzględniono natomiast instrumentów konkurowania (w skali międzynarodowej)15.
3. Narzędzia badawcze – w celu identyfikacji czynników wpływających na kon-kurencyjność państw (ze szczególnym uwzględnieniem Polski) jako narzędzia badawcze zastosowano: rangową analizę korelacyjną (wykorzystanie współczynnika korelacji rang
Spearmana) na danych z próby 23 krajów Europy, prosty model ekonometryczny niezbędny do objaśnienia łącznego wpływu
wybranych czynników (z uwzględnieniem uwag ekspertów) oraz skwanty-fikowania siły ich oddziaływania (estymacja parametrów na próbie z 23 krajów).
W badaniu wzięto pod uwagę 10 wskaźników konkurencyjności oraz 57 czynników potencjalnie wpływających (determinant) na konkurencyjność. Wskaźniki konkurencyjności to m.in.:
liczba turystów zagranicznych przyjeżdżających do Polski (z wyróżnieniem turystów zamierzających wypocząć),
wydatki turystów zagranicznych w miejscu (kraju) destynacji,
14 Analiza przewag konkurencyjnych Polski na międzynarodowym rynku turystycznym, In-
stytut Koniunktur i Cen Handlu Zagranicznego, Warszawa 2003, s. 7. 15 Ibidem.
Potencjał turystyczny jako obszar badawczy nauk ekonomicznych 147
noclegi udzielone turystom, a były one ujmowane bezwzględnie lub per capita.
Czynniki potencjalne podzielono na poniższe grupy: walory przyrodnicze i klimatyczne, infrastruktura transportowa, infrastruktura telekomunikacyjna, czynniki otoczenia makroekonomicznego i konkurencyjności cenowej, czynniki sektora turystycznego16.
4. Wnioski z badania: 4.1. W grupie państw objętych badaniem Polska w 2003 roku – a więc przed akce-
sją do UE – miała najgorszą pozycję konkurencyjną (czołówka to Francja, Niemcy i Hiszpania), co nie oznacza, że Polska jako kraj destynacji nie prze-stanie być obiecująca dla turystów zagranicznych, ale korzyści uzyskiwane z turystyki zagranicznej będą relatywnie niższe od tych, które uzyskają konku-renci.
4.2. Analiza nie wykazała istotnego statystycznego związku (korelacji) pomiędzy konkurencyjnością destynacji turystycznej a relatywnym poziomem cen towa-rów i usług konsumpcyjnych, zachodził natomiast istotny związek między konkurencyjnością destynacji a poziomem rozwoju gospodarczego kraju.
4.3. Rozpatrując łączne oddziaływanie wyżej wymienionych czynników, na pod-stawie ocen parametrów ustalono, że: najsilniejsze oddziaływanie na konkurencyjność destynacji Polski wykaza-
ły czynniki związane z walorami przyrodniczo-klimatycznymi oraz z orga-nizacją i jakością usług sektora turystyki,
nieco mniejszą, ale bardzo wyraźną siłę oddziaływania wykazały czynniki związane z infrastrukturą transportową oraz ogólnym poziomem rozwoju gospodarczego,
wpływ pozostałych czynników był relatywnie znikomy17 – jest to zgodne zarówno z potrzebą ustalenia czynników istotnych (kluczowych), jak i z metodą opartą na koncepcji Vilfredo Pareto, głoszącej, iż: pewną prawi-dłowością jest, że 20% elementów systemu determinuje 80% efektów tego systemu18.
5. Wniosek ogólny z badania – Polska jest skazana na przyjazd ubogich turystów, z małą ilością pieniędzy i to na krótko!19
16 Ibidem, s. 59, wyniki przedstawiono w rozdz. III. 17 Ibidem, s. 22. 18 por. Z. Martyniak, Metody organizowania procesów pracy, PWE, Warszawa 1999,
s. 130–134. 19 Analiza przewag konkurencyjnych…, op.cit., s. 23 (wniosek 25).
Joanna Julia Sienkiewicz 148
Odnosząc się do przedstawionego w studium przypadku badania, uznajemy je za istotne i przecierające drogi dla innych projektów, ale należałoby je powtórzyć już w warunkach uczestnictwa Polski w Unii Europejskiej, czyli w sytuacji otwar-tego rynku ze wszystkimi implikacjami zeń wynikającymi. Kwintesencją marketingowego pojmowania zagadnień turystyki w optyce polskiej wydaje się opracowana przez Polską Organizację Turystyczną Marketin-gowa strategia Polski w sektorze turystyki na lata 2008–201520, której zasadniczym celem jest wyraźna poprawa międzynarodowej rozpoznawalności Polski jako kraju atrakcyjnego dla turystów, posiadającego konkurencyjne produkty turystyczne wy-sokiej jakości – i jest to studium przypadku nr 2. 3. Studium przypadku nr 2 1. Założenia wyjściowe – ocena: autorzy dostrzegają i akcentują wpływ świato-
wych trendów w turystyce i ich konsekwencje dla popytu turystycznego21. Mimo braku wyraźnego wskazania adresatów (sektorów turystyki) konse-kwencji trendów w turystyce, koncentrując się na sektorze turystyki zdrowot-nej, można zauważyć następujące czynniki wpływu: czynniki demograficzne (tzw. III wiek), czynniki zdrowotne (założono wzrost świadomości zdrowotnej), nowe technologie (głównie informatyczne), czas wolny (przyjęto, iż w bilansie czasu nastąpi rezygnacja z jednego
dłuższego urlopu na rzecz kilku krótszych), zmiany klimatyczne (ocieplenie klimatu i występowanie anomalii pogodo-
wych – konsekwencje: wzrost średnich temperatur w okresie letnim spo-woduje przesuwanie się wypoczynku typu „3S” na obszary północne).
2. Segmentacja rynku – tylko grupie seniorów (IV grupa) można znaleźć najwię-cej uczestników ruchu turystycznego o charakterze zdrowotnym.
3. Ocena podstawowych produktów turystycznych – żaden z produktów nie uzy-skał wysokiej oceny, średnią otrzymały jedynie trzy produkty. Perspektywicz-nie do grupy o wysokiej ocenie zaliczono: city break, tzw. tury gwarantowane, wydarzenia (święta, sylwester, imprezy kulturalne i sportowe) oraz pobyty specjalistyczne (polowania, wędkarstwo, SPA, kajaki). Pobyty lecznicze w uzdrowiskach uzyskały niską ocenę perspektywiczną, co stoi w wyraźnej sprzeczności z akcentowanymi trendami w turystyce światowej22.
20 Marketingowa strategia Polski w sektorze turystyki na lata 2008 – 2015, Polska Organi-
zacja Turystyczna, Warszawa 2008. 21 Ibidem, s. 20. 22 Ibidem, s. 41.
Potencjał turystyczny jako obszar badawczy nauk ekonomicznych 149
4. Potencjał produktów turystycznych województw – jeśli wierzyć ustaleniom monitoringu ROT – w sektorze turystyki zdrowotnej tylko trzy województwa (na 13 ogółem) traktują turystykę uzdrowiskową jako priorytety (kujawsko-pomorskie, małopolskie, świętokrzyskie), podczas gdy np. dla Pomorza Za-chodniego turystyka zdrowotna oceniana jest jako drugorzędna (najniższa oce-na w 3-stopniowej skali) – co dla województwa z uzdrowiskami o znaczącym potencjale turystycznym i perspektywach aktywnego uczestnictwa na europej-skim rynku uzdrowiskowym jest trudne do przyjęcia, gdy weźmie się pod uwagę deklaracje wojewódzkich strategii rozwojowych23. Dla pełnego obrazu dodajmy, że większość państw ujętych w opracowaniu traktuje produkt tury-styki uzdrowiskowej jako drugorzędny, co może być dla polskich uzdrowisk szansą (strategia niszy).
5. Synteza: można przyjąć, że autorzy omawianego dokumentu zdają sobie sprawę, iż
wiele założeń szczegółowych jest mało prawdopodobnym do urzeczywist-nienia, skoro wpływ strategii na wzrost udziału przemysłu turystycznego w gospodarce Polski oceniają jako niewielki24;
uważamy, że omawianą strategię należy skonfrontować z projektem Kie-runków rozwoju turystyki do 2015 roku, z uwzględnieniem misji rozwoju turystyki w Polsce (przyczynianie się do tworzenia istotnej części dochodu narodowego), wiodących celów nadrzędnych polskiej turystyki (wzrost znaczenia ekonomicznego turystyki w rozwoju gospodarczym kraju)25 oraz szans kreowania i rozwoju zintegrowanych i konkurencyjnych produktów (w analizie SWOT wymieniono wzrost zainteresowania ofertą turystyki prozdrowotnej oraz turystyką miejską)26.
Studium przypadku nr 2 wskazuje na jeden z najczęściej pojawiających się błędów w planowaniu i tworzeniu strategii rozwojowych – brak kompatybilności między rozmaitymi materiałami i dokumentami planistycznymi, który osłabia ich wiarygodność. Projekcja powyższych studiów przypadku pozwala na sformułowanie wnio-sków natury ogólniejszej, a więc: 1. Problematyka „potencjału turystycznego” Polski (na różnych poziomach) wy-
maga pogłębionych studiów z nadaniem ekonomicznemu aspektowi badań na-leżytej rangi.
23 Marketingowa strategia…, op.cit, s. 22, tabela 18. 24 Ibidem, s. 99. 25 Kierunki rozwoju turystyki do 2015 roku, projekt, Ministerstwo Sportu i Turystyki, War-
szawa 2008, s. 46. 26 Ibidem, s. 52.
Joanna Julia Sienkiewicz 150
2. Punktem odniesienia metodologii i metodyki badawczej mogą być zarówno model zespołu M.J. Stankiewicza, jak też model zaproponowany przez IKiC (patrz studium nr 1) – wydaje się, że ustalenia Instytutu sprzed siedmiu lat są nadal aktualne.
3. Z powyższego wynika, że najbardziej syntetycznym miernikiem oceny przez turystę zagranicznego potencjału turystycznego Polski (na przykładzie konku-rencyjności destynacji) jest wielkość środków pozostawianych przez turystę (per capita) w naszym kraju, które w 2002 roku wynosiły 72,2 USD (dla Irlan-dii 478,8 USD, Hiszpanii 422 USD, Czech 210,2 USD, Węgier 109,3 USD)27.
Podsumowanie Przed badaczami potencjału konkurencyjności stoi szereg problemów i pytań do rozwiązania. Z jednej strony, istotę analiz można sprowadzić do poszukiwań wieloczynnikowego modelu potencjału i ustalenia, które z elementów (czynników) odgrywają zasadniczą rolę – czynniki kluczowe. Z drugiej strony, wyobrażając sobie potencjał turystyczny jako pewien byt idealny (hipotetyczny), nie można pominąć wpływu tzw. megaczynników (zespołu czynników wykraczających poza sferę czystej ekonomii) na rozwój społeczno-gospodarczy kraju lub kontynentu. Istotne więc jest nie tyle ustalenie ilości megaczynników, ale sprawdzenie, które z nich równocześnie w czasie i przestrzeni są determinantami zmian w turystyce i potencjale turystyki. Dla wielu specjalistów centralnym punktem poszukiwań jest uświadomienie sobie relacji klimat – turystyka, co eksplodowało niejako po drugiej konferencji w Davos oraz po opublikowaniu Czwartego Raportu Oceniającego IPCC28. Dla innej grupy specjalistów istota zagadnienia sprowadza się do prób weryfi-kacji tzw. scenariuszy ESPON ze scenariuszami konkurencyjności Unii Europej-skiej, z zastrzeżeniem, iż scenariusze te dotyczą jednak fragmentu Europy – jest to o tyle interesujące, że dotyczy tzw. zasobowej szkoły w ekonomii, ale poprzedni i ostatni wątek stanowią osobne zagadnienia.
27 Obliczenia własne na podstawie: Analiza przewag konkurencyjnych..., op.cit., s. 117, ta-
blica 3.17. 28 Climate Change 2007, The IPCC 4th Assessment Report (pełny tekst raportu AR4 oraz
jego wersje skrócone dostępne na stronie internetowej http://ippc-wg1.ucar.edu).

Potencjał turystyczny jako obszar badawczy nauk ekonomicznych 151
TOURIST POTENTIAL AS A RESEARCH AREA OF ECONOMIC SCIENCES
Summary The paper is focused on theoretical and methodological aspects of the measure-ment of factors that affect the tourist potential of Poland allowing the influence of eco-nomic sciences, management studies and marketing triad on searching directions. Based on the analysis of literature and research projects, influence of the marketing concepts of market research (evaluation of subjective factors of influence among others) on des-tination models and competitiveness of tourist destination was demonstrated. The second aspect of the study is to take a look at national scientific output on destination competitiveness with a reference to economic formulation of competitive-ness model in the micro scale. The discussed problems are illustrated by two case studies and conclusions refer-ring to researchers on the tourist potential of Poland.
Translated by Jerzy Stępień

ZESZYTY NAUKOWE UNIWERSYTETU SZCZECIŃSKIEGO NR 592 EKONOMICZNE PROBLEMY TURYSTYKI NR 14 2010
ADAM R. SZROMEK Politechnika Śląska w Gliwicach
WSPÓŁCZYNNIK Α-CRONBACHA W BADANIACH ZJAWISK TURYSTYCZNYCH Wprowadzenie Naukowcy badający zjawiska społeczne, czyli takie, w których jednym z głównych czynników oddziałujących na zjawisko jest człowiek (jego cechy, opi-nie, postawy, zachowania itp.) posługują się wieloma narzędziami badawczymi, wśród których jednym z najpopularniejszych jest kwestionariusz badawczy. Jest to wygodne narzędzie badawcze, gdyż pozwala na zebranie danych w sposób bardzo przystępny, szczególnie gdy wykorzystuje się do tego celu technologie informa-tyczne (internetowe). Istnieje jednak kilka warunków skuteczności kwestionariusza, wśród których jest wiarygodność. Nawet najznamienitsze wnioski i dowody tracą wartość naukową, jeśli zostały oparte na wynikach badań wykonanych narzędziami o wątpliwej wiarygodności. Mimo to zauważa się liczne przypadki sporządzania kwestionariuszy badawczych bez uwzględniania podstawowych informacji na temat wiarygodności narzędzia. Wiarygodność wyników badań jest zależna od wielu aspektów badania, ale jednym z kluczowych jest wiarygodność narzędzi, którymi posłużono się w proce-sie badawczym. Owa wiarygodność kwestionariusza badawczego opiera się na dwóch filarach, którymi są trafność i rzetelność kwestionariusza. Aby zestaw pytań był wiarygodnym narzędziem badawczym, powinien być zarówno rzetelny, jak i trafny. Celem artykułu jest prezentacja techniki szacowania rzetelności kwestionariu-szy badawczych za pomocą współczynnika α-Cronbacha (alfa-Cronbacha). Autor przytacza różne metody szacowania wiarygodności kwestionariuszy badawczych, skupiając się na metodzie L.J. Cronbacha. Artykuł omawia również przykłady wy-korzystania współczynnika w turystyce.
Adam R. Szromek 154
1. Metody pomiaru trafności i rzetelności kwestionariusza Ogólne zasady formułowania pytań badawczych przytaczają A. Tokarz i A. Lewandowska1, stwierdzając wprost, iż:
pytania powinny być precyzyjne i zrozumiałe również przez unikanie spe-cjalistycznych i niejednoznacznych terminów,
warianty odpowiedzi nie mogą na siebie zachodzić lub stwarzać wrażenia dowolności klasyfikowania,
nie należy pytać o więcej niż jedno zagadnienie jednocześnie, pytania należy dostosować do wiedzy i doświadczenia badanych.
Literatura wymienia wiele sposobów ustalania trafności kwestionariusza2. Najczęściej wymienia się trafność treściową (fasadową), która opiera się jedynie na subiektywnym przekonaniu badacza, iż stworzone przez niego narzędzie pomiaro-we odzwierciedla mierzoną właściwość. Kwestionariusz może również wykazywać trafność teoretyczną poprzez udowodnienie, iż jest on powiązany z pojęciami oraz teoretycznymi założeniami obowiązującymi i ogólnie przyjętymi w analizowanej dziedzinie. Narzędzie może się również charakteryzować trafnością empiryczną (prognostyczną), będącą oceną zdolności prognostycznych narzędzia3. Opracowany kwestionariusz będzie trafny empirycznie, jeśli wystąpi wysoka zależność między wynikami predykcji (uzyskanymi na podstawie kwestionariusza) i rzeczywistym związkiem zachodzącym między mierzonymi zmiennymi. Natomiast trafność dia-gnostyczna wynika z porównania z innymi narzędziami mierzącymi tę samą wła-ściwość. W przypadku badania rzetelności kwestionariuszy wybór metod jest jeszcze szerszy4 i często uzależniony od potrzeb wynikających z procesu badawczego, a nawet skali. Należy jednak wspomnieć, iż obecnie stosowane metody badania rzetelności opierają się na klasycznym modelu rzetelności H. Gulliksena5:
Yi=Yti+Yei gdzie: Yi – wynik obserwowany dla i-tej osoby; Yti – wynik prawdziwy dla i-tej osoby;
1 A. Tokarz, A. Lewandowska, Badania rynku turystycznego. Materiały do studiowania,
WNUS, Szczecin 2005, s. 34. 2 Trafność i rzetelność testów psychologicznych. Wybór tekstów, red. J. Brzeziński, Gdań-
skie Wydawnictwo Psychologiczne, Gdańsk 2005, s. 12, 91, 272, 403. 3 A. Stanisz, Przystępny kurs statystyki z zastosowaniem STATISTICA PL na przykładach z
medycyny. Tom 3. Analizy wielowymiarowe, StatSoft Polska, Kraków 2007, s. 441. 4 J.P. Guilford, Psychometric method, McGraw-Hill, New York 1954, s. 373 oraz J.P. Guil-
ford, Rzetelność i trafność pomiarów, w: Trafność i rzetelność testów…, op.cit., s. 62. 5 H. Gulliksen, Theory of mental tests, Wiley, New York 1950.
Współczynnik -Cronbacha w badaniach zjawisk turystycznych 155
Yei – wielkość popełnionego błędu dla i-tej osoby. Model wymaga jednak przyjęcia m.in. następujących założeń:
wszystkie błędy pomiarów Yei (wynikające z rozbieżności między wyni-kiem kwestionariusza Yi oraz wynikiem rzeczywistym Yti) dla nieskończe-nie wielu pomiarów wykonanych u i-tej osoby mają rozkład normalny,
wartość średnia ze wszystkich błędów Yei jest równa zero, brak zależności między wynikiem pomiarowym Yi i błędem pomiaru Yei.
W literaturze wymienia się m.in. metodę powtórnego testowania (tzw. test-retest reliability), w której kwestionariusz przedstawiany jest dwukrotnie tej samej grupie osób, a rzetelność określana jest za pomocą współczynnika korelacji, obli-czanego względem obu prób badań. Z kolei metoda form równoległych (paralel – form reliability) wymaga opra-cowania dwóch równoległych narzędzi pomiarowych zastosowanych wobec tej samej grupy badawczej. Również w tym przypadku współczynnik korelacji między wynikami obu grup określa rzetelność kwestionariusza. Metoda połówkowa (odd-even reliability/split half) polega na podziale kwe-stionariusza na pytania parzyste i nieparzyste oraz potraktowanie ich odrębnie jako dwóch kwestionariuszy. Obliczona między nimi zależność stanowi korelację po-łówkową, która powinna być przekształcona zgodnie z przyjętą metodą obliczania rzetelności. Najczęściej stosowanym przekształceniem jest wzór Spearmana-Browna o postaci:
xy
xyz r
rr
1
2
, (1) gdzie: rxy – korelacja między połówkami; rz – rzetelność kwestionariusza. Kolejną metodą jest metoda zgodności wewnętrznej (internal consistency reliability), która składa się z różnych serii pytań o dychotomicznym podziale wa-riantów odpowiedzi. Podział kwestionariusza na dwie części w różnych sekwen-cjach umożliwia zbadanie rzetelności metodą połówkową. A. Stanisz6 wśród powyższych metod badania rzetelności wymienia również ocenę rzetelności między obserwatorami (inter-observer reliability). Metoda ta polega na badaniu zgodności ocen wydawanych przez zaangażowanych w badanie ekspertów, np. grupy lekarzy, którzy, badając uczestników badań, określiliby sto-pień zgodność między wynikami uzyskanymi na podstawie określonego narzędzia badawczego oraz rzeczywistym stwierdzeniem lub niestwierdzeniem schorzenia u badanego.
6 A. Stanisz, op.cit., s. 441.
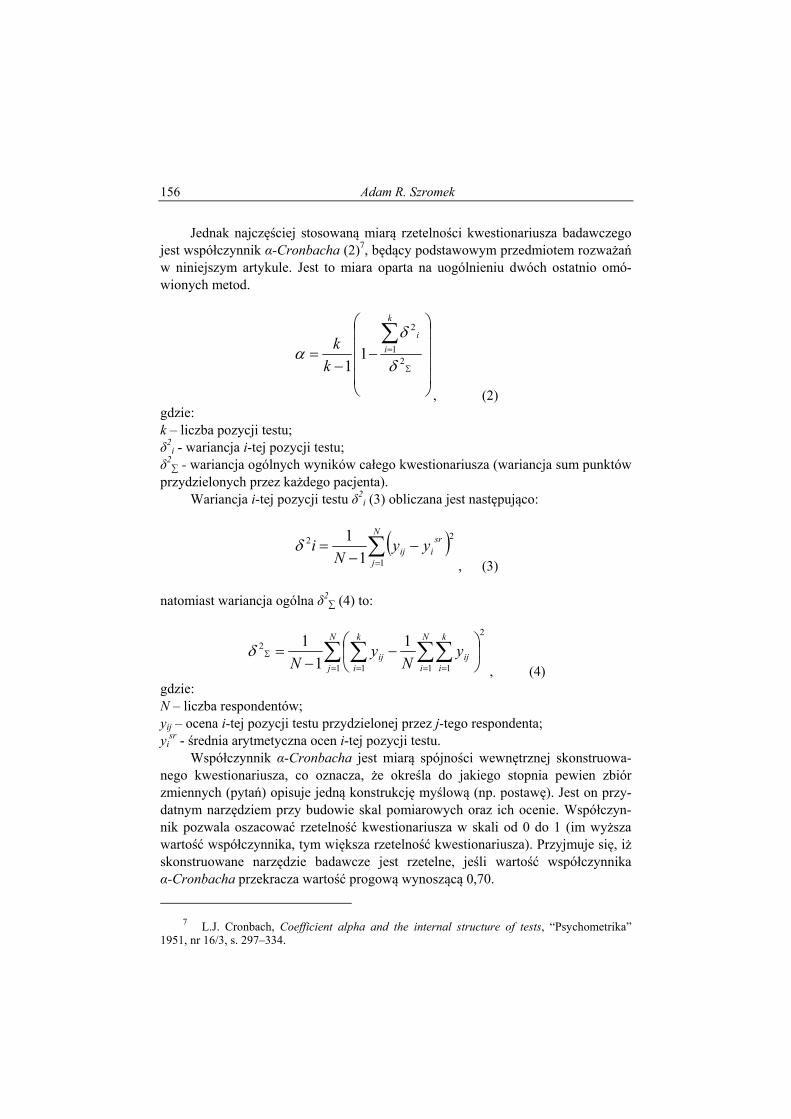
Adam R. Szromek 156
Jednak najczęściej stosowaną miarą rzetelności kwestionariusza badawczego jest współczynnik α-Cronbacha (2)7, będący podstawowym przedmiotem rozważań w niniejszym artykule. Jest to miara oparta na uogólnieniu dwóch ostatnio omó-wionych metod.
21
2
11
k
i
i
k
k
, (2) gdzie: k – liczba pozycji testu; δ2
i - wariancja i-tej pozycji testu; δ2∑ - wariancja ogólnych wyników całego kwestionariusza (wariancja sum punktów
przydzielonych przez każdego pacjenta). Wariancja i-tej pozycji testu δ2
i (3) obliczana jest następująco:
N
j
sriij yy
Ni
1
22
1
1, (3)
natomiast wariancja ogólna δ2
∑ (4) to:
N
j
N
i
k
iij
k
iij y
Ny
N 1
2
1 11
2 1
1
1, (4)
gdzie: N – liczba respondentów; yij – ocena i-tej pozycji testu przydzielonej przez j-tego respondenta; yi
sr - średnia arytmetyczna ocen i-tej pozycji testu. Współczynnik α-Cronbacha jest miarą spójności wewnętrznej skonstruowa-nego kwestionariusza, co oznacza, że określa do jakiego stopnia pewien zbiór zmiennych (pytań) opisuje jedną konstrukcję myślową (np. postawę). Jest on przy-datnym narzędziem przy budowie skal pomiarowych oraz ich ocenie. Współczyn-nik pozwala oszacować rzetelność kwestionariusza w skali od 0 do 1 (im wyższa wartość współczynnika, tym większa rzetelność kwestionariusza). Przyjmuje się, iż skonstruowane narzędzie badawcze jest rzetelne, jeśli wartość współczynnika α-Cronbacha przekracza wartość progową wynoszącą 0,70.
7 L.J. Cronbach, Coefficient alpha and the internal structure of tests, “Psychometrika”
1951, nr 16/3, s. 297–334.

Współczynnik -Cronbacha w badaniach zjawisk turystycznych 157
Dokonując prostych symulacji na danych, można zauważyć, iż wartość współ-czynnika jest wyższa, gdy badani są konsekwentni w wyborze określonego obszaru skali we wszystkich pytaniach. Natomiast nie obserwuje się większego wpływu na stopień rzetelności, gdy wśród respondentów występują zarówno zwolennicy jed-nej, jak i drugiej skrajności, albo ci, którzy wybierają wariant pośredni. Rzetelność narzędzia wynika z konsekwentności wyboru podobnych odpowiedzi wobec wszystkich pytań u jednego respondenta. 2. Przykład wykorzystania współczynnika α-Cronbacha Miara rzetelności L.J. Cronbacha, choć oparta na metodach ilościowych, nie wskazuje dokładnej rzetelności zestawu pytań, ale szacuje tę rzetelność na podsta-wie badania zgodności odpowiedzi określonego respondenta. Własności te można przedstawić na poniższym przykładzie. Gdy zadaniem konstruktora, badacza, pracownika działu marketingu jest skonstruowanie kwestionariusza służącego do pomiaru uprzedzeń mieszkań-ców określonej miejscowości turystycznej w stosunku do przybywających tam turystów, formułuje on zestaw opinii, pełniących rolę pytań kwestionariuszowych. Na przykład:
wszyscy turyści są tacy sami; turyści zaśmiecają miejscowość turystyczną; żyłoby się tu lepiej, gdyby nie było turystów; ogólnie rzecz biorąc, turyści nie przynoszą mieszkańcom miejscowości po-
żytku; turyści dewastują atrakcje miejscowości turystycznej; napływ turystów odbiera miastu jego klimat społeczny; turyści są powodem zaniku tożsamości regionalnej; w mieście byłoby więcej firm i miejsc pracy, gdyby nie turyści; włodarze miasta widzą na pierwszym miejscu dobro turystów, a nie miesz-
kańców; turyści są traktowani priorytetowo (w sklepach, zakładach usługowych i in-
stytucjach); turyści wywołują konflikty między sobą i ze stałymi mieszkańcami; turyści hałasują i zakłócają spokój innym turystom i mieszkańcom; przez turystów nie ma gdzie parkować; turyści powodują tłok w środkach komunikacji i na drogach (korki); turyści są powodem wzrostu kosztów utrzymania mieszkańców.
Respondent ma za zadanie wskazać odpowiedź (wyrazić swoją opinię) w określonej skali, gdzie skrajności skali wyrażają jednocześnie skrajności odpo-wiedzi. W analizowanym przykładzie badany powinien określić, w jakim stopniu
Adam R. Szromek 158
zgadza się on z każdym przytoczonym stwierdzeniem. Badanie wymaga przyjęcia określonej skali. W naszym przykładzie będzie to skala dziesięciostopniowa od 1 do 10, gdzie 1 oznacza całkowity brak zgody z prezentowanym stwierdzeniem, a 10 – całkowitą zgodność ze stwierdzeniem. Jak łatwo zauważyć – respondent pełen uprzedzeń wciąż będzie wskazywał najwyższe wartości dla każdego z pytań. Możliwe jest również przedstawienie bardziej wyraźnej konstrukcji kwestio-nariusza, w którym zamiast dychotomicznego wariantu odpowiedzi umieszcza się opis skrajności lub stopniowanie odpowiedzi w porządku rosnącym. Może to być np. określenie stopnia skłonności do występowania określonego zachowania. Analiza wyników w popularnych arkuszach kalkulacyjnych nie daje zadowa-lającego efektu, gdyż uzyskujemy wartość współczynnika α-Cronbacha dla istnie-jącej zbiorowości 15 pytań. Jednak eliminacja pytań obniżających wynik współ-czynnika musiałaby być poprzedzona 15-krotnym obliczeniem współczynnika dla wyeliminowania zaledwie jednego z 15 pytań. Proces należałoby powtarzać, aż do uzyskania pożądanej wartości współczynnika lub wyboru zaplanowanej liczby naj-efektywniejszych pytań. Byłby to zatem bardzo czasochłonny proces. Zaawansowane pakiety analizy danych, np. STATISTICA 8 PL, posiadają moduł obliczający wartość współczynnika α-Cronbacha wraz z tabelą podsumowu-jącą potencjalne wartości współczynnika dla każdego eliminowanego pytania. W tabeli 1 zaprezentowano zbiorcze zestawienie podsumowań współczynnika α-Cronbacha dla danych (fikcyjnych) celowo dobranych przez autora na potrzeby zobrazowania niniejszego przykładu. Wartość współczynnika dla 15 pytań wynosi 0,6761. Nie jest to zatem zado-walająca rzetelność kwestionariusza. Przeglądając poszczególne wyniki, zauważa-my, że usunięcie pytania H pozwoli na podwyższenie współczynnika α-Cronbacha do poziomu 0,7258. Następnie, gdy usuniemy pytanie E, rzetelność przekroczy wartość 0,7647. Gdy zaś wyeliminujemy ostatnie pytanie – uzyskamy zestaw 12 pytań o rzetelności 0,7858 itd. Jak łatwo zauważyć – najwyższa rzetelność kwestionariusza (0,8593) wystąpi przy siedmiu pytaniach (A, B, C, F, I, J, K)8. Dalsze eliminowanie pytań nie popra-wia wyniku, ale go pogarsza, zatem jest to optymalny zestaw pytań dla sformuło-wanego zestawu 15 pytań początkowych.
8 Rzecz jasna, uzyskane tu wyniki nie mogą być podstawą wnioskowania naukowego,
gdyż zostały wymyślone przez autora na potrzeby prezentacji możliwości współczynnika α-Cronbacha.
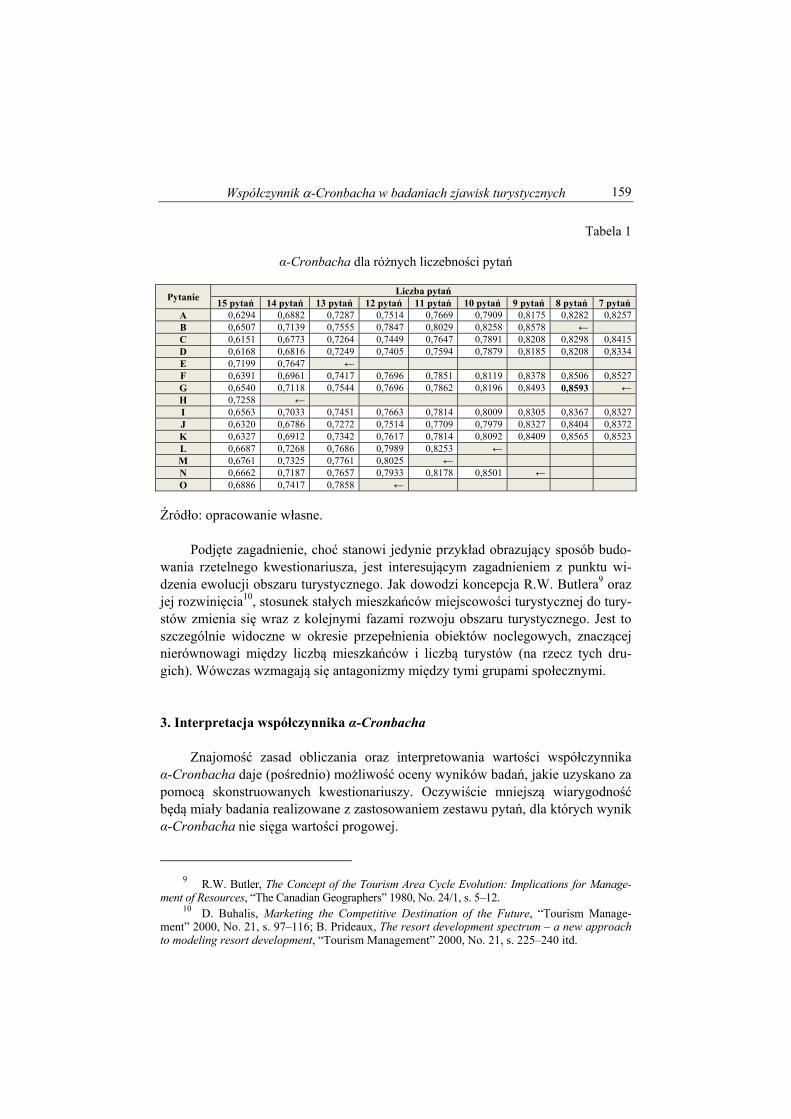
Współczynnik -Cronbacha w badaniach zjawisk turystycznych 159
Tabela 1
α-Cronbacha dla różnych liczebności pytań
Pytanie Liczba pytań
15 pytań 14 pytań 13 pytań 12 pytań 11 pytań 10 pytań 9 pytań 8 pytań 7 pytań A 0,6294 0,6882 0,7287 0,7514 0,7669 0,7909 0,8175 0,8282 0,8257 B 0,6507 0,7139 0,7555 0,7847 0,8029 0,8258 0,8578 ← C 0,6151 0,6773 0,7264 0,7449 0,7647 0,7891 0,8208 0,8298 0,8415 D 0,6168 0,6816 0,7249 0,7405 0,7594 0,7879 0,8185 0,8208 0,8334 E 0,7199 0,7647 ← F 0,6391 0,6961 0,7417 0,7696 0,7851 0,8119 0,8378 0,8506 0,8527 G 0,6540 0,7118 0,7544 0,7696 0,7862 0,8196 0,8493 0,8593 ← H 0,7258 ← I 0,6563 0,7033 0,7451 0,7663 0,7814 0,8009 0,8305 0,8367 0,8327 J 0,6320 0,6786 0,7272 0,7514 0,7709 0,7979 0,8327 0,8404 0,8372 K 0,6327 0,6912 0,7342 0,7617 0,7814 0,8092 0,8409 0,8565 0,8523 L 0,6687 0,7268 0,7686 0,7989 0,8253 ← M 0,6761 0,7325 0,7761 0,8025 ← N 0,6662 0,7187 0,7657 0,7933 0,8178 0,8501 ← O 0,6886 0,7417 0,7858 ←
Źródło: opracowanie własne. Podjęte zagadnienie, choć stanowi jedynie przykład obrazujący sposób budo-wania rzetelnego kwestionariusza, jest interesującym zagadnieniem z punktu wi-dzenia ewolucji obszaru turystycznego. Jak dowodzi koncepcja R.W. Butlera9 oraz jej rozwinięcia10, stosunek stałych mieszkańców miejscowości turystycznej do tury-stów zmienia się wraz z kolejnymi fazami rozwoju obszaru turystycznego. Jest to szczególnie widoczne w okresie przepełnienia obiektów noclegowych, znaczącej nierównowagi między liczbą mieszkańców i liczbą turystów (na rzecz tych dru-gich). Wówczas wzmagają się antagonizmy między tymi grupami społecznymi. 3. Interpretacja współczynnika α-Cronbacha Znajomość zasad obliczania oraz interpretowania wartości współczynnika α-Cronbacha daje (pośrednio) możliwość oceny wyników badań, jakie uzyskano za pomocą skonstruowanych kwestionariuszy. Oczywiście mniejszą wiarygodność będą miały badania realizowane z zastosowaniem zestawu pytań, dla których wynik α-Cronbacha nie sięga wartości progowej.
9 R.W. Butler, The Concept of the Tourism Area Cycle Evolution: Implications for Manage-
ment of Resources, “The Canadian Geographers” 1980, No. 24/1, s. 5–12. 10 D. Buhalis, Marketing the Competitive Destination of the Future, “Tourism Manage-
ment” 2000, No. 21, s. 97–116; B. Prideaux, The resort development spectrum – a new approach to modeling resort development, “Tourism Management” 2000, No. 21, s. 225–240 itd.

Adam R. Szromek 160
W literaturze przedmiotu zauważa się incydentalne przypadki ujawniania wartości współczynnika wobec sporządzonych narzędzi badawczych. Przykładem jest praca J.Y. Wonga i C. Yeh11, którzy badają związek między postrzeganiem ryzyka oraz wiedzy na temat podróży turystycznych a niezdecydowaniem w proce-sie podejmowania decyzji dotyczących podejmowanej podróży (tabela 2).
Tabela 2
Rezultaty badań J.Y. Wonga i C. Eh
Zagadnienia pomiarowe α
Psychologiczna percepcja ryzyka Podróżowanie jest obecnie ryzykowne Czułbym się komfortowo, podróżując gdziekolwiek w obecnych czasach Podróż po kraju jest obecnie bardziej ryzykowne niż podróżowanie po świecie Turyści powinni unikać odwiedzania miejsc, gdzie miały miejsce ataki Wyjazdy wakacyjne są zupełnie bezpieczne Czuję się nerwowy, podróżując w obecnych czasach Dodatkowe względy bezpieczeństwa na lotniskach czynią podróż bezpieczniejszą
0,60
Wrodzona percepcja ryzyka Podróż na obszary naturalne (tj. parki narodowe i lasy) nie jest ryzykowna Odwiedzanie galerii sztuki i muzeów jest bezpieczną aktywnością turystyczną Obecnie powinno się unikać odwiedzania innych parków i pól namiotowych Bezpieczeństwo jest najważniejszym atrybutem, jaki może zaoferować miejscowość turystyczna Bezpieczeństwo jest najważniejszym argumentem, którą biorę pod uwagę, wybierając miejsce wypoczynku Wyprawy turystyczne do malowniczych atrakcji obszarów naturalnych jest obecnie bezpiecz-niejsze
0,60
Stan wiedzy turystów W porównaniu z przeciętną osobą, jestem zaznajomiony z szeroką różnorodnością miejsc wypo-czynku W porównaniu z moimi przyjaciółmi, jestem obeznany z szeroką różnorodnością miejsc wypo-czynku W porównaniu z ludźmi, którzy wiele podróżują, jestem zaznajomiony z szeroką różnorodnością miejsc wypoczynku
0,86
Niezdecydowanie turystów Unikam podejmowania decyzji podczas wyboru miejsca wypoczynku Odraczam podjęcie decyzji podczas wyboru miejsca wypoczynku Wolę raczej zostawić komuś decyzję, aby nie był to mój problem Wolę zostawić kogoś decydowanie Kiedy muszę podjąć decyzję, długo czekam, nim zacznę o tym myśleć Nie lubię brać odpowiedzialności za decyzje dotyczące wyboru miejsca wypoczynku
0,80
Źródło: opracowanie własne. Przytoczone wyniki badań wskazują na wysoką rzetelność zestawów pytań dotyczących stanu wiedzy turystów oraz ich niezdecydowania, co do wyboru miej-
11 J.Y. Wong, C. Yeh, Tourist hesitation in destination decision ma king, “Journal of Tour-
ism Research” 2009, No. 36/1, s. 6–23.

Współczynnik -Cronbacha w badaniach zjawisk turystycznych 161
sca wypoczynku. W obu przypadkach α-Cronbacha przekracza wartość progową 0,7. Natomiast w przypadku testów percepcji ryzyka (zarówno wrodzonej, jak i psychologicznej) spójność zestawu pytań wydaje się niewystarczająca. Zastana-wiające jest również ograniczenie liczby pytań w przypadku stanu wiedzy turystów do trzech. Podsumowanie Najpopularniejsza miara badania rzetelności kwestionariusza α-Cronbacha jest cennym narzędziem oceny wiarygodności formułowanych pytań. Współczyn-nik ten pozwala w przystępny sposób ocenić rzetelność narzędzi badawczych, a często sam staje się narzędziem umożliwiającym opracowanie skali oceny okre-ślonego zjawiska. Zasadę obliczania współczynnika L.J. Cronbacha przedstawiono na przykła-dzie kwestionariusza oceny uprzedzeń mieszkańców miejscowości turystycznej wobec przybywających turystów. Tym sposobem z 15 pytań wybrano 7 pozwalają-cych na osiągnięcie najwyższej rzetelności narzędzia oceny. Przedstawiony zestaw pytań pomiarowych posiada jednak słabość w postaci niewiadomej trafności kwe-stionariusza w identyfikacji stopnia uprzedzenia do turystów. Powodem tego jest fakt, iż zakłada się trafność treściową (fasadową), a zatem wynika ona z przekona-nia konstruktora, że sporządzone narzędzie wskazuje prawdę. Tym samym fakt ten może dostarczać mniejszych lub większych wątpliwości co do wiarygodności na-rzędzia pomiarowego. Wątpliwości te mogą być mniejsze, jeśli konstruktor posiada doświadczenie w obszarze badanego zagadnienia, ale chcąc je całkowicie oddalić, powinien udowodnić (empirycznie) zgodność wyników z cechą, która reprezentuje badane zagadnienie, co w stosunku do niektórych podejmowanych problemów może być niemożliwe.
CRONBACH'S ALPHA COEFFICIENT IN TOURISM RESEARCH
Summary In the article one of most forceful research method of reliability in investigative questionnaire is describing. It is Cronbach’s α. Author presents technique of valuation of this ratio and its conditions and refer to examples of using Cronbach’s α in tourism.
Translated by Adam Szromek


ZESZYTY NAUKOWE UNIWERSYTETU SZCZECIŃSKIEGO NR 592 EKONOMICZNE PROBLEMY TURYSTYKI NR 14 2010
JĒKABS TRUŠIŅS, EDVĪNS BUKA Riga Technical University
PRECONDITIONS AND PROBLEMS OF CREATING THE RECREATION AND TOURISM SPATIAL SYSTEM IN LATVIA
Recreation, including active leisure, tourism and rehabilitation, as a process for reconstruction of human physical and mental strength forms the basis for the industry that masters and uses recreational resources, organises natural and artificial environment as well as its spatial development by providing and enhancing the social and economical effects of recreation. The role of tourism sector in Latvia's national economy is significant: the export of tourism-related services in 2008 reached 403 million LVL, or 18,3% of Latvia's total service exports. The share of tourism in national economy is still below the European average (i.e. 4%): direct percentage of tourism sector in Latvian GDP in 2008 was 1,5%1. However, given that tourism is closely linked to other sectors, its total (direct and indirect) contribu-tion to the national economy is much higher – 7,5%2. The importance and diversity of tourism and recreation industry has been highlighted within the Latvian National Development Plan for the years 2007–20133 as one of the priority tasks. The same has been noticed within the National Strategic Framework Document for the years 2007–2013 as well as within EU funding programmes. Two key directions have been selected – the development of competitive and quality tourism products and services as well as making them recognizable4.
1 Tourism in Latvia in 2008, A Collection of Statistical Data – Riga, Central Statistical Bu-
reau of Latvia, Riga 2009. 2 World Tourism Organization (UNWTO) World Tourism Barometer, „Bulletin”, Vol. 7,
No. 1, January 2009, Madrid, Spain. 3 Latvian National Development Plan for the years 2007–2013, www.nap.lv, 15.01.2010. 4 National Strategic Framework Document for the years 2007–2013, izm.izm.gov.lv.

Jēkabs Trušiņs, Edvīns Buka 164
The current state of recreational sector in Latvia can be characterized by lack of systematic coordination and management. The main focus is on the tourism or-ganization, promoting its commercialisation5. The development of domestic tourism is based on the construction and ar-rangement of small guest houses and significantly on the development of rural tour-ism. Development of recreational rehabilitation and leisure industries is under su-pervision of separate private entrepreneurs and is not sufficiently coordinated, evaluated and forecasted. The systemic study on joint recreation and tourism system launched at the end of 2008 in Department of Architecture and Urban Planning of the Riga Technical University. Scientific aim of the Study is to draw-up a spatial model and a sustain-able development strategy for Latvia's tourism and recreation system (LARETS) in European context. The tourism and recreation has been defined as a priority sector that is competitive and able to ensure effective use of Latvia's recreational and tour-ism resources, improvement of population's living standards as well as increase of international demand for these resources. The main problems, which determine the urgency of such kind of research, are following:
Latvia lacks a systemic approach to the complex spatial planning of the recreation and tourism sector, most of the researches are in different recrea-tional and tourism sub-sectors, but no common analyse with global devel-opment trends has been made;
failure to make a common territorially functional zoning for all tourism and recreation related sectors;
the inadequate identification and assessment of Latvian natural and cultural heritage as recourses for recreation and tourism;
failure to make a united recreational and tourism scientific research centre. Development issues of recreation industry are addressed within an interdisci-plinary research that requires an integrated information, data, methodology, instru-ments and approaches from several science disciplines (architecture, economics, sociology, environment science, system analysis and modelling) in order to origi-nate knowledge and to expound proposals that would be impossible to do within the framework of only one scientific discipline. The subject of the study is topical since growing importance of recreation and tourism in Latvian economy during recent years as well as there is lack of scientific study of tourism and recreation industry, especially in aspects of its spatial and regional development.
5 Recreation system of Latvia, Scientific research – Riga, Latvian Building Research Insti-
tute, Riga 1990.

Preconditions and problems… 165
The leading role in interdisciplinary scientific study on modelling of Latvia's tourism and recreational system and drawing up its development strategy has given to the architectural and urban science. Urbanism is a sub-sector of science that explores the principles of territorially functional and spatial organization of cities and other settlements in contemporary processes and perspectives for future development from both – planning structure and architectural point of view. It is envisages to aim the complex urban studies on accurate planning of recreation and tourism sector as well as to enhance its contri-bution to Latvian national economy. The output of the project will provide creation of sustainable tourism and recreational system in both cities and rural areas that will meet the needs of local population as well as local and international tourists in a long term span. The complex analysis of tourism and recreational resources are carried out and proposals for their rational use defined. The main tourism resources of Latvia are (Fig. 1):
relaxation and rehabilitation resources (Baltic Sea and Riga Gulf coast, lakes, rivers, recreative relief, forests, natural singulars, mineral waters and mud for treatment, climate);
cultural monuments (urban, architectural, archeological, historical and art) which are usually part of cultural and historical landscpe;
international scale musical, dance folklore et.c. events; museums; art exhibitions; handicrafts and craftsman traditions; national cuisine; cultural activities in authentic environment.
Figure 1. Recreative potential of the tourism resources in Latvia in 1994.

Jēkabs Trušiņs, Edvīns Buka 166
There are 3 types of the recreation areas in Latvia: coastal, hilly lakelands, river valleys. Today tourism and recreation resources in Latvia are used very uneven. The most popular tourist areas are Old Riga, historical centre of Riga, Jurmala resort, National Park of Gauja with Sigulda and Cesis, Rundale Palace, historical centres of Liepaja, Ventspils and Kuldīga. In connection with that the previous research works in recreation and tourism spatial planning field from 80ies and 90ies are critically analysed and updated according to contemporary social and economical conditions. Results of the research will serve as a guidelines for local and state govern-ment and the executive bodies in planning the implementation measures of adminis-trative territorial planning programmes. The outcome of the project aims will be described in the final report; it will be made available for public on the internet site. The implementation of the LARETS project will provide the wide influence and concrete results in following areas connected with tourism and recreation: 1. In economic sphere:
diverse, authentic, and competitive offer of the tourism and recreational products with balanced economical and social aspects;
well developed and competitive enterpreneurship in tourism branch; balanced tourism and recreation product offer in all the regions of Latvia.
2. In social, cultural and education sphere: improved state social environment and quality of life of inhabitants of
Latvia; wide offer of domestic tourism; understanding of society about tourism and recreation as integrated part of
modern national economy. 3. In environment sphere:
implemented principles of sustainability in planning of tourism and recreation development;
preserved and maintained resources attractive for tourism and recreation , spatial and landscape environment;
preservation of the cultural heritage by active use for tourism and recreation purposes.
4. In management and co-operation sphere: synergetic effect in co-opration between tourism and connected branches; optimal co-operation model in tourism and recreation development
between involved state, municipal, non-governmental organizations and enterpreneurs according to the scheme: tourism market – state – region – local municipality – enterpreneur;
closer co-operation between the Baltic States and alignment with Baltic Sea Region tourism movement and concrete development projects.
Preconditions and problems… 167
PROBLEMY BUDOWANIA SYSTEMÓW REKREACYJNYCH I TURYSTYCZNYCH NA ŁOTWIE
Streszczenie W artykule przedstawiono najważniejsze problemy rozwoju sektora turystycznego na Łotwie. Dokonano przeglądu najważniejszych atrakcji turystycznych kraju oraz przedstawiono założenia projektu LARETS (Łotewski System Turystyczny).
Tłumaczył Adam Pawlicz

ZESZYTY NAUKOWE UNIWERSYTETU SZCZECIŃSKIEGO NR 592 EKONOMICZNE PROBLEMY TURYSTYKI NR 14 2010
WOJCIECH WIESNER, JACEK GROBELNY, PIOTR ZARZYCKI Akademia Wychowania Fizycznego we Wrocławiu
EDUKACJA TURYSTYCZNA STUDENTÓW AWF WE WROCŁAWIU – REFLEKSJE PEDAGOGICZNE
Wprowadzenie Edukacja oznacza ogół procesów oświatowo-wychowawczych, a jako szeroko zakrojona działalność pedagogiczna obejmuje kształcenie i wychowanie1. Wycho-wanie jest świadomie organizowaną działalnością ludzką, której celem jest wywo-łanie zmian w całej osobowości człowieka, włącznie ze stroną wyrażającą stosunek do wartości2. Proces wychowania ukierunkowany jest na wszechstronny rozwój osobowości, który powinien być gwarantem przygotowania wychowanka do sprawnego uczestnictwa w życiu społecznym3. Proces kształcenia obejmuje przede wszystkim nauczanie i rozwijanie strony motoryczno-kondycyjnej4. Skuteczny proces edukacji powinien przysposabiać człowieka do autokreacji, czyli do wpły-wania na swój własny rozwój. Założenia edukacji akademickiej muszą spełniać powyższe oczekiwania i nie stanowi różnicy fakt, że podmiotem jest człowiek dorosły. Podmiotem tej edukacji, obok studenta, są nauczyciele akademiccy z kadrą profesorską na czele. W pośred-niej perspektywie ważnym podmiotem tego rodzaju edukacji jest również osoba turysty, odbiorcy usług oferowanych przez absolwentów.
1 H. Grabowski, Teoria fizycznej edukacji, WSiP, Warszawa 1997; W. Okoń, Wprowadze-
nie do dydaktyki ogólnej, PWN, Warszawa 1987. 2 B. Czabański, Kształcenie psychomotoryczne, AWF, Wrocław 2000; W. Okoń, op.cit.;
S. Palka, Teoria pedagogiczna a praktyczne doświadczenia nauczycieli, WSiP, Warszawa 1989; A. Pawłucki, Osoba w pedagogice ciała, OSW, Olsztyn 2007.
3 W. Okoń, op.cit. 4 H. Grabowski, op.cit.

Wojciech Wiesner, Jacek Grobelny, Piotr Zarzycki 170
Edukacja akademicka specjalistów z zakresu turystyki odbywa się w Polsce w ponad 60 placówkach, w tym 36 szkołach niepublicznych5. W województwie dolnośląskim funkcjonuje siedem szkół wyższych oferujących kierunek turystyka i rekreacja. Tylko trzy z nich mają charakter publiczny: Akademia Wychowania Fizycznego we Wrocławiu, Państwowa Wyższa Szkoła Zawodowa w Legnicy oraz Państwowa Wyższa Szkoła Zawodowa w Wałbrzychu. Pozostałe cztery mieszczą się we Wrocławiu i mają charakter niepubliczny: Wyższa Szkoła Informatyki Sto-sowanej, Wyższa Szkoła Bankowa, Wyższa Szkoła Handlowa i Wyższa Szkoła Zarządzania „Edukacja”6. Akademia Wychowania Fizycznego we Wrocławiu jest uczelnią dwuwydzia-łową (Wychowanie Fizyczne i Fizjoterapia). Kierunek turystyka i rekreacja jest jednym z trzech kierunków Wydziału Wychowania Fizycznego (obok kierunków sport oraz wf)7. W latach 1976–1982 turystyka i rekreacja funkcjonowała jako sa-modzielny wydział (1986 – ostatni absolwenci)8. W planach strategii uczelni do 2012 roku planowane jest ponowne powołanie Wydziału Turystyki i Rekreacji. Tradycje edukacji turystycznej wśród wrocławskich studentów wychowania fizycz-nego są bogate i wiążą się m.in. z osobą dr Zofii Dowgird9. Program kształcenia na kierunku turystyka i rekreacja w Akademii Wychowa-nia Fizycznego we Wrocławiu zakłada wykształcenie specjalistów, którzy powinni być przygotowani do podejmowania wszelkiej działalności i przedsięwzięć w za-kresie turystyki i rekreacji. Proces edukacji studentów kierunku turystyki i rekreacji przebiega zgodnie z założeniami Deklaracji Bolońskiej10, w wymiarze studiów licencjackich, magisterskich i doktorskich. Studia licencjackie trwają sześć seme-strów. Absolwent studiów licencjackich powinien być przygotowany do podjęcia studiów drugiego stopnia11. Absolwent studiów magisterskich powinien posiadać wiedzę rozszerzoną – w stosunku do studiów na poziomie licencjackim oraz umie-
5 Pentor Research International S.A., Oddział w Katowicach dla Ministerstwa Sportu i Tu-
rystyki, 2007. 6 Ibidem. 7 www.awf.wroc.pl 8 www.awf.wroc.pl, Absolwenci Akademii Wychowania Fizycznego we Wrocławiu
1949–2005, AWF, Wrocław 2006. 9 Nasza słoneczna uczelnia, red. R. Jezierski, A. Kaczyński, AWF, Wrocław 2006. 10 Deklaracja Bolońska (18-19 czerwca 1999 roku) jest podstawą procesu na rzecz tworze-
nia harmonijnego i porównywalnego w zakresie stopni i tytułów akademickich systemu szkolnic-twa wyższego w Europie oraz podniesienia prestiżu uczelni europejskich w porównaniu z uczel-niami amerykańskimi. Zakłada wprowadzenie systemu szkolnictwa wyższego opartego na trzech cyklach kształcenia: co najmniej 3-letnie studia I stopnia (w Polsce kończące się dyplomem licen-cjata lub inżyniera), 2-letnie studia II stopnia (w Polsce kończące się uzyskaniem tytułu magistra lub magistra inżyniera) i 4-letnie studia III stopnia, kończące się uzyskaniem stopnia doktora.
11 Standardy kształcenia dla poszczególnych kierunków studiów i poziomów kształcenia, Biuletyn Informacji Publicznej, Ministerstwo Nauki i Szkolnictwa Wyższego, www.mnisw.gov.pl, poz. 108, (23.10.2008).
Edukacja turystyczna studentów… 171
jętności umożliwiające podejmowanie samodzielnej działalności menedżerskiej w obszarze turystyki i rekreacji. Magister turystyki (rekreacji) powinien mieć wpo-jone nawyki ustawicznego kształcenia i rozwoju zawodowego oraz być przygoto-wany do podejmowania wyzwań badawczych i kontynuacji edukacji na studiach trzeciego stopnia (doktoranckich)12 . Środowiskowe studia doktoranckie w Akademii Wychowania Fizycznego we Wrocławiu realizowane są na Wydziale Wychowania Fizycznego przy udziale Wy-działu Fizjoterapii i trwają osiem semestrów. Nadzór merytoryczny nad działalno-ścią studiów sprawuje Rada Wydziału Wychowania Fizycznego. Studia doktoranc-kie prowadzone są w dziedzinie nauk o kulturze fizycznej. Do podstawowych obo-wiązków studentów należy realizowanie programu studiów doktoranckich oraz prowadzenie badań naukowych i składanie sprawozdań z ich przebiegu. Doktoranci mają także obowiązek odbywania praktyk zawodowych w formie uczestniczenia w zajęciach dydaktycznych (I rok) oraz prowadzenia zajęć (II-IV rok) w wymiarze 60 godzin rocznie13. Niniejsze doniesienie jest próbą oceny założeń edukacji specjalistów z zakresu turystyki pod kątem skuteczności dydaktycznej tego procesu. Celem artykułu jest ukazanie obszarów, w których występują nierozwiązane problemy dydaktyczne związane z edukacją studentów kierunku turystyka i rekreacja, na przykładzie AWF we Wrocławiu. Praca stanowi fragment głębszych i szerszych rozważań. 1. Cel edukacyjny Nie można odnieść sukcesu pedagogicznego bez precyzyjnego sformułowania celu, który zamierza się osiągnąć. Precyzyjnie sformułowany cel edukacji pozwala na właściwy nabór kandydatów na specjalistów z turystyki rekreacji, kontrolowanie przebiegu i realizacji szkolenia, konfrontowanie założeń z działaniem zawodowym absolwenta. Cel edukacji akademickiej – wykształcenie specjalisty w zakresie tury-styki – jest podporządkowany głównemu zadaniu, jakie będzie on realizować w ramach swoich obowiązków zawodowych. Problem celu pedagogicznego zawarty jest w pytaniu, kim ma być absolwent kierunku turystyki i rekreacji? Jakie powinny być jego kwalifikacje i kompetencje zawodowe? Czy przygotowanie powinno być specjalistyczne czy ogólne i uniwer-salne? Aktualnie, cel edukacji akademickiej sformułowany jest jednak bardzo ogól-nie, czyli powierzchownie i szeroko. Absolwent studiów licencjackich powinien
12 Ibidem. 13 Standardy kształcenia dla poszczególnych kierunków studiów i poziomów kształcenia,
Biuletyn Informacji Publicznej, Ministerstwo Nauki i Szkolnictwa Wyższego, www.mnisw.gov.pl, poz. 108, (23.10.2008); Regulamin Środowiskowych Studiów Doktoranckich w Akademii Wychowania Fizycznego we Wrocławiu, 2008, http://www.awf.wroc.pl, (23.10.2008).
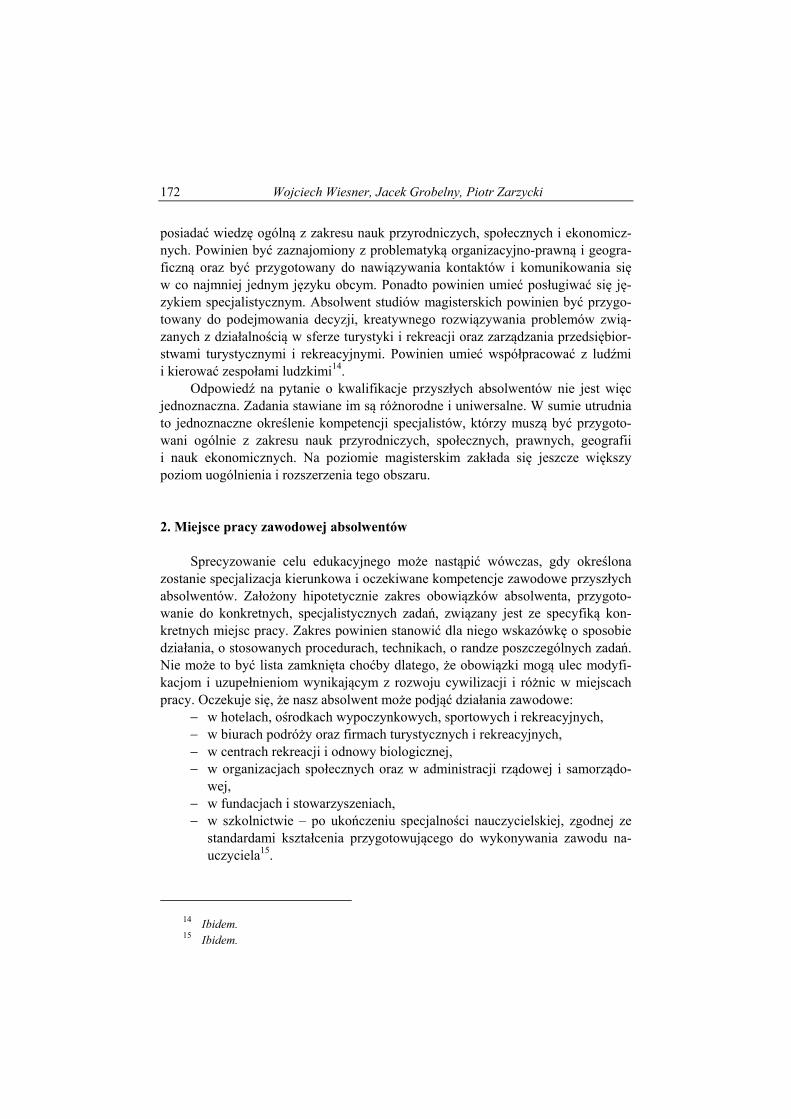
Wojciech Wiesner, Jacek Grobelny, Piotr Zarzycki 172
posiadać wiedzę ogólną z zakresu nauk przyrodniczych, społecznych i ekonomicz-nych. Powinien być zaznajomiony z problematyką organizacyjno-prawną i geogra-ficzną oraz być przygotowany do nawiązywania kontaktów i komunikowania się w co najmniej jednym języku obcym. Ponadto powinien umieć posługiwać się ję-zykiem specjalistycznym. Absolwent studiów magisterskich powinien być przygo-towany do podejmowania decyzji, kreatywnego rozwiązywania problemów zwią-zanych z działalnością w sferze turystyki i rekreacji oraz zarządzania przedsiębior-stwami turystycznymi i rekreacyjnymi. Powinien umieć współpracować z ludźmi i kierować zespołami ludzkimi14. Odpowiedź na pytanie o kwalifikacje przyszłych absolwentów nie jest więc jednoznaczna. Zadania stawiane im są różnorodne i uniwersalne. W sumie utrudnia to jednoznaczne określenie kompetencji specjalistów, którzy muszą być przygoto-wani ogólnie z zakresu nauk przyrodniczych, społecznych, prawnych, geografii i nauk ekonomicznych. Na poziomie magisterskim zakłada się jeszcze większy poziom uogólnienia i rozszerzenia tego obszaru. 2. Miejsce pracy zawodowej absolwentów Sprecyzowanie celu edukacyjnego może nastąpić wówczas, gdy określona zostanie specjalizacja kierunkowa i oczekiwane kompetencje zawodowe przyszłych absolwentów. Założony hipotetycznie zakres obowiązków absolwenta, przygoto-wanie do konkretnych, specjalistycznych zadań, związany jest ze specyfiką kon-kretnych miejsc pracy. Zakres powinien stanowić dla niego wskazówkę o sposobie działania, o stosowanych procedurach, technikach, o randze poszczególnych zadań. Nie może to być lista zamknięta choćby dlatego, że obowiązki mogą ulec modyfi-kacjom i uzupełnieniom wynikającym z rozwoju cywilizacji i różnic w miejscach pracy. Oczekuje się, że nasz absolwent może podjąć działania zawodowe:
w hotelach, ośrodkach wypoczynkowych, sportowych i rekreacyjnych, w biurach podróży oraz firmach turystycznych i rekreacyjnych, w centrach rekreacji i odnowy biologicznej, w organizacjach społecznych oraz w administracji rządowej i samorządo-
wej, w fundacjach i stowarzyszeniach, w szkolnictwie – po ukończeniu specjalności nauczycielskiej, zgodnej ze
standardami kształcenia przygotowującego do wykonywania zawodu na-uczyciela15.
14 Ibidem. 15 Ibidem.

Edukacja turystyczna studentów… 173
Przedsięwzięcia i zadania absolwenta mogą obejmować także prowadzenie własnej działalności gospodarczej i doradztwa, organizowanie działalności gospo-darstw agroturystycznych oraz przygotowywanie oferty turystycznej i rekreacyjnej dla różnych grup odbiorców16. „Amadeus, dostawca technologii i rozwiązań dystrybucyjnych dla branży turystycznej, zwraca uwagę na niski poziom nauczania na kierunkach turystycznych polskich uczelni wyższych”. „Najczęściej jako przyczyny negatywnych opinii wskazywano, że zdobyta wiedza jest teoretyczna i nieadekwatna do umiejętności wymaganych w praktyce. Mała ilość zajęć praktycznych sprawia, że absolwenci nie znają geografii (położenia obiektów, zabytków itp.) i nie potrafią obsługiwać sys-temów rezerwacyjnych”, „brak przygotowania absolwentów do pracy z klientem”, ponadto krytykuje się małą ilość godzin lektoratów języków obcych, niewielką liczbę przedmiotów ekonomicznych, a także obowiązkowych szkoleń z zakresu obsługi konkretnych systemów rezerwacyjnych17. Przytoczone wyżej opinie są wiarygodne, gdyż oparte są na opiniach doświad-czonych praktyków branży turystycznej. Diagnoza ta jest dla nas ważna, ponieważ może uchronić politykę edukacyjną naszej uczelni. 3. Kompetencje pedagogiczne specjalisty z turystyki Specjalista z turystyki jest dla podmiotu swoich oddziaływań zawodowych świadczeniodawcą czy usługodawcą. Ogranicza się wówczas jednak wyłącznie do wykonania usługi, jaką jest zorganizowanie konkretnego zadania z zakresu turysty-ki. W dobie ekonomicznego traktowania turystyki i rekreacji – usługa, produkt, towar, marketing, sprzedaż, handel, zysk, inwestycja, prawo, polityka – niepokoi wyraźny brak odniesienia do zasad rozwoju osobowości człowieka (pedagogika), do norm moralnych (etyka) czy do podstawowych wartości (aksjologia). Humanistyczny, a zwłaszcza pedagogiczny punkt widzenia zwraca uwagę na inny, bardzo ważny rodzaj relacji pomiędzy specjalistą a klientem. Nakazuje bo-wiem podmiotowe traktowanie klienta. To klient jako OSOBA jest postacią cen-tralną. On stawia sobie określony cel i godzi się na pokonywanie trudności w dro-dze do tego celu. On wreszcie odnosi określone korzyści z jego osiągnięcia. Musi-my bezwzględnie przyjąć, że turysta jest człowiekiem rozwijającym się, posiadają-cym niepowtarzalną osobowość, jest człowiekiem kierującym się swoimi motywa-mi, nastawieniami i emocjami, że to w końcu on będzie aktywnie wypoczywał. Z pedagogicznych założeń metodyki turystyki wynika konieczność uwzględnienia
16 Ibidem. 17 W. Wiesner, Strategia Działań Katedry Turystyki i Rekreacji, 2009–2012, AWF, Wro-
cław 2009. Przytoczona w dokumencie informacja opracowana została na podstawie W. Rozwa-dowski, Kadry w polskiej turystyce, 2009, http://konfraternia.bloog.pl.

Wojciech Wiesner, Jacek Grobelny, Piotr Zarzycki 174
działań o charakterze aksjologicznym i kreatywnym, kształtującym osobowość podmiotu korzystającego z usług. W tym znaczeniu można widzieć w specjaliście z turystyki kreatora, nauczyciela i wychowawcę. Uświadomienie sobie tej oczywi-stości stanowi jedną z najistotniejszych dyrektyw metodycznych turystyki. Przy takim założeniu absolwent turystyki – jako specjalista i pedagog – nie ogranicza się jedynie do wykonania usługi, ale wpływa pobudzająco na rozwój osobowości swego klienta. Specjalista w zakresie turystyki i rekreacji może dla podmiotu swoich oddziaływań w wielu sytuacjach być nauczycielem turystyki, krajoznawstwa, estetyki, ekologii czy przewodnikiem w świecie rekreacji. Może motywować, wpływać na zainteresowania, kształtować postawy moralne i wobec życia społecznego, własnego zdrowia, kultury fizycznej itp. Może pobudzać proces uczenia się, promować najwyższe wartości. Kompetencje pedagogiczne naszego absolwenta uświadamiają mu, że jest odpowiedzialny moralnie i wobec prawa za swoich podopiecznych. Od odpowiedzialności tej nie można się uwolnić. Odpowie-dzialność to bowiem nieustanna świadomość konsekwencji w zakresie bezpieczeń-stwa, jakie może spowodować działanie lub zaniechanie działania (np. niewypeł-nianie przyjętych obowiązków)18. Edukacyjne zadania specjalisty z turystyki realizowane są w sprzyjającym kontekście bogactwa naturalnych bodźców stymulujących wszechstronny rozwój osobowości człowieka (piękno przyrody, aktywność ruchowa, hartowanie, przeży-cia emocjonalne, kontakty społeczne, biologiczne i fizyczne oddziaływanie wielu bodźców na organizm, pokonywanie zagrożeń i własnych słabości itp.)19. 4. Edukacja ustawiczna w turystyce Edukacja ustawiczna stanowi kompleksowe ujęcie wszystkich procesów oświatowych zmierzających do możliwie wszechstronnego rozwoju osobowości, kształtowania określonych uzdolnień, zainteresowań i ogólnej sprawności umysło-wej. Obejmuje kształcenie na wszystkich szczeblach, od edukacji szkolnej, po wyż-sze studia oraz zdobywanie wiedzy i podwyższanie kwalifikacji w dojrzałym życiu człowieka20. Tym samym proces zdobywania kwalifikacji zawodowych w zakresie turysty-ki nie może ograniczyć się wyłącznie do okresu studiów na uczelni. Akademicka edukacja turystyczna musi funkcjonować w szerokim wymiarze społecznym, rów-nież poza uczelnią. Zainteresowania turystyczne kształtują się bowiem na długo
18 A. Pawłucki, op.cit.; W. Wiesner i in., Podstawy metodyczne edukacji ratowniczej, Ma-
trix, Olsztyn 2007. 19 K. Denek, Edukacja pozalekcyjna i pozaszkolna, WSPiA, Poznań 2009. 20 Wg definicji UNESCO, http://pl.wikipedia.org/wiki/Edukacja_ustawiczna, 9.01.2010.

Edukacja turystyczna studentów… 175
przed rozpoczęciem studiów, w środowisku rodzinnym, w gronie przyjaciół i w okresie szkolnym. To wówczas ma miejsce inicjacja turystyczna, której efektem jest decyzja o wyborze kierunku studiów. Pomiędzy wstępną inicjacją a dojrzałą decyzją o wyborze studiów trwa wieloletni proces rozwijania motywacji, emocji, procesów poznawczych, nabywania doświadczenia i umiejętności turystycznych, opanowywania technik oraz kompletowania niezbędnego wyposażenia do turystyki kwalifikowanej. Diagnoza tego przygotowania do aktywności turystycznej stanowi-łaby cenną informację o kandydatach na przyszłych specjalistów. Procedura rekru-tacji na studia rzadko sięga do tych informacji. Aktualne założenia programowe edukacji specjalistów z turystyki na naszej uczelni przewidują wprawdzie działania promocyjne wśród kandydatów na studia, ale są to dopiero pojedyncze inicjatywy21. Brak jest szerokiej akcji promującej stu-dia turystyczne, poprzedzonej preorientacją zawodową wśród młodzieży szkolnej, w tym wśród absolwentów szkół średnich, policealnych i licencjackich. A jest to w sumie ponad 100 szkół tylko w województwie dolnośląskim22. Efektem skutecznej edukacji jest aplikacja nabytej wiedzy i umiejętności w działalności zawodowej. Aktualne założenia programowe edukacji specjalistów z turystyki jednak zupełnie nie uwzględniają zachowań absolwentów po zakończe-niu studiów. Brak jest weryfikacji praktycznej kompetencji zawodowych absolwen-tów. Jak z tego wynika, autorzy programów dydaktycznych i nauczyciele akade-miccy nie dostrzegają potrzeby wykorzystania informacji zwrotnej o sukcesach lub o niepowodzeniach zawodowych absolwentów. Nie kontrolują efektów swojej pra-cy pedagogicznej. A przecież wnioski płynące z oceny poziomu przygotowania zawodowego modyfikują zwrotnie program i przebieg procesu edukacji. Idea edukacji ustawicznej postuluje oryginalną drogę rozwoju osobowości, uwzględniając indywidualne potrzeby osoby kształcącej się zarówno w okresie przed rozpoczęciem studiowania, jak i po zakończeniu edukacji akademickiej. Sku-teczność takiej edukacji wymaga opracowania oferty programowej w wymiarze pionowym, ale także poziomym i pogłębianiu swoich zainteresowań. 5. Poziom zawodowy kadry akademickiej Chcąc zabiegać o status dominującej placówki w dziedzinie kształcenia kadr dla turystyki, przynajmniej w swoim regionie, należy także rozwiązać poważny problem związany z kompetencjami kadry akademickiej. Kompetencje kadry trzeba rozpatrywać w dwóch płaszczyznach: naukowej i zawodowo-specjalistycznej.
21 Np. Salon Maturzystów. 22 Pentor Research International S.A., Oddział w Katowicach dla Ministerstwa Sportu i Tu-
rystyki, 2007.
Wojciech Wiesner, Jacek Grobelny, Piotr Zarzycki 176
Samodzielna kadra naukowa jest podstawą dla wszechstronnego rozwoju uczelni i nie wymaga to komentarzy. Poziom edukacji akademickiej zależy bowiem od liczby i poziomu kwalifikacji naukowych kadry profesorskiej. Jest to poza tym bezwzględny wymóg formalny, warunkujący istnienie placówki akademickiej23. Wzrost liczby szkół kształcących kadry turystyczne zwiększa popyt na profesorów, którzy już dziś stanowią swoisty „towar reglamentowany”. Brak samodzielnej ka-dry naukowej lub ograniczona liczba profesorów wypromowanych z własnego grona musi być uzupełniana pracownikami spoza uczelni. Praktyka taka może ograniczać jednak efektywność naukową i dydaktyczną samodzielnych pracowni-ków zatrudnionych w drugim miejscu pracy. Obawy wzbudza także poziom fachowości kadry akademickiej. Dyrektor Biura Zarządu Warszawskiej Izby Turystyki, Wiesław Piegat, stwierdza, że „wy-kładowcy na uczelniach nie zawsze są praktykami wykładanych przedmiotów. W konsekwencji nie budują proaktywnej postawy wśród studentów, nie ukierun-kowują ich na samokształcenie. To wszystko prowadzi do sytuacji, że młody ab-solwent turystyki i rekreacji nie identyfikuje się z tym kierunkiem i zawodem, a odbywane wcześniej praktyki w biurach podróży zniechęcają co bardziej ambit-nych do pracy w tym zawodzie"24. Z przytoczoną diagnozą praktyka branży turystycznej być może można pole-mizować, trzeba jednak uwzględnić ten punkt widzenia. A jest to opinia ważna, gdyż pozwala ocenić skuteczność edukacji akademickiej. Otrzymana informacja wskazuje kierunek doskonalenia i podwyższania poziomu nauczycieli akademic-kich kształcących kadry dla turystyki. Podsumowanie 1. W procesie edukacji turystycznej, realizowanej m.in. w Akademii Wychowania
Fizycznego we Wrocławiu, stwierdzamy wiele niedoskonałości. Do podstawo-wych zastrzeżeń zaliczyć należy nadmierne akcentowanie aspektów ekono-micznych, kosztem oddalenia się od myślenia o turystyce w kategoriach warto-ści i kreacji.
2. Specyfika pracy zawodowej w turystyce implikuje kompetencje specjalisty, które należy przełożyć na cele i treści programów edukacyjnych. Postulujemy, aby wśród celów ukierunkowanych na kompetencje stricte turystyczne, uwzględnić także kompetencje pedagogiczne absolwentów.
23 Ustawa z dnia 27 lipca 2005 r. Prawo o szkolnictwie wyższym, Dz.U. 2005, nr 164, poz.
1365 z późniejszymi zmianami. 24 W. Wiesner, op.cit. Przytoczona w dokumencie informacja opracowana została na pod-
stawie W. Rozwadowski, Kadry w polskiej turystyce, 2009, http://konfraternia.bloog.pl.

Edukacja turystyczna studentów… 177
3. Idea edukacji ustawicznej postuluje oryginalną drogę rozwoju osobowości, uwzględniając indywidualne potrzeby osoby kształcącej się zarówno w okresie przed rozpoczęciem studiowania, jak i po zakończeniu edukacji akademickiej. Dostrzegamy brak odniesienia do procesu edukacji ustawicznej, zwłaszcza w sferze naboru na studia i sferze kontroli efektów edukacyjnych.
4. Dynamika rozwoju gałęzi turystycznych stawia wysokie standardy zawodowe i naukowe przed kadrą akademicką. Aktualna polityka kadrowa nie sprzyja cał-kowitemu wypełnianiu tych standardów.
5. Ukazane niedoskonałości edukacji akademickiej z chwilą ich zdiagnozowania stanowią szansę na skuteczną korektę i wzrost skuteczności kształcenia studen-tów w omawianej dziedzinie.
TOURISTISCHE BILDUNG DER STUDENTEN AN DER SPORTHOCHSCHULE WROCŁAW - PÄDAGOGISCHE REFLEXIONEN
Zusammenfassung Akademische Bildung im Bereich der Touristik erfolgt in Polen in über 60 Bil-dungsstellen. In der Woiwodschaft Niederschlesien gibt es sieben Hochschulen, die den Tourismus und Freizeit in ihrem Programm anbieten, und darunter die Sporthochschule in Wrocław. Im Prozess der touristischen Bildung werden viele Unvollkommenheiten festgestellt, was aber eine Chance für eine effektive Korrektur und Entwicklungsmög-lichkeit darstellt. Zu Grundbedenken sind unpräzise Bestimmung der Bildungsziele sowie fehlender Bezug auf den Prozess der permanenten Bildung, insbesondere bei der Studienaufnahme und bei der Kontrolle der Bildungsergebnisse, zu zählen. Diese Bear-beitung stellt eine Bewertungsprobe von Voraussetzungen der Bildung im Bereich des Tourismus vom Standpunkt der Effektivität dieses pädagogischen Prozesses dar. Das Ziel dieses Artikels ist eine Darstellung der Bereiche am Beispiel der Sporthochschule in Wrocław, in denen ungelöste didaktische Probleme im Zusammenhang mit der Bil-dung der Studenten in der Abteilung Tourismus und Freizeit auftreten. Voraussetzungen der akademischen Bildung müssen Postulate der Didaktik erfüllen. Das Subjekt dieser Bildung sind der Student und akademische Lehrer mit Professoren an der Spitze, und in weiterer Perspektive auch der Tourist – Empfänger der Leistungen, die durch Absolven-ten angeboten werden. Wir postulieren, dass unter den Zielen orientiert an streng touris-tischen Kompetenzen auch pädagogische Kompetenzen berücksichtigt werden. Eine Alternative für das Denken an den Tourismus in Kategorien des Produktes und des Gewinns ist das Denken in Kategorien des Wertes und der Kreation.
Übersetzt von Beata Zdrzalik-Grobelna