
TUI AG FINANCIAL YEAR 2012/13
52
Aktiengesellschaft TUI AG FINANCIAL YEAR 2012/13 Interim Report 1 October 2012 – 30 June 2013
Transcript of TUI AG FINANCIAL YEAR 2012/13

Aktiengesellschaft
TUI AG F INANCIAL YEAR 2012/13Interim Report 1 October 2012 – 30 June 2013
TABLE OF CONTENTS
MANAGEMENT REPORT
1 TUIGroup–financialhighlights 2 Economicsituation 2 Generaleconomicsituation 2 Groupstructureandstrategy 3 Developmentintheperiodunderreview 4 EarningsbytheSectors 7 TUITravel11 TUIHotels&Resorts16 Cruises19 CentralOperations20 Consolidatedearnings23 Netassetsandfinancialposition24 Othersegmentindicators26 Riskandopportunityreport27 Outlook27 Economicframework28 Expecteddevelopmentofearnings30 Developmentofthefinancial position30 OverallassessmentoftheGroup’s expecteddevelopment31 CorporateGovernance
INTERIMFINANCIALSTATEMENTS
32 IncomestatementoftheTUIGroup33 Condensedstatementofcomprehensive
incomeoftheTUIGroup34 FinancialpositionoftheTUIGroup35 Condensedstatementsofchanges
inequityoftheTUIGroup36 Condensedcashflowstatement
oftheTUIGroup
NOTES
37 Accountingprinciples38 Groupofconsolidatedcompanies38 Acquisitions–divestments40 NotestotheTUIGroup’sincomestatement43 Notestothefinancialpositionofthe
TUI Group44 Changesinequity45 Contingentliabilities45 Otherfinancialliabilities45 Notestothecashflowstatementofthe
TUI Group46 Segmentindicators47 Relatedparties
48 Financialcalendar48 Cautionarystatement Imprint
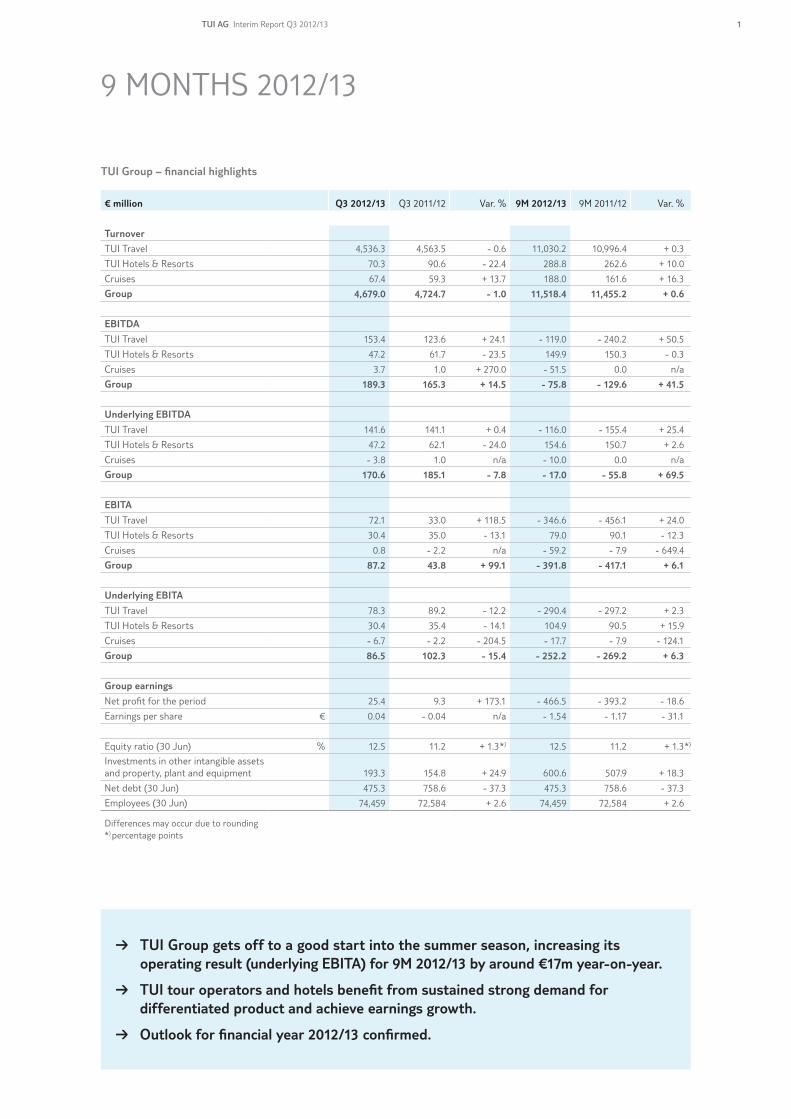
TUI Group – financial highlights
€ million Q3 2012/13 Q3 2011/12 Var. % 9M 2012/13 9M 2011/12 Var. %
Turnover
TUI Travel 4,536.3 4,563.5 - 0.6 11,030.2 10,996.4 + 0.3
TUI Hotels & Resorts 70.3 90.6 - 22.4 288.8 262.6 + 10.0
Cruises 67.4 59.3 + 13.7 188.0 161.6 + 16.3
Group 4,679.0 4,724.7 - 1.0 11,518.4 11,455.2 + 0.6
EBITDA
TUI Travel 153.4 123.6 + 24.1 - 119.0 - 240.2 + 50.5
TUI Hotels & Resorts 47.2 61.7 - 23.5 149.9 150.3 - 0.3
Cruises 3.7 1.0 + 270.0 - 51.5 0.0 n/a
Group 189.3 165.3 + 14.5 - 75.8 - 129.6 + 41.5
Underlying EBITDA
TUI Travel 141.6 141.1 + 0.4 - 116.0 - 155.4 + 25.4
TUI Hotels & Resorts 47.2 62.1 - 24.0 154.6 150.7 + 2.6
Cruises - 3.8 1.0 n/a - 10.0 0.0 n/a
Group 170.6 185.1 - 7.8 - 17.0 - 55.8 + 69.5
EBITA
TUI Travel 72.1 33.0 + 118.5 - 346.6 - 456.1 + 24.0
TUI Hotels & Resorts 30.4 35.0 - 13.1 79.0 90.1 - 12.3
Cruises 0.8 - 2.2 n/a - 59.2 - 7.9 - 649.4
Group 87.2 43.8 + 99.1 - 391.8 - 417.1 + 6.1
Underlying EBITA
TUI Travel 78.3 89.2 - 12.2 - 290.4 - 297.2 + 2.3
TUI Hotels & Resorts 30.4 35.4 - 14.1 104.9 90.5 + 15.9
Cruises - 6.7 - 2.2 - 204.5 - 17.7 - 7.9 - 124.1
Group 86.5 102.3 - 15.4 - 252.2 - 269.2 + 6.3
Group earnings
Net profit for the period 25.4 9.3 + 173.1 - 466.5 - 393.2 - 18.6
Earnings per share € 0.04 - 0.04 n/a - 1.54 - 1.17 - 31.1
Equity ratio (30 Jun) % 12.5 11.2 + 1.3 *) 12.5 11.2 + 1.3*)
Investments in other intangible assets and property, plant and equipment 193.3 154.8 + 24.9 600.6 507.9 + 18.3
Net debt (30 Jun) 475.3 758.6 - 37.3 475.3 758.6 - 37.3
Employees (30 Jun) 74,459 72,584 + 2.6 74,459 72,584 + 2.6
Differences may occur due to rounding*) percentage points
B TUI Group gets off to a good start into the summer season, increasing its ope rating result (underlying EBITA) for 9M 2012/13 by around €17m year-on-year.
B TUI tour operators and hotels benefit from sustained strong demand for differentiated product and achieve earnings growth.
B Outlook for financial year 2012/13 confirmed.
9 MONTHS 2012/13
TUI AG Interim Report Q3 2012/13 1
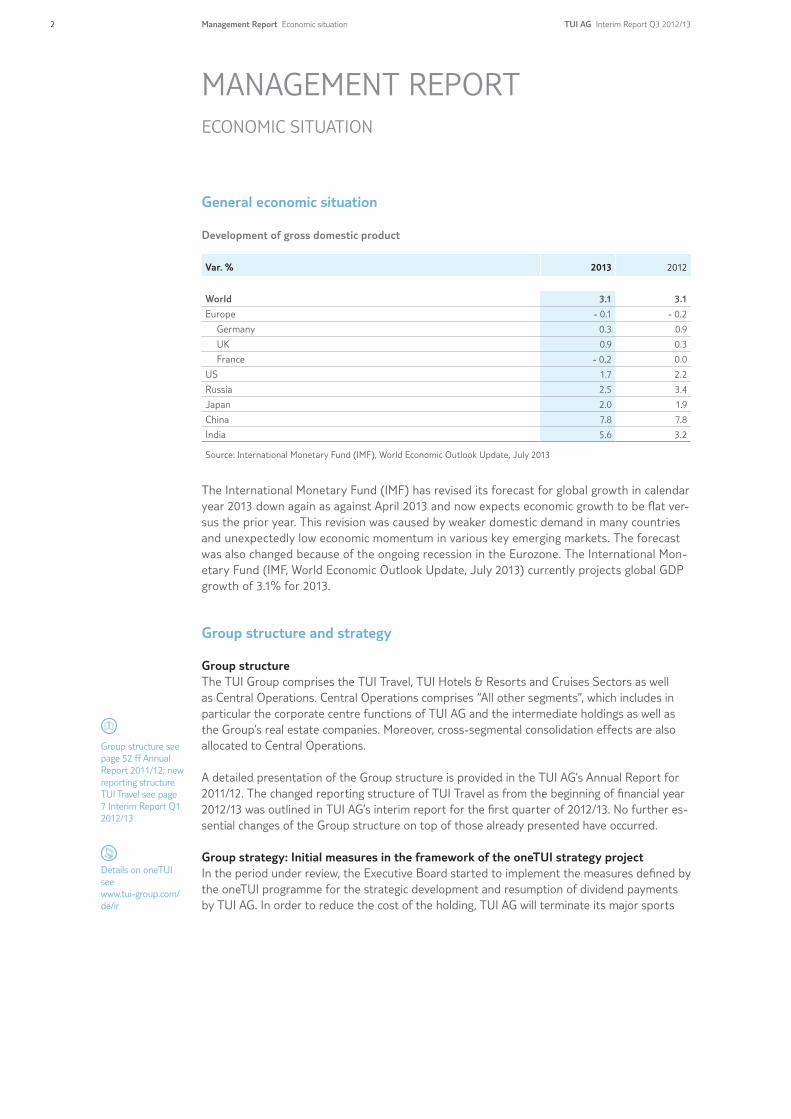
General economic situation Development of gross domestic product
Var. % 2013 2012
World 3.1 3.1
Europe - 0.1 - 0.2
Germany 0.3 0.9
UK 0.9 0.3
France - 0.2 0.0
US 1.7 2.2
Russia 2.5 3.4
Japan 2.0 1.9
China 7.8 7.8
India 5.6 3.2
Source: International Monetary Fund (IMF), World Economic Outlook Update, July 2013
The International Monetary Fund (IMF) has revised its forecast for global growth in calendar year 2013 down again as against April 2013 and now expects economic growth to be flat ver-sus the prior year. This revision was caused by weaker domestic demand in many countries and unexpectedly low economic momentum in various key emerging markets. The forecast was also changed because of the ongoing recession in the Eurozone. The International Mon-etary Fund (IMF, World Economic Outlook Update, July 2013) currently projects global GDP growth of 3.1% for 2013.
Group structure and strategy
Group structureThe TUI Group comprises the TUI Travel, TUI Hotels & Resorts and Cruises Sectors as well as Central Operations. Central Operations comprises “All other segments”, which includes in particular the corporate centre functions of TUI AG and the intermediate holdings as well as the Group’s real estate companies. Moreover, cross-segmental consolidation effects are also allocated to Central Operations.
A detailed presentation of the Group structure is provided in the TUI AG’s Annual Report for 2011/12. The changed reporting structure of TUI Travel as from the beginning of financial year 2012/13 was outlined in TUI AG’s interim report for the first quarter of 2012/13. No further es-sential changes of the Group structure on top of those already presented have occurred.
Group strategy: Initial measures in the framework of the oneTUI strategy project In the period under review, the Executive Board started to implement the measures defined by the oneTUI programme for the strategic development and resumption of dividend payments by TUI AG. In order to reduce the cost of the holding, TUI AG will terminate its major sports
MANAGEMENT REPORTECONOMIC SITUATION
Group structure see page 52 ff Annual Report 2011/12; new reporting structure TUI Travel see page 7 Interim Report Q1 2012/13
Details on oneTUI see www.tui-group.com/de/ir
2 Management Report Economic situation TUI AG Interim Report Q3 2012/13

sponsorship activities upon expiry of the contracts concerned. In July 2013, the Company also adopted a reconciliation of interests and a social plan, under which the headcount in the Group holding will be halved from around 200 to around 90 employees by mid-2014.
Research and developmentAs a tourism service provider, TUI does not engage in research and development in the nar-row sense. Information on innovation activities by Group companies is provided in the Annual Report.
Development in the period under review
TUI Group gets off to a good start into the summer season 2013. Underlying Group EBITA up by €17.0m for 9M 2012/13 The TUI Group has recorded a successful start into the summer season 2013. The Group’s sea-sonal loss (underlying EBITA) declined by €17.0m in the first nine months of 2012/13 as against the prior year. The accumulated underlying EBITA for the first nine months of €-252.2m includes the cost of the change in estimate in empty leg accounting in TUI Travel worth €31.0m that will balance out in the fourth quarter of 2012/13, so that there will be no full-year cost impact for 2012/13.
TUI Travel’s seasonal loss (underlying EBITA) improved by €6.8m year-on-year to €-290.4m in the first nine months of 2012/13, in particular due to the sound performance by TUI tour opera-tors in the UK and the Nordics.
In the first nine months of 2012/13, TUI Hotels & Resorts posted an increase in underlying earnings of €14.4m to €104.9m year-on-year.
At €-17.7m, underlying earnings by the Cruises Sector was €9.8m down year-on-year. While Hapag-Lloyd Kreuzfahrten remained affected by start-up costs for the market launch of the new Europa 2, TUI Cruises managed to continue the very successful performance of the prior year.
In the first nine months of 2012/13, underlying EBITA by Central Operations rose by €5.6m to €-49.0m as against the prior year.
TUI Group business activity and strategy see page 57 ff Annual Report 2011/12
R&D see page 85 ff Annual Report 2011/12
Management Report Economic situationTUI AG Interim Report Q3 2012/13 3
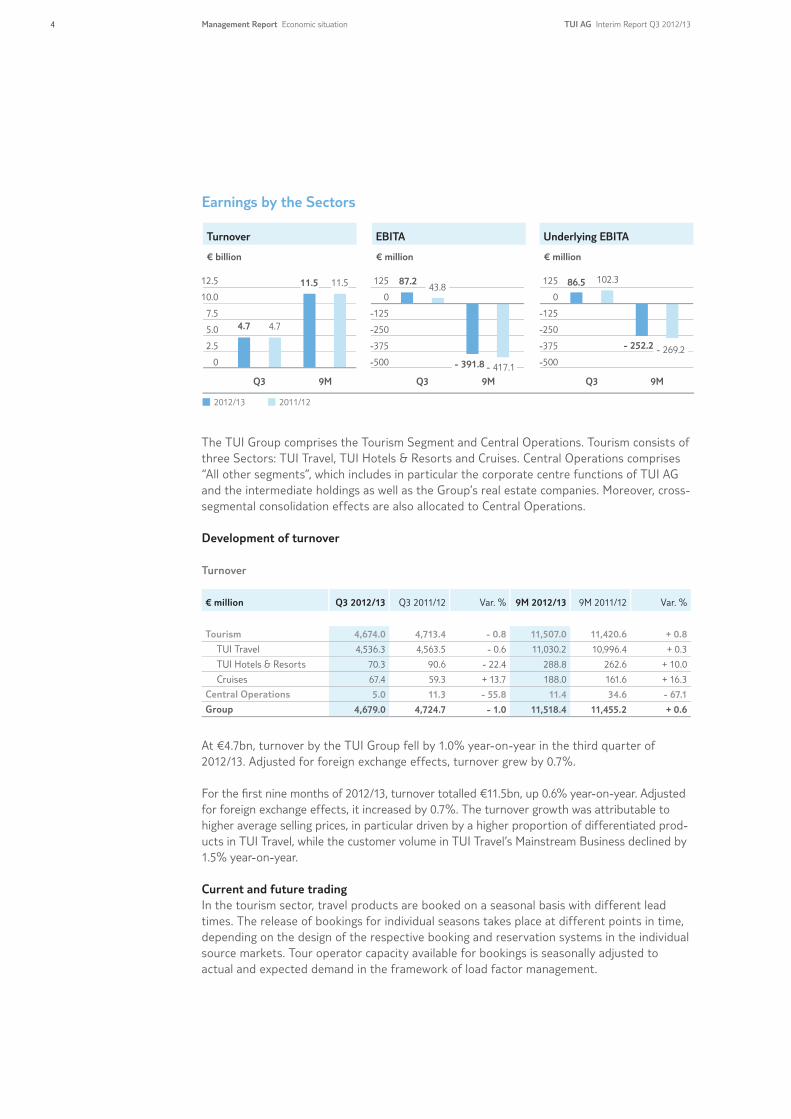
Earnings by the Sectors
Turnover EBITA Underlying EBITA
€ billion € million€ million
2012/13 2011/12
Q3 9M Q3 9MQ3 9M
-500
-375
-250
-125
0
125
-500
-375
-250
-125
0
125
0
2.5
5.0
7.5
10.0
12.5
4.7
43.8
- 417.1
4.7
11.5 11.5 102.3
- 269.2
86.5
- 252.2
87.2
- 391.8
The TUI Group comprises the Tourism Segment and Central Operations. Tourism consists of three Sectors: TUI Travel, TUI Hotels & Resorts and Cruises. Central Operations comprises “All other segments”, which includes in particular the corporate centre functions of TUI AG and the intermediate holdings as well as the Group’s real estate companies. Moreover, cross-segmental consolidation effects are also allocated to Central Operations.
Development of turnover
Turnover
€ million Q3 2012/13 Q3 2011/12 Var. % 9M 2012/13 9M 2011/12 Var. %
Tourism 4,674.0 4,713.4 - 0.8 11,507.0 11,420.6 + 0.8
TUI Travel 4,536.3 4,563.5 - 0.6 11,030.2 10,996.4 + 0.3
TUI Hotels & Resorts 70.3 90.6 - 22.4 288.8 262.6 + 10.0
Cruises 67.4 59.3 + 13.7 188.0 161.6 + 16.3
Central Operations 5.0 11.3 - 55.8 11.4 34.6 - 67.1
Group 4,679.0 4,724.7 - 1.0 11,518.4 11,455.2 + 0.6
At €4.7bn, turnover by the TUI Group fell by 1.0% year-on-year in the third quarter of 2012/13. Adjusted for foreign exchange effects, turnover grew by 0.7%.
For the fi rst nine months of 2012/13, turnover totalled €11.5bn, up 0.6% year-on-year. Adjusted for foreign exchange effects, it increased by 0.7%. The turnover growth was attri butable to higher average selling prices, in particular driven by a higher proportion of differen tiated prod-ucts in TUI Travel, while the customer volume in TUI Travel’s Mainstream Business declined by 1.5% year-on-year.
Current and future tradingIn the tourism sector, travel products are booked on a seasonal basis with different lead times. The release of bookings for individual seasons takes place at different points in time, depending on the design of the respective booking and reservation systems in the individual source markets. Tour operator capacity available for bookings is seasonally adjusted to actual and expected demand in the framework of load factor management.
4 Management Report Economic situation TUI AG Interim Report Q3 2012/13

In July 2013, current trading by TUI Travel for the completed winter season 2012/13 and the current summer season 2013 was as follows as against the prior-year levels. Current trading TUI Travel Mainstream
Winter season 2012/13 Summer season 2013
Var. %Average
selling price Total salesTotal cus-
tomersAverage
selling price Total salesTotal cus-
tomers
Germany + 9 + 3 - 5 + 8 + 2 - 5
UK & Ireland + 6 + 5 – + 7 + 11 + 4
Nordics + 5 + 10 + 5 + 3 + 10 + 7
France (tour operators) + 7 - 25 - 29 + 3 - 20 - 22
Other countries + 1 + 1 – + 2 + 1 - 1
Total + 6 + 2 - 4 + 6 + 4 - 2
As at 28 July 2013
Development of earnings
Underlying EBITA
€ million Q3 2012/13 Q3 2011/12 Var. % 9M 2012/13 9M 2011/12 Var. %
Tourism 102.0 122.4 - 16.7 - 203.2 - 214.6 + 5.3
TUI Travel 78.3 89.2 - 12.2 - 290.4 - 297.2 + 2.3
TUI Hotels & Resorts 30.4 35.4 - 14.1 104.9 90.5 + 15.9
Cruises - 6.7 - 2.2 - 204.5 - 17.7 - 7.9 - 124.1
Central Operations - 15.5 - 20.1 + 22.9 - 49.0 - 54.6 + 10.3
Group 86.5 102.3 - 15.4 - 252.2 - 269.2 + 6.3
EBITA
€ million Q3 2012/13 Q3 2011/12 Var. % 9M 2012/13 9M 2011/12 Var. %
Tourism 103.3 65.8 + 57.0 - 326.8 - 373.9 + 12.6
TUI Travel 72.1 33.0 + 118.5 - 346.6 - 456.1 + 24.0
TUI Hotels & Resorts 30.4 35.0 - 13.1 79.0 90.1 - 12.3
Cruises 0.8 - 2.2 n/a - 59.2 - 7.9 - 649.4
Central Operations - 16.1 - 22.0 + 26.8 - 65.0 - 43.2 - 50.5
Group 87.2 43.8 + 99.1 - 391.8 - 417.1 + 6.1
In order to explain and evaluate the operating performance by the Sectors, earnings adjusted for one-off effects (underlying EBITA) are presented below. Underlying earnings have been adjusted for gains on disposal of investments, expenses in the framework of restructuring measures, essentially scheduled amortisation of intangible assets from purchase price alloca-tions and other expenses for and income from one-off items.
Management Report Economic situationTUI AG Interim Report Q3 2012/13 5

Underlying EBITA: TUI Group
€ million Q3 2012/13 Q3 2011/12 Var. % 9M 2012/13 9M 2011/12 Var. %
EBITA 87.2 43.8 + 99.1 - 391.8 - 417.1 + 6.1
Gains on disposal + 1.5 – + 1.5 –
Restructuring + 3.9 + 7.6 + 29.4 + 57.6
Purchase price allocation + 19.1 + 15.0 + 56.1 + 55.7
Other one-off items - 25.2 + 35.9 + 52.6 + 34.6
Underlying EBITA 86.5 102.3 - 15.4 - 252.2 - 269.2 + 6.3
In the third quarter of 2012/13, the TUI Group’s EBITA adjusted for one-off effects declined by 15.4% or €15.8m year-on-year to €86.5m. The TUI Group’s accumulated underlying earnings for the first nine months of 2012/13 were negative for seasonal reasons; they totalled €-252.2m, up €17.0m year-on-year. Both earnings for the third quarter and accumulated earnings for the first nine months were impacted by the change in the estimate for empty leg accounting in TUI Travel worth €13m and €31m, respectively. The accumulated cost resulting from the change in the estimate for empty leg accounting will balance out in the fourth quarter of 2012/13 so that there will be no full-year impact for 2012/13.
In the first nine months of 2012/13, net expenses of €139.6m had to be carried as adjustments. Apart from expenses for purchase price allocations, they included in particular
• restructuring costs in TUI Travel and TUI AG for the conversion of the corporate centres, and • net one-off expenses, resulting from e.g. the impairment of a hotel project and a provision
for impending losses from onerous contracts in the Cruises Sector, partly offset by income from the curtailment and settlement of pension plans of TUI Nederland.
Reported EBITA for the first nine months of 2012/13 was seasonally negative; it totalled €-391.8m, an improvement of €25.3m year-on-year.
6 Management Report Economic situation TUI AG Interim Report Q3 2012/13
TUI Travel
Turnover EBITA Underlying EBITA
€ billion € million€ million
2012/13 2011/12
Q3 9M Q3 9MQ3 9M
6.4
-480
-360
-240
-120
0
120
-480
-360
-240
-120
0
120
4.6
89.211.011.0
0.0
2.5
5.0
7.5
10.0
12.533.0
- 456.1
4.5
- 297.2
72.1
- 346.6
78.3
- 290.4
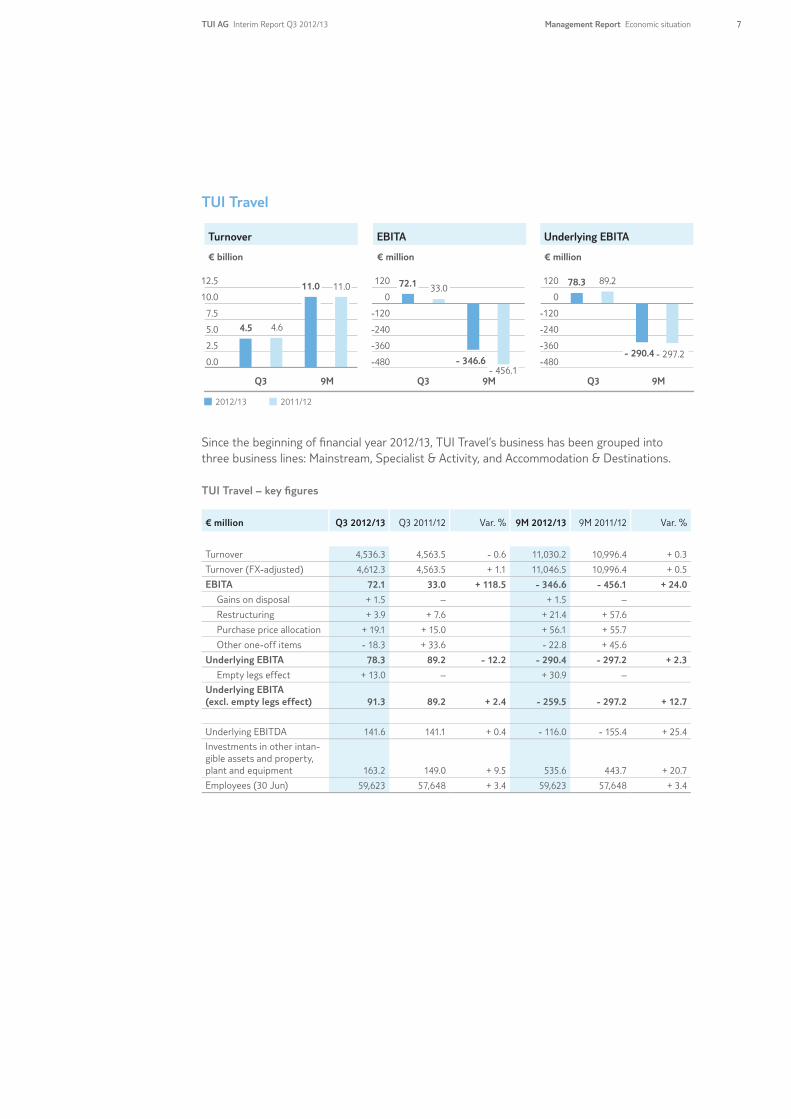
Since the beginning of fi nancial year 2012/13, TUI Travel’s business has been grouped into three business lines: Mainstream, Specialist & Activity, and Accommodation & Destinations.
TUI Travel – key fi gures
€ million Q3 2012/13 Q3 2011/12 Var. % 9M 2012/13 9M 2011/12 Var. %
Turnover 4,536.3 4,563.5 - 0.6 11,030.2 10,996.4 + 0.3
Turnover (FX-adjusted) 4,612.3 4,563.5 + 1.1 11,046.5 10,996.4 + 0.5
EBITA 72.1 33.0 + 118.5 - 346.6 - 456.1 + 24.0
Gains on disposal + 1.5 – + 1.5 –
Restructuring + 3.9 + 7.6 + 21.4 + 57.6
Purchase price allocation + 19.1 + 15.0 + 56.1 + 55.7
Other one-off items - 18.3 + 33.6 - 22.8 + 45.6
Underlying EBITA 78.3 89.2 - 12.2 - 290.4 - 297.2 + 2.3
Empty legs effect + 13.0 – + 30.9 –
Underlying EBITA (excl. empty legs effect) 91.3 89.2 + 2.4 - 259.5 - 297.2 + 12.7
Underlying EBITDA 141.6 141.1 + 0.4 - 116.0 - 155.4 + 25.4
Investments in other intan-gible assets and property, plant and equipment 163.2 149.0 + 9.5 535.6 443.7 + 20.7
Employees (30 Jun) 59,623 57,648 + 3.4 59,623 57,648 + 3.4
Management Report Economic situationTUI AG Interim Report Q3 2012/13 7
TurnoverTurnover accounted for by TUI Travel declined by 0.6% year-on-year in the third quarter of 2012/13. It was up 1.1% on the prior year on a constant currency basis.
For the first nine months of 2012/13, turnover rose by 0.3% year-on-year. Adjusted for foreign exchange effects, it grew by 0.5% on the prior year. While customer numbers in the Mainstream Business declined by 2.0%, the turnover growth was above all attributable to higher average sell-ing prices resulting from a higher proportion of sales of differentiated product.
EarningsIn order to enhance comparability, the table above additionally shows underlying EBITA by TUI Travel prior to effects resulting from a change in the estimate for empty leg accounting. The accumulated effects resulting from the change in the estimate for empty leg account-ing will balance out in the fourth quarter of 2012/13 so that there will be no full-year cost impact for financial year 2012/13.
TUI Travel started off well into the summer season 2013. Underlying EBITA excluding empty legs increased by €2.1m year-on-year in the third quarter of 2012/13 despite the earlier timing of Easter this year.
For the first nine months of 2012/13, underlying EBITA excluding empty legs also improved year-on-year; it grew by €37.7m year-on-year to €-259.5m. This was mainly attributable to the sound performance in the UK and the Nordics as well as cost savings and operational improvements from the business improvement programmes implemented in France and Germany.
In the first nine months of 2012/13, TUI Travel had to carry adjustments for expenses worth €56.2m on balance for the following one-off effects (previous year net expenses of €158.9m):
• gains on disposal of €1.5m• restructuring costs of €21.4m, in particular for the restructuring of tour operator activities in
Austria and the Specialist & Activity Business• effects of purchase price allocations worth €56.1m, and• one-off expenses worth €22.8m on balance, including income from the curtailment and
settlement of pension plans in the Netherlands
Due to the sound operating performance and lower net one-off expenses, reported earnings (EBITA) by TUI Travel rose by €39.1m versus the prior year to €72.1m in the third quarter of 2012/13. Accumulated reported earnings for the first nine months of 2012/13 grew by €109.5m year-on-year to €-346.6m.
8 Management Report Economic situation TUI AG Interim Report Q3 2012/13
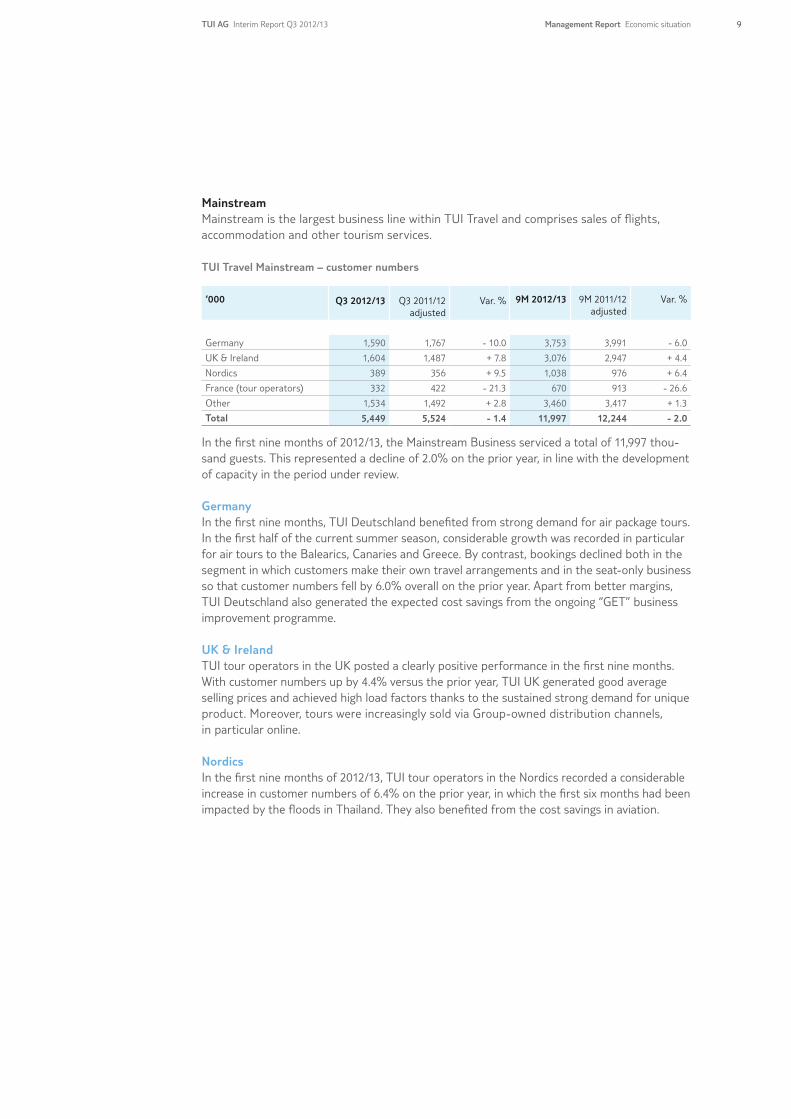
Mainstream Mainstream is the largest business line within TUI Travel and comprises sales of flights, accommodation and other tourism services.
TUI Travel Mainstream – customer numbers
‘000 Q3 2012/13 Q3 2011/12adjusted
Var. % 9M 2012/13 9M 2011/12adjusted
Var. %
Germany 1,590 1,767 - 10.0 3,753 3,991 - 6.0
UK & Ireland 1,604 1,487 + 7.8 3,076 2,947 + 4.4
Nordics 389 356 + 9.5 1,038 976 + 6.4
France (tour operators) 332 422 - 21.3 670 913 - 26.6
Other 1,534 1,492 + 2.8 3,460 3,417 + 1.3
Total 5,449 5,524 - 1.4 11,997 12,244 - 2.0
In the first nine months of 2012/13, the Mainstream Business serviced a total of 11,997 thou-sand guests. This represented a decline of 2.0% on the prior year, in line with the development of capacity in the period under review.
Germany In the first nine months, TUI Deutschland benefited from strong demand for air package tours. In the first half of the current summer season, considerable growth was recorded in particular for air tours to the Balearics, Canaries and Greece. By contrast, bookings declined both in the segment in which customers make their own travel arrangements and in the seat-only business so that customer numbers fell by 6.0% overall on the prior year. Apart from better margins, TUI Deutschland also generated the expected cost savings from the ongoing “GET” business improvement programme.
UK & IrelandTUI tour operators in the UK posted a clearly positive performance in the first nine months. With customer numbers up by 4.4% versus the prior year, TUI UK generated good average selling prices and achieved high load factors thanks to the sustained strong demand for unique product. Moreover, tours were increasingly sold via Group-owned distribution channels, in particular online.
NordicsIn the first nine months of 2012/13, TUI tour operators in the Nordics recorded a considerable increase in customer numbers of 6.4% on the prior year, in which the first six months had been impacted by the floods in Thailand. They also benefited from the cost savings in aviation.
Management Report Economic situationTUI AG Interim Report Q3 2012/13 9

FranceIn the light of the persistent weakness of the French travel market and subdued demand for North Africa, TUI France cancelled unprofitable routes and destinations and hence considerably reduced its capacity in the first nine months 2012/13. Despite a year-on-year decline of 26.6% in customer numbers, TUI France showed a positive development as against the prior year due to the capacity cuts and the cost savings achieved in the framework of the Convergence project.
Other In the first nine months, TUI tour operators in Canada, Belgium and Russia recorded im-provements in their performance year-on-year. The Corsair airline benefited from a more attractive flight schedule, the modernisation of its fleet implemented in the framework of the Takeoff project and the conclusion of the new code share agreement with Air Carïbes. Due to strong price competition in the Netherlands, TUI Nederland reported lower margins. Overall, Other countries recorded a slight increase in customer numbers.
Specialist & ActivityThe Specialist & Activity Business comprises tour operators in six divisions: Adventure, North American Specialist, Education, Sport, Marine and Specialist Holiday Group.
Overall, the Business Line reported a weaker performance as against the prior year. While a positive effect for the first nine months of 2012/13 was created by sound demand for skiing tours in the winter season and the rise in the business volume by the Adventure tour operators, the Sports and Marine Divisions, in particular, reported declines on the previous year.
Accommodation and Destinations (A&D)The A&D Business, which comprises the online services and incoming agencies of TUI Travel, showed an overall weaker performance in the first nine months of 2012/13. The expansion of B2C portals in Asia and South America created an adverse effect, only partly offset by volume growth in the B2B portals, in particular in Latin America and Asia. The performance of the incoming agencies was flat overall year-on-year.
10 Management Report Economic situation TUI AG Interim Report Q3 2012/13
TUI Hotels & Resorts
Turnover EBITA Underlying EBITA
€ million € million€ million
2012/13 2011/12
Q3 9M Q3 9MQ3 9M
0
20
40
60
80
0
25
50
75
100
125
0
60
120
180
300
35.0
79.0262.6
288.8
70.3 90.6
100
30.4
90.1
35.4
104.990.5
30.4
240
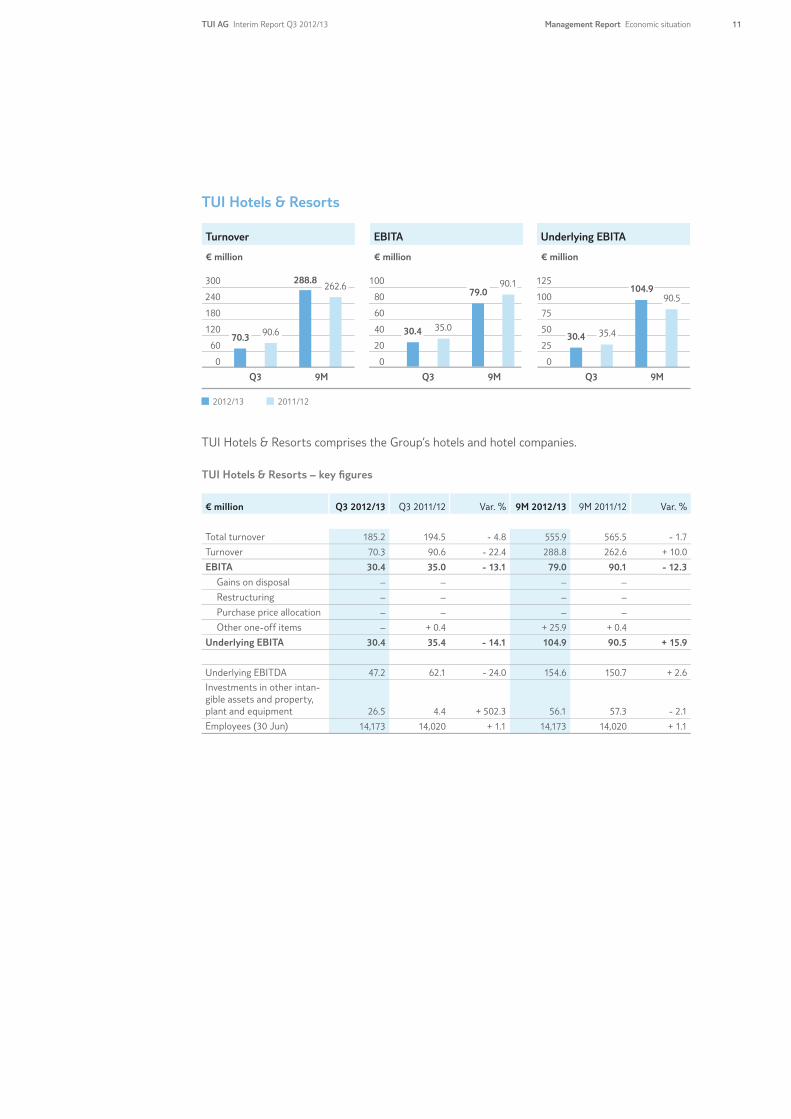
TUI Hotels & Resorts comprises the Group’s hotels and hotel companies.
TUI Hotels & Resorts – key fi gures
€ million Q3 2012/13 Q3 2011/12 Var. % 9M 2012/13 9M 2011/12 Var. %
Total turnover 185.2 194.5 - 4.8 555.9 565.5 - 1.7
Turnover 70.3 90.6 - 22.4 288.8 262.6 + 10.0
EBITA 30.4 35.0 - 13.1 79.0 90.1 - 12.3
Gains on disposal – – – –
Restructuring – – – –
Purchase price allocation – – – –
Other one-off items – + 0.4 + 25.9 + 0.4
Underlying EBITA 30.4 35.4 - 14.1 104.9 90.5 + 15.9
Underlying EBITDA 47.2 62.1 - 24.0 154.6 150.7 + 2.6
Investments in other intan-gible assets and property, plant and equipment 26.5 4.4 + 502.3 56.1 57.3 - 2.1
Employees (30 Jun) 14,173 14,020 + 1.1 14,173 14,020 + 1.1
Management Report Economic situationTUI AG Interim Report Q3 2012/13 11
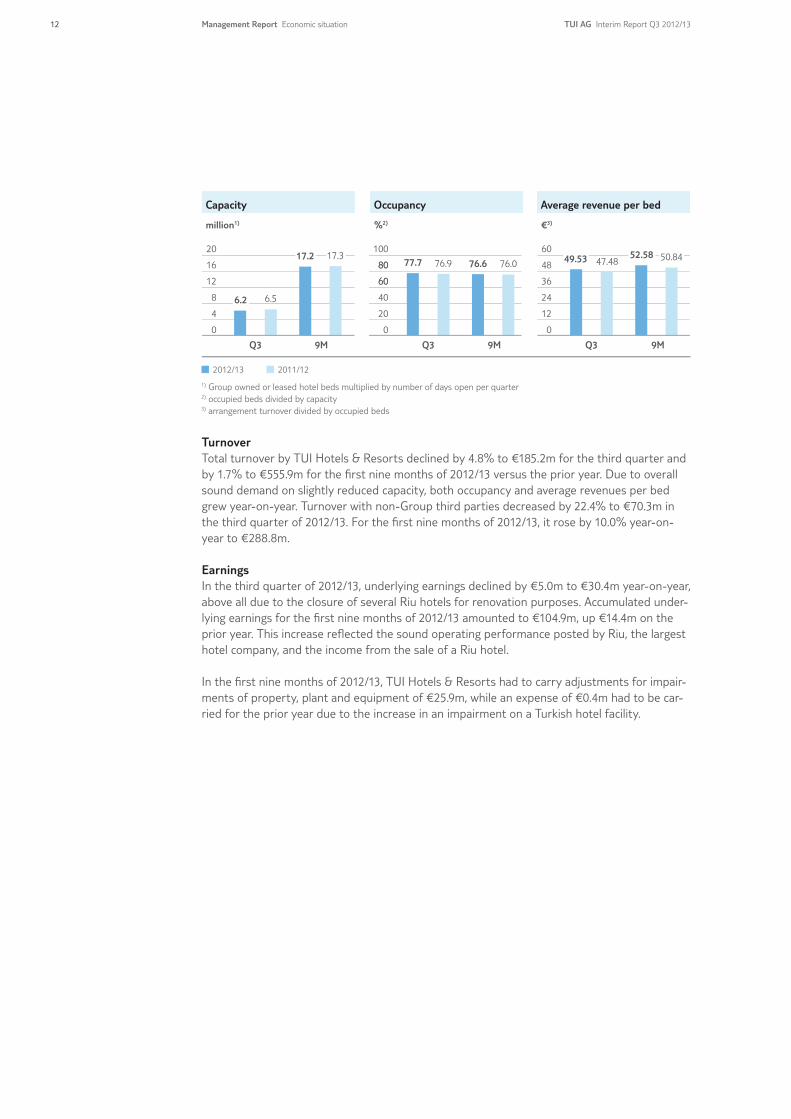
Capacity Occupancy Average revenue per bed
million1) €3)%2)
2012/13 2011/12
0
20
40
60
80
100
1) Group owned or leased hotel beds multiplied by number of days open per quarter2) occupied beds divided by capacity3) arrangement turnover divided by occupied beds
60
80
Q3 9M Q3 9MQ3 9M
0
12
24
36
48
60
0
4
8
12
16
2076.977.7 76.076.6
6.5
47.48 50.84
6.2
17.2 17.3 49.53 52.58
Turnover Total turnover by TUI Hotels & Resorts declined by 4.8% to €185.2m for the third quarter and by 1.7% to €555.9m for the fi rst nine months of 2012/13 versus the prior year. Due to overall sound demand on slightly reduced capacity, both occupancy and average revenues per bed grew year-on-year. Turnover with non-Group third parties decreased by 22.4% to €70.3m in the third quarter of 2012/13. For the fi rst nine months of 2012/13, it rose by 10.0% year-on-year to €288.8m.
EarningsIn the third quarter of 2012/13, underlying earnings declined by €5.0m to €30.4m year-on-year, above all due to the closure of several Riu hotels for renovation purposes. Accumulated under-lying earnings for the fi rst nine months of 2012/13 amounted to €104.9m, up €14.4m on the prior year. This increase refl ected the sound operating performance posted by Riu, the largest hotel company, and the income from the sale of a Riu hotel.
In the fi rst nine months of 2012/13, TUI Hotels & Resorts had to carry adjustments for impair-ments of property, plant and equipment of €25.9m, while an expense of €0.4m had to be car-ried for the prior year due to the increase in an impairment on a Turkish hotel facility.
12 Management Report Economic situation TUI AG Interim Report Q3 2012/13
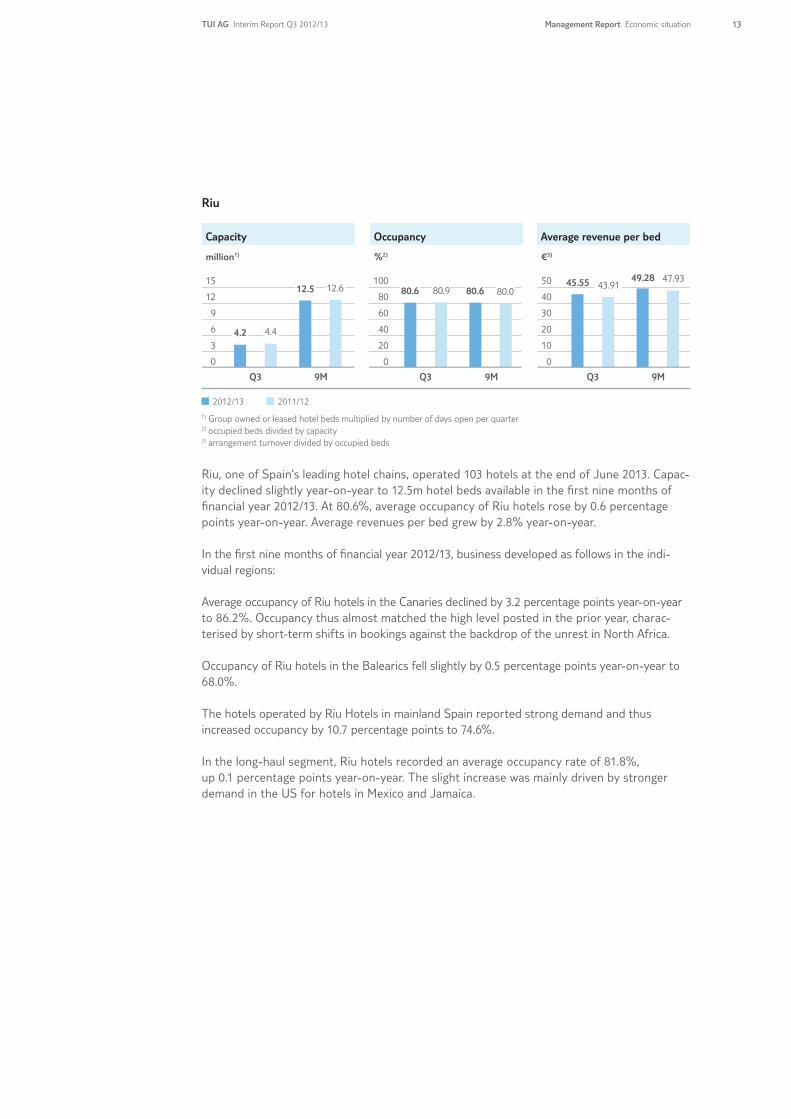
Riu
Capacity Occupancy Average revenue per bed
million1) €3)%2)
2012/13 2011/12
0
20
40
60
80
100
1) Group owned or leased hotel beds multiplied by number of days open per quarter2) occupied beds divided by capacity3) arrangement turnover divided by occupied beds
Q3 Q3Q39M 9M9M
4.2
45.55
4.4
12.5 12.6 80.6 80.9 80.6 80.049.28 47.93
43.91
0
10
20
30
40
50
0
3
6
9
12
15
Riu, one of Spain’s leading hotel chains, operated 103 hotels at the end of June 2013. Capac-ity declined slightly year-on-year to 12.5m hotel beds available in the fi rst nine months of fi nancial year 2012/13. At 80.6%, average occupancy of Riu hotels rose by 0.6 percentage points year-on-year. Average revenues per bed grew by 2.8% year-on-year.
In the fi rst nine months of fi nancial year 2012/13, business developed as follows in the indi-vidual regions:
Average occupancy of Riu hotels in the Canaries declined by 3.2 percentage points year-on-year to 86.2%. Occupancy thus almost matched the high level posted in the prior year, charac-terised by short-term shifts in bookings against the backdrop of the unrest in North Africa.
Occupancy of Riu hotels in the Balearics fell slightly by 0.5 percentage points year-on-year to 68.0%.
The hotels operated by Riu Hotels in mainland Spain reported strong demand and thus increased occupancy by 10.7 percentage points to 74.6%.
In the long-haul segment, Riu hotels recorded an average occupancy rate of 81.8%, up 0.1 percentage points year-on-year. The slight increase was mainly driven by stronger demand in the US for hotels in Mexico and Jamaica.
Management Report Economic situationTUI AG Interim Report Q3 2012/13 13
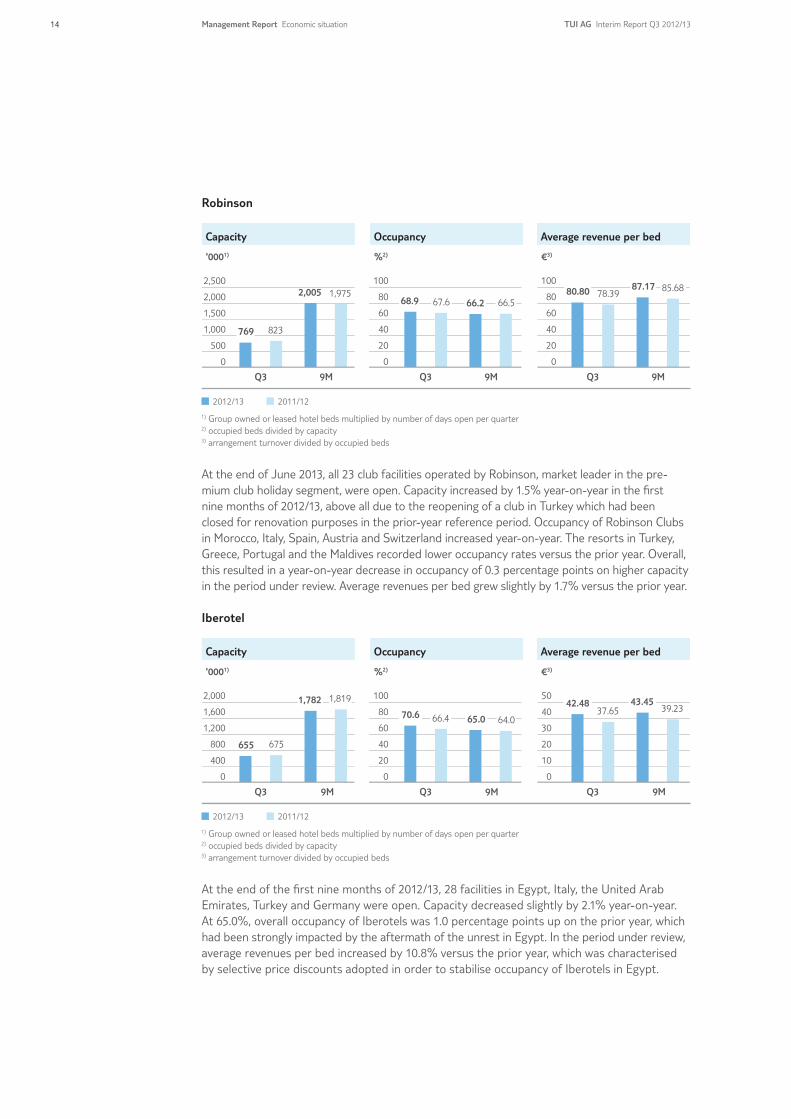
Robinson
Capacity Occupancy Average revenue per bed
'0001) €3)%2)
2012/13 2011/12
0
20
40
60
80
100
1) Group owned or leased hotel beds multiplied by number of days open per quarter2) occupied beds divided by capacity3) arrangement turnover divided by occupied beds
Q3 9M Q3 9MQ3 9M
0
20
40
60
80
100
0
500
1,000
1,500
2,000
2,500
67.668.9 66.566.2
769 823
2,005 1,975 80.80 78.3987.17 85.68
At the end of June 2013, all 23 club facilities operated by Robinson, market leader in the pre-mium club holiday segment, were open. Capacity increased by 1.5% year-on-year in the fi rst nine months of 2012/13, above all due to the reopening of a club in Turkey which had been closed for renovation purposes in the prior-year reference period. Occupancy of Robinson Clubs in Morocco, Italy, Spain, Austria and Switzerland increased year-on-year. The resorts in Turkey, Greece, Portugal and the Maldives recorded lower occupancy rates versus the prior year. Overall, this resulted in a year-on-year decrease in occupancy of 0.3 percentage points on higher capacity in the period under review. Average revenues per bed grew slightly by 1.7% versus the prior year.
Iberotel
Capacity Occupancy Average revenue per bed
'0001) €3)%2)
2012/13 2011/12
0
20
40
60
80
100
0
10
20
30
40
50
1) Group owned or leased hotel beds multiplied by number of days open per quarter2) occupied beds divided by capacity3) arrangement turnover divided by occupied beds
Q3 9M Q3 9MQ3 9M
0
400
800
1,200
1,600
2,000 1,819
65.0 64.0
42.4837.65
43.4539.23
655 675
1,782
70.6 66.4
At the end of the fi rst nine months of 2012/13, 28 facilities in Egypt, Italy, the United Arab Emirates, Turkey and Germany were open. Capacity decreased slightly by 2.1% year-on-year. At 65.0%, overall occupancy of Iberotels was 1.0 percentage points up on the prior year, which had been strongly impacted by the aftermath of the unrest in Egypt. In the period under review, average revenues per bed increased by 10.8% versus the prior year, which was characterised by selective price discounts adopted in order to stabilise occupancy of Iberotels in Egypt.
14 Management Report Economic situation TUI AG Interim Report Q3 2012/13
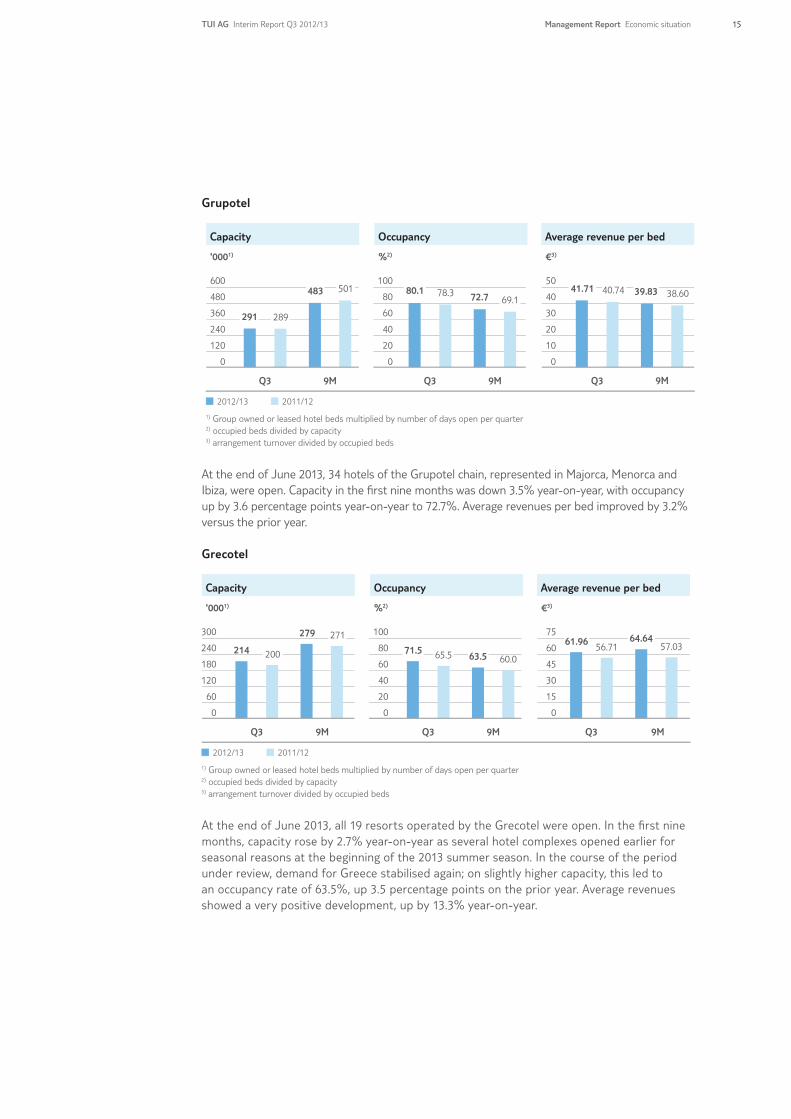
Grupotel
Capacity Occupancy Average revenue per bed
'0001) €3)%2)
2012/13 2011/12
0
20
40
60
80
100
0
10
20
30
40
50
1) Group owned or leased hotel beds multiplied by number of days open per quarter2) occupied beds divided by capacity3) arrangement turnover divided by occupied beds
Q3 9M Q3 9MQ3 9M
78.3 40.74 38.6080.172.7 69.1
41.71 39.83
0
120
240
360
480
600
291 289
483 501
At the end of June 2013, 34 hotels of the Grupotel chain, represented in Majorca, Menorca and Ibiza, were open. Capacity in the fi rst nine months was down 3.5% year-on-year, with occupancy up by 3.6 percentage points year-on-year to 72.7%. Average revenues per bed improved by 3.2% versus the prior year.
Grecotel
Capacity Occupancy Average revenue per bed
'0001) €3)%2)
2012/13 2011/12
0
20
40
60
80
100
1) Group owned or leased hotel beds multiplied by number of days open per quarter2) occupied beds divided by capacity3) arrangement turnover divided by occupied beds
Q3 9M Q3 9MQ3 9M
0
15
30
45
60
75
0
60
120
180
240
300
57.03279
21460.0200
271
63.565.571.564.64
56.7161.96
At the end of June 2013, all 19 resorts operated by the Grecotel were open. In the fi rst nine months, capacity rose by 2.7% year-on-year as several hotel complexes opened earlier for seasonal reasons at the beginning of the 2013 summer season. In the course of the period under review, demand for Greece stabilised again; on slightly higher capacity, this led to an occupancy rate of 63.5%, up 3.5 percentage points on the prior year. Average revenues showed a very positive development, up by 13.3% year-on-year.
Management Report Economic situationTUI AG Interim Report Q3 2012/13 15
Cruises
Turnover EBITA Underlying EBITA
€ million € million€ million
2012/13 2011/12
Q3 9M Q3 9MQ3 9M
0
40
80
120
160
200
67.4
188.0161.6
59.3
-80
-60
-40
-20
0
20
- 2.2 - 7.9
0.8
- 59.2 -25
-20
-15
-10
-5
0
- 17.7
- 7.9- 6.7- 2.2
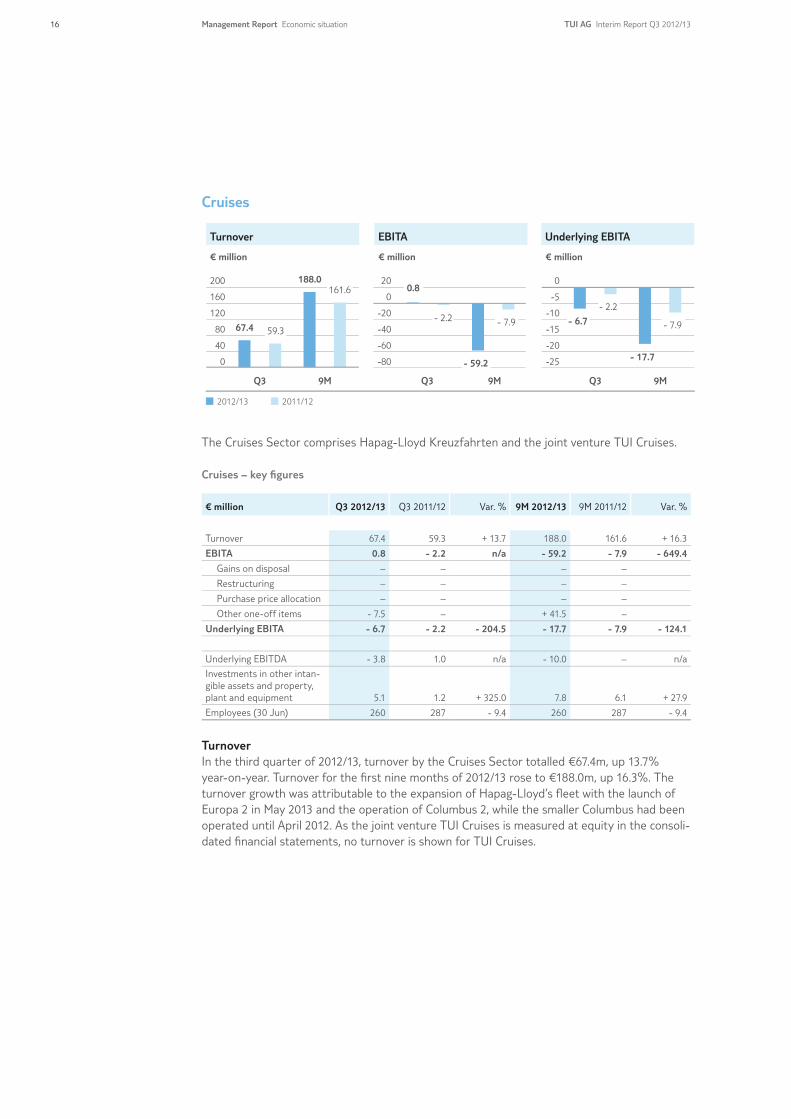
The Cruises Sector comprises Hapag-Lloyd Kreuzfahrten and the joint venture TUI Cruises.
Cruises – key fi gures
€ million Q3 2012/13 Q3 2011/12 Var. % 9M 2012/13 9M 2011/12 Var. %
Turnover 67.4 59.3 + 13.7 188.0 161.6 + 16.3
EBITA 0.8 - 2.2 n/a - 59.2 - 7.9 - 649.4
Gains on disposal – – – –
Restructuring – – – –
Purchase price allocation – – – –
Other one-off items - 7.5 – + 41.5 –
Underlying EBITA - 6.7 - 2.2 - 204.5 - 17.7 - 7.9 - 124.1
Underlying EBITDA - 3.8 1.0 n/a - 10.0 – n/a
Investments in other intan-gible assets and property, plant and equipment 5.1 1.2 + 325.0 7.8 6.1 + 27.9
Employees (30 Jun) 260 287 - 9.4 260 287 - 9.4
Turnover In the third quarter of 2012/13, turnover by the Cruises Sector totalled €67.4m, up 13.7% year-on-year. Turnover for the fi rst nine months of 2012/13 rose to €188.0m, up 16.3%. The turnover growth was attributable to the expansion of Hapag-Lloyd’s fl eet with the launch of Europa 2 in May 2013 and the operation of Columbus 2, while the smaller Columbus had been operated until April 2012. As the joint venture TUI Cruises is measured at equity in the consoli-dated fi nancial statements, no turnover is shown for TUI Cruises.
16 Management Report Economic situation TUI AG Interim Report Q3 2012/13

EarningsIn the third quarter of 2012/13, underlying earnings by the Cruises Sector stood at €-6.7m, down €4.5m year-on-year. Accumulated underlying earnings for the fi rst nine months of 2012/13 totalled €-17.7m, down €9.8m versus the prior year. While TUI Cruises posted a suc-cessful performance, Hapag-Lloyd Kreuzfahrten reported a weaker performance, driven by start-up costs for the market launch of the new Europa 2 and damage caused by a fi re on board Hanseatic during a scheduled dry-dock period.
In the third quarter of 2012/13, an amount of €7.5m used from provisions for impending losses from onerous contracts was carried as an adjustment for income. These provisions totalling €49m had been formed in the previous quarter due to occupancy risks, in particular for Europa 2, and had been carried as an adjustment for expenses accordingly. For the fi rst nine months of 2012/13, accumulated net expenses of €41.5m were carried as adjustments in connection with these provisions. At €-59.2m, accumulated reported earnings declined considerably.
Hapag-Lloyd Kreuzfahrten
Occupancy Passenger cruise days Average daily rates
% €1)'000
2012/13 2011/12
Q3 9M Q3 9MQ3 9M
1) per day and passenger
0
100
200
300
400
500
0
20
40
60
80
100
0
60
120
180
240
30076.4 395 37773.0 75.570.9
110.2 100.9
286.4
358409256.6
In the fi rst nine months of 2012/13, Hapag-Lloyd Kreuzfahrten recorded a decline in the oc-cupancy rate for its fl eet of 4.6 percentage points versus the prior year to 70.9%. Passenger days rose to 286,352. This growth refl ected, among other things, the expansion of the fl eet to include Europa 2, launched in May 2013. The accumulated average rate per passenger per day for the fi rst nine months increased by 8.5% to €409, benefi ting from the expansion and renewal of the fl eet.
Management Report Economic situationTUI AG Interim Report Q3 2012/13 17
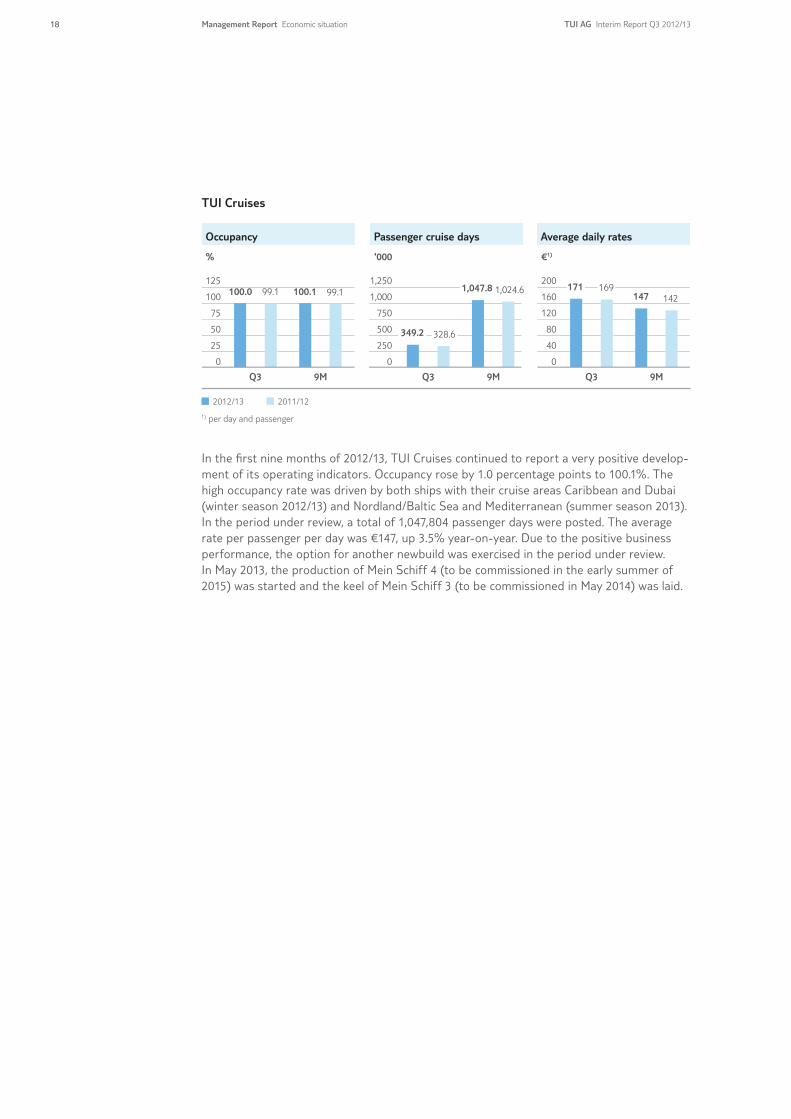
TUI Cruises
Occupancy Passenger cruise days Average daily rates
% €1)'000
2012/13 2011/12
1) per day and passenger
Q3 9M Q3 9MQ3 9M
0
25
50
75
100
125
0
250
500
750
1,000
1,250
0
40
80
120
160
200100.0 171
349.2 328.6
99.1 100.1 99.1 169147 142
1,047.8 1,024.6
In the fi rst nine months of 2012/13, TUI Cruises continued to report a very positive develop-ment of its operating indicators. Occupancy rose by 1.0 percentage points to 100.1%. The high occupancy rate was driven by both ships with their cruise areas Caribbean and Dubai (winter season 2012/13) and Nordland/Baltic Sea and Mediterranean (summer season 2013). In the period under review, a total of 1,047,804 passenger days were posted. The average rate per passenger per day was €147, up 3.5% year-on-year. Due to the positive business performance, the option for another newbuild was exercised in the period under review. In May 2013, the production of Mein Schiff 4 (to be commissioned in the early summer of 2015) was started and the keel of Mein Schiff 3 (to be commissioned in May 2014) was laid.
18 Management Report Economic situation TUI AG Interim Report Q3 2012/13
Central Operations
Turnover EBITA Underlying EBITA
€ million € million€ million
2012/13 2011/12
Q3 9M Q3 9MQ3 9M
-75
-60
-45
-30
-15
0
34.6
11.3
0
10
20
30
40
50
11.45.0
- 16.1
- 43.2
- 65.0
- 22.0
-75
-60
-45
-30
-15
0
- 49.0
- 15.5 - 20.1
- 54.6
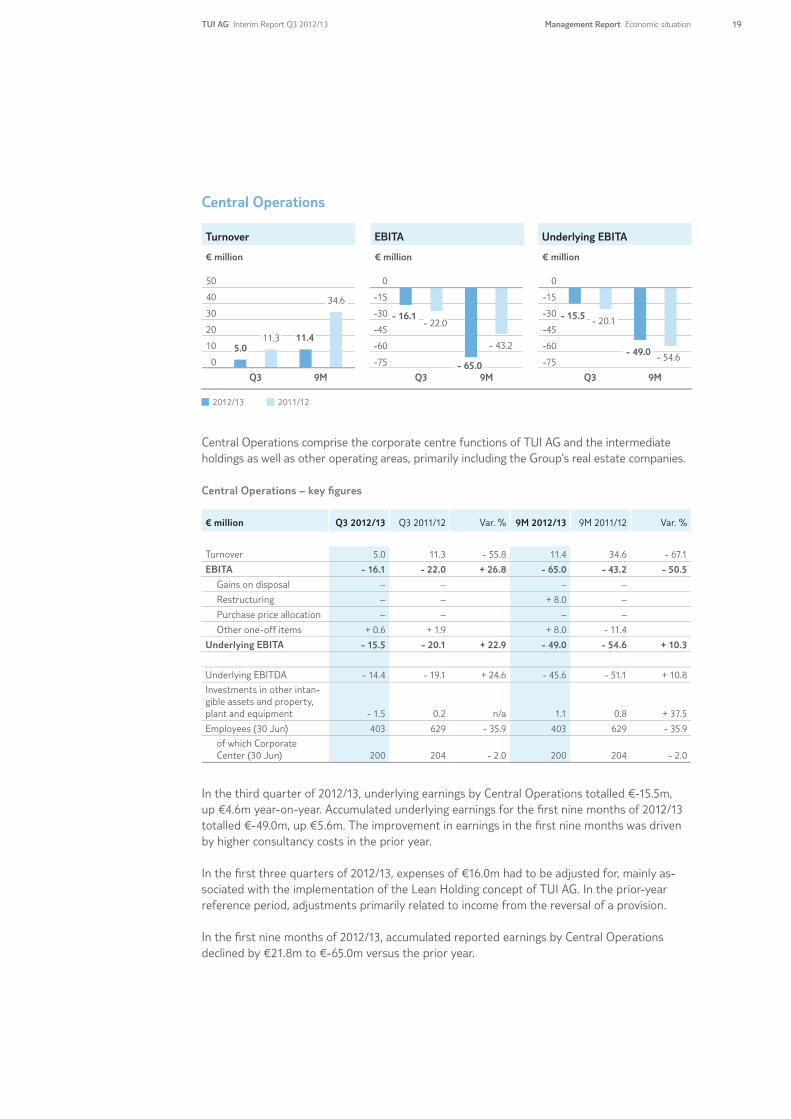
Central Operations comprise the corporate centre functions of TUI AG and the intermediate holdings as well as other operating areas, primarily including the Group’s real estate companies.
Central Operations – key fi gures
€ million Q3 2012/13 Q3 2011/12 Var. % 9M 2012/13 9M 2011/12 Var. %
Turnover 5.0 11.3 - 55.8 11.4 34.6 - 67.1
EBITA - 16.1 - 22.0 + 26.8 - 65.0 - 43.2 - 50.5
Gains on disposal – – – –
Restructuring – – + 8.0 –
Purchase price allocation – – – –
Other one-off items + 0.6 + 1.9 + 8.0 - 11.4
Underlying EBITA - 15.5 - 20.1 + 22.9 - 49.0 - 54.6 + 10.3
Underlying EBITDA - 14.4 - 19.1 + 24.6 - 45.6 - 51.1 + 10.8
Investments in other intan-gible assets and property, plant and equipment - 1.5 0.2 n/a 1.1 0.8 + 37.5
Employees (30 Jun) 403 629 - 35.9 403 629 - 35.9
of which Corporate Center (30 Jun) 200 204 - 2.0 200 204 - 2.0
In the third quarter of 2012/13, underlying earnings by Central Operations totalled €-15.5m, up €4.6m year-on-year. Accumulated underlying earnings for the fi rst nine months of 2012/13 totalled €-49.0m, up €5.6m. The improvement in earnings in the fi rst nine months was driven by higher consultancy costs in the prior year.
In the fi rst three quarters of 2012/13, expenses of €16.0m had to be adjusted for, mainly as-sociated with the implementation of the Lean Holding concept of TUI AG. In the prior-year reference period, adjustments primarily related to income from the reversal of a provision.
In the fi rst nine months of 2012/13, accumulated reported earnings by Central Operations declined by €21.8m to €-65.0m versus the prior year.
Management Report Economic situationTUI AG Interim Report Q3 2012/13 19
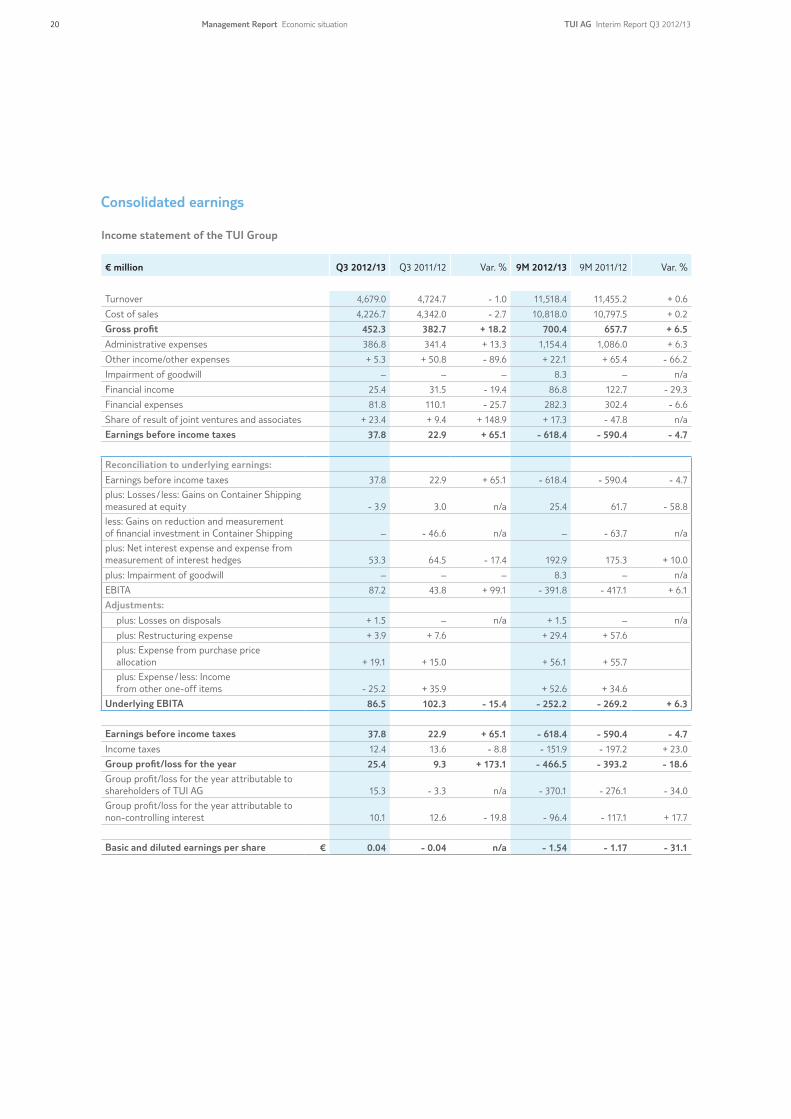
Consolidated earnings
Income statement of the TUI Group
€ million Q3 2012/13 Q3 2011/12 Var. % 9M 2012/13 9M 2011/12 Var. %
Turnover 4,679.0 4,724.7 - 1.0 11,518.4 11,455.2 + 0.6
Cost of sales 4,226.7 4,342.0 - 2.7 10,818.0 10,797.5 + 0.2
Gross profit 452.3 382.7 + 18.2 700.4 657.7 + 6.5
Administrative expenses 386.8 341.4 + 13.3 1,154.4 1,086.0 + 6.3
Other income/other expenses + 5.3 + 50.8 - 89.6 + 22.1 + 65.4 - 66.2
Impairment of goodwill – – – 8.3 – n/a
Financial income 25.4 31.5 - 19.4 86.8 122.7 - 29.3
Financial expenses 81.8 110.1 - 25.7 282.3 302.4 - 6.6
Share of result of joint ventures and associates + 23.4 + 9.4 + 148.9 + 17.3 - 47.8 n/a
Earnings before income taxes 37.8 22.9 + 65.1 - 618.4 - 590.4 - 4.7
Reconciliation to underlying earnings:
Earnings before income taxes 37.8 22.9 + 65.1 - 618.4 - 590.4 - 4.7
plus: Losses / less: Gains on Container Shipping measured at equity - 3.9 3.0 n/a 25.4 61.7 - 58.8
less: Gains on reduction and measurement of financial investment in Container Shipping – - 46.6 n/a – - 63.7 n/a
plus: Net interest expense and expense from measurement of interest hedges 53.3 64.5 - 17.4 192.9 175.3 + 10.0
plus: Impairment of goodwill – – – 8.3 – n/a
EBITA 87.2 43.8 + 99.1 - 391.8 - 417.1 + 6.1
Adjustments:
plus: Losses on disposals + 1.5 – n/a + 1.5 – n/a
plus: Restructuring expense + 3.9 + 7.6 + 29.4 + 57.6
plus: Expense from purchase price allocation + 19.1 + 15.0 + 56.1 + 55.7
plus: Expense / less: Income from other one-off items - 25.2 + 35.9 + 52.6 + 34.6
Underlying EBITA 86.5 102.3 - 15.4 - 252.2 - 269.2 + 6.3
Earnings before income taxes 37.8 22.9 + 65.1 - 618.4 - 590.4 - 4.7
Income taxes 12.4 13.6 - 8.8 - 151.9 - 197.2 + 23.0
Group profit/loss for the year 25.4 9.3 + 173.1 - 466.5 - 393.2 - 18.6
Group profit/loss for the year attributable to shareholders of TUI AG 15.3 - 3.3 n/a - 370.1 - 276.1 - 34.0
Group profit/loss for the year attributable to non-controlling interest 10.1 12.6 - 19.8 - 96.4 - 117.1 + 17.7
Basic and diluted earnings per share € 0.04 - 0.04 n/a - 1.54 - 1.17 - 31.1
20 Management Report Economic situation TUI AG Interim Report Q3 2012/13
The consolidated income statement reflects the seasonality of the tourism business, with accumu-lated negative results generated in the period from October to June due to the seasonality of the business.
Turnover and cost of sales In the third quarter of 2012/13, turnover by the TUI Group declined by 1.0% year-on-year to €4.7bn. Adjusted for foreign exchange effects, it rose by 0.7% year-on-year. For the first nine months of 2012/13, turnover totalled €11.5bn, up 0.6% on the prior year. Adjusted for foreign exchange effects, it rose by 0.7%. The growth in turnover was driven by higher average selling prices, in particular due to a higher proportion of differentiated products in TUI Travel, while TUI Travel’s Mainstream Business reported a decline in customer volumes of 1.5%.
Turnover is presented alongside the cost of sales. A detailed breakdown of turnover and the development of turnover are presented in the section Earnings by the Sectors.
Gross profitAt €452.3m, gross profit as the balance of turnover and the cost of sales was up by 18.2% year-on-year in the third quarter of 2012/13. For the first three quarters of 2012/13, gross profit amounted to €700.4m, up €6.5% versus the prior year.
Administrative expensesAdministrative expenses comprise expenses not directly allocable to the turnover transactions, such as expenses for general management functions. In the third quarter, they totalled €386.8m, up 13.3% on the prior year. At €1.2bn, administrative expenses for the first nine months in-creased by 6.3% year-on-year. This was partly attributable to staff costs incurred by companies included in consolidation for the first time as at 1 October 2012. Moreover, expenses associated with restructuring measures in TUI Travel and scheduled staff measures in connection with the conversion of TUI AG’s corporate centre were incurred in the period under review.
Other income/other expensesThe balance of other income and other expenses totalled €5.3m in the third quarter of 2012/13. The net income of €22.1m carried for the first nine months of 2012/13 mainly resulted from the sale of a Riu hotel, while income in the prior year had arisen from the partial disposal of the hybrid instrument granted to Hapag-Lloyd Holding AG and the measurement of the investment in Container Shipping.
Impairment of goodwillIn the third quarter of 2012/13, no goodwill impairments were required. The accumulated impairments for the first nine months of 2012/13 of €8.3m relate to the Castelfalfi project in TUI Hotels & Resorts. In the prior year, no goodwill impairments had been required.
Financial income and expenses/financial resultThe financial result comprises the interest result and the net result from marketable securities. In the prior year it had also included the effect of the measurement of the loans granted to Container Shipping. In the third quarter of 2012/13, the financial result improved by €22.2m. In the first nine months of 2012/13, it declined by €15.8m on the prior year.
See page 4
Management Report Economic situationTUI AG Interim Report Q3 2012/13 21
The decrease in the financial income in the third quarter and the first nine months of 2012/13 year-on-year resulted above all from interest income from the hybrid instruments granted to Hapag-Lloyd. These were fully redeemed in financial year 2011/12.
The decline in financial expenses mainly resulted from the reduction in financial liabilities in the period under review. An opposite effect on financial expenses in the first nine months of financial year 2012/13 resulted from subsequent measurement of liabilities to banks.
Share of results of joint ventures and associatesThe share of results of joint ventures and associates comprises the share in net profit for the year of the associated companies and joint ventures as well as any impairments of the goodwill of these companies. The share of results of joint ventures and associates rose by €14.0m to €23.4m in the third quarter of 2012/13. It totalled €17.3m in the first nine months of 2012/13 (previous year €-47.8m). The improvement of €65.1m recorded in the first nine months of 2012/13 mainly resulted from the reduction in the stake in Hapag-Lloyd from 38.4% to 22.0% in June 2012.
Underlying Group EBITA In the third quarter of 2012/13, underlying Group EBITA was negative due to the seasonality of the tourism business. It totalled €86.5m for the third quarter of 2012/13, down 15.4% year-on-year. On an accumulated basis, it rose by €17.0m for the first nine months to €-252.2m. EBITA was adjusted for gains on disposal, restructuring expenses, purchase price allocations and one-off items. The adjustments are outlined in detail in the section Earnings by the Sectors.
Income taxesTaxes on income comprise taxes on profits from the business activities. In the third quarter of 2012/13, tax liabilities of €12.4m arose (previous year €13.6m). On an accumulated basis, tax assets of €151.9m arose for the first nine months; just as the tax assets of €197.2m posted for the prior year, it was mainly attributable to the seasonal swing in the tourism business.
Group resultIn the third quarter of 2012/13, the Group result rose to €25.4m (previous year €9.3m). The accumulated Group result for the first nine months of 2012/13 declined by €73.3m to €-466.5m.
Non-controlling interestsNon-controlling interests accounted for €10.1m for the third quarter of 2012/13 and €-96.4m for the first nine months. They related to the external shareholders of TUI Travel PLC and compa-nies in the TUI Hotels & Resorts Sector.
Earnings per shareAfter deduction of non-controlling interests, TUI AG shareholders accounted for €15.3m (previous year €-3.3m) of the Group result for the third quarter of 2012/13 and €-370.1m (previous year €-276.1m) for the first nine months of 2012/13. As a result, basic earnings per share amounted to €0.04 (previous year €-0.04) for the third quarter and €-1.54 (previous year €-1.17) for the first nine months of 2012/13.
Adjustments see page 5
22 Management Report Economic situation TUI AG Interim Report Q3 2012/13
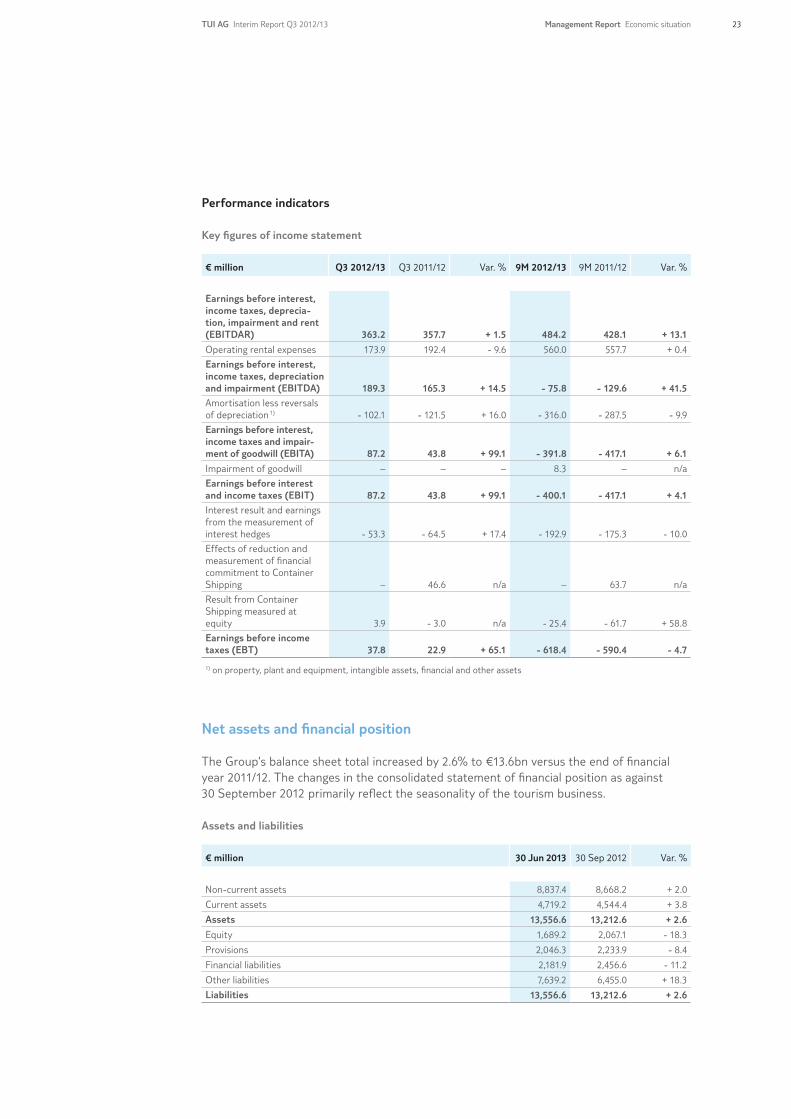
Performance indicators
Key figures of income statement
€ million Q3 2012/13 Q3 2011/12 Var. % 9M 2012/13 9M 2011/12 Var. %
Earnings before interest, income taxes, deprecia-tion, impairment and rent (EBITDAR) 363.2 357.7 + 1.5 484.2 428.1 + 13.1
Operating rental expenses 173.9 192.4 - 9.6 560.0 557.7 + 0.4
Earnings before interest, income taxes, depreciation and impairment (EBITDA) 189.3 165.3 + 14.5 - 75.8 - 129.6 + 41.5
Amortisation less reversals of depreciation 1) - 102.1 - 121.5 + 16.0 - 316.0 - 287.5 - 9.9
Earnings before interest, income taxes and impair-ment of goodwill (EBITA) 87.2 43.8 + 99.1 - 391.8 - 417.1 + 6.1
Impairment of goodwill – – – 8.3 – n/a
Earnings before interest and income taxes (EBIT) 87.2 43.8 + 99.1 - 400.1 - 417.1 + 4.1
Interest result and earnings from the measurement of interest hedges - 53.3 - 64.5 + 17.4 - 192.9 - 175.3 - 10.0
Effects of reduction and measurement of financial commitment to Container Shipping – 46.6 n/a – 63.7 n/a
Result from Container Shipping measured at equity 3.9 - 3.0 n/a - 25.4 - 61.7 + 58.8
Earnings before income taxes (EBT) 37.8 22.9 + 65.1 - 618.4 - 590.4 - 4.7
1) on property, plant and equipment, intangible assets, financial and other assets
Net assets and financial position
The Group’s balance sheet total increased by 2.6% to €13.6bn versus the end of financial year 2011/12. The changes in the consolidated statement of financial position as against 30 September 2012 primarily reflect the seasonality of the tourism business.
Assets and liabilities
€ million 30 Jun 2013 30 Sep 2012 Var. %
Non-current assets 8,837.4 8,668.2 + 2.0
Current assets 4,719.2 4,544.4 + 3.8
Assets 13,556.6 13,212.6 + 2.6
Equity 1,689.2 2,067.1 - 18.3
Provisions 2,046.3 2,233.9 - 8.4
Financial liabilities 2,181.9 2,456.6 - 11.2
Other liabilities 7,639.2 6,455.0 + 18.3
Liabilities 13,556.6 13,212.6 + 2.6
Management Report Economic situationTUI AG Interim Report Q3 2012/13 23
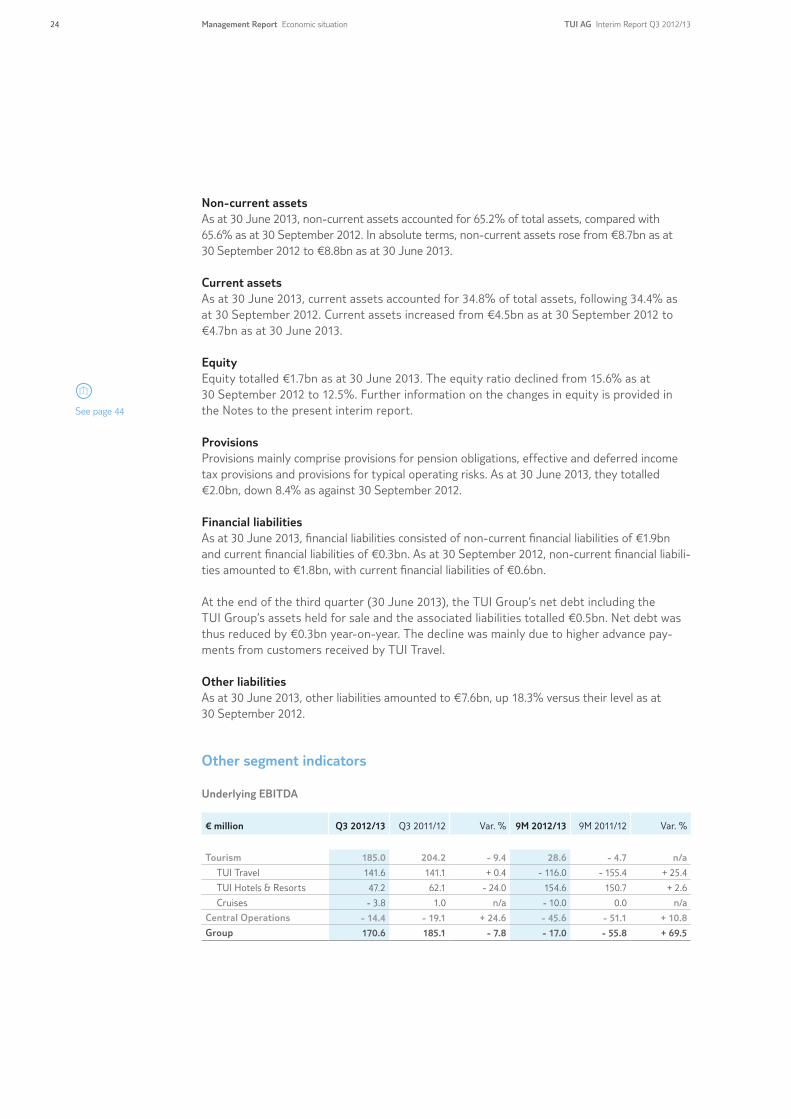
Non-current assetsAs at 30 June 2013, non-current assets accounted for 65.2% of total assets, compared with 65.6% as at 30 September 2012. In absolute terms, non-current assets rose from €8.7bn as at 30 September 2012 to €8.8bn as at 30 June 2013.
Current assetsAs at 30 June 2013, current assets accounted for 34.8% of total assets, following 34.4% as at 30 September 2012. Current assets increased from €4.5bn as at 30 September 2012 to €4.7bn as at 30 June 2013.
EquityEquity totalled €1.7bn as at 30 June 2013. The equity ratio declined from 15.6% as at 30 September 2012 to 12.5%. Further information on the changes in equity is provided in the Notes to the present interim report.
ProvisionsProvisions mainly comprise provisions for pension obligations, effective and deferred income tax provisions and provisions for typical operating risks. As at 30 June 2013, they totalled €2.0bn, down 8.4% as against 30 September 2012.
Financial liabilitiesAs at 30 June 2013, financial liabilities consisted of non-current financial liabilities of €1.9bn and current financial liabilities of €0.3bn. As at 30 September 2012, non-current financial liabili-ties amounted to €1.8bn, with current financial liabilities of €0.6bn.
At the end of the third quarter (30 June 2013), the TUI Group’s net debt including the TUI Group’s assets held for sale and the associated liabilities totalled €0.5bn. Net debt was thus reduced by €0.3bn year-on-year. The decline was mainly due to higher advance pay-ments from customers received by TUI Travel.
Other liabilitiesAs at 30 June 2013, other liabilities amounted to €7.6bn, up 18.3% versus their level as at 30 September 2012.
Other segment indicators
Underlying EBITDA
€ million Q3 2012/13 Q3 2011/12 Var. % 9M 2012/13 9M 2011/12 Var. %
Tourism 185.0 204.2 - 9.4 28.6 - 4.7 n/a
TUI Travel 141.6 141.1 + 0.4 - 116.0 - 155.4 + 25.4
TUI Hotels & Resorts 47.2 62.1 - 24.0 154.6 150.7 + 2.6
Cruises - 3.8 1.0 n/a - 10.0 0.0 n/a
Central Operations - 14.4 - 19.1 + 24.6 - 45.6 - 51.1 + 10.8
Group 170.6 185.1 - 7.8 - 17.0 - 55.8 + 69.5
See page 44
24 Management Report Economic situation TUI AG Interim Report Q3 2012/13

EBITDA
€ million Q3 2012/13 Q3 2011/12 Var. % 9M 2012/13 9M 2011/12 Var. %
Tourism 204.3 186.3 + 9.7 - 20.6 - 89.9 + 77.1
TUI Travel 153.4 123.6 + 24.1 - 119.0 - 240.2 + 50.5
TUI Hotels & Resorts 47.2 61.7 - 23.5 149.9 150.3 - 0.3
Cruises 3.7 1.0 + 270.0 - 51.5 0.0 n/a
Central Operations - 15.0 - 21.0 + 28.6 - 55.2 - 39.7 - 39.0
Group 189.3 165.3 + 14.5 - 75.8 - 129.6 + 41.5
Investments in other intangible assets and property, plant and equipment
€ million Q3 2012/13 Q3 2011/12 Var. % 9M 2012/13 9M 2011/12 Var. %
Tourism 194.8 154.6 + 26.0 599.5 507.1 + 18.2
TUI Travel 163.2 149.0 + 9.5 535.6 443.7 + 20.7
TUI Hotels & Resorts 26.5 4.4 + 502.3 56.1 57.3 - 2.1
Cruises 5.1 1.2 + 325.0 7.8 6.1 + 27.9
Central Operations - 1.5 0.2 n/a 1.1 0.8 + 37.5
Group 193.3 154.8 + 24.9 600.6 507.9 + 18.3
Amortisation of other intangible assets and depreciation of property, plant and equipment
€ million Q3 2012/13 Q3 2011/12 Var. % 9M 2012/13 9M 2011/12 Var. %
Tourism 102.6 108.8 - 5.7 307.9 272.3 + 13.1
TUI Travel 82.9 78.8 + 5.2 229.3 204.1 + 12.3
TUI Hotels & Resorts 16.8 26.8 - 37.3 70.9 60.3 + 17.6
Cruises 2.9 3.2 - 9.4 7.7 7.9 - 2.5
Central Operations 1.1 1.0 + 10.0 9.8 3.4 + 188.2
Group 103.7 109.8 - 5.6 317.7 275.7 + 15.2
Employees
30 Jun 2013 30 Sep 2012 Var. %
Tourism 74,056 73,391 + 0.9
TUI Travel 59,623 57,961 + 2.9
TUI Hotels & Resorts 14,173 15,141 - 6.4
Cruises 260 289 - 10.0
Central Operations 403 421 - 4.3
Corporate Center 200 212 - 5.7
Other units 203 209 - 2.9
Group 74,459 73,812 + 0.9
Management Report Economic situationTUI AG Interim Report Q3 2012/13 25
MANAGEMENT REPORTRISK AND OPPORTUNITY REPORT
For a comprehensive presentation of our risk and opportunity management systems and any potential risks and opportunities, we refer to the corresponding comments in our An-nual Report 2011/12. The risks and opportunities outlined in that report remained largely unchanged in the period under review, with the exception of changes in external risks in Egypt and Turkey in the current period under review.
Due to the resurgence of political unrest in Egypt, the German Foreign Office issued a partial travel warning for the country in June 2013, which, however, does not include the tourist areas on the Red Sea. The Foreign Office also updated the travel and safety guidelines for the Turkish city of Istanbul in July 2013 due to the demonstrations staged there. Here, too, the tourist areas on the Mediterranean are not affected. In the period under review, the incidents in Egypt and Turkey did not have a material effect on the TUI Group’s business performance and current trading. We presume that potential effects will also be limited for the full year 2012/13. For our capacity planning for the winter season 2013/14, we will take account of the further devel-opment of demand for Egypt, a major winter destination. Turkey is a destination of minor relevance in the winter season.
Overall, the TUI Group’s risks, both individually and in conjunction with other risks, are limited and from today’s perspective do not threaten the continued existence of the Company. Opportunities and risks or any positive or negative changes of opportunities and risks are not offset against one another.
Annual Report 2011/12: Risks see page 132 ff, opportunities see page 149
26 TUI AG Interim Report Q3 2012/13Management Report Risk and opportunity report
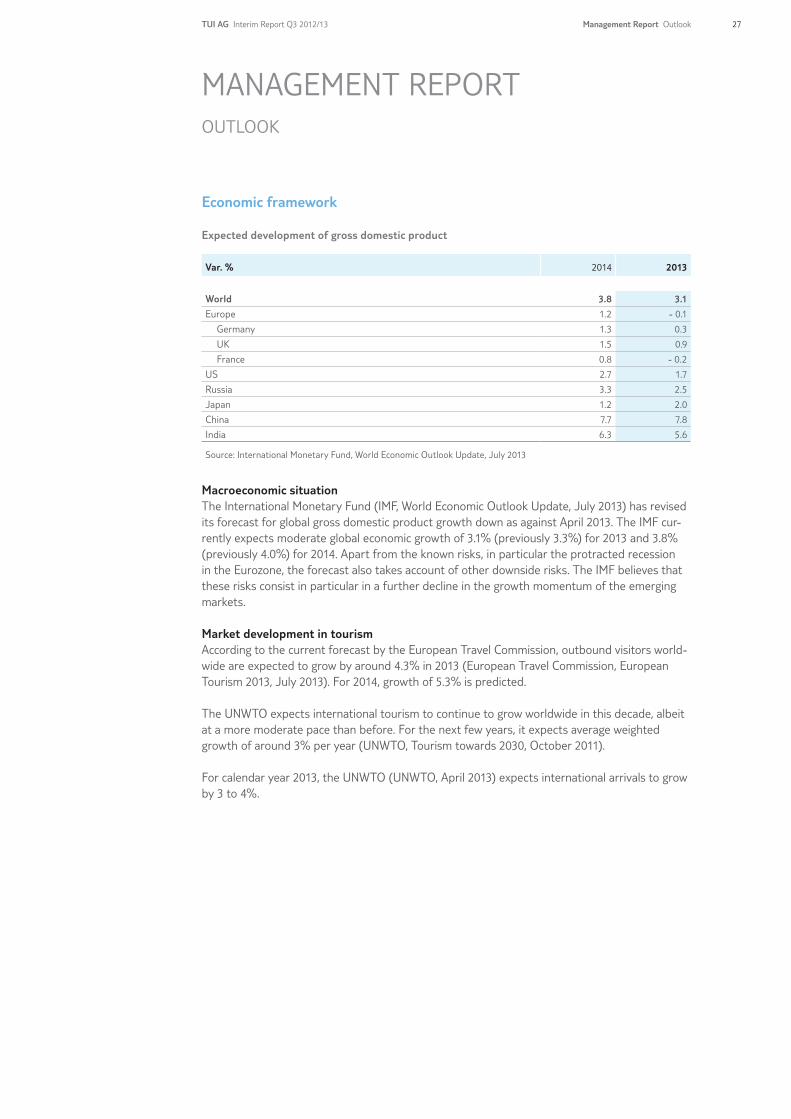
MANAGEMENT REPORTOUTLOOK
Economic framework
Expected development of gross domestic product
Var. % 2014 2013
World 3.8 3.1
Europe 1.2 - 0.1
Germany 1.3 0.3
UK 1.5 0.9
France 0.8 - 0.2
US 2.7 1.7
Russia 3.3 2.5
Japan 1.2 2.0
China 7.7 7.8
India 6.3 5.6
Source: International Monetary Fund, World Economic Outlook Update, July 2013
Macroeconomic situationThe International Monetary Fund (IMF, World Economic Outlook Update, July 2013) has revised its forecast for global gross domestic product growth down as against April 2013. The IMF cur-rently expects moderate global economic growth of 3.1% (previously 3.3%) for 2013 and 3.8% (previously 4.0%) for 2014. Apart from the known risks, in particular the protracted recession in the Eurozone, the forecast also takes account of other downside risks. The IMF believes that these risks consist in particular in a further decline in the growth momentum of the emerging markets.
Market development in tourismAccording to the current forecast by the European Travel Commission, outbound visitors world-wide are expected to grow by around 4.3% in 2013 (European Travel Commission, European Tourism 2013, July 2013). For 2014, growth of 5.3% is predicted.
The UNWTO expects international tourism to continue to grow worldwide in this decade, albeit at a more moderate pace than before. For the next few years, it expects average weighted growth of around 3% per year (UNWTO, Tourism towards 2030, October 2011).
For calendar year 2013, the UNWTO (UNWTO, April 2013) expects international arrivals to grow by 3 to 4%.
TUI AG Interim Report Q3 2012/13 27Management Report Outlook
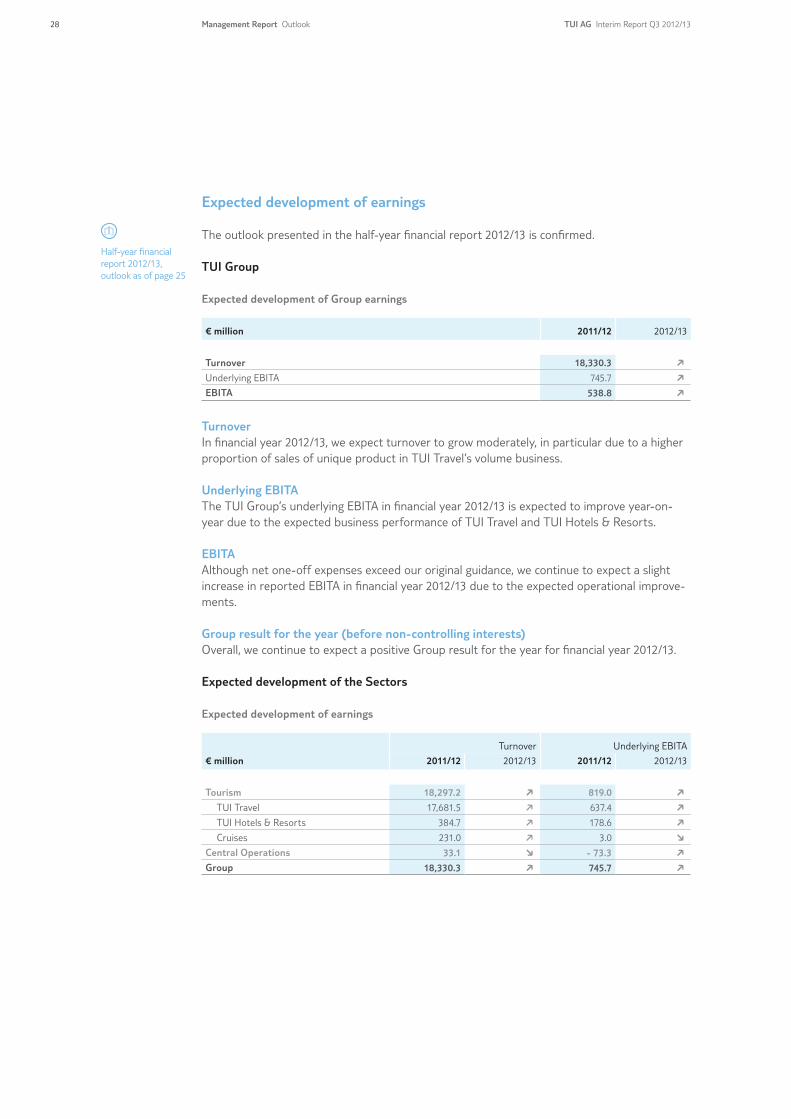
Expected development of earnings
The outlook presented in the half-year financial report 2012/13 is confirmed.
TUI Group
Expected development of Group earnings
€ million 2011/12 2012/13
Turnover 18,330.3 F
Underlying EBITA 745.7 F
EBITA 538.8 F
TurnoverIn financial year 2012/13, we expect turnover to grow moderately, in particular due to a higher proportion of sales of unique product in TUI Travel’s volume business.
Underlying EBITAThe TUI Group’s underlying EBITA in financial year 2012/13 is expected to improve year-on-year due to the expected business performance of TUI Travel and TUI Hotels & Resorts.
EBITAAlthough net one-off expenses exceed our original guidance, we continue to expect a slight increase in reported EBITA in financial year 2012/13 due to the expected operational improve-ments.
Group result for the year (before non-controlling interests)Overall, we continue to expect a positive Group result for the year for financial year 2012/13.
Expected development of the Sectors
Expected development of earnings
Turnover Underlying EBITA
€ million 2011/12 2012/13 2011/12 2012/13
Tourism 18,297.2 F 819.0 F
TUI Travel 17,681.5 F 637.4 F
TUI Hotels & Resorts 384.7 F 178.6 F
Cruises 231.0 F 3.0 H
Central Operations 33.1 H - 73.3 F
Group 18,330.3 F 745.7 F
Half-year financial report 2012/13, outlook as of page 25
28 TUI AG Interim Report Q3 2012/13Management Report Outlook
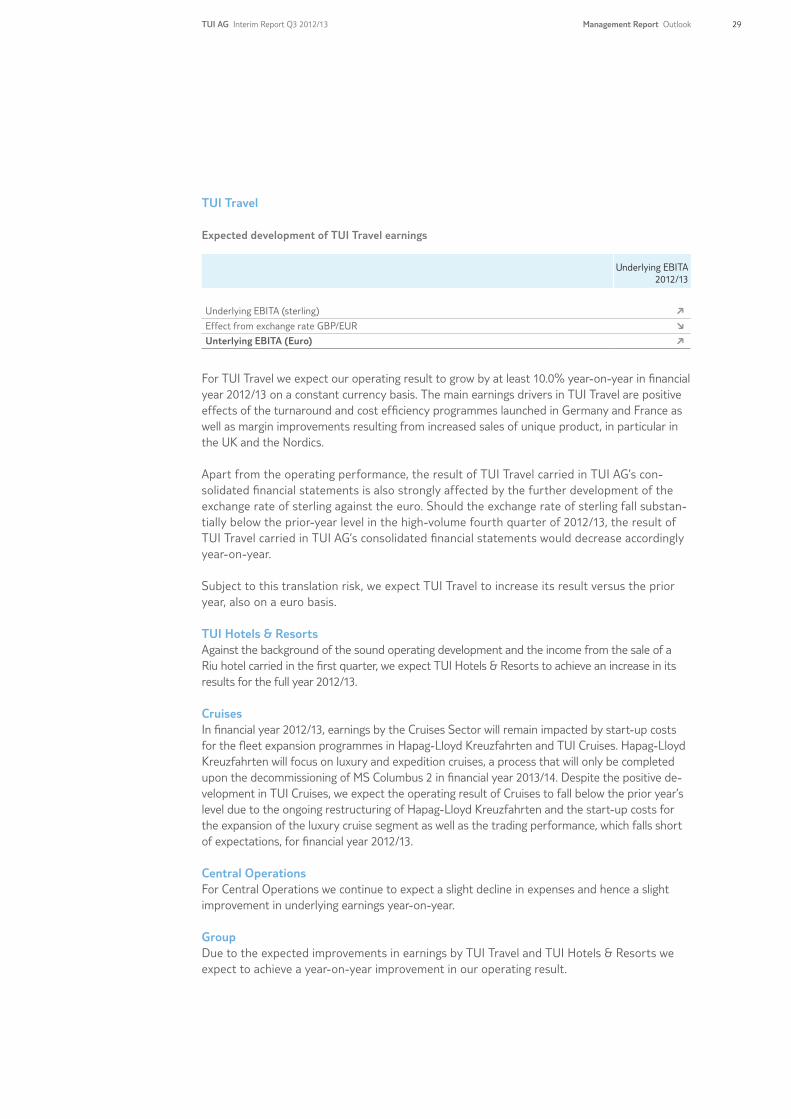
TUI Travel
Expected development of TUI Travel earnings
Underlying EBITA 2012/13
Underlying EBITA (sterling) F
Effect from exchange rate GBP/EUR H
Unterlying EBITA (Euro) F
For TUI Travel we expect our operating result to grow by at least 10.0% year-on-year in financial year 2012/13 on a constant currency basis. The main earnings drivers in TUI Travel are positive effects of the turnaround and cost efficiency programmes launched in Germany and France as well as margin improvements resulting from increased sales of unique product, in particular in the UK and the Nordics.
Apart from the operating performance, the result of TUI Travel carried in TUI AG’s con-solidated financial statements is also strongly affected by the further development of the exchange rate of sterling against the euro. Should the exchange rate of sterling fall substan-tially below the prior-year level in the high-volume fourth quarter of 2012/13, the result of TUI Travel carried in TUI AG’s consolidated financial statements would decrease accordingly year-on-year.
Subject to this translation risk, we expect TUI Travel to increase its result versus the prior year, also on a euro basis.
TUI Hotels & ResortsAgainst the background of the sound operating development and the income from the sale of a Riu hotel carried in the first quarter, we expect TUI Hotels & Resorts to achieve an increase in its results for the full year 2012/13.
CruisesIn financial year 2012/13, earnings by the Cruises Sector will remain impacted by start-up costs for the fleet expansion programmes in Hapag-Lloyd Kreuzfahrten and TUI Cruises. Hapag-Lloyd Kreuzfahrten will focus on luxury and expedition cruises, a process that will only be completed upon the decommissioning of MS Columbus 2 in financial year 2013/14. Despite the positive de-velopment in TUI Cruises, we expect the operating result of Cruises to fall below the prior year’s level due to the ongoing restructuring of Hapag-Lloyd Kreuzfahrten and the start-up costs for the expansion of the luxury cruise segment as well as the trading performance, which falls short of expectations, for financial year 2012/13.
Central OperationsFor Central Operations we continue to expect a slight decline in expenses and hence a slight improvement in underlying earnings year-on-year.
GroupDue to the expected improvements in earnings by TUI Travel and TUI Hotels & Resorts we expect to achieve a year-on-year improvement in our operating result.
TUI AG Interim Report Q3 2012/13 29Management Report Outlook
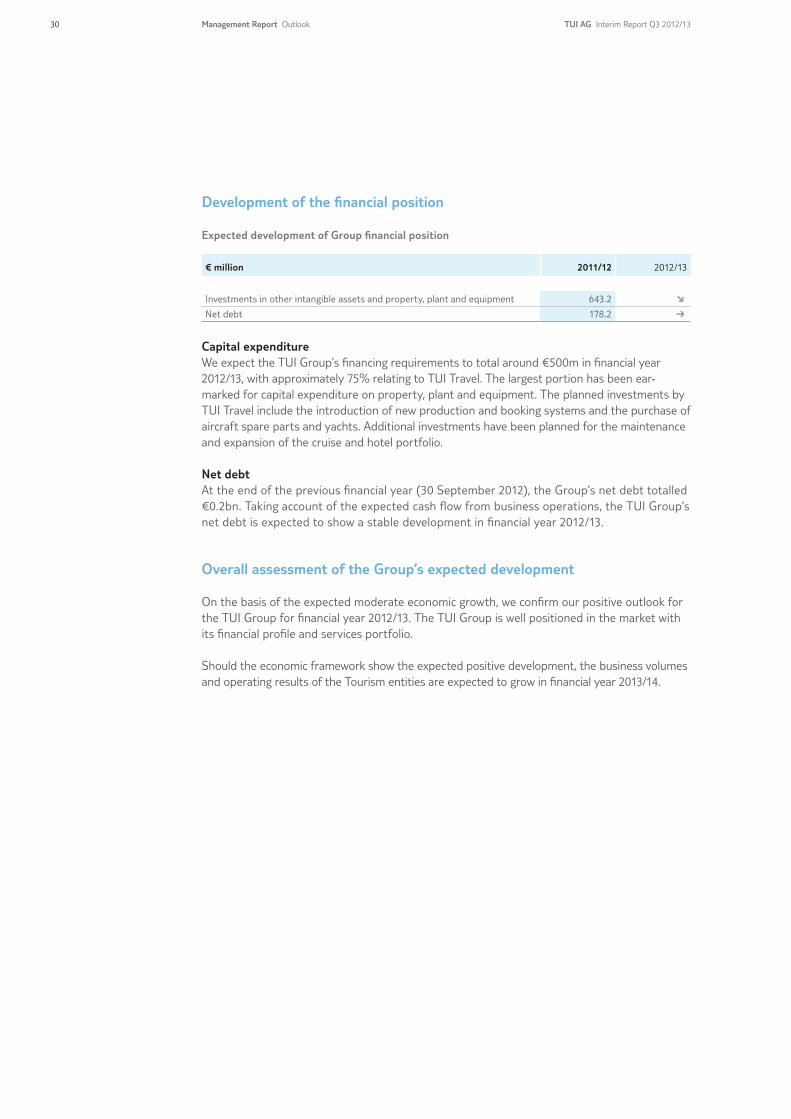
Development of the financial position
Expected development of Group financial position
€ million 2011/12 2012/13
Investments in other intangible assets and property, plant and equipment 643.2 H
Net debt 178.2 B
Capital expenditureWe expect the TUI Group’s financing requirements to total around €500m in financial year 2012/13, with approximately 75% relating to TUI Travel. The largest portion has been ear-marked for capital expenditure on property, plant and equipment. The planned investments by TUI Travel include the introduction of new production and booking systems and the purchase of aircraft spare parts and yachts. Additional investments have been planned for the maintenance and expansion of the cruise and hotel portfolio.
Net debtAt the end of the previous financial year (30 September 2012), the Group’s net debt totalled €0.2bn. Taking account of the expected cash flow from business operations, the TUI Group’s net debt is expected to show a stable development in financial year 2012/13.
Overall assessment of the Group’s expected development
On the basis of the expected moderate economic growth, we confirm our positive outlook for the TUI Group for financial year 2012/13. The TUI Group is well positioned in the market with its financial profile and services portfolio.
Should the economic framework show the expected positive development, the business volumes and operating results of the Tourism entities are expected to grow in financial year 2013/14.
30 TUI AG Interim Report Q3 2012/13Management Report Outlook
Composition of the boards
There were no changes in the composition of the boards of TUI AG in the period under review or after the closing date. The current, complete composition of the Executive Board and Supervisory Board is listed on the Company’s website, where it has been made permanently available to the public.
TUI AGThe Executive Board
August 2013
MANAGEMENT REPORTCORPORATE GOVERNANCE
www.tui-group.com
TUI AG Interim Report Q3 2012/13 31Management Report Corporate Governance
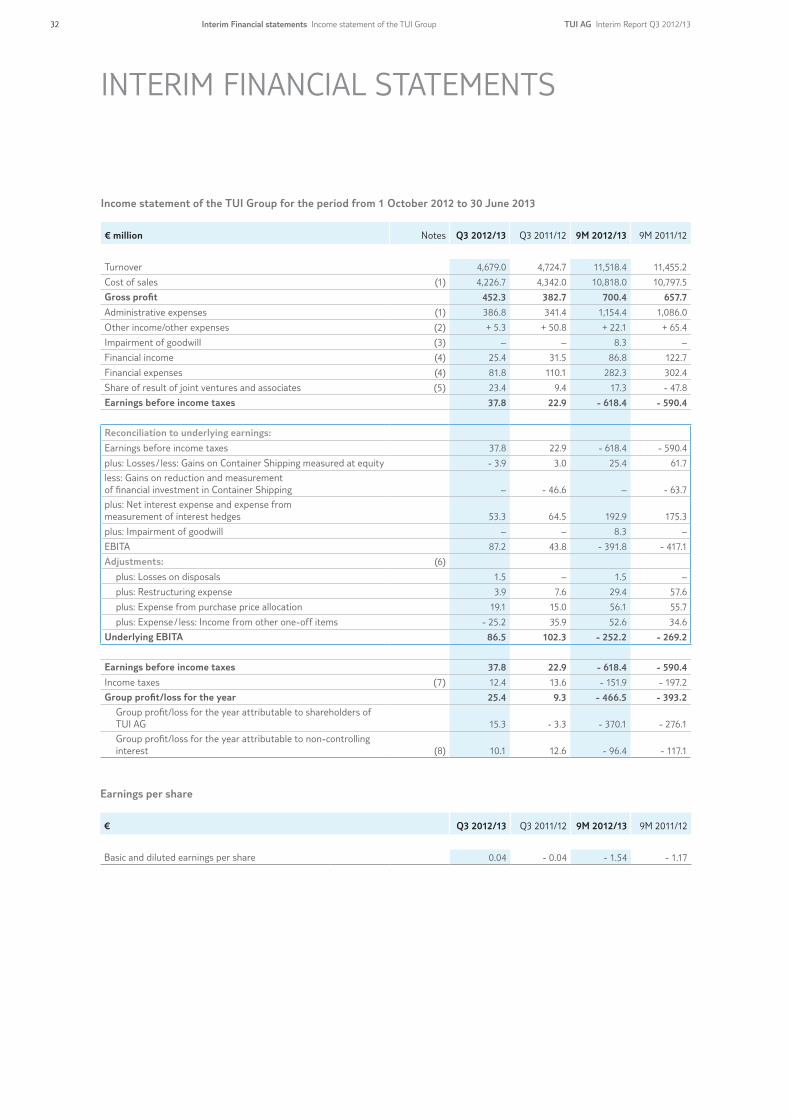
Income statement of the TUI Group for the period from 1 October 2012 to 30 June 2013
€ million Notes Q3 2012/13 Q3 2011/12 9M 2012/13 9M 2011/12
Turnover 4,679.0 4,724.7 11,518.4 11,455.2
Cost of sales (1) 4,226.7 4,342.0 10,818.0 10,797.5
Gross profit 452.3 382.7 700.4 657.7
Administrative expenses (1) 386.8 341.4 1,154.4 1,086.0
Other income/other expenses (2) + 5.3 + 50.8 + 22.1 + 65.4
Impairment of goodwill (3) – – 8.3 –
Financial income (4) 25.4 31.5 86.8 122.7
Financial expenses (4) 81.8 110.1 282.3 302.4
Share of result of joint ventures and associates (5) 23.4 9.4 17.3 - 47.8
Earnings before income taxes 37.8 22.9 - 618.4 - 590.4
Reconciliation to underlying earnings:
Earnings before income taxes 37.8 22.9 - 618.4 - 590.4
plus: Losses / less: Gains on Container Shipping measured at equity - 3.9 3.0 25.4 61.7
less: Gains on reduction and measurement of financial investment in Container Shipping – - 46.6 – - 63.7
plus: Net interest expense and expense from measurement of interest hedges 53.3 64.5 192.9 175.3
plus: Impairment of goodwill – – 8.3 –
EBITA 87.2 43.8 - 391.8 - 417.1
Adjustments: (6)
plus: Losses on disposals 1.5 – 1.5 –
plus: Restructuring expense 3.9 7.6 29.4 57.6
plus: Expense from purchase price allocation 19.1 15.0 56.1 55.7
plus: Expense / less: Income from other one-off items - 25.2 35.9 52.6 34.6
Underlying EBITA 86.5 102.3 - 252.2 - 269.2
Earnings before income taxes 37.8 22.9 - 618.4 - 590.4
Income taxes (7) 12.4 13.6 - 151.9 - 197.2
Group profit/loss for the year 25.4 9.3 - 466.5 - 393.2
Group profit/loss for the year attributable to shareholders of TUI AG 15.3 - 3.3 - 370.1 - 276.1
Group profit/loss for the year attributable to non-controlling interest (8) 10.1 12.6 - 96.4 - 117.1
Earnings per share
€ Q3 2012/13 Q3 2011/12 9M 2012/13 9M 2011/12
Basic and diluted earnings per share 0.04 - 0.04 - 1.54 - 1.17
INTERIM FINANCIAL STATEMENTS
32 TUI AG Interim Report Q3 2012/13Interim Financial statements Income statement of the TUI Group
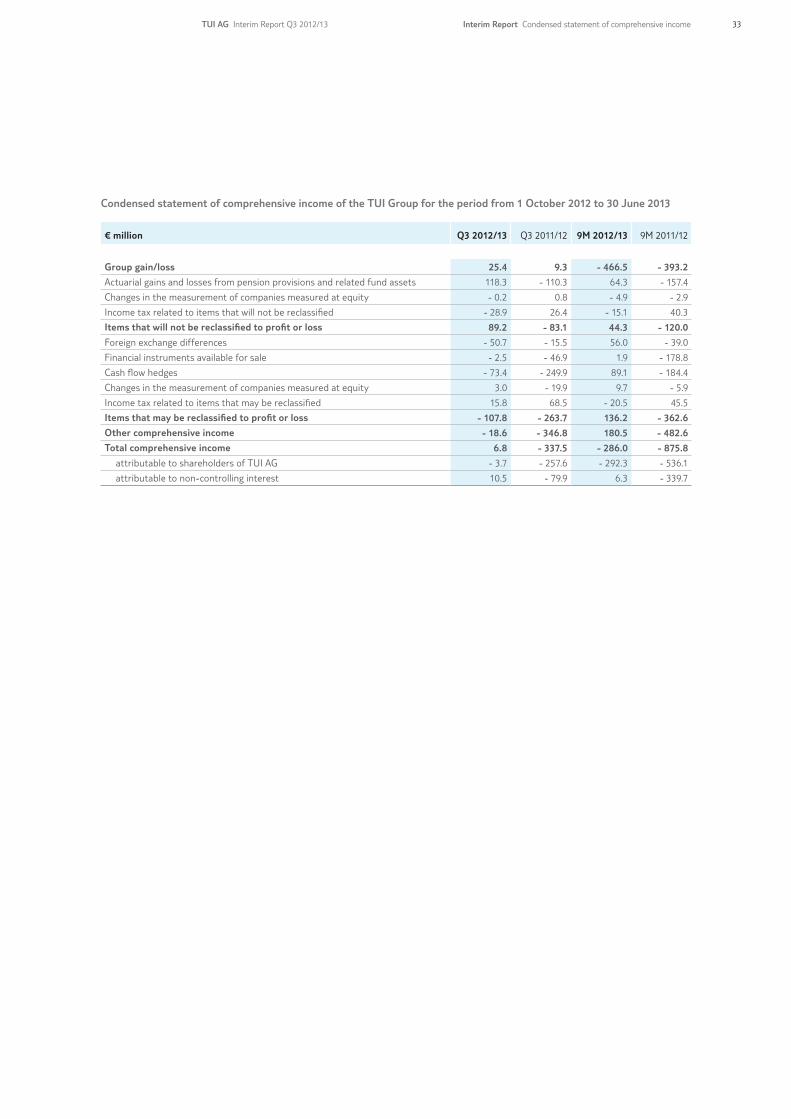
Condensed statement of comprehensive income of the TUI Group for the period from 1 October 2012 to 30 June 2013
€ million Q3 2012/13 Q3 2011/12 9M 2012/13 9M 2011/12
Group gain/loss 25.4 9.3 - 466.5 - 393.2
Actuarial gains and losses from pension provisions and related fund assets 118.3 - 110.3 64.3 - 157.4
Changes in the measurement of companies measured at equity - 0.2 0.8 - 4.9 - 2.9
Income tax related to items that will not be reclassified - 28.9 26.4 - 15.1 40.3
Items that will not be reclassified to profit or loss 89.2 - 83.1 44.3 - 120.0
Foreign exchange differences - 50.7 - 15.5 56.0 - 39.0
Financial instruments available for sale - 2.5 - 46.9 1.9 - 178.8
Cash flow hedges - 73.4 - 249.9 89.1 - 184.4
Changes in the measurement of companies measured at equity 3.0 - 19.9 9.7 - 5.9
Income tax related to items that may be reclassified 15.8 68.5 - 20.5 45.5
Items that may be reclassified to profit or loss - 107.8 - 263.7 136.2 - 362.6
Other comprehensive income - 18.6 - 346.8 180.5 - 482.6
Total comprehensive income 6.8 - 337.5 - 286.0 - 875.8
attributable to shareholders of TUI AG - 3.7 - 257.6 - 292.3 - 536.1
attributable to non-controlling interest 10.5 - 79.9 6.3 - 339.7
TUI AG Interim Report Q3 2012/13 33Interim Report Condensed statement of comprehensive income
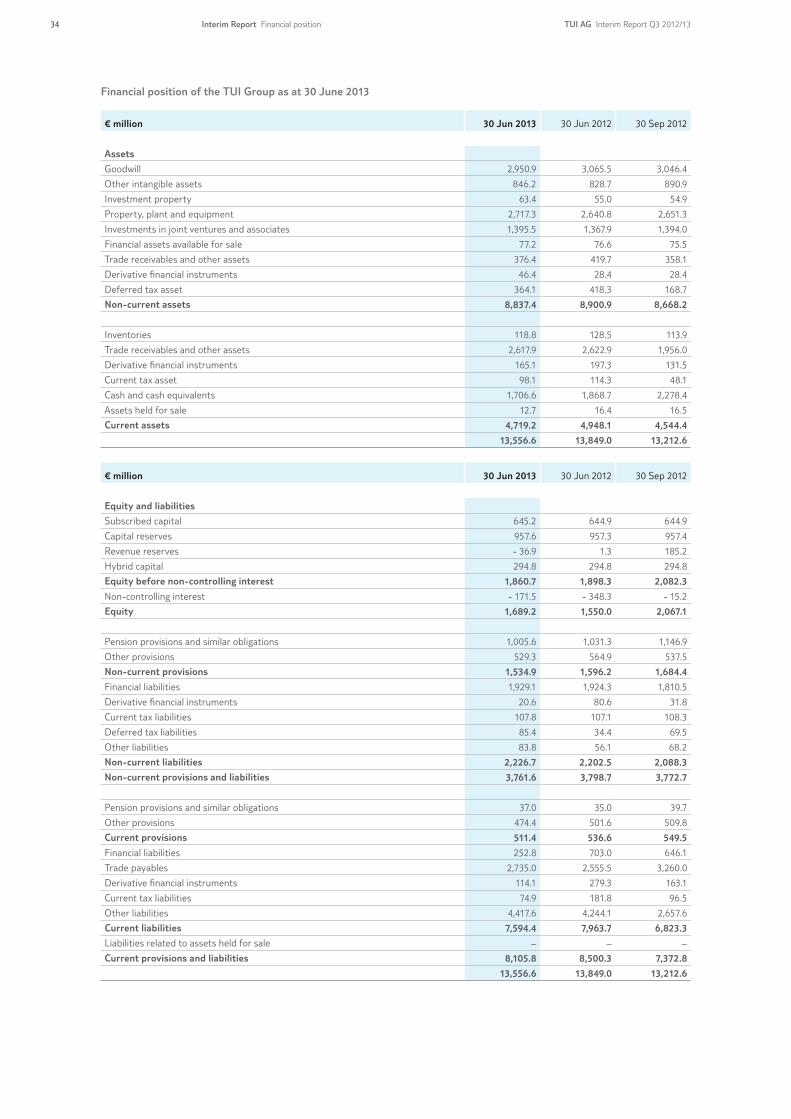
Financial position of the TUI Group as at 30 June 2013
€ million 30 Jun 2013 30 Jun 2012 30 Sep 2012
Assets
Goodwill 2,950.9 3,065.5 3,046.4
Other intangible assets 846.2 828.7 890.9
Investment property 63.4 55.0 54.9
Property, plant and equipment 2,717.3 2,640.8 2,651.3
Investments in joint ventures and associates 1,395.5 1,367.9 1,394.0
Financial assets available for sale 77.2 76.6 75.5
Trade receivables and other assets 376.4 419.7 358.1
Derivative financial instruments 46.4 28.4 28.4
Deferred tax asset 364.1 418.3 168.7
Non-current assets 8,837.4 8,900.9 8,668.2
Inventories 118.8 128.5 113.9
Trade receivables and other assets 2,617.9 2,622.9 1,956.0
Derivative financial instruments 165.1 197.3 131.5
Current tax asset 98.1 114.3 48.1
Cash and cash equivalents 1,706.6 1,868.7 2,278.4
Assets held for sale 12.7 16.4 16.5
Current assets 4,719.2 4,948.1 4,544.4
13,556.6 13,849.0 13,212.6
€ million 30 Jun 2013 30 Jun 2012 30 Sep 2012
Equity and liabilities
Subscribed capital 645.2 644.9 644.9
Capital reserves 957.6 957.3 957.4
Revenue reserves - 36.9 1.3 185.2
Hybrid capital 294.8 294.8 294.8
Equity before non-controlling interest 1,860.7 1,898.3 2,082.3
Non-controlling interest - 171.5 - 348.3 - 15.2
Equity 1,689.2 1,550.0 2,067.1
Pension provisions and similar obligations 1,005.6 1,031.3 1,146.9
Other provisions 529.3 564.9 537.5
Non-current provisions 1,534.9 1,596.2 1,684.4
Financial liabilities 1,929.1 1,924.3 1,810.5
Derivative financial instruments 20.6 80.6 31.8
Current tax liabilities 107.8 107.1 108.3
Deferred tax liabilities 85.4 34.4 69.5
Other liabilities 83.8 56.1 68.2
Non-current liabilities 2,226.7 2,202.5 2,088.3
Non-current provisions and liabilities 3,761.6 3,798.7 3,772.7
Pension provisions and similar obligations 37.0 35.0 39.7
Other provisions 474.4 501.6 509.8
Current provisions 511.4 536.6 549.5
Financial liabilities 252.8 703.0 646.1
Trade payables 2,735.0 2,555.5 3,260.0
Derivative financial instruments 114.1 279.3 163.1
Current tax liabilities 74.9 181.8 96.5
Other liabilities 4,417.6 4,244.1 2,657.6
Current liabilities 7,594.4 7,963.7 6,823.3
Liabilities related to assets held for sale – – –
Current provisions and liabilities 8,105.8 8,500.3 7,372.8
13,556.6 13,849.0 13,212.6
34 TUI AG Interim Report Q3 2012/13Interim Report Financial position

Condensed statement of changes in equity of the TUI Group for the period from 1 October 2012 to 30 June 2013
€ millionSubscribed
capitalCapital
reservesRevenue reserves
Hybrid capital
Equity before non-
controlling interest
Non- controlling
interest Total
Balance as at 1 October 2012 644.9 957.4 185.2 294.8 2,082.3 - 15.2 2,067.1
Dividends – – – – – - 128.6 - 128.6
Hybrid capital dividend – – - 18.1 – - 18.1 – - 18.1
Share-based payment schemes of TUI Travel PLC – – 7.5 – 7.5 6.0 13.5
Issue of employee shares 0.3 0.2 – – 0.5 – 0.5
Effects on the acquisition of non-controlling interests – – - 17.0 – - 17.0 - 8.5 - 25.5
Effects on the disposal of shares to non-controlling interests – – 97.8 – 97.8 - 31.5 66.3
Group loss – – - 370.1 – - 370.1 - 96.4 - 466.5
Foreign exchange differences – – - 5.1 – - 5.1 61.1 56.0
Financial instruments available for sale – – 1.1 – 1.1 0.8 1.9
Cash flow hedges – – 63.1 – 63.1 26.0 89.1
Actuarial losses from pension provisions and related fund assets – – 39.7 – 39.7 24.6 64.3
Changes in the measurement of companies measured at equity – – 4.8 – 4.8 – 4.8
Taxes attributable to other comprehensive income – – - 25.8 – - 25.8 - 9.8 - 35.6
Other comprehensive income – – 77.8 – 77.8 102.7 180.5
Total comprehensive income – – - 292.3 – - 292.3 6.3 - 286.0
Balance as at 30 June 2013 645.2 957.6 - 36.9 294.8 1,860.7 - 171.5 1,689.2
Condensed statement of changes in equity of the TUI Group for the period from 1 October 2011 to 30 June 2012
€ millionSubscribed
capitalCapital
reservesRevenue reserves
Hybrid capital
Equity before non-
controlling interest
Non- controlling
interest Total
Balance as at 1 October 2011 643.5 956.1 575.6 294.8 2,470.0 77.8 2,547.8
Dividends – – – – – - 93.4 - 93.4
Hybrid capital dividend – – - 19.4 – - 19.4 – - 19.4
Share-based payment schemes of TUI Travel PLC – – 5.0 – 5.0 3.9 8.9
Issue of employee shares 1.4 1.2 – – 2.6 – 2.6
Effects on the acquisition of non-controlling interests – – - 23.8 – - 23.8 3.1 - 20.7
Group loss – – - 276.1 – - 276.1 - 117.1 - 393.2
Foreign exchange differences – – 71.1 – 71.1 - 110.1 - 39.0
Financial instruments available for sale – – - 181.9 – - 181.9 3.1 - 178.8
Cash flow hedges – – - 86.9 – - 86.9 - 97.5 - 184.4
Actuarial losses from pension provisions and related fund assets – – - 100.2 – - 100.2 - 57.2 - 157.4
Changes in the measurement of companies measured at equity – – - 9.0 – - 9.0 0.2 - 8.8
Taxes attributable to other comprehensive income – – 46.9 – 46.9 38.9 85.8
Other comprehensive income – – - 260.0 – - 260.0 - 222.6 - 482.6
Total comprehensive income – – - 536.1 – - 536.1 - 339.7 - 875.8
Balance as at 30 June 2012 644.9 957.3 1.3 294.8 1,898.3 - 348.3 1,550.0
TUI AG Interim Report Q3 2012/13 35Interim Report Condensed statements of changes in equity

Condensed cash flow statement of the TUI Group for the period from 1 October 2012 to 30 June 2013
€ million 9M 2012/13 9M 2011/12
Cash inflow from operating activities 426.4 141.7
Cash outflow/inflow from investing activities - 356.9 431.5
Cash outflow from financing activities - 647.3 - 667.6
Net change in cash and cash equivalents - 577.8 - 94.4
Change in cash and cash equivalents due to exchange rate fluctuation 6.0 - 18.2
Cash and cash equivalents at beginning of period 2,278.4 1,981.3
Cash and cash equivalents at end of period 1,706.6 1,868.7
36 TUI AG Interim Report Q3 2012/13Interim Report Condensed cash flow statement
NOTES
Accounting principles
In accordance with IAS 34, the Group’s interim financial statements as at 30 June 2013 are published in a condensed form compared with the consolidated annual financial statements. As before, they are prepared on the historical cost basis, the only exception being the accounting method applied in measuring financial instruments.
As a matter of principle, the accounting and measurement methods adopted in the preparation of these interim financial statements as at 30 June 2013 are consistent with those followed in the preparation of the preceding consolidated financial statements for the financial year ended 30 September 2012.
The preparation of the financial statements requires the management to make estimates and judgements that affect the reported amounts of assets, liabilities and contingent liabilities as at the balance sheet date and the reported amounts of turnover and expenses during the period under review. Actual results may deviate from the estimates.
Compared with the prior year reference period, TUI Travel updated the parameters used in empty leg accounting for inbound customers. As a consequence, the reported results for the first and third quarters are down year-on-year due to the seasonal nature of the business, while the results for the second and fourth quarters of 2012/13 are up. The effects of this change in estimate balance out for the full year 2012/13.
In addition, the following standards and interpretations revised or newly issued by the IASB have been mandatory since the beginning of financial year 2012/13:
• Amendments to IAS 1: Presentation of Financial Statements – Presentation of Other Compre-hensive Income (OCI) Items
• Amendments to IAS 12: Income Taxes – Deferred Tax: Recovery of Underlying Assets
The present interim financial statements reflect the amendments to IAS 1 concerning the presentation of other comprehensive income. Accordingly, the items of other comprehen-sive income are classified into two groups, depending on whether or not the items will be recycled later. Tax associated with items presented before tax is shown separately for each of these two groups.
The amendments to IAS 12 regarding deferred tax on investment property measured using the fair value model according to IAS 40 do not impact the TUI Group’s net assets, financial position and financial performance as this property is carried at amortised cost by the TUI Group.
The mandatory application of these provisions does not have a significant impact on the TUI Group’s net assets, financial position and financial performance and disclosures in the notes to the these interim financial statements.
TUI AG Interim Report Q3 2012/13 37Notes Accounting principles
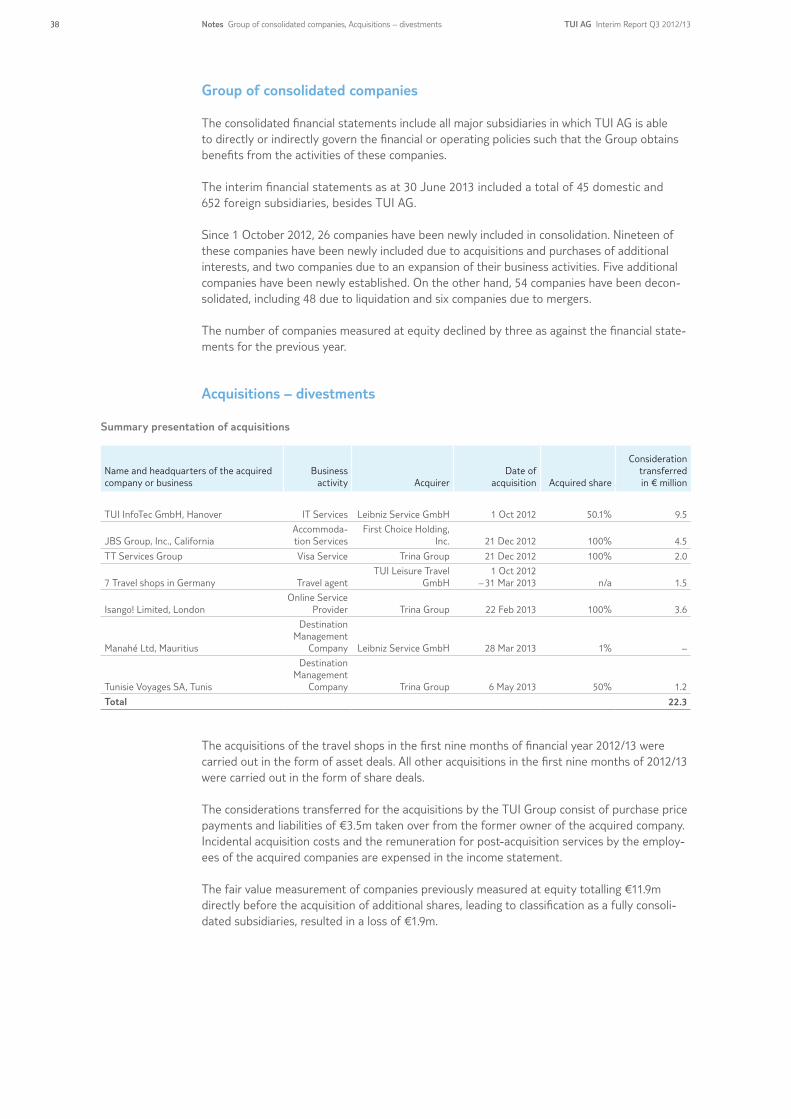
Group of consolidated companies
The consolidated financial statements include all major subsidiaries in which TUI AG is able to directly or indirectly govern the financial or operating policies such that the Group obtains benefits from the activities of these companies.
The interim financial statements as at 30 June 2013 included a total of 45 domestic and 652 foreign subsidiaries, besides TUI AG.
Since 1 October 2012, 26 companies have been newly included in consolidation. Nineteen of these companies have been newly included due to acquisitions and purchases of additional interests, and two companies due to an expansion of their business activities. Five additional companies have been newly established. On the other hand, 54 companies have been decon-solidated, including 48 due to liquidation and six companies due to mergers.
The number of companies measured at equity declined by three as against the financial state-ments for the previous year.
Acquisitions – divestments
Summary presentation of acquisitions
Name and headquarters of the acquired company or business
Business activity Acquirer
Date of acquisition Acquired share
Consideration transferred in € million
TUI InfoTec GmbH, Hanover IT Services Leibniz Service GmbH 1 Oct 2012 50.1% 9.5
JBS Group, Inc., CaliforniaAccommoda-tion Services
First Choice Holding, Inc. 21 Dec 2012 100% 4.5
TT Services Group Visa Service Trina Group 21 Dec 2012 100% 2.0
7 Travel shops in Germany Travel agentTUI Leisure Travel
GmbH1 Oct 2012
– 31 Mar 2013 n/a 1.5
Isango! Limited, LondonOnline Service
Provider Trina Group 22 Feb 2013 100% 3.6
Manahé Ltd, Mauritius
Destination Management
Company Leibniz Service GmbH 28 Mar 2013 1% –
Tunisie Voyages SA, Tunis
Destination Management
Company Trina Group 6 May 2013 50% 1.2
Total 22.3
The acquisitions of the travel shops in the first nine months of financial year 2012/13 were carried out in the form of asset deals. All other acquisitions in the first nine months of 2012/13 were carried out in the form of share deals.
The considerations transferred for the acquisitions by the TUI Group consist of purchase price payments and liabilities of €3.5m taken over from the former owner of the acquired company. Incidental acquisition costs and the remuneration for post-acquisition services by the employ-ees of the acquired companies are expensed in the income statement.
The fair value measurement of companies previously measured at equity totalling €11.9m directly before the acquisition of additional shares, leading to classification as a fully consoli-dated subsidiaries, resulted in a loss of €1.9m.
38 TUI AG Interim Report Q3 2012/13Notes Group of consolidated companies, Acquisitions – divestments
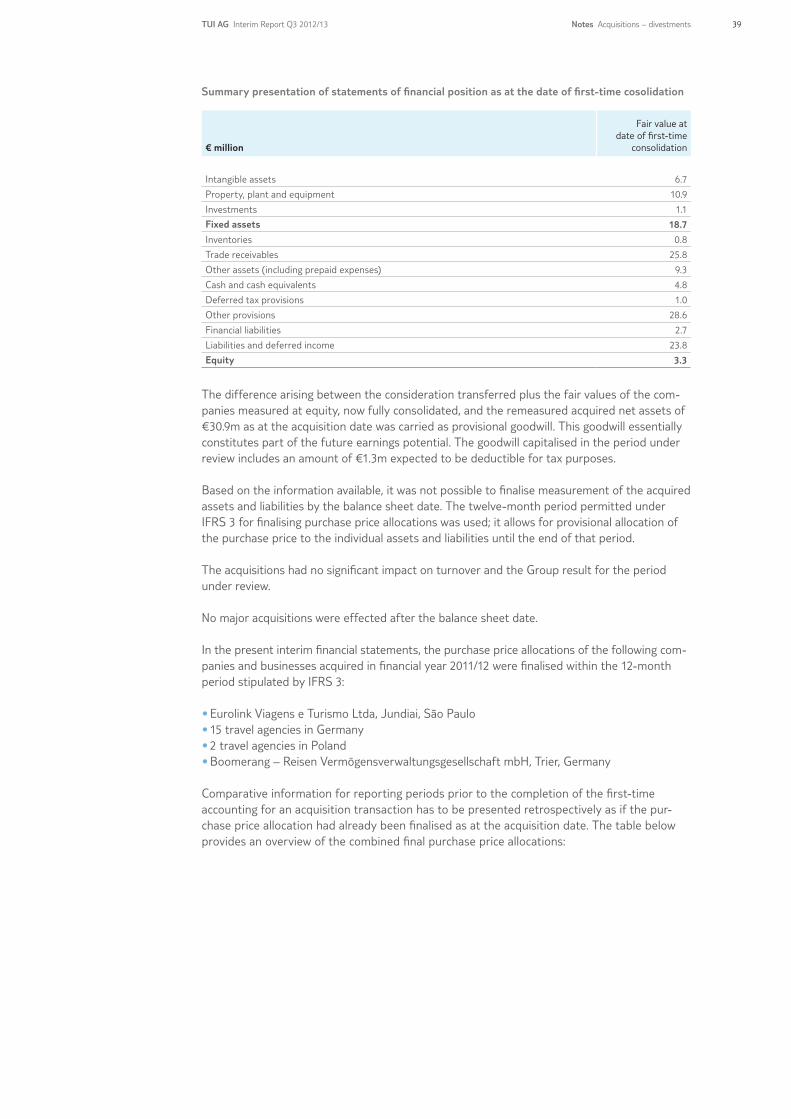
Summary presentation of statements of financial position as at the date of first-time cosolidation
€ million
Fair value at date of first-time
consolidation
Intangible assets 6.7
Property, plant and equipment 10.9
Investments 1.1
Fixed assets 18.7
Inventories 0.8
Trade receivables 25.8
Other assets (including prepaid expenses) 9.3
Cash and cash equivalents 4.8
Deferred tax provisions 1.0
Other provisions 28.6
Financial liabilities 2.7
Liabilities and deferred income 23.8
Equity 3.3
The difference arising between the consideration transferred plus the fair values of the com-panies measured at equity, now fully consolidated, and the remeasured acquired net assets of €30.9m as at the acquisition date was carried as provisional goodwill. This goodwill essentially constitutes part of the future earnings potential. The goodwill capitalised in the period under review includes an amount of €1.3m expected to be deductible for tax purposes.
Based on the information available, it was not possible to finalise measurement of the acquired assets and liabilities by the balance sheet date. The twelve-month period permitted under IFRS 3 for finalising purchase price allocations was used; it allows for provisional allocation of the purchase price to the individual assets and liabilities until the end of that period.
The acquisitions had no significant impact on turnover and the Group result for the period under review.
No major acquisitions were effected after the balance sheet date.
In the present interim financial statements, the purchase price allocations of the following com-panies and businesses acquired in financial year 2011/12 were finalised within the 12-month period stipulated by IFRS 3:
• Eurolink Viagens e Turismo Ltda, Jundiai, São Paulo• 15 travel agencies in Germany • 2 travel agencies in Poland• Boomerang – Reisen Vermögensverwaltungsgesellschaft mbH, Trier, Germany
Comparative information for reporting periods prior to the completion of the first-time accounting for an acquisition transaction has to be presented retrospectively as if the pur-chase price allocation had already been finalised as at the acquisition date. The table below provides an overview of the combined final purchase price allocations:
TUI AG Interim Report Q3 2012/13 39Notes Acquisitions – divestments
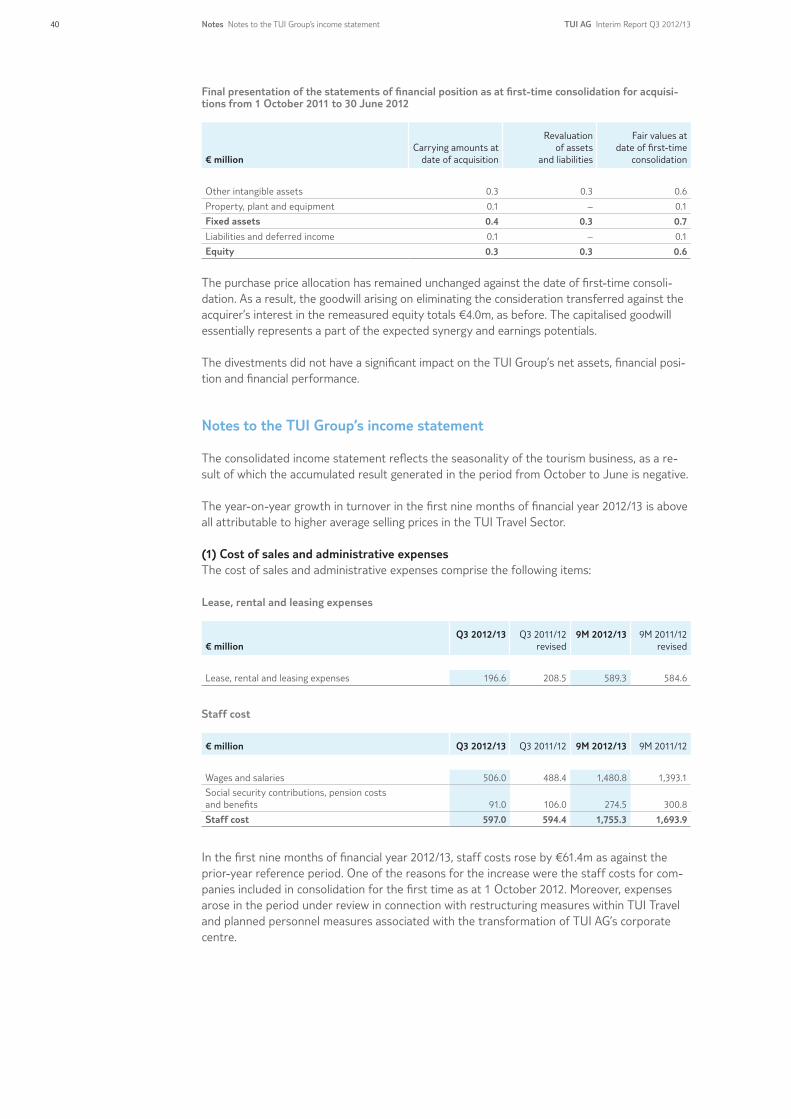
Final presentation of the statements of financial position as at first-time consolidation for acquisi-tions from 1 October 2011 to 30 June 2012
€ millionCarrying amounts at
date of acquisition
Revaluation of assets
and liabilities
Fair values at date of first-time
consolidation
Other intangible assets 0.3 0.3 0.6
Property, plant and equipment 0.1 – 0.1
Fixed assets 0.4 0.3 0.7
Liabilities and deferred income 0.1 – 0.1
Equity 0.3 0.3 0.6
The purchase price allocation has remained unchanged against the date of first-time consoli-dation. As a result, the goodwill arising on eliminating the consideration transferred against the acquirer’s interest in the remeasured equity totals €4.0m, as before. The capitalised goodwill essentially represents a part of the expected synergy and earnings potentials.
The divestments did not have a significant impact on the TUI Group’s net assets, financial posi-tion and financial performance.
Notes to the TUI Group’s income statement
The consolidated income statement reflects the seasonality of the tourism business, as a re-sult of which the accumulated result generated in the period from October to June is negative.
The year-on-year growth in turnover in the first nine months of financial year 2012/13 is above all attributable to higher average selling prices in the TUI Travel Sector.
(1) Cost of sales and administrative expensesThe cost of sales and administrative expenses comprise the following items:
Lease, rental and leasing expenses
€ millionQ3 2012/13 Q3 2011/12
revised9M 2012/13 9M 2011/12
revised
Lease, rental and leasing expenses 196.6 208.5 589.3 584.6
Staff cost
€ million Q3 2012/13 Q3 2011/12 9M 2012/13 9M 2011/12
Wages and salaries 506.0 488.4 1,480.8 1,393.1
Social security contributions, pension costs and benefits 91.0 106.0 274.5 300.8
Staff cost 597.0 594.4 1,755.3 1,693.9
In the first nine months of financial year 2012/13, staff costs rose by €61.4m as against the prior-year reference period. One of the reasons for the increase were the staff costs for com-panies included in consolidation for the first time as at 1 October 2012. Moreover, expenses arose in the period under review in connection with restructuring measures within TUI Travel and planned personnel measures associated with the transformation of TUI AG’s corporate centre.
40 TUI AG Interim Report Q3 2012/13Notes Notes to the TUI Group’s income statement

The decline in social security contributions and pension costs and benefits was mainly attri-butable to income of €28.8m from the curtailment and settlement of pension plans in a Dutch subsidiary. Depreciation/amortisation/impairments
€ million Q3 2012/13 Q3 2011/12 9M 2012/13 9M 2011/12
Depreciation and amortisation 92.7 92.1 276.1 258.0
Impairments of property, plant and equipment 11.0 17.7 41.6 17.7
Total 103.7 109.8 317.7 275.7
The impairments carried for the third quarter of the financial year under review mainly include impairments of intangible assets of €7.6m. In the second quarter, impairments had included €21.2m for property, plant and equipment in Tenuta di Castelfalfi S.p.A. and €6.4m for the fair value measurement of an aircraft held for sale (in Q3 €6.6m due to foreign exchange effects).
The impairments carried in the prior year reference period mainly included impairments of hotel facilities to their fair value.
(2) Other income /other expenses
Other income/other expenses
€ million Q3 2012/13 Q3 2011/12 9M 2012/13 9M 2011/12
Other income 10.5 50.8 28.5 66.2
Other expenses 5.2 – 6.4 0.8
Total 5.3 50.8 22.1 65.4
Other income for the current financial year 2012/13 mainly results from the book profit from the sale of a hotel of the Riu Group in December 2012 and profits from sale-and-lease-back transactions for aircraft.
The other income carried for the first nine months of the prior year primarily resulted from the disposal of a part of the hybrid instrument granted to Hapag-Lloyd Holding AG and the measurement of the investment in Container Shipping.
In the third quarter of 2012/13, other expenses primarily relate to losses from sale-and-lease-back transactions in connection with the delivery of aircraft.
(3) Goodwill impairmentsA strategic review of the business plan of the Castelfalfi project, completed in the second quarter of 2012/13, resulted in an adjustment of the medium-term sales and investment planning. The main reasons for the adjustment of the medium-term sales planning were modifications of the concept and a reassessment of the marketability of individual high-quality properties. The investment planning was updated in order to reflect the sales ratios now sought and optimise planned infrastructure investments.
On the basis of the adjusted business plan, an impairment charge of €34.1m arose in the Hotels & Resorts segment in the period under review. It includes goodwill impairments of €8.3m. The other impairments relate to impairments of land and buildings of €21.2m, and a devaluation of current assets of €4.6m.
TUI AG Interim Report Q3 2012/13 41Notes Notes to the TUI Group’s income statement
(4) Financial resultThe financial result for the first nine months of the prior year had included measurement effects of €5.1m from hybrid instruments granted to Hapag-Lloyd Holding AG and interest income of €11.9m associated with these hybrid instruments. The hybrid instruments were fully redeemed in financial year 2011/12 so that the financial income declined in the period under review.
The decrease in financial expenses mainly results from the reduction in financial liabilities in the period under review. The financial result in the third quarter of the prior year had also been impacted by expenses for the write-down of a financial investment. An opposite effect on financial expenses results from subsequent measurement of liabilities to banks in the first nine months of financial year 2012/13.
(5) Share of result of joint ventures and associates
Share of result of joint ventures and associates
€ million Q3 2012/13 Q3 2011/12 9M 2012/13 9M 2011/12
Tourism 19.5 12.4 42.7 13.9
Container Shipping 3.9 - 3.0 - 25.4 - 61.7
Total 23.4 9.4 17.3 - 47.8
The improvement in the result by Tourism in the first nine months of 2012/13 was driven in particular by the positive development of the Russian market and the Iberotel Group and the increase in the profit contribution by TUI Cruises. Moreover, the result posted for the prior-year reference period was impacted by the write-down of a shareholding in a Greek hotel property company.
In the first nine months, the year-on-year improvement in the share of result of Container Shipping mainly resulted from a reduction in the stake in Hapag-Lloyd Holding AG from 38.4% to 22.0% in June 2012 and a positive operating profit contribution by Hapag-Lloyd in the third quarter of 2012/13.
(6) AdjustmentsIn addition to the disclosures required under IFRS, the consolidated income statement com-prises a reconciliation to underlying earnings. The adjustments show deconsolidation income as gains on disposal, events according to IAS 37 as restructuring measures and all effects of purchase price allocations, incidental acquisition costs and contingent considerations on EBITA as purchase price allocations.
The one-off items carried as adjustments are income (-) and expenses (+) impacting or distort-ing the assessment of the operating earnings power of the Sectors and the Group due to their levels and frequencies. These one-off items include in particular major restructuring and integration expenses not meeting the criteria of IAS 37, major expenses for litigation, profits and losses from the sale of aircraft and other material business transactions with a one-off character.
One-off items by sector
€ million Q3 2012/13 Q3 2011/12 9M 2012/13 9M 2011/12
Tourism - 25.8 34.0 44.6 46.0
TUI Travel - 18.3 33.6 - 22.8 45.6
TUI Hotels & Resorts – 0.4 25.9 0.4
Cruises - 7.5 – 41.5 –
All other segments 0.6 1.9 8.0 - 11.4
Total - 25.2 35.9 52.6 34.6
42 TUI AG Interim Report Q3 2012/13Notes Notes to the TUI Group’s income statement

In the period under review, the one-off items carried by TUI Travel mainly include income from the curtailment and settlement of pension plans in the Netherlands and income from sale-and-lease-back transactions for aircraft. This income is carried alongside expenses incurred, inter alia, in connection with the restructuring of airline activities in France and the reorganisa-tion of the Specialist & Activity Business.
In the first nine months of the prior year, the adjustments carried by TUI Travel included in particular expenses in connection with the restructuring of the tour operator and airline busi-ness in France (Convergence project) and expenses for the restructuring of the Specialist & Activity Business.
In the Hotels & Resorts Sector, adjustments in the period under review related to impairments in the hotel project Castelfalfi, carried as a one-off item.
The one-off items carried as adjustments in the Cruises Sector in the first nine months of 2012/13 mainly relate to expenses for risk provisioning in Hapag-Lloyd Kreuzfahrten for a pending liability from the long-term charter contract for Europa 2. Due to the utilisation of a part of this provision for pending liabilities in the third quarter of 2012/13, adjusted expenses decreased by €7.5m.
One-off items carried under other segments in the period under review above all relate to one-off expenses for the fair value measurement of an aircraft held for sale.
In the first nine months of the prior year, the one-off items carried under other segments mainly related to income from the reversal of a provision and a subsequent reduction in acquisition costs for shares which had meanwhile been sold. This income was partly offset by expenses incurred in connection with safeguarding measures for former industrial and mining activities in the Harz Mountains and the early retirement of an Executive Board member.
(7) Income taxesThe tax income posted for the first nine months of the year is mainly attributable to the sea-sonality of the tourism business.
(8) Group profit/loss attributable to non-controlling interest
Group profit/loss attributable to non-controlling interest
€ million Q3 2012/13 Q3 2011/12 9M 2012/13 9M 2011/12
TUI Travel 1.9 1.5 - 134.6 - 152.2
TUI Hotels & Resorts 8.2 11.1 38.2 35.1
Total 10.1 12.6 - 96.4 - 117.1
Notes to the financial position of the TUI Group
The changes in the consolidated statement of financial position as against 30 September 2012 primarily reflect the seasonality of the tourism business.
Assets held for sale of €12.7m (€16.5m as at 30 September 2012) mainly include aircraft and hotel assets owned by a French hotel group. The decrease of €3.8m as against 30 Septem-ber 2012 is mainly driven by the sale of two hotels of this hotel group.
TUI AG Interim Report Q3 2012/13 43Notes Notes to the financial position of the TUI Group

Pension provisions declined by 144.0m to €1,042.6m as against the beginning of the financial year. This was caused by slightly higher interest rates levels in Germany and the UK and in par-ticular a rise in the value of the associated pension fund assets in the UK and the weaker pound sterling. Pension obligations also declined due to the curtailment and settlement of the pension plans of a Dutch subsidiary. In contrast, obligations rose due to the acquisition of TUI InfoTec.
Non-current financial liabilities rose by a total of €118.6m to €1,929.1m as against 30 Septem-ber 2012. The increase mainly results from the financing of the acquisition of aircraft.
The decline in current financial liabilities of €393.3m as against 30 September 2012 results from various factors including the full repayment of liabilities to banks in connection with an exchangeable bond issued by Nero Finance worth €206.3m. In addition, a bond with a carrying amount of €232.8m maturing in December 2012 was repaid in full as scheduled in December 2012. On the other hand, financial liabilities grew by €36.0m due to short-term financing agreements in connection with aircraft acquisition transactions.
Other liabilities rose in line with the seasonal swing in tourism due to advance payments received from customers.
Changes in equity
Since 30 September 2012, equity decreased by €377.9m overall to €1,689.2m.
Equity declined due to the payment of dividends to non-Group shareholders, primarily dividends of TUI Travel PLC and RIUSA II S.A. Moreover, the interest on the hybrid capital issued by TUI AG also has to be carried as a dividend in accordance with IFRS rules.
In the framework of long-term incentive programmes, TUI Travel PLC compensates its employ-ees in the form of stock option plans serviced with shares. These stock option plans resulted in an increase in pre-tax equity of €13.5m outside profit and loss in the period under review.
TUI AG opted to receive a part of the interim dividend paid by TUI Travel PLC in October in shares, thus acquiring additional shares in TUI Travel PLC. TUI Travel PLC itself acquired own shares in order to use them for its stock option plan. The statutory elimination of these costs against revenue reserves led to a decline in equity of €25.5m.
In the second quarter, TUI AG redeemed liabilities to banks in connection with an exchange-able bond worth €66.3m by means of disposing of shares in TUI Travel PLC. The resulting reduction in the stake held had to be eliminated against revenue reserves.
The Group result is negative due to the seasonality of the tourism business.
The after-tax results directly to be eliminated against equity from higher fair values of cash flow hedges totalled €68.6m.
In the period under review, pension obligations declined, primarily due to the increase in the long-term interest rate levels in Germany and the UK and the rise in the value of associated assets in the UK. This resulted in an after-tax increase in the reserves in accordance with IAS 19 included in equity of €49.2m.
44 TUI AG Interim Report Q3 2012/13Notes Changes in equity
Contingent liabilities
As at 30 June 2013, contingent liabilities totalled €407.7m (as at 30 September 2012 €480.8m). Contingent liabilities are carried at the level of estimated settlement as at the balance sheet date. They mainly relate to the assumption of liability for the benefit of Hapag-Lloyd AG for collateralised ship financing schemes and the assumption of liability for the benefit of TUI Cruises GmbH.
Other financial liabilities
Financial commitments from operating lease, rental and charter contracts
€ million 30 Jun 2013 30 Sep 2012
Nominal value 3,336.1 3,089.6
Fair value 2,953.8 2,770.3
As at 30 June 2013, the financial commitments from operating lease, rental and charter con-tracts rose by €246.5m to €3,336.1m as against 30 September 2012. This increase is mainly attributable to the commissioning of several aircraft, for which corresponding leasing obliga-tions were carried. An opposite effect was caused in particular by the contractual repayment of rental and leasing obligations for hotel and club facilities and aircraft.
Nominal values of other financial commitments
€ million 30 Jun 2013 30 Sep 2012adjusted
Order commitments in respect of capital expenditure 3,406.2 1,945.8
Other financial commitments 109.5 166.8
Total 3,515.7 2,112.6
Fair value 3,010.6 1,968.6
As at 30 June 2013, the order commitments in respect of capital expenditure, almost exclusively relating to Tourism, rose by €1,460.4m versus 30 September 2012. This was driven by several factors, including the order of new aircraft and related equipment as part of TUI Travel’s fleet renewal strategy, offset by scheduled down-payments and the delivery of previously ordered aircraft.
Notes to the cash flow statement of the TUI Group
Based on the after-tax Group result, the cash flow from operating activities is determined using the indirect method. In the period under review, cash and cash equivalents declined by €571.8m to €1,706.6m.
In the period under review, the inflow of cash from operating activities was €426.4m (previ-ous year €141.7m). The increase in the inflow of cash is primarily due to higher working capital due to price and volume increases for tours to be effected in the next few quarters.
The outflow of cash from investing activities totalled €356.9m. It comprises a cash outflow for investments in property, plant and equipment and intangible assets of €355.0m by the TUI Travel Group and of €56.1m by the hotel companies as well as an inflow of cash of €171.9m generated from the sale of aircraft by TUI Travel and the sale of a Majorcan hotel of the Riu Group. The cash outflow from investing activities also includes payments of €114.2m for the acquisition of consolidated companies and for capital increases in joint ventures and associates.
TUI AG Interim Report Q3 2012/13 45Notes Contingent liabilities, other financial liabilities, Notes to the chash flow statement
The outflow of cash from financing activities totalled €647.3m. TUI AG paid €233.0m for the scheduled redemption of bonds maturing in December 2012 and a further €160.9m to repay liabilities due to banks due in April 2013. TUI Travel fully repaid the long-term credit facility which was used at the beginning of the reporting period in order to finance the tourism season. Moreover, companies of the TUI Travel Group redeemed further credits worth €18.4m and liabilities from finance leases worth €32.1m. The hotel companies repaid credits worth €28.3m. On the other hand, companies of the TUI Travel Group took out loans worth €72.6m, above all to finance aircraft, while the hotel companies took out €12.8m. An amount of €131.2m was used for interest payments. Further payments made related to the dividend for TUI AG’s hybrid bond (€31.5m) and the dividend for the minority shareholders of TUI Travel PLC and RIUSA II S.A. (€91.2m).
Cash and cash equivalents also increased by €6.0m due to changes in exchange rates.
As at 30 June 2013, cash and cash equivalents worth €108.3m were subject to restraints on disposal. They included an amount of €55.8m for reimbursements of advance VAT payments in Belgium, deposited in full as bank collateral. The other restricted cash relates to cash and cash equivalents managed by Group-owned insurance companies due to legal requirements.
Segment indicators
Turnover by divisions and sectors for the period from 1 October 2012 to 30 June 2013
€ million External GroupQ3 2012/13
Total External Group9M 2012/13
Total
Tourism 4,674.0 3.4 4,677.4 11,507.0 13.5 11,520.5
TUI Travel 4,536.3 2.2 4,538.5 11,030.2 20.5 11,050.7
TUI Hotels & Resorts 70.3 114.9 185.2 288.8 267.1 555.9
Cruises 67.4 – 67.4 188.0 – 188.0
Consolidation – - 113.7 - 113.7 – - 274.1 - 274.1
All other segments 5.0 10.2 15.2 11.4 17.2 28.6
Consolidation – - 13.6 - 13.6 – - 30.7 - 30.7
Total 4,679.0 – 4,679.0 11,518.4 – 11,518.4
Turnover by divisions and sectors for the period from 1 October 2011 to 30 June 2012
€ million External GroupQ3 2011/12
Total External Group9M 2011/12
Total
Tourism 4,713.4 3.8 4,717.2 11,420.6 12.3 11,432.9
TUI Travel 4,563.5 5.4 4,568.9 10,996.4 16.6 11,013.0
TUI Hotels & Resorts 90.6 103.9 194.5 262.6 302.9 565.5
Cruises 59.3 – 59.3 161.6 – 161.6
Consolidation – - 105.5 - 105.5 – - 307.2 - 307.2
All other segments 11.3 1.7 13.0 34.6 11.3 45.9
Consolidation – - 5.5 - 5.5 – - 23.6 - 23.6
Total 4,724.7 – 4,724.7 11,455.2 – 11,455.2
46 TUI AG Interim Report Q3 2012/13Notes Segment indicators
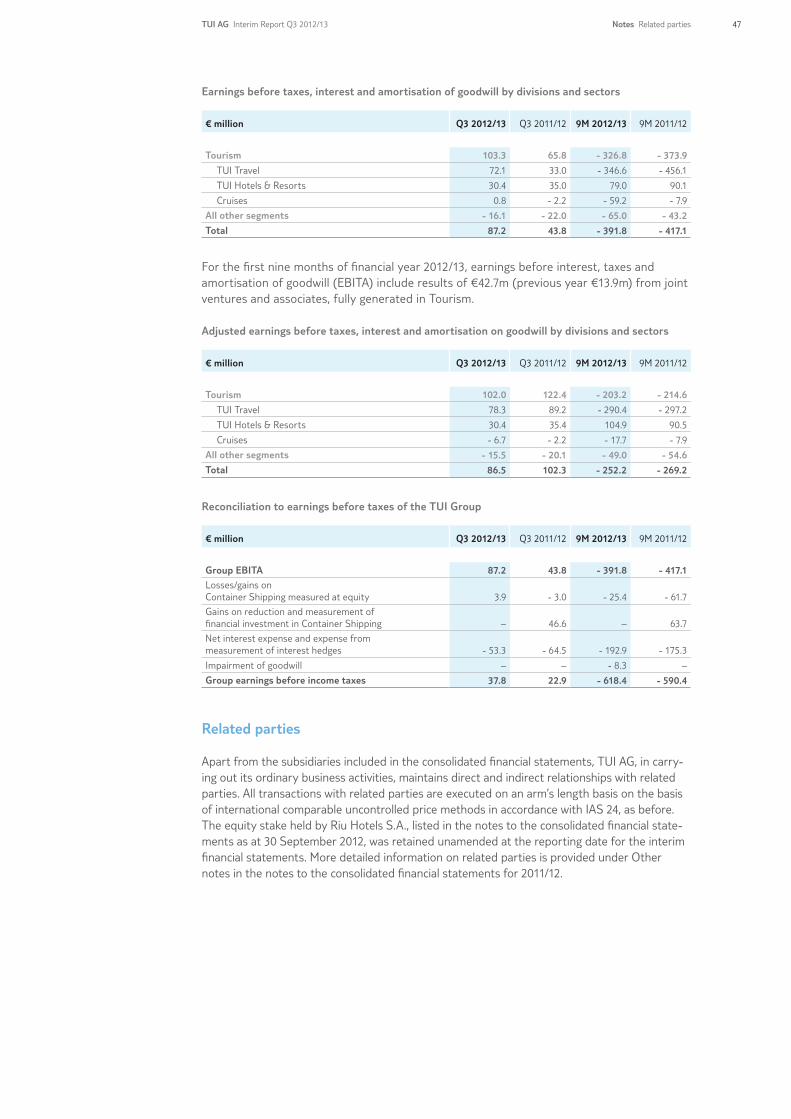
Earnings before taxes, interest and amortisation of goodwill by divisions and sectors
€ million Q3 2012/13 Q3 2011/12 9M 2012/13 9M 2011/12
Tourism 103.3 65.8 - 326.8 - 373.9
TUI Travel 72.1 33.0 - 346.6 - 456.1
TUI Hotels & Resorts 30.4 35.0 79.0 90.1
Cruises 0.8 - 2.2 - 59.2 - 7.9
All other segments - 16.1 - 22.0 - 65.0 - 43.2
Total 87.2 43.8 - 391.8 - 417.1
For the first nine months of financial year 2012/13, earnings before interest, taxes and amortisation of goodwill (EBITA) include results of €42.7m (previous year €13.9m) from joint ventures and associates, fully generated in Tourism.
Adjusted earnings before taxes, interest and amortisation on goodwill by divisions and sectors
€ million Q3 2012/13 Q3 2011/12 9M 2012/13 9M 2011/12
Tourism 102.0 122.4 - 203.2 - 214.6
TUI Travel 78.3 89.2 - 290.4 - 297.2
TUI Hotels & Resorts 30.4 35.4 104.9 90.5
Cruises - 6.7 - 2.2 - 17.7 - 7.9
All other segments - 15.5 - 20.1 - 49.0 - 54.6
Total 86.5 102.3 - 252.2 - 269.2
Reconciliation to earnings before taxes of the TUI Group
€ million Q3 2012/13 Q3 2011/12 9M 2012/13 9M 2011/12
Group EBITA 87.2 43.8 - 391.8 - 417.1
Losses/gains on Container Shipping measured at equity 3.9 - 3.0 - 25.4 - 61.7
Gains on reduction and measurement of financial investment in Container Shipping – 46.6 – 63.7
Net interest expense and expense from measurement of interest hedges - 53.3 - 64.5 - 192.9 - 175.3
Impairment of goodwill – – - 8.3 –
Group earnings before income taxes 37.8 22.9 - 618.4 - 590.4
Related parties
Apart from the subsidiaries included in the consolidated financial statements, TUI AG, in carry-ing out its ordinary business activities, maintains direct and indirect relationships with related parties. All transactions with related parties are executed on an arm’s length basis on the basis of international comparable uncontrolled price methods in accordance with IAS 24, as before. The equity stake held by Riu Hotels S.A., listed in the notes to the consolidated financial state-ments as at 30 September 2012, was retained unamended at the reporting date for the interim financial statements. More detailed information on related parties is provided under Other notes in the notes to the consolidated financial statements for 2011/12.
TUI AG Interim Report Q3 2012/13 47Notes Related parties

Cautionary statement regarding forward-looking statements
The present Half-Year Financial Report contains various statements relating to TUI’s future development. These statements are based on assumptions and estimates. Although we are convinced that these forward-looking statements are realistic, they are not guarantees of future performance since our assumptions involve risks and uncertainties that could cause actual results to differ materially from those anticipated. Such factors include market fluctuations, the development of world market prices for commodities and exchange rates or fundamental changes in the economic environment. TUI does not intend to and does not undertake any obligation to update any forward-looking statements in order to reflect events of developments after the date of this Report.
Financial Calendar
Date
Interim Report Q3 2012/13 8 Aug 2013
Annual Report 2012/13, Press Conference & Analysts' Meeting Dec 2013
Annual General Meeting 2014 12 Feb 2014
48 TUI AG Interim Report Q3 2012/13Financial Calender, Cautionary statement regarding forward-looking statements
Imprint
TUI AGKarl-Wiechert-Allee 430625 HanoverGermanyTel. +49 (0)511 566-00Fax +49 (0)511 566-1901Email [email protected] www.tui-group.com
DesignandproductionKirchhoff Consult AG, Hamburg
TheGermanversionofthisInterimReportislegallybinding.TheCompanycannot beheldresponsibleforanymisunderstandingormisinterpretationarisingfromthis translation.
Bothversionsareavailableontheweb:http://interimreport3-2012-13.tui-group.com

TUI AGKarl-Wiechert-Allee 430625 HanoverGermany