Trwanie życia w 2018 r....sza dekada XXI wieku przyniosła wzrost tej wartości do 8,7 (w latach...
79
Analizy statystyczne Statistical analyses Warszawa 2019 Warsaw Trwanie życia w 2018 r. Life expectancy tables of Poland 2018
Transcript of Trwanie życia w 2018 r....sza dekada XXI wieku przyniosła wzrost tej wartości do 8,7 (w latach...

Analizy statystyczneStatistical analyses
Cena 15,00 złISSN 1507-1340
War
szaw
a
201
9W
arsa
w Trwanie życia w 2018 r.Life expectancy tables of Poland 2018


Główny Urząd Statystyczny Statistics Poland
Warszawa 2019Warsaw
Analizy statystyczneStatistical analyses 04
Trwanie życia w 2018 r.Life expectancy tables of Poland 2018

Opracowanie merytoryczneContent-related worksGłówny Urząd Statystyczny, Departament Badań DemograficznychStatistics Poland, Demographic Surveys Department
pod kierunkiemsupervised by
Dorota Szałtys
Zespół autorskiEditorial team
Maciej Potyra, Katarzyna Góral-Radziszewska
Opracowanie redakcyjneEditorial works
Andrzej Paluchowski
Opracowanie graficzneGraphics
Halina Sztrantowicz
ISSN 1507-1340
Publikacja dostępna na stronie internetowejPublication available on websitestat.gov.pl
Przy publikowaniu danych GUS prosimy o podanie źródłaWhen publishing Statistics Poland data — please indicate the source
00-925 WARSZAWA, AL. NIEPODLEGŁOŚCI 208.Informacje w sprawach sprzedaży publikacji — tel. (22) 608 32 10, 608 38 10 Zam. 270/ 2019/ nakł. 190

Przedmowa
Niniejsza publikacja jest kolejną z serii opracowań Głównego Urzędu Statystycznego, dotyczącą tablic trwania życia. Począwszy od lat 50., w odstępach co pięć lat, ukazywały się publikacje zawierające pełne tablice trwania życia. Równolegle, począwszy od wczesnych lat 70. – przy zastosowaniu innej metody – opracowywano corocznie skrócone tablice trwania życia. W połowie lat 90. metoda obliczeń została ujednolicona i od 1995 r. corocznie opracowywane są tylko tablice pełne, których parametry mogą być prezentowane w dowolnych grupowaniach według wieku, a jednocześnie zapewniają porównywalność wyników z poprzednimi tablicami skróconymi. Tablice trwania życia począwszy od danych za 2012 r. są opracowywane na podstawie bilansów stanu i struktury ludności wyprowadzonych na bazie wyników ostatniego spisu ludności i mieszkań z 2011 roku.
Niniejsza publikacja składa się z trzech części tj. uwag metodologicznych, części analitycznej, w której przedstawiono aktu-alne parametry dotyczące trwania życia i omówiono zmiany, jakie zachodziły w latach 1950-2018, oraz części tabelarycznej, prezentującej wyniki badania, w tym w według województw i podregionów.
Przekazując do Państwa rąk to opracowanie zwracamy się z prośbą o nadsyłanie uwag i sugestii, które stanowić będą cenną wskazówkę w rozwoju tego obszaru badawczego oraz przyczynią się do doskonalenia zarówno treści, jak i formy kolejnych edycji.
Dyrektor PrezesDepartamentu Badań Demograficznych Głównego Urzędu Statystycznego
Dorota Szałtys dr Dominik Rozkrut
Warszawa, lipiec 2019 r.

Preface
This publication is a regular elaboration of the Statistics Poland concerning life tables. Since the 50-ties the publications were released every five years and contained complete life tables. Also, each year since the early 70-ties the abridged life tables were calculated, using an alternative method. Beginning from 1995 both calculation methods have been unified and only complete life tables are prepared. This makes possible the presentation of data according to requested age groups and current method allows for comparability of results with previous abridged life tables. Life expectancy tables since 2012 have been prepared on the base of the size and structure population balances, generated on the results of 2011 population and housing census.
This publication consists of three parts – part 1 sets out methodological notes, part 2 presents current life table parameters and an analysis of changes which took place in period 1950-2018,
part 3 contains life expectancy tables, including those for voivodships and subregions.
Presenting this publication we shall appreciate any comments and suggestions which will be a valuable advice in the de-velopment of this research area as well will contribute to improvement both, the content and the form of the next edition of this publication.
Director President Demographic Surveys Department Statistics Poland
Dorota Szałtys Dominik Rozkrut Ph.D.
Warsaw, July 2019

5
spis treści
Spis treści
Przedmowa . . . . . . . . . . . . . . . . . . . . . . . . . . . . . . . . . . . . . . . . . . . . 3Skróty . . . . . . . . . . . . . . . . . . . . . . . . . . . . . . . . . . . . . . . . . . . . . . . . . .71. Trwanie życia w Polsce – synteza . . . . . . . . . . . . . . . . . . . . . .82. Podstawowe dane ………………………. . . . . . . . . . . . . . .8 3. Zmiany średniej długości życia w latach 1950-2018 . . 124. Przestrzenne zróżnicowanie przeciętnego trwania
życia………………. . . . . . . . . . . . . . . . . . . . . . . . . . . . . . . . . . 154.1. Makroregiony . . . . . . . . . . . . . . . . . . . . . . . . . . . . . . . . . . . 154.2. Województwa . . . . . . . . . . . . . . . . . . . . . . . . . . . . . . . . . . 184.3. Podregiony . . . . . . . . . . . . . . . . . . . . . . . . . . . . . . . . . . . . . 20
5. Porównanie międzynarodowe . . . . . . . . . . . . . . . . . . . . . . . 216. Umieralność w Polsce . . . . . . . . . . . . . . . . . . . . . . . . . . . . . . . 23
6.1. Umieralność według wieku i wybranych grup przyczyn zgonów w latach 1980-2017 . . . . . . . . . . . 25
6.2. Umieralność według województw w 2018 r. . . . . . 326.3. Umieralność według wybranych grup przyczyn
zgonów i województw w 2017 r. . . . . . . . . . . . . . . . . . 347. Podsumowanie . . . . . . . . . . . . . . . . . . . . . . . . . . . . . . . . . . . . . 388. Uwagi metodologiczne .. . . . . . . . . . . . . . . . . . . . . . . . . . . . . 39 9. Wykaz publikacji GUS dotyczących trwania życia . . . . . 44Tablice podstawowe . . . . . . . . . . . . . . . . . . . . . . . . . . . . . . . . . . . 47
Contents
Preface . . . . . . . . . . . . . . . . . . . . . . . . . . . . . . . . . . . . . . . . . . . . . . . . 4Main abbreviations . . . . . . . . . . . . . . . . . . . . . . . . . . . . . . . . . . . . .71. Life expectancy of Poland – synthesis . . . . . . . . . . . . . . . . . .82. Basic data . . . . . . . . . . . . . . . . . . . . . . . . . . . . . . . . . . . . . . . . . . . .83. Changes in the life expectancy in the years
1950-2018 . . . . . . . . . . . . . . . . . . . . . . . . . . . . . . . . . . . . . . . . . . 12 4. Spatial diversity of life expectancy . . . . . . . . . . . . . . . . . . . 15
4.1. Macroregions . . . . . . . . . . . . . . . . . . . . . . . . . . . . . . . . . . . 154.2. Voivodships . . . . . . . . . . . . . . . . . . . . . . . . . . . . . . . . . . . . 184.3. Subregions . . . . . . . . . . . . . . . . . . . . . . . . . . . . . . . . . . . . . 20
5. International comparison . . . . . . . . . . . . . . . . . . . . . . . . . . . 216. Mortality in Poland . . . . . . . . . . . . . . . . . . . . . . . . . . . . . . . . . 23
6.1. Mortality by age and selected groups of death causes in 1980-2017. . . . . . . . . . . . . . . . . . . . . . . . . . . . . 25
6.2. Mortality by voivodships in 2018 . . . . . . . . . . . . . . . . 326.3. Mortality by selected groups of death causes and
voivodships in 2017 . . . . . . . . . . . . . . . . . . . . . . . . . . . . 347. Summary . . . . . . . . . . . . . . . . . . . . . . . . . . . . . . . . . . . . . . . . . . . 388. Methodological notes . . . . . . . . . . . . . . . . . . . . . . . . . . . . . . . 399. List of publications containing Polish complete and
abridged life tables . . . . . . . . . . . . . . . . . . . . . . . . . . . . . . . . . . 44Basic tables . . . . . . . . . . . . . . . . . . . . . . . . . . . . . . . . . . . . . . . . . . . 47

6
list of tables
Spis tablic w tekście
Przeciętne dalsze trwanie życia w Polsce w latach 1950--2018 . . . . . . . . . . . . . . . . . . . . . . . . . . . . . . . . . . . . . . . . . . . . . .Przeciętne dalsze trwanie życia noworodka według makroregionów w 2018 r. . . . . . . . . . . . . . . . . . . . . . . . . . .Przeciętne trwanie życia noworodka według woje-wództw w wybranych latach . . . . . . . . . . . . . . . . . . . . . . .Przeciętne trwanie życia noworodka w krajach Euro-py . . . . . . . . . . . . . . . . . . . . . . . . . . . . . . . . . . . . . . . . . . . . . . . . .Standaryzowane współczynniki zgonów według wy-branych grup przyczyn w latach 1980-2017 . . . . . . . . .Standaryzowane współczynniki zgonów według wo-jewództw w 2018 r. . . . . . . . . . . . . . . . . . . . . . . . . . . . . . . . .Standaryzowane współczynniki zgonów według wy-branych grup przyczyn i województw w 2017 r. . . . . .
Tablice podstawowe
Tablica trwania życia 2018 . . . . . . . . . . . . . . . . . . . . . . . . . .Skrócona tablica trwania życia 2018 . . . . . . . . . . . . . . . .Średnie dalsze trwanie życia według województw w 2018 r. . . . . . . . . . . . . . . . . . . . . . . . . . . . . . . . . . . . . . . . . . . .Średnie dalsze trwanie życia według podregionów w 2018 r. . . . . . . . . . . . . . . . . . . . . . . . . . . . . . . . . . . . . . . . . . . .Tablica trwania życia dla obu płci łącznie w 2018 . . . .Średnie dalsze trwanie życia mężczyzn i kobiet łącznie w 2018 r. . . . . . . . . . . . . . . . . . . . . . . . . . . . . . . . . . . . . . . . . . . .
Tables in text
Life expectancy by age in Poland in 1950-2018 . . . . . . Life expectancy in Poland by macroregions in 2018 Life expectancy at birth by voivodships in selected years . . . . . . . . . . . . . . . . . . . . . . . . . . . . . . . . . . . . . . . . . . . . . . Life expectancy at birth in European countries . . . . . .Standardized death rates by selected groups of causes in 1980-2017 . . . . . . . . . . . . . . . . . . . . . . . . . . . . . . . Standardized death rates by voivodships in 2018 . . . .Standardized death rates by selected groups of cau-ses and voivodships in 2017 . . . . . . . . . . . . . . . . . . . . . . . .
Basic tables
Life table of Poland 2018 . . . . . . . . . . . . . . . . . . . . . . . . . . .Abridged life table of Poland 2018 . . . . . . . . . . . . . . . . . . Life expectancy in Poland by voivodships in 2018 . . . Life expectancy in Poland by subregions in 2018 . . . .Life table for both sexes combined in 2018 . . . . . . . . . . Life expectancy for both sexes combined in 2018 . . .
1
2
3
4
5
6
7
ABC
D
EF
10
15
18
22
26
33
35
4866
68
7072
75

7
spis wykresów
1
23456
7
8
9
10
11
12
13
9
13131414
16
17
20
21
24
28
33
37
Spis wykresów
Przeciętne trwanie życia według płci w latach 1990- -2018 . . . . . . . . . . . . . . . . . . . . . . . . . . . . . . . . . . . . . . . . . . . . . .Przeciętne trwanie życia noworodka w Polsce . . . . . . .Przeciętne dalsze trwanie życia osób w wieku 45 lat Przeciętne dalsze trwanie życia osób w wieku 60 lat Przeciętne dalsze trwanie życia osób w wieku 75 lat Przeciętne trwanie życia noworodka według makrore-gionów w 2018 r. . . . . . . . . . . . . . . . . . . . . . . . . . . . . . . . . . . .Przeciętne trwanie życia noworodka według woje-wództw w 2018 r. . . . . . . . . . . . . . . . . . . . . . . . . . . . . . . . . . .Przeciętne trwanie życia noworodka w wybranych podregionach w 2018 r. . . . . . . . . . . . . . . . . . . . . . . . . . . . .Przeciętne trwanie życia noworodka w krajach euro-pejskich w 2017 r. . . . . . . . . . . . . . . . . . . . . . . . . . . . . . . . . . . Standaryzowane współczynniki zgonów mężczyzn i kobiet według wieku w latach 1980-2018 . . . . . . . . . .Standaryzowane współczynniki zgonów według grup przyczyn w latach 1980-2017 . . . . . . . . . . . . . . . . . . . . . . .Standaryzowane współczynniki zgonów według wo-jewództw w 2018 r. . . . . . . . . . . . . . . . . . . . . . . . . . . . . . . . .Standaryzowane współczynniki zgonów według wy-branych grup przyczyn w 2017 r. . . . . . . . . . . . . . . . . . . .
List of figures
Life expectancy by sex in Poland in 1990-2018 . . . . . .Life expectancy at birth in Poland . . . . . . . . . . . . . . . . . .Life expectancy at age 45 . . . . . . . . . . . . . . . . . . . . . . . . . .Life expectancy at age 60 . . . . . . . . . . . . . . . . . . . . . . . . . .Life expectancy at age 75 . . . . . . . . . . . . . . . . . . . . . . . . . . Life expectancy at birth by macroregions in 2018 . . . Life expectancy at birth by voivodships in 2018 . . . . .Life expectancy at birth in 2018 in selected subre-gions (NTS 3) . . . . . . . . . . . . . . . . . . . . . . . . . . . . . . . . . . . . . . .Life expectancy at birth in European countries in 2017 . . . . . . . . . . . . . . . . . . . . . . . . . . . . . . . . . . . . . . . . . . . . . . .Standardized death rates males and females by age in 1980-2018 . . . . . . . . . . . . . . . . . . . . . . . . . . . . . . . . . . . . . . .Standardized death rates by selected groups of cau-ses in 1980-2017 . . . . . . . . . . . . . . . . . . . . . . . . . . . . . . . . . . . Standardized death rates by voivodships in 2018 . . . .Standardized death by selected groups of causes in 2017 . . . . . . . . . . . . . . . . . . . . . . . . . . . . . . . . . . . . . . . . . . . . . . .
SkrótyMain abbreviations
SkrótAbbreviation
ZnaczenieMeaning
SkrótAbbreviation
ZnaczenieMeaning
r. rok year tj. ie to jest id esttys. thous. tysiąc thousand Dz.u. Dziennik Ustawcd. cont. ciąg dalszy continued poz. pozycjadok. cont. dokończenie continued oprac. opracowanie
8
chapter 2. basis data
1. Trwanie życia w Polsce – synteza
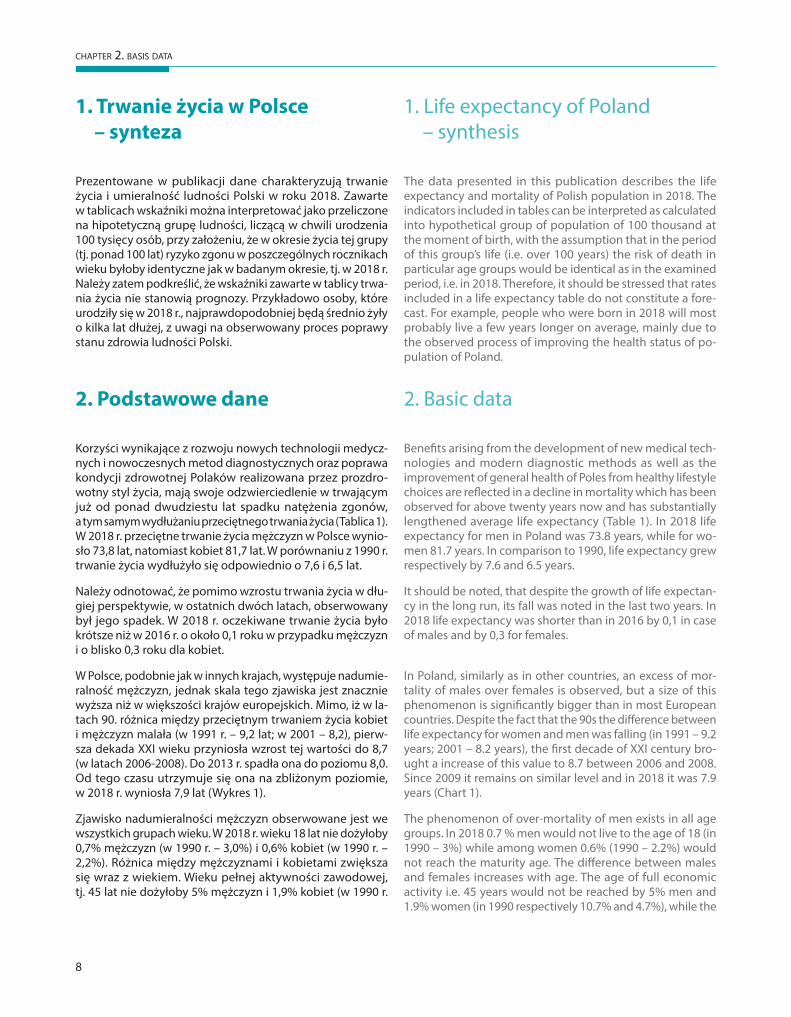
Prezentowane w publikacji dane charakteryzują trwanie życia i umieralność ludności Polski w roku 2018. Zawarte w tablicach wskaźniki można interpretować jako przeliczone na hipotetyczną grupę ludności, liczącą w chwili urodzenia 100 tysięcy osób, przy założeniu, że w okresie życia tej grupy (tj. ponad 100 lat) ryzyko zgonu w poszczególnych rocznikach wieku byłoby identyczne jak w badanym okresie, tj. w 2018 r. Należy zatem podkreślić, że wskaźniki zawarte w tablicy trwa-nia życia nie stanowią prognozy. Przykładowo osoby, które urodziły się w 2018 r., najprawdopodobniej będą średnio żyły o kilka lat dłużej, z uwagi na obserwowany proces poprawy stanu zdrowia ludności Polski.
2. Podstawowe dane
Korzyści wynikające z rozwoju nowych technologii medycz-nych i nowoczesnych metod diagnostycznych oraz poprawa kondycji zdrowotnej Polaków realizowana przez prozdro-wotny styl życia, mają swoje odzwierciedlenie w trwającym już od ponad dwudziestu lat spadku natężenia zgonów, a tym samym wydłużaniu przeciętnego trwania życia (Tablica 1). W 2018 r. przeciętne trwanie życia mężczyzn w Polsce wynio-sło 73,8 lat, natomiast kobiet 81,7 lat. W porównaniu z 1990 r. trwanie życia wydłużyło się odpowiednio o 7,6 i 6,5 lat.
Należy odnotować, że pomimo wzrostu trwania życia w dłu-giej perspektywie, w ostatnich dwóch latach, obserwowany był jego spadek. W 2018 r. oczekiwane trwanie życia było krótsze niż w 2016 r. o około 0,1 roku w przypadku mężczyzn i o blisko 0,3 roku dla kobiet.
W Polsce, podobnie jak w innych krajach, występuje nadumie-ralność mężczyzn, jednak skala tego zjawiska jest znacznie wyższa niż w większości krajów europejskich. Mimo, iż w la-tach 90. różnica między przeciętnym trwaniem życia kobiet i mężczyzn malała (w 1991 r. – 9,2 lat; w 2001 – 8,2), pierw-sza dekada XXI wieku przyniosła wzrost tej wartości do 8,7 (w latach 2006-2008). Do 2013 r. spadła ona do poziomu 8,0. Od tego czasu utrzymuje się ona na zbliżonym poziomie, w 2018 r. wyniosła 7,9 lat (Wykres 1).
Zjawisko nadumieralności mężczyzn obserwowane jest we wszystkich grupach wieku. W 2018 r. wieku 18 lat nie dożyłoby 0,7% mężczyzn (w 1990 r. – 3,0%) i 0,6% kobiet (w 1990 r. – 2,2%). Różnica między mężczyznami i kobietami zwiększa się wraz z wiekiem. Wieku pełnej aktywności zawodowej, tj. 45 lat nie dożyłoby 5% mężczyzn i 1,9% kobiet (w 1990 r.
1. Life expectancy of Poland – synthesis
The data presented in this publication describes the life expectancy and mortality of Polish population in 2018. The indicators included in tables can be interpreted as calculated into hypothetical group of population of 100 thousand at the moment of birth, with the assumption that in the period of this group’s life (i.e. over 100 years) the risk of death in particular age groups would be identical as in the examined period, i.e. in 2018. Therefore, it should be stressed that rates included in a life expectancy table do not constitute a fore-cast. For example, people who were born in 2018 will most probably live a few years longer on average, mainly due to the observed process of improving the health status of po-pulation of Poland.
2. Basic data
Benefits arising from the development of new medical tech-nologies and modern diagnostic methods as well as the improvement of general health of Poles from healthy lifestyle choices are reflected in a decline in mortality which has been observed for above twenty years now and has substantially lengthened average life expectancy (Table 1). In 2018 life expectancy for men in Poland was 73.8 years, while for wo-men 81.7 years. In comparison to 1990, life expectancy grew respectively by 7.6 and 6.5 years.
It should be noted, that despite the growth of life expectan-cy in the long run, its fall was noted in the last two years. In 2018 life expectancy was shorter than in 2016 by 0,1 in case of males and by 0,3 for females.
In Poland, similarly as in other countries, an excess of mor-tality of males over females is observed, but a size of this phenomenon is significantly bigger than in most European countries. Despite the fact that the 90s the difference between life expectancy for women and men was falling (in 1991 – 9.2 years; 2001 – 8.2 years), the first decade of XXI century bro-ught a increase of this value to 8.7 between 2006 and 2008. Since 2009 it remains on similar level and in 2018 it was 7.9 years (Chart 1).
The phenomenon of over-mortality of men exists in all age groups. In 2018 0.7 % men would not live to the age of 18 (in 1990 – 3%) while among women 0.6% (1990 – 2.2%) would not reach the maturity age. The difference between males and females increases with age. The age of full economic activity i.e. 45 years would not be reached by 5% men and 1.9% women (in 1990 respectively 10.7% and 4.7%), while the

9
rozdział 2. podstawowe dane
7,0
7,5
8,0
8,5
9,0
9,5
0
20
40
60
80
100
Przeciętne trwanie życia Life expectancy
Różnica w latach Difference in years
RóżnicaDifference
MężczyźniMales
KobietyFemales
201820161990 1992 1994 1996 1998 2000 2002 2004 2006 2008 2010 2012 2014
Wykres 1. Przeciętne trwanie życia według płci w latach 1990-2018 Chart 1. Life expectancy by sex in Poland in 1990-2018
Przeciętne dalsze trwanie życia osoby w wieku x lat oznaczane jest w literaturze przez ex i wyraża średnią liczbę lat jaką ma do przeżycia – przy danych warunkach umieralności populacji – osoba w wieku x ukończonych lat. Na szczególną uwagę zasługuje parametr e0 nazywany przeciętnym trwaniem życia noworodka (lub krócej – przeciętnym trwaniem życia). W tablicach trwania życia za 2018 r., obliczonych na podstawie liczby osób zmarłych w 2018 r., wielkość e0 (dla chłopca w wieku 0 lat) wynosi 73,8 lat. Oznacza to, że gdyby przez całe życie mężczyzny urodzonego w 2018 r. warunki umieral-ności ludności nie ulegały żadnym zmianom, to dożyłby on przeciętnie właśnie tego wieku. Aby prawidłowo interpretować tablicę przeciętnego dalszego trwania życia należy pamiętać, że każda podana w niej wielkość jest obwarowana dwoma warunkami – utrzymania schematu umieralności na poziomie z danego roku oraz dożyciem do wskazanego wieku.I tak – zgodnie z tablicą trwania życia za 2018 r. – średnie dalsze trwanie życia dla mężczyzny w wieku 30 lat, wynosi 44,9 lat życia, czyli przeciętnie dożyłby on wieku 74,9 lat – zatem więcej niż chłopiec urodzony w 2018 r. Szanse dożycia kolejnych urodzin wzrastają wraz z wiekiem. Dla mężczyzny mającego ukończonych 60 lat, przeciętne dalsze trwanie życia wynosi 19,1 lat, a więc średnio dożyłby 79,1 lat.
odpowiednio 10,7% i 4,7%), natomiast wieku 75 lat 46,3% mężczyzn i 23,9% kobiet (w 1990 r. 63,9% i 37,5%).
W 2018 r. przeciętne dalsze trwanie życia 15-latków wyno-siło dla chłopca 59,3 lat, natomiast dla dziewczynki 67,1. W porównaniu z 1990 r. jest to o 6,2 lat więcej w przypadku chłopców i o 5,3 roku więcej w przypadku dziewcząt. Z ko-lei średnie dalsze trwanie życia 45-latków wynosiło 31,1 lat dla mężczyzn i 37,7 lat dla kobiet, co w stosunku do 1990 r. oznacza wydłużenie przeciętnego trwania życia mężczyzn o 5 lat i kobiet o 4,7 lat.
W 2018 r. przeciętne trwanie życia mężczyzn zamieszkałych w miastach wynosiło 74,2 lata, tj. o rok więcej niż mężczyzn na wsi, natomiast mieszkanki zarówno miast, jak i wsi żyły średnio 81,6 lat. Obecnie w miastach kobiety żyją o 7,4 lat dłużej niż mężczyźni (w 1991 r. – prawie 9; w 2001 – 7,8), natomiast na wsi o 8,4 lat (w 1991 r. – 9,7, w 2001 – 8,8).
age of 75 years by as many as 46.3% men and 23.9% women (in 1990 – 63.9% and 37.5%).
In 2018, the life expectancy of 15-year-olds was 59.3 years for males and 67.1 for females. In comparison to 1990 it is 6.2 years more for males and 5.3 years for females. Life expectancy of the 45-year-olds was 31.1 years for men and 37.7 for wo-men, which in relation to 1990 means an increase in the life expectancy by 5 years for males and by 4.7 years for females.
In 2018, the life expectancy for males living in urban areas was 74.2 years which is a year longer than for males in rural areas. Females both in urban areas and rural areas lived on average 81.6 years. Nowadays females in urban areas live 7.4 years longer than males (in 1991 – almost 9; in 2001 – 7.8) while in rural areas the difference is 8.4 years (in 1991 – 9.7; in 2001 – 8.8).

10
chapter 2. basis data
Tablica 1. Przeciętne dalsze trwanie życia w Polsce w latach 1950-20181 Table 1. Life expectancy by age in Poland in 1950-20181
LataYears
Mężczyźni Males Kobiety FemalesWedług wieku by age
0 15 30 45 60 75 0 15 30 45 60 75
1950 56,1 51,0 38,1 25,5 14,6 6,9 61,7 55,7 42,3 29,2 17,1 7,8
1951 55,1 50,6 37,7 25,0 14,2 6,5 60,7 55,1 41,9 28,7 16,6 7,5
1952 57,6 51,3 38,2 25,4 14,4 6,8 63,1 55,8 42,4 29,1 16,9 7,7
1953 59,6 52,7 39,3 26,1 14,8 6,9 65,1 57,2 43,2 29,6 17,2 7,8
1954 59,8 52,4 38,8 25,6 14,2 6,3 65,1 56,7 42,7 29,1 16,6 7,2
1955 60,8 53,3 39,7 26,5 15,1 7,2 66,2 57,8 43,7 30,0 17,5 8,1
1956 62,3 53,7 40,0 26,6 15,1 7,1 67,5 58,1 43,9 30,2 17,6 7,9
1957 61,2 53,0 39,4 26,1 14,6 6,8 66,7 57,7 43,5 29,8 17,2 7,6
1958 63,1 54,6 40,9 27,5 15,8 7,5 68,6 59,1 44,8 31,0 18,2 8,2
1959 62,7 54,0 40,3 27,0 15,2 7,1 68,3 58,9 44,6 30,7 17,9 7,9
1960 64,9 55,0 41,1 27,7 15,9 7,5 70,6 59,9 45,5 31,6 18,7 8,6
1961 64,9 54,8 41,0 27,6 15,8 7,7 70,8 60,0 45,6 31,6 18,7 8,7
1962 64,5 54,4 40,6 27,3 15,4 7,3 70,5 59,7 45,3 31,3 18,4 8,4
1963 65,4 55,0 41,2 27,8 15,9 7,5 71,5 60,3 45,8 31,9 18,9 8,8
1964 65,8 55,1 41,2 27,7 15,7 7,4 71,6 60,3 45,8 31,7 18,7 8,6
1965 66,6 55,5 41,5 28,1 16,1 7,7 72,4 60,6 46,1 32,1 19,0 8,8
1966 66,9 55,6 41,6 28,2 16,2 7,8 72,9 60,9 46,4 32,3 19,3 8,9
1967 66,4 55,1 41,1 27,7 15,8 7,4 72,6 60,6 46,0 31,9 18,9 8,5
1968 67,0 55,3 41,4 27,9 16,1 7,9 73,6 61,3 46,7 32,6 19,6 9,4
1969 66,5 54,8 40,8 27,4 15,6 7,6 73,1 60,8 46,3 32,1 19,2 8,9
1970 66,6 54,8 40,9 27,5 15,7 7,6 73,3 61,0 46,5 32,3 19,2 8,9
1971 66,1 54,0 40,1 26,8 15,0 6,8 73,3 60,6 46,1 31,9 18,9 8,5
1972 67,3 55,1 41,2 27,8 16,0 7,6 74,2 61,5 46,9 32,7 19,6 9,0
1973 67,2 54,8 40,8 27,5 15,8 7,3 74,3 61,4 46,8 32,6 19,5 8,9
1974 67,8 55,2 41,1 27,7 16,0 7,5 74,6 61,6 47,0 32,8 19,7 9,0
1975 67,0 54,5 40,6 27,3 15,7 7,2 74,3 61,3 46,7 32,5 19,4 8,7
1976 66,9 54,3 40,3 27,1 15,7 7,3 74,6 61,5 46,9 32,7 19,6 9,0
1977 66,5 53,9 40,1 26,9 15,6 7,2 74,5 61,5 46,9 32,7 19,7 9,0
1978 66,4 53,7 39,8 26,7 15,5 7,1 74,5 61,4 46,8 32,6 19,6 8,8
1979 66,8 54,0 40,1 26,9 15,7 7,3 74,9 61,6 47,1 32,8 19,8 9,1
1980 66,0 53,1 39,2 26,2 15,2 6,9 74,4 61,2 46,5 32,4 19,4 8,8
1981 67,1 54,2 40,3 27,0 15,8 7,5 75,2 61,9 47,3 33,1 20,1 9,4
1982 67,2 54,3 40,3 27,1 15,8 7,5 75,2 61,9 47,3 33,1 20,1 9,4
1983 67,0 54,0 40,0 26,8 15,7 7,4 75,2 61,8 47,2 32,9 19,9 9,3
1984 66,8 53,7 39,7 26,5 15,5 7,3 75,0 61,5 46,9 32,7 19,7 9,1
1985 66,5 53,3 39,2 26,0 15,1 7,0 74,8 61,3 46,7 32,5 19,5 9,0
1 Parametry trwania życia dla lat 1990-1994 zostały przeliczone zgodnie z definicją urodzenia i zgonu noworodka obowiązującą od 1994 r. („Zeszyt metodologiczny – Ruch naturalny. Bilanse ludności”, 2018, Strony 11, 34, https://stat.gov.pl/obszary-tematyczne/ludnosc/ludnosc/zeszyt-metodologiczny-ruch-naturalny-bilanse-ludnosci,37,1.html, dostęp z dnia 31.05.2019)
Life tables for 1990-1994 have been recalculated according to the birth and infant death definition implemented in 1994. (“Methodological report – Vital statistics. Balances of population”, 2018. Pages 11, 34, https://stat.gov.pl/obszary-tematyczne/ludnosc/ludnosc/zeszyt-metodologiczny-ruch-naturalny-bilanse-ludnosci,37,1.html, access on 31.05.2019)

11
rozdział 2. podstawowe dane
LataYears
Mężczyźni Males Kobiety FemalesWedług wieku by age
0 15 30 45 60 75 0 15 30 45 60 75
1986 66,8 53,4 39,4 26,1 15,3 7,3 75,1 61,5 46,9 32,7 19,7 9,2
1987 66,8 53,5 39,4 26,1 15,3 7,3 75,2 61,6 46,9 32,7 19,8 9,3
1988 67,2 53,7 39,6 26,4 15,5 7,5 75,7 61,9 47,2 33,0 20,1 9,5
1989 66,8 53,3 39,3 26,2 15,4 7,6 75,5 61,8 47,1 32,9 19,9 9,5
1990 66,2 53,1 39,1 26,1 15,3 7,5 75,2 61,8 47,2 33,0 20,0 9,5
1991 65,9 52,6 38,6 25,7 15,1 7,4 75,1 61,6 46,9 32,7 19,8 9,3
1992 66,5 53,1 39,1 26,1 15,4 7,7 75,5 61,9 47,3 33,1 20,1 9,5
1993 67,2 53,7 39,6 26,4 15,5 7,7 75,8 62,2 47,5 33,2 20,1 9,4
1994 67,5 53,9 39,9 26,7 15,8 7,8 76,1 62,4 47,7 33,5 20,4 9,6
1995 67,6 53,9 39,8 26,7 15,8 7,9 76,4 62,6 47,9 33,6 20,5 9,7
1996 68,1 54,3 40,2 26,9 15,9 7,9 76,6 62,7 48,0 33,7 20,5 9,7
1997 68,5 54,5 40,4 27,1 16,1 8,2 77,0 62,9 48,2 33,9 20,8 9,9
1998 68,9 54,8 40,7 27,4 16,4 8,4 77,3 63,2 48,5 34,2 21,0 10,0
1999 68,8 54,8 40,6 27,3 16,3 8,3 77,5 63,3 48,6 34,3 21,1 10,1
2000 69,7 55,6 41,4 27,9 16,7 8,6 78,0 63,8 49,0 34,7 21,5 10,4
2001 70,2 56,0 41,8 28,3 17,0 8,8 78,4 64,1 49,4 35,0 21,8 10,6
2002 70,4 56,2 42,0 28,5 17,2 8,8 78,8 64,5 49,8 35,4 22,2 10,8
2003 70,5 56,3 42,0 28,5 17,1 8,7 78,9 64,6 49,8 35,4 22,2 10,8
2004 70,7 56,4 42,1 28,6 17,4 8,9 79,2 64,9 50,1 35,7 22,5 11,0
2005 70,8 56,5 42,2 28,7 17,5 9,0 79,4 65,0 50,3 35,8 22,7 11,2
2006 70,9 56,6 42,3 28,8 17,7 9,1 79,6 65,2 50,5 36,0 22,8 11,3
2007 71,0 56,6 42,4 28,8 17,7 9,1 79,7 65,3 50,6 36,1 22,9 11,4
2008 71,3 56,9 42,6 29,1 17,9 9,2 80,0 65,5 50,8 36,3 23,1 11,5
2009 71,5 57,1 42,9 29,3 17,9 9,2 80,1 65,6 50,9 36,4 23,2 11,6
2010 72,1 57,6 43,3 29,7 18,3 9,5 80,6 66,1 51,3 36,8 23,5 11,9
2011 72,4 58,0 43,7 30,0 18,5 9,7 80,9 66,4 51,6 37,1 23,8 12,1
2012 72,7 58,2 43,9 30,2 18,6 9,7 81,0 66,5 51,7 37,1 23,8 12,2
2013 73,1 58,6 44,3 30,5 18,7 9,8 81,1 66,6 51,8 37,3 23,9 12,3
2014 73,8 59,2 44,9 31,0 19,2 10,1 81,6 67,1 52,3 37,7 24,3 12,6
2015 73,6 59,0 44,7 30,8 19,0 10,0 81,6 67,0 52,2 37,6 24,1 12,5
2016 73,9 59,4 45,0 31,2 19,3 10,3 81,9 67,3 52,5 38,0 24,5 12,8
2017 74,0 59,4 45,0 31,2 19,2 10,2 81,8 67,2 52,4 37,9 24,3 12,8
2018 73,8 59,3 44,9 31,1 19,1 10,2 81,7 67,1 52,3 37,7 24,2 12,7
Tablica 1. Przeciętne dalsze trwanie życia w Polsce w latach 1950-20181 (dok.) Table 1. Life expectancy by age in Poland in 1950-20181 (cont.)
1 Parametry trwania życia dla lat 1990-1994 zostały przeliczone zgodnie z definicją urodzenia i zgonu noworodka obowiązującą od 1994 r. („Zeszyt metodologiczny – Ruch naturalny. Bilanse ludności”, 2018, Strony 11, 34, https://stat.gov.pl/obszary-tematyczne/ludnosc/ludnosc/zeszyt-metodologiczny-ruch-naturalny-bilanse-ludnosci,37,1.html, dostęp z dnia 31.05.2019)
Life tables for 1990-1994 have been recalculated according to the birth and infant death definition implemented in 1994. (“Methodological report – Vital statistics. Balances of population”, 2018. Pages 11, 34, https://stat.gov.pl/obszary-tematyczne/ludnosc/ludnosc/zeszyt-metodologiczny-ruch-naturalny-bilanse-ludnosci,37,1.html, access on 31.05.2019)

12
chapter 3. changes in the life expectancy in the years 1950-2018
3. Changes in the life expectancy in the years 1950-2018
The mortality in Poland was very high directly after the Second World War. In 1950 the life expectancy for male was slightly above 56 years, while for female it was almost 62 years. In the 50s Poland experienced a sharp drop in the mortality rates and consequently a significant growth of life expectancy. This positive tendency continued also in the next decade although its progress was much slower. Over a period of the next 20 years (during the 70s and 80s) the life expectancy for men hardly changed – even some drops were recorded periodically – while life expectancy for women increased by only 3 years.
The decade of the 90s brought a change of this negative ten-dency, although the year 1991 was the lowest in this period. Since that time until the present moment life expectancy increased by 7.9 years for males and by 6.6 years for females (Chart 2). Such a significant growth was achieved thanks to crucial progress in lowering the mortality both for men and women and particularly by strengthening the tendency of diminishing the infant mortality. Currently, males in Poland live 17.7 years longer than in the middle of the last century while women live 20 years longer.
Beginning in 1992 a significant improvement of further life expectancy for 45 year-old men was also observed (Chart 3). The negative trend of life expectancy among this group of people which had lasted over previous twenty years was reversed. In 2018 a male at working age had on average 31.1 years more to live which is 5.6 years more than his peer in 1950. The life expectancy of a 45- year-old Polish woman was 37.7 years in 2018 which means that in the discussed period the growth of the life expectancy among women of this age was 8.5 years.
The increase of life expectancy for older males observed in the 50s soon became inhibited in the 60s. The renewed growth was observed form the middle of the 80s. Thus in the years 1950-2018 life expectancy for a 60-year-old man rose by only 4.5 years (to 19.1 years) and for a 75-year-old man by 3.3 years (to 10.2 years). Among women of the same age a constant im-provement of life expectancy was observed (Chart 4 and Chart 5). Life expectancy of a 60-year-old woman grew from 1950 till 2018 by 7.1 years (to 24.2 years) while that of a 75-year-old woman increased by 4.9 years (to 12.7 years).
3. Zmiany średniej długości życia w latach 1950-2018
Poziom umieralności w Polsce był bardzo wysoki bezpośred-nio po drugiej wojnie światowej. W 1950 r. przeciętna długość trwania życia mężczyzn wynosiła nieco ponad 56 lat, nato-miast kobiet prawie 62 lata. W dekadzie lat 50. obserwowano szybki spadek poziomu umieralności, a tym samym wyraźny wzrost trwania życia. Ta korzystna tendencja utrzymywała się również w następnym dziesięcioleciu, chociaż proces ten następował znacznie wolniej. W okresie kolejnych 20 lat (lata 70. i 80.) średnia długość trwania życia mężczyzn prawie nie uległa zmianie – okresowo notowano nawet jej spadek – na-tomiast kobiet wzrosła jedynie o 3 lata.
Dekada lat 90. przyniosła zmianę tej niekorzystnej tendencji, przy czym rok 1991 był najgorszym w analizowanym okresie. Od tego czasu do chwili obecnej przeciętne trwanie życia wy-dłużyło się dla mężczyzn o 7,9 lat, a kobiet o 6,6 lat (Wykres 2). Tak znaczny wzrost osiągnięto dzięki istotnemu postępowi w zmniejszeniu poziomu umieralności zarówno mężczyzn, jak i kobiet, a zwłaszcza we wzmocnieniu istniejącego trendu spadku umieralności niemowląt. Obecnie w Polsce mężczyźni żyją o 17,7 lat dłużej niż w połowie ubiegłego stulecia, nato-miast kobiety o 20 lat dłużej.
Począwszy od 1992 r. obserwowano również wyraźną po-prawę dalszego trwania życia mężczyzn w wieku 45 lat (Wykres 3). Uległa bowiem odwróceniu trwająca ponad dwadzieścia lat tendencja obniżania się dalszego trwania życia tej grupy ludności. W 2018 r. mężczyzna w wieku pełnej aktywności zawodowej miał przed sobą średnio 31,1 lat życia, czyli o 5,6 lat więcej niż jego rówieśnik w 1950 r. Przeciętne dalsze trwanie życia 45-letniej Polki wynosiło w 2018 r. 37,7 lat, co oznacza, że w omawianym okresie przyrost trwania życia kobiet w tym wieku wyniósł 8,5 lat.
Notowane w latach 50. wydłużanie się przeciętnego trwa-nia życia mężczyzn w starszym wieku uległo zahamowaniu w latach 60. Ponowny jego wzrost rejestrowano dopiero od połowy lat 80. Tym samym, w latach 1950-2018, dalsze trwa-nie życia 60-latka wydłużyło się tylko o 4,5 roku (do 19,1 lat), a 75-latka o 3,3 roku (do 10,2 lat). Wśród kobiet w tym wieku no-towano stałą poprawę oczekiwanego trwania życia (Wykres 4, Wykres 5). Dalsze trwanie życia 60-letniej kobiety wydłużyło się w omawianym okresie o 7,1 lat (do 24,2 lat), natomiast 75-let-niej kobiety o 4,9 lat (do 12,7 lat).

13
rozdział 3. zmiany średniej długości życia w latach 1950-2018
Wykres 2. Przeciętne trwanie życia noworodka w Polsce Chart 2. Life expectancy at birth in Poland
Wykres 3. Przeciętne dalsze trwanie życia osób w wieku 45 lat Chart 3. Life expectancy at age 45
Lata życiaYears of life
54
58
62
66
70
74
78
82
84
1950 1955 1960 1965 1970 1975 1980 1985 1990 1995 2000 2005 2010 2015 2020
MężczyźniMales
KobietyFemales
Lata życiaYears of life
24
26
28
30
32
34
36
38
40
1950 1955 1960 1965 1970 1975 1980 1985 1990 1995 2000 2005 2010 2015 2020
MężczyźniMales
KobietyFemales

14
chapter 3. changes in the life expectancy in the years 1950-2018
Wykres 4. Przeciętne dalsze trwanie życia osób w wieku 60 lat Chart 4. Life expectancy at age 60
Wykres 5. Przeciętne dalsze trwanie życia osób w wieku 75 lat Chart 5. Life expectancy at age 75
Lata życiaYears of life
1950 1955 1960 1965 1970 1975 1980 1985 1990 1995 2000 2005 2010 2015 202014
16
18
20
22
24
26
MężczyźniMales
KobietyFemales
6
7
8
9
10
11
12
13
1950 1955 1960 1965 1970 1975 1980 1985 1990 1995 2000 2005 2010 2015 2020
Lata życiaYears of life
MężczyźniMales
KobietyFemales

15
rozdział 4. przestrzenne zróżnicowanie przeciętnego trwania życia
4. Spatial diversity of life expectancy
4.1 Macroregions
In 2018 the longest life expectancy for males was recorded in the eastern and southern macroregions (respectively 74.4 and 74.2 years). Among females, the highest was in eastern macroregion – 82.7 years (Table 2, Chart 6).
In urban areas men live on average longer than in rural areas. In Mazovian voivodeship this difference is the biggest – 2 years. The only macroregion in which life expectancy for men is longer in rural areas (by 0.5 year) is the southern ma-croregion. In southern and central macroregions women from rural areas also live longer than urban areas dwellers (by 0.7 years). In the others macroregions the life expectancy is lon-ger for women in urban areas (by 0.3 to 1.1 years).
4. Przestrzenne zróżnicowanie przeciętnego trwania życia
4.1 Makroregiony
W 2018 r. najwyższe trwanie życia mężczyzn notowano w makroregionach wschodnim i południowym – odpowied-nio 74,4 i 74,2 lata, a wśród kobiet we wschodnim – 82,7 lat (Tablica 2, Wykres 6).
W miastach mężczyźni żyją przeciętnie dłużej niż na wsi. W województwie mazowieckim różnica ta jest największa i wynosi 2 lata. Jedynym makroregionem, gdzie przeciętne trwanie życia mężczyzn jest dłuższe na wsi jest makroregion południowy (o 0,3 roku). W makroregionie południowym i centralnym kobiety na wsi żyją dłużej niż mieszkanki miast (o 0,7 roku). W pozostałych makroregionach trwanie życia kobiet w miastach jest dłuższe niż na wsi (od 0,3 do 1,1 roku).
Tablica 2. Przeciętne dalsze trwanie życia noworodka według makroregionów w 2018 r. Table 2. Life expectancy in Poland by macroregions in 2018
Mężczyźni Males Kobiety FemalesWedług wieku by age
0 15 30 45 60 0 15 30 45 60
Ogółem Total 73,8 59,3 44,9 31,1 10,2 81,7 67,1 52,3 37,7 24,2
Południowy 74,2 59,6 45,2 31,4 19,4 81,7 67,0 52,2 37,7 24,2
Północno-zachodni 73,7 59,2 44,7 30,8 18,8 81,2 66,6 51,9 37,3 23,8
Południowo-zachodni 73,6 59,1 44,7 30,9 19,0 81,4 66,9 52,1 37,6 24,1
Północny 73,7 59,1 44,8 31,0 18,9 81,5 67,0 52,2 37,6 24,1
Centralny 72,5 58,0 43,7 30,2 18,7 81,2 66,6 51,8 37,3 24,0
Wschodni 74,4 59,8 45,4 31,6 19,5 82,7 68,2 53,4 38,8 25,0
Woj. Mazowieckie 74,0 59,4 45,0 31,2 19,4 82,0 67,4 52,7 38,1 24,5
Miasta Urban areas 74,2 59,6 45,2 31,4 19,4 81,6 67,0 52,3 37,7 24,2
Południowy 74,1 59,5 45,1 31,3 19,4 81,5 66,8 52,0 37,5 24,1
Północno-zachodni 74,2 59,6 45,1 31,2 19,1 81,5 66,9 52,1 37,5 24,1
Południowo-zachodni 73,8 59,3 44,9 31,1 19,2 81,6 67,0 52,2 37,7 24,3
Północny 74,3 59,7 45,3 31,4 19,4 81,9 67,3 52,5 37,9 24,4
Centralny 72,7 58,2 43,9 30,4 18,9 80,9 66,3 51,6 37,2 23,9
Wschodni 75,4 60,9 46,3 32,4 20,2 82,9 68,5 53,7 39,1 25,3
Woj. Mazowieckie 74,8 60,2 45,8 31,9 19,8 82,3 67,6 52,9 38,3 24,7
Wieś Rural areas 73,2 58,7 44,4 30,6 18,6 81,6 67,1 52,3 37,7 24,1
Południowy 74,4 59,8 45,3 31,4 19,2 82,2 67,6 52,8 38,1 24,4
Północno-zachodni 73,0 58,5 44,1 30,3 18,2 80,7 66,1 51,4 36,8 23,3
Południowo-zachodni 73,1 58,6 44,3 30,4 18,5 81,0 66,5 51,8 37,2 23,7
Północny 72,7 58,2 44,0 30,2 18,1 80,8 66,3 51,5 36,9 23,4
Centralny 72,3 57,8 43,5 29,9 18,4 81,6 67,0 52,2 37,7 24,2
Wschodni 73,5 59,0 44,6 30,8 18,9 82,6 68,0 53,2 38,6 24,7
Woj. Mazowieckie 72,5 58,0 43,7 30,1 18,5 81,6 67,0 52,2 37,7 24,0

16
chapter 4. spatial diversity of life expectancy
Wykres 6. Przeciętne trwanie życia noworodka według makroregionów w 2018 r. Chart 6. Life expectancy at birth in Poland by macroregions in 2018
MężczyźniMales
KobietyFemales
Wschodni82,7
Północny81,5
Północno--zachodni
81,2
Południowo--zachodni
81,4
Południowy81,7
Centralny81,2
Woj. mazowieckie82,0
Wschodni74,4
Północny73,7
Północno--zachodni
73,7
Południowo--zachodni
73,6
Południowy74,2
Centralny72,5
Woj. mazowieckie74,0

17
rozdział 4. przestrzenne zróżnicowanie przeciętnego trwania życia
Wykres 7. Przeciętne trwanie życia noworodka według województw w 2018 r. Chart 7. Life expectancy at birth in Poland by voivodships in 2018
MężczyźniMales
73,1–74,0 72,0–73,0
74,1–75,075,1–75,6
KobietyFemales
81,1–81,5 80,7–81,0
81,6–82,082,1–82,582,6–83,2

18
chapter 4. spatial diversity of life expectancy
4.2 Voivodships
In the last three decades there was significant progress in increasing the life expectancy in all voivodships. This parti-cularly applies to males in pomorskie, zachodniopomorskie, wielkopolskie and opolskie, for whom life expectancy be-tween 1990 and 2018 has grown by more than 8 years (Table 3). In this period the smallest growth took place in łódzkie and lubelskie (6.7 years). For females the highest growth of life expectancy parameters was observed in pomorskie (7.2 years), the smallest in podlaskie and lubelskie (5.9 years).
In Poland there is a big diversity of life expectancy in the vo-ivodships cross-section. In 2018 the span between the highest and the lowest parameter for males among 16 voivodships was 3.5 years The shortest life expectancy was observed among men living in the łódzkie (72 years) and the longest was in the podkarpackie (75.5 years). Among females the diversity is smaller and amounts to 2.5 years. Women in the łódzkie and śląskie have the shortest life expectancy (80.9 years). On the other hand, podkarpackie has the longest life expectancy for women – 82.1 years. Generally, it can be sta-ted, that in all voivodships in the eastern and south-eastern Poland life expectancy for women is higher than the national average (Chart 7).
Excess mortality of males over females is clearly visible in all voivodships. In 2018 difference between life expectancy of males and females was biggest in warmińsko-mazurskie (9.1 years), lowest in opolskie (7.2 years).
4.2 Województwa
W ostatnich trzech dekadach obserwowano istotny postęp w wydłużaniu się przeciętnego trwania życia we wszystkich województwach. Szczególnie dotyczy to mężczyzn zamiesz-kałych w województwie pomorskim, zachodniopomorskim, wielkopolskim i opolskim, dla których w latach 1990-2018 średnie trwanie życia wydłużyło się o więcej niż 8 lat (Tablica 3). W okresie tym najniższy wzrost notowano w województwie łódzkim i lubelskim (6,7 lat). Dla kobiet największy przyrost trwania życia zanotowano w województwie pomorskim (7,2 lat), natomiast najmniejszy w województwach podlaskim i lubelskim (5,9 lat).
W Polsce występuje duże zróżnicowanie przeciętnego trwa-nia życia w przekroju wojewódzkim. W 2018 r. rozpiętość między skrajnymi wartościami wskaźnika dla mężczyzn wynosiła 3,5 roku. Najkrócej żyli mężczyźni mieszkający na terenie województwa łódzkiego (72 lata), natomiast naj-dłużej w województwie podkarpackim (75,5 roku). Wśród kobiet zróżnicowanie jest mniejsze i wynosi 2,5 roku. Kobiety żyją najkrócej w województwie łódzkim i śląskim (80,9 lat). Województwo podkarpackie charakteryzuje się z kolei naj-dłuższym trwaniem życia – kobiety dożywają tam przeciętnie wieku 83,2 lat. Ogólnie można stwierdzić, że we wszystkich województwach leżących na terenach Polski wschodniej i południowo-wschodniej (Wykres 7) przeciętne trwanie życia kobiet jest wyższe od średniej dla kraju.
Nadumieralność mężczyzn jest wyraźnie widoczna we wszystkich województwach. W 2018 r. dysproporcja między przeciętnym trwaniem życia mężczyzn i kobiet były najwięk-sza w warmińsko-mazurskim (9,1 lat), najniższa w opolskim (7,2 lat).
Tablica 3. Przeciętne trwanie życia noworodka według województw w wybranych latach2 Table 3. Life expectancy at birth by voivodships in selected years2
Województwa Voivodships
Mężczyźni Males Kobiety Females1990 2000 2005 2010 2015 2017 2018 1990 2000 2005 2010 2015 2016 2018
Ogółem Total 66,2 69,7 70,8 72,1 73,6 74,0 73,8 75,2 78,0 79,4 80,6 81,6 81,8 81,7
Dolnośląskie 65,7 68,8 70,4 71,7 73,2 73,5 73,2 74,7 77,6 78,9 80,2 81,0 81,1 81,3
Kujawsko-pomorskie 65,7 69,6 70,6 71,4 73,5 74,0 73,5 74,6 77,5 79,1 79,8 81,3 81,0 81,1
Lubelskie 66,8 69,1 69,9 71,2 73,3 73,6 73,5 76,4 78,5 79,9 81,0 82,4 82,2 82,3
Lubuskie 65,2 69,2 70,2 71,5 72,8 73,4 73,0 74,6 77,4 79,0 80,1 80,9 81,2 80,9
Łódzkie 65,3 67,9 68,6 70,1 71,4 71,9 72,0 74,5 77,2 78,3 79,4 80,4 80,8 80,7
Małopolskie 68,0 71,3 72,3 73,7 75,1 75,4 75,3 76,3 78,8 80,2 81,4 82,4 82,6 82,9
Mazowieckie 66,6 69,8 71,1 72,6 74,0 74,0 74,0 75,9 78,6 80,2 81,0 82,0 82,1 82,0
Opolskie 66,5 70,7 71,9 73,0 73,8 74,1 74,6 74,9 78,2 79,5 80,4 81,4 81,6 81,8
Podkarpackie 68,0 71,2 72,0 73,7 74,9 75,6 75,5 76,4 79,0 80,3 81,8 82,5 83,1 83,2
Podlaskie 67,1 70,5 71,0 72,5 73,8 74,2 74,1 76,8 79,1 80,4 81,9 82,6 82,9 82,7
2 Przy wyznaczaniu parametrów za 1990 r. uwzględniono definicję urodzenia i zgonu noworodka obowiązującą od 1994 r. (patrz przypis 1) At the calculation of life table parameters for 1990 has been introduced the modified definition of live births implemented since 1994. (see note
No. 1)

19
rozdział 4. przestrzenne zróżnicowanie przeciętnego trwania życia
Województwa Voivodships
Mężczyźni Males Kobiety Females1990 2000 2005 2010 2015 2017 2018 1990 2000 2005 2010 2015 2016 2018
Pomorskie 66,0 70,6 71,7 73,0 74,2 74,8 74,7 74,7 78,1 79,8 80,8 81,4 81,7 81,9
Śląskie 65,8 69,6 70,5 71,6 73,0 73,4 73,5 74,2 77,2 78,5 79,7 80,3 80,8 80,9
Świętokrzyskie 66,7 70,5 70,6 71,8 73,0 73,8 73,6 76,0 78,6 80,2 80,9 82,2 82,2 82,1
Warmińsko-mazurskie 65,4 69,2 70,0 71,3 72,7 73,0 72,5 75,2 78,6 79,4 80,4 81,1 81,4 81,6
Wielkopolskie 65,8 69,7 71,3 72,5 73,7 74,1 74,0 74,9 77,5 79,2 80,5 81,2 81,6 81,3
Zachodniopomorskie 65,1 69,0 70,6 71,3 73,5 73,7 73,6 74,5 77,5 78,8 80,1 81,1 81,2 81,2
Miasta Urban areas 66,2 70,0 71,2 72,6 74,0 74,4 74,2 74,9 77,8 79,3 80,6 81,5 81,8 81,6
Dolnośląskie 65,9 69,2 70,7 72,1 73,4 73,9 73,5 74,5 77,5 79,1 80,2 81,1 81,2 81,5
Kujawsko-pomorskie 65,9 70,0 71,3 71,7 73,6 74,1 73,7 74,6 77,5 79,4 79,9 81,2 81,0 81,3
Lubelskie 67,1 70,0 71,0 72,7 74,8 74,8 74,6 76,4 78,5 79,9 80,8 82,6 82,3 82,6
Lubuskie 65,8 69,7 70,6 72,3 73,0 73,9 73,6 74,6 77,2 79,2 80,3 81,0 81,6 81,1
Łódzkie 64,9 67,8 68,7 70,3 71,4 72,1 72,0 74,0 76,7 78,2 79,2 80,1 80,4 80,5
Małopolskie 67,7 71,6 72,6 74,2 75,6 75,8 75,9 75,9 78,6 80,0 81,4 82,3 82,5 83,0
Mazowieckie 66,8 70,5 71,8 73,6 74,9 75,0 74,8 75,7 78,5 80,3 81,2 82,0 82,2 82,3
Opolskie 67,0 70,7 72,3 73,0 74,2 74,9 74,8 74,8 78,3 79,1 80,4 81,4 81,7 82,1
Podkarpackie 68,3 71,8 72,6 74,5 75,9 76,5 76,6 76,5 78,7 80,2 82,1 82,3 83,0 83,5
Podlaskie 66,5 70,9 71,8 73,5 74,7 75,1 75,1 76,4 78,8 80,4 82,2 82,6 83,0 82,7
Pomorskie 66,2 71,1 72,1 73,4 74,8 75,2 75,1 74,8 78,0 79,8 81,0 81,5 81,7 82,2
Śląskie 65,4 69,4 70,3 71,5 72,8 73,2 73,4 73,9 77,0 78,2 79,5 80,0 80,5 80,8
Świętokrzyskie 67,2 70,6 71,2 72,9 74,3 74,6 74,7 76,1 78,5 80,1 81,0 81,9 82,0 82,3
Warmińsko-mazurskie 66,0 70,3 70,7 72,2 73,3 73,8 73,6 75,3 78,6 79,6 80,4 81,4 82,0 82,1
Wielkopolskie 66,0 70,0 71,9 73,1 74,0 74,5 74,5 74,8 77,5 79,3 80,4 81,3 81,9 81,6
Zachodniopomorskie 65,9 69,5 71,3 72,1 74,1 74,0 74,0 74,4 77,4 78,9 80,3 81,4 81,3 81,5
Wieś Rural areas 66,2 69,4 70,3 71,4 73,0 73,3 73,2 75,8 78,4 79,6 80,7 81,7 81,8 81,6
Dolnośląskie 65,3 67,9 69,6 70,7 72,6 72,6 72,5 75,0 77,8 78,3 80,2 80,6 80,6 80,7
Kujawsko-pomorskie 65,3 69,0 69,6 70,9 73,3 73,7 73,1 74,6 77,6 78,7 79,6 81,3 80,8 80,7
Lubelskie 66,4 68,4 69,1 70,1 72,1 72,6 72,5 76,5 78,5 80,0 81,2 82,2 82,1 82,0
Lubuskie 64,0 68,3 69,5 70,4 72,2 72,4 71,8 74,6 77,8 78,7 79,6 80,5 80,2 80,3
Łódzkie 65,9 68,2 68,7 70,0 71,4 71,6 72,0 75,3 78,2 78,7 80,0 81,1 81,4 81,2
Małopolskie 68,2 71,0 72,0 73,3 74,7 75,0 74,8 76,7 79,1 80,4 81,4 82,5 82,7 82,8
Mazowieckie 66,2 68,8 69,8 70,8 72,5 72,4 72,5 76,2 78,9 80,1 80,8 81,7 81,7 81,6
Opolskie 65,9 70,8 71,6 72,9 73,5 73,3 74,5 74,9 78,0 79,9 80,4 81,2 81,2 81,6
Podkarpackie 67,8 70,8 71,8 73,2 74,2 74,9 74,8 76,4 79,2 80,4 81,5 82,6 83,1 83,0
Podlaskie 67,3 69,9 70,2 71,3 72,5 73,1 72,7 77,1 79,4 80,5 81,4 82,4 82,5 82,7
Pomorskie 65,5 69,3 70,7 71,9 73,1 74,0 73,6 74,7 78,3 79,7 80,0 81,0 81,3 81,1
Śląskie 67,0 70,1 71,5 72,0 73,5 73,9 73,8 75,7 77,9 79,6 80,5 81,3 81,6 81,3
Świętokrzyskie 66,2 70,3 70,2 70,8 71,9 73,2 72,8 75,9 78,7 80,4 80,8 82,4 82,3 82,0
Warmińsko-mazurskie 64,5 67,9 68,9 70,0 71,7 71,8 71,1 75,2 78,6 79,2 80,3 80,5 80,2 80,7
Wielkopolskie 65,6 69,3 70,5 71,8 73,3 73,5 73,4 75,1 77,6 79,1 80,5 81,0 81,1 80,9
Zachodniopomorskie 63,4 67,9 69,1 69,6 72,1 72,9 72,5 74,8 77,4 78,4 79,4 80,4 80,8 80,4
Tablica 3. Przeciętne trwanie życia noworodka według województw w wybranych latach2 (dok.) Table 3. Life expectancy at birth by voivodships in selected years2 (cont.)
2 Przy wyznaczaniu parametrów za 1990 r. uwzględniono definicję urodzenia i zgonu noworodka obowiązującą od 1994 r. (patrz przypis 1) At the calculation of life table parameters for 1990 has been introduced the modified definition of live births implemented since 1994. (see note
No. 1)

20
chapter 4. spatial diversity of life expectancy
4.3 Podregiony
W 2018 r. rozpiętość między skrajnymi wartościami oczeki-wanego trwania życia w polskich podregionach wynosiła 5,2 lat dla mężczyzn i 3,2 dla kobiet. W trzydziestu (na 73 podregiony) średnie trwanie życia mężczyzn było wyższe niż średnia ogólnopolska, w przypadku kobiet w 33 podregio-nach. Najkrócej mężczyźni żyli w ciechanowskim (71,5 roku), najdłużej w podregionie miasta Kraków (76,7 lat). Kobiety natomiast najkrócej żyły w podregionie miasta Łodzi (80,2 lat), najdłużej w tarnowskim i rzeszowskim (83,4 lata).
Różnica między przeciętnym trwaniem życia mężczyzn i kobiet w 42 podregionach była wyższa niż w całym kraju. Dodatkowo w ośmiu z nich była ona wyższa niż 9 lat. Najmniejszą różnicę zanotowano w podregionie gliwickim – 6,3 roku.
Wśród podregionów na specjalną uwagę zasługują podre-giony tworzone przez największe miasta w kraju, skupiające na swoim terenie 6,3 milionów mieszkańców (tj. 16,3% ogó-łu ludności kraju). Należą do nich miasta: Kraków, Łódź, Poznań, Szczecin, Warszawa, Wrocław a także podregiony katowicki i trójmiejski. Spośród nich aż w pięciu kobiety, a w sześciu mężczyźni, żyli dłużej niż wynosi średnia ogól-nokrajowa. W ubiegłym roku najdłuższe trwanie życia wśród nich zanotowano w Krakowie (różnica między mężczyznami a kobietami wyniosła 6,5 roku). Na tle innych wielkich miast bardzo niekorzystnie wypada Łódź, gdzie przeciętne trwanie życia mężczyzn jest krótsze od średniej krajowej o 1,8 roku, a kobiet o 1,5 roku (Wykres 8).
4.3 Subregions
In 2018 the diversity between the extreme values of life expec-tancy parameters in subregions of Poland was 5.2 years for males and 3.2 years for females. In 30 out of 73 subregions life expectancy for men was higher than national averages, in case of females in 33 subregions. The shortest life expectan-cy for men was in ciechanowski subregion (71.5 years), the longest in Kraków (76,7 years). For females, the shortest was in Łódź (80,2 years), the longest in tarnowski and rzeszowski subregions (83,4).
The difference between life expectancy for males and fema-les was higher than in Poland in 42 subregions. Additionally in eight subregions it was higher than 9 years. The smallest difference was recorded in gliwicki subregion – 6.3 years.
Special attention should be paid to subregions which cor-respond to the biggest cities in the country, which have 6.3 million inhabitants (i.e. 16.3% of the total population). These include cities: Kraków, Łódź, Poznań, Szczecin, Warszawa, Wrocław and also katowicki and trójmiejski subregions. In six of them men and in five of them women lived longer than the national life expectancy. Last year the longest life expec-tancy among them was recorded in Kraków (the difference between men and women was 6.5 years). When compared to other big cities Łódź fares poorly, with life expectancy for men shorter than national average by 1.8 years and for women by 1.5 years (Chart 8).
Wykres 8. Przeciętne trwanie życia noworodka w wybranych podregionach w 2018 r. Chart 8. Life expectancy at birth in 2018 in selected subregions
MężczyżniMales
KobietyFemales
latyears
KrakówPOLSKAPOLAND
Warszawa Wrocław Poznań Podregiontrójmiejski
Szczecin Łódź Podregionkatowicki
0
10
20
30
40
50
60
70
80
90

21
rozdział 5. porównanie międzynarodowe
5. Porównanie międzynarodowe
Mimo pozytywnych zmian przeciętnego trwania życia, Polska nadal wypada niekorzystnie na tle czołówki krajów europej-skich (Tablica 4).
Na terenie Europy występuje duże zróżnicowanie prze-ciętnej długości trwania życia. Najdłużej żyją mężczyźni w Liechtensteinie – 81,6 lat, najkrócej na Ukrainie – 68,3 lata. Wśród kobiet najwyższe oczekiwane trwanie życia odnoto-wano w Hiszpanii – 86,1 lat, najkrótsze w Gruzji – 77,8 lat.
Znamiennym jest fakt, że w krajach, w których długość trwa-nia życia jest stosunkowo niska, różnica między trwaniem życia mężczyzn i kobiet – poza nielicznymi wyjątkami – jest bardzo duża (Wykres 9). Kraje, w których rozpiętość ta jest największa to: Białoruś (10 lat), Łotwa (9,9 lat), Litwa (9,8 lat) oraz Ukraina (9,7 lat).
5. International comparison
Despite positive changes of life expectancy Poland still falls behind leader European countries (Table 4).
In Europe there is a great diversity of average life expectancy. The longest life expectancy for males in Europe can be found in Liechtenstein – 81.6 years; the shortest in Ukraine – 68.3 years. Among females the longest living are in Spain – 86.1, the shortest in Georgia – less than 77.8 years.
It is characteristic that in countries where life expectancy is relatively low the difference between life expectancy for men and women – apart from few exceptions – is very high (Chart 9). Countries in which this gap is the biggest are Belarus (10 years), Latvia (9.9 years), Lithuania (9.8 years) and Ukraine (9.7).
Wykres 9. Przeciętne trwanie życia noworodka w krajach europejskich w 2017 r. Chart 9. Life expectancy at birth in European countries 2017
Uwaga: Objaśnienie skrótów nazw krajów w Tabeli 4. Źródło: https://ec.europa.eu/eurostat, 31.05.2019Note: Explanation of countries name in Table 4. Source: https://ec.europa.eu/eurostat, 31.05.2019
Różnica 10 lat
Różnica 5 lat
Różnica 0 lat
Males
Przeciętne trwanie życia noworodków płci męśkiej
AL
AM
AT
AZ
BE
BYBG
HR
CY
ME
CZ
DKEE
FIFR
GE
GR
ES
NLIE
IS
LI
LT
LU
LV
MK
MT
DE
NO
PL
PT
RU
RS
SK
SI
CH
SE
UA
UA
HU
UK
IT
76
78
80
82
84
86
88
68 70 72 74 76 78 80 82
Przeciętne trwanie życia noworodków płci żeńskiej
Females

22
chapter 5. international comparison
Tablica 4. Przeciętne trwanie życia noworodka w krajach Europy w 2017 r.3 Table 4. Life expectancy in European countries in 20173
Kraj Country Mężczyźni Males Kobiety Females Różnica Difference
AL Albania Albania 77,1 80,1 3,0
AM Armenia Armenia 72,5 78,9 6,4
AT Austria Austria 79,4 84,0 4,6
AZ Azerbejdżan Azerbaijan 73,2 77,9 4,7
BE Belgia Belgium 79,2 83,9 4,7
BY Białoruś Belarus 69,3 79,3 10,0
BG Bułgaria Bulgaria 71,4 78,4 7,0
HR Chorwacja Croatia 74,9 81,0 6,1
CY Cypr Cyprus 80,2 84,2 4,0
ME Czarnogóra Montenegro 73,9 79,2 5,3
CZ Czechy Czech Republic 76,1 82,0 5,9
DK Dania Denmark 79,2 83,1 3,9
EE Estonia Estonia 73,8 82,6 8,8
FI Finlandia Finland 78,9 84,5 5,6
FR Francja France 79,6 85,6 6,0
GE Gruzja Georgia 69,2 77,8 8,6
GR Grecja Greece 78,8 83,9 5,1
ES Hiszpania Spain 80,6 86,1 5,5
NL Holandia Netherlands 80,2 83,4 3,2
IE Irlandia Ireland 80,4 84,0 3,6
IS Islandia Iceland 81,1 84,3 3,2
LI Liechtenstein Lichtenstein 81,6 86,0 4,4
LT Litwa Lithuania 70,7 80,5 9,8
LU Luksemburg Luxemburg 79,9 84,4 4,5
LV Łotwa Latvia 69,8 79,7 9,9
MK Macedonia Północna North Macedonia 74,1 77,9 3,8
MT Malta Malta 80,2 84,6 4,4
DE Niemcy Germany 78,7 83,4 4,7
NO Norwegia Norway 81,0 84,3 3,3
PL Polska Poland 73,9 81,8 7,9
PT Portugalia Portugal 78,4 84,6 6,2
RU Rumunia Romania 71,7 79,1 7,4
RS Serbia Serbia 73,1 78,1 5,0
SK Słowacja Slovakia 73,8 80,7 6,9
SI Słowenia Slovenia 78,2 84,0 5,8
CH Szwajcaria Switzerland 81,6 85,6 4,0
SE Szwecja Sweden 80,8 84,1 3,3
UA Turcja Turkey 75,7 81,3 5,6
UA Ukraina Ukraine 68,3 78,0 9,7
HU Węgry Hungary 72,5 79,3 6,8
UK Wielka Brytania United Kingdom 79,5 83,1 3,6
IT Włochy Italy 80,8 85,2 4,4
3 Źródło/Source : https://ec.europa.eu/eurostat, 31.05.2019

23
rozdział 6. umieralność w polsce
6. Umieralność w Polsce
Poniżej przedstawiono pogłębioną analizę dotyczącą kształto-wania się średniego trwania życia Polaków oraz uwarunkowań zmian w tym zakresie. W tym celu posłużono się badaniem umieralności według pięciu grup przyczyn zgonów, decydu-jących w największym stopniu o długości życia.
W celu wyeliminowania wpływu różnych struktur wieku ludności na poziom współczynników umieralności za-stosowano metodę bezpośredniej standaryzacji, która pozwala odpowiedzieć na pytanie: jakie byłyby współ-czynniki zgonów, gdyby struktura ludności była taka sama w całym badanym okresie. Do obliczeń wykorzy-stano jako standardową, strukturę ludności z 2010 r., oszacowaną na podstawie wyników NSP’2011.
Na przestrzeni ostatnich trzydziestu lat – mimo okresowych wahań – poziom natężenia zgonów wykazywał tendencję malejącą. W 2018 r. w Polsce na każde 100 tys. ludności zmarły 894 osoby. Przebieg zmian umieralności według płci wyraźnie wskazuje na wysoką nadumieralność mężczyzn we wszyst-kich grupach wieku (Wykres 10). W całym badanym okresie natężenie zgonów mężczyzn poniżej 60 roku życia było 2-3 krotnie wyższe niż kobiet w tym wieku. W wieku starszym, tj. powyżej 60 lat, różnica ta zmniejsza się.
Ogólnie można stwierdzić, że w Polsce – po 1991 r. – we wszystkich grupach wieku obserwowano szybkie tempo spadku natężenia zgonów, głównie mężczyzn.
6. Mortality in Poland
Below an additional analysis of the life expectancy in Poland and the determinants of its changes is presented. For this purpose, a mortality study was used according to five groups of causes of death, which determine the greatest extent of life expectancy.
In order to control influence of age structures of popula-tion on death rates, a method of direct standardization has been applied which allows for answering the fol-lowing question: what would the death rates be if the population structure was the same during the entire pe-riod of analysis. As the standard the population structure from 2010 was used, which had been calculated using the results of 2011 population census.
During the last thirty years, despite periodic fluctuations, the overall level of death rates were decreasing. In 2018 in Poland 894 persons died per each 100 thousand people. Changes in mortality according to gender explicitly indicate high over--mortality of men in each age group (Chart 10). During the entire analysed period the death rates among men below 60 years old were 2-3 times higher than women of the same age. Among older people (above 60 years of age) the difference is reduced.
It can be stated that after 1991, in Poland, among all age groups, a rapid drop in death rates was observed (mostly among men).

24
chapter 6. mortality in poland
Wykres 10. Standaryzowane współczynniki zgonów mężczyzn i kobiet według wieku w latach 1980-2018 (na 100 tys. ludnosci) Chart 10. Standardized death rates males and females by age in 1980-2018 (per 100 thous. of population)
0-44 lata 0-44 years
45-59 lat 45-59 years
20
60
100
140
180
220
260
300
1980 1985 1990 1995 2000 2005 2010 2015 2020
MężczyźniMales
KobietyFemales
250
500
750
1000
1250
1500
1750
MężczyźniMales
KobietyFemales
1980 1985 1990 1995 2000 2005 2010 2015 2020

25
rozdział 6. umieralność w polsce
Wykres 10. Standaryzowane współczynniki zgonów mężczyzn i kobiet według wieku w latach 1980-2018 (na 100 tys. ludnosci) (dok.) Chart 10. Standardized death rates males and females by age in 1980-2018 (per 100 thous. of population) (cont.)
60 lat i więcej 60 years and more
MężczyźniMales
KobietyFemales
3000
3500
4000
4500
5000
5500
6000
6500
7000
1980 1985 1990 1995 2000 2005 2010 2015 2020
6.1 Umieralność według wieku i wybranych grup przyczyn zgonów w latach 1980-2017
W Polsce głównymi przyczynami zgonów są choroby układu krążenia, nowotwory oraz choroby układu oddechowego. W 2017 r. stanowiły one 73% wszystkich zgonów.
Dominującą przyczyną zgonów w Polsce są choroby układu krążenia, prawie co drugi zgon jest powodowany tymi cho-robami. Począwszy od 1992 r. udział chorób układu krążenia w ogólnej liczbie zgonów obniżył się z poziomu 52% do 40% w 2017 r. Niewątpliwy wpływ na obserwowane zmiany ma – między innymi – coraz większa świadomość znaczenia pro-filaktyki zdrowotnej w ograniczaniu umieralności, dbałość o dobrą kondycję fizyczną oraz zmiana złych nawyków ży-wieniowych w kierunku diety bogatszej w warzywa i owoce. Bardzo istotny wpływ na spadek natężenia zgonów, których przyczyną są choroby układu krążenia, ma poprawa leczenia choroby wieńcowej i jej następstw. W 2017 r. z powodu chorób układu krążenia na każde 100 tys. ludności zmarły 353 osoby – o 12 mniej niż w 2016 r. – mimo to intensywność zgonów w wyniku tych chorób nadal jest bardzo wysoka (Tablica 5).
6.1 Mortality by age and selected groups of death causes in 1980-2017
In Poland the main causes of deaths are cardiovascular dise-ases, neoplasms and respiratory diseases. According to recent data they caused 73% of all deaths in 2017.
Presently, the primary causes of death in Poland are cardio-vascular diseases. Since 1992 the share of such diseases has been decreasing in total number of deaths (52% in 1992, 40% in 2017) which means that almost every second death is a consequence of mentioned diseases (apart from insignificant fluctuations). Observed changes are result of – inter alia – gre-ater awareness of prevention methods, attention to physical condition and most of all change of bad nutritional habits towards a fruit-and-vegetable-rich diet. The improvement of treatment of the coronary heart diseases and negative effects of such illnesses has a very significant impact on the decline of mortality from cardiovascular diseases. In 2017 due to cardiovascular diseases for every 100 thousand people 353 died – 12 less than in 2016 – despite this, the intensity of deaths as a result of these diseases is still very high.

26
chapter 6. mortality in poland
Tablica 5. Standaryzowane współczynniki zgonów według wybranych grup przyczyn w latach 1980-20174 Table 5. Standardized death rates by selected groups of causes in 1980-20174
RokYear
OgółemTotal
Choroby układu krążenia
Deaths from diseases of the
circulatory system
Choroby nowotworowe
Deaths from neoplasms
Zewnętrzne przyczyny urazów
i zatruć Deaths from
external causes
Choroby układu oddechowego
Deaths from diseases of the
respiratory system
Choroby układu trawiennego Deaths from
diseases of the digestive system
na 100 tys. ludności per 100 thous. of population
1980 1485,3 773,7 237,4 89,6 80,8 50,1
1981 1367,3 710,4 239,5 . 70,8 46,9
1982 1366,8 723,0 240,3 . 70,2 45,6
1983 1402,6 743,9 245,3 85,6 75,9 46,8
1984 1447,5 775,7 249,9 86,6 75,5 47,6
1985 1507,9 818,9 250,4 88,0 81,9 46,9
1986 1464,1 799,3 251,4 84,9 78,0 44,4
1987 1454,9 806,9 253,1 82,1 69,3 44,4
1988 1400,9 772,5 256,4 80,0 60,6 43,8
1989 1419,8 781,9 255,0 86,5 62,3 43,4
1990 1426,3 785,4 257,5 92,2 57,9 42,9
1991 1469,6 812,6 258,9 96,8 55,1 43,2
1992 1416,9 779,4 256,1 91,9 48,0 43,4
1993 1403,3 765,0 259,9 85,6 50,0 43,1
1994 1365,2 733,3 260,2 87,5 45,0 42,9
1995 1346,8 710,9 262,4 86,1 46,5 42,7
1996 1335,3 703,4 261,7 81,3 50,2 41,6
1997 1298,1 626,1 250,4 89,0 57,8 37,8
1998 1259,5 628,6 263,4 86,7 48,0 39,3
1999 1263,2 627,0 263,5 79,1 61,4 46,1
2000 1203,7 596,8 269,8 74,7 61,5 46,2
2001 1167,6 580,6 271,3 71,8 51,6 45,3
2002 1136,3 556,3 271,3 71,8 50,0 45,5
2003 1141,9 559,9 269,8 69,7 55,0 45,1
2004 1109,9 532,9 268,0 69,3 52,3 46,5
2005 1096,9 516,2 265,0 69,8 56,1 48,0
2006 1069,5 498,9 264,3 68,3 53,8 46,2
2007 1061,8 491,3 264,3 66,5 54,9 46,2
2008 1040,8 479,8 258,5 67,5 53,1 46,3
2009 1031,0 479,4 255,8 63,8 55,3 44,8
2010 982,6 451,8 249,4 61,3 50,2 42,2
2011 950,9 427,4 244,5 61,1 50,5 41,9
2012 950,3 433,3 246,4 60,2 49,5 41,4
2013 935,6 421,4 242,2 57,0 55,1 40,6
2014 887,2 391,0 240,8 53,9 47,6 37,1
4 W związku z brakiem określenia przez lekarzy przyczyny zgonu dla ok. 80,5 tys. osób zmarłych w 1997 r. i ok. 75,4 tys. przypadków w 1998 r., do wyznaczenia współczynników zgonów według przyczyn przyjęto jako podstawę rozszacowaną proporcjonalnie liczbę zgonów.
Deaths rates by causes for years 1997 and 1998 have been estimated using proportional number of deaths. It was resulted ca 80.5 thous. deceased in 1997 and ca 75.4 thous. – in 1998, for which the cause of death was missing.

27
rozdział 6. umieralność w polsce
RokYear
OgółemTotal
Choroby układu krążenia
Deaths from diseases of the
circulatory system
Choroby nowotworowe
Deaths from neoplasms
Zewnętrzne przyczyny urazów
i zatruć Deaths from
external causes
Choroby układu oddechowego
Deaths from diseases of the
respiratory system
Choroby układu trawiennego Deaths from
diseases of the digestive system
na 100 tys. ludności per 100 thous. of population
2015 908,9 404,5 247,6 49,4 55,3 35,1
2016 872,9 365,4 243,8 47,5 51,2 37,5
2017 886,2 352,9 241,0 47,2 56,6 38,7
20185 894,4 . . . . .
4 W związku z brakiem określenia przez lekarzy przyczyny zgonu dla ok. 80,5 tys. osób zmarłych w 1997 r. i ok. 75,4 tys. przypadków w 1998 r., do wyznaczenia współczynników zgonów według przyczyn przyjęto jako podstawę rozszacowaną proporcjonalnie liczbę zgonów.
Deaths rates by causes for years 1997 and 1998 have been estimated using proportional number of deaths. It was resulted ca 80.5 thous. deceased in 1997 and ca 75.4 thous. – in 1998, for which the cause of death was missing.
5 Współczynniki zgonów dla wybranych grup przyczyn za 2018 nie zostały opracowane, ponieważ szczegółowe dane z tego roku będą dostępne w styczniu 2020.
Death rates for selected groups of causes for 2018 were not calculated, because the detailed data from this year will be available in January 2020.
Tablica 5. Standaryzowane współczynniki zgonów według wybranych grup przyczyn w latach 1980-20174 (dok.) Table 5. Standardized death rates by selected groups of causes in 1980-20174 (cont.)
Współczynnik zgonów z powodu chorób układu krążenia wśród mężczyzn w wieku poniżej 45 lat jest prawie trzy razy wyższy niż wśród kobiet w tym wieku (Wykres 11). Relacja ta jest silniejsza w grupie osób w wieku 45-59 lat (3,5 razy wyż-sza umieralność wśród mężczyzn), przy czym wartość tego współczynnika jest kilkanaście razy wyższa niż wśród osób młodszych. Po wyraźnym – w dekadzie lat osiemdziesiątych – wzroście natężenia zgonów mężczyzn w wieku 45-59 lat, lata dziewięćdziesiąte zapoczątkowały jego spadek. Poziom natężenia zgonów kobiet w tym wieku przez szereg lat nie zmieniał się w znaczący sposób i dopiero – począwszy od 1992 r. – zaczął się systematycznie obniżać. Choroby układu krążenia są, obok nowotworów, jedną z najczęstszych przy-czyn zgonów wśród mężczyzn i kobiet w wieku 45-59 lat, a dla osób powyżej 60 roku życia najczęstszą. Charakterystycznym dla osób w starszym wieku wieku jest fakt, iż natężenie zgo-nów mężczyzn jest niewiele większe niż kobiet, podczas gdy w młodszych grupach wieku nadumieralność mężczyzn ponad poziom umieralności kobiet jest bardzo wysoka.
Kolejna częsta przyczyna występowania zgonów to choroby nowotworowe – w 2017 r. stanowiły 25,8% wszystkich zgo-nów. W latach 1980-2001 w Polsce obserwowano stały wzrost poziomu natężenia zgonów z powodu nowotworów. Początek nowego stulecia przyniósł zmianę tej niekorzystnej tendencji – wartość standaryzowanego współczynnika zgonów zaczęła się zmniejszać.
Sytuacja ta jest skutkiem szybkiego spadku natężenia zgonów z powodu nowotworów ludzi młodych, tj. w wieku do 44 lat. W ostatnim trzydziestoleciu współczynnik zgonów zarówno mężczyzn, jak i kobiet w tym wieku zmniejszył się dwukrotnie. Poziom natężenia zgonów osób w wieku 0-44 lata jest kilkana-ście razy niższy niż notowany wśród osób w wieku 45-59 lat.
The cardiovascular disease mortality rate among men aged less than 45 is almost three times higher than among women of the same age (Chart 11). This also concerns people at age of 45-59 (3.5 times higher mortality for males), however, the level of this rate is several times higher than among younger people. After a significant increase of men’s death rate at age of 45-59 in the 80s, in the next decade a decrease was obse-rved. Still it is one of the most common, apart from neoplasms, causes of death among men at that age. The mortality rate for women of the same age since 1992 it has started to decline gradually. Cardiovascular diseases are the primary cause of death among people over 60 years old. The oldest age group is characterised by the fact that male death rate is only slightly higher than female, while in younger age groups the excess of mortality for males is much higher than for females.
The second highest cause of deaths is from neoplasms, causing – 25.8% of all deaths in 2017. In Poland, a constant increase of standardized death rates caused by these diseases was observed in 1980-2001. The beginning of the new century has brought a change of this tendency – a decrease of the standardized death rate has been observed.
Such a situation is a result of a rapid decrease of death rates caused by neoplasms among people younger than 44 years old. During the last 30 years the death rate of male and female at this age decreased twice. The death rates among people aged 0-44 years are over a dozen times lower than the level noted among aged 45-59.

28
chapter 6. mortality in poland
Wykres 11. Standaryzowane współczynniki zgonów według grup przyczyn w latach 1980-2017 Chart 11. Standardized death rates by selected groups of causes in 1980-2017
0-44 lata 0-44 years
Mężczyźni Males
Kobiety Females
0
10
20
30
40
50
60
70
80
90
100
110
1980 1985 1990 1995 2000 2005 2010 20172015
NowotworyDeaths from neoplasms
Zewnętrzne przyczyny zgonówDeaths from external causes mortality
Choroby układu krążeniaDeaths from diseases of the circulatory system
Choroby układu oddechowegoDeaths from diseases of the respiratory system
Choroby układu trawiennegoDeaths from diseases of the didestive system

29
rozdział 6. umieralność w polsce
Wykres 11. Standaryzowane współczynniki zgonów według grup przyczyn w latach 1980-2017 (cd.) Chart 11. Standardized death rates by selected groups of causes in 1980-2017 (cont.)
45-59 lat 45-59 years
Mężczyźni Males
Kobiety Females
0
100
200
300
400
500
600
700
1980 1985 1990 1995 2000 2005 2010 20172015
NowotworyDeaths from neoplasms
Zewnętrzne przyczyny zgonówDeaths from external causes mortality
Choroby układu krążeniaDeaths from diseases of the circulatory system
Choroby układu oddechowegoDeaths from diseases of the respiratory system
Choroby układu trawiennegoDeaths from diseases of the didestive system
0
50
100
150
200
250
1980 1985 1990 1995 2000 2005 2010 20172015
NowotworyDeaths from neoplasms
Zewnętrzne przyczyny zgonówDeaths from external causes mortality
Choroby układu krążeniaDeaths from diseases of the circulatory system
Choroby układu oddechowegoDeaths from diseases of the respiratory system
Choroby układu trawiennegoDeaths from diseases of the didestive system

30
chapter 6. mortality in poland
Wykres 11. Standaryzowane współczynniki zgonów według grup przyczyn w latach 1980-2017 (dok.) Chart 11. Standardized death rates by selected groups of causes in 1980-2017 (cont.)
60 lat i więcej 60 years and more
Mężczyźni Males
Kobiety Females
0
400
800
1200
1600
2000
2400
2800
3200
3600
4000
NowotworyDeaths from neoplasms
Zewnętrzne przyczyny zgonówDeaths from external causes mortality
Choroby układu krążeniaDeaths from diseases of the circulatory system
Choroby układu oddechowegoDeaths from diseases of the respiratory system
Choroby układu trawiennegoDeaths from diseases of the didestive system
1980 1985 1990 1995 2000 2005 2010 20172015
0
400
800
1200
1600
2000
2400
2800
3200
3600
1980 1985 1990 1995 2000 2005 2010 20172015
NowotworyDeaths from neoplasms
Zewnętrzne przyczyny zgonówDeaths from external causes mortality
Choroby układu krążeniaDeaths from diseases of the circulatory system
Choroby układu oddechowegoDeaths from diseases of the respiratory system
Choroby układu trawiennegoDeaths from diseases of the didestive system

31
rozdział 6. umieralność w polsce
A rapid decline in neoplasm mortality from 1991-1997 among men aged 45-59 was halted. Since 2002 a decline of intensity of neoplasms mortality can be observed again. In the case of women, the rate of deaths caused by cancers has remained fairly stable for almost twenty five years. However in the last years the decreasing tendency is observed.
In the older age groups (60+), the mortality of males, caused by neoplasms had keep increasing until 2004, next during 10 years the decline of death rates was observed. In 2017 1313 (per 100 thousand persons) males died of neoplasms. Among females the death rates have declined since 2002. Among women over 60, the level of death caused by neoplasms in the last two years increased by about 15 deaths per 100 tho-usand compared to the level observed since 2001. In 2017, neoplasms was the cause of the death of over 770 women (per 100 thousand). It ought to be mentioned that neoplasms rate from neoplasms (for males) is six times higher among the older people (i.e. above 60) than among younger ones (45-59); for females 4.5 times. The numbers of death caused by external reasons (accidents, injuries and poisonings) make up 4.5% of all deaths. A positive tendency of decreasing the mortality level can be observed. In 2017 standardized death rate was 47,2 per 100 thousand persons and constituted only 53.6% of the maximum value of this observed coefficient in 1991 when 88 deaths per 100 thousand persons was observed.
Accidents, injuries and poisonings are the most frequent re-asons of death among young men aged below 45. In fact, in 2017 it comprised 36% of all deaths among males at this age. The death rate among men aged 0-44 is five times, aged 45-59 is six times, above 60 two times higher than among women. People above 60 years old suffer from accidents, injuries and poisonings less frequently. Share of all causes of death is 3.3% for males and 2.0% for females.
In Poland respiratory diseases were responsible for 6.4% of all deaths in 2017. After a steady decrease in mortality caused by these diseases, which lasted for many years, the death rate has remained at the similar level from the mid-90s. However, it is worth paying attention to the increase in the number of deaths compared to the previous year (from 51.2 in 2016 to 56.6 in 2017). Mortality caused by respiratory di-seases among males below 60 years has been decreasing for almost 20 years, however in the noughties small increase of mortality rate was observed. In the last years it has remained stable. In 2017 frequency of deaths caused by respiratory diseases among men aged 60 years and more was 9.4 times
Dosyć szybki, w okresie lat 1991-1997, spadek natężenia zgo-nów z powodu nowotworów mężczyzn w wieku 45-59 lat uległ zahamowaniu. Począwszy od 2002 r. obserwowany jest ponowny spadek współczynnika zgonów. Dla kobiet w tym wieku poziom natężenia zgonów spowodowanych nowotwo-rami w zasadzie utrzymywał się na niezmienionym poziomie przez blisko ćwierć wieku. W ostatnich latach zaznacza się jednak tendencja spadkowa tego wskaźnika. W starszych grupach wieku – 60 lat i więcej – umieralność mężczyzn spo-wodowana chorobami nowotworowymi zwiększała się do 2004 r., po czym – przez okres 10 lat – obserwowano spadek natężenia zgonów. Na 100 tys. mężczyzn powyżej 60 roku życia na nowotwory umarło w 2017 r. 1313 mężczyzn. Wśród kobiet, które ukończyły 60 lat, poziom natężenia zgonów z powodu nowotworów w ostatnich dwóch latach wzrósł o około 15 zgonów na 100 tys. w porównaniu do poziomu obserwowanego od 2001 r. W 2017 r. nowotwór był przyczy-ną śmierci ponad 770 kobiet (na 100 tys.). Należy zaznaczyć, że dla mężczyzn w wieku 60 lat i więcej, poziom natężenia zgonów z powodu chorób nowotworowych jest prawie 6-krotnie wyższy niż u osób w wieku 45-59, natomiast dla kobiet 4,5-krotnie.
Zgony spowodowane wypadkami i urazami (tzw. przyczy-ny nienaturalne) stanowią 4,5% wszystkich zgonów. Można zaobserwować korzystną tendencję obniżania się poziomu umieralności z powodu zewnętrznych przyczyn zgonów (wypadków, urazów i zatruć). W 2017 r. standaryzowany współczynnik zgonów wynosił 47,2 na 100 tys. ludności i stanowił jedynie 53,6% maksymalnej wartości tego współ-czynnika obserwowanej w 1991 r. – 88 zgonów na 100 tys. ludności.
Wypadki, urazy i zatrucia są najczęstszą przyczyną zgonów młodych mężczyzn, tj. w wieku poniżej 45 lat. W 2017 r. sta-nowiły one 36% wszystkich zgonów mężczyzn w tym wieku. Poziom natężenia zgonów mężczyzn w wieku do 45 lat jest ponad pięciokrotnie wyższy niż kobiet. Mężczyźni w wieku 45-59 lat sześciokrotnie częściej niż kobiety umierają z powodu wypadków i urazów, zaś w wieku powyżej 60 lat dwukrotnie częściej. Wraz z wiekiem spada udział procento-wy zgonów z powodu przyczyn zewnętrznych. Wśród osób powyżej 60 lat wynosił on 3,3% u mężczyzn i 2,0% u kobiet.
W Polsce w 2017 r. choroby układu oddechowego stanowi-ły 6,4% wszystkich zgonów. Po trwającym przez szereg lat spadku umieralności z powodu tych chorób, od połowy lat 90-tych natężenie zgonów utrzymuje się na zbliżonym pozio-mie. Warto jednak zwrócić uwagę na wzrost liczby zgonów w porównaniu do poprzedniego roku (od 51,2 w 2016 r. do 56,6 w 2017 r.). Umieralność z powodu chorób układu odde-chowego osób poniżej 60 roku życia zmniejszała się przez okres prawie 20 lat. W pierwszej dekadzie XXI wieku zaobser-wowano niewielki wzrost współczynnika zgonów, po czym jego wielkość ustabilizowała się. Częstość występowania zgo-nów mężczyzn w wieku 60 lat i więcej, w następstwie chorób

32
chapter 6. mortality in poland
układu oddechowego, jest 9,4-krotnie wyższa niż mężczyzn w wieku 44-59 lat; natomiast kobiet 17-krotnie wyższa.
Podobny przebieg zmian notowano w natężeniu zgonów z powodu chorób układu trawiennego, z tym, że na nieco niższym poziomie. W pierwszej połowie lat 80. współczynnik zgonów z tej przyczyny wynosił 38-39 na 100 tys. ludności, w okresie kolejnych dziesięciu lat obniżył się do 35-36, po czym nastąpił ponowny jego wzrost do 38-39 zgonów na 100 tys. ludności w latach 2004-2008. W 2017 r. wartość tego wskaźnika wynosiła 38,7. Na zmiany ogólnego poziomu na-tężenia zgonów w następstwie chorób układu trawiennego miał wpływ przede wszystkim wzrost umieralności mężczyzn w wieku poniżej 60 lat. Natężenie zgonów kobiet w tym wieku oraz osób starszych (obojga płci) utrzymuje się w badanym okresie na zbliżonym poziomie, choć i tutaj można zaobser-wować niewielki wzrost w porównaniu do roku 2016.
6.2 Umieralność według województw w 2018 r.
W celu przeprowadzenia analizy natężenia zgonów w 2018 r. w ujęciu regionalnym wyznaczone zostały stan-daryzowane współczynniki zgonów. Do ich obliczeń przyjęto jednolitą ogólnopolską strukturę ludności we-dług wieku z 2018 r.
W 2018 r. najwyższą umieralność zanotowano, podobnie jak w 2017 roku, w województwie łódzkim (Tablica 6, Wykres 12), gdzie na każde 100 tys. ludności zmarło 1175 osób. Stosunkowo niskie natężenie zgonów – w porównaniu z innymi rejonami kraju – notowano w województwach podkarpackim i małopolskim (odpowiednio 955 i 983 osób). W 2018 r. we wszystkich województwach natężenie było wyższe na wsi niż w miastach. Największą różnicę zarejestrowano w wo-jewództwie warmińsko-mazurskim (208 więcej zgonów na wsi na 100 tys. ludności), a najmniejszą w łódzkim i śląskim (odpowiednio 27 i 31).
higher than among men aged 44-59; among women it was 17 times higher.
Similar changes concern death rates caused by digestive di-sorders, but at a slightly lower level. In the first half of the 80s, the death rate reached 38-39 per 100 thousand people, during the subsequent ten years it decreased to 35-36 and it increased again to 38-39 deaths per 100 thousand people between 2004-2008. In 2017 this rates was 38.7. Changes to the general mortality caused by digestive disorders are mostly influenced by increase of mortality of males aged below 60 years. The female mortality rate for this age groups as well as for elderly people of both genders has remained constant over the past nearly 30 years, however a slight increase com-pared to 2016 can be observed.
6.2 Mortality by voivodships in 2018
In order to analyse mortality at regional level in 2018 the standardized death rates for individual voivodships have been introduced. For calculation of such death rates a uniform nationwide population structure (according to age in 2018) was applied.
On the basis of recent results, the highest mortality rates for last year were noted, similar like in 2017, in łódzkie voivodship (Table 6, Chart 12) where 1175 persons died per each 100 thousand of population. A rather low death rates – in compa-rison to other regions of Poland – were noted in podkarpackie and małopolskie voivodships (955 and 983). In 2018, in all voivodships, higher death rates were registered in the rural areas than in the urban. The largest difference was noted in the warmińsko-mazurskie voivodship (208 more deaths in the rural areas per 100,000 population) and the smallest in łódzkie and śląskie (respectively 27 and 31).

33
rozdział 6. umieralność w polsce
Tablica 6. Standaryzowane współczynniki zgonów według województw w 2017 r. Table 6. Standardized death rates by voivodships in 2017
WojewództwaVoivodships
Ogółem Total
Miasta Urban Areas
Wieś Rural Areas
00 Ogółem Total 1078 1043 1140
02 Dolnośląskie 1103 1071 1195
04 Kujawsko-pomorskie 1129 1090 1204
06 Lubelskie 1070 987 1142
08 Lubuskie 1152 1112 1240
10 Łódzkie 1175 1165 1193
12 Małopolskie 983 944 1027
14 Mazowieckie 1052 999 1162
16 Opolskie 1033 996 1079
18 Podkarpackie 955 872 1018
20 Podlaskie 1029 964 1115
22 Pomorskie 1041 1002 1152
24 Śląskie 1113 1106 1137
26 Świętokrzyskie 1077 1008 1137
28 Warmińsko-mazurskie 1136 1060 1269
30 Wielkopolskie 1113 1068 1184
32 Zachodniopomorskie 1112 1075 1216
Wykres 12. Standaryzowane współczynniki zgonów według województw w 2018r. Chart 12. Standardized death rates by voivodships in 2018
Na 100 tys. ludnościPer 100 thous. of population
1001–1050 955–1000
1051–11001101–11501151–1175

34
chapter 6. mortality in poland
6.3 Umieralność według wybranych grup przyczyn zgonów i województw w 2017 r.
Analiza natężenia zgonów według wybranych przyczyn zgonów w ujęciu regionalnym została opracowana na podstawie danych za 2017 r. W związku z powyższym do obliczenia standaryzowanych współczynników zgo-nów przyjęto jednolitą ogólnopolską strukturę ludności według wieku z 2017 r.
Rozkład natężenia zgonów według przyczyn jest nierówno-mierny w relacji obszary miejskie i wiejskie (Tablica 7). Na choroby układu krążenia częściej umierają mieszkańcy wsi. Oni również częściej ulegają wypadkom, urazom i zatruciom, a także chorobom układu oddechowego. Wśród ludności miejskiej natomiast występuje większa umieralność z powodu chorób nowotworowych oraz chorób układu trawiennego.
W 2017 r. najwyższy poziom umieralności z powodu chorób układu krążenia notowano w województwie świętokrzyskim (Wykres 13), gdzie na 100 tys. osób zanotowano 501 zgonów z powodu tych chorób. Wskaźnik ten jest zatem o 34% więk-szy niż w województwie mazowieckim, w którym notowano najniższy poziom umieralności (375). Na terenach wiejskich we wszystkich województwach natężenie zgonów w następ-stwie chorób układu krążenia było wyższe niż w miastach. W województwach lubuskim i mazowieckim różnica ta była największa i wynosiła 116 i 111 osób (na 100 tys. ludności).
Najbardziej zagrożonymi pod względem natężenia zgonów z powodu nowotworów były województwa kujawsko-po-morskie oraz dolnośląskie i śląskie. W rejonach tych, na każde 100 tys. ludności zmarło około 300 osób. Najniższy poziom umieralności odnotowano w województwie podkarpackim (239 osób). W większości województw zgony, których przy-czyną były choroby nowotworowe, częściej rejestrowano w miastach. W województwie podlaskim przewaga ta była największa (29 osób na 100 tys.).
Śmiertelnym wypadkom najczęściej ulegali mieszkańcy wo-jewództwa łódzkiego, warmińsko-mazurskiego i podlaskiego. W województwach tych na 100 tys. ludności zmarło 57-64 osób. W województwie o najmniejszym natężeniu zgonów z powodu zewnętrznych przyczyn – podkarpackim – wartość tego współczynnika była równa 41. W 2017 r. we wszystkich województwach poziom umieralności z powodu wypadków, urazów i zatruć był wyższy na wsi. Największe dysproporcje zaobserwowano w województwie lubelskim i mazowieckim, gdzie liczba zgonów na 100 tys. osób była na wsi o około 30 większa niż w miastach.
Najniższy poziom umieralności z powodu chorób układu oddechowego występował w województwie świętokrzy-
6.3 Mortality by selected groups of death causes and voivodships in 2017
The analysis of mortality by selected groups of causes of death and voivodships is based on the 2017 data. For a calculation of standardized death rates for individual voivodships an uniform nationwide population structure according to age in 2017 was used.
Distribution of death rates by causes is different between urban and rural areas (Table 7). In 2017 residents of rural are-as died more often from cardiovascular. They are also more frequent victims of accidents, injuries and poisonings and also respiratory diseases. However, the mortality caused by cancers and digestive disorders is higher among urban in-habitants.
In 2017, the highest mortality related to cardiovascular dise-ases was noted in the świętokrzyskie voivideship (Chart 13), where for each 100 thousand of people 501 died of these di-seases. Thus this rate is ca. 34% of higher than in mazowieckie voivodship in which the lowest mortality rate was noted (375). In rural areas all voivodships death rates of cardiovascular diseases were higher than in urban areas. In lubuskie and mazowieckie voivodships, that difference was the largest and it amounted to 116 and 111 persons (per 100 thousand).
In 2017 in the kujawsko-pomorskie, dolnosląskie and śląskie voivodships experienced the highest mortality caused by neoplasms. In these regions, about 300 people died of neo-plasms per 100 thousand. The lowest mortality rates were noted in the podkarpackie voivodship (239 persons). Deaths caused by neoplasms were higher in urban areas. In podlaskie voivodship such surplus was the highest (29 persons per 100 thousand).
In 2017, the residents of łódzkie, warmińsko-mazurskie and podlaskie voivodships suffered from lethal accidents most frequently. Death rate in these areas was above 57-64 deaths per 100 thousand persons. In podkarpackie voivodship with the lowest death rates related to external causes the num-ber of death was 41 persons per 100 thousand. In 2017, the rate of deaths caused by accidents, injuries and poisonings was higher in rural areas in all voivodships. The greatest di-sproportions were observed in lubelskie and mazowieckie voivodships in which the number of deaths in rural areas was higher by about 30 people than in the urban areas.
In 2017 the lowest level of mortality related to respiratory diseases was in the świętokrzyskie voivodship (47 deaths per

35
rozdział 6. umieralność w polsce
skim – 47 zgonów na 100 tys. osób. Najwyższą natomiast umieralność odnotowano w województwie pomorskim, gdzie na każde 100 tys. ludności zmarło 85 osób. W 2017 r. tylko w województwie łódzkim natężenie zgonów spowodowanych chorobami układu oddechowego było większe w miastach (różnica 8 osób na 100 tys.). Maksymalne różnice notowano w województwie warmińsko-mazurskim – 28 zgonów na 100 tys. ludności na niekorzyść wsi.
Największe natężenie zgonów z powodu chorób układu tra-wiennego zaobserwowano w województwie łódzkim i śląskim – 56-57 zgonów na 100 tys. osób. Najkorzystniej wygląda-ła sytuacja w województwach lubelskim i świętokrzyskim, gdzie na każde 100 tys. ludności zmarły w następstwie chorób układu trawiennego 32 osoby. Poziom natężenia zgonów spowodowanych chorobami układu trawiennego, zarówno w miastach, jak i na wsi, był zbliżony. Największe różnice no-towano w województwie łódzkim, gdzie wskaźnik dla miast był wyższy od analogicznego dla wsi o 12 osób.
100 thousand people). On the other hand highest mortali-ty rate was noted in the pomorskie voivodship in excess of 85 deaths per 100 thousand people. In 2017 only in łódzkie voivodship rates of deaths due to respiratory diseases was higher in urban areas (the difference was 8 per 100 thousand). Maximal difference was observed in the warmińsko-mazur-skie voivodship (28 deaths per 100 thousand people more in rural areas than in urban areas).
In 2017, the highest rates of deaths caused by digestive disor-ders were noted in the łódzkie and śląskie voivodships (56-57 deaths per 100 thousand people). The best situation was in lubelskie and świętokrzyskie voivodships where 32 (per 100 thousand) people died from digestive disorders. In all voivod-ships frequency of deaths related to digestive disorders was similar in urban and rural areas. The biggest differences, were noted in the łódzkie voivodship, where this rate for urban areas was higher by 12 persons than for rural areas.
Tablica 7. Standaryzowane współczynniki zgonów według wybranych grup przyczyn i województw w 2017 r. Table 7. Standardized death rates by selected groups of causes and voivodships in 2017
Województwa Voivodships
OgółemTotal
Choroby układu krążenia
Deaths from diseases of
the circulatory system
Choroby nowotworowe
Deaths from neoplasms
Zewnętrzne przyczyny
urazów i zatruć
Deaths from external causes
Choroby układu oddechowego
Deaths from diseases of
the respiratory system
Choroby układu trawiennego Deaths from
diseases of the digestive system
na 100 tys. ludności per 100 thous. of population
00 Ogółem Total 1048 435 278 50 68 44
02 Dolnośląskie 1071 457 299 47 72 41
04 Kujawsko-pomorskie 1060 385 307 45 68 45
06 Lubelskie 1051 460 252 55 49 32
08 Lubuskie 1078 435 290 52 52 41
10 Łódzkie 1153 450 283 64 83 56
12 Małopolskie 966 451 260 45 63 36
14 Mazowieckie 1022 375 273 48 81 45
16 Opolskie 1053 488 249 47 66 38
18 Podkarpackie 944 406 239 41 59 35
20 Podlaskie 987 424 240 57 75 41
22 Pomorskie 1011 435 285 54 85 50
24 Śląskie 1100 483 298 54 53 57
26 Świętokrzyskie 1048 501 251 49 47 32
28 Warmińsko-mazurskie 1094 430 289 57 79 50
30 Wielkopolskie 1055 384 294 45 72 34
32 Zachodniopomorskie 1067 474 285 50 74 46
00 Miasta Urban areas 1015 407 282 45 67 46
02 Dolnośląskie 1044 443 294 44 70 41
04 Kujawsko-pomorskie 1033 363 310 38 67 47
06 Lubelskie 966 410 256 41 47 34

36
chapter 6. mortality in poland
Województwa Voivodships
OgółemTotal
Choroby układu krążenia
Deaths from diseases of
the circulatory system
Choroby nowotworowe
Deaths from neoplasms
Zewnętrzne przyczyny
urazów i zatruć
Deaths from external causes
Choroby układu oddechowego
Deaths from diseases of
the respiratory system
Choroby układu trawiennego Deaths from
diseases of the digestive system
na 100 tys. ludności per 100 thous. of population
08 Lubuskie 1016 399 290 49 45 40
10 Łódzkie 1135 412 291 57 86 60
12 Małopolskie 935 437 266 41 55 38
14 Mazowieckie 964 339 270 38 80 44
16 Opolskie 1004 454 250 42 61 35
18 Podkarpackie 880 355 246 37 55 38
20 Podlaskie 927 388 253 48 70 37
22 Pomorskie 980 410 286 50 83 53
24 Śląskie 1098 471 303 53 52 58
26 Świętokrzyskie 985 459 254 42 45 33
28 Warmińsko-mazurskie 1025 398 280 52 69 49
30 Wielkopolskie 1010 353 293 41 70 35
32 Zachodniopomorskie 1035 453 282 47 72 46
00 Wieś Rural areas 1106 482 271 58 72 40
02 Dolnośląskie 1151 503 312 52 81 39
04 Kujawsko-pomorskie 1111 425 302 56 69 40
06 Lubelskie 1123 501 251 68 51 30
08 Lubuskie 1215 515 290 59 70 43
10 Łódzkie 1182 517 268 78 78 48
12 Małopolskie 1003 467 253 50 71 34
14 Mazowieckie 1139 450 278 68 83 48
16 Opolskie 1111 529 248 53 73 42
18 Podkarpackie 990 442 235 44 63 33
20 Podlaskie 1068 468 224 69 81 46
22 Pomorskie 1100 507 283 63 91 45
24 Śląskie 1109 527 280 56 60 50
26 Świętokrzyskie 1102 536 250 56 48 32
28 Warmińsko-mazurskie 1211 487 302 64 97 51
30 Wielkopolskie 1125 432 296 50 74 34
32 Zachodniopomorskie 1163 538 294 58 79 47
Tablica 7. Standaryzowane współczynniki zgonów według wybranych grup przyczyn i województw w 2017 r. (dok.) Table 7. Standardized death rates by selected groups of causes and voivodships in 2017 (cont.)

37
rozdział 6. umieralność w polsce
Wykres 13. Standaryzowane współczynniki zgonów według wybranych grup przyczyn w 2017 r. Chart 13. Standardized death rates by selected groups of causes in 2017
0 90
Dolnośląskie
Kujawsko-pomorskie
Lubelskie
Lubuskie
Łódzkie
Małópolskie
Mazowieckie
Opolskie
Podkarpadzkie
Podlaskie
Pomorskie
Śląskie
Świętokrzyskie
Warmińsko-mazurskie
Wielkopolskie
Zachodniopomorskie
180 270 360 450 540
NowotworyDeaths from neoplasms
Zewnętrzne przyczyny zgonówDeaths from external causes mortality
Choroby układu krążeniaDeaths from diseases of the circulatory system
Choroby układu oddechowegoDeaths from diseases of the respiratory system
Choroby układu trawiennegoDeaths from diseases of the didestive system

38
chapter 7. summary
7. Summary
The wider public knows life expectancy as an index which is used in insurance system and affects amount of retirement pension. However, its potential in social sciences is much bigger-in the last few decades the development of various measures based on life expectancy has been observed. They are used to estimate parameters like healthy life years, disa-bility or dementia free life expectancy as well as effectivity of medical treatment.
Research conducted by different countries proved that except sex, among others the place of residence, education and level of prosperity have impact on differences in life expectancy. High spatial diversity of life expectancy in Poland provides opportunity for further in-depth analysis, which should help the efforts to reduce disparities between regions.
7. Podsumowanie
Szerokiemu odbiorcy przeciętne dalsze trwanie życia jest znane jako miernik wykorzystywany do określenia wysokości emerytur. Tymczasem „potencjał” tego wskaźnika w naukach społecznych jest znacznie większy – w ostatnich dekadach obserwujemy rozwój rozmaitych miar opartych na przecięt-nym trwaniu życia. Przy ich pomocy podejmowane są na przykład próby oszacowania długości życia bez chorób, nie-pełnosprawności czy demencji, a także ocena efektywności leczenia.
Badania prowadzone przez różne kraje udowadniają, że poza płcią czynnikami różnicującymi długość trwania życia są m.in.: miejsce zamieszkania, wykształcenie czy poziom zamożności. Duże zróżnicowanie terytorialne wartości tego wskaźnika w Polsce stwarza pole do dalszych szczegółowych analiz, które powinny wspomagać programy wyrównywania dysproporcji między regionami.

39
rozdział 8. uwagi metodologiczne
8. Uwagi metodologiczne
Pełne tablice trwania życia
Podstawą do budowy pełnych tablic trwania życia są liczby osób zmarłych w 2018 r. pogrupowane według roku uro-dzenia i wieku ukończonego, liczby urodzeń w 2018 r. oraz ludności według roczników wieku na koniec 2017 r. oraz 2018 r. Budowa tablicy opiera się na prawdopodobieństwach zgonu, które są obliczane do wieku 84 lat (włącznie) według wzorów przedstawionych poniżej, następnie ekstrapolowane powyżej 84 lat oraz wyrównywane w wieku od 1 do 84 lat. Inne parametry tablicy trwania życia są obliczane w sposób tradycyjny.
Oznaczenia:
8
.
Uwagi metodyczne Methodological notes
Pełne tablice trwania życia Complete life tables
Podstawą do budowy pełnych tablic trwania życia są liczby osób zmarłych w 2018 r. pogrupowane według roku urodzenia i wieku ukończonego, liczby urodzeń w 2018 r. oraz ludności według roczników wieku na koniec 2017 r. oraz 2018 r. Budowa tablicy opiera się na prawdopodobieństwach zgonu, które są obliczane do wieku 84 lat (włącznie) według wzorów przedstawionych poniżej, następnie ekstrapolowane powyżej 84 lat oraz wyrównywane w wieku od 1 do 84 lat. Inne parametry tablicy trwania życia są obliczane w sposób tradycyjny.
Complete life tables are drawn up on the basis of data on persons deceased in 2018 classified by the year of birth and age in completed years, the number of births in 2018 and population by single year of age at the end of 2017 and 2018. The computation of the tables is based on proba-bilities of death calculated up to the age of 84 using formulas presented below. The probabilities are extrapolated to the ages of 84 and more and then adjusted for ages 1-84. Other parameters of the life tables are calculated by traditional methods.
Oznaczenia: Notation:
( )tPx – liczba osób żyjących
w wieku x lat ukończonych
w końcu roku t( )tB – liczba urodzeń w roku t
( )D tx' – liczba osób zmarłych
w roku t , w wieku ukończonych xlat, spośród urodzonych
w roku t x− −1
( )D tx'' – liczba osób zmarłych
w roku t , w wieku ukończonych xlat, spośród urodzonych
w roku t x−
( )R tx – korekta dla liczby ludności
ze względu na migracje w roku tosób urodzonych w roku
t x−
x+1
x
x-1
t
P x (t)
P x-1 (t-1)
P x (t-1)
R x+1 (t), D x ' (t)
R x (t), D x '' (t)
R x (t), D x-1 ' (t)
( )tPx – the number of persons
aged x at the end of year t
( )tB – the number of births in year
t
( )D tx' – the number of death in
year t at the age of x , amongst
people born in year t x− −1
( )D tx'' – the number of persons
deceased in year t at age of xamongst people born in year
t x−
( )R tx – correction for the number
of population in year t with regard to migration of persons born in year
t x−
( ) ( ) ( ) ( ) ( )( )tDtDtPtPtR xxxxx""
11 121 −−−−= −− dla / for 841 ≤≤ x
( ) ( ) ( ) ( )R t B t P t D t0 0 0= − − ''
– liczba osób żyjących
w wieku
8
.
Uwagi metodyczne Methodological notes
Pełne tablice trwania życia Complete life tables
Podstawą do budowy pełnych tablic trwania życia są liczby osób zmarłych w 2018 r. pogrupowane według roku urodzenia i wieku ukończonego, liczby urodzeń w 2018 r. oraz ludności według roczników wieku na koniec 2017 r. oraz 2018 r. Budowa tablicy opiera się na prawdopodobieństwach zgonu, które są obliczane do wieku 84 lat (włącznie) według wzorów przedstawionych poniżej, następnie ekstrapolowane powyżej 84 lat oraz wyrównywane w wieku od 1 do 84 lat. Inne parametry tablicy trwania życia są obliczane w sposób tradycyjny.
Complete life tables are drawn up on the basis of data on persons deceased in 2018 classified by the year of birth and age in completed years, the number of births in 2018 and population by single year of age at the end of 2017 and 2018. The computation of the tables is based on proba-bilities of death calculated up to the age of 84 using formulas presented below. The probabilities are extrapolated to the ages of 84 and more and then adjusted for ages 1-84. Other parameters of the life tables are calculated by traditional methods.
Oznaczenia: Notation:
( )tPx – liczba osób żyjących
w wieku x lat ukończonych
w końcu roku t( )tB – liczba urodzeń w roku t
( )D tx' – liczba osób zmarłych
w roku t , w wieku ukończonych xlat, spośród urodzonych
w roku t x− −1
( )D tx'' – liczba osób zmarłych
w roku t , w wieku ukończonych xlat, spośród urodzonych
w roku t x−
( )R tx – korekta dla liczby ludności
ze względu na migracje w roku tosób urodzonych w roku
t x−
x+1
x
x-1
t
P x (t)
P x-1 (t-1)
P x (t-1)
R x+1 (t), D x ' (t)
R x (t), D x '' (t)
R x (t), D x-1 ' (t)
( )tPx – the number of persons
aged x at the end of year t
( )tB – the number of births in year
t
( )D tx' – the number of death in
year t at the age of x , amongst
people born in year t x− −1
( )D tx'' – the number of persons
deceased in year t at age of xamongst people born in year
t x−
( )R tx – correction for the number
of population in year t with regard to migration of persons born in year
t x−
( ) ( ) ( ) ( ) ( )( )tDtDtPtPtR xxxxx""
11 121 −−−−= −− dla / for 841 ≤≤ x
( ) ( ) ( ) ( )R t B t P t D t0 0 0= − − ''
lat ukończonych
w końcu roku t
8
.
Uwagi metodyczne Methodological notes
Pełne tablice trwania życia Complete life tables
Podstawą do budowy pełnych tablic trwania życia są liczby osób zmarłych w 2018 r. pogrupowane według roku urodzenia i wieku ukończonego, liczby urodzeń w 2018 r. oraz ludności według roczników wieku na koniec 2017 r. oraz 2018 r. Budowa tablicy opiera się na prawdopodobieństwach zgonu, które są obliczane do wieku 84 lat (włącznie) według wzorów przedstawionych poniżej, następnie ekstrapolowane powyżej 84 lat oraz wyrównywane w wieku od 1 do 84 lat. Inne parametry tablicy trwania życia są obliczane w sposób tradycyjny.
Complete life tables are drawn up on the basis of data on persons deceased in 2018 classified by the year of birth and age in completed years, the number of births in 2018 and population by single year of age at the end of 2017 and 2018. The computation of the tables is based on proba-bilities of death calculated up to the age of 84 using formulas presented below. The probabilities are extrapolated to the ages of 84 and more and then adjusted for ages 1-84. Other parameters of the life tables are calculated by traditional methods.
Oznaczenia: Notation:
( )tPx – liczba osób żyjących
w wieku x lat ukończonych
w końcu roku t( )tB – liczba urodzeń w roku t
( )D tx' – liczba osób zmarłych
w roku t , w wieku ukończonych xlat, spośród urodzonych
w roku t x− −1
( )D tx'' – liczba osób zmarłych
w roku t , w wieku ukończonych xlat, spośród urodzonych
w roku t x−
( )R tx – korekta dla liczby ludności
ze względu na migracje w roku tosób urodzonych w roku
t x−
x+1
x
x-1
t
P x (t)
P x-1 (t-1)
P x (t-1)
R x+1 (t), D x ' (t)
R x (t), D x '' (t)
R x (t), D x-1 ' (t)
( )tPx – the number of persons
aged x at the end of year t
( )tB – the number of births in year
t
( )D tx' – the number of death in
year t at the age of x , amongst
people born in year t x− −1
( )D tx'' – the number of persons
deceased in year t at age of xamongst people born in year
t x−
( )R tx – correction for the number
of population in year t with regard to migration of persons born in year
t x−
( ) ( ) ( ) ( ) ( )( )tDtDtPtPtR xxxxx""
11 121 −−−−= −− dla / for 841 ≤≤ x
( ) ( ) ( ) ( )R t B t P t D t0 0 0= − − ''
– liczba urodzeń w roku t
8
.
Uwagi metodyczne Methodological notes
Pełne tablice trwania życia Complete life tables
Podstawą do budowy pełnych tablic trwania życia są liczby osób zmarłych w 2018 r. pogrupowane według roku urodzenia i wieku ukończonego, liczby urodzeń w 2018 r. oraz ludności według roczników wieku na koniec 2017 r. oraz 2018 r. Budowa tablicy opiera się na prawdopodobieństwach zgonu, które są obliczane do wieku 84 lat (włącznie) według wzorów przedstawionych poniżej, następnie ekstrapolowane powyżej 84 lat oraz wyrównywane w wieku od 1 do 84 lat. Inne parametry tablicy trwania życia są obliczane w sposób tradycyjny.
Complete life tables are drawn up on the basis of data on persons deceased in 2018 classified by the year of birth and age in completed years, the number of births in 2018 and population by single year of age at the end of 2017 and 2018. The computation of the tables is based on proba-bilities of death calculated up to the age of 84 using formulas presented below. The probabilities are extrapolated to the ages of 84 and more and then adjusted for ages 1-84. Other parameters of the life tables are calculated by traditional methods.
Oznaczenia: Notation:
( )tPx – liczba osób żyjących
w wieku x lat ukończonych
w końcu roku t( )tB – liczba urodzeń w roku t
( )D tx' – liczba osób zmarłych
w roku t , w wieku ukończonych xlat, spośród urodzonych
w roku t x− −1
( )D tx'' – liczba osób zmarłych
w roku t , w wieku ukończonych xlat, spośród urodzonych
w roku t x−
( )R tx – korekta dla liczby ludności
ze względu na migracje w roku tosób urodzonych w roku
t x−
x+1
x
x-1
t
P x (t)
P x-1 (t-1)
P x (t-1)
R x+1 (t), D x ' (t)
R x (t), D x '' (t)
R x (t), D x-1 ' (t)
( )tPx – the number of persons
aged x at the end of year t
( )tB – the number of births in year
t
( )D tx' – the number of death in
year t at the age of x , amongst
people born in year t x− −1
( )D tx'' – the number of persons
deceased in year t at age of xamongst people born in year
t x−
( )R tx – correction for the number
of population in year t with regard to migration of persons born in year
t x−
( ) ( ) ( ) ( ) ( )( )tDtDtPtPtR xxxxx""
11 121 −−−−= −− dla / for 841 ≤≤ x
( ) ( ) ( ) ( )R t B t P t D t0 0 0= − − ''
– liczba osób zmarłych
w roku t , w wieku ukończonych
8
.
Uwagi metodyczne Methodological notes
Pełne tablice trwania życia Complete life tables
Podstawą do budowy pełnych tablic trwania życia są liczby osób zmarłych w 2018 r. pogrupowane według roku urodzenia i wieku ukończonego, liczby urodzeń w 2018 r. oraz ludności według roczników wieku na koniec 2017 r. oraz 2018 r. Budowa tablicy opiera się na prawdopodobieństwach zgonu, które są obliczane do wieku 84 lat (włącznie) według wzorów przedstawionych poniżej, następnie ekstrapolowane powyżej 84 lat oraz wyrównywane w wieku od 1 do 84 lat. Inne parametry tablicy trwania życia są obliczane w sposób tradycyjny.
Complete life tables are drawn up on the basis of data on persons deceased in 2018 classified by the year of birth and age in completed years, the number of births in 2018 and population by single year of age at the end of 2017 and 2018. The computation of the tables is based on proba-bilities of death calculated up to the age of 84 using formulas presented below. The probabilities are extrapolated to the ages of 84 and more and then adjusted for ages 1-84. Other parameters of the life tables are calculated by traditional methods.
Oznaczenia: Notation:
( )tPx – liczba osób żyjących
w wieku x lat ukończonych
w końcu roku t( )tB – liczba urodzeń w roku t
( )D tx' – liczba osób zmarłych
w roku t , w wieku ukończonych xlat, spośród urodzonych
w roku t x− −1
( )D tx'' – liczba osób zmarłych
w roku t , w wieku ukończonych xlat, spośród urodzonych
w roku t x−
( )R tx – korekta dla liczby ludności
ze względu na migracje w roku tosób urodzonych w roku
t x−
x+1
x
x-1
t
P x (t)
P x-1 (t-1)
P x (t-1)
R x+1 (t), D x ' (t)
R x (t), D x '' (t)
R x (t), D x-1 ' (t)
( )tPx – the number of persons
aged x at the end of year t
( )tB – the number of births in year
t
( )D tx' – the number of death in
year t at the age of x , amongst
people born in year t x− −1
( )D tx'' – the number of persons
deceased in year t at age of xamongst people born in year
t x−
( )R tx – correction for the number
of population in year t with regard to migration of persons born in year
t x−
( ) ( ) ( ) ( ) ( )( )tDtDtPtPtR xxxxx""
11 121 −−−−= −− dla / for 841 ≤≤ x
( ) ( ) ( ) ( )R t B t P t D t0 0 0= − − ''
lat, spośród urodzonych w roku
8
.
Uwagi metodyczne Methodological notes
Pełne tablice trwania życia Complete life tables
Podstawą do budowy pełnych tablic trwania życia są liczby osób zmarłych w 2018 r. pogrupowane według roku urodzenia i wieku ukończonego, liczby urodzeń w 2018 r. oraz ludności według roczników wieku na koniec 2017 r. oraz 2018 r. Budowa tablicy opiera się na prawdopodobieństwach zgonu, które są obliczane do wieku 84 lat (włącznie) według wzorów przedstawionych poniżej, następnie ekstrapolowane powyżej 84 lat oraz wyrównywane w wieku od 1 do 84 lat. Inne parametry tablicy trwania życia są obliczane w sposób tradycyjny.
Complete life tables are drawn up on the basis of data on persons deceased in 2018 classified by the year of birth and age in completed years, the number of births in 2018 and population by single year of age at the end of 2017 and 2018. The computation of the tables is based on proba-bilities of death calculated up to the age of 84 using formulas presented below. The probabilities are extrapolated to the ages of 84 and more and then adjusted for ages 1-84. Other parameters of the life tables are calculated by traditional methods.
Oznaczenia: Notation:
( )tPx – liczba osób żyjących
w wieku x lat ukończonych
w końcu roku t( )tB – liczba urodzeń w roku t
( )D tx' – liczba osób zmarłych
w roku t , w wieku ukończonych xlat, spośród urodzonych
w roku t x− −1
( )D tx'' – liczba osób zmarłych
w roku t , w wieku ukończonych xlat, spośród urodzonych
w roku t x−
( )R tx – korekta dla liczby ludności
ze względu na migracje w roku tosób urodzonych w roku
t x−
x+1
x
x-1
t
P x (t)
P x-1 (t-1)
P x (t-1)
R x+1 (t), D x ' (t)
R x (t), D x '' (t)
R x (t), D x-1 ' (t)
( )tPx – the number of persons
aged x at the end of year t
( )tB – the number of births in year
t
( )D tx' – the number of death in
year t at the age of x , amongst
people born in year t x− −1
( )D tx'' – the number of persons
deceased in year t at age of xamongst people born in year
t x−
( )R tx – correction for the number
of population in year t with regard to migration of persons born in year
t x−
( ) ( ) ( ) ( ) ( )( )tDtDtPtPtR xxxxx""
11 121 −−−−= −− dla / for 841 ≤≤ x
( ) ( ) ( ) ( )R t B t P t D t0 0 0= − − ''
– korekta dla liczby ludności
ze względu na migracje w roku t osób urodzonych w roku
8
.
Uwagi metodyczne Methodological notes
Pełne tablice trwania życia Complete life tables
Podstawą do budowy pełnych tablic trwania życia są liczby osób zmarłych w 2018 r. pogrupowane według roku urodzenia i wieku ukończonego, liczby urodzeń w 2018 r. oraz ludności według roczników wieku na koniec 2017 r. oraz 2018 r. Budowa tablicy opiera się na prawdopodobieństwach zgonu, które są obliczane do wieku 84 lat (włącznie) według wzorów przedstawionych poniżej, następnie ekstrapolowane powyżej 84 lat oraz wyrównywane w wieku od 1 do 84 lat. Inne parametry tablicy trwania życia są obliczane w sposób tradycyjny.
Complete life tables are drawn up on the basis of data on persons deceased in 2018 classified by the year of birth and age in completed years, the number of births in 2018 and population by single year of age at the end of 2017 and 2018. The computation of the tables is based on proba-bilities of death calculated up to the age of 84 using formulas presented below. The probabilities are extrapolated to the ages of 84 and more and then adjusted for ages 1-84. Other parameters of the life tables are calculated by traditional methods.
Oznaczenia: Notation:
( )tPx – liczba osób żyjących
w wieku x lat ukończonych
w końcu roku t( )tB – liczba urodzeń w roku t
( )D tx' – liczba osób zmarłych
w roku t , w wieku ukończonych xlat, spośród urodzonych
w roku t x− −1
( )D tx'' – liczba osób zmarłych
w roku t , w wieku ukończonych xlat, spośród urodzonych
w roku t x−
( )R tx – korekta dla liczby ludności
ze względu na migracje w roku tosób urodzonych w roku
t x−
x+1
x
x-1
t
P x (t)
P x-1 (t-1)
P x (t-1)
R x+1 (t), D x ' (t)
R x (t), D x '' (t)
R x (t), D x-1 ' (t)
( )tPx – the number of persons
aged x at the end of year t
( )tB – the number of births in year
t
( )D tx' – the number of death in
year t at the age of x , amongst
people born in year t x− −1
( )D tx'' – the number of persons
deceased in year t at age of xamongst people born in year
t x−
( )R tx – correction for the number
of population in year t with regard to migration of persons born in year
t x−
( ) ( ) ( ) ( ) ( )( )tDtDtPtPtR xxxxx""
11 121 −−−−= −− dla / for 841 ≤≤ x
( ) ( ) ( ) ( )R t B t P t D t0 0 0= − − ''
8. Methodological notes
Complete life tables
Complete life tables are drawn up on the basis of data on persons deceased in 2018 classified by the year of birth and age in completed years, the number of births in 2018 and population by single year of age at the end of 2017 and 2018. The computation of the tables is based on proba-bilities of death calculated up to the age of 84 using formulas presented below. The probabilities are extrapolated to the ages of 84 and more and then adjusted for ages 1-84. Other parameters of the life tables are calculated by traditional methods.
Notation:
8
.
Uwagi metodyczne Methodological notes
Pełne tablice trwania życia Complete life tables
Podstawą do budowy pełnych tablic trwania życia są liczby osób zmarłych w 2018 r. pogrupowane według roku urodzenia i wieku ukończonego, liczby urodzeń w 2018 r. oraz ludności według roczników wieku na koniec 2017 r. oraz 2018 r. Budowa tablicy opiera się na prawdopodobieństwach zgonu, które są obliczane do wieku 84 lat (włącznie) według wzorów przedstawionych poniżej, następnie ekstrapolowane powyżej 84 lat oraz wyrównywane w wieku od 1 do 84 lat. Inne parametry tablicy trwania życia są obliczane w sposób tradycyjny.
Complete life tables are drawn up on the basis of data on persons deceased in 2018 classified by the year of birth and age in completed years, the number of births in 2018 and population by single year of age at the end of 2017 and 2018. The computation of the tables is based on proba-bilities of death calculated up to the age of 84 using formulas presented below. The probabilities are extrapolated to the ages of 84 and more and then adjusted for ages 1-84. Other parameters of the life tables are calculated by traditional methods.
Oznaczenia: Notation:
( )tPx – liczba osób żyjących
w wieku x lat ukończonych
w końcu roku t( )tB – liczba urodzeń w roku t
( )D tx' – liczba osób zmarłych
w roku t , w wieku ukończonych xlat, spośród urodzonych
w roku t x− −1
( )D tx'' – liczba osób zmarłych
w roku t , w wieku ukończonych xlat, spośród urodzonych
w roku t x−
( )R tx – korekta dla liczby ludności
ze względu na migracje w roku tosób urodzonych w roku
t x−
x+1
x
x-1
t
P x (t)
P x-1 (t-1)
P x (t-1)
R x+1 (t), D x ' (t)
R x (t), D x '' (t)
R x (t), D x-1 ' (t)
( )tPx – the number of persons
aged x at the end of year t
( )tB – the number of births in year
t
( )D tx' – the number of death in
year t at the age of x , amongst
people born in year t x− −1
( )D tx'' – the number of persons
deceased in year t at age of xamongst people born in year
t x−
( )R tx – correction for the number
of population in year t with regard to migration of persons born in year
t x−
( ) ( ) ( ) ( ) ( )( )tDtDtPtPtR xxxxx""
11 121 −−−−= −− dla / for 841 ≤≤ x
( ) ( ) ( ) ( )R t B t P t D t0 0 0= − − ''
– the number of persons
aged
8
.
Uwagi metodyczne Methodological notes
Pełne tablice trwania życia Complete life tables
Podstawą do budowy pełnych tablic trwania życia są liczby osób zmarłych w 2018 r. pogrupowane według roku urodzenia i wieku ukończonego, liczby urodzeń w 2018 r. oraz ludności według roczników wieku na koniec 2017 r. oraz 2018 r. Budowa tablicy opiera się na prawdopodobieństwach zgonu, które są obliczane do wieku 84 lat (włącznie) według wzorów przedstawionych poniżej, następnie ekstrapolowane powyżej 84 lat oraz wyrównywane w wieku od 1 do 84 lat. Inne parametry tablicy trwania życia są obliczane w sposób tradycyjny.
Complete life tables are drawn up on the basis of data on persons deceased in 2018 classified by the year of birth and age in completed years, the number of births in 2018 and population by single year of age at the end of 2017 and 2018. The computation of the tables is based on proba-bilities of death calculated up to the age of 84 using formulas presented below. The probabilities are extrapolated to the ages of 84 and more and then adjusted for ages 1-84. Other parameters of the life tables are calculated by traditional methods.
Oznaczenia: Notation:
( )tPx – liczba osób żyjących
w wieku x lat ukończonych
w końcu roku t( )tB – liczba urodzeń w roku t
( )D tx' – liczba osób zmarłych
w roku t , w wieku ukończonych xlat, spośród urodzonych
w roku t x− −1
( )D tx'' – liczba osób zmarłych
w roku t , w wieku ukończonych xlat, spośród urodzonych
w roku t x−
( )R tx – korekta dla liczby ludności
ze względu na migracje w roku tosób urodzonych w roku
t x−
x+1
x
x-1
t
P x (t)
P x-1 (t-1)
P x (t-1)
R x+1 (t), D x ' (t)
R x (t), D x '' (t)
R x (t), D x-1 ' (t)
( )tPx – the number of persons
aged x at the end of year t
( )tB – the number of births in year
t
( )D tx' – the number of death in
year t at the age of x , amongst
people born in year t x− −1
( )D tx'' – the number of persons
deceased in year t at age of xamongst people born in year
t x−
( )R tx – correction for the number
of population in year t with regard to migration of persons born in year
t x−
( ) ( ) ( ) ( ) ( )( )tDtDtPtPtR xxxxx""
11 121 −−−−= −− dla / for 841 ≤≤ x
( ) ( ) ( ) ( )R t B t P t D t0 0 0= − − ''
at the end of year t
8
.
Uwagi metodyczne Methodological notes
Pełne tablice trwania życia Complete life tables
Podstawą do budowy pełnych tablic trwania życia są liczby osób zmarłych w 2018 r. pogrupowane według roku urodzenia i wieku ukończonego, liczby urodzeń w 2018 r. oraz ludności według roczników wieku na koniec 2017 r. oraz 2018 r. Budowa tablicy opiera się na prawdopodobieństwach zgonu, które są obliczane do wieku 84 lat (włącznie) według wzorów przedstawionych poniżej, następnie ekstrapolowane powyżej 84 lat oraz wyrównywane w wieku od 1 do 84 lat. Inne parametry tablicy trwania życia są obliczane w sposób tradycyjny.
Complete life tables are drawn up on the basis of data on persons deceased in 2018 classified by the year of birth and age in completed years, the number of births in 2018 and population by single year of age at the end of 2017 and 2018. The computation of the tables is based on proba-bilities of death calculated up to the age of 84 using formulas presented below. The probabilities are extrapolated to the ages of 84 and more and then adjusted for ages 1-84. Other parameters of the life tables are calculated by traditional methods.
Oznaczenia: Notation:
( )tPx – liczba osób żyjących
w wieku x lat ukończonych
w końcu roku t( )tB – liczba urodzeń w roku t
( )D tx' – liczba osób zmarłych
w roku t , w wieku ukończonych xlat, spośród urodzonych
w roku t x− −1
( )D tx'' – liczba osób zmarłych
w roku t , w wieku ukończonych xlat, spośród urodzonych
w roku t x−
( )R tx – korekta dla liczby ludności
ze względu na migracje w roku tosób urodzonych w roku
t x−
x+1
x
x-1
t
P x (t)
P x-1 (t-1)
P x (t-1)
R x+1 (t), D x ' (t)
R x (t), D x '' (t)
R x (t), D x-1 ' (t)
( )tPx – the number of persons
aged x at the end of year t
( )tB – the number of births in year
t
( )D tx' – the number of death in
year t at the age of x , amongst
people born in year t x− −1
( )D tx'' – the number of persons
deceased in year t at age of xamongst people born in year
t x−
( )R tx – correction for the number
of population in year t with regard to migration of persons born in year
t x−
( ) ( ) ( ) ( ) ( )( )tDtDtPtPtR xxxxx""
11 121 −−−−= −− dla / for 841 ≤≤ x
( ) ( ) ( ) ( )R t B t P t D t0 0 0= − − ''
– the number of births in year t
8
.
Uwagi metodyczne Methodological notes
Pełne tablice trwania życia Complete life tables
Podstawą do budowy pełnych tablic trwania życia są liczby osób zmarłych w 2018 r. pogrupowane według roku urodzenia i wieku ukończonego, liczby urodzeń w 2018 r. oraz ludności według roczników wieku na koniec 2017 r. oraz 2018 r. Budowa tablicy opiera się na prawdopodobieństwach zgonu, które są obliczane do wieku 84 lat (włącznie) według wzorów przedstawionych poniżej, następnie ekstrapolowane powyżej 84 lat oraz wyrównywane w wieku od 1 do 84 lat. Inne parametry tablicy trwania życia są obliczane w sposób tradycyjny.
Complete life tables are drawn up on the basis of data on persons deceased in 2018 classified by the year of birth and age in completed years, the number of births in 2018 and population by single year of age at the end of 2017 and 2018. The computation of the tables is based on proba-bilities of death calculated up to the age of 84 using formulas presented below. The probabilities are extrapolated to the ages of 84 and more and then adjusted for ages 1-84. Other parameters of the life tables are calculated by traditional methods.
Oznaczenia: Notation:
( )tPx – liczba osób żyjących
w wieku x lat ukończonych
w końcu roku t( )tB – liczba urodzeń w roku t
( )D tx' – liczba osób zmarłych
w roku t , w wieku ukończonych xlat, spośród urodzonych
w roku t x− −1
( )D tx'' – liczba osób zmarłych
w roku t , w wieku ukończonych xlat, spośród urodzonych
w roku t x−
( )R tx – korekta dla liczby ludności
ze względu na migracje w roku tosób urodzonych w roku
t x−
x+1
x
x-1
t
P x (t)
P x-1 (t-1)
P x (t-1)
R x+1 (t), D x ' (t)
R x (t), D x '' (t)
R x (t), D x-1 ' (t)
( )tPx – the number of persons
aged x at the end of year t
( )tB – the number of births in year
t
( )D tx' – the number of death in
year t at the age of x , amongst
people born in year t x− −1
( )D tx'' – the number of persons
deceased in year t at age of xamongst people born in year
t x−
( )R tx – correction for the number
of population in year t with regard to migration of persons born in year
t x−
( ) ( ) ( ) ( ) ( )( )tDtDtPtPtR xxxxx""
11 121 −−−−= −− dla / for 841 ≤≤ x
( ) ( ) ( ) ( )R t B t P t D t0 0 0= − − ''
– the number of death in
year t at the age of
8
.
Uwagi metodyczne Methodological notes
Pełne tablice trwania życia Complete life tables
Podstawą do budowy pełnych tablic trwania życia są liczby osób zmarłych w 2018 r. pogrupowane według roku urodzenia i wieku ukończonego, liczby urodzeń w 2018 r. oraz ludności według roczników wieku na koniec 2017 r. oraz 2018 r. Budowa tablicy opiera się na prawdopodobieństwach zgonu, które są obliczane do wieku 84 lat (włącznie) według wzorów przedstawionych poniżej, następnie ekstrapolowane powyżej 84 lat oraz wyrównywane w wieku od 1 do 84 lat. Inne parametry tablicy trwania życia są obliczane w sposób tradycyjny.
Complete life tables are drawn up on the basis of data on persons deceased in 2018 classified by the year of birth and age in completed years, the number of births in 2018 and population by single year of age at the end of 2017 and 2018. The computation of the tables is based on proba-bilities of death calculated up to the age of 84 using formulas presented below. The probabilities are extrapolated to the ages of 84 and more and then adjusted for ages 1-84. Other parameters of the life tables are calculated by traditional methods.
Oznaczenia: Notation:
( )tPx – liczba osób żyjących
w wieku x lat ukończonych
w końcu roku t( )tB – liczba urodzeń w roku t
( )D tx' – liczba osób zmarłych
w roku t , w wieku ukończonych xlat, spośród urodzonych
w roku t x− −1
( )D tx'' – liczba osób zmarłych
w roku t , w wieku ukończonych xlat, spośród urodzonych
w roku t x−
( )R tx – korekta dla liczby ludności
ze względu na migracje w roku tosób urodzonych w roku
t x−
x+1
x
x-1
t
P x (t)
P x-1 (t-1)
P x (t-1)
R x+1 (t), D x ' (t)
R x (t), D x '' (t)
R x (t), D x-1 ' (t)
( )tPx – the number of persons
aged x at the end of year t
( )tB – the number of births in year
t
( )D tx' – the number of death in
year t at the age of x , amongst
people born in year t x− −1
( )D tx'' – the number of persons
deceased in year t at age of xamongst people born in year
t x−
( )R tx – correction for the number
of population in year t with regard to migration of persons born in year
t x−
( ) ( ) ( ) ( ) ( )( )tDtDtPtPtR xxxxx""
11 121 −−−−= −− dla / for 841 ≤≤ x
( ) ( ) ( ) ( )R t B t P t D t0 0 0= − − ''
, amongst
people born in year
8
.
Uwagi metodyczne Methodological notes
Pełne tablice trwania życia Complete life tables
Podstawą do budowy pełnych tablic trwania życia są liczby osób zmarłych w 2018 r. pogrupowane według roku urodzenia i wieku ukończonego, liczby urodzeń w 2018 r. oraz ludności według roczników wieku na koniec 2017 r. oraz 2018 r. Budowa tablicy opiera się na prawdopodobieństwach zgonu, które są obliczane do wieku 84 lat (włącznie) według wzorów przedstawionych poniżej, następnie ekstrapolowane powyżej 84 lat oraz wyrównywane w wieku od 1 do 84 lat. Inne parametry tablicy trwania życia są obliczane w sposób tradycyjny.
Complete life tables are drawn up on the basis of data on persons deceased in 2018 classified by the year of birth and age in completed years, the number of births in 2018 and population by single year of age at the end of 2017 and 2018. The computation of the tables is based on proba-bilities of death calculated up to the age of 84 using formulas presented below. The probabilities are extrapolated to the ages of 84 and more and then adjusted for ages 1-84. Other parameters of the life tables are calculated by traditional methods.
Oznaczenia: Notation:
( )tPx – liczba osób żyjących
w wieku x lat ukończonych
w końcu roku t( )tB – liczba urodzeń w roku t
( )D tx' – liczba osób zmarłych
w roku t , w wieku ukończonych xlat, spośród urodzonych
w roku t x− −1
( )D tx'' – liczba osób zmarłych
w roku t , w wieku ukończonych xlat, spośród urodzonych
w roku t x−
( )R tx – korekta dla liczby ludności
ze względu na migracje w roku tosób urodzonych w roku
t x−
x+1
x
x-1
t
P x (t)
P x-1 (t-1)
P x (t-1)
R x+1 (t), D x ' (t)
R x (t), D x '' (t)
R x (t), D x-1 ' (t)
( )tPx – the number of persons
aged x at the end of year t
( )tB – the number of births in year
t
( )D tx' – the number of death in
year t at the age of x , amongst
people born in year t x− −1
( )D tx'' – the number of persons
deceased in year t at age of xamongst people born in year
t x−
( )R tx – correction for the number
of population in year t with regard to migration of persons born in year
t x−
( ) ( ) ( ) ( ) ( )( )tDtDtPtPtR xxxxx""
11 121 −−−−= −− dla / for 841 ≤≤ x
( ) ( ) ( ) ( )R t B t P t D t0 0 0= − − ''
– the number of persons
deceased in year t at age of
8
.
Uwagi metodyczne Methodological notes
Pełne tablice trwania życia Complete life tables
Podstawą do budowy pełnych tablic trwania życia są liczby osób zmarłych w 2018 r. pogrupowane według roku urodzenia i wieku ukończonego, liczby urodzeń w 2018 r. oraz ludności według roczników wieku na koniec 2017 r. oraz 2018 r. Budowa tablicy opiera się na prawdopodobieństwach zgonu, które są obliczane do wieku 84 lat (włącznie) według wzorów przedstawionych poniżej, następnie ekstrapolowane powyżej 84 lat oraz wyrównywane w wieku od 1 do 84 lat. Inne parametry tablicy trwania życia są obliczane w sposób tradycyjny.
Complete life tables are drawn up on the basis of data on persons deceased in 2018 classified by the year of birth and age in completed years, the number of births in 2018 and population by single year of age at the end of 2017 and 2018. The computation of the tables is based on proba-bilities of death calculated up to the age of 84 using formulas presented below. The probabilities are extrapolated to the ages of 84 and more and then adjusted for ages 1-84. Other parameters of the life tables are calculated by traditional methods.
Oznaczenia: Notation:
( )tPx – liczba osób żyjących
w wieku x lat ukończonych
w końcu roku t( )tB – liczba urodzeń w roku t
( )D tx' – liczba osób zmarłych
w roku t , w wieku ukończonych xlat, spośród urodzonych
w roku t x− −1
( )D tx'' – liczba osób zmarłych
w roku t , w wieku ukończonych xlat, spośród urodzonych
w roku t x−
( )R tx – korekta dla liczby ludności
ze względu na migracje w roku tosób urodzonych w roku
t x−
x+1
x
x-1
t
P x (t)
P x-1 (t-1)
P x (t-1)
R x+1 (t), D x ' (t)
R x (t), D x '' (t)
R x (t), D x-1 ' (t)
( )tPx – the number of persons
aged x at the end of year t
( )tB – the number of births in year
t
( )D tx' – the number of death in
year t at the age of x , amongst
people born in year t x− −1
( )D tx'' – the number of persons
deceased in year t at age of xamongst people born in year
t x−
( )R tx – correction for the number
of population in year t with regard to migration of persons born in year
t x−
( ) ( ) ( ) ( ) ( )( )tDtDtPtPtR xxxxx""
11 121 −−−−= −− dla / for 841 ≤≤ x
( ) ( ) ( ) ( )R t B t P t D t0 0 0= − − ''
amongst people born in year
8
.
Uwagi metodyczne Methodological notes
Pełne tablice trwania życia Complete life tables
Podstawą do budowy pełnych tablic trwania życia są liczby osób zmarłych w 2018 r. pogrupowane według roku urodzenia i wieku ukończonego, liczby urodzeń w 2018 r. oraz ludności według roczników wieku na koniec 2017 r. oraz 2018 r. Budowa tablicy opiera się na prawdopodobieństwach zgonu, które są obliczane do wieku 84 lat (włącznie) według wzorów przedstawionych poniżej, następnie ekstrapolowane powyżej 84 lat oraz wyrównywane w wieku od 1 do 84 lat. Inne parametry tablicy trwania życia są obliczane w sposób tradycyjny.
Complete life tables are drawn up on the basis of data on persons deceased in 2018 classified by the year of birth and age in completed years, the number of births in 2018 and population by single year of age at the end of 2017 and 2018. The computation of the tables is based on proba-bilities of death calculated up to the age of 84 using formulas presented below. The probabilities are extrapolated to the ages of 84 and more and then adjusted for ages 1-84. Other parameters of the life tables are calculated by traditional methods.
Oznaczenia: Notation:
( )tPx – liczba osób żyjących
w wieku x lat ukończonych
w końcu roku t( )tB – liczba urodzeń w roku t
( )D tx' – liczba osób zmarłych
w roku t , w wieku ukończonych xlat, spośród urodzonych
w roku t x− −1
( )D tx'' – liczba osób zmarłych
w roku t , w wieku ukończonych xlat, spośród urodzonych
w roku t x−
( )R tx – korekta dla liczby ludności
ze względu na migracje w roku tosób urodzonych w roku
t x−
x+1
x
x-1
t
P x (t)
P x-1 (t-1)
P x (t-1)
R x+1 (t), D x ' (t)
R x (t), D x '' (t)
R x (t), D x-1 ' (t)
( )tPx – the number of persons
aged x at the end of year t
( )tB – the number of births in year
t
( )D tx' – the number of death in
year t at the age of x , amongst
people born in year t x− −1
( )D tx'' – the number of persons
deceased in year t at age of xamongst people born in year
t x−
( )R tx – correction for the number
of population in year t with regard to migration of persons born in year
t x−
( ) ( ) ( ) ( ) ( )( )tDtDtPtPtR xxxxx""
11 121 −−−−= −− dla / for 841 ≤≤ x
( ) ( ) ( ) ( )R t B t P t D t0 0 0= − − ''
– correction for the number
of population in year t with regard
to migration of persons born in year
8
.
Uwagi metodyczne Methodological notes
Pełne tablice trwania życia Complete life tables
Podstawą do budowy pełnych tablic trwania życia są liczby osób zmarłych w 2018 r. pogrupowane według roku urodzenia i wieku ukończonego, liczby urodzeń w 2018 r. oraz ludności według roczników wieku na koniec 2017 r. oraz 2018 r. Budowa tablicy opiera się na prawdopodobieństwach zgonu, które są obliczane do wieku 84 lat (włącznie) według wzorów przedstawionych poniżej, następnie ekstrapolowane powyżej 84 lat oraz wyrównywane w wieku od 1 do 84 lat. Inne parametry tablicy trwania życia są obliczane w sposób tradycyjny.
Complete life tables are drawn up on the basis of data on persons deceased in 2018 classified by the year of birth and age in completed years, the number of births in 2018 and population by single year of age at the end of 2017 and 2018. The computation of the tables is based on proba-bilities of death calculated up to the age of 84 using formulas presented below. The probabilities are extrapolated to the ages of 84 and more and then adjusted for ages 1-84. Other parameters of the life tables are calculated by traditional methods.
Oznaczenia: Notation:
( )tPx – liczba osób żyjących
w wieku x lat ukończonych
w końcu roku t( )tB – liczba urodzeń w roku t
( )D tx' – liczba osób zmarłych
w roku t , w wieku ukończonych xlat, spośród urodzonych
w roku t x− −1
( )D tx'' – liczba osób zmarłych
w roku t , w wieku ukończonych xlat, spośród urodzonych
w roku t x−
( )R tx – korekta dla liczby ludności
ze względu na migracje w roku tosób urodzonych w roku
t x−
x+1
x
x-1
t
P x (t)
P x-1 (t-1)
P x (t-1)
R x+1 (t), D x ' (t)
R x (t), D x '' (t)
R x (t), D x-1 ' (t)
( )tPx – the number of persons
aged x at the end of year t
( )tB – the number of births in year
t
( )D tx' – the number of death in
year t at the age of x , amongst
people born in year t x− −1
( )D tx'' – the number of persons
deceased in year t at age of xamongst people born in year
t x−
( )R tx – correction for the number
of population in year t with regard to migration of persons born in year
t x−
( ) ( ) ( ) ( ) ( )( )tDtDtPtPtR xxxxx""
11 121 −−−−= −− dla / for 841 ≤≤ x
( ) ( ) ( ) ( )R t B t P t D t0 0 0= − − ''
8
.
Uwagi metodyczne Methodological notes
Pełne tablice trwania życia Complete life tables
Podstawą do budowy pełnych tablic trwania życia są liczby osób zmarłych w 2018 r. pogrupowane według roku urodzenia i wieku ukończonego, liczby urodzeń w 2018 r. oraz ludności według roczników wieku na koniec 2017 r. oraz 2018 r. Budowa tablicy opiera się na prawdopodobieństwach zgonu, które są obliczane do wieku 84 lat (włącznie) według wzorów przedstawionych poniżej, następnie ekstrapolowane powyżej 84 lat oraz wyrównywane w wieku od 1 do 84 lat. Inne parametry tablicy trwania życia są obliczane w sposób tradycyjny.
Complete life tables are drawn up on the basis of data on persons deceased in 2018 classified by the year of birth and age in completed years, the number of births in 2018 and population by single year of age at the end of 2017 and 2018. The computation of the tables is based on proba-bilities of death calculated up to the age of 84 using formulas presented below. The probabilities are extrapolated to the ages of 84 and more and then adjusted for ages 1-84. Other parameters of the life tables are calculated by traditional methods.
Oznaczenia: Notation:
( )tPx – liczba osób żyjących w wieku x lat ukończonych w końcu roku t
( )tB – liczba urodzeń w roku t
( )D tx' – liczba osób zmarłych w
roku t , w wieku ukończonych x lat, spośród urodzonych w roku t x− −1
( )D tx'' – liczba osób zmarłych w
roku t , w wieku ukończonych x lat, spośród urodzonych w roku t x−
( )R tx – korekta dla liczby
ludności ze względu na migracje w roku t osób urodzonych w roku t x−
x+1
x
x-1
t
P x (t)
P x-1 (t-1)
P x (t-1)
R x+1 (t), D x ' (t)
R x (t), D x '' (t)
R x (t), D x-1 ' (t)
( )tPx – the number of persons
aged x at the end of year t
( )tB – the number of births
in year t
( )D tx' – the number of death in
year t at the age of x , amongst people born in year t x− −1
( )D tx'' – the number of persons
deceased in year tat age of x amongst people born in year t x−
( )R tx – correction for the
number of population in year t with regard to migration of persons born in year t x−
( ) ( ) ( ) ( ) ( )( )tDtDtPtPtR xxxxx""
11 121 −−−−= −− dla / for 841 ≤≤ x
8
.
Uwagi metodyczne Methodological notes
Pełne tablice trwania życia Complete life tables
Podstawą do budowy pełnych tablic trwania życia są liczby osób zmarłych w 2018 r. pogrupowane według roku urodzenia i wieku ukończonego, liczby urodzeń w 2018 r. oraz ludności według roczników wieku na koniec 2017 r. oraz 2018 r. Budowa tablicy opiera się na prawdopodobieństwach zgonu, które są obliczane do wieku 84 lat (włącznie) według wzorów przedstawionych poniżej, następnie ekstrapolowane powyżej 84 lat oraz wyrównywane w wieku od 1 do 84 lat. Inne parametry tablicy trwania życia są obliczane w sposób tradycyjny.
Complete life tables are drawn up on the basis of data on persons deceased in 2018 classified by the year of birth and age in completed years, the number of births in 2018 and population by single year of age at the end of 2017 and 2018. The computation of the tables is based on proba-bilities of death calculated up to the age of 84 using formulas presented below. The probabilities are extrapolated to the ages of 84 and more and then adjusted for ages 1-84. Other parameters of the life tables are calculated by traditional methods.
Oznaczenia: Notation:
( )tPx – liczba osób żyjących w wieku x lat ukończonych w końcu roku t
( )tB – liczba urodzeń w roku t
( )D tx' – liczba osób zmarłych w
roku t , w wieku ukończonych x lat, spośród urodzonych w roku t x− −1
( )D tx'' – liczba osób zmarłych w
roku t , w wieku ukończonych x lat, spośród urodzonych w roku t x−
( )R tx – korekta dla liczby
ludności ze względu na migracje w roku t osób urodzonych w roku t x−
x+1
x
x-1
t
P x (t)
P x-1 (t-1)
P x (t-1)
R x+1 (t), D x ' (t)
R x (t), D x '' (t)
R x (t), D x-1 ' (t)
( )tPx – the number of persons
aged x at the end of year t
( )tB – the number of births
in year t
( )D tx' – the number of death in
year t at the age of x , amongst people born in year t x− −1
( )D tx'' – the number of persons
deceased in year tat age of x amongst people born in year t x−
( )R tx – correction for the
number of population in year t with regard to migration of persons born in year t x−
( ) ( ) ( ) ( ) ( )( )tDtDtPtPtR xxxxx""
11 121 −−−−= −− dla / for 841 ≤≤ x 9
( ) ( ) ( ) ( )R t B t P t D t0 0 0= − − ''
qx – prawdopodobieństwo zgonu obliczane jest według wzoru:
qx – the probability of death is calculated by use of the formula:
( )( ) 840/111 "' ≤≤−−−= xfordlaqqq xxx
gdzie / where
( )
( ) ( )q
D t
P t R tx
xt
x xt
'
'
=− −
+1 12 1
oraz / and ( )
( ) ( ) ( )q
D t
P t D t R tx
xt
x x xt
''
''
''=
+ +
12
W celu obliczenia prawdopodobieństw zgonu w wieku powyżej 84 lat wykonujemy dopasowanie funkcji wielomianowo-wykładniczej do liczby doży-wających (lx):
In order to calculate the probabilities of death for persons aged 84 and over the polynomial-exponential function is fitted to the number of survivors (lx):
( )55
2210exp100000 xbxbxbbl x −−−−−=
w punktach x = 40, 45, …., 85, a następnie ekstrapolacji na roczniki od 85 do 120.
Dopasowanie jest wykonywane uogólnioną metodą najmniejszych kwadratów (z zastosowaniem proce-dury optymalizacji nieliniowej Marquardta) przy założeniu, że macierz kowariancji liczb dożywa-jących ma elementy wyrażające się wzorem:
in points x = 40, 45, …., 85, and then extrapolated for ages 85-120
Fitting is done by use of the generalised least squares method (with application of Marquardt non-linear optimization method) with the assumption that the variance-convariance matrix of the number of survivors contains elements defined by the formula:
( )( )
( )Cov l l
llS l y x
llS l y x
x y
y
xx
x
yy
, =≥
<
2
2
gdzie ( )S lx2 jest oceną wariancji liczby dożywa-
jących obliczaną według wzorów:
in which ( )S lx2 is an estimate of the variance
of the number of survivors calculated by use of the following formulas:
( ) ( ) ( ) ( )S l q S l S q lx x x x x2
12 2 2 21+ = − +
( )S qq
Dqx
x
xx
2 21=
−

40
chapter 8. methodological notes
9
( ) ( ) ( ) ( )R t B t P t D t0 0 0= − − ''
qx – prawdopodobieństwo zgonu obliczane jest według wzoru:
qx – the probability of death is calculated by use of the formula:
( )( ) 840/111 "' ≤≤−−−= xfordlaqqq xxx
gdzie / where
( )
( ) ( )q
D t
P t R tx
xt
x xt
'
'
=− −
+1 12 1
oraz / and ( )
( ) ( ) ( )q
D t
P t D t R tx
xt
x x xt
''
''
''=
+ +
12
W celu obliczenia prawdopodobieństw zgonu w wieku powyżej 84 lat wykonujemy dopasowanie funkcji wielomianowo-wykładniczej do liczby doży-wających (lx):
In order to calculate the probabilities of death for persons aged 84 and over the polynomial-exponential function is fitted to the number of survivors (lx):
( )55
2210exp100000 xbxbxbbl x −−−−−=
w punktach x = 40, 45, …., 85, a następnie ekstrapolacji na roczniki od 85 do 120.
Dopasowanie jest wykonywane uogólnioną metodą najmniejszych kwadratów (z zastosowaniem proce-dury optymalizacji nieliniowej Marquardta) przy założeniu, że macierz kowariancji liczb dożywa-jących ma elementy wyrażające się wzorem:
in points x = 40, 45, …., 85, and then extrapolated for ages 85-120
Fitting is done by use of the generalised least squares method (with application of Marquardt non-linear optimization method) with the assumption that the variance-convariance matrix of the number of survivors contains elements defined by the formula:
( )( )
( )Cov l l
llS l y x
llS l y x
x y
y
xx
x
yy
, =≥
<
2
2
gdzie ( )S lx2 jest oceną wariancji liczby dożywa-
jących obliczaną według wzorów:
in which ( )S lx2 is an estimate of the variance
of the number of survivors calculated by use of the following formulas:
( ) ( ) ( ) ( )S l q S l S q lx x x x x2
12 2 2 21+ = − +
( )S qq
Dqx
x
xx
2 21=
−
– prawdopodobieństwo zgonu obliczane jest według wzoru:
9
( ) ( ) ( ) ( )R t B t P t D t0 0 0= − − ''
qx – prawdopodobieństwo zgonu obliczane jest według wzoru:
qx – the probability of death is calculated by use of the formula:
( )( ) 840/111 "' ≤≤−−−= xfordlaqqq xxx
gdzie / where
( )
( ) ( )q
D t
P t R tx
xt
x xt
'
'
=− −
+1 12 1
oraz / and ( )
( ) ( ) ( )q
D t
P t D t R tx
xt
x x xt
''
''
''=
+ +
12
W celu obliczenia prawdopodobieństw zgonu w wieku powyżej 84 lat wykonujemy dopasowanie funkcji wielomianowo-wykładniczej do liczby doży-wających (lx):
In order to calculate the probabilities of death for persons aged 84 and over the polynomial-exponential function is fitted to the number of survivors (lx):
( )55
2210exp100000 xbxbxbbl x −−−−−=
w punktach x = 40, 45, …., 85, a następnie ekstrapolacji na roczniki od 85 do 120.
Dopasowanie jest wykonywane uogólnioną metodą najmniejszych kwadratów (z zastosowaniem proce-dury optymalizacji nieliniowej Marquardta) przy założeniu, że macierz kowariancji liczb dożywa-jących ma elementy wyrażające się wzorem:
in points x = 40, 45, …., 85, and then extrapolated for ages 85-120
Fitting is done by use of the generalised least squares method (with application of Marquardt non-linear optimization method) with the assumption that the variance-convariance matrix of the number of survivors contains elements defined by the formula:
( )( )
( )Cov l l
llS l y x
llS l y x
x y
y
xx
x
yy
, =≥
<
2
2
gdzie ( )S lx2 jest oceną wariancji liczby dożywa-
jących obliczaną według wzorów:
in which ( )S lx2 is an estimate of the variance
of the number of survivors calculated by use of the following formulas:
( ) ( ) ( ) ( )S l q S l S q lx x x x x2
12 2 2 21+ = − +
( )S qq
Dqx
x
xx
2 21=
−
– the probability of death is calculated by use of the for-mula:
gdzie / where
9
( ) ( ) ( ) ( )R t B t P t D t0 0 0= − − ''
qx – prawdopodobieństwo zgonu obliczane jest według wzoru:
qx – the probability of death is calculated by use of the formula:
( )( ) 840/111 "' ≤≤−−−= xfordlaqqq xxx
gdzie / where
( )
( ) ( )q
D t
P t R tx
xt
x xt
'
'
=− −
+1 12 1
oraz / and ( )
( ) ( ) ( )q
D t
P t D t R tx
xt
x x xt
''
''
''=
+ +
12
W celu obliczenia prawdopodobieństw zgonu w wieku powyżej 84 lat wykonujemy dopasowanie funkcji wielomianowo-wykładniczej do liczby doży-wających (lx):
In order to calculate the probabilities of death for persons aged 84 and over the polynomial-exponential function is fitted to the number of survivors (lx):
( )55
2210exp100000 xbxbxbbl x −−−−−=
w punktach x = 40, 45, …., 85, a następnie ekstrapolacji na roczniki od 85 do 120.
Dopasowanie jest wykonywane uogólnioną metodą najmniejszych kwadratów (z zastosowaniem proce-dury optymalizacji nieliniowej Marquardta) przy założeniu, że macierz kowariancji liczb dożywa-jących ma elementy wyrażające się wzorem:
in points x = 40, 45, …., 85, and then extrapolated for ages 85-120
Fitting is done by use of the generalised least squares method (with application of Marquardt non-linear optimization method) with the assumption that the variance-convariance matrix of the number of survivors contains elements defined by the formula:
( )( )
( )Cov l l
llS l y x
llS l y x
x y
y
xx
x
yy
, =≥
<
2
2
gdzie ( )S lx2 jest oceną wariancji liczby dożywa-
jących obliczaną według wzorów:
in which ( )S lx2 is an estimate of the variance
of the number of survivors calculated by use of the following formulas:
( ) ( ) ( ) ( )S l q S l S q lx x x x x2
12 2 2 21+ = − +
( )S qq
Dqx
x
xx
2 21=
−
oraz / and
9
( ) ( ) ( ) ( )R t B t P t D t0 0 0= − − ''
qx – prawdopodobieństwo zgonu obliczane jest według wzoru:
qx – the probability of death is calculated by use of the formula:
( )( ) 840/111 "' ≤≤−−−= xfordlaqqq xxx
gdzie / where
( )
( ) ( )q
D t
P t R tx
xt
x xt
'
'
=− −
+1 12 1
oraz / and ( )
( ) ( ) ( )q
D t
P t D t R tx
xt
x x xt
''
''
''=
+ +
12
W celu obliczenia prawdopodobieństw zgonu w wieku powyżej 84 lat wykonujemy dopasowanie funkcji wielomianowo-wykładniczej do liczby doży-wających (lx):
In order to calculate the probabilities of death for persons aged 84 and over the polynomial-exponential function is fitted to the number of survivors (lx):
( )55
2210exp100000 xbxbxbbl x −−−−−=
w punktach x = 40, 45, …., 85, a następnie ekstrapolacji na roczniki od 85 do 120.
Dopasowanie jest wykonywane uogólnioną metodą najmniejszych kwadratów (z zastosowaniem proce-dury optymalizacji nieliniowej Marquardta) przy założeniu, że macierz kowariancji liczb dożywa-jących ma elementy wyrażające się wzorem:
in points x = 40, 45, …., 85, and then extrapolated for ages 85-120
Fitting is done by use of the generalised least squares method (with application of Marquardt non-linear optimization method) with the assumption that the variance-convariance matrix of the number of survivors contains elements defined by the formula:
( )( )
( )Cov l l
llS l y x
llS l y x
x y
y
xx
x
yy
, =≥
<
2
2
gdzie ( )S lx2 jest oceną wariancji liczby dożywa-
jących obliczaną według wzorów:
in which ( )S lx2 is an estimate of the variance
of the number of survivors calculated by use of the following formulas:
( ) ( ) ( ) ( )S l q S l S q lx x x x x2
12 2 2 21+ = − +
( )S qq
Dqx
x
xx
2 21=
−
W celu obliczenia prawdopodobieństw zgonu w wieku po-wyżej 84 lat wykonujemy dopasowanie funkcji wielomia- nowo-wykładniczej do liczby dożywających
9
( ) ( ) ( ) ( )R t B t P t D t0 0 0= − − ''
qx – prawdopodobieństwo zgonu obliczane jest według wzoru:
qx – the probability of death is calculated by use of the formula:
( )( ) 840/111 "' ≤≤−−−= xfordlaqqq xxx
gdzie / where
( )
( ) ( )q
D t
P t R tx
xt
x xt
'
'
=− −
+1 12 1
oraz / and ( )
( ) ( ) ( )q
D t
P t D t R tx
xt
x x xt
''
''
''=
+ +
12
W celu obliczenia prawdopodobieństw zgonu w wieku powyżej 84 lat wykonujemy dopasowanie funkcji wielomianowo-wykładniczej do liczby doży-wających (lx):
In order to calculate the probabilities of death for persons aged 84 and over the polynomial-exponential function is fitted to the number of survivors (lx):
( )55
2210exp100000 xbxbxbbl x −−−−−=
w punktach x = 40, 45, …., 85, a następnie ekstrapolacji na roczniki od 85 do 120.
Dopasowanie jest wykonywane uogólnioną metodą najmniejszych kwadratów (z zastosowaniem proce-dury optymalizacji nieliniowej Marquardta) przy założeniu, że macierz kowariancji liczb dożywa-jących ma elementy wyrażające się wzorem:
in points x = 40, 45, …., 85, and then extrapolated for ages 85-120
Fitting is done by use of the generalised least squares method (with application of Marquardt non-linear optimization method) with the assumption that the variance-convariance matrix of the number of survivors contains elements defined by the formula:
( )( )
( )Cov l l
llS l y x
llS l y x
x y
y
xx
x
yy
, =≥
<
2
2
gdzie ( )S lx2 jest oceną wariancji liczby dożywa-
jących obliczaną według wzorów:
in which ( )S lx2 is an estimate of the variance
of the number of survivors calculated by use of the following formulas:
( ) ( ) ( ) ( )S l q S l S q lx x x x x2
12 2 2 21+ = − +
( )S qq
Dqx
x
xx
2 21=
−
:
w punktach x = 40, 45, …., 85, a następnie ekstrapolacji na roczniki od 85 do 120.
Dopasowanie jest wykonywane uogólnioną metodą najmniej-szych kwadratów (z zastosowaniem procedury optymalizacji nieliniowej Marquardta) przy założeniu, że macierz kowarian-cji liczb dożywających ma elementy wyrażające się wzorem:
gdzie
9
( ) ( ) ( ) ( )R t B t P t D t0 0 0= − − ''
qx – prawdopodobieństwo zgonu obliczane jest według wzoru:
qx – the probability of death is calculated by use of the formula:
( )( ) 840/111 "' ≤≤−−−= xfordlaqqq xxx
gdzie / where
( )
( ) ( )q
D t
P t R tx
xt
x xt
'
'
=− −
+1 12 1
oraz / and ( )
( ) ( ) ( )q
D t
P t D t R tx
xt
x x xt
''
''
''=
+ +
12
W celu obliczenia prawdopodobieństw zgonu w wieku powyżej 84 lat wykonujemy dopasowanie funkcji wielomianowo-wykładniczej do liczby doży-wających (lx):
In order to calculate the probabilities of death for persons aged 84 and over the polynomial-exponential function is fitted to the number of survivors (lx):
( )55
2210exp100000 xbxbxbbl x −−−−−=
w punktach x = 40, 45, …., 85, a następnie ekstrapolacji na roczniki od 85 do 120.
Dopasowanie jest wykonywane uogólnioną metodą najmniejszych kwadratów (z zastosowaniem proce-dury optymalizacji nieliniowej Marquardta) przy założeniu, że macierz kowariancji liczb dożywa-jących ma elementy wyrażające się wzorem:
in points x = 40, 45, …., 85, and then extrapolated for ages 85-120
Fitting is done by use of the generalised least squares method (with application of Marquardt non-linear optimization method) with the assumption that the variance-convariance matrix of the number of survivors contains elements defined by the formula:
( )( )
( )Cov l l
llS l y x
llS l y x
x y
y
xx
x
yy
, =≥
<
2
2
gdzie ( )S lx2 jest oceną wariancji liczby dożywa-
jących obliczaną według wzorów:
in which ( )S lx2 is an estimate of the variance
of the number of survivors calculated by use of the following formulas:
( ) ( ) ( ) ( )S l q S l S q lx x x x x2
12 2 2 21+ = − +
( )S qq
Dqx
x
xx
2 21=
−
jest oceną wariancji liczby dożywających ob-
liczaną według wzorów:
In order to calculate the probabilities of death for persons aged 84 and over the polynomial-exponential function is fitted to the number of survivors
9
( ) ( ) ( ) ( )R t B t P t D t0 0 0= − − ''
qx – prawdopodobieństwo zgonu obliczane jest według wzoru:
qx – the probability of death is calculated by use of the formula:
( )( ) 840/111 "' ≤≤−−−= xfordlaqqq xxx
gdzie / where
( )
( ) ( )q
D t
P t R tx
xt
x xt
'
'
=− −
+1 12 1
oraz / and ( )
( ) ( ) ( )q
D t
P t D t R tx
xt
x x xt
''
''
''=
+ +
12
W celu obliczenia prawdopodobieństw zgonu w wieku powyżej 84 lat wykonujemy dopasowanie funkcji wielomianowo-wykładniczej do liczby doży-wających (lx):
In order to calculate the probabilities of death for persons aged 84 and over the polynomial-exponential function is fitted to the number of survivors (lx):
( )55
2210exp100000 xbxbxbbl x −−−−−=
w punktach x = 40, 45, …., 85, a następnie ekstrapolacji na roczniki od 85 do 120.
Dopasowanie jest wykonywane uogólnioną metodą najmniejszych kwadratów (z zastosowaniem proce-dury optymalizacji nieliniowej Marquardta) przy założeniu, że macierz kowariancji liczb dożywa-jących ma elementy wyrażające się wzorem:
in points x = 40, 45, …., 85, and then extrapolated for ages 85-120
Fitting is done by use of the generalised least squares method (with application of Marquardt non-linear optimization method) with the assumption that the variance-convariance matrix of the number of survivors contains elements defined by the formula:
( )( )
( )Cov l l
llS l y x
llS l y x
x y
y
xx
x
yy
, =≥
<
2
2
gdzie ( )S lx2 jest oceną wariancji liczby dożywa-
jących obliczaną według wzorów:
in which ( )S lx2 is an estimate of the variance
of the number of survivors calculated by use of the following formulas:
( ) ( ) ( ) ( )S l q S l S q lx x x x x2
12 2 2 21+ = − +
( )S qq
Dqx
x
xx
2 21=
−
:
in points x = 40, 45, …., 85, and then extrapolated for ages 85-120
Fitting is done by use of the generalised least squares me-thod (with application of Marquardt non-linear optimization method) with the assumption that the variance-convariance matrix of the number of survivors contains elements defined by the formula:
in which
9
( ) ( ) ( ) ( )R t B t P t D t0 0 0= − − ''
qx – prawdopodobieństwo zgonu obliczane jest według wzoru:
qx – the probability of death is calculated by use of the formula:
( )( ) 840/111 "' ≤≤−−−= xfordlaqqq xxx
gdzie / where
( )
( ) ( )q
D t
P t R tx
xt
x xt
'
'
=− −
+1 12 1
oraz / and ( )
( ) ( ) ( )q
D t
P t D t R tx
xt
x x xt
''
''
''=
+ +
12
W celu obliczenia prawdopodobieństw zgonu w wieku powyżej 84 lat wykonujemy dopasowanie funkcji wielomianowo-wykładniczej do liczby doży-wających (lx):
In order to calculate the probabilities of death for persons aged 84 and over the polynomial-exponential function is fitted to the number of survivors (lx):
( )55
2210exp100000 xbxbxbbl x −−−−−=
w punktach x = 40, 45, …., 85, a następnie ekstrapolacji na roczniki od 85 do 120.
Dopasowanie jest wykonywane uogólnioną metodą najmniejszych kwadratów (z zastosowaniem proce-dury optymalizacji nieliniowej Marquardta) przy założeniu, że macierz kowariancji liczb dożywa-jących ma elementy wyrażające się wzorem:
in points x = 40, 45, …., 85, and then extrapolated for ages 85-120
Fitting is done by use of the generalised least squares method (with application of Marquardt non-linear optimization method) with the assumption that the variance-convariance matrix of the number of survivors contains elements defined by the formula:
( )( )
( )Cov l l
llS l y x
llS l y x
x y
y
xx
x
yy
, =≥
<
2
2
gdzie ( )S lx2 jest oceną wariancji liczby dożywa-
jących obliczaną według wzorów:
in which ( )S lx2 is an estimate of the variance
of the number of survivors calculated by use of the following formulas:
( ) ( ) ( ) ( )S l q S l S q lx x x x x2
12 2 2 21+ = − +
( )S qq
Dqx
x
xx
2 21=
−
is an estimate of the variance of the num-
ber of survivors calculated by use of the following formulas:
9
( ) ( ) ( ) ( )R t B t P t D t0 0 0= − − ''
qx – prawdopodobieństwo zgonu obliczane jest według wzoru:
qx – the probability of death is calculated by use of the formula:
( )( ) 840/111 "' ≤≤−−−= xfordlaqqq xxx
gdzie / where
( )
( ) ( )q
D t
P t R tx
xt
x xt
'
'
=− −
+1 12 1
oraz / and ( )
( ) ( ) ( )q
D t
P t D t R tx
xt
x x xt
''
''
''=
+ +
12
W celu obliczenia prawdopodobieństw zgonu w wieku powyżej 84 lat wykonujemy dopasowanie funkcji wielomianowo-wykładniczej do liczby doży-wających (lx):
In order to calculate the probabilities of death for persons aged 84 and over the polynomial-exponential function is fitted to the number of survivors (lx):
( )55
2210exp100000 xbxbxbbl x −−−−−=
w punktach x = 40, 45, …., 85, a następnie ekstrapolacji na roczniki od 85 do 120.
Dopasowanie jest wykonywane uogólnioną metodą najmniejszych kwadratów (z zastosowaniem proce-dury optymalizacji nieliniowej Marquardta) przy założeniu, że macierz kowariancji liczb dożywa-jących ma elementy wyrażające się wzorem:
in points x = 40, 45, …., 85, and then extrapolated for ages 85-120
Fitting is done by use of the generalised least squares method (with application of Marquardt non-linear optimization method) with the assumption that the variance-convariance matrix of the number of survivors contains elements defined by the formula:
( )( )
( )Cov l l
llS l y x
llS l y x
x y
y
xx
x
yy
, =≥
<
2
2
gdzie ( )S lx2 jest oceną wariancji liczby dożywa-
jących obliczaną według wzorów:
in which ( )S lx2 is an estimate of the variance
of the number of survivors calculated by use of the following formulas:
( ) ( ) ( ) ( )S l q S l S q lx x x x x2
12 2 2 21+ = − +
( )S qq
Dqx
x
xx
2 21=
−
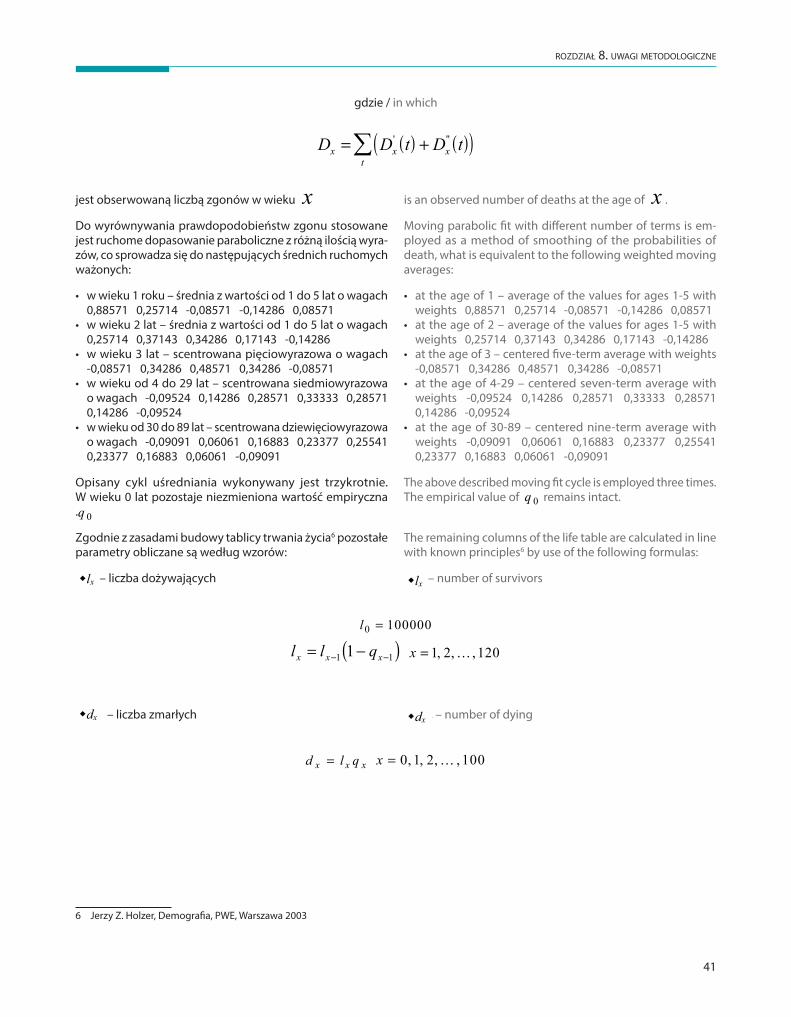
41
rozdział 8. uwagi metodologiczne
gdzie / in which
10
.
gdzie / in which
( ) ( )( )D D t D tx x xt
= + ' ''
jest obserwowaną liczbą zgonów w wieku x .
Do wyrównywania prawdopodobieństw zgonu sto-sowane jest ruchome dopasowanie paraboliczne z różną ilością wyrazów, co sprowadza się do nastę-pujących średnich ruchomych ważonych:
• w wieku 1 roku – średnia z wartości od 1 do 5 lat o wagach 0,88571 0,25714 -0,08571 -0,14286 0,08571
• w wieku 2 lat – średnia z wartości od 1 do 5 lat o wagach 0,25714 0,37143 0,34286 0,17143 -0,14286
• w wieku 3 lat – scentrowana pięciowyrazowa o wagach -0,08571 0,34286 0,48571 0,34286 -0,08571
• w wieku od 4 do 29 lat – scentrowana siedmiowyrazowa o wagach -0,09524 0,14286 0,28571 0,33333 0,28571 0,14286 -0,09524
• w wieku od 30 do 89 lat – scentrowana dziewięciowyrazowa o wagach -0,09091 0,06061 0,16883 0,23377 0,25541 0,23377 0,16883 0,06061 -0,09091
Opisany cykl uśredniania wykonywany jest trzykrot-nie. W wieku 0 lat pozostaje niezmieniona wartość empiryczna q 0 .
is an observed number of deaths at the age of x .
Moving parabolic fit with different number of terms is employed as a method of smoothing of the proba-bilities of death, what is equivalent to the following weighted moving averages:
• at the age of 1 – average of the values for ages 1-5 with weights 0,88571 0,25714 -0,08571 -0,14286 0,08571
• at the age of 2 – average of the values for ages 1-5 with weights 0,25714 0,37143 0,34286 0,17143 -0,14286
• at the age of 3 – centered five-term average with weights -0,08571 0,34286 0,48571 0,34286 -0,08571
• at the age of 4-29 – centered seven-term average with weights -0,09524 0,14286 0,28571 0,33333 0,28571 0,14286 -0,09524
• at the age of 30-89 – centered nine-term average with weights -0,09091 0,06061 0,16883 0,23377 0,25541 0,23377 0,16883 0,06061 -0,09091
The above described moving fit cycle is employed three times. The empirical value of q 0 remains intact.
Zgodnie z zasadami budowy tablicy trwania życia1 pozostałe parametry obliczane są według wzorów:
The remaining columns of the life table are calcula-ted in line with known principles1 by use of the following formulas:
lx – liczba dożywających lx – number of survivors
l0 100000=
( )l l qx x x= −− −1 11 x = 1 2 120, , ,
dx – liczba zmarłych dx – number of dying
d l qx x x= x = 0 1 2 100, , , ,
1 Jerzy Z. Holzer, Demografia, PWE, Warszawa 2003
jest obserwowaną liczbą zgonów w wieku
10
.
gdzie / in which
( ) ( )( )D D t D tx x xt
= + ' ''
jest obserwowaną liczbą zgonów w wieku x .
Do wyrównywania prawdopodobieństw zgonu sto-sowane jest ruchome dopasowanie paraboliczne z różną ilością wyrazów, co sprowadza się do nastę-pujących średnich ruchomych ważonych:
• w wieku 1 roku – średnia z wartości od 1 do 5 lat o wagach 0,88571 0,25714 -0,08571 -0,14286 0,08571
• w wieku 2 lat – średnia z wartości od 1 do 5 lat o wagach 0,25714 0,37143 0,34286 0,17143 -0,14286
• w wieku 3 lat – scentrowana pięciowyrazowa o wagach -0,08571 0,34286 0,48571 0,34286 -0,08571
• w wieku od 4 do 29 lat – scentrowana siedmiowyrazowa o wagach -0,09524 0,14286 0,28571 0,33333 0,28571 0,14286 -0,09524
• w wieku od 30 do 89 lat – scentrowana dziewięciowyrazowa o wagach -0,09091 0,06061 0,16883 0,23377 0,25541 0,23377 0,16883 0,06061 -0,09091
Opisany cykl uśredniania wykonywany jest trzykrot-nie. W wieku 0 lat pozostaje niezmieniona wartość empiryczna q 0 .
is an observed number of deaths at the age of x .
Moving parabolic fit with different number of terms is employed as a method of smoothing of the proba-bilities of death, what is equivalent to the following weighted moving averages:
• at the age of 1 – average of the values for ages 1-5 with weights 0,88571 0,25714 -0,08571 -0,14286 0,08571
• at the age of 2 – average of the values for ages 1-5 with weights 0,25714 0,37143 0,34286 0,17143 -0,14286
• at the age of 3 – centered five-term average with weights -0,08571 0,34286 0,48571 0,34286 -0,08571
• at the age of 4-29 – centered seven-term average with weights -0,09524 0,14286 0,28571 0,33333 0,28571 0,14286 -0,09524
• at the age of 30-89 – centered nine-term average with weights -0,09091 0,06061 0,16883 0,23377 0,25541 0,23377 0,16883 0,06061 -0,09091
The above described moving fit cycle is employed three times. The empirical value of q 0 remains intact.
Zgodnie z zasadami budowy tablicy trwania życia1 pozostałe parametry obliczane są według wzorów:
The remaining columns of the life table are calcula-ted in line with known principles1 by use of the following formulas:
lx – liczba dożywających lx – number of survivors
l0 100000=
( )l l qx x x= −− −1 11 x = 1 2 120, , ,
dx – liczba zmarłych dx – number of dying
d l qx x x= x = 0 1 2 100, , , ,
1 Jerzy Z. Holzer, Demografia, PWE, Warszawa 2003
Do wyrównywania prawdopodobieństw zgonu stosowane jest ruchome dopasowanie paraboliczne z różną ilością wyra-zów, co sprowadza się do następujących średnich ruchomych ważonych:
• w wieku 1 roku – średnia z wartości od 1 do 5 lat o wagach 0,88571 0,25714 -0,08571 -0,14286 0,08571
• w wieku 2 lat – średnia z wartości od 1 do 5 lat o wagach 0,25714 0,37143 0,34286 0,17143 -0,14286
• w wieku 3 lat – scentrowana pięciowyrazowa o wagach -0,08571 0,34286 0,48571 0,34286 -0,08571
• w wieku od 4 do 29 lat – scentrowana siedmiowyrazowa o wagach -0,09524 0,14286 0,28571 0,33333 0,28571 0,14286 -0,09524
• w wieku od 30 do 89 lat – scentrowana dziewięciowyrazowa o wagach -0,09091 0,06061 0,16883 0,23377 0,25541 0,23377 0,16883 0,06061 -0,09091
Opisany cykl uśredniania wykonywany jest trzykrotnie. W wieku 0 lat pozostaje niezmieniona wartość empiryczna .
Zgodnie z zasadami budowy tablicy trwania życia6 pozostałe parametry obliczane są według wzorów:
10
.
gdzie / in which
( ) ( )( )D D t D tx x xt
= + ' ''
jest obserwowaną liczbą zgonów w wieku x .
Do wyrównywania prawdopodobieństw zgonu sto-sowane jest ruchome dopasowanie paraboliczne z różną ilością wyrazów, co sprowadza się do nastę-pujących średnich ruchomych ważonych:
• w wieku 1 roku – średnia z wartości od 1 do 5 lat o wagach 0,88571 0,25714 -0,08571 -0,14286 0,08571
• w wieku 2 lat – średnia z wartości od 1 do 5 lat o wagach 0,25714 0,37143 0,34286 0,17143 -0,14286
• w wieku 3 lat – scentrowana pięciowyrazowa o wagach -0,08571 0,34286 0,48571 0,34286 -0,08571
• w wieku od 4 do 29 lat – scentrowana siedmiowyrazowa o wagach -0,09524 0,14286 0,28571 0,33333 0,28571 0,14286 -0,09524
• w wieku od 30 do 89 lat – scentrowana dziewięciowyrazowa o wagach -0,09091 0,06061 0,16883 0,23377 0,25541 0,23377 0,16883 0,06061 -0,09091
Opisany cykl uśredniania wykonywany jest trzykrot-nie. W wieku 0 lat pozostaje niezmieniona wartość empiryczna q 0 .
is an observed number of deaths at the age of x .
Moving parabolic fit with different number of terms is employed as a method of smoothing of the proba-bilities of death, what is equivalent to the following weighted moving averages:
• at the age of 1 – average of the values for ages 1-5 with weights 0,88571 0,25714 -0,08571 -0,14286 0,08571
• at the age of 2 – average of the values for ages 1-5 with weights 0,25714 0,37143 0,34286 0,17143 -0,14286
• at the age of 3 – centered five-term average with weights -0,08571 0,34286 0,48571 0,34286 -0,08571
• at the age of 4-29 – centered seven-term average with weights -0,09524 0,14286 0,28571 0,33333 0,28571 0,14286 -0,09524
• at the age of 30-89 – centered nine-term average with weights -0,09091 0,06061 0,16883 0,23377 0,25541 0,23377 0,16883 0,06061 -0,09091
The above described moving fit cycle is employed three times. The empirical value of q 0 remains intact.
Zgodnie z zasadami budowy tablicy trwania życia1 pozostałe parametry obliczane są według wzorów:
The remaining columns of the life table are calcula-ted in line with known principles1 by use of the following formulas:
lx – liczba dożywających lx – number of survivors
l0 100000=
( )l l qx x x= −− −1 11 x = 1 2 120, , ,
dx – liczba zmarłych dx – number of dying
d l qx x x= x = 0 1 2 100, , , ,
1 Jerzy Z. Holzer, Demografia, PWE, Warszawa 2003
– liczba dożywających
10
.
gdzie / in which
( ) ( )( )D D t D tx x xt
= + ' ''
jest obserwowaną liczbą zgonów w wieku x .
Do wyrównywania prawdopodobieństw zgonu sto-sowane jest ruchome dopasowanie paraboliczne z różną ilością wyrazów, co sprowadza się do nastę-pujących średnich ruchomych ważonych:
• w wieku 1 roku – średnia z wartości od 1 do 5 lat o wagach 0,88571 0,25714 -0,08571 -0,14286 0,08571
• w wieku 2 lat – średnia z wartości od 1 do 5 lat o wagach 0,25714 0,37143 0,34286 0,17143 -0,14286
• w wieku 3 lat – scentrowana pięciowyrazowa o wagach -0,08571 0,34286 0,48571 0,34286 -0,08571
• w wieku od 4 do 29 lat – scentrowana siedmiowyrazowa o wagach -0,09524 0,14286 0,28571 0,33333 0,28571 0,14286 -0,09524
• w wieku od 30 do 89 lat – scentrowana dziewięciowyrazowa o wagach -0,09091 0,06061 0,16883 0,23377 0,25541 0,23377 0,16883 0,06061 -0,09091
Opisany cykl uśredniania wykonywany jest trzykrot-nie. W wieku 0 lat pozostaje niezmieniona wartość empiryczna q 0 .
is an observed number of deaths at the age of x .
Moving parabolic fit with different number of terms is employed as a method of smoothing of the proba-bilities of death, what is equivalent to the followingweighted moving averages:
• at the age of 1 – average of the values for ages 1-5 with weights 0,88571 0,25714 -0,08571 -0,14286 0,08571
• at the age of 2 – average of the values for ages 1-5 with weights 0,25714 0,37143 0,34286 0,17143 -0,14286
• at the age of 3 – centered five-term average with weights -0,08571 0,34286 0,48571 0,34286 -0,08571
• at the age of 4-29 – centered seven-term average with weights -0,09524 0,14286 0,28571 0,33333 0,28571 0,14286 -0,09524
• at the age of 30-89 – centered nine-term average with weights -0,09091 0,06061 0,16883 0,23377 0,25541 0,23377 0,16883 0,06061 -0,09091
The above described moving fit cycle is employed three times. The empirical value of q 0 remainsintact.
Zgodnie z zasadami budowy tablicy trwania życia1
pozostałe parametry obliczane są według wzorów: The remaining columns of the life table are calcula-ted in line with known principles1 by use of the following formulas:
lx – liczba dożywających lx – number of survivors
l0 100000=
( )l l qx x x= −− −1 11 x = 1 2 120, , ,
dx – liczba zmarłych dx – number of dying
d l qx x x= x = 0 1 2 100, , , ,
1 Jerzy Z. Holzer, Demografia, PWE, Warszawa 2003
– liczba zmarłych
6 Jerzy Z. Holzer, Demografia, PWE, Warszawa 2003
is an observed number of deaths at the age of
10
.
gdzie / in which
( ) ( )( )D D t D tx x xt
= + ' ''
jest obserwowaną liczbą zgonów w wieku x .
Do wyrównywania prawdopodobieństw zgonu sto-sowane jest ruchome dopasowanie paraboliczne z różną ilością wyrazów, co sprowadza się do nastę-pujących średnich ruchomych ważonych:
• w wieku 1 roku – średnia z wartości od 1 do 5 lat o wagach 0,88571 0,25714 -0,08571 -0,14286 0,08571
• w wieku 2 lat – średnia z wartości od 1 do 5 lat o wagach 0,25714 0,37143 0,34286 0,17143 -0,14286
• w wieku 3 lat – scentrowana pięciowyrazowa o wagach -0,08571 0,34286 0,48571 0,34286 -0,08571
• w wieku od 4 do 29 lat – scentrowana siedmiowyrazowa o wagach -0,09524 0,14286 0,28571 0,33333 0,28571 0,14286 -0,09524
• w wieku od 30 do 89 lat – scentrowana dziewięciowyrazowa o wagach -0,09091 0,06061 0,16883 0,23377 0,25541 0,23377 0,16883 0,06061 -0,09091
Opisany cykl uśredniania wykonywany jest trzykrot-nie. W wieku 0 lat pozostaje niezmieniona wartość empiryczna q 0 .
is an observed number of deaths at the age of x .
Moving parabolic fit with different number of terms is employed as a method of smoothing of the proba-bilities of death, what is equivalent to the following weighted moving averages:
• at the age of 1 – average of the values for ages 1-5 with weights 0,88571 0,25714 -0,08571 -0,14286 0,08571
• at the age of 2 – average of the values for ages 1-5 with weights 0,25714 0,37143 0,34286 0,17143 -0,14286
• at the age of 3 – centered five-term average with weights -0,08571 0,34286 0,48571 0,34286 -0,08571
• at the age of 4-29 – centered seven-term average with weights -0,09524 0,14286 0,28571 0,33333 0,28571 0,14286 -0,09524
• at the age of 30-89 – centered nine-term average with weights -0,09091 0,06061 0,16883 0,23377 0,25541 0,23377 0,16883 0,06061 -0,09091
The above described moving fit cycle is employed three times. The empirical value of q 0 remains intact.
Zgodnie z zasadami budowy tablicy trwania życia1 pozostałe parametry obliczane są według wzorów:
The remaining columns of the life table are calcula-ted in line with known principles1 by use of the following formulas:
lx – liczba dożywających lx – number of survivors
l0 100000=
( )l l qx x x= −− −1 11 x = 1 2 120, , ,
dx – liczba zmarłych dx – number of dying
d l qx x x= x = 0 1 2 100, , , ,
1 Jerzy Z. Holzer, Demografia, PWE, Warszawa 2003
.
Moving parabolic fit with different number of terms is em-ployed as a method of smoothing of the probabilities of death, what is equivalent to the following weighted moving averages:
• at the age of 1 – average of the values for ages 1-5 with weights 0,88571 0,25714 -0,08571 -0,14286 0,08571
• at the age of 2 – average of the values for ages 1-5 with weights 0,25714 0,37143 0,34286 0,17143 -0,14286
• at the age of 3 – centered five-term average with weights -0,08571 0,34286 0,48571 0,34286 -0,08571
• at the age of 4-29 – centered seven-term average with weights -0,09524 0,14286 0,28571 0,33333 0,28571 0,14286 -0,09524
• at the age of 30-89 – centered nine-term average with weights -0,09091 0,06061 0,16883 0,23377 0,25541 0,23377 0,16883 0,06061 -0,09091
The above described moving fit cycle is employed three times. The empirical value of
10
.
gdzie / in which
( ) ( )( )D D t D tx x xt
= + ' ''
jest obserwowaną liczbą zgonów w wieku x .
Do wyrównywania prawdopodobieństw zgonu sto-sowane jest ruchome dopasowanie paraboliczne z różną ilością wyrazów, co sprowadza się do nastę-pujących średnich ruchomych ważonych:
• w wieku 1 roku – średnia z wartości od 1 do 5 lat o wagach 0,88571 0,25714 -0,08571 -0,14286 0,08571
• w wieku 2 lat – średnia z wartości od 1 do 5 lat o wagach 0,25714 0,37143 0,34286 0,17143 -0,14286
• w wieku 3 lat – scentrowana pięciowyrazowa o wagach -0,08571 0,34286 0,48571 0,34286 -0,08571
• w wieku od 4 do 29 lat – scentrowana siedmiowyrazowa o wagach -0,09524 0,14286 0,28571 0,33333 0,28571 0,14286 -0,09524
• w wieku od 30 do 89 lat – scentrowana dziewięciowyrazowa o wagach -0,09091 0,06061 0,16883 0,23377 0,25541 0,23377 0,16883 0,06061 -0,09091
Opisany cykl uśredniania wykonywany jest trzykrot-nie. W wieku 0 lat pozostaje niezmieniona wartość empiryczna q 0 .
is an observed number of deaths at the age of x .
Moving parabolic fit with different number of terms is employed as a method of smoothing of the proba-bilities of death, what is equivalent to the following weighted moving averages:
• at the age of 1 – average of the values for ages 1-5 with weights 0,88571 0,25714 -0,08571 -0,14286 0,08571
• at the age of 2 – average of the values for ages 1-5 with weights 0,25714 0,37143 0,34286 0,17143 -0,14286
• at the age of 3 – centered five-term average with weights -0,08571 0,34286 0,48571 0,34286 -0,08571
• at the age of 4-29 – centered seven-term average with weights -0,09524 0,14286 0,28571 0,33333 0,28571 0,14286 -0,09524
• at the age of 30-89 – centered nine-term average with weights -0,09091 0,06061 0,16883 0,23377 0,25541 0,23377 0,16883 0,06061 -0,09091
The above described moving fit cycle is employed three times. The empirical value of q 0 remains intact.
Zgodnie z zasadami budowy tablicy trwania życia1 pozostałe parametry obliczane są według wzorów:
The remaining columns of the life table are calcula-ted in line with known principles1 by use of the following formulas:
lx – liczba dożywających lx – number of survivors
l0 100000=
( )l l qx x x= −− −1 11 x = 1 2 120, , ,
dx – liczba zmarłych dx – number of dying
d l qx x x= x = 0 1 2 100, , , ,
1 Jerzy Z. Holzer, Demografia, PWE, Warszawa 2003
remains intact.
The remaining columns of the life table are calculated in line with known principles6 by use of the following formulas:
10
.
gdzie / in which
( ) ( )( )D D t D tx x xt
= + ' ''
jest obserwowaną liczbą zgonów w wieku x .
Do wyrównywania prawdopodobieństw zgonu sto-sowane jest ruchome dopasowanie paraboliczne z różną ilością wyrazów, co sprowadza się do nastę-pujących średnich ruchomych ważonych:
• w wieku 1 roku – średnia z wartości od 1 do 5 lat o wagach 0,88571 0,25714 -0,08571 -0,14286 0,08571
• w wieku 2 lat – średnia z wartości od 1 do 5 lat o wagach 0,25714 0,37143 0,34286 0,17143 -0,14286
• w wieku 3 lat – scentrowana pięciowyrazowa o wagach -0,08571 0,34286 0,48571 0,34286 -0,08571
• w wieku od 4 do 29 lat – scentrowana siedmiowyrazowa o wagach -0,09524 0,14286 0,28571 0,33333 0,28571 0,14286 -0,09524
• w wieku od 30 do 89 lat – scentrowana dziewięciowyrazowa o wagach -0,09091 0,06061 0,16883 0,23377 0,25541 0,23377 0,16883 0,06061 -0,09091
Opisany cykl uśredniania wykonywany jest trzykrot-nie. W wieku 0 lat pozostaje niezmieniona wartość empiryczna q 0 .
is an observed number of deaths at the age of x .
Moving parabolic fit with different number of terms is employed as a method of smoothing of the proba-bilities of death, what is equivalent to the following weighted moving averages:
• at the age of 1 – average of the values for ages 1-5 with weights 0,88571 0,25714 -0,08571 -0,14286 0,08571
• at the age of 2 – average of the values for ages 1-5 with weights 0,25714 0,37143 0,34286 0,17143 -0,14286
• at the age of 3 – centered five-term average with weights -0,08571 0,34286 0,48571 0,34286 -0,08571
• at the age of 4-29 – centered seven-term average with weights -0,09524 0,14286 0,28571 0,33333 0,28571 0,14286 -0,09524
• at the age of 30-89 – centered nine-term average with weights -0,09091 0,06061 0,16883 0,23377 0,25541 0,23377 0,16883 0,06061 -0,09091
The above described moving fit cycle is employed three times. The empirical value of q 0 remains intact.
Zgodnie z zasadami budowy tablicy trwania życia1 pozostałe parametry obliczane są według wzorów:
The remaining columns of the life table are calcula-ted in line with known principles1 by use of the following formulas:
lx – liczba dożywających lx – number of survivors
l0 100000=
( )l l qx x x= −− −1 11 x = 1 2 120, , ,
dx – liczba zmarłych dx – number of dying
d l qx x x= x = 0 1 2 100, , , ,
1 Jerzy Z. Holzer, Demografia, PWE, Warszawa 2003
– number of survivors
10
.
gdzie / in which
( ) ( )( )D D t D tx x xt
= + ' ''
jest obserwowaną liczbą zgonów w wieku x .
Do wyrównywania prawdopodobieństw zgonu sto-sowane jest ruchome dopasowanie paraboliczne z różną ilością wyrazów, co sprowadza się do nastę-pujących średnich ruchomych ważonych:
• w wieku 1 roku – średnia z wartości od 1 do 5 lat o wagach 0,88571 0,25714 -0,08571 -0,14286 0,08571
• w wieku 2 lat – średnia z wartości od 1 do 5 lat o wagach 0,25714 0,37143 0,34286 0,17143 -0,14286
• w wieku 3 lat – scentrowana pięciowyrazowa o wagach -0,08571 0,34286 0,48571 0,34286 -0,08571
• w wieku od 4 do 29 lat – scentrowana siedmiowyrazowa o wagach -0,09524 0,14286 0,28571 0,33333 0,28571 0,14286 -0,09524
• w wieku od 30 do 89 lat – scentrowana dziewięciowyrazowa o wagach -0,09091 0,06061 0,16883 0,23377 0,25541 0,23377 0,16883 0,06061 -0,09091
Opisany cykl uśredniania wykonywany jest trzykrot-nie. W wieku 0 lat pozostaje niezmieniona wartość empiryczna q 0 .
is an observed number of deaths at the age of x .
Moving parabolic fit with different number of terms is employed as a method of smoothing of the proba-bilities of death, what is equivalent to the followingweighted moving averages:
• at the age of 1 – average of the values for ages 1-5 with weights 0,88571 0,25714 -0,08571 -0,14286 0,08571
• at the age of 2 – average of the values for ages 1-5 with weights 0,25714 0,37143 0,34286 0,17143 -0,14286
• at the age of 3 – centered five-term average with weights -0,08571 0,34286 0,48571 0,34286 -0,08571
• at the age of 4-29 – centered seven-term average with weights -0,09524 0,14286 0,28571 0,33333 0,28571 0,14286 -0,09524
• at the age of 30-89 – centered nine-term average with weights -0,09091 0,06061 0,16883 0,23377 0,25541 0,23377 0,16883 0,06061 -0,09091
The above described moving fit cycle is employed three times. The empirical value of q 0 remainsintact.
Zgodnie z zasadami budowy tablicy trwania życia1
pozostałe parametry obliczane są według wzorów: The remaining columns of the life table are calcula-ted in line with known principles1 by use of the following formulas:
lx – liczba dożywających lx – number of survivors
l0 100000=
( )l l qx x x= −− −1 11 x = 1 2 120, , ,
dx – liczba zmarłych dx – number of dying
d l qx x x= x = 0 1 2 100, , , ,
1 Jerzy Z. Holzer, Demografia, PWE, Warszawa 2003
– number of dying
10
.
gdzie / in which
( ) ( )( )D D t D tx x xt
= + ' ''
jest obserwowaną liczbą zgonów w wieku x .
Do wyrównywania prawdopodobieństw zgonu sto-sowane jest ruchome dopasowanie paraboliczne z różną ilością wyrazów, co sprowadza się do nastę-pujących średnich ruchomych ważonych:
• w wieku 1 roku – średnia z wartości od 1 do 5 lat o wagach 0,88571 0,25714 -0,08571 -0,14286 0,08571
• w wieku 2 lat – średnia z wartości od 1 do 5 lat o wagach 0,25714 0,37143 0,34286 0,17143 -0,14286
• w wieku 3 lat – scentrowana pięciowyrazowa o wagach -0,08571 0,34286 0,48571 0,34286 -0,08571
• w wieku od 4 do 29 lat – scentrowana siedmiowyrazowa o wagach -0,09524 0,14286 0,28571 0,33333 0,28571 0,14286 -0,09524
• w wieku od 30 do 89 lat – scentrowana dziewięciowyrazowa o wagach -0,09091 0,06061 0,16883 0,23377 0,25541 0,23377 0,16883 0,06061 -0,09091
Opisany cykl uśredniania wykonywany jest trzykrot-nie. W wieku 0 lat pozostaje niezmieniona wartość empiryczna q 0 .
is an observed number of deaths at the age of x .
Moving parabolic fit with different number of terms is employed as a method of smoothing of the proba-bilities of death, what is equivalent to the following weighted moving averages:
• at the age of 1 – average of the values for ages 1-5 with weights 0,88571 0,25714 -0,08571 -0,14286 0,08571
• at the age of 2 – average of the values for ages 1-5 with weights 0,25714 0,37143 0,34286 0,17143 -0,14286
• at the age of 3 – centered five-term average with weights -0,08571 0,34286 0,48571 0,34286 -0,08571
• at the age of 4-29 – centered seven-term average with weights -0,09524 0,14286 0,28571 0,33333 0,28571 0,14286 -0,09524
• at the age of 30-89 – centered nine-term average with weights -0,09091 0,06061 0,16883 0,23377 0,25541 0,23377 0,16883 0,06061 -0,09091
The above described moving fit cycle is employed three times. The empirical value of q 0 remains intact.
Zgodnie z zasadami budowy tablicy trwania życia1 pozostałe parametry obliczane są według wzorów:
The remaining columns of the life table are calcula-ted in line with known principles1 by use of the following formulas:
lx – liczba dożywających lx – number of survivors
l0 100000=
( )l l qx x x= −− −1 11 x = 1 2 120, , ,
dx – liczba zmarłych dx – number of dying
d l qx x x= x = 0 1 2 100, , , ,
1 Jerzy Z. Holzer, Demografia, PWE, Warszawa 2003

42
chapter 8. methodological notes
11
L0 – ludność stacjonarna L0 – stationary population
( )L l q0 0 01= − ''
Ll l
xx x=
+ +12 x = 1 2 119, , ,
T Lx yy x
=≥ x = 0 1 2 100, , , ,
ex – średnie dalsze trwanie życia ex – life expectancy
eTlx
x
x= x = 0 1 2 100, , , ,
Skrócona tablica trwania życia Abridged life table
Skrócona tablica trwania życia jest opracowywana na podstawie parametrów wykonanej uprzednio tablicy pełnej oraz danych o liczbach zgonów Dx . Liczba dożywających oraz średnie dalsze trwanie życia pochodzą bezpośrednio z tej tablicy, natomiast prawdopodobieństwa zgonu w ciągu n lat dla osób w wieku x są liczone według następującego wzoru:
An abridged life table is based on the complete life table described above and on the number of deathsDx . The number of the survivors and the life expec-tancy are derived directly from that complete table, whereas the probabilities of death during n years for persons aged x are calculated using the following formula:
n xx n
xq
ll
xn
= −==
+10 1 5 10 801 4 5 5 5, , , , ,, , , , ,
Tablica trwania życia dla obu płci łącznie Life tables for both sexes combined
Na ogół w zastosowaniach tablic trwania życia niezbędne jest opracowywanie i upowszechnianie parametrów odrębnie dla mężczyzn i kobiet. Tym niemniej, jeśli występuje taka potrzeba, konstruuje się tablice dla obu płci łącznie. W Polsce, począwszy od 1999 roku – w związku z rozwiąza-niami przyjętymi w systemie ubezpieczeń społecznych – corocznie naliczane są parametry trwania życia dla obu płci łącznie dla potrzeb
Generally, the life table parameters are prepared separately for males and females using the same method. Nevertheless, if special need exists, the combined parameters of life table are calculated. In Poland each year since 1999 combined life expectancy (with no distinction by gender) is calculated, accordingly to the requirements intro-duced in the social insurance system2.
– ludność stacjonarna
11
L0 – ludność stacjonarna L0 – stationary population
( )L l q0 0 01= − ''
Ll l
xx x=
+ +12 x = 1 2 119, , ,
T Lx yy x
=≥ x = 0 1 2 100, , , ,
ex – średnie dalsze trwanie życia ex – life expectancy
eTlx
x
x= x = 0 1 2 100, , , ,
Skrócona tablica trwania życia Abridged life table
Skrócona tablica trwania życia jest opracowywana na podstawie parametrów wykonanej uprzednio tablicy pełnej oraz danych o liczbach zgonów Dx . Liczba dożywających oraz średnie dalsze trwanie życia pochodzą bezpośrednio z tej tablicy, natomiast prawdopodobieństwa zgonu w ciągu n lat dla osób w wieku x są liczone według następującego wzoru:
An abridged life table is based on the complete life table described above and on the number of deathsDx . The number of the survivors and the life expec-tancy are derived directly from that complete table, whereas the probabilities of death during n years for persons aged x are calculated using the following formula:
n xx n
xq
ll
xn
= −==
+10 1 5 10 801 4 5 5 5, , , , ,, , , , ,
Tablica trwania życia dla obu płci łącznie Life tables for both sexes combined
Na ogół w zastosowaniach tablic trwania życia niezbędne jest opracowywanie i upowszechnianie parametrów odrębnie dla mężczyzn i kobiet. Tym niemniej, jeśli występuje taka potrzeba, konstruuje się tablice dla obu płci łącznie. W Polsce, począwszy od 1999 roku – w związku z rozwiąza-niami przyjętymi w systemie ubezpieczeń społecznych – corocznie naliczane są parametry trwania życia dla obu płci łącznie dla potrzeb
Generally, the life table parameters are prepared separately for males and females using the same method. Nevertheless, if special need exists, the combined parameters of life table are calculated. In Poland each year since 1999 combined life expectancy (with no distinction by gender) is calculated, accordingly to the requirements intro-duced in the social insurance system2.
– średnie dalsze trwanie życia
Skrócona tablica trwania życia
Skrócona tablica trwania życia jest opracowywana na pod-stawie parametrów wykonanej uprzednio tablicy pełnej oraz danych o liczbach zgonów
11
L0 – ludność stacjonarna L0 – stationary population
( )L l q0 0 01= − ''
Ll l
xx x=
+ +12 x = 1 2 119, , ,
T Lx yy x
=≥ x = 0 1 2 100, , , ,
ex – średnie dalsze trwanie życia ex – life expectancy
eTlx
x
x= x = 0 1 2 100, , , ,
Skrócona tablica trwania życia Abridged life table
Skrócona tablica trwania życia jest opracowywana na podstawie parametrów wykonanej uprzednio tablicy pełnej oraz danych o liczbach zgonów Dx . Liczba dożywających oraz średnie dalsze trwanie życia pochodzą bezpośrednio z tej tablicy, natomiast prawdopodobieństwa zgonu w ciągu n lat dla osób w wieku x są liczone według następującego wzoru:
An abridged life table is based on the complete life table described above and on the number of deathsDx . The number of the survivors and the life expec-tancy are derived directly from that complete table, whereas the probabilities of death during n years for persons aged x are calculated using the following formula:
n xx n
xq
ll
xn
= −==
+10 1 5 10 801 4 5 5 5, , , , ,, , , , ,
Tablica trwania życia dla obu płci łącznie Life tables for both sexes combined
Na ogół w zastosowaniach tablic trwania życia niezbędne jest opracowywanie i upowszechnianie parametrów odrębnie dla mężczyzn i kobiet. Tym niemniej, jeśli występuje taka potrzeba, konstruuje się tablice dla obu płci łącznie. W Polsce, począwszy od 1999 roku – w związku z rozwiąza-niami przyjętymi w systemie ubezpieczeń społecznych – corocznie naliczane są parametry trwania życia dla obu płci łącznie dla potrzeb
Generally, the life table parameters are prepared separately for males and females using the same method. Nevertheless, if special need exists, the combined parameters of life table are calculated. In Poland each year since 1999 combined life expectancy (with no distinction by gender) is calculated, accordingly to the requirements intro-duced in the social insurance system2.
. Liczba dożywających oraz średnie dalsze trwanie życia pochodzą bezpośrednio z tej tablicy, natomiast prawdopodobieństwa zgonu w ciągu
11
L0 – ludność stacjonarna L0 – stationary population
( )L l q0 0 01= − ''
Ll l
xx x=
+ +12 x = 1 2 119, , ,
T Lx yy x
=≥ x = 0 1 2 100, , , ,
ex – średnie dalsze trwanie życia ex – life expectancy
eTlx
x
x= x = 0 1 2 100, , , ,
Skrócona tablica trwania życia Abridged life table
Skrócona tablica trwania życia jest opracowywana na podstawie parametrów wykonanej uprzednio tablicy pełnej oraz danych o liczbach zgonów Dx . Liczba dożywających oraz średnie dalsze trwanie życia pochodzą bezpośrednio z tej tablicy, natomiast prawdopodobieństwa zgonu w ciągu n lat dla osób w wieku x są liczone według następującego wzoru:
An abridged life table is based on the complete life table described above and on the number of deathsDx . The number of the survivors and the life expec-tancy are derived directly from that complete table, whereas the probabilities of death during n years for persons aged x are calculated using the following formula:
n xx n
xq
ll
xn
= −==
+10 1 5 10 801 4 5 5 5, , , , ,, , , , ,
Tablica trwania życia dla obu płci łącznie Life tables for both sexes combined
Na ogół w zastosowaniach tablic trwania życia niezbędne jest opracowywanie i upowszechnianie parametrów odrębnie dla mężczyzn i kobiet. Tym niemniej, jeśli występuje taka potrzeba, konstruuje się tablice dla obu płci łącznie. W Polsce, począwszy od 1999 roku – w związku z rozwiąza-niami przyjętymi w systemie ubezpieczeń społecznych – corocznie naliczane są parametry trwania życia dla obu płci łącznie dla potrzeb
Generally, the life table parameters are prepared separately for males and females using the same method. Nevertheless, if special need exists, the combined parameters of life table are calculated. In Poland each year since 1999 combined life expectancy (with no distinction by gender) is calculated, accordingly to the requirements intro-duced in the social insurance system2.
lat dla osób w wieku
10
.
gdzie / in which
( ) ( )( )D D t D tx x xt
= + ' ''
jest obserwowaną liczbą zgonów w wieku x .
Do wyrównywania prawdopodobieństw zgonu sto-sowane jest ruchome dopasowanie paraboliczne z różną ilością wyrazów, co sprowadza się do nastę-pujących średnich ruchomych ważonych:
• w wieku 1 roku – średnia z wartości od 1 do 5 lat o wagach 0,88571 0,25714 -0,08571 -0,14286 0,08571
• w wieku 2 lat – średnia z wartości od 1 do 5 lat o wagach 0,25714 0,37143 0,34286 0,17143 -0,14286
• w wieku 3 lat – scentrowana pięciowyrazowa o wagach -0,08571 0,34286 0,48571 0,34286 -0,08571
• w wieku od 4 do 29 lat – scentrowana siedmiowyrazowa o wagach -0,09524 0,14286 0,28571 0,33333 0,28571 0,14286 -0,09524
• w wieku od 30 do 89 lat – scentrowana dziewięciowyrazowa o wagach -0,09091 0,06061 0,16883 0,23377 0,25541 0,23377 0,16883 0,06061 -0,09091
Opisany cykl uśredniania wykonywany jest trzykrot-nie. W wieku 0 lat pozostaje niezmieniona wartość empiryczna q 0 .
is an observed number of deaths at the age of x .
Moving parabolic fit with different number of terms is employed as a method of smoothing of the proba-bilities of death, what is equivalent to the following weighted moving averages:
• at the age of 1 – average of the values for ages 1-5 with weights 0,88571 0,25714 -0,08571 -0,14286 0,08571
• at the age of 2 – average of the values for ages 1-5 with weights 0,25714 0,37143 0,34286 0,17143 -0,14286
• at the age of 3 – centered five-term average with weights -0,08571 0,34286 0,48571 0,34286 -0,08571
• at the age of 4-29 – centered seven-term average with weights -0,09524 0,14286 0,28571 0,33333 0,28571 0,14286 -0,09524
• at the age of 30-89 – centered nine-term average with weights -0,09091 0,06061 0,16883 0,23377 0,25541 0,23377 0,16883 0,06061 -0,09091
The above described moving fit cycle is employed three times. The empirical value of q 0 remains intact.
Zgodnie z zasadami budowy tablicy trwania życia1 pozostałe parametry obliczane są według wzorów:
The remaining columns of the life table are calcula-ted in line with known principles1 by use of the following formulas:
lx – liczba dożywających lx – number of survivors
l0 100000=
( )l l qx x x= −− −1 11 x = 1 2 120, , ,
dx – liczba zmarłych dx – number of dying
d l qx x x= x = 0 1 2 100, , , ,
1 Jerzy Z. Holzer, Demografia, PWE, Warszawa 2003
są liczone według następującego wzoru:
11
L0 – ludność stacjonarna L0 – stationary population
( )L l q0 0 01= − ''
Ll l
xx x=
+ +12 x = 1 2 119, , ,
T Lx yy x
=≥ x = 0 1 2 100, , , ,
ex – średnie dalsze trwanie życia ex – life expectancy
eTlx
x
x= x = 0 1 2 100, , , ,
Skrócona tablica trwania życia Abridged life table
Skrócona tablica trwania życia jest opracowywana na podstawie parametrów wykonanej uprzednio tablicy pełnej oraz danych o liczbach zgonów Dx . Liczba dożywających oraz średnie dalsze trwanie życia pochodzą bezpośrednio z tej tablicy, natomiast prawdopodobieństwa zgonu w ciągu n lat dla osób w wieku x są liczone według następującego wzoru:
An abridged life table is based on the complete life table described above and on the number of deathsDx . The number of the survivors and the life expec-tancy are derived directly from that complete table, whereas the probabilities of death during n years for persons aged x are calculated using the following formula:
n xx n
xq
ll
xn
= −==
+10 1 5 10 801 4 5 5 5, , , , ,, , , , ,
Tablica trwania życia dla obu płci łącznie Life tables for both sexes combined
Na ogół w zastosowaniach tablic trwania życia niezbędne jest opracowywanie i upowszechnianie parametrów odrębnie dla mężczyzn i kobiet. Tym niemniej, jeśli występuje taka potrzeba, konstruuje się tablice dla obu płci łącznie. W Polsce, począwszy od 1999 roku – w związku z rozwiąza-niami przyjętymi w systemie ubezpieczeń społecznych – corocznie naliczane są parametry trwania życia dla obu płci łącznie dla potrzeb
Generally, the life table parameters are prepared separately for males and females using the same method. Nevertheless, if special need exists, the combined parameters of life table are calculated. In Poland each year since 1999 combined life expectancy (with no distinction by gender) is calculated, accordingly to the requirements intro-duced in the social insurance system2.
– stationary population
11
L0 – ludność stacjonarna L0 – stationary population
( )L l q0 0 01= − ''
Ll l
xx x=
+ +12 x = 1 2 119, , ,
T Lx yy x
=≥ x = 0 1 2 100, , , ,
ex – średnie dalsze trwanie życia ex – life expectancy
eTlx
x
x= x = 0 1 2 100, , , ,
Skrócona tablica trwania życia Abridged life table
Skrócona tablica trwania życia jest opracowywana na podstawie parametrów wykonanej uprzednio tablicy pełnej oraz danych o liczbach zgonów Dx . Liczba dożywających oraz średnie dalsze trwanie życia pochodzą bezpośrednio z tej tablicy, natomiast prawdopodobieństwa zgonu w ciągu n lat dla osób w wieku x są liczone według następującego wzoru:
An abridged life table is based on the complete life table described above and on the number of deathsDx . The number of the survivors and the life expec-tancy are derived directly from that complete table, whereas the probabilities of death during n years for persons aged x are calculated using the following formula:
n xx n
xq
ll
xn
= −==
+10 1 5 10 801 4 5 5 5, , , , ,, , , , ,
Tablica trwania życia dla obu płci łącznie Life tables for both sexes combined
Na ogół w zastosowaniach tablic trwania życia niezbędne jest opracowywanie i upowszechnianie parametrów odrębnie dla mężczyzn i kobiet. Tym niemniej, jeśli występuje taka potrzeba, konstruuje się tablice dla obu płci łącznie. W Polsce, począwszy od 1999 roku – w związku z rozwiąza-niami przyjętymi w systemie ubezpieczeń społecznych – corocznie naliczane są parametry trwania życia dla obu płci łącznie dla potrzeb
Generally, the life table parameters are prepared separately for males and females using the same method. Nevertheless, if special need exists, the combined parameters of life table are calculated. In Poland each year since 1999 combined life expectancy (with no distinction by gender) is calculated, accordingly to the requirements intro-duced in the social insurance system2.
– life expectancy
Abridged life table
An abridged life table is based on the complete life table de-scribed above and on the number of deaths
11
L0 – ludność stacjonarna L0 – stationary population
( )L l q0 0 01= − ''
Ll l
xx x=
+ +12 x = 1 2 119, , ,
T Lx yy x
=≥ x = 0 1 2 100, , , ,
ex – średnie dalsze trwanie życia ex – life expectancy
eTlx
x
x= x = 0 1 2 100, , , ,
Skrócona tablica trwania życia Abridged life table
Skrócona tablica trwania życia jest opracowywana na podstawie parametrów wykonanej uprzednio tablicy pełnej oraz danych o liczbach zgonów Dx . Liczba dożywających oraz średnie dalsze trwanie życia pochodzą bezpośrednio z tej tablicy, natomiast prawdopodobieństwa zgonu w ciągu n lat dla osób w wieku x są liczone według następującego wzoru:
An abridged life table is based on the complete life table described above and on the number of deathsDx . The number of the survivors and the life expec-tancy are derived directly from that complete table, whereas the probabilities of death during n years for persons aged x are calculated using the following formula:
n xx n
xq
ll
xn
= −==
+10 1 5 10 801 4 5 5 5, , , , ,, , , , ,
Tablica trwania życia dla obu płci łącznie Life tables for both sexes combined
Na ogół w zastosowaniach tablic trwania życia niezbędne jest opracowywanie i upowszechnianie parametrów odrębnie dla mężczyzn i kobiet. Tym niemniej, jeśli występuje taka potrzeba, konstruuje się tablice dla obu płci łącznie. W Polsce, począwszy od 1999 roku – w związku z rozwiąza-niami przyjętymi w systemie ubezpieczeń społecznych – corocznie naliczane są parametry trwania życia dla obu płci łącznie dla potrzeb
Generally, the life table parameters are prepared separately for males and females using the same method. Nevertheless, if special need exists, the combined parameters of life table are calculated. In Poland each year since 1999 combined life expectancy (with no distinction by gender) is calculated, accordingly to the requirements intro-duced in the social insurance system2.
. The number of the survivors and the life expectancy are derived directly from that complete table, whereas the probabilities of death during
11
L0 – ludność stacjonarna L0 – stationary population
( )L l q0 0 01= − ''
Ll l
xx x=
+ +12 x = 1 2 119, , ,
T Lx yy x
=≥ x = 0 1 2 100, , , ,
ex – średnie dalsze trwanie życia ex – life expectancy
eTlx
x
x= x = 0 1 2 100, , , ,
Skrócona tablica trwania życia Abridged life table
Skrócona tablica trwania życia jest opracowywana na podstawie parametrów wykonanej uprzednio tablicy pełnej oraz danych o liczbach zgonów Dx . Liczba dożywających oraz średnie dalsze trwanie życia pochodzą bezpośrednio z tej tablicy, natomiast prawdopodobieństwa zgonu w ciągu n lat dla osób w wieku x są liczone według następującego wzoru:
An abridged life table is based on the complete life table described above and on the number of deathsDx . The number of the survivors and the life expec-tancy are derived directly from that complete table, whereas the probabilities of death during n years for persons aged x are calculated using the following formula:
n xx n
xq
ll
xn
= −==
+10 1 5 10 801 4 5 5 5, , , , ,, , , , ,
Tablica trwania życia dla obu płci łącznie Life tables for both sexes combined
Na ogół w zastosowaniach tablic trwania życia niezbędne jest opracowywanie i upowszechnianie parametrów odrębnie dla mężczyzn i kobiet. Tym niemniej, jeśli występuje taka potrzeba, konstruuje się tablice dla obu płci łącznie. W Polsce, począwszy od 1999 roku – w związku z rozwiąza-niami przyjętymi w systemie ubezpieczeń społecznych – corocznie naliczane są parametry trwania życia dla obu płci łącznie dla potrzeb
Generally, the life table parameters are prepared separately for males and females using the same method. Nevertheless, if special need exists, the combined parameters of life table are calculated. In Poland each year since 1999 combined life expectancy (with no distinction by gender) is calculated, accordingly to the requirements intro-duced in the social insurance system2.
years for persons aged
10
.
gdzie / in which
( ) ( )( )D D t D tx x xt
= + ' ''
jest obserwowaną liczbą zgonów w wieku x .
Do wyrównywania prawdopodobieństw zgonu sto-sowane jest ruchome dopasowanie paraboliczne z różną ilością wyrazów, co sprowadza się do nastę-pujących średnich ruchomych ważonych:
• w wieku 1 roku – średnia z wartości od 1 do 5 lat o wagach 0,88571 0,25714 -0,08571 -0,14286 0,08571
• w wieku 2 lat – średnia z wartości od 1 do 5 lat o wagach 0,25714 0,37143 0,34286 0,17143 -0,14286
• w wieku 3 lat – scentrowana pięciowyrazowa o wagach -0,08571 0,34286 0,48571 0,34286 -0,08571
• w wieku od 4 do 29 lat – scentrowana siedmiowyrazowa o wagach -0,09524 0,14286 0,28571 0,33333 0,28571 0,14286 -0,09524
• w wieku od 30 do 89 lat – scentrowana dziewięciowyrazowa o wagach -0,09091 0,06061 0,16883 0,23377 0,25541 0,23377 0,16883 0,06061 -0,09091
Opisany cykl uśredniania wykonywany jest trzykrot-nie. W wieku 0 lat pozostaje niezmieniona wartość empiryczna q 0 .
is an observed number of deaths at the age of x .
Moving parabolic fit with different number of terms is employed as a method of smoothing of the proba-bilities of death, what is equivalent to the following weighted moving averages:
• at the age of 1 – average of the values for ages 1-5 with weights 0,88571 0,25714 -0,08571 -0,14286 0,08571
• at the age of 2 – average of the values for ages 1-5 with weights 0,25714 0,37143 0,34286 0,17143 -0,14286
• at the age of 3 – centered five-term average with weights -0,08571 0,34286 0,48571 0,34286 -0,08571
• at the age of 4-29 – centered seven-term average with weights -0,09524 0,14286 0,28571 0,33333 0,28571 0,14286 -0,09524
• at the age of 30-89 – centered nine-term average with weights -0,09091 0,06061 0,16883 0,23377 0,25541 0,23377 0,16883 0,06061 -0,09091
The above described moving fit cycle is employed three times. The empirical value of q 0 remains intact.
Zgodnie z zasadami budowy tablicy trwania życia1 pozostałe parametry obliczane są według wzorów:
The remaining columns of the life table are calcula-ted in line with known principles1 by use of the following formulas:
lx – liczba dożywających lx – number of survivors
l0 100000=
( )l l qx x x= −− −1 11 x = 1 2 120, , ,
dx – liczba zmarłych dx – number of dying
d l qx x x= x = 0 1 2 100, , , ,
1 Jerzy Z. Holzer, Demografia, PWE, Warszawa 2003
are calculated using the following formula:
11
L0 – ludność stacjonarna L0 – stationary population
( )L l q0 0 01= − ''
Ll l
xx x=
+ +12 x = 1 2 119, , ,
T Lx yy x
=≥ x = 0 1 2 100, , , ,
ex – średnie dalsze trwanie życia ex – life expectancy
eTlx
x
x= x = 0 1 2 100, , , ,
Skrócona tablica trwania życia Abridged life table
Skrócona tablica trwania życia jest opracowywana na podstawie parametrów wykonanej uprzednio tablicy pełnej oraz danych o liczbach zgonów Dx . Liczba dożywających oraz średnie dalsze trwanie życia pochodzą bezpośrednio z tej tablicy, natomiast prawdopodobieństwa zgonu w ciągu n lat dla osób w wieku x są liczone według następującego wzoru:
An abridged life table is based on the complete life table described above and on the number of deathsDx . The number of the survivors and the life expec-tancy are derived directly from that complete table, whereas the probabilities of death during n years for persons aged x are calculated using the following formula:
n xx n
xq
ll
xn
= −==
+10 1 5 10 801 4 5 5 5, , , , ,, , , , ,
Tablica trwania życia dla obu płci łącznie Life tables for both sexes combined
Na ogół w zastosowaniach tablic trwania życia niezbędne jest opracowywanie i upowszechnianie parametrów odrębnie dla mężczyzn i kobiet. Tym niemniej, jeśli występuje taka potrzeba, konstruuje się tablice dla obu płci łącznie. W Polsce, począwszy od 1999 roku – w związku z rozwiąza-niami przyjętymi w systemie ubezpieczeń społecznych – corocznie naliczane są parametry trwania życia dla obu płci łącznie dla potrzeb
Generally, the life table parameters are prepared separately for males and females using the same method. Nevertheless, if special need exists, the combined parameters of life table are calculated. In Poland each year since 1999 combined life expectancy (with no distinction by gender) is calculated, accordingly to the requirements intro-duced in the social insurance system2.

43
rozdział 8. uwagi metodologiczne
Tablica trwania życia dla obu płci łącznie
Na ogół w zastosowaniach tablic trwania życia niezbędne jest opracowywanie i upowszechnianie parametrów od-rębnie dla mężczyzn i kobiet. Tym niemniej, jeśli występuje taka potrzeba, konstruuje się tablice dla obu płci łącznie. W Polsce, począwszy od 1999 roku – w związku z rozwią-zaniami przyjętymi w systemie ubezpieczeń społecznych – corocznie naliczane są parametry trwania życia dla obu płci łącznie dla potrzeb ustalenia kapitału początkowego oraz emerytur kapitałowych7.
Zamieszczona w Aneksie publikacji Tablica E jest obliczona metodą kombinacji liczb dożywających obu płci przy zało-żeniu proporcji płci przy urodzeniu: 0,4845 dla żeńskiej oraz 0,5155 dla męskiej.
Dane dotyczące średniego trwania życia dla obu płci łącznie, w przeliczeniu na miesiące życia, są publikowane corocznie w formie załącznika do komunikatu Prezesa GUS (por. Tablica F).
***
Tablice trwania życia są opracowane – począwszy od danych za 2012 r. – na podstawie bilansów stanu i struktury ludności wyprowadzonych na bazie wyników ostatniego spisu ludno-ści i mieszkań z 2011 roku.
Life tables for both sexes combined
Generally, the life table parameters are prepared separately for males and females using the same method. Nevertheless, if special need exists, the combined parameters of life table are calculated. In Poland each year since 1999 combined li-fe expectancy (with no distinction by gender) is calculated, accordingly to the requirements intro-duced in the social insurance system7.
Numbers of survivors for both sexes is calculated using sex proportion at birth i.e. 0,4845 for females and 0,5155 for males (Table E).
Life expectancy combined for both sexes presented in months of life according to exact age of survivors, is disseminated each year by the President of CSO (Table F).
***
Since the 2012 life expectancy tables are based – on the size and structure of population balances, derived from the results of 2011 population and housing census.
7 Art. 26 ust. 4 ustawy z dnia 17 grudnia 1998 r. o emeryturach i rentach z Funduszu Ubezpieczeń Społecznych (Dz. U. z 2015 r. poz. 748 i 1302; Dz. U. z 2018 r. poz. 1270) The 26th article of the national law of 17.XII.1998 on pensions and retirement pay from Social Insurance Fund (Journal of Laws of 2015, No 748 item, 1302; Journal of Laws of 2018, No 1270 item)

44
chapter 9. list of publications containing polish complete and abridged life tables
9. Wykaz publikacji GUS dotyczących trwania życia9. List of publication containing Polish complete and abridged life tables
Polskie tablice trwania życia Polish complete life expectancy tables
1. GUS [1938]; Polskie tablice wymieralności 1931/32, (Polish complete mortality 1931/1932), „Statystyka Polski”, seria C, 91/1938, Warszawa
2. GUS [1956]; Polskie tablice wymieralności 1952/1953, (Polish complete mortality 1952/1953), (oprac. R. Zasępa), „Przegląd Statystyczny”, 4/1956, Warszawa
3. GUS [1960]; Polskie tablice wymieralności 1955/1956, (Polish complete mortality 1955/1956), (oprac. J. Z. Holzer), „Statystyka Polski”, 32/1960, Warszawa
4. GUS [1964]; Polskie tablice wymieralności 1960/61, (Polish complete mortality 1960/1961), (oprac. J. Z. Holzer), „Statystyka Polski”, 91/1964, Warszawa
5. GUS [1968]; Polskie tablice wymieralności 1965/1966, (Polish complete mortality 1965/1966), (oprac. J. Aleksińska), „Studia i Prace Statystyczne”, 13/1968, Warszawa
6. GUS [1973]; Polskie tablice trwania życia 1970-72, (Polish complete life expectancy tables 1970-1972), (oprac. J. Aleksińska i Z. Gałązka), „Rocznik Demograficzny 1973”, Warszawa
7. GUS [1978]; Polskie tablice trwania życia 1975/1976, (Polish complete life expectancy tables 1975/1976), (oprac. J. Mijakowska), Statystyka Polski, 101/1978, Warszawa
8. GUS [1983]; Polskie tablice trwania życia 1980/1981, (Polish complete life expectancy tables 1980/1981), (oprac. L. Nowak), „Studia i Prace”, 4/1983, Warszawa
9. GUS [1987]; Polskie tablice trwania życia 1985/1986, (Polish complete life expectancy tables 1985/1986), (oprac. L. Nowak), „Studia i Prace”, 14/1987, Warszawa
10. GUS [1993]; Polskie tablice trwania życia 1990-1991, (Polish complete life expectancy tables 1990/1991), (oprac. J. Mijakowska), „Studia i Analizy Statystyczne”, Warszawa
11. GUS [1997]; Polskie tablice trwania życia 1995-1996, (Polish complete life expectancy tables 1995/1996), (oprac. L. Bolesławski), „Studia i Analizy Statystyczne”, Warszawa
Tablice trwania życia i umieralność według przyczynLife expectancy tables and mortality by causes
1. GUS [1975]; Trwanie życia i umieralność według przyczyn w latach 1970-1974, (Life expectancy tables and mortality by causes in 1970-1974), (oprac. L. Bolesławski), Tablice wynikowe, Warszawa
2. GUS [1976];Trwanie życia i umieralność według przyczyn w 1975 r., (Life expectancy tables and mortality by causes in 1975), (oprac. L. Bolesławski), Tablice wynikowe, Warszawa
3. GUS [1976];Trwanie życia i umieralność według przyczyn w województwach w latach 1973-1975, (Life expectancy tables and mortality by causes and voivodships in 1973-1975), (oprac. L. Bolesławski), Tablice wynikowe, Warszawa
4. GUS [1977]; Trwanie życia i umieralność według przyczyn w 1976 r., (Life expectancy tables and mortality by causes in 1976), (oprac. J. Mijakowska), Tablice wynikowe, Warszawa
5. GUS [1981];Trwanie życia i umieralność według przyczyn w latach 1977-1980, (Life expectancy tables and mortality by causes in 1977-1980), (oprac. J. Mijakowska), „Opracowania Statystyczne”, Warszawa
6. GUS [1981]; Trwanie życia i umieralność według przyczyn w latach 1976-1981, cz.I, (Life expectancy tables and mortality by causes in 1976-1981), (oprac. L. Nowak), „Opracowania Statystyczne”, Warszawa

45
rozdział 9. wykaz publikacji gus dotyczących trwania życia
7. GUS [1982]; Trwanie życia i umieralność według przyczyn w województwach w latach 1976-1980, cz.II, (Life expectan-cy tables and mortality by causes and voivodships in 1976-1980), (oprac. J.Mijakowska), „Opracowania Statystyczne”, Warszawa
8. GUS [1983]; Trwanie życia i umieralność według przyczyn w 1982 r., (Life expectancy tables and mortality by causes in 1982), (oprac. L. Nowak), „Opracowania Statystyczne”, Warszawa
9. GUS [1984]; Trwanie życia i umieralność według przyczyn w 1983 r., (Life expectancy tables and mortality by causes in 1983), (oprac. L. Nowak), „Opracowania Statystyczne”, Warszawa
10. GUS [1985]; Trwanie życia i umieralność według przyczyn w 1984 r., (Life expectancy tables and mortality by causes in 1984), (oprac. L. Nowak), „Opracowania Statystyczne”, Warszawa
11. GUS [1986]; Trwanie życia i umieralność według przyczyn w 1985 r., (Life expectancy tables and mortality by causes in 1985), (oprac. L. Nowak), „Opracowania Statystyczne”, Warszawa
12. GUS [1986]; Trwanie życia i umieralność według przyczyn w województwach w latach 1981-1985, (Life expectancy tables and mortality by causes and voivodships in 1981-1985), (oprac. L. Nowak), „Opracowania Statystyczne”, Warszawa
13. GUS [1987]; Trwanie życia i umieralność według przyczyn w 1986 r., (Life expectancy tables and mortality by causes in 1986), (oprac. L. Nowak), „Opracowania Statystyczne”, Warszawa
14. GUS [1988]; Trwanie życia i umieralność według przyczyn w 1987 r., (Life expectancy tables and mortality by causes in 1987), (oprac. L. Nowak), „Opracowania Statystyczne”, Warszawa
15. GUS [1990]; Trwanie życia i umieralność według przyczyn w 1989 r., (Life expectancy tables and mortality by causes in 1989), (oprac. L. Nowak), „Materiały i Opracowania Statystyczne”, Warszawa
16. GUS [1991]; Trwanie życia i umieralność według przyczyn w 1988 r., (Life expectancy tables and mortality by causes in 1988), (oprac. L. Nowak), „Materiały i Opracowania Statystyczne”, Warszawa
17. GUS [1991]; Trwanie życia i umieralność według przyczyn w 1990 r., (Life expectancy tables and mortality by causes in 1990), (oprac. L. Nowak), Materiały i Opracowania Statystyczne”, Warszawa
18. GUS [1991]; Trwanie życia i umieralność według przyczyn w województwach w latach 1986-1990, (Life expectancy tables and mortality by causes and voivodships in 1986-1990), (oprac. J. Mijakowska), „Materiały i Opracowania Statystyczne”, Warszawa
19. GUS [1992]; Trwanie życia i umieralność według przyczyn w 1991 r., (Life expectancy tables and mortality by causes in 1991), (oprac. L. Nowak), „Materiały i Opracowania Statystyczne”, Warszawa
20. GUS [1993]; Trwanie życia i umieralność według przyczyn w 1992 r., (Life expectancy tables and mortality by causes in 1992), (oprac. A. Glazer, L. Bolesławski), „Informacje i Opracowania Statystyczne”, Warszawa
21. GUS [1994]; Trwanie życia i umieralność według przyczyn w 1993 r., (Life expectancy tables and mortality by causes in 1993), (oprac. A. Glazer, L. Bolesławski), „Informacje i Opracowania Statystyczne”, Warszawa
22. GUS [1995]; Trwanie życia i umieralność według przyczyn w 1994 r., (Life expectancy tables and mortality by causes in 1994), (oprac. A. Glazer, L. Bolesławski), „Informacje i Opracowania Statystyczne”, Warszawa
23. Bolesławski L. [1996]; Trwanie życia i umieralność według przyczyn w 1995 r., (Life expectancy tables and mortality by causes in 1995), ”Studia i Analizy Statystyczne”, GUS, Warszawa
24. Bolesławski L. [1997]; Trwanie życia i umieralność według przyczyn w województwach w latach 1991-1995, (Life expectancy tables and mortality by causes and voivodships in 1991-1995), „Informacje i Opracowania Statystyczne”, GUS, Warszawa
25. Bolesławski L. [1997]; Trwanie życia i umieralność według przyczyn w 1996 r., (Life expectancy tables and mortality by causes in 1996), „Informacje i Opracowania Statystyczne”, GUS, Warszawa

46
chapter 9. list of publications containing polish complete and abridged life tables
Tablice trwania życiaLife expectancy tables
1. Bolesławski L. [1998]; Trwanie życia w 1997 r., (Life expectancy tables of Poland 1997), „Informacje i Opracowania Statystyczne”, GUS, Warszawa
2. Bolesławski L. [1999]; Trwanie życia w 1998 r., (Life expectancy tables of Poland 1998), „Informacje i Opracowania Statystyczne”, GUS, Warszawa
3. Bolesławski L. [2000]; Trwanie życia w 1999 r., (Life expectancy tables of Poland 1999), „Informacje i Opracowania Statystyczne”, GUS, Warszawa
4. Bolesławski L. [2001]; Trwanie życia w 2000 r., (Life expectancy tables of Poland 2000), „Informacje i Opracowania Statystyczne”, GUS, Warszawa
5. Rutkowska L. [2002]; Trwanie życia w 2001 r., (Life expectancy tables of Poland 2001), „Informacje i Opracowania Statystyczne”, GUS, Warszawa
6. Rutkowska L. [2003]; Trwanie życia w 2002 r., (Life expectancy tables of Poland 2002), „Informacje i Opracowania Statystyczne”, GUS, Warszawa
7. Rutkowska L. [2004]; Trwanie życia w 2003 r., (Life expectancy tables of Poland 2003), „Informacje i Opracowania Statystyczne”, GUS, Warszawa
8. Rutkowska L. [2005]; Trwanie życia w 2004 r., (Life expectancy tables of Poland 2004), „Informacje i Opracowania Statystyczne”, GUS, Warszawa
9. Rutkowska L. [2006]; Trwanie życia w 2005 r., (Life expectancy tables of Poland 2005), „Informacje i Opracowania Statystyczne”, GUS, Warszawa
10. Rutkowska L. [2007]; Trwanie życia w 2006 r., (Life expectancy tables of Poland 2006), „Informacje i Opracowania Statystyczne”, GUS, Warszawa
11. Rutkowska L. [2008]; Trwanie życia w 2007 r., (Life expectancy tables of Poland 2007), „Informacje i Opracowania Statystyczne”, GUS, Warszawa
12. Rutkowska L. [2009]; Trwanie życia w 2008 r., (Life expectancy tables of Poland 2008), „Informacje i Opracowania Statystyczne”, GUS, Warszawa
13. Rutkowska L. [2010]; Trwanie życia w 2009 r., (Life expectancy tables of Poland 2009), „Informacje i Opracowania Statystyczne”, GUS, Warszawa
14. Rutkowska L. [2011]; Trwanie życia w 2010 r., (Life expectancy tables of Poland 2010), „Informacje i Opracowania Statystyczne”, GUS, Warszawa
15. Rutkowska L. [2012]; Trwanie życia w 2011 r., (Life expectancy tables of Poland 2011), „Informacje i Opracowania Statystyczne”, GUS, Warszawa
16. Rutkowska L. [2013]; Trwanie życia w 2012 r., (Life expectancy tables of Poland 2012), „Informacje i Opracowania Statystyczne”, GUS, Warszawa
17. Rutkowska L. [2014]; Trwanie życia w 2013 r., (Life expectancy tables of Poland 2013), „Informacje i Opracowania Statystyczne”, GUS, Warszawa
18. Rutkowska L. [2015]; Trwanie życia w 2014 r., (Life expectancy tables of Poland 2014), „Informacje i Opracowania Statystyczne”, GUS, Warszawa
19. Rutkowska L. [2016]; Trwanie życia w 2015 r., (Life expectancy tables of Poland 2015), „Informacje i Opracowania Statystyczne”, GUS, Warszawa
20. Rutkowska L. [2017]; Trwanie życia w 2016 r., (Life expectancy tables of Poland 2016), „Informacje i Opracowania Statystyczne”, GUS, Warszawa
21. Rutkowska L., Waligórska M., Sapała K. [2017]; Trwanie życia w 2017 r., (Life expectancy tables of Poland 2017), „Informacje i Opracowania Statystyczne”, GUS, Warszawa

47
tablice podstawowe
Tablice podstawoweBasic tables

48
basic tables
Tablica A. TABLICA TRWANIA ŻYCIA 2018 Table A. LIFE TABLE OF POLAND 2018
WiekAge
Liczba dożywających
Number of survivors
Prawdopodo-bieństwo zgonu
Probability of dying
Liczba zmarłychNumber deceased
Ludność stacjonarna Przeciętne dalsze trwanie życia
Life expectancyw wieku x
at age xskumulowana
cumulated
x lx qx dx Lx Tx ex
Mężczyźni ogółem Total males
0 100000 0,00421 421 99790 7384643 73,85
1 99579 0,00026 25 99567 7284854 73,16
2 99554 0,00019 19 99545 7185287 72,17
3 99535 0,00013 13 99529 7085743 71,19
4 99522 0,00010 10 99517 6986214 70,20
5 99512 0,00009 8 99508 6886697 69,20
6 99504 0,00009 9 99500 6787189 68,21
7 99495 0,00010 9 99491 6687690 67,22
8 99486 0,00010 11 99481 6588199 66,22
9 99475 0,00011 11 99470 6488719 65,23
10 99464 0,00011 11 99459 6389249 64,24
11 99453 0,00012 12 99447 6289791 63,24
12 99441 0,00014 13 99435 6190344 62,25
13 99428 0,00017 17 99420 6090909 61,26
14 99411 0,00021 21 99401 5991490 60,27
15 99390 0,00027 27 99377 5892089 59,28
16 99363 0,00036 37 99345 5792713 58,30
17 99326 0,00048 47 99303 5693368 57,32
18 99279 0,00061 61 99249 5594066 56,35
19 99218 0,00073 73 99182 5494817 55,38
20 99145 0,00082 81 99105 5395636 54,42
21 99064 0,00087 87 99021 5296531 53,47
22 98977 0,00089 88 98933 5197511 52,51
23 98889 0,00091 90 98844 5098578 51,56
24 98799 0,00093 92 98753 4999734 50,61
25 98707 0,00096 95 98660 4900981 49,65
26 98612 0,00101 100 98562 4802321 48,70
27 98512 0,00105 104 98460 4703759 47,75
28 98408 0,00112 109 98354 4605299 46,80
29 98299 0,00119 117 98241 4506946 45,85
30 98182 0,00126 124 98120 4408705 44,90
31 98058 0,00134 132 97992 4310585 43,96
32 97926 0,00141 138 97857 4212593 43,02
33 97788 0,00148 145 97716 4114736 42,08
34 97643 0,00157 153 97567 4017021 41,14

49
tablice podstawowe
WiekAge
Liczba dożywających
Number of survivors
Prawdopodo-bieństwo zgonu
Probability of dying
Liczba zmarłychNumber deceased
Ludność stacjonarna Przeciętne dalsze trwanie życia
Life expectancyw wieku x
at age xskumulowana
cumulated
x lx qx dx Lx Tx ex
Mężczyźni ogółem (cd.) Total males (cont.)
35 97490 0,00167 163 97409 3919454 40,20
36 97327 0,00181 175 97240 3822046 39,27
37 97152 0,00198 193 97056 3724806 38,34
38 96959 0,00219 212 96853 3627751 37,42
39 96747 0,00242 234 96630 3530898 36,50
40 96513 0,00266 257 96385 3434268 35,58
41 96256 0,00291 280 96116 3337883 34,68
42 95976 0,00315 302 95825 3241767 33,78
43 95674 0,00343 328 95510 3145942 32,88
44 95346 0,00373 356 95168 3050432 31,99
45 94990 0,00408 388 94796 2955264 31,11
46 94602 0,00448 424 94390 2860468 30,24
47 94178 0,00493 465 93946 2766078 29,37
48 93713 0,00541 507 93460 2672133 28,51
49 93206 0,00592 552 92930 2578673 27,67
50 92654 0,00648 600 92354 2485743 26,83
51 92054 0,00710 653 91728 2393389 26,00
52 91401 0,00779 712 91045 2301662 25,18
53 90689 0,00858 778 90300 2210617 24,38
54 89911 0,00947 851 89486 2120317 23,58
55 89060 0,01045 931 88595 2030831 22,80
56 88129 0,01151 1015 87622 1942237 22,04
57 87114 0,01264 1101 86564 1854615 21,29
58 86013 0,01381 1188 85419 1768052 20,56
59 84825 0,01504 1276 84187 1682633 19,84
60 83549 0,01635 1366 82866 1598446 19,13
61 82183 0,01779 1462 81452 1515580 18,44
62 80721 0,01936 1563 79940 1434128 17,77
63 79158 0,02107 1668 78324 1354188 17,11
64 77490 0,02290 1774 76603 1275864 16,46
65 75716 0,02477 1876 74778 1199261 15,84
66 73840 0,02663 1966 72857 1124483 15,23
67 71874 0,02845 2045 70852 1051626 14,63
68 69829 0,03025 2112 68773 980775 14,05
69 67717 0,03209 2173 66631 912002 13,47
Tablica A. TABLICA TRWANIA ŻYCIA 2018 (cd.) Table A. LIFE TABLE OF POLAND 2018 (cont.)

50
basic tables
WiekAge
Liczba dożywających
Number of survivors
Prawdopodo-bieństwo zgonu
Probability of dying
Liczba zmarłychNumber deceased
Ludność stacjonarna Przeciętne dalsze trwanie życia
Life expectancyw wieku x
at age xskumulowana
cumulated
x lx qx dx Lx Tx ex
Mężczyźni ogółem (dok.) Total males (cont.)
70 65544 0,03404 2231 64429 845371 12,90
71 63313 0,03623 2295 62166 780943 12,33
72 61018 0,03871 2362 59837 718777 11,78
73 58656 0,04155 2437 57438 658940 11,23
74 56219 0,04476 2516 54961 601503 10,70
75 53703 0,04832 2595 52406 546542 10,18
76 51108 0,05225 2671 49773 494136 9,67
77 48437 0,05659 2741 47067 444364 9,17
78 45696 0,06144 2808 44292 397297 8,69
79 42888 0,06691 2869 41454 353005 8,23
80 40019 0,07308 2925 38557 311552 7,79
81 37094 0,07999 2967 35611 272995 7,36
82 34127 0,08753 2987 32634 237385 6,96
83 31140 0,09546 2973 29654 204751 6,58
84 28167 0,10359 2918 26708 175098 6,22
85 25249 0,11186 2824 23837 148390 5,88
86 22425 0,12030 2698 21076 124553 5,55
87 19727 0,12916 2548 18453 103477 5,25
88 17179 0,13866 2382 15988 85024 4,95
89 14797 0,14899 2204 13695 69036 4,67
90 12593 0,16024 2018 11584 55341 4,39
91 10575 0,17229 1822 9664 43757 4,14
92 8753 0,18503 1620 7943 34093 3,89
93 7133 0,19848 1415 6426 26150 3,67
94 5718 0,21262 1216 5110 19724 3,45
95 4502 0,22746 1024 3990 14614 3,25
96 3478 0,24299 845 3056 10624 3,05
97 2633 0,25922 683 2292 7569 2,87
98 1950 0,27612 538 1681 5277 2,71
99 1412 0,29369 415 1205 3596 2,55
100 997 0,31189 311 842 2392 2,40
Tablica A. TABLICA TRWANIA ŻYCIA 2018 (cd.) Table A. LIFE TABLE OF POLAND 2018 (cont.)

51
tablice podstawowe
Tablica A. TABLICA TRWANIA ŻYCIA 2018 (cd.) Table A. LIFE TABLE OF POLAND 2018 (cont.)
WiekAge
Liczba dożywających
Number of survivors
Prawdopodo-bieństwo zgonu
Probability of dying
Liczba zmarłychNumber deceased
Ludność stacjonarna Przeciętne dalsze trwanie życia
Life expectancyw wieku x
at age xskumulowana
cumulated
x lx qx dx Lx Tx ex
Kobiety ogółem Total females
0 100000 0,00353 353,00 99824 8167929 81,68
1 99647 0,00020 20,00 99637 8068106 80,97
2 99627 0,00016 15,00 99620 7968469 79,98
3 99612 0,00012 12,00 99606 7868849 78,99
4 99600 0,00010 10,00 99595 7769243 78,00
5 99590 0,00008 9,00 99586 7669648 77,01
6 99581 0,00008 7,00 99578 7570063 76,02
7 99574 0,00007 8,00 99570 7470485 75,02
8 99566 0,00007 7,00 99563 7370915 74,03
9 99559 0,00008 8,00 99555 7271353 73,04
10 99551 0,00009 10,00 99546 7171798 72,04
11 99541 0,00011 11,00 99536 7072252 71,05
12 99530 0,00013 12,00 99524 6972716 70,06
13 99518 0,00014 14,00 99511 6873192 69,06
14 99504 0,00015 15,00 99497 6773681 68,07
15 99489 0,00017 17,00 99481 6674185 67,08
16 99472 0,00020 20,00 99462 6574704 66,10
17 99452 0,00023 23,00 99441 6475242 65,11
18 99429 0,00027 27,00 99416 6375802 64,12
19 99402 0,00028 28,00 99388 6276386 63,14
20 99374 0,00028 28,00 99360 6176998 62,16
21 99346 0,00027 26,00 99333 6077638 61,18
22 99320 0,00025 25,00 99308 5978305 60,19
23 99295 0,00024 23,00 99284 5878998 59,21
24 99272 0,00023 23,00 99261 5779714 58,22
25 99249 0,00025 25,00 99237 5680454 57,23
26 99224 0,00026 26,00 99211 5581217 56,25
27 99198 0,00028 27,00 99185 5482006 55,26
28 99171 0,00029 29,00 99157 5382822 54,28
29 99142 0,00031 30,00 99127 5283665 53,29
30 99112 0,00033 33,00 99096 5184538 52,31
31 99079 0,00035 34,00 99062 5085443 51,33
32 99045 0,00038 38,00 99026 4986381 50,34
33 99007 0,00042 42,00 98986 4887355 49,36
34 98965 0,00046 45,00 98943 4788369 48,38

52
basic tables
WiekAge
Liczba dożywających
Number of survivors
Prawdopodo-bieństwo zgonu
Probability of dying
Liczba zmarłychNumber deceased
Ludność stacjonarna Przeciętne dalsze trwanie życia
Life expectancyw wieku x
at age xskumulowana
cumulated
x lx qx dx Lx Tx ex
Kobiety ogółem (cd.) Total females (cont.)
35 98920 0,00051 50,00 98895 4689426 47,41
36 98870 0,00056 55,00 98843 4590531 46,43
37 98815 0,00062 61,00 98785 4491689 45,46
38 98754 0,00068 68,00 98720 4392904 44,48
39 98686 0,00075 73,00 98650 4294184 43,51
40 98613 0,00082 81,00 98573 4195535 42,55
41 98532 0,00090 88,00 98488 4096962 41,58
42 98444 0,00100 99,00 98395 3998474 40,62
43 98345 0,00112 111,00 98290 3900080 39,66
44 98234 0,00127 124,00 98172 3801790 38,70
45 98110 0,00143 140,00 98040 3703618 37,75
46 97970 0,00160 157,00 97892 3605578 36,80
47 97813 0,00178 174,00 97726 3507687 35,86
48 97639 0,00197 192,00 97543 3409961 34,92
49 97447 0,00218 213,00 97341 3312418 33,99
50 97234 0,00240 233,00 97118 3215077 33,07
51 97001 0,00264 257 96873 3117960 32,14
52 96744 0,00292 282 96603 3021087 31,23
53 96462 0,00323 312 96306 2924484 30,32
54 96150 0,00360 346 95977 2828178 29,41
55 95804 0,00405 388 95610 2732201 28,52
56 95416 0,00456 435 95199 2636591 27,63
57 94981 0,00514 488 94737 2541393 26,76
58 94493 0,00576 544 94221 2446656 25,89
59 93949 0,00639 600 93649 2352435 25,04
60 93349 0,00702 656 93021 2258786 24,20
61 92693 0,00765 708 92339 2165765 23,36
62 91985 0,00827 761 91605 2073426 22,54
63 91224 0,00893 814 90817 1981821 21,72
64 90410 0,00965 873 89974 1891004 20,92
65 89537 0,01049 939 89068 1801031 20,11
66 88598 0,01143 1013 88092 1711963 19,32
67 87585 0,01248 1093 87039 1623872 18,54
68 86492 0,01365 1181 85902 1536833 17,77
69 85311 0,01492 1272 84675 1450932 17,01
Tablica A. TABLICA TRWANIA ŻYCIA 2018 (cd.) Table A. LIFE TABLE OF POLAND 2018 (cont.)

53
tablice podstawowe
WiekAge
Liczba dożywających
Number of survivors
Prawdopodo-bieństwo zgonu
Probability of dying
Liczba zmarłychNumber deceased
Ludność stacjonarna Przeciętne dalsze trwanie życia
Life expectancyw wieku x
at age xskumulowana
cumulated
x lx qx dx Lx Tx ex
Kobiety ogółem (dok.) Total females (cont.)
70 84039 0,01628 1369 83355 1366257 16,26
71 82670 0,01776 1468 81936 1282902 15,52
72 81202 0,01938 1573 80416 1200966 14,79
73 79629 0,02115 1684 78787 1120551 14,07
74 77945 0,02312 1803 77044 1041764 13,37
75 76142 0,02532 1928 75178 964720 12,67
76 74214 0,02782 2064 73182 889542 11,99
77 72150 0,03071 2216 71042 816360 11,31
78 69934 0,03419 2391 68739 745318 10,66
79 67543 0,03849 2600 66243 676580 10,02
80 64943 0,04380 2845 63521 610337 9,40
81 62098 0,05021 3118 60539 546816 8,81
82 58980 0,05770 3403 57279 486277 8,24
83 55577 0,06595 3665 53745 428999 7,72
84 51912 0,07460 3873 49976 375254 7,23
85 48039 0,08343 4008 46035 325279 6,77
86 44031 0,09236 4066 41998 279244 6,34
87 39965 0,10162 4062 37934 237246 5,94
88 35903 0,11151 4003 33902 199312 5,55
89 31900 0,12234 3903 29949 165410 5,19
90 27997 0,13427 3759 26118 135462 4,84
91 24238 0,14748 3575 22451 109344 4,51
92 20663 0,16158 3338 18994 86894 4,21
93 17325 0,17659 3060 15795 67900 3,92
94 14265 0,19251 2746 12892 52105 3,65
95 11519 0,20934 2411 10314 39213 3,40
96 9108 0,22707 2068 8074 28899 3,17
97 7040 0,24568 1730 6175 20825 2,96
98 5310 0,26516 1408 4606 14650 2,76
99 3902 0,28547 1114 3345 10044 2,57
100 2788 0,30658 855 2361 6699 2,40
Tablica A. TABLICA TRWANIA ŻYCIA 2018 (cd.) Table A. LIFE TABLE OF POLAND 2018 (cont.)

54
basic tables
Tablica A. TABLICA TRWANIA ŻYCIA 2018 (cd.) Table A. LIFE TABLE OF POLAND 2018 (cont.)
WiekAge
Liczba dożywających
Number of survivors
Prawdopodo-bieństwo zgonu
Probability of dying
Liczba zmarłychNumber deceased
Ludność stacjonarna Przeciętne dalsze trwanie życia
Life expectancyw wieku x
at age xskumulowana
cumulated
x lx qx dx Lx Tx ex
Mężczyźni w miastach Males in urban areas
0 100000 0,00395 395 99803 7421133 74,21
1 99605 0,00025 24 99593 7321331 73,50
2 99581 0,00016 16 99573 7221738 72,52
3 99565 0,00010 10 99560 7122165 71,53
4 99555 0,00007 6 99552 7022605 70,54
5 99549 0,00006 7 99546 6923053 69,54
6 99542 0,00008 7 99539 6823507 68,55
7 99535 0,00010 10 99530 6723969 67,55
8 99525 0,00011 12 99519 6624439 66,56
9 99513 0,00012 12 99507 6524920 65,57
10 99501 0,00012 12 99495 6425413 64,58
11 99489 0,00012 12 99483 6325918 63,58
12 99477 0,00013 13 99471 6226435 62,59
13 99464 0,00015 14 99457 6126964 61,60
14 99450 0,00018 18 99441 6027507 60,61
15 99432 0,00023 23 99421 5928066 59,62
16 99409 0,00031 32 99393 5828646 58,63
17 99377 0,00043 42 99356 5729253 57,65
18 99335 0,00056 56 99307 5629897 56,68
19 99279 0,00068 67 99246 5530590 55,71
20 99212 0,00076 76 99174 5431344 54,74
21 99136 0,00081 81 99096 5332170 53,79
22 99055 0,00085 84 99013 5233075 52,83
23 98971 0,00089 88 98927 5134062 51,87
24 98883 0,00092 91 98838 5035135 50,92
25 98792 0,00095 94 98745 4936297 49,97
26 98698 0,00097 96 98650 4837552 49,01
27 98602 0,00100 99 98553 4738902 48,06
28 98503 0,00104 102 98452 4640350 47,11
29 98401 0,00111 109 98347 4541898 46,16
30 98292 0,00119 116 98234 4443551 45,21
31 98176 0,00127 125 98114 4345317 44,26
32 98051 0,00135 133 97985 4247204 43,32
33 97918 0,00143 140 97848 4149219 42,37
34 97778 0,00152 148 97704 4051371 41,43

55
tablice podstawowe
WiekAge
Liczba dożywających
Number of survivors
Prawdopodo-bieństwo zgonu
Probability of dying
Liczba zmarłychNumber deceased
Ludność stacjonarna Przeciętne dalsze trwanie życia
Life expectancyw wieku x
at age xskumulowana
cumulated
x lx qx dx Lx Tx ex
Mężczyźni w miastach (cd.) Males in urban areas (cont.)
35 97630 0,00162 159 97551 3953667 40,50
36 97471 0,00176 171 97386 3856117 39,56
37 97300 0,00194 189 97206 3758731 38,63
38 97111 0,00216 210 97006 3661526 37,70
39 96901 0,00239 232 96785 3564520 36,79
40 96669 0,00263 254 96542 3467735 35,87
41 96415 0,00287 277 96277 3371193 34,97
42 96138 0,00310 298 95989 3274916 34,06
43 95840 0,00335 321 95680 3178927 33,17
44 95519 0,00365 349 95345 3083248 32,28
45 95170 0,00401 381 94980 2987903 31,40
46 94789 0,00442 419 94580 2892924 30,52
47 94370 0,00488 461 94140 2798344 29,65
48 93909 0,00538 505 93657 2704205 28,80
49 93404 0,00590 551 93129 2610548 27,95
50 92853 0,00645 599 92554 2517420 27,11
51 92254 0,00705 651 91929 2424866 26,28
52 91603 0,00772 707 91250 2332938 25,47
53 90896 0,00846 769 90512 2241688 24,66
54 90127 0,00930 838 89708 2151177 23,87
55 89289 0,01023 913 88833 2061469 23,09
56 88376 0,01124 994 87879 1972636 22,32
57 87382 0,01233 1078 86843 1884757 21,57
58 86304 0,01349 1164 85722 1797914 20,83
59 85140 0,01470 1252 84514 1712192 20,11
60 83888 0,01601 1343 83217 1627678 19,40
61 82545 0,01742 1438 81826 1544462 18,71
62 81107 0,01895 1537 80339 1462636 18,03
63 79570 0,02061 1639 78751 1382297 17,37
64 77931 0,02235 1742 77060 1303547 16,73
65 76189 0,02411 1837 75271 1226487 16,10
66 74352 0,02584 1921 73392 1151216 15,48
67 72431 0,02752 1994 71434 1077825 14,88
68 70437 0,02918 2055 69410 1006391 14,29
69 68382 0,03086 2110 67327 936981 13,70
Tablica A. TABLICA TRWANIA ŻYCIA 2018 (cd.) Table A. LIFE TABLE OF POLAND 2018 (cont.)
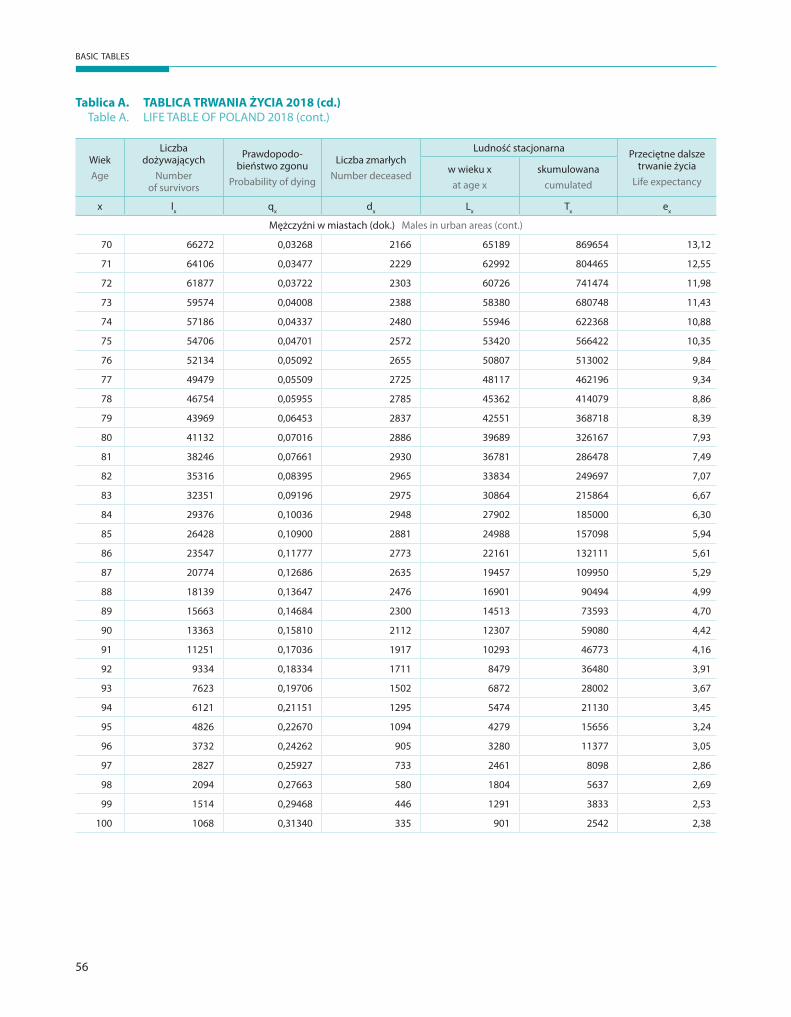
56
basic tables
WiekAge
Liczba dożywających
Number of survivors
Prawdopodo-bieństwo zgonu
Probability of dying
Liczba zmarłychNumber deceased
Ludność stacjonarna Przeciętne dalsze trwanie życia
Life expectancyw wieku x
at age xskumulowana
cumulated
x lx qx dx Lx Tx ex
Mężczyźni w miastach (dok.) Males in urban areas (cont.)
70 66272 0,03268 2166 65189 869654 13,12
71 64106 0,03477 2229 62992 804465 12,55
72 61877 0,03722 2303 60726 741474 11,98
73 59574 0,04008 2388 58380 680748 11,43
74 57186 0,04337 2480 55946 622368 10,88
75 54706 0,04701 2572 53420 566422 10,35
76 52134 0,05092 2655 50807 513002 9,84
77 49479 0,05509 2725 48117 462196 9,34
78 46754 0,05955 2785 45362 414079 8,86
79 43969 0,06453 2837 42551 368718 8,39
80 41132 0,07016 2886 39689 326167 7,93
81 38246 0,07661 2930 36781 286478 7,49
82 35316 0,08395 2965 33834 249697 7,07
83 32351 0,09196 2975 30864 215864 6,67
84 29376 0,10036 2948 27902 185000 6,30
85 26428 0,10900 2881 24988 157098 5,94
86 23547 0,11777 2773 22161 132111 5,61
87 20774 0,12686 2635 19457 109950 5,29
88 18139 0,13647 2476 16901 90494 4,99
89 15663 0,14684 2300 14513 73593 4,70
90 13363 0,15810 2112 12307 59080 4,42
91 11251 0,17036 1917 10293 46773 4,16
92 9334 0,18334 1711 8479 36480 3,91
93 7623 0,19706 1502 6872 28002 3,67
94 6121 0,21151 1295 5474 21130 3,45
95 4826 0,22670 1094 4279 15656 3,24
96 3732 0,24262 905 3280 11377 3,05
97 2827 0,25927 733 2461 8098 2,86
98 2094 0,27663 580 1804 5637 2,69
99 1514 0,29468 446 1291 3833 2,53
100 1068 0,31340 335 901 2542 2,38
Tablica A. TABLICA TRWANIA ŻYCIA 2018 (cd.) Table A. LIFE TABLE OF POLAND 2018 (cont.)

57
tablice podstawowe
Tablica A. TABLICA TRWANIA ŻYCIA 2018 (cd.) Table A. LIFE TABLE OF POLAND 2018 (cont.)
WiekAge
Liczba dożywających
Number of survivors
Prawdopodo-bieństwo zgonu
Probability of dying
Liczba zmarłychNumber deceased
Ludność stacjonarna Przeciętne dalsze trwanie życia
Life expectancyw wieku x
at age xskumulowana
cumulated
x lx qx dx Lx Tx ex
Kobiety w miastach Females in urban areas
0 100000 0,00328 328 99836 8164074 81,64
1 99672 0,00020 20 99662 8064238 80,91
2 99652 0,00015 15 99645 7964576 79,92
3 99637 0,00011 11 99632 7864932 78,94
4 99626 0,00009 10 99621 7765300 77,94
5 99616 0,00008 7 99613 7665679 76,95
6 99609 0,00007 7 99606 7566067 75,96
7 99602 0,00007 7 99599 7466461 74,96
8 99595 0,00007 7 99592 7366863 73,97
9 99588 0,00008 8 99584 7267271 72,97
10 99580 0,00011 11 99575 7167687 71,98
11 99569 0,00013 13 99563 7068113 70,99
12 99556 0,00014 14 99549 6968550 70,00
13 99542 0,00014 14 99535 6869001 69,01
14 99528 0,00014 13 99522 6769466 68,02
15 99515 0,00014 15 99508 6669945 67,02
16 99500 0,00017 16 99492 6570437 66,03
17 99484 0,00021 21 99474 6470945 65,05
18 99463 0,00025 25 99451 6371472 64,06
19 99438 0,00028 27 99425 6272021 63,07
20 99411 0,00028 28 99397 6172597 62,09
21 99383 0,00028 28 99369 6073200 61,11
22 99355 0,00027 26 99342 5973831 60,13
23 99329 0,00026 27 99316 5874489 59,14
24 99302 0,00027 26 99289 5775173 58,16
25 99276 0,00027 27 99263 5675884 57,17
26 99249 0,00028 27 99236 5576622 56,19
27 99222 0,00028 28 99208 5477386 55,20
28 99194 0,00029 29 99180 5378178 54,22
29 99165 0,00031 30 99150 5278999 53,23
30 99135 0,00034 34 99118 5179849 52,25
31 99101 0,00037 36 99083 5080731 51,27
32 99065 0,00040 40 99045 4981648 50,29
33 99025 0,00044 44 99003 4882603 49,31
34 98981 0,00049 48 98957 4783600 48,33

58
basic tables
WiekAge
Liczba dożywających
Number of survivors
Prawdopodo-bieństwo zgonu
Probability of dying
Liczba zmarłychNumber deceased
Ludność stacjonarna Przeciętne dalsze trwanie życia
Life expectancyw wieku x
at age xskumulowana
cumulated
x lx qx dx Lx Tx ex
Kobiety w miastach (cd.) Females in urban areas (cont.)
35 98933 0,00054 54 98906 4684643 47,35
36 98879 0,00060 59 98850 4585737 46,38
37 98820 0,00066 65 98788 4486887 45,40
38 98755 0,00072 71 98720 4388100 44,43
39 98684 0,00078 77 98646 4289380 43,47
40 98607 0,00086 84 98565 4190735 42,50
41 98523 0,00095 94 98476 4092170 41,54
42 98429 0,00106 104 98377 3993694 40,57
43 98325 0,00120 119 98266 3895317 39,62
44 98206 0,00137 134 98139 3797051 38,66
45 98072 0,00155 152 97996 3698912 37,72
46 97920 0,00173 169 97836 3600916 36,77
47 97751 0,00191 186 97658 3503081 35,84
48 97565 0,00208 203 97464 3405423 34,90
49 97362 0,00226 220 97252 3307959 33,98
50 97142 0,00245 238 97023 3210707 33,05
51 96904 0,00267 259 96775 3113684 32,13
52 96645 0,00293 283 96504 3016910 31,22
53 96362 0,00323 311 96207 2920406 30,31
54 96051 0,00360 346 95878 2824200 29,40
55 95705 0,00404 387 95512 2728322 28,51
56 95318 0,00457 435 95101 2632810 27,62
57 94883 0,00517 491 94638 2537710 26,75
58 94392 0,00584 551 94117 2443072 25,88
59 93841 0,00651 610 93536 2348956 25,03
60 93231 0,00717 669 92897 2255420 24,19
61 92562 0,00780 722 92201 2162523 23,36
62 91840 0,00840 772 91454 2070322 22,54
63 91068 0,00903 822 90657 1978868 21,73
64 90246 0,00973 878 89807 1888211 20,92
65 89368 0,01056 944 88896 1798404 20,12
66 88424 0,01152 1019 87915 1709508 19,33
67 87405 0,01261 1102 86854 1621594 18,55
68 86303 0,01383 1194 85706 1534740 17,78
69 85109 0,01515 1289 84465 1449034 17,03
Tablica A. TABLICA TRWANIA ŻYCIA 2018 (cd.) Table A. LIFE TABLE OF POLAND 2018 (cont.)

59
tablice podstawowe
WiekAge
Liczba dożywających
Number of survivors
Prawdopodo-bieństwo zgonu
Probability of dying
Liczba zmarłychNumber deceased
Ludność stacjonarna Przeciętne dalsze trwanie życia
Life expectancyw wieku x
at age xskumulowana
cumulated
x lx qx dx Lx Tx ex
Kobiety w miastach (dok.) Females in urban areas (cont.)
70 83820 0,01655 1388 83126 1364569 16,28
71 82432 0,01807 1489 81688 1281443 15,55
72 80943 0,01970 1595 80146 1199756 14,82
73 79348 0,02146 1703 78497 1119610 14,11
74 77645 0,02341 1818 76736 1041114 13,41
75 75827 0,02554 1937 74859 964378 12,72
76 73890 0,02789 2060 72860 889519 12,04
77 71830 0,03055 2195 70733 816659 11,37
78 69635 0,03370 2347 68462 745927 10,71
79 67288 0,03764 2533 66022 677465 10,07
80 64755 0,04264 2761 63375 611444 9,44
81 61994 0,04884 3027 60481 548069 8,84
82 58967 0,05639 3325 57305 487589 8,27
83 55642 0,06490 3611 53837 430284 7,73
84 52031 0,07393 3847 50108 376448 7,24
85 48184 0,08312 4005 46182 326340 6,77
86 44179 0,09229 4077 42141 280159 6,34
87 40102 0,10163 4075 38065 238018 5,94
88 36027 0,11147 4016 34019 199954 5,55
89 32011 0,12219 3912 30055 165935 5,18
90 28099 0,13401 3765 26217 135880 4,84
91 24334 0,14731 3585 22542 109663 4,51
92 20749 0,16153 3352 19073 87122 4,20
93 17397 0,17666 3073 15861 68049 3,91
94 14324 0,19273 2761 12944 52188 3,64
95 11563 0,20972 2425 10351 39245 3,39
96 9138 0,22763 2080 8098 28894 3,16
97 7058 0,24645 1739 6189 20796 2,95
98 5319 0,26614 1416 4611 14608 2,75
99 3903 0,28668 1119 3344 9997 2,56
100 2784 0,30804 857 2356 6653 2,39
Tablica A. TABLICA TRWANIA ŻYCIA 2018 (cd.) Table A. LIFE TABLE OF POLAND 2018 (cont.)

60
basic tables
Tablica A. TABLICA TRWANIA ŻYCIA 2018 (cd.) Table A. LIFE TABLE OF POLAND 2018 (cont.)
WiekAge
Liczba dożywających
Number of survivors
Prawdopodo-bieństwo zgonu
Probability of dying
Liczba zmarłychNumber deceased
Ludność stacjonarna Przeciętne dalsze trwanie życia
Life expectancyw wieku x
at age xskumulowana
cumulated
x lx qx dx Lx Tx ex
Mężczyźni na wsi Males in rural areas
0 100000 0,00458 458 99771 7323574 73,24
1 99542 0,00027 27 99529 7223803 72,57
2 99515 0,00023 22 99504 7124275 71,59
3 99493 0,00018 18 99484 7024771 70,61
4 99475 0,00014 15 99468 6925287 69,62
5 99460 0,00012 11 99455 6825819 68,63
6 99449 0,00010 10 99444 6726365 67,64
7 99439 0,00009 10 99434 6626921 66,64
8 99429 0,00009 9 99425 6527487 65,65
9 99420 0,00009 9 99416 6428062 64,66
10 99411 0,00010 10 99406 6328647 63,66
11 99401 0,00012 11 99396 6229241 62,67
12 99390 0,00015 15 99383 6129845 61,67
13 99375 0,00019 19 99366 6030463 60,68
14 99356 0,00025 25 99344 5931097 59,70
15 99331 0,00033 32 99315 5831754 58,71
16 99299 0,00043 43 99278 5732439 57,73
17 99256 0,00054 54 99229 5633161 56,75
18 99202 0,00067 66 99169 5533932 55,78
19 99136 0,00080 79 99097 5434763 54,82
20 99057 0,00089 88 99013 5335667 53,86
21 98969 0,00093 93 98923 5236654 52,91
22 98876 0,00094 93 98830 5137731 51,96
23 98783 0,00094 92 98737 5038902 51,01
24 98691 0,00094 93 98645 4940165 50,06
25 98598 0,00098 97 98550 4841520 49,10
26 98501 0,00105 103 98450 4742971 48,15
27 98398 0,00113 111 98343 4644521 47,20
28 98287 0,00122 119 98228 4546179 46,25
29 98168 0,00130 128 98104 4447951 45,31
30 98040 0,00137 135 97973 4349847 44,37
31 97905 0,00144 140 97835 4251875 43,43
32 97765 0,00150 147 97692 4154040 42,49
33 97618 0,00157 153 97542 4056348 41,55
34 97465 0,00165 160 97385 3958807 40,62

61
tablice podstawowe
WiekAge
Liczba dożywających
Number of survivors
Prawdopodo-bieństwo zgonu
Probability of dying
Liczba zmarłychNumber deceased
Ludność stacjonarna Przeciętne dalsze trwanie życia
Life expectancyw wieku x
at age xskumulowana
cumulated
x lx qx dx Lx Tx ex
Mężczyźni na wsi (cd.) Males in rural areas (cont.)
35 97305 0,00175 170 97220 3861422 39,68
36 97135 0,00188 183 97044 3764202 38,75
37 96952 0,00204 198 96853 3667158 37,82
38 96754 0,00224 216 96646 3570305 36,90
39 96538 0,00246 238 96419 3473659 35,98
40 96300 0,00271 260 96170 3377240 35,07
41 96040 0,00297 285 95898 3281070 34,16
42 95755 0,00324 310 95600 3185173 33,26
43 95445 0,00353 337 95277 3089573 32,37
44 95108 0,00385 367 94925 2994296 31,48
45 94741 0,00419 397 94543 2899372 30,60
46 94344 0,00458 432 94128 2804829 29,73
47 93912 0,00500 469 93678 2710701 28,86
48 93443 0,00546 510 93188 2617024 28,01
49 92933 0,00595 553 92657 2523836 27,16
50 92380 0,00651 602 92079 2431179 26,32
51 91778 0,00715 656 91450 2339100 25,49
52 91122 0,00788 718 90763 2247650 24,67
53 90404 0,00873 789 90010 2156887 23,86
54 89615 0,00969 868 89181 2066878 23,06
55 88747 0,01075 954 88270 1977697 22,28
56 87793 0,01188 1043 87272 1889427 21,52
57 86750 0,01306 1132 86184 1802155 20,77
58 85618 0,01427 1222 85007 1715971 20,04
59 84396 0,01553 1310 83741 1630964 19,33
60 83086 0,01687 1402 82385 1547223 18,62
61 81684 0,01835 1499 80935 1464838 17,93
62 80185 0,02000 1604 79383 1383904 17,26
63 78581 0,02184 1716 77723 1304521 16,60
64 76865 0,02383 1832 75949 1226798 15,96
65 75033 0,02591 1944 74061 1150849 15,34
66 73089 0,02802 2048 72065 1076788 14,73
67 71041 0,03011 2139 69972 1004723 14,14
68 68902 0,03222 2220 67792 934751 13,57
69 66682 0,03438 2293 65536 866959 13,00
Tablica A. TABLICA TRWANIA ŻYCIA 2018 (cd.) Table A. LIFE TABLE OF POLAND 2018 (cont.)

62
basic tables
WiekAge
Liczba dożywających
Number of survivors
Prawdopodo-bieństwo zgonu
Probability of dying
Liczba zmarłychNumber deceased
Ludność stacjonarna Przeciętne dalsze trwanie życia
Life expectancyw wieku x
at age xskumulowana
cumulated
x lx qx dx Lx Tx ex
Mężczyźni na wsi (dok.) Males in rural areas (cont.)
70 64389 0,03663 2358 63210 801424 12,45
71 62031 0,03902 2421 60821 738214 11,90
72 59610 0,04156 2477 58372 677393 11,36
73 57133 0,04435 2534 55866 619022 10,83
74 54599 0,04741 2589 53305 563156 10,31
75 52010 0,05080 2642 50689 509851 9,80
76 49368 0,05470 2700 48018 459162 9,30
77 46668 0,05926 2766 45285 411144 8,81
78 43902 0,06465 2838 42483 365859 8,33
79 41064 0,07092 2913 39608 323376 7,87
80 38151 0,07803 2977 36663 283769 7,44
81 35174 0,08592 3022 33663 247106 7,03
82 32152 0,09424 3030 30637 213443 6,64
83 29122 0,10268 2990 27627 182806 6,28
84 26132 0,11110 2903 24681 155179 5,94
85 23229 0,11950 2776 21841 130499 5,62
86 20453 0,12804 2619 19144 108658 5,31
87 17834 0,13704 2444 16612 89514 5,02
88 15390 0,14680 2259 14261 72902 4,74
89 13131 0,15751 2068 12097 58642 4,47
90 11063 0,16924 1873 10127 46545 4,21
91 9190 0,18169 1669 8356 36418 3,96
92 7521 0,19482 1465 6789 28063 3,73
93 6056 0,20864 1264 5424 21274 3,51
94 4792 0,22314 1069 4258 15850 3,31
95 3723 0,23834 887 3280 11593 3,11
96 2836 0,25421 721 2476 8313 2,93
97 2115 0,27076 573 1829 5838 2,76
98 1542 0,28796 444 1320 4009 2,60
99 1098 0,30579 336 930 2689 2,45
100 762 0,32424 247 639 1759 2,31
Tablica A. TABLICA TRWANIA ŻYCIA 2018 (cd.) Table A. LIFE TABLE OF POLAND 2018 (cont.)

63
tablice podstawowe
Tablica A. TABLICA TRWANIA ŻYCIA 2018 (cd.) Table A. LIFE TABLE OF POLAND 2018 (cont.)
WiekAge
Liczba dożywających
Number of survivors
Prawdopodo-bieństwo zgonu
Probability of dying
Liczba zmarłychNumber deceased
Ludność stacjonarna Przeciętne dalsze trwanie życia
Life expectancyw wieku x
at age xskumulowana
cumulated
x lx qx dx Lx Tx ex
Kobiety na wsi Females in rural areas
0 100000 0,00388 388 99806 8162566 81,63
1 99612 0,00020 21 99602 8062760 80,94
2 99591 0,00016 16 99583 7963159 79,96
3 99575 0,00013 13 99569 7863576 78,97
4 99562 0,00011 11 99557 7764007 77,98
5 99551 0,00009 9 99547 7664451 76,99
6 99542 0,00009 9 99538 7564904 76,00
7 99533 0,00008 8 99529 7465367 75,00
8 99525 0,00008 8 99521 7365838 74,01
9 99517 0,00008 8 99513 7266317 73,02
10 99509 0,00008 8 99505 7166804 72,02
11 99501 0,00009 8 99497 7067299 71,03
12 99493 0,00011 12 99487 6967802 70,03
13 99481 0,00014 13 99475 6868315 69,04
14 99468 0,00017 17 99460 6768840 68,05
15 99451 0,00020 20 99441 6669381 67,06
16 99431 0,00024 24 99419 6569940 66,08
17 99407 0,00027 26 99394 6470521 65,09
18 99381 0,00029 29 99367 6371127 64,11
19 99352 0,00029 29 99338 6271760 63,13
20 99323 0,00028 28 99309 6172423 62,14
21 99295 0,00025 25 99283 6073114 61,16
22 99270 0,00022 22 99259 5973831 60,18
23 99248 0,00020 20 99238 5874572 59,19
24 99228 0,00020 20 99218 5775334 58,20
25 99208 0,00022 21 99198 5676116 57,21
26 99187 0,00025 24 99175 5576919 56,23
27 99163 0,00027 27 99150 5477744 55,24
28 99136 0,00029 29 99122 5378594 54,25
29 99107 0,00030 30 99092 5279473 53,27
30 99077 0,00031 31 99062 5180381 52,29
31 99046 0,00033 33 99030 5081319 51,30
32 99013 0,00035 34 98996 4982290 50,32
33 98979 0,00037 37 98961 4883294 49,34
34 98942 0,00040 40 98922 4784333 48,35

64
basic tables
WiekAge
Liczba dożywających
Number of survivors
Prawdopodo-bieństwo zgonu
Probability of dying
Liczba zmarłychNumber deceased
Ludność stacjonarna Przeciętne dalsze trwanie życia
Life expectancyw wieku x
at age xskumulowana
cumulated
x lx qx dx Lx Tx ex
Kobiety na wsi (cd.) Females in rural areas (cont.)
35 98902 0,00045 44 98880 4685411 47,37
36 98858 0,00050 49 98834 4586531 46,40
37 98809 0,00055 54 98782 4487698 45,42
38 98755 0,00062 61 98725 4388916 44,44
39 98694 0,00068 68 98660 4290191 43,47
40 98626 0,00075 74 98589 4191531 42,50
41 98552 0,00082 81 98512 4092942 41,53
42 98471 0,00091 89 98427 3994431 40,56
43 98382 0,00100 99 98333 3896004 39,60
44 98283 0,00111 109 98229 3797672 38,64
45 98174 0,00125 122 98113 3699443 37,68
46 98052 0,00141 138 97983 3601330 36,73
47 97914 0,00159 156 97836 3503347 35,78
48 97758 0,00182 178 97669 3405511 34,84
49 97580 0,00206 201 97480 3307842 33,90
50 97379 0,00233 227 97266 3210363 32,97
51 97152 0,00260 253 97026 3113097 32,04
52 96899 0,00290 281 96759 3016072 31,13
53 96618 0,00324 313 96462 2919313 30,22
54 96305 0,00362 348 96131 2822852 29,31
55 95957 0,00406 390 95762 2726721 28,42
56 95567 0,00455 434 95350 2630959 27,53
57 95133 0,00507 482 94892 2535609 26,65
58 94651 0,00560 531 94386 2440717 25,79
59 94120 0,00615 579 93831 2346331 24,93
60 93541 0,00673 629 93227 2252501 24,08
61 92912 0,00734 683 92571 2159274 23,24
62 92229 0,00800 737 91861 2066704 22,41
63 91492 0,00872 798 91093 1974843 21,58
64 90694 0,00950 861 90264 1883750 20,77
65 89833 0,01034 929 89369 1793487 19,96
66 88904 0,01123 998 88405 1704118 19,17
67 87906 0,01219 1072 87370 1615713 18,38
68 86834 0,01326 1151 86259 1528343 17,60
69 85683 0,01442 1236 85065 1442085 16,83
Tablica A. TABLICA TRWANIA ŻYCIA 2018 (cd.) Table A. LIFE TABLE OF POLAND 2018 (cont.)

65
tablice podstawowe
WiekAge
Liczba dożywających
Number of survivors
Prawdopodo-bieństwo zgonu
Probability of dying
Liczba zmarłychNumber deceased
Ludność stacjonarna Przeciętne dalsze trwanie życia
Life expectancyw wieku x
at age xskumulowana
cumulated
x lx qx dx Lx Tx ex
Kobiety na wsi (dok.) Females in rural areas (cont.)
70 84447 0,01570 1326 83784 1357020 16,07
71 83121 0,01712 1423 82410 1273236 15,32
72 81698 0,01871 1528 80934 1190826 14,58
73 80170 0,02050 1644 79348 1109892 13,84
74 78526 0,02256 1771 77641 1030544 13,12
75 76755 0,02492 1913 75799 952904 12,41
76 74842 0,02769 2072 73806 877105 11,72
77 72770 0,03097 2254 71643 803299 11,04
78 70516 0,03496 2465 69284 731656 10,38
79 68051 0,03982 2710 66696 662373 9,73
80 65341 0,04568 2984 63849 595677 9,12
81 62357 0,05259 3279 60718 531828 8,53
82 59078 0,06046 3572 57292 471110 7,97
83 55506 0,06899 3830 53591 413818 7,46
84 51676 0,07793 4027 49663 360227 6,97
85 47649 0,08713 4152 45573 310565 6,52
86 43497 0,09661 4202 41396 264992 6,09
87 39295 0,10659 4188 37201 223596 5,69
88 35107 0,11736 4120 33047 186395 5,31
89 30987 0,12916 4003 28986 153348 4,95
90 26984 0,14213 3835 25067 124362 4,61
91 23149 0,15631 3618 21340 99296 4,29
92 19531 0,17144 3349 17857 77956 3,99
93 16182 0,18753 3034 14665 60099 3,71
94 13148 0,20457 2690 11803 45434 3,46
95 10458 0,22256 2327 9295 33631 3,22
96 8131 0,24149 1964 7149 24337 2,99
97 6167 0,26133 1612 5361 17188 2,79
98 4555 0,28205 1284 3913 11827 2,60
99 3271 0,30361 993 2775 7914 2,42
100 2278 0,32597 743 1907 5139 2,26
Tablica A. TABLICA TRWANIA ŻYCIA 2018 (dok.) Table A. LIFE TABLE OF POLAND 2018 (cont.)

66
basic tables
Tablica B. SKRÓCONA TABLICA TRWANIA ŻYCIA 2018 Table B. ABRIDGED LIFE TABLE OF POLAND 2018
Mężczyźni Males Kobiety Females
x lx qx dx Lx Tx ex lx qx dx Lx Tx ex
Ogółem Total
0 100000 0,00421 421 99790 7384643 73,85 100000 0,00353 353 99824 8167929 81,68
1-4 99579 0,00067 67 398157 7284854 73,16 99647 0,00057 57 398458 8068106 80,97
5-9 99512 0,00048 48 497448 6886697 69,20 99590 0,00039 39 497851 7669648 77,01
10-14 99464 0,00074 74 497160 6389249 64,24 99551 0,00062 62 497613 7171798 72,04
15-19 99390 0,00247 245 496454 5892089 59,28 99489 0,00116 115 497187 6674185 67,08
20-24 99145 0,00442 438 494655 5395636 54,42 99374 0,00126 125 496545 6176998 62,16
25-29 98707 0,00532 525 492276 4900981 49,65 99249 0,00138 137 495916 5680454 57,23
30-34 98182 0,00705 692 489251 4408705 44,90 99112 0,00194 192 495112 5184538 52,31
35-39 97490 0,01002 977 485187 3919454 40,20 98920 0,00310 307 493892 4689426 47,41
40-44 96513 0,01578 1523 479004 3434268 35,58 98613 0,00510 503 491917 4195535 42,55
45-49 94990 0,02459 2336 469521 2955264 31,11 98110 0,00893 876 488541 3703618 37,75
50-54 92654 0,03879 3594 454912 2485743 26,83 97234 0,01471 1430 482876 3215077 33,07
55-59 89060 0,06188 5511 432386 2030831 22,80 95804 0,02563 2455 473416 2732201 28,52
60-64 83549 0,09375 7833 399185 1598446 19,13 93349 0,04084 3812 457755 2258786 24,20
65-69 75716 0,13434 10172 353890 1199261 15,84 89537 0,06140 5498 434774 1801031 20,11
70-74 65544 0,18066 11841 298830 845371 12,90 84039 0,09397 7897 401537 1366257 16,26
75-79 53703 0,25481 13684 234990 546542 10,18 76142 0,14708 11199 354384 964720 12,67
80-84 40019 0,36907 14770 163162 311552 7,79 64943 0,26029 16904 285058 610337 9,40
85+ 25249 1 25249 148390 148390 5,88 48039 1 48039 325279 325279 6,77
Miasta Urban areas
0 100000 0,00395 395 99803 7421133 74,21 100000 0,00328 328 99836 8164074 81,64
1-4 99605 0,00056 56 398278 7321331 73,50 99672 0,00056 56 398559 8064238 80,91
5-9 99549 0,00048 48 497640 6923053 69,54 99616 0,00036 36 497992 7665679 76,95
10-14 99501 0,00069 69 497347 6425413 64,58 99580 0,00065 65 497743 7167687 71,98
15-19 99432 0,00221 220 496722 5928066 59,62 99515 0,00105 104 497348 6669945 67,02
20-24 99212 0,00423 420 495047 5431344 54,74 99411 0,00136 135 496713 6172597 62,09
25-29 98792 0,00506 500 492746 4936297 49,97 99276 0,00142 141 496036 5675884 57,17
30-34 98292 0,00674 662 489884 4443551 45,21 99135 0,00204 202 495206 5179849 52,25
35-39 97630 0,00984 961 485933 3953667 40,50 98933 0,00330 326 493908 4684643 47,35
40-44 96669 0,01551 1499 479832 3467735 35,87 98607 0,00543 535 491823 4190735 42,50
45-49 95170 0,02435 2317 470484 2987903 31,40 98072 0,00948 930 488205 3698912 37,72
50-54 92853 0,03838 3564 455951 2517420 27,11 97142 0,01479 1437 482386 3210707 33,05
55-59 89289 0,06049 5401 433791 2061469 23,09 95705 0,02585 2474 472902 2728322 28,51
60-64 83888 0,09178 7699 401192 1627678 19,40 93231 0,04143 3863 457016 2255420 24,19
65-69 76189 0,13016 9917 356833 1226487 16,10 89368 0,06208 5548 433835 1798404 20,12
70-74 66272 0,17452 11566 303232 869654 13,12 83820 0,09536 7993 400192 1364569 16,28
75-79 54706 0,24813 13574 240255 566422 10,35 75827 0,14602 11072 352934 964378 12,72
80-84 41132 0,35748 14704 169069 326167 7,93 64755 0,25590 16571 285104 611444 9,44
85+ 26428 1 26428 157098 157098 5,94 48184 1 48184 326340 326340 6,77

67
tablice podstawowe
Mężczyźni Males Kobiety Females
x lx qx dx Lx Tx ex lx qx dx Lx Tx ex
Wieś Rural areas
0 100000 0,00458 458 99771 7323574 73,24 100000 0,00388 388 99806 8162566 81,63
1-4 99542 0,00082 82 397984 7223803 72,57 99612 0,000612 61 398310 8062760 80,94
5-9 99460 0,00049 49 497173 6825819 68,63 99551 0,000422 42 497647 7664451 76,99
10-14 99411 0,00080 80 496893 6328647 63,66 99509 0,000583 58 497423 7166804 72,02
15-19 99331 0,00276 274 496087 5831754 58,71 99451 0,001287 128 496958 6669381 67,06
20-24 99057 0,00463 459 494147 5335667 53,86 99323 0,001158 115 496307 6172423 62,14
25-29 98598 0,00566 558 491673 4841520 49,10 99208 0,00132 131 495736 5676116 57,21
30-34 98040 0,00750 735 488426 4349847 44,37 99077 0,001766 175 494970 5180381 52,29
35-39 97305 0,01033 1005 484182 3861422 39,68 98902 0,002791 276 493880 4685411 47,37
40-44 96300 0,01619 1559 477869 3377240 35,07 98626 0,004583 452 492088 4191531 42,50
45-49 94741 0,02492 2361 468193 2899372 30,60 98174 0,008098 795 489081 3699443 37,68
50-54 92380 0,03933 3633 453483 2431179 26,32 97379 0,014603 1422 483642 3210363 32,97
55-59 88747 0,06379 5661 430474 1977697 22,28 95957 0,025178 2416 474220 2726721 28,42
60-64 83086 0,09692 8053 396375 1547223 18,62 93541 0,03964 3708 459014 2252501 24,08
65-69 75033 0,14186 10644 349425 1150849 15,34 89833 0,059956 5386 436467 1793487 19,96
70-74 64389 0,19225 12379 291573 801424 12,45 84447 0,091087 7692 404116 1357020 16,07
75-79 52010 0,26647 13859 226083 509851 9,80 76755 0,148707 11414 357227 952904 12,41
80-84 38151 0,39113 14922 153270 283769 7,44 65341 0,270764 17692 285112 595677 9,12
85+ 23229 1 23229 130499 130499 5,62 47649 1 47649 310565 310565 6,52
Tablica B. SKRÓCONA TABLICA TRWANIA ŻYCIA 2018 (dok.) Table B. ABRIDGED LIFE TABLE OF POLAND 2018 (cont.)

68
basic tables
Tablica C. ŚREDNIE DALSZE TRWANIE ŻYCIA WEDŁUG WOJEWÓDZTW W 2018 R. Table C. LIFE EXPECTANCY IN POLAND BY VOIVODSHIPS IN 2018
Mężczyźni Males Kobiety Females
Według wieku by age
0 15 30 45 60 0 15 30 45 60
Ogółem Total 73,85 59,28 44,90 31,11 19,13 81,68 67,08 52,31 37,75 24,20
02 Dolnośląskie 73,23 58,73 44,40 30,62 18,86 81,27 66,72 51,96 37,46 24,08
04 Kujawsko-pomorskie 73,46 58,89 44,60 30,75 18,67 81,10 66,54 51,75 37,17 23,72
06 Lubelskie 73,47 58,91 44,55 30,86 18,96 82,29 67,77 52,99 38,42 24,71
08 Lubuskie 72,96 58,43 44,08 30,36 18,53 80,87 66,31 51,58 37,05 23,65
10 Łódzkie 72,00 57,52 43,24 29,85 18,44 80,71 66,11 51,38 36,96 23,67
12 Małopolskie 75,34 60,73 46,23 32,19 19,89 82,89 68,20 53,37 38,72 24,94
14 Mazowieckie 73,96 59,36 45,01 31,24 19,37 82,02 67,39 52,66 38,08 24,46
16 Opolskie 74,65 60,07 45,62 31,68 19,46 81,84 67,26 52,48 37,92 24,29
18 Podkarpackie 75,55 60,94 46,43 32,47 20,13 83,21 68,74 53,93 39,24 25,29
20 Podlaskie 74,08 59,62 45,17 31,39 19,39 82,68 68,10 53,31 38,69 24,99
22 Pomorskie 74,65 60,11 45,70 31,74 19,52 81,88 67,31 52,51 37,90 24,34
24 Śląskie 73,50 58,91 44,53 30,84 19,01 80,88 66,29 51,50 37,01 23,68
26 Świętokrzyskie 73,61 59,05 44,63 30,96 19,09 82,12 67,54 52,74 38,19 24,62
28 Warmińsko-mazurskie 72,54 58,06 43,79 30,15 18,34 81,60 67,00 52,23 37,67 24,12
30 Wielkopolskie 74,00 59,45 44,99 31,04 18,84 81,33 66,70 51,91 37,32 23,80
32 Zachodniopomorskie 73,55 59,03 44,66 30,77 18,77 81,21 66,64 51,88 37,34 23,90
Miasta Urban areas 74,21 59,62 45,21 31,40 19,40 81,64 67,02 52,25 37,72 24,19
02 Dolnośląskie 73,55 59,03 44,64 30,89 19,13 81,48 66,86 52,08 37,59 24,24
04 Kujawsko-pomorskie 73,67 59,05 44,70 30,91 18,96 81,31 66,73 51,94 37,38 23,96
06 Lubelskie 74,62 60,06 45,58 31,77 19,67 82,61 68,12 53,36 38,82 25,07
08 Lubuskie 73,58 59,02 44,58 30,76 18,84 81,10 66,49 51,79 37,28 23,87
10 Łódzkie 72,00 57,51 43,27 29,94 18,55 80,46 65,84 51,14 36,77 23,56
12 Małopolskie 75,87 61,25 46,74 32,68 20,32 82,97 68,21 53,38 38,73 24,98
14 Mazowieckie 74,79 60,16 45,76 31,89 19,84 82,25 67,60 52,85 38,28 24,67
16 Opolskie 74,79 60,18 45,78 31,88 19,69 82,10 67,55 52,77 38,21 24,64
18 Podkarpackie 76,61 61,98 47,45 33,43 20,97 83,53 69,07 54,30 39,65 25,80
20 Podlaskie 75,13 60,63 46,10 32,19 19,93 82,72 68,18 53,40 38,79 25,13
22 Pomorskie 75,13 60,54 46,06 32,05 19,85 82,18 67,59 52,78 38,16 24,59
24 Śląskie 73,40 58,83 44,44 30,80 19,08 80,78 66,18 51,41 36,95 23,69
26 Świętokrzyskie 74,66 60,06 45,63 31,85 19,72 82,28 67,63 52,82 38,29 24,81
28 Warmińsko-mazurskie 73,59 59,04 44,67 30,94 19,03 82,10 67,48 52,72 38,15 24,53
30 Wielkopolskie 74,46 59,84 45,35 31,40 19,16 81,59 66,94 52,12 37,56 24,08
32 Zachodniopomorskie 74,00 59,39 44,98 31,05 19,05 81,50 66,94 52,18 37,64 24,15
Wieś Rural areas 73,24 58,71 44,37 30,60 18,62 81,63 67,06 52,29 37,68 24,08
02 Dolnośląskie 72,46 57,98 43,73 29,91 18,12 80,70 66,29 51,56 37,06 23,61
04 Kujawsko-pomorskie 73,09 58,60 44,33 30,43 18,18 80,70 66,16 51,37 36,78 23,28

69
tablice podstawowe
Mężczyźni Males Kobiety Females
Według wieku by age
0 15 30 45 60 0 15 30 45 60
06 Lubelskie 72,54 57,98 43,70 30,11 18,35 82,03 67,48 52,69 38,09 24,43
08 Lubuskie 71,82 57,34 43,12 29,56 17,87 80,31 65,81 51,04 36,48 23,10
10 Łódzkie 71,97 57,51 43,19 29,70 18,23 81,23 66,66 51,90 37,40 23,93
12 Małopolskie 74,79 60,20 45,71 31,69 19,43 82,83 68,19 53,38 38,73 24,89
14 Mazowieckie 72,53 57,99 43,69 30,11 18,48 81,56 66,99 52,25 37,66 24,03
16 Opolskie 74,47 59,92 45,42 31,44 19,18 81,56 66,95 52,17 37,59 23,91
18 Podkarpackie 74,80 60,21 45,71 31,79 19,52 83,02 68,53 53,69 38,98 24,98
20 Podlaskie 72,67 58,23 43,93 30,33 18,68 82,74 68,09 53,27 38,65 24,88
22 Pomorskie 73,64 59,14 44,81 30,96 18,66 81,09 66,55 51,75 37,18 23,62
24 Śląskie 73,78 59,17 44,79 30,93 18,76 81,29 66,67 51,85 37,26 23,69
26 Świętokrzyskie 72,75 58,23 43,83 30,22 18,53 82,02 67,48 52,69 38,12 24,45
28 Warmińsko-mazurskie 71,09 56,70 42,54 28,98 17,29 80,72 66,12 51,36 36,81 23,37
30 Wielkopolskie 73,41 58,94 44,50 30,56 18,39 80,93 66,32 51,55 36,94 23,37
32 Zachodniopomorskie 72,48 58,11 43,81 30,02 17,98 80,37 65,80 51,03 36,50 23,17
Tablica C. ŚREDNIE DALSZE TRWANIE ŻYCIA WEDŁUG WOJEWÓDZTW W 2018 R. (dok.) Table C. LIFE EXPECTANCY IN POLAND BY VOIVODSHIPS IN 2018 (cont.)

70
basic tables
Tablica D. ŚREDNIE DALSZE TRWANIE ŻYCIA WEDŁUG PODREGIONÓW W 2018 R. Table D. LIFE EXPECTANCY IN POLAND BY SUBREGIONS IN 2018
Mężczyźni Males Kobiety Females
Według wieku by age
0 15 30 45 60 0 15 30 45 60
1 Jeleniogórski 72,1 57,6 43,3 29,6 17,9 81,1 66,4 51,6 37,0 23,6
2 Legnicko-Głogowski 73,3 58,9 44,5 30,7 18,7 80,6 66,0 51,3 36,9 23,7
3 Wałbrzyski 72,3 57,7 43,4 29,8 18,2 80,6 66,1 51,3 36,9 23,7
4 Wrocławski 73,2 58,9 44,5 30,7 19,0 81,4 67,0 52,3 37,7 24,1
5 Miasto Wrocław 75,4 60,8 46,3 32,4 20,4 82,5 67,9 53,1 38,6 25,0
6 Bydgosko-Toruński 74,9 60,3 45,9 31,8 19,4 81,8 67,4 52,6 38,0 24,4
7 Grudziądzki 72,6 58,1 43,9 30,3 18,4 80,3 65,7 51,0 36,5 23,2
8 Włocławski 71,8 57,3 43,2 29,7 18,0 80,7 66,1 51,4 36,8 23,5
9 Bialski 72,3 57,8 43,5 29,8 18,1 82,0 67,4 52,6 37,9 24,1
10 Chełmsko-Zamojski 73,3 58,9 44,6 30,9 18,9 82,4 67,7 52,9 38,4 24,7
11 Lubelski 74,1 59,5 45,1 31,4 19,4 82,3 67,8 53,1 38,5 24,9
12 Puławski 73,5 58,8 44,4 30,7 18,9 82,4 68,0 53,2 38,5 24,7
13 Gorzowski 72,7 58,2 43,9 30,3 18,6 80,6 66,0 51,3 36,7 23,3
14 Zielonogórski 73,1 58,6 44,2 30,4 18,5 81,0 66,5 51,7 37,2 23,8
15 Łódzki 72,2 57,8 43,4 29,9 18,5 80,7 66,0 51,3 36,8 23,5
16 Miasto Łódź 72,0 57,5 43,2 30,0 18,7 80,2 65,7 51,0 36,6 23,6
17 Piotrkowski 71,5 57,0 42,8 29,6 18,1 81,1 66,4 51,7 37,2 23,8
18 Sieradzki 72,6 58,1 43,8 30,2 18,6 81,4 66,7 52,0 37,4 23,9
19 Skierniewicki 71,7 57,4 43,1 29,5 18,0 80,3 65,9 51,2 36,8 23,5
20 Krakowski 74,8 60,3 45,8 31,8 19,4 82,7 67,9 53,0 38,4 24,6
21 Miasto Kraków 76,7 62,1 47,5 33,3 20,8 83,2 68,4 53,6 39,0 25,2
22 Nowosądecki 75,8 61,1 46,5 32,4 20,0 83,0 68,3 53,5 38,9 25,0
23 Oświęcimski 73,9 59,3 44,9 31,0 19,0 82,1 67,5 52,6 38,0 24,4
24 Tarnowski 75,8 61,1 46,6 32,5 20,1 83,4 68,9 54,0 39,4 25,4
25 Ciechanowski 71,5 56,9 42,7 29,4 17,9 81,0 66,5 51,7 37,2 23,6
26 Ostrołęcki 72,9 58,3 44,0 30,3 18,6 82,3 67,6 52,8 38,3 24,5
27 Radomski 72,2 57,6 43,4 29,9 18,3 81,8 67,2 52,4 37,8 24,2
28 Miasto Warszawa 76,0 61,4 47,0 33,0 20,7 82,9 68,2 53,4 38,8 25,2
29 Warszawski Wschodni 74,0 59,3 44,8 31,0 19,0 81,7 67,1 52,3 37,7 24,0
30 Warszawski Zachodni 74,5 60,0 45,6 31,7 19,5 81,3 66,6 51,9 37,4 23,8
31 Nyski 73,4 58,8 44,4 30,5 18,4 81,3 66,7 52,0 37,4 23,7
32 Opolski 75,4 60,8 46,4 32,4 20,1 82,2 67,6 52,8 38,3 24,6
33 Krośnieński 76,0 61,4 46,8 32,8 20,2 83,1 68,5 53,7 39,0 25,2
34 Przemyski 74,4 59,8 45,4 31,5 19,4 82,9 68,2 53,3 38,6 24,7
35 Rzeszowski 76,3 61,7 47,1 33,1 20,7 83,4 69,0 54,2 39,5 25,5
36 Tarnobrzeski 75,2 60,6 46,1 32,2 19,9 83,3 69,0 54,2 39,5 25,6
37 Białostocki 75,2 60,5 46,0 32,1 20,1 82,6 68,0 53,2 38,5 24,8

71
tablice podstawowe
Mężczyźni Males Kobiety Females
Według wieku by age
0 15 30 45 60 0 15 30 45 60
38 Łomżyński 73,2 58,9 44,5 30,8 18,9 82,5 68,0 53,3 38,7 25,0
39 Suwalski 73,3 59,1 44,7 30,9 18,9 83,0 68,4 53,6 38,9 25,2
40 Gdański 74,7 60,1 45,7 31,7 19,3 81,6 67,0 52,2 37,5 23,9
41 Słupski 73,3 58,9 44,7 31,1 19,1 81,1 66,8 52,0 37,5 24,1
42 Starogardzki 73,5 58,9 44,5 30,5 18,4 81,4 66,8 52,0 37,4 23,9
43 Trójmiejski 75,8 61,2 46,7 32,6 20,3 82,5 68,0 53,1 38,5 24,9
44 Bielski 74,2 59,6 45,1 31,2 19,0 81,7 67,1 52,3 37,7 24,2
45 Bytomski 73,7 59,0 44,7 30,9 19,0 80,6 66,0 51,2 36,7 23,5
46 Częstochowski 72,9 58,2 43,9 30,5 18,8 80,9 66,2 51,4 37,0 23,6
47 Gliwicki 74,5 59,8 45,4 31,6 19,8 80,8 66,3 51,5 37,0 23,7
48 Katowicki 72,8 58,3 44,0 30,3 18,6 80,3 65,9 51,1 36,7 23,4
49 Rybnicki 73,9 59,3 44,9 31,1 19,0 81,2 66,8 52,0 37,4 23,9
50 Sosnowiecki 72,2 57,8 43,6 30,2 18,7 80,4 65,7 51,0 36,5 23,4
51 Tyski 74,6 59,9 45,4 31,6 19,5 81,2 66,5 51,7 37,2 23,6
52 Kielecki 73,8 59,2 44,8 31,1 19,3 82,2 67,5 52,7 38,2 24,7
53 Sandomiersko-Jędrzejowski 73,3 58,8 44,4 30,7 18,8 82,1 67,5 52,7 38,1 24,4
54 Elbląski 72,2 57,8 43,5 29,9 18,1 80,8 66,3 51,6 37,0 23,5
55 Ełcki 72,7 58,2 43,8 30,3 18,4 82,2 67,5 52,7 38,2 24,6
56 Olsztyński 72,7 58,3 44,0 30,4 18,5 82,0 67,4 52,6 38,0 24,4
57 Kaliski 73,2 58,7 44,4 30,7 18,7 81,1 66,5 51,7 37,1 23,7
58 Koniński 73,6 58,9 44,4 30,7 18,6 81,0 66,4 51,6 37,1 23,6
59 Leszczyński 74,0 59,5 45,0 31,0 18,7 81,0 66,5 51,7 37,1 23,5
60 Pilski 73,5 59,1 44,6 30,6 18,4 80,4 65,8 51,1 36,5 23,1
61 Poznański 73,9 59,5 45,0 30,9 18,5 81,3 66,7 51,9 37,2 23,6
62 Miasto Poznań 75,7 61,0 46,5 32,4 20,1 82,6 67,9 53,0 38,4 24,9
63 Koszaliński 73,8 59,3 44,9 31,1 19,1 81,7 67,1 52,3 37,9 24,4
64 Szczecinecko-Pyrzycki 72,8 58,3 44,0 30,3 18,4 80,7 66,2 51,4 37,0 23,7
65 Miasto Szczecin 74,3 59,7 45,3 31,3 19,2 81,2 66,8 52,0 37,4 24,0
66 Szczeciński 73,3 58,8 44,4 30,4 18,3 81,2 66,5 51,7 37,1 23,5
67 Inowrocławski 73,0 58,3 43,9 30,0 18,0 80,7 66,0 51,2 36,6 23,1
68 Świecki 73,8 59,2 44,9 31,0 18,7 81,0 66,3 51,5 37,0 23,5
69 Nowotarski 74,5 59,9 45,6 31,8 19,8 82,9 68,2 53,4 38,8 24,9
70 Płocki 72,2 57,8 43,5 29,9 18,1 80,7 66,2 51,4 36,9 23,4
71 Siedlecki 73,5 58,8 44,5 30,8 19,0 82,0 67,6 52,9 38,4 24,7
72 Chojnicki 74,3 59,8 45,4 31,6 19,3 81,7 66,9 52,1 37,5 23,9
73 Żyrardowski 71,9 57,1 42,8 29,3 17,9 80,8 66,3 51,5 37,0 23,5
Tablica D. ŚREDNIE DALSZE TRWANIE ŻYCIA WEDŁUG PODREGIONÓW W 2018 R. (dok.) Table D. LIFE EXPECTANCY IN POLAND BY SUBREGIONS IN 2018 (cont.)

72
basic tables
Tablica E. TABLICA TRWANIA ŻYCIA DLA OBU PŁCI ŁĄCZNIE 2018 Table E. LIFE TABLE FOR BOTH SEXES COMBINED IN 2018
WiekAge
Liczba dożywających
Number of survivors
Prawdopodo-bieństwo zgonu
Probability of dying
Liczba zmarłychNumber deceased
Ludność stacjonarna Przeciętne dalsze trwanie życia
Life expectancyw wieku x
at age xskumulowana
cumulated
x lx qx dx Lx Tx ex
0 100000 0,00388 388 99664 7763898 77,64
1 99612 0,00023 23 99601 7664234 76,94
2 99589 0,00018 18 99580 7564634 75,96
3 99571 0,00013 13 99565 7465054 74,97
4 99558 0,00009 9 99554 7365489 73,98
5 99549 0,00008 8 99545 7265936 72,99
6 99541 0,00009 9 99537 7166391 71,99
7 99532 0,00009 9 99528 7066854 71,00
8 99523 0,00008 8 99519 6967327 70,01
9 99515 0,00010 10 99510 6867808 69,01
10 99505 0,00010 10 99500 6768298 68,02
11 99495 0,00011 11 99490 6668798 67,03
12 99484 0,00013 13 99478 6569308 66,03
13 99471 0,00016 16 99463 6469831 65,04
14 99455 0,00018 18 99446 6370368 64,05
15 99437 0,00022 22 99426 6270922 63,06
16 99415 0,00029 29 99401 6171496 62,08
17 99386 0,00035 35 99369 6072095 61,10
18 99351 0,00045 45 99329 5972727 60,12
19 99306 0,00051 51 99281 5873398 59,14
20 99255 0,00055 55 99228 5774118 58,17
21 99200 0,00058 58 99171 5674890 57,21
22 99142 0,00057 57 99114 5575719 56,24
23 99085 0,00059 58 99056 5476606 55,27
24 99027 0,00060 59 98998 5377550 54,30
25 98968 0,00061 60 98938 5278552 53,34
26 98908 0,00065 64 98876 5179614 52,37
27 98844 0,00068 67 98811 5080738 51,40
28 98777 0,00072 71 98742 4981928 50,44
29 98706 0,00076 75 98669 4883186 49,47
30 98631 0,00081 80 98591 4784518 48,51
31 98551 0,00084 83 98510 4685927 47,55
32 98468 0,00092 91 98423 4587417 46,59
33 98377 0,00097 95 98330 4488995 45,63
34 98282 0,00102 100 98232 4390665 44,67
35 98182 0,00110 108 98128 4292433 43,72

73
tablice podstawowe
WiekAge
Liczba dożywających
Number of survivors
Prawdopodo-bieństwo zgonu
Probability of dying
Liczba zmarłychNumber deceased
Ludność stacjonarna Przeciętne dalsze trwanie życia
Life expectancyw wieku x
at age xskumulowana
cumulated
x lx qx dx Lx Tx ex
36 98074 0,00120 118 98015 4194305 42,77
37 97956 0,00131 128 97892 4096290 41,82
38 97828 0,00145 142 97757 3998398 40,87
39 97686 0,00161 157 97608 3900641 39,93
40 97529 0,00176 172 97443 3803034 38,99
41 97357 0,00192 187 97264 3705591 38,06
42 97170 0,00209 203 97069 3608327 37,13
43 96967 0,00230 223 96856 3511259 36,21
44 96744 0,00251 243 96623 3414403 35,29
45 96501 0,00278 268 96367 3317781 34,38
46 96233 0,00307 295 96086 3221414 33,48
47 95938 0,00337 323 95777 3125328 32,58
48 95615 0,00372 356 95437 3029552 31,68
49 95259 0,00405 386 95066 2934115 30,80
50 94873 0,00447 424 94661 2839049 29,92
51 94449 0,00487 460 94219 2744388 29,06
52 93989 0,00536 504 93737 2650169 28,20
53 93485 0,00590 552 93209 2556432 27,35
54 92933 0,00653 607 92630 2463223 26,51
55 92326 0,00722 667 91993 2370593 25,68
56 91659 0,00801 734 91292 2278601 24,86
57 90925 0,00884 804 90523 2187309 24,06
58 90121 0,00972 876 89683 2096786 23,27
59 89245 0,01063 949 88771 2007103 22,49
60 88296 0,01157 1022 87785 1918332 21,73
61 87274 0,01257 1097 86726 1830547 20,97
62 86177 0,01361 1173 85591 1743822 20,24
63 85004 0,01476 1255 84377 1658231 19,51
64 83749 0,01598 1338 83080 1573855 18,79
65 82411 0,01725 1422 81700 1490775 18,09
66 80989 0,01856 1503 80238 1409075 17,40
67 79486 0,01993 1584 78694 1328837 16,72
68 77902 0,02132 1661 77072 1250143 16,05
69 76241 0,02280 1738 75372 1173072 15,39
70 74503 0,02433 1813 73597 1097700 14,73
71 72690 0,02604 1893 71744 1024103 14,09
Tablica E. TABLICA TRWANIA ŻYCIA DLA OBU PŁCI ŁĄCZNIE 2018 (cd.) Table E. LIFE TABLE FOR BOTH SEXES COMBINED IN 2018 (cont.)

74
basic tables
WiekAge
Liczba dożywających
Number of survivors
Prawdopodo-bieństwo zgonu
Probability of dying
Liczba zmarłychNumber deceased
Ludność stacjonarna Przeciętne dalsze trwanie życia
Life expectancyw wieku x
at age xskumulowana
cumulated
x lx qx dx Lx Tx ex
72 70797 0,02797 1980 69807 952360 13,45
73 68817 0,03012 2073 67781 882553 12,82
74 66744 0,03253 2171 65659 814772 12,21
75 64573 0,03517 2271 63438 749114 11,60
76 62302 0,03815 2377 61114 685676 11,01
77 59925 0,04149 2486 58682 624563 10,42
78 57439 0,04537 2606 56136 565881 9,85
79 54833 0,04997 2740 53463 509745 9,30
80 52093 0,05538 2885 50651 456282 8,76
81 49208 0,06178 3040 47688 405631 8,24
82 46168 0,06907 3189 44574 357943 7,75
83 42979 0,07697 3308 41325 313370 7,29
84 39671 0,08523 3381 37981 272045 6,86
85 36290 0,09361 3397 34592 234064 6,45
86 32893 0,10221 3362 31212 199473 6,06
87 29531 0,11110 3281 27891 168261 5,70
88 26250 0,12065 3167 24667 140370 5,35
89 23083 0,13118 3028 21569 115704 5,01
90 20055 0,14266 2861 18625 94135 4,69
91 17194 0,15534 2671 15859 75510 4,39
92 14523 0,16890 2453 13297 59652 4,11
93 12070 0,18326 2212 10964 46355 3,84
94 9858 0,19862 1958 8879 35391 3,59
95 7900 0,21468 1696 7052 26512 3,36
96 6204 0,23162 1437 5486 19460 3,14
97 4767 0,24963 1190 4172 13975 2,93
98 3577 0,26838 960 3097 9803 2,74
99 2617 0,28773 753 2241 6706 2,56
100 1864 0,30848 575 1577 4465 2,40
Tablica E. TABLICA TRWANIA ŻYCIA DLA OBU PŁCI ŁĄCZNIE 2018 (dok.) Table E. LIFE TABLE FOR BOTH SEXES COMBINED IN 2018 (cont.)

75
tablice podstawowe
Tablica F. ŚREDNIE DALSZE TRWANIE ŻYCIA MĘŻCZYZN I KOBIET ŁĄCZNIE8 W 2018 R. (Liczba miesięcy dalszego trwania życia według wieku) Table F. LIFE EXPECTANCY FOR BOTH SEXES COMBINED8 IN 2018 (Expected months of future life by age)
Ukończone lata życia
Age in complited
years
Miesiące ukończone powyżej pełnego roku życia Months above full year of age
0 1 2 3 4 5 6 7 8 9 10 11
30 582,1 581,2 580,2 579,2 578,3 577,3 576,3 575,4 574,4 573,5 572,5 571,5
31 570,6 569,6 568,7 567,7 566,7 565,8 564,8 563,9 562,9 561,9 561,0 560,0
32 559,1 558,1 557,1 556,2 555,2 554,3 553,3 552,4 551,4 550,4 549,5 548,5
33 547,6 546,6 545,7 544,7 543,7 542,8 541,8 540,9 539,9 539,0 538,0 537,0
34 536,1 535,1 534,2 533,2 532,3 531,3 530,4 529,4 528,4 527,5 526,5 525,6
35 524,6 523,7 522,7 521,8 520,8 519,9 518,9 518,0 517,0 516,1 515,1 514,2
36 513,2 512,3 511,3 510,4 509,4 508,5 507,5 506,6 505,6 504,7 503,7 502,8
37 501,8 500,9 499,9 499,0 498,0 497,1 496,1 495,2 494,2 493,3 492,4 491,4
38 490,5 489,5 488,6 487,6 486,7 485,8 484,8 483,9 482,9 482,0 481,0 480,1
39 479,2 478,2 477,3 476,4 475,4 474,5 473,5 472,6 471,7 470,7 469,8 468,9
40 467,9 467,0 466,1 465,1 464,2 463,3 462,3 461,4 460,5 459,5 458,6 457,7
41 456,7 455,8 454,9 454,0 453,0 452,1 451,2 450,2 449,3 448,4 447,5 446,5
42 445,6 444,7 443,8 442,8 441,9 441,0 440,1 439,1 438,2 437,3 436,4 435,5
43 434,5 433,6 432,7 431,8 430,9 429,9 429,0 428,1 427,2 426,3 425,4 424,4
44 423,5 422,6 421,7 420,8 419,9 419,0 418,0 417,1 416,2 415,3 414,4 413,5
45 412,6 411,7 410,8 409,9 408,9 408,0 407,1 406,2 405,3 404,4 403,5 402,6
46 401,7 400,8 399,9 399,0 398,1 397,2 396,3 395,4 394,5 393,6 392,7 391,8
47 390,9 390,0 389,1 388,2 387,4 386,5 385,6 384,7 383,8 382,9 382,0 381,1
48 380,2 379,3 378,5 377,6 376,7 375,8 374,9 374,0 373,2 372,3 371,4 370,5
49 369,6 368,7 367,9 367,0 366,1 365,2 364,4 363,5 362,6 361,7 360,9 360,0
50 359,1 358,2 357,4 356,5 355,6 354,8 353,9 353,0 352,2 351,3 350,4 349,5
51 348,7 347,8 347,0 346,1 345,2 344,4 343,5 342,7 341,8 340,9 340,1 339,2
52 338,4 337,5 336,7 335,8 335,0 334,1 333,3 332,4 331,6 330,7 329,9 329,0
53 328,2 327,3 326,5 325,6 324,8 323,9 323,1 322,3 321,4 320,6 319,7 318,9
54 318,1 317,2 316,4 315,6 314,7 313,9 313,1 312,3 311,4 310,6 309,8 308,9
55 308,1 307,3 306,5 305,7 304,8 304,0 303,2 302,4 301,6 300,8 299,9 299,1
56 298,3 297,5 296,7 295,9 295,1 294,3 293,5 292,7 291,9 291,1 290,3 289,5
57 288,7 287,9 287,1 286,3 285,5 284,7 283,9 283,1 282,4 281,6 280,8 280,0
58 279,2 278,4 277,6 276,9 276,1 275,3 274,5 273,8 273,0 272,2 271,4 270,7
59 269,9 269,1 268,4 267,6 266,8 266,1 265,3 264,5 263,8 263,0 262,2 261,5
60 260,7 260,0 259,2 258,5 257,7 257,0 256,2 255,5 254,7 254,0 253,2 252,4
61 251,7 251,0 250,2 249,5 248,7 248,0 247,3 246,5 245,8 245,0 244,3 243,6
62 242,8 242,1 241,4 240,6 239,9 239,2 238,5 237,7 237,0 236,3 235,5 234,8
8 Uwaga: tablica obliczona zgodnie z wymaganiami art. 26 ust. 4 ustawy z dnia 17 grudnia 1998 r. o emeryturach i rentach z Funduszu Ubezpieczeń Społecznych (Dz. U. z 2018 r. poz. 1270 i 2245 oraz z 2019 r. poz. 39)
Note: table calculated accordingly with the 26th article p. 4 of the national law of 17.XII.1998 on pensions and retirement pay from Social Insurance Fund. (Journal of Laws of 2018, item 1270 and 2245; Journal of Laws of 2019, item 39)

76
basic tables
Ukończone lata życia
Age in complited
years
Miesiące ukończone powyżej pełnego roku życia Months above full year of age
0 1 2 3 4 5 6 7 8 9 10 11
63 234,1 233,4 232,7 231,9 231,2 230,5 229,8 229,1 228,4 227,7 226,9 226,2
64 225,5 224,8 224,1 223,4 222,7 222,0 221,3 220,6 219,9 219,2 218,5 217,8
65 217,1 216,4 215,7 215,0 214,3 213,6 212,9 212,2 211,5 210,9 210,2 209,5
66 208,8 208,1 207,4 206,7 206,1 205,4 204,7 204,0 203,3 202,7 202,0 201,3
67 200,6 199,9 199,3 198,6 197,9 197,3 196,6 195,9 195,3 194,6 193,9 193,2
68 192,6 191,9 191,2 190,6 189,9 189,3 188,6 187,9 187,3 186,6 186,0 185,3
69 184,6 184,0 183,3 182,7 182,0 181,4 180,7 180,1 179,4 178,8 178,1 177,5
70 176,8 176,2 175,5 174,9 174,2 173,6 172,9 172,3 171,6 171,0 170,4 169,7
71 169,1 168,4 167,8 167,2 166,5 165,9 165,2 164,6 164,0 163,3 162,7 162,1
72 161,4 160,8 160,2 159,5 158,9 158,3 157,7 157,0 156,4 155,8 155,2 154,5
73 153,9 153,3 152,7 152,0 151,4 150,8 150,2 149,6 149,0 148,3 147,7 147,1
74 146,5 145,9 145,3 144,7 144,1 143,5 142,9 142,2 141,6 141,0 140,4 139,8
75 139,2 138,6 138,0 137,4 136,8 136,2 135,6 135,0 134,4 133,9 133,3 132,7
76 132,1 131,5 130,9 130,3 129,7 129,2 128,6 128,0 127,4 126,8 126,2 125,7
77 125,1 124,5 123,9 123,4 122,8 122,2 121,6 121,1 120,5 119,9 119,4 118,8
78 118,2 117,7 117,1 116,6 116,0 115,4 114,9 114,3 113,8 113,2 112,7 112,1
79 111,6 111,0 110,5 109,9 109,4 108,9 108,3 107,8 107,3 106,7 106,2 105,6
80 105,1 104,6 104,1 103,6 103,0 102,5 102,0 101,5 101,0 100,5 99,9 99,4
81 98,9 98,4 97,9 97,4 97,0 96,5 96,0 95,5 95,0 94,5 94,0 93,5
82 93,0 92,6 92,1 91,7 91,2 90,7 90,3 89,8 89,3 88,9 88,4 88,0
83 87,5 87,1 86,6 86,2 85,8 85,3 84,9 84,5 84,0 83,6 83,2 82,7
84 82,3 81,9 81,5 81,1 80,7 80,3 79,8 79,4 79,0 78,6 78,2 77,8
85 77,4 77,0 76,6 76,2 75,9 75,5 75,1 74,7 74,3 73,9 73,5 73,2
86 72,8 72,4 72,0 71,7 71,3 70,9 70,6 70,2 69,8 69,5 69,1 68,7
87 68,4 68,0 67,7 67,3 67,0 66,6 66,3 65,9 65,6 65,2 64,9 64,5
88 64,2 63,8 63,5 63,2 62,8 62,5 62,2 61,8 61,5 61,2 60,8 60,5
89 60,1 59,8 59,5 59,2 58,9 58,6 58,2 57,9 57,6 57,3 57,0 56,6
90 56,3 56,0 55,7 55,4 55,1 54,8 54,5 54,2 53,9 53,6 53,3 53,0
Zawarte w powyższej tabeli parametry przeciętnego/średniego dalszego trwania życia (mężczyzn i kobiet łącznie) są ogłaszane Komunikatem Prezesa GUS w końcu marca każdego roku i obowiązującą przez kolejne 12 miesięcy. Są one wykorzystywane przez Zakład Ubezpieczeń Społecznych do ustalenia wysokości emerytury kapitałowej. W celu prawidłowej interpretacji wartości przedstawionych w tabeli, zamieszczamy dodatkowe wyjaśnienia jak należy odczytywać zawarte w niej informacje.
Tablica F. ŚREDNIE DALSZE TRWANIE ŻYCIA MĘŻCZYZN I KOBIET ŁĄCZNIE8 W 2018 R. (Liczba miesięcy dalszego trwania życia według wieku) (dok.) Table F. LIFE EXPECTANCY FOR BOTH SEXES COMBINED8 IN 2018 (Expected months of future life by age) (cont.)
8 Uwaga: tablica obliczona zgodnie z wymaganiami art. 26 ust. 4 ustawy z dnia 17 grudnia 1998 r. o emeryturach i rentach z Funduszu Ubezpieczeń Społecznych (Dz. U. z 2018 r. poz. 1270 i 2245 oraz z 2019 r. poz. 39)
Note: table calculated accordingly with the 26th article p. 4 of the national law of 17.XII.1998 on pensions and retirement pay from Social Insurance Fund. (Journal of Laws of 2018, item 1270 and 2245; Journal of Laws of 2019, item 39)

77
tablice podstawowe
Dla prawidłowej interpretacji informacji zawartych w tabeli bardzo ważne jest zrozumienie, że wiek, w jakim dana osoba zamierza przejść na emeryturę, określa się w latach (boczek tabeli: „30”, „31”, …, „90”) i miesiącach (główka tabeli: „0”, „1”, …, „11”) ukończonych. Wartości podane w tabeli przedstawiają średnie dalsze trwanie życia w miesiącach osoby przechodzącej na emeryturę w określonym wieku.
Przykładowo:
Załóżmy że Pan X, który urodził się 1 czerwca 1954 r., planuje przejść na emeryturę z dniem 10 czerwca 2019 r. Będzie on miał zatem – w tym momencie – ukończonych dokładnie 65 lat i 0 miesięcy (czyli nie ukończy jeszcze 65 lat i 1 miesiąca), dlatego też wielkość przeciętnego dalszego trwania życia należy odczytać z komórki znajdującej się na skrzyżowaniu wiersza tabeli, w którego boczku znajduje się liczba „65”, i kolumny o nagłówku „0”. Jest to wartość 217,1 oznaczająca oczekiwaną liczbę miesięcy dalszego życia dla Pana X, przy założeniu utrzymywania się umieralności na poziomie z danego roku. Zgodnie z tym założeniem, dla osoby w wieku dokładnie 65 lat, oczekiwane dalsze trwanie życia wynosi 217,1 miesięcy, czyli 18,1 lat, co oznacza, że osoba w tym wieku dożyłaby przeciętnie wieku 83,1 lat.
Z kolei Pani Y urodziła się 2 stycznia 1949 roku i planuje przejść na emeryturę 15 lipca 2019 r., kiedy to będzie miała ukończone 70 lat i 6 miesięcy (czyli nie ukończy jeszcze 70 lat i 7 miesięcy). Przeciętne dalsze trwanie życia dla jej wieku należy odczytać z komórki znajdującej się na skrzyżowaniu wiersza tabeli, w którego boczku znajduje się liczba „70”, i kolumny o nagłówku „6”. Wartość 172,9 oznacza oczekiwaną liczbę miesięcy dalszego życia Pani Y, przy założeniu utrzymywania się warunków umieralności na niezmiennym poziomie. Zatem dla osoby w wieku dokładnie 70 lat i 6 miesięcy oczekiwane dalsze trwanie życia wynosi 172,9 miesiąca, czyli 14,4 roku. Oznacza to, że osoba w tym wieku dożyłaby przeciętnie wieku 84,9 lat (przy założeniu utrzymywania się umieralności na poziomie z danego roku).
Na podstawie opisanych przykładów nie sposób nie zauważyć, że osoba w wieku 65 lat średnio dożyłaby wieku 83,1 lat, pod-czas gdy osoba w wieku 70 lat – 84,9 lat. Dla wielu może być niezrozumiałe, dlaczego dla osoby młodszej przeciętne trwanie życia jest krótsze, niż dla osoby starszej. Jest to konsekwencja metodologii stosowanej do obliczania średniego dalszego trwania życia, wynikająca z faktu, że przeżycie każdego kolejnego roku zwiększa szansę dożycia do coraz starszego wieku.