
The Hachett Group 2015 - Billtrustmktg.billtrust.com/rs/billtrust/images/AR-Show-AP-Love.pdf · ©...
39
Transcript of The Hachett Group 2015 - Billtrustmktg.billtrust.com/rs/billtrust/images/AR-Show-AP-Love.pdf · ©...


February 12, 2015
Bryan DeGraw, Senior Director
Hackett Advisory Webcast“How AR Can Show Invoicing Love to AP”
7© 2015 The Hackett Group, Inc. All rights reserved. Reproduction of this document or any portion thereof without prior written consent is prohibited.
Agenda
Who is The Hackett
Group?
What does AP and AR
have in Common?
AR Best Practices that
can help the AP
Process?
Benefits and
Challenges of
Automation
Process
Considerations
© 2014 The Hackett Group, Inc. All rights reserved. Reproduction of this document or any portion thereof without prior written consent is prohibited. 8
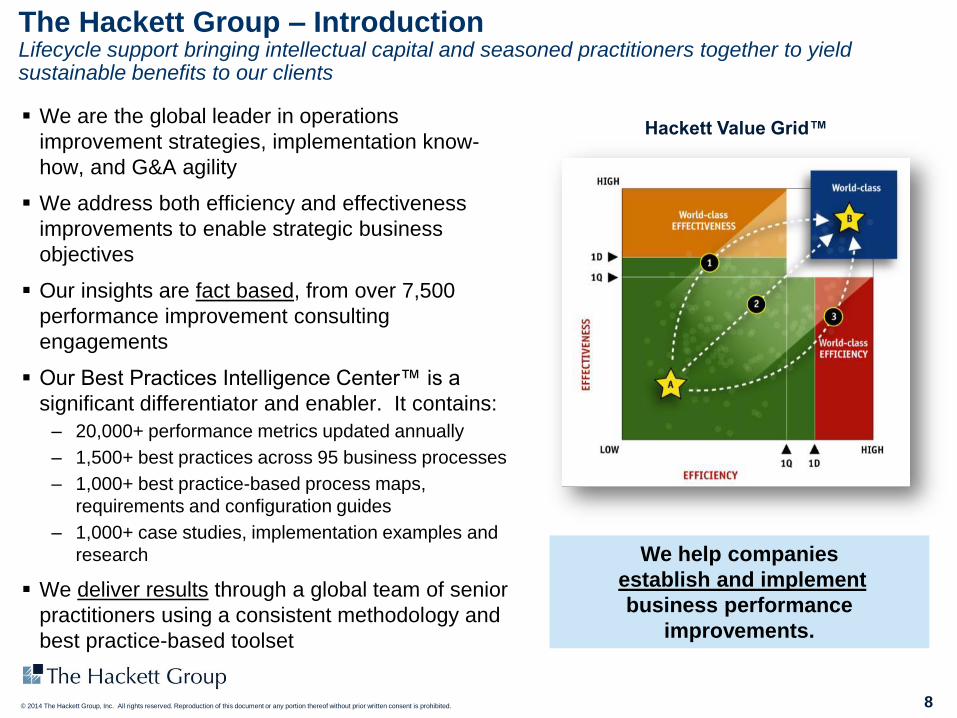
The Hackett Group – IntroductionLifecycle support bringing intellectual capital and seasoned practitioners together to yield sustainable benefits to our clients
We are the global leader in operations
improvement strategies, implementation know-
how, and G&A agility
We address both efficiency and effectiveness
improvements to enable strategic business
objectives
Our insights are fact based, from over 7,500
performance improvement consulting
engagements
Our Best Practices Intelligence Center™ is a
significant differentiator and enabler. It contains:
– 20,000+ performance metrics updated annually
– 1,500+ best practices across 95 business processes
– 1,000+ best practice-based process maps,
requirements and configuration guides
– 1,000+ case studies, implementation examples and
research
We deliver results through a global team of senior
practitioners using a consistent methodology and
best practice-based toolset
Hackett Value Grid™
We help companies
establish and implement
business performance
improvements.
9© 2015 The Hackett Group, Inc. All rights reserved. Reproduction of this document or any portion thereof without prior written consent is prohibited.
Agenda
Who is The Hackett
Group?
What does AP and AR
have in Common?
AR Best Practices that
can help the AP
Process?
Benefits and
Challenges of
Automation
Process
Considerations
10© 2015 The Hackett Group, Inc. All rights reserved. Reproduction of this document or any portion thereof without prior written consent is prohibited.
What do Accounts Payable and Account Receivable have in Common?
At first thought….absolutely nothing
11© 2015 The Hackett Group, Inc. All rights reserved. Reproduction of this document or any portion thereof without prior written consent is prohibited.
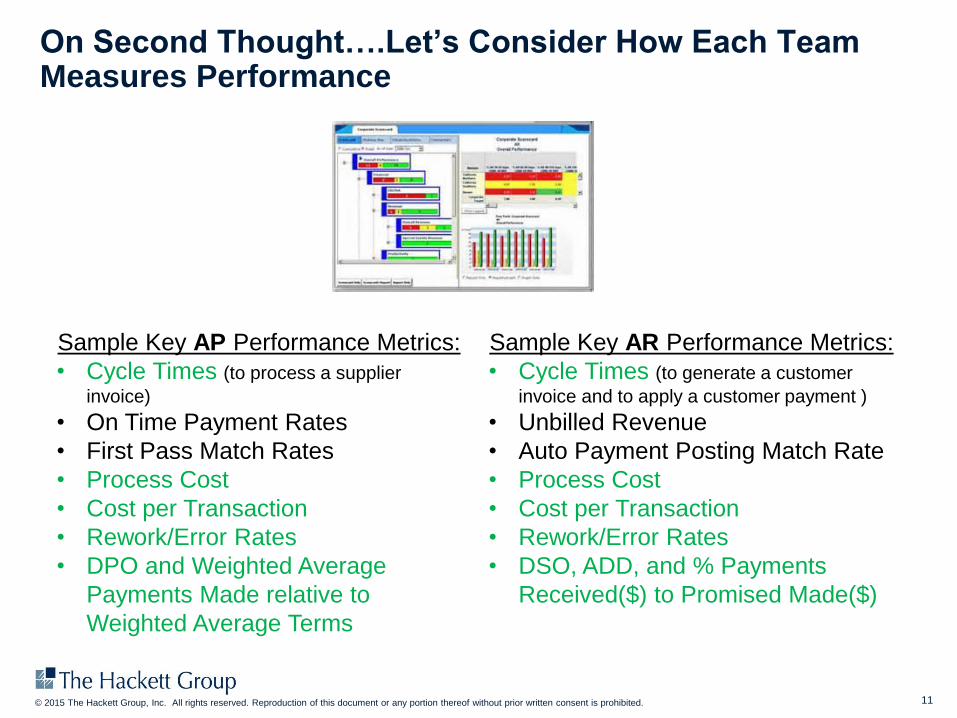
On Second Thought….Let’s Consider How Each Team Measures Performance
Sample Key AP Performance Metrics:
• Cycle Times (to process a supplier
invoice)
• On Time Payment Rates
• First Pass Match Rates
• Process Cost
• Cost per Transaction
• Rework/Error Rates
• DPO and Weighted Average
Payments Made relative to
Weighted Average Terms
Sample Key AR Performance Metrics:
• Cycle Times (to generate a customer
invoice and to apply a customer payment )
• Unbilled Revenue
• Auto Payment Posting Match Rate
• Process Cost
• Cost per Transaction
• Rework/Error Rates
• DSO, ADD, and % Payments
Received($) to Promised Made($)
12© 2015 The Hackett Group, Inc. All rights reserved. Reproduction of this document or any portion thereof without prior written consent is prohibited.
Agenda
Who is The Hackett
Group?
What does AP and AR
have in Common?
AR Best Practices that
can help the AP
Process?
Benefits and
Challenges of
Automation
Process
Considerations
13© 2015 The Hackett Group, Inc. All rights reserved. Reproduction of this document or any portion thereof without prior written consent is prohibited.
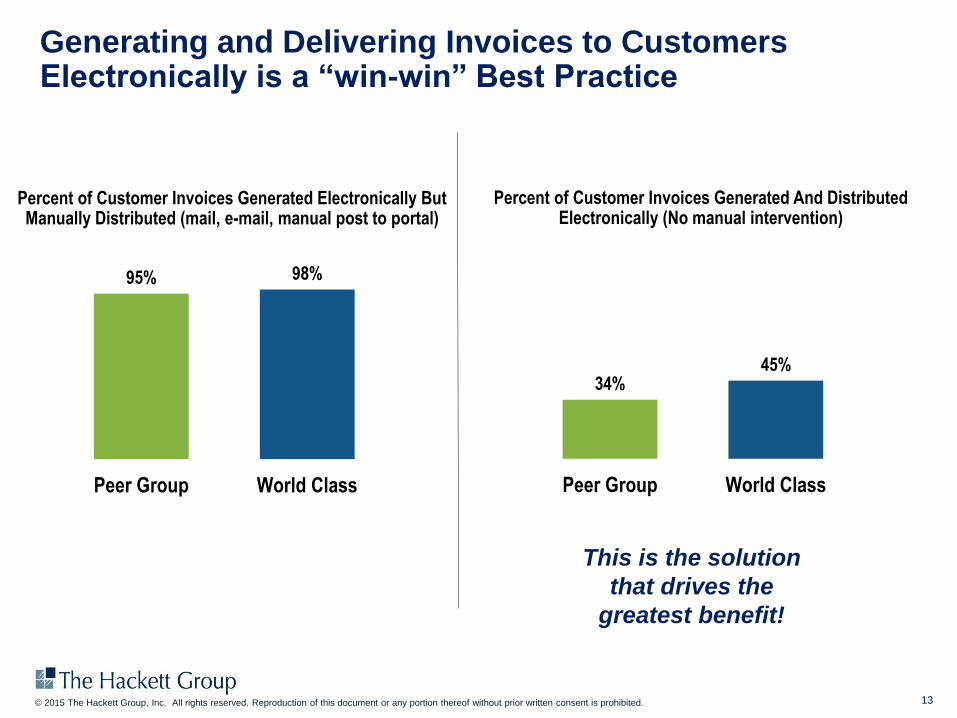
Generating and Delivering Invoices to Customers Electronically is a “win-win” Best Practice
95% 98%
Peer Group World Class
Percent of Customer Invoices Generated Electronically But Manually Distributed (mail, e-mail, manual post to portal)
34%45%
Peer Group World Class
Percent of Customer Invoices Generated And Distributed Electronically (No manual intervention)
This is the solution
that drives the
greatest benefit!
Hackett 2014 C2C Advisory Program | 14© 2014 The Hackett Group, Inc. All rights reserved. Reproduction of this document or any portion thereof without prior written consent is prohibited.
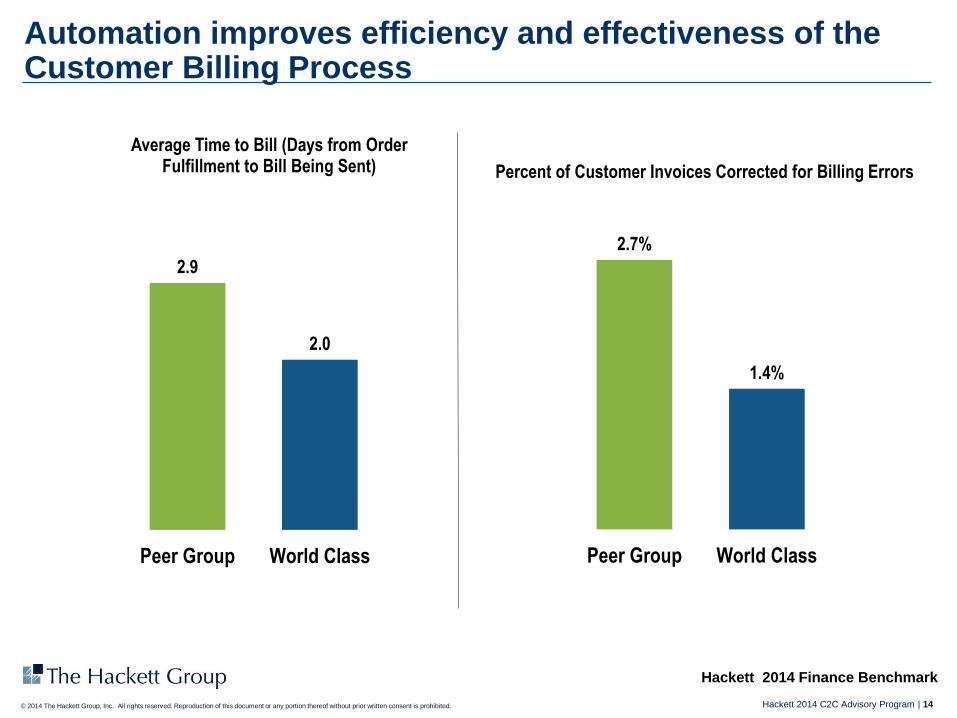
Average Time to Bill (Days from Order Fulfillment to Bill Being Sent)
2.9
2.0
Peer Group World Class
Automation improves efficiency and effectiveness of the Customer Billing Process
Hackett 2014 Finance Benchmark
Percent of Customer Invoices Corrected for Billing Errors
2.7%
1.4%
Peer Group World Class
Inquiry Response | 15© 2014 The Hackett Group, Inc. All rights reserved. Reproduction of this document or any portion thereof without prior written consent is prohibited.
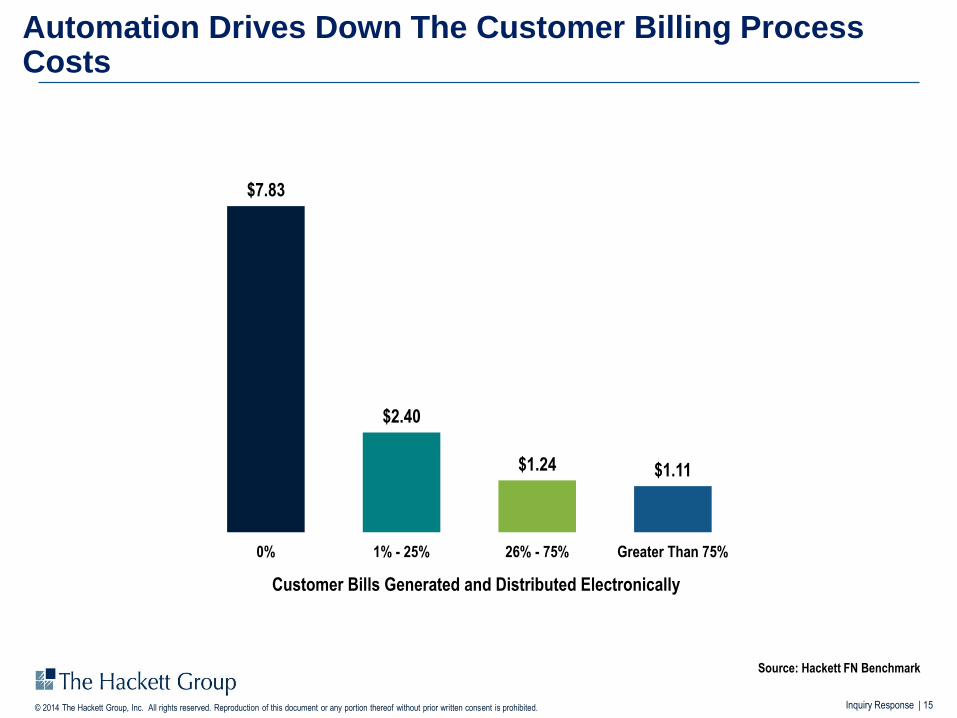
$7.83
$2.40
$1.24 $1.11
0% 1% - 25% 26% - 75% Greater Than 75%
Customer Bills Generated and Distributed Electronically
Source: Hackett FN Benchmark
Automation Drives Down The Customer Billing Process Costs
Inquiry Response | 16© 2014 The Hackett Group, Inc. All rights reserved. Reproduction of this document or any portion thereof without prior written consent is prohibited.
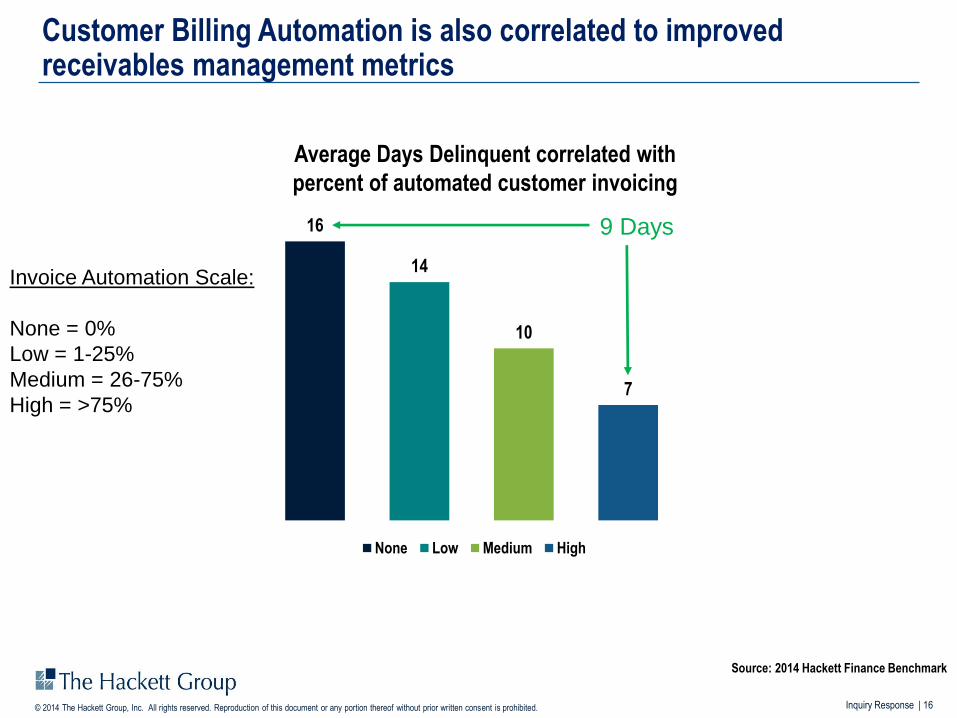
16
14
10
7
None Low Medium High
Customer Billing Automation is also correlated to improved receivables management metrics
Source: 2014 Hackett Finance Benchmark
Invoice Automation Scale:
None = 0%
Low = 1-25%
Medium = 26-75%
High = >75%
Average Days Delinquent correlated with
percent of automated customer invoicing
9 Days
Business Advisory Services | 17© 2014 The Hackett Group, Inc. All rights reserved. Reproduction of this document or any portion thereof without prior written consent is prohibited.
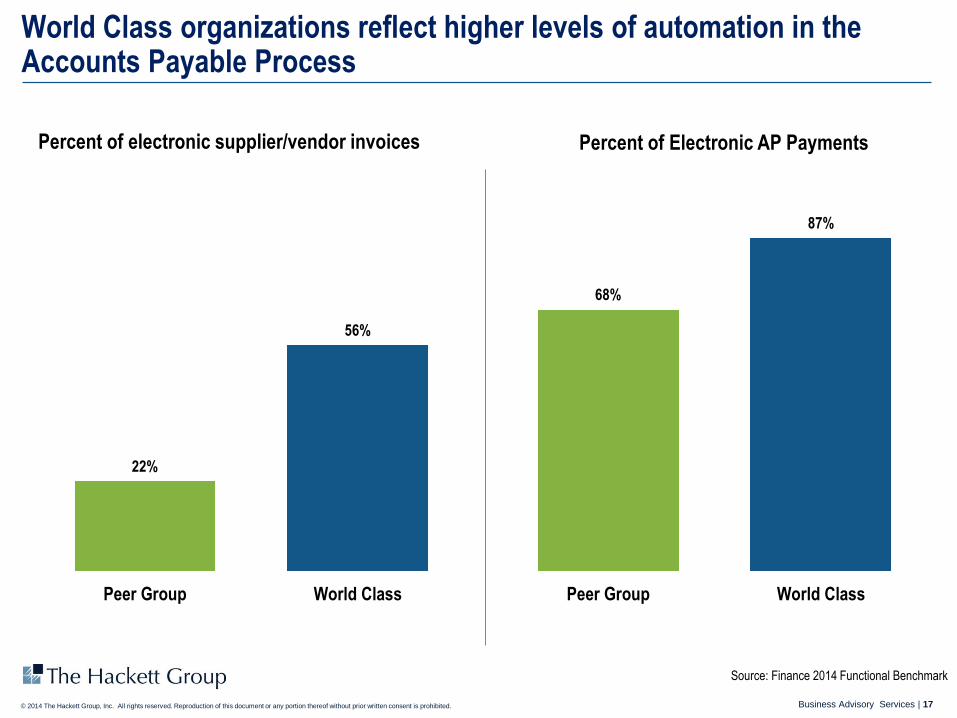
Percent of electronic supplier/vendor invoices
World Class organizations reflect higher levels of automation in the Accounts Payable Process
Percent of Electronic AP Payments
68%
87%
Peer Group World Class
Source: Finance 2014 Functional Benchmark
22%
56%
Peer Group World Class
Inquiry Response | 18© 2014 The Hackett Group, Inc. All rights reserved. Reproduction of this document or any portion thereof without prior written consent is prohibited.
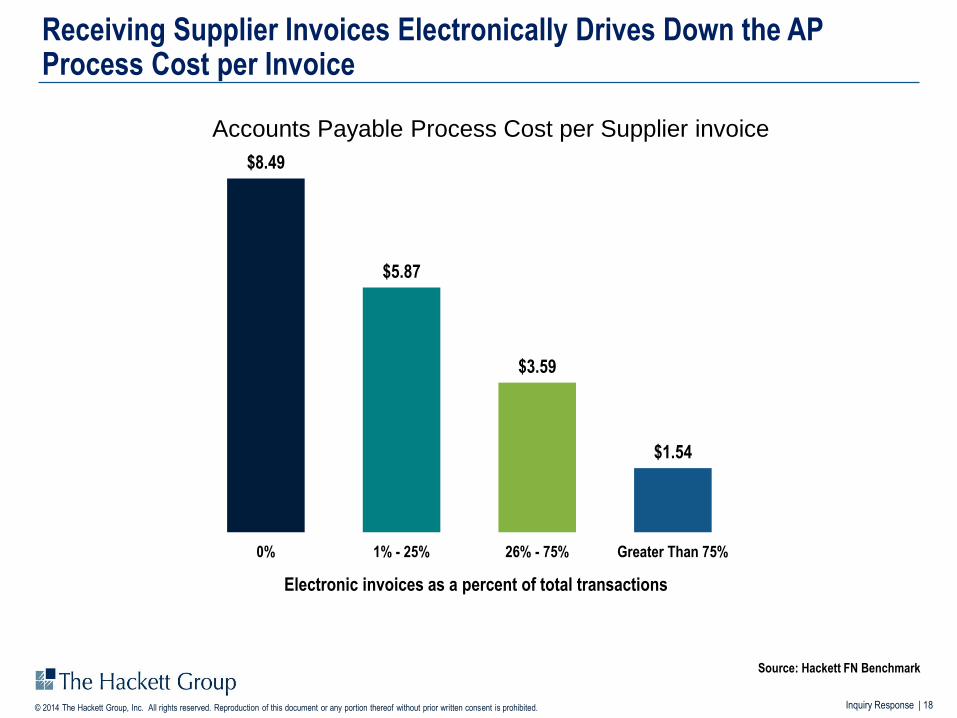
$8.49
$5.87
$3.59
$1.54
0% 1% - 25% 26% - 75% Greater Than 75%
Receiving Supplier Invoices Electronically Drives Down the AP Process Cost per Invoice
Electronic invoices as a percent of total transactions
Source: Hackett FN Benchmark
Accounts Payable Process Cost per Supplier invoice
Business Advisory Services | 19© 2014 The Hackett Group, Inc. All rights reserved. Reproduction of this document or any portion thereof without prior written consent is prohibited.
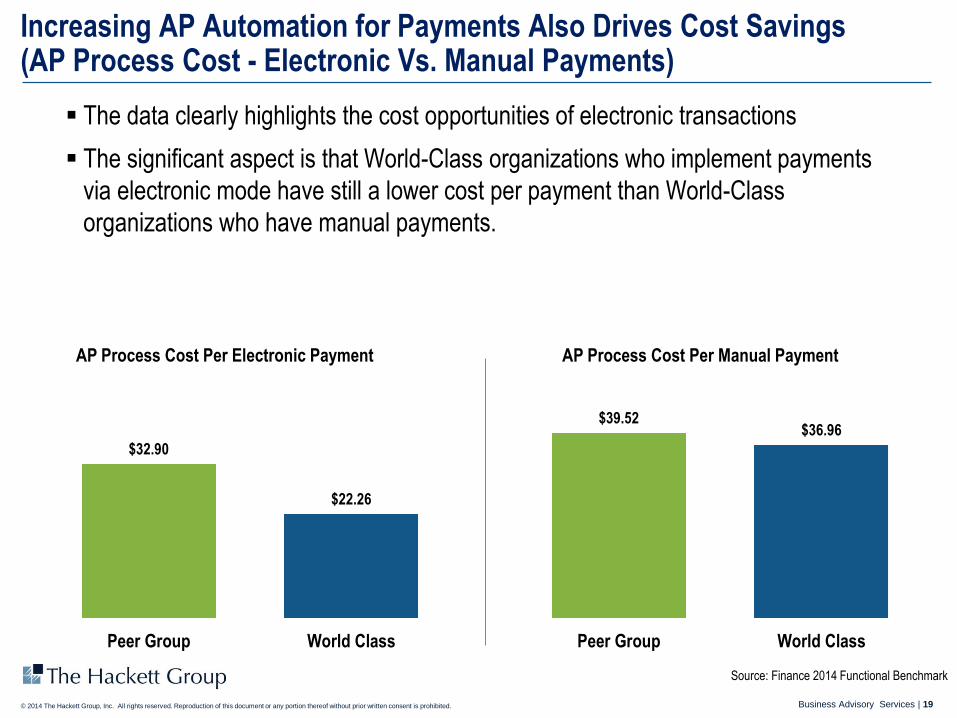
$32.90
$22.26
Peer Group World Class
AP Process Cost Per Electronic Payment
Increasing AP Automation for Payments Also Drives Cost Savings (AP Process Cost - Electronic Vs. Manual Payments)
The data clearly highlights the cost opportunities of electronic transactions
The significant aspect is that World-Class organizations who implement payments
via electronic mode have still a lower cost per payment than World-Class
organizations who have manual payments.
$39.52$36.96
Peer Group World Class
AP Process Cost Per Manual Payment
Source: Finance 2014 Functional Benchmark
Business Advisory Services | 20© 2014 The Hackett Group, Inc. All rights reserved. Reproduction of this document or any portion thereof without prior written consent is prohibited.
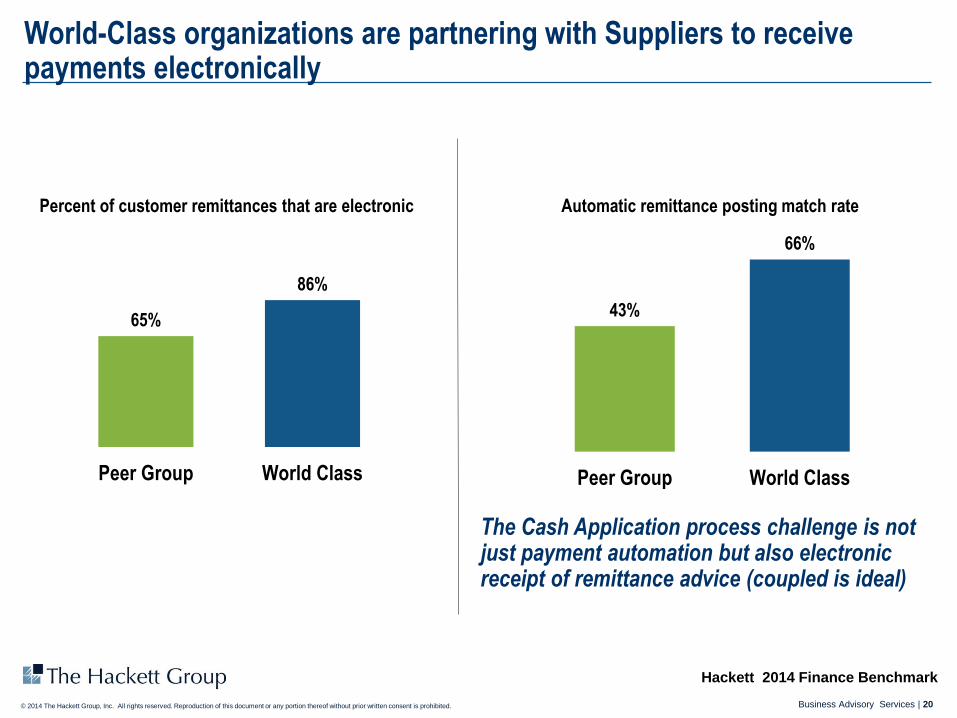
43%
66%
Peer Group World Class
World-Class organizations are partnering with Suppliers to receive payments electronically
Percent of customer remittances that are electronic Automatic remittance posting match rate
Hackett 2014 Finance Benchmark
65%
86%
Peer Group World Class
The Cash Application process challenge is not just payment automation but also electronic receipt of remittance advice (coupled is ideal)
Inquiry Response | 21© 2014 The Hackett Group, Inc. All rights reserved. Reproduction of this document or any portion thereof without prior written consent is prohibited.
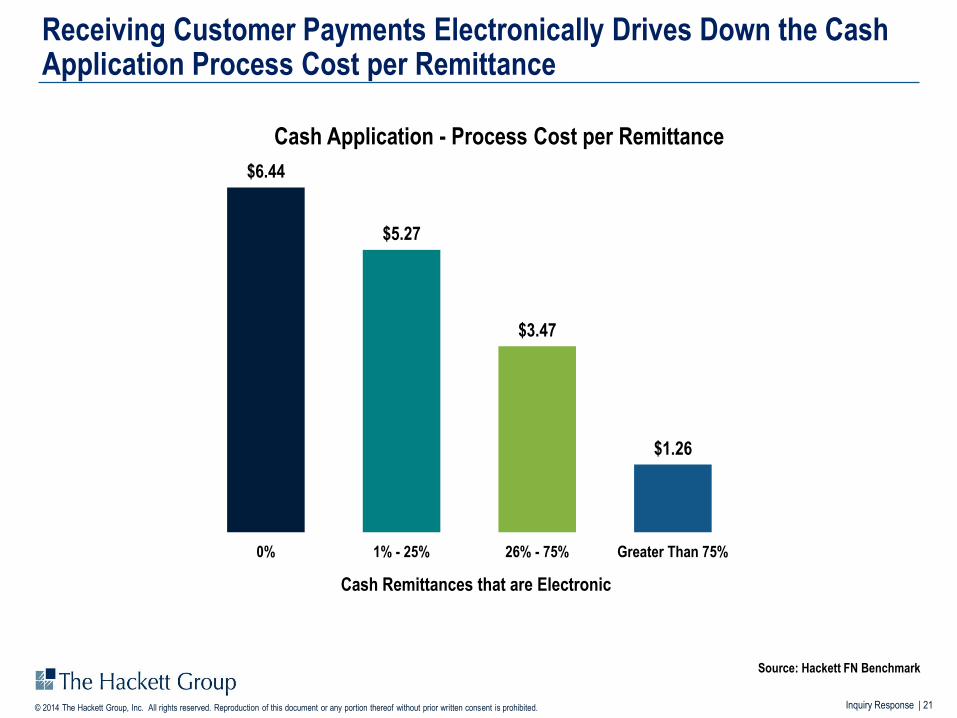
$6.44
$5.27
$3.47
$1.26
0% 1% - 25% 26% - 75% Greater Than 75%
Receiving Customer Payments Electronically Drives Down the Cash Application Process Cost per Remittance
Cash Remittances that are Electronic
Source: Hackett FN Benchmark
Cash Application - Process Cost per Remittance
© 2013 The Hackett Group, Inc. All rights reserved. Reproduction of this document or any portion thereof without prior written consent is prohibited.
@OPENSCAN #OPENUP2014
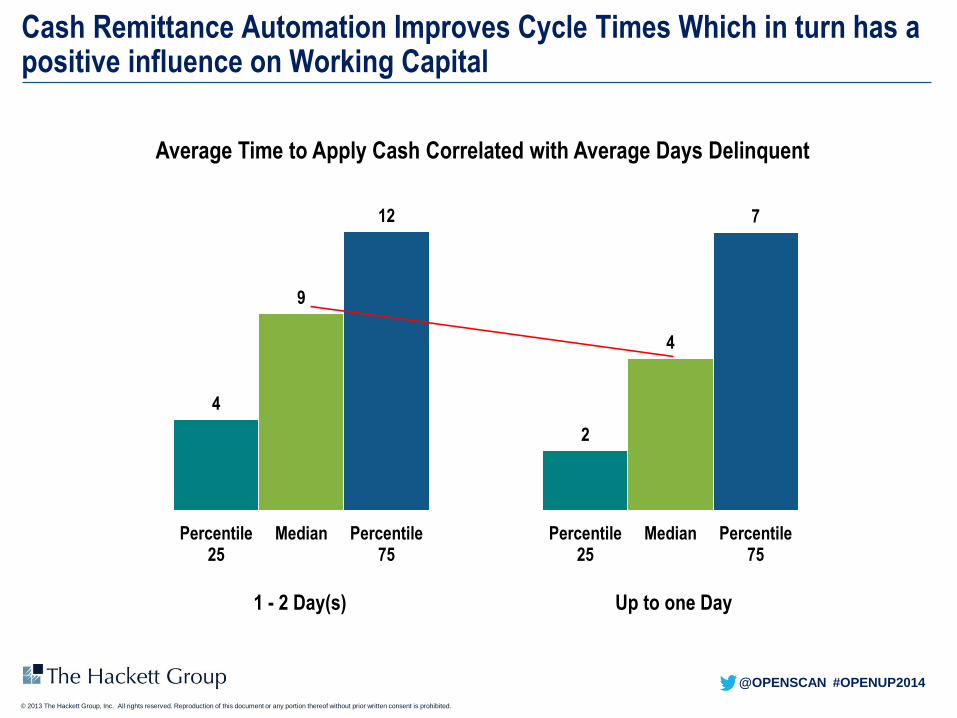
Cash Remittance Automation Improves Cycle Times Which in turn has a positive influence on Working Capital
2
4
7
Percentile25
Median Percentile75
4
9
12
Percentile25
Median Percentile75
Up to one Day1 - 2 Day(s)
Average Time to Apply Cash Correlated with Average Days Delinquent
23© 2015 The Hackett Group, Inc. All rights reserved. Reproduction of this document or any portion thereof without prior written consent is prohibited.
Agenda
Who is The Hackett
Group?
What does AP and AR
have in Common?
AR Best Practices that
can help the AP
Process?
Benefits and
Challenges of
Automation
Process
Considerations
Inquiry Response | 24© 2015 The Hackett Group, Inc. All rights reserved. Reproduction of this document or any portion thereof without prior written consent is prohibited.
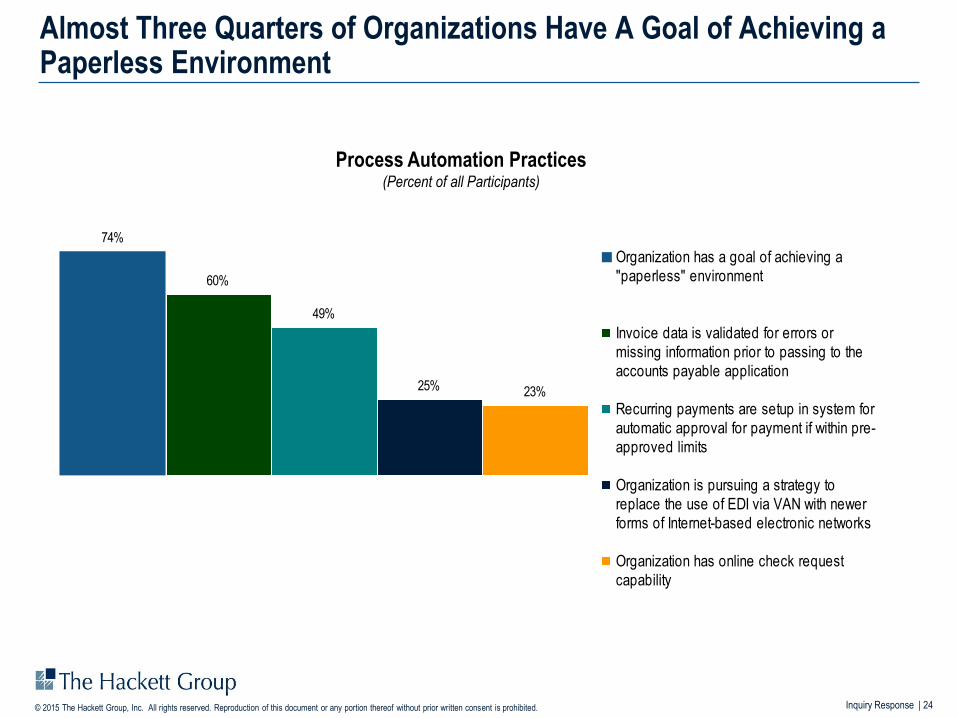
Almost Three Quarters of Organizations Have A Goal of Achieving a Paperless Environment
74%
60%
49%
25% 23%
Organization has a goal of achieving a
"paperless" environment
Invoice data is validated for errors or
missing information prior to passing to the
accounts payable application
Recurring payments are setup in system for
automatic approval for payment if within pre-
approved limits
Organization is pursuing a strategy to
replace the use of EDI via VAN with newer
forms of Internet-based electronic networks
Organization has online check request
capability
Process Automation Practices(Percent of all Participants)
25© 2015 The Hackett Group, Inc. All rights reserved. Reproduction of this document or any portion thereof without prior written consent is prohibited.
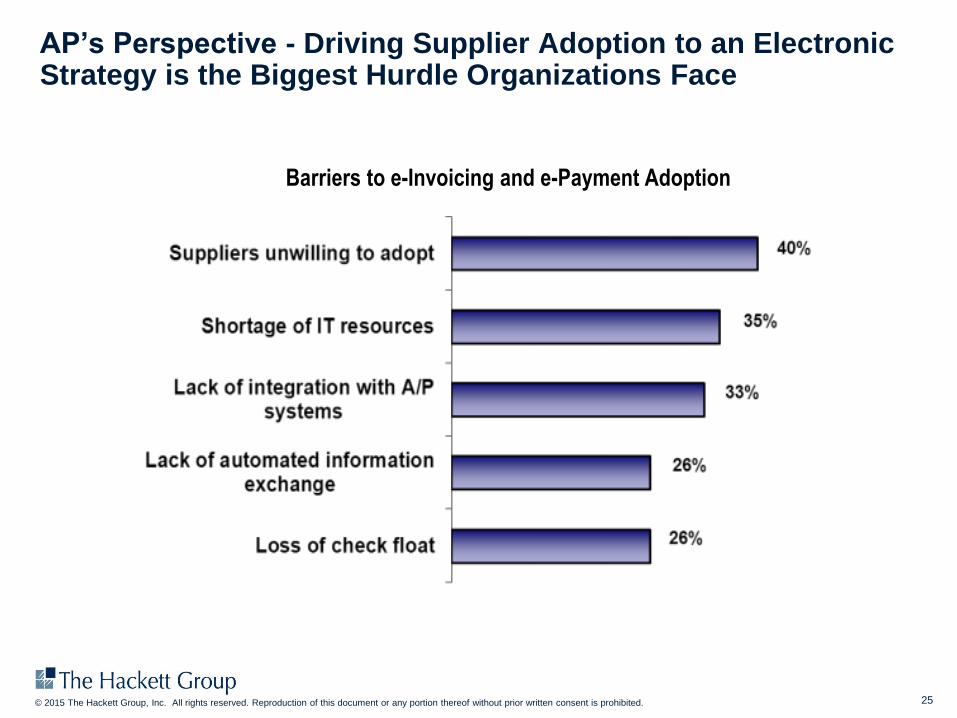
AP’s Perspective - Driving Supplier Adoption to an Electronic Strategy is the Biggest Hurdle Organizations Face
Barriers to e-Invoicing and e-Payment Adoption
Inquiry Response | 26© 2015 The Hackett Group, Inc. All rights reserved. Reproduction of this document or any portion thereof without prior written consent is prohibited.
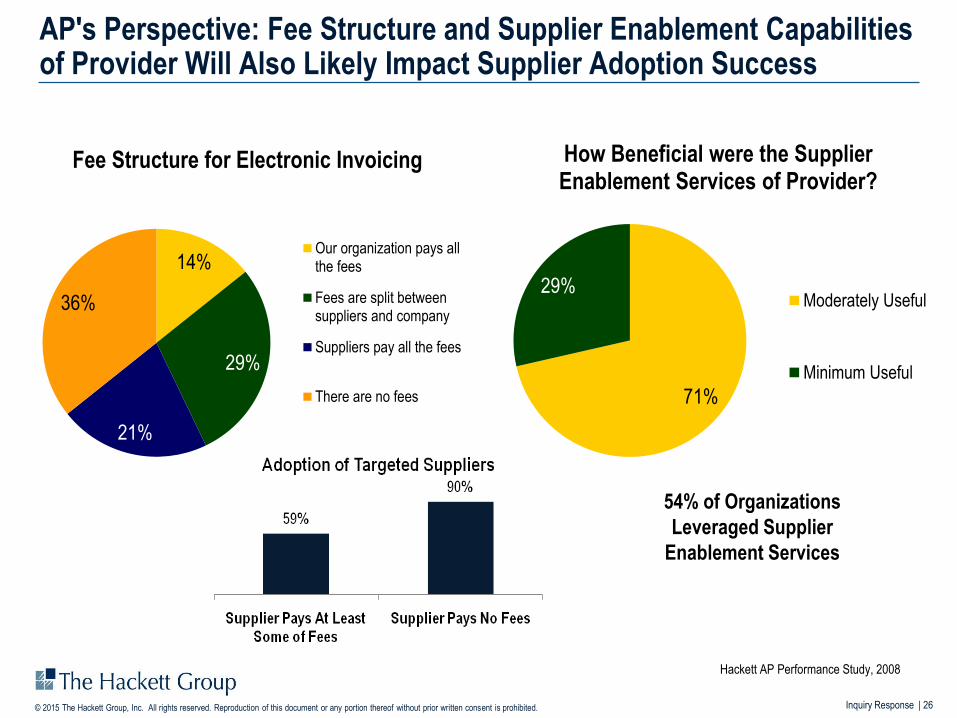
AP's Perspective: Fee Structure and Supplier Enablement Capabilities of Provider Will Also Likely Impact Supplier Adoption Success
14%
29%
21%
36%
Fee Structure for Electronic Invoicing
Our organization pays allthe fees
Fees are split betweensuppliers and company
Suppliers pay all the fees
There are no fees 71%
29%
How Beneficial were the Supplier Enablement Services of Provider?
Moderately Useful
Minimum Useful
54% of Organizations
Leveraged Supplier
Enablement Services
Hackett AP Performance Study, 2008
Inquiry Response | 27© 2015 The Hackett Group, Inc. All rights reserved. Reproduction of this document or any portion thereof without prior written consent is prohibited.
Buyers and Suppliers must be equal partners in the process
Buyers need to treat their suppliers as partners in the EIPP or other forms of invoice
and payment automation solution
Buyers (AP) must communication the benefits of automation solutions to suppliers (AR)
in the following ways:
– Increased visibility / predictability to payment receipt
– Resolve exceptions collaboratively with buyers online
– Checking invoice status and payment details in real-time
28© 2015 The Hackett Group, Inc. All rights reserved. Reproduction of this document or any portion thereof without prior written consent is prohibited.
Agenda
Who is The Hackett
Group?
What does AP and AR
have in Common?
AR Best Practices that
can help the AP
Process?
Benefits and
Challenges of
Automation
Process
Considerations
29© 2015 The Hackett Group, Inc. All rights reserved. Reproduction of this document or any portion thereof without prior written consent is prohibited.
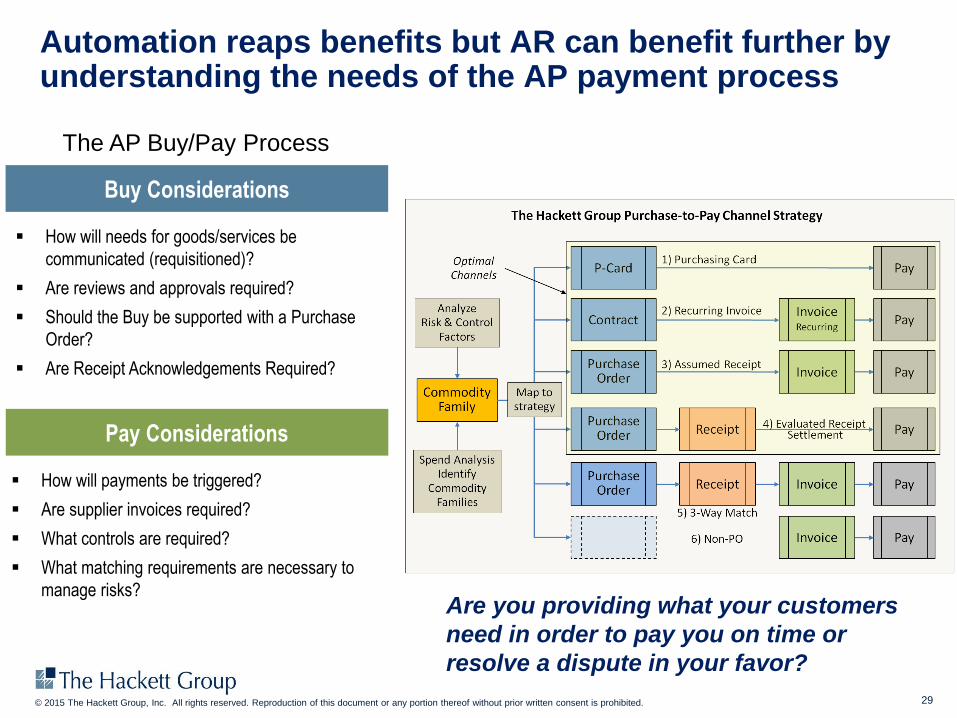
Automation reaps benefits but AR can benefit further by understanding the needs of the AP payment process
How will needs for goods/services be
communicated (requisitioned)?
Are reviews and approvals required?
Should the Buy be supported with a Purchase
Order?
Are Receipt Acknowledgements Required?
Buy Considerations
Pay Considerations
How will payments be triggered?
Are supplier invoices required?
What controls are required?
What matching requirements are necessary to
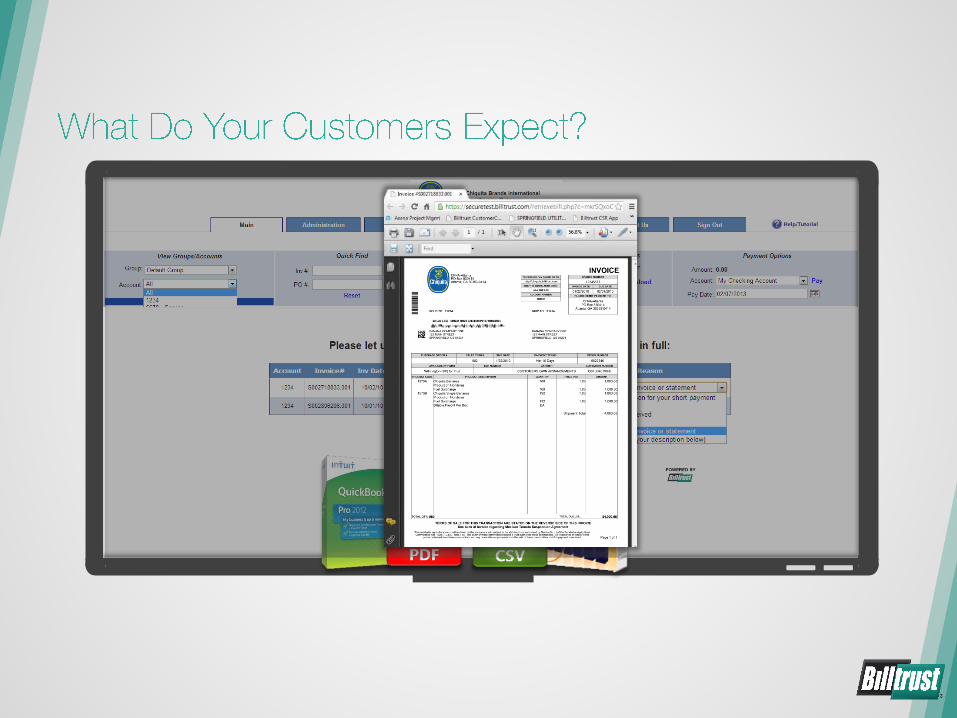
manage risks?Are you providing what your customers
need in order to pay you on time or
resolve a dispute in your favor?
The AP Buy/Pay Process
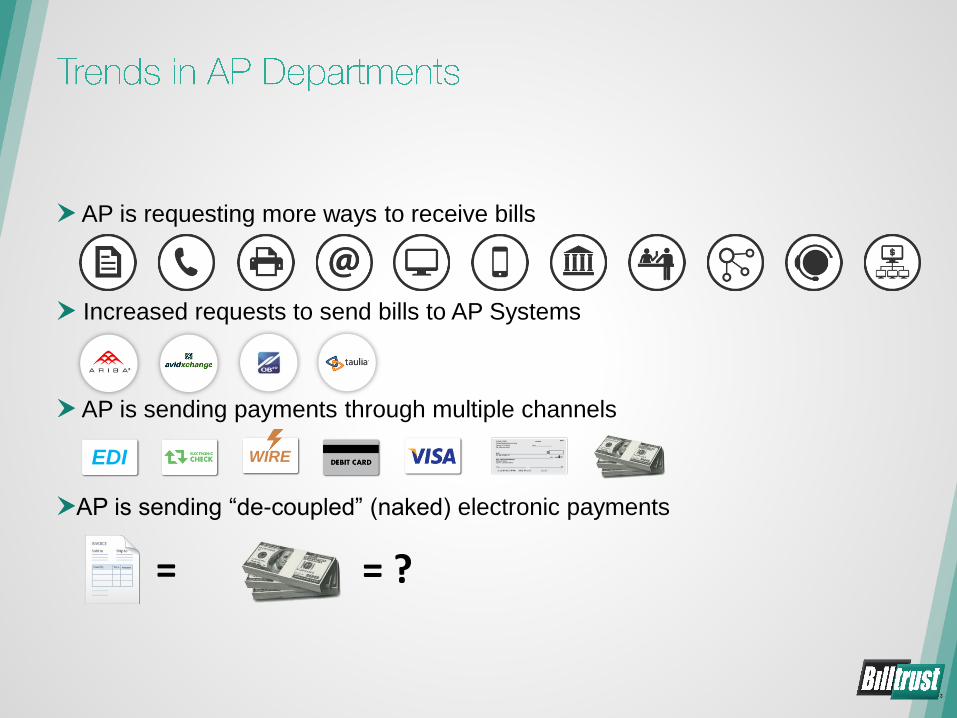
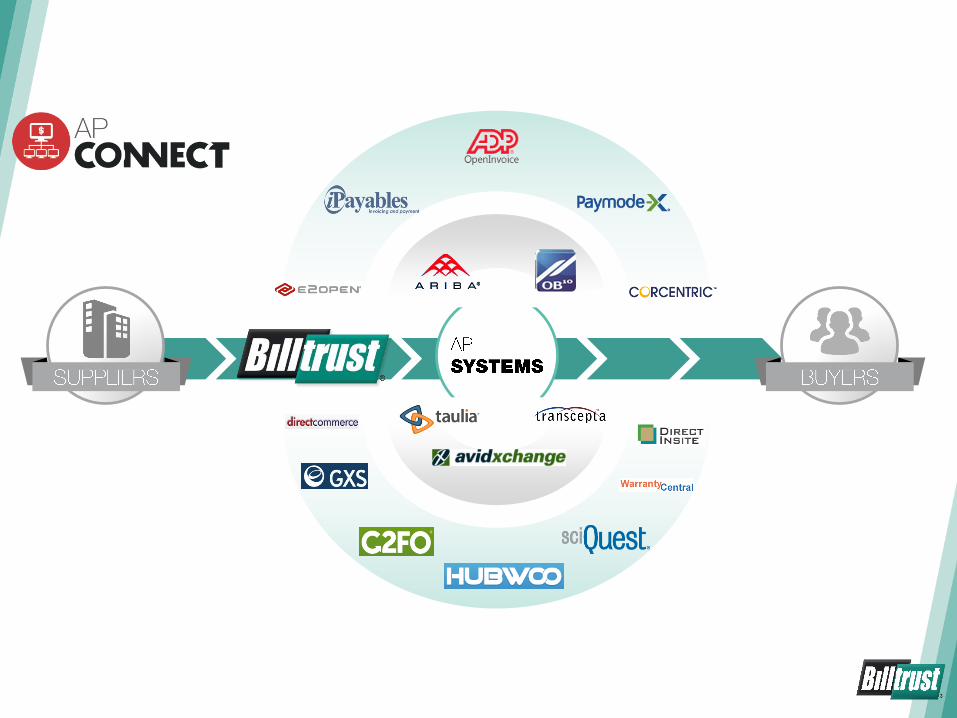
AP is requesting more ways to receive bills
Increased requests to send bills to AP Systems
AP is sending payments through multiple channels
AP is sending “de-coupled” (naked) electronic payments
EDI
= ?
WIRE
=
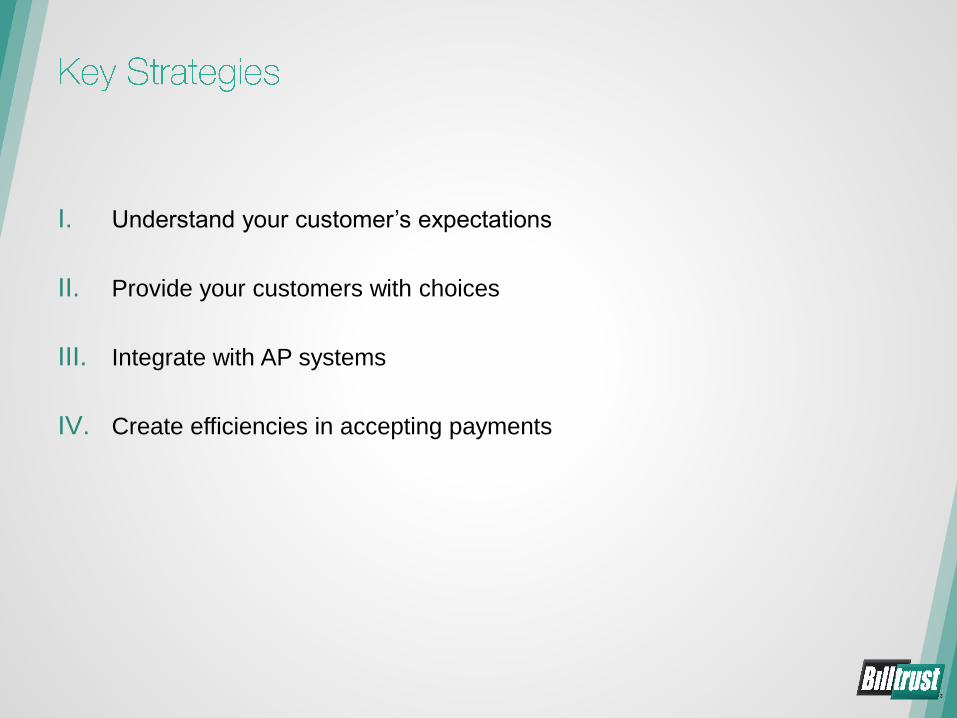
I. Understand your customer’s expectations
II. Provide your customers with choices
III. Integrate with AP systems
IV. Create efficiencies in accepting payments
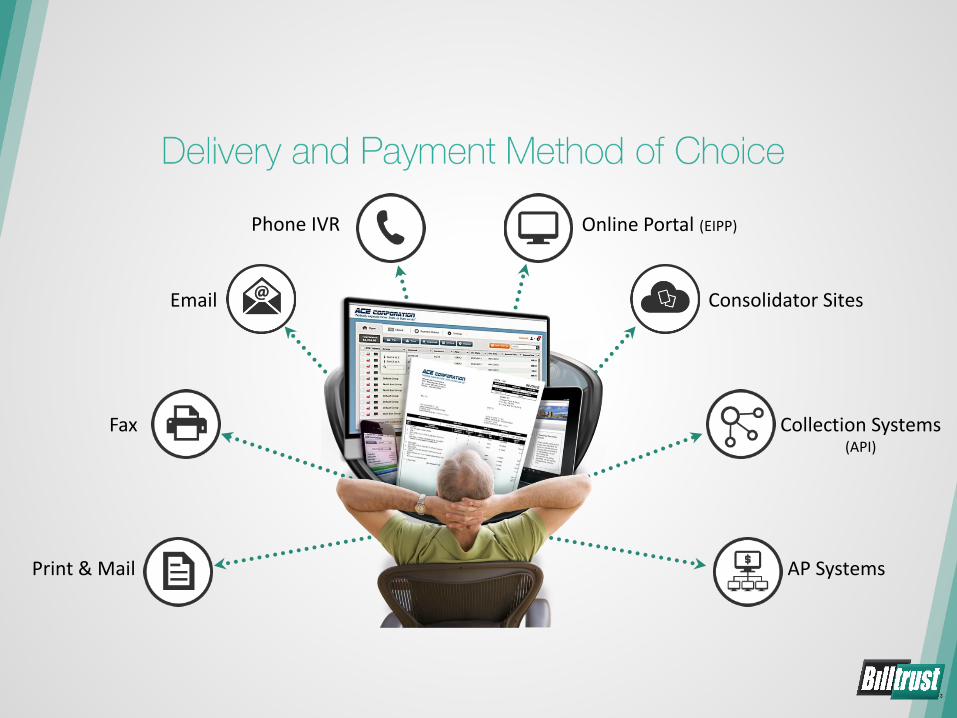
Consolidator Sites
Phone IVR
Print & Mail
Online Portal (EIPP)
Collection Systems(API)
AP Systems
Fax
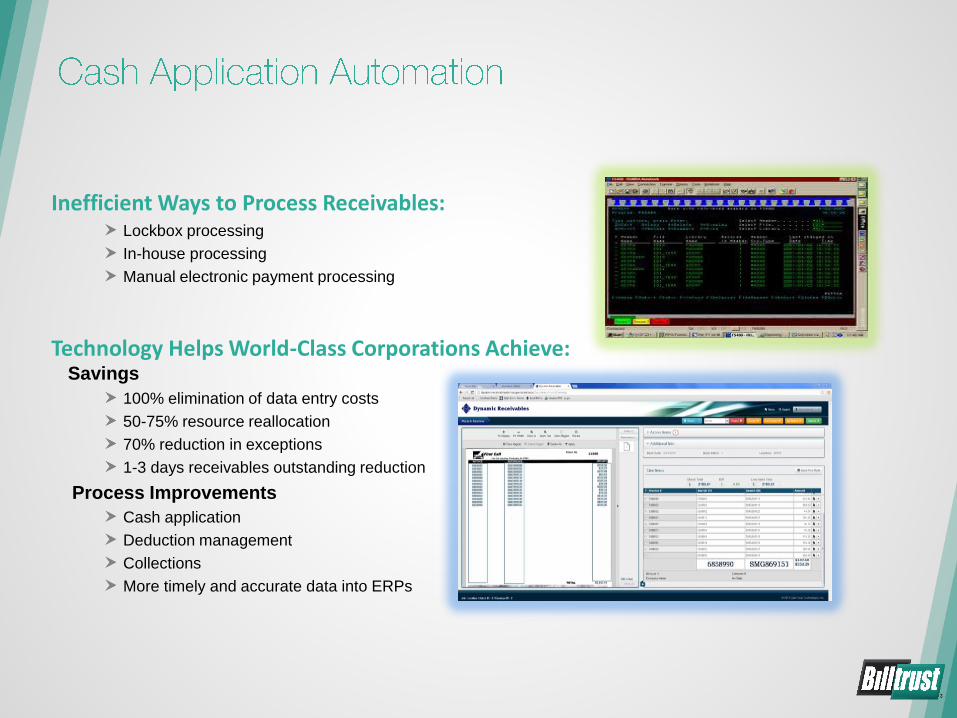
Inefficient Ways to Process Receivables:Lockbox processing
In-house processing
Manual electronic payment processing
Technology Helps World-Class Corporations Achieve:Savings
100% elimination of data entry costs
50-75% resource reallocation
70% reduction in exceptions
1-3 days receivables outstanding reduction
Process Improvements
Cash application
Deduction management
Collections
More timely and accurate data into ERPs
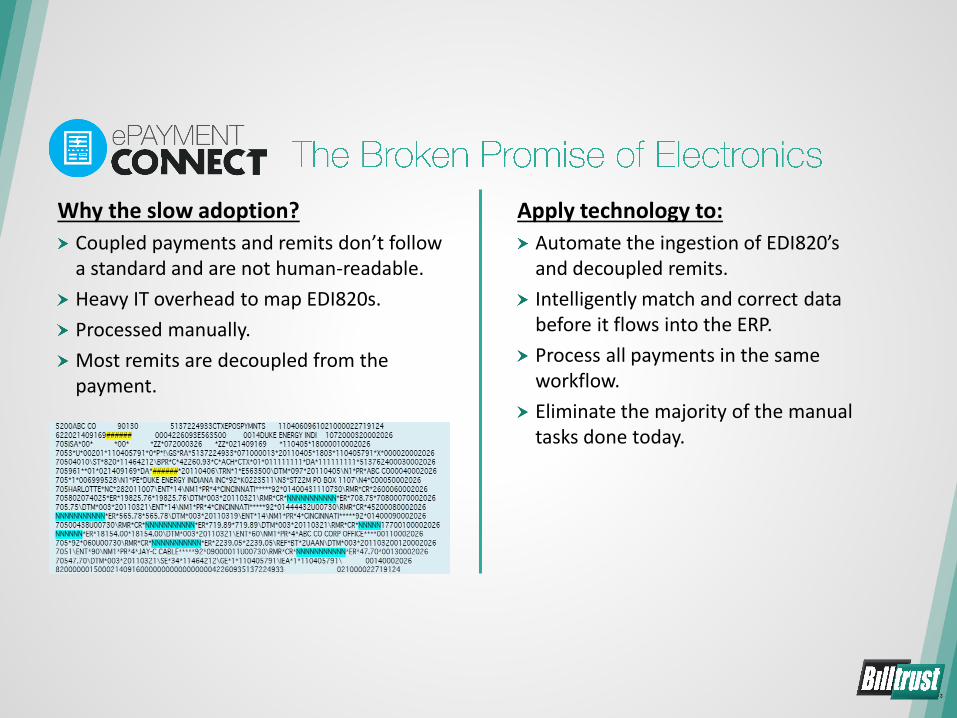
Why the slow adoption?
Coupled payments and remits don’t follow a standard and are not human-readable.
Heavy IT overhead to map EDI820s.
Processed manually.
Most remits are decoupled from the payment.
Apply technology to:
Automate the ingestion of EDI820’s and decoupled remits.
Intelligently match and correct data before it flows into the ERP.
Process all payments in the same workflow.
Eliminate the majority of the manual tasks done today.
I. Provide a range of integrated paper and electronic invoice presentment
channels
II. Integrate into leading AP Systems
III. Open API to support linkage with other applications
IV. Best in breed integrated presentment and payment portals
V. Automated Cash Application across payment methods