System of measures and indicators employed in green controlling at ...
202
Transcript of System of measures and indicators employed in green controlling at ...
GRECON.indd 1 2016-06-20 11:56:19
ReviewerMirosław Hamrol
AuthorsPaweł Chudziński (Chapters 2, 8)Cezary Kochalski (Introduction, Chapters 2, 8, Conclusions)Jarosław Kubiak (Chapter 4)Grzegorz Mikołajewicz (Chapters 1, 3, 9, 10)Andrzej Niemiec (Chapter 7)Jarosław Nowicki (Chapters 1, 3, 9, 10)Piotr Ratajczak (Chapter 6)Agata Sierpińska-Sawicz (Chapter 7)Aleksandra Szulczewska-Remi (Chapter 5)Sławomir Zerbst (Chapter 5)
Cover designJan Paluch
Editing and proofreadingMichał Mażulis
The publication is supported by a grant from Norway through the Norway Grantsand co-financed by the Polish funds.Responsibility for the contents of the publication rests solely on Poznań Universityof Economics and Business.
© Copyright by Poznań University of Economics and Business
ISBN: 978-83-283-2817-4
PublisherHELION SA Publishing GroupKościuszki 1c, 44-100 GLIWICE, Polandphone: +48 32 231 22 19, +48 32 230 98 63e-mail: [email protected]: http://helion.pl
PrintELPILArtyleryjska 11, 08-110 Siedlce, Poland
Free publication
Contents
Introduction ......................................................................................................................7
C H A P T E R 1Creating enterprise value and the requirements of sustainable developmentat Aesculap Chifa, Amica, Aquanet, B. Braun, Hochtief, PBG and PKN Orlen .......................11
1.1. Introductory remarks ..................................................................................................... 111.2. Declared objectives of enterprise at Amica, Solaris Bus & Coach, Aquanet,
PBG, B. Braun and PKN Orlen ..................................................................................... 121.3. PKN Orlen stakeholder map ......................................................................................... 141.4. Value added creation at Hochtief Group .................................................................... 171.5. Key performance indicators (KPIs) at PKN Orlen .................................................... 181.6. CSR activities at Aesculap Chifa, Amica, Aquanet and Solaris Bus & Coach ........ 211.7. Final remarks ................................................................................................................... 24
C H A P T E R 2Environmental and social aspects in the corporate strategy of Aquanet ............................27
2.1. Introductory remarks ..................................................................................................... 272.2. Strategic management process at a waterworks ......................................................... 272.3. Changes in the expectations of the external environment and in company
capacities - comparison of strategic analyses results ................................................. 292.4. Evolution of the vision of the company ....................................................................... 312.5. Change of the strategic goals and initiatives of the company ................................... 312.6. Final remarks ................................................................................................................... 34
4
C H A P T E R 3Selected ESG issues in strategic analysis at Amica, Aquanet, B. Braun, PKN Orlenand Solaris Bus & Coach ....................................................................................................35
3.1. Introductory remarks .....................................................................................................353.2. Declared extent of concern for environmental and social aspects
in the strategic documents of Amica, Aquanet and B. Braun ...................................363.3. Strategic analysis at Amica group .................................................................................383.4. Employment of benchmarking in the strategic analysis at Aquanet ........................393.5. Application of the analysis of stakeholders' expectations as a method of strategic
analysis accounting for environmental and social aspects at PKN Orlen ...............403.6. Accounting for environmental aspects in the product life cycle
at Solaris Bus & Coach ...................................................................................................433.7. Final remarks ...................................................................................................................46
C H A P T E R 4Financial planning in the assessment of profitability of green investmentsillustrated by the example of a wind farm ........................................................................47
4.1. Introductory remarks .....................................................................................................474.2. Development of wind power industry as one of the forms of renewable energy .....484.3. Investment outlays and fundamental project assumptions .......................................484.4. Sales revenues ..................................................................................................................504.5. Operating costs ................................................................................................................514.6. Net financial performance and project cash flows .....................................................514.7. Measurements of investment profitability ...................................................................524.8. Project risk assessment ...................................................................................................554.9. Final remarks ...................................................................................................................58
C H A P T E R 5Budgeting in green controlling at B. Braun Melsungen .....................................................59
5.1. Introductory remarks .....................................................................................................595.2. Enterprise characteristics ...............................................................................................595.3. Green controlling in the economic aspect ...................................................................60
5.3.1. Increasing income through own resources ....................................................................... 605.3.2. Condition and financial results of the considered enterprise as an outcome
of budge execution ................................................................................................................ 615.3.3. Increased value of purchases in countries of manufacture ............................................. 64
5.4. Budgeting process ...........................................................................................................655.5. Environmental aspects in budgeting ............................................................................685.6. Social activities in budgeting .........................................................................................69
5.6.1. Matrix of CSR activities ........................................................................................................ 695.6.2. Social project Children & Youth Weeks 'New Researchers Needed' ............................ 725.6.3. Budget of the Children and Youth Weeks 'New Researchers Needed' project ............ 75
5.7. Final remarks ...................................................................................................................77
5
C H A P T E R 6System of measures and indicators employed in green controllingat Kompania Piwowarska ................................................................................................79
6.1. Introductory remarks ..................................................................................................... 796.2. Kompania Piwowarska - basic information ................................................................ 806.3. Integration of measures and indicators ....................................................................... 806.4. Sustainability Assessment Matrix as a green controlling tool .................................. 826.5. Planning sustainable development with the use of measures and indicators ........ 856.6. Key performance indicators and performance levels for the five priorities ........... 896.7. Communication and control of sustainable development activities ....................... 936.8. Final remarks ................................................................................................................... 98
C H A P T E R 7Reporting in green controlling at selected companies ......................................................99
7.1. Introductory remarks ..................................................................................................... 997.2. Environmental reporting system at GK LW Bogdanka SA .................................... 101
7.2.1. Brief description of the company ...................................................................................... 1017.2.2. Monitoring the natural environment condition ............................................................. 1027.2.3. Reporting procedure and contents of environmental reports ...................................... 108
7.3. Environmental reporting system at Corporate Group ZGH Bolesławin Bukowno ................................................................................................................... 1157.3.1. Brief description of the company and its processes ....................................................... 1157.3.2. Impact of ZGH BOLESŁAW SA on the natural environment ..................................... 1157.3.3. Monitoring the natural environment condition and reporting
contamination levels ........................................................................................................... 1197.4. Integrated reporting pursuant to the GRI standard illustrated by the example
of LOTOS Group .......................................................................................................... 1277.4.1. Brief description of the corporate group ......................................................................... 1277.4.2. Impact of LOTOS Group on the natural environment ................................................. 1287.4.3. Reporting at LOTOS Group .............................................................................................. 1327.4.4. Conclusions .......................................................................................................................... 142
7.5. EMAS environmental reporting compliant with ISO 14001illustrated with the example of RAFAKO SA ........................................................... 1427.5.1. Brief description of the company ...................................................................................... 1437.5.2. EMAS environmental declaration reporting scope ........................................................ 1447.5.3. Place of the EMAS environmental declaration within the system
of external reporting ........................................................................................................... 1507.6. Final remarks ................................................................................................................. 150
6
C H A P T E R 8Cost management with account of sustainable development at Aquanet ........................153
8.1. Introductory remarks ...................................................................................................1538.2. Cost management at Aquanet SA ...............................................................................1538.3. Effects of operational costs management with account of environmental aspects .....1548.4. Tariff burden ..................................................................................................................1588.5. Final remarks .................................................................................................................159
C H A P T E R 9Investment project appraisal with account of environmental and social aspectsat Aquanet and Amica ....................................................................................................161
9.1. Introductory remarks ...................................................................................................1619.2. Approach to investment project appraisal at Aquanet ............................................1629.3. Business investment project appraisal at Aquanet ...................................................1649.4. Example of evaluation of social impacts of an investment project at Aquanet ....1669.5. Costs of traffic congestion in Poznań as an example of valuation
of certain social impacts under cost-benefit analysis ...............................................1689.6. Investment project appraisal at Amica group ...........................................................1709.7. Final remarks .................................................................................................................171
C H A P T E R 1 0Risk and cost of capital accounting for social and environmental issuesat Aquanet, Amica, B. Braun and PKN Orlen ....................................................................173
10.1. Introductory remarks .................................................................................................17310.2. Key global risks and trends ........................................................................................17410.3. Integrated enterprise risk management system at PKN Orlen .............................17610.4. Risk analysis and cost of capital at Aquanet, Amica and B. Braun ......................17810.5. Final remarks ...............................................................................................................183
Conclusions ...................................................................................................................185Bibliography ..................................................................................................................187
Table index ....................................................................................................................195Figure index ..................................................................................................................197Diagram index ...............................................................................................................198Graph index ...................................................................................................................199
Introduction
This publication is the outcome of research on controlling and finance in enterprises,that pursue measures to reach objectives resulting from the premises, underlying theconcept of sustainable development. Well-recognized Polish and foreign enterpriseswere targeted within the research, with their economic performance ensuring valueincrease, and demonstrated success record in undertaking activities geared towarddelivery of social and environmental objectives. Those are: Aesculap Chifa, Amica,Aquanet, LW Bogdanka, B. Braun, Hochtief, Kompania Piwowarska, Lotos, PBG,PKN Orlen, Rafako, Solaris Bus & Coach, ZGH Bolesław.
The research has been performed as an exemplification of practices used in enter-prises, toward presenting solutions to problems identified in the monograph entitled'Green Controlling and Finance. Theoretical Framework' - ed. C. Kochalski, PublishingHouse - C.H. Beck, Warsaw 2016. The dissertation adopts cognitive and methodicalapproach to identify the possibilities of employing controlling to reach the goals of sus-tainable development concept, in a way enabling the financial aspect of planned growthof company value to correlate with environmental and social activities.
The aim of this publication is finding an answer to the question: How do enter-prises employ controlling to achieve the objectives of sustainable development concept,while assuming that social and environmental activities coordinated within the con-trolling scheme are to be considered in connection with the finance?
In order to answer this question, i.e. solve the research problem, the following issueswere addressed:
consideration of social and environmental aspects in the enterprises' strategicdocuments,
employment of strategic analysis methods incorporating the requirements ofsustainable development in enterprises,
evaluation of sources and distribution of the created value added in enterprisesfrom the perspective of identified stakeholder groups,
8
addressing social and environmental aspects of activities undertaken at enter-prises and their evaluation against key performance indicators (KPI's),
the significance of financial planning in the context of enterprises' environmentalinvestment decisions,
revealing the significance of budgeting process in green controlling, based onexperience of an international enterprise, including example of 'Latest Estimate'budgeting approach,
methods of integration of measures and indices between the strategic and opera-tional objectives of sustainable development,
applied solutions for environmental reporting and integrated reporting, consideration of environmental and social aspects in cost management, employment of investment appraisal methods within the enterprises and evalua-
tion of social and environmental impacts of investment projects, identification of various types of risk, risk management systems and methods
employed in risk analysis as well as in determination of the cost of capital.
In order to solve the presented research problem and find answers to the detailedquestions, qualitative and, in certain cases also, quantitative research methods havebeen applied. The authors attempted to explore specific solutions regarding greencontrolling and finance within considered enterprises, with emphasis on interpretationof the employed solutions and, wherever possible, numerical results were analysedand evaluated.
The data and information collected, arranged and analyzed under this project,come both directly from the enterprises in question, as well as, wherever possible andnecessary, were supported by open sources. Particularly productive were visits paid tomajority of the researched enterprises, where in the course of interviews, a lot of valu-able information was shared, along with assistance in analysis and interpretation ofthe data gathered, thus allowing for a better understanding of the issues discussed.
This work comprises introduction, ten chapters, and conclusions. Each of thechapters covers a specific set of issues related to green controlling and finance withinthe considered enterprises.
Chapter 1 explores value creation at Aesculap Chifa, Amica, Aquanet, B. BraunMelsungen, Hochtief, PBG, PKN Orlen. In particular, it focuses on the practical as-pects of value creation at enterprises that have opted for sustainable development.
Environmental and social aspects in the development of Aquanet's strategy havebeen presented in Chapter 2. Its purpose is to identify elements of sustainable develop-ment concept within the strategy of the considered enterprise.
Chapter 3 pertains to selected aspects of strategic analysis. Its objective is to demon-strate strategic analysis solutions at Amica, Aquanet, B. Braun, PKN Orlen and SolarisBus & Coach, with indication of those related to sustainable development.
9
Chapter 4 refers to financial planning in profitability assessment of green invest-ments, illustrated by an example of a wind farm. The example of a wind farm investment,draws attention to significance of financial planning in the context of investment deci-sions taken by enterprises focused on environmental and social objectives.
Budgeting in green controlling at B. Braun Melsungen is the subject of Chapter 5.It's particular focus is on the process of 'Latest Estimate' budgeting process, that formsground for increased effectiveness, simplification and leanness.
The system of measures and indices employed in green controlling at KompaniaPiwowarska is explored in Chapter 6. It presents solutions adopted for integration ofmeasures and indices between strategic and operational objectives of sustainable de-velopment, with the use of appropriate IT tools to support processes of planning,control and reporting.
Chapter 7 takes a closer look at integrated reporting in accordance with the GRIstandard, as illustrated by the case of LOTOS Group.
Chapter 8 explores cost management in terms of sustainable development at Aquanetenterprise. The purpose of this chapter is to show the effects of cost management at thiscompany with a particular emphasis on environmental aspects.
The investment appraisal of projects with account of environmental and social as-pects at Aquanet and Amica are pondered in Chapter 9, that presents practical aspectsof employing various approaches to profitability appraisal of investment projects anddiverse assessment methods in operation of the considered enterprises.
Chapter 10 is dedicated to risk and cost of capital at Aquanet, Amica, B. BraunMelsungen and PKN Orlen. It expounds the practical aspects of risk management andcapital cost estimation within the subject companies, where businesses are conductedin a sustainable manner.
The conclusion summarizes the key findings from the conducted research. Based onconducted case studies, the findings that support usefulness of controlling and financetools in achieving the objectives of sustainable development concept were highlighted.
This publication is the final effect of the project entitled Green Controlling andFinance - The Innovative Program of Postgraduate Studies, co-financed from the fundsof the Foundation for the Development of the Education System (FRSE), acting as theOperator of the Scholarship and Training Fund (FSS) within Measure 5, Developmentof Polish Higher Education Institutions (the so-called Norway Grants).
Cezary Kochalski

C H A P T E R 1
Creating enterprise value and the requirementsof sustainable development at Aesculap Chifa, Amica,Aquanet, B. Braun, Hochtief, PBG and PKN Orlen
1.1. Introductory remarks
The chapter on 'Value Creation Concept in Sustainable Business' in the book entitled'Green Controlling and Finance. Theoretical Framework' [Mikołajewicz and Nowicki2016b] presents concepts of value creation and the tasks placed before 'green' controllingwithin the context of the structure of possible enterprise goals. It also offers a com-parison of the shareholder theory of value creation with the stakeholder theory, indi-cating arguments supporting each one and the possibilities of their coexistence. Thediscussed chapter also places the social and environmental aspects within the structureof key performance indicators of an enterprise in a model approach, and cites results ofempirical research on the influence of environmental, social and corporate governanceissues on the operational and financial efficiency and on the value of an enterprise.
In the present chapter, the primary focus is on practical aspects of value creation inenterprises that pursue the model of sustainable development, and the main problemsregard:
identification of declared objectives of an enterprise and accounting for socialand environmental aspects within them,
identification of key stakeholder groups, evaluation of sources and distribution of the created value added in the enter-
prise from the perspective of stakeholders, consideration of social and environmental aspects in key performance indicators
(KPIs) of enterprises, identification of undertaken CSR initiatives and their related benefits.
The above problems have been presented as case studies in subsequent sub-chapters.
12
1.2. Declared objectives of enterprise at Amica, Solaris Bus & Coach, Aquanet,PBG, B. Braun and PKN Orlen
As regards the topic of this chapter, the focus should be on the objectives of enter-prises as declared by the companies themselves.
The corporate group Amica declares its focus on the shareholder concept [Amica 2016].This is reflected both in the company's mission, in the currently pursued strategy HIT 2023,and in the information for investors [Rutkowski 2015, p. 1: Amica 2015, pp. 18, 27-28;Amica 2014, p. 8]. The company does not employ a formalized system of value-basedmanagement, and in order to measure the effects of value creation, it uses indicators asformulated in the current strategy, such as revenues, EBITDA, net profits, dividend payoutratio, debt/EBITDA ratio or production effectiveness [Amica 2016, Amica 2014, pp. 9,22, 28]. At the same time, the analysis of Amica's involvement in numerous initiativesdemonstrating the policy of corporate social responsibility pursued by the company1,commands the focus on objectives understood as increasing shareholder value in thecategories of the so-called 'enlightened' value maximization2. Similar conclusions arebrought by the analysis of company's mission, which mentions creating value for share-holders, employees and local communities and as such, even at this general level, it signalsthe company's will to consider social determinants of its operations [Amica 2014, s. 8].
Solaris Bus & Coach declares that 'the main objective of the company is its de-velopment, in which all stakeholders participate on equal rights' [Solaris 2015, s. 38].This approach, then, is closer to the concept of balancing the interests of individualstakeholders, that is to the main concept competitive to the shareholder theory3. Thecompany owner states openly that 'functioning of the enterprise is subordinate to theconsistently pursued idea of sustainable development', which is manifested in that'economic progress of the company must go hand in hand with care for the sur-rounding natural environment and the community bound to it' [Solaris 2015, s. 2]. Itfollows from these declarations that in the case of Solaris Bus & Coach, concern forenvironmental and social aspects is deeply ingrained in its business philosophy.
Aquanet, as a public utility enterprise, emphasizes that its 'main function is to pro-vide uninterrupted cold water supply and waste water collection and treatment serviceto the residents, while maintaining profitability' [Aquanet 2015d, p. 14]. The nature ofAquanet's operations suggests that its business philosophy is closer to the stakeholderconcept than to the shareholder concept, yet this does not mean that the growth of com-pany value is not one of its goals: the letter from the President of the Supervisory Boardcontains an overt assurance that the increase of company's stock value is confirmation
1 These will be explored further on in this chapter.2 This concept has been analyzed in: [Mikołajewicz and Nowicki 2016b].3 Shareholder theory and stakeholder theory as the main two concepts underlying objectives of an
enterprise have been covered in: [Mikołajewicz and Nowicki 2016b].
13
of the company's capability to press ahead with an ambitious investment plan [Aquanet2015d, p. 9]. In this case, accounting for the environmental and social determinants inthe business operations is, in a way, directly dictated by its nature and stated in thestrategy followed by the company [Ernst & Young 2015, p. 1].
PBG Group considers as its main strategic prerogative the steady and long-termincrease of company value [PBG 2011, p. 2]. The adoption of such main objectiveplaces PBG Group in the ranks of entities that subscribe to the shareholder theory.Yet, its declared objective is well-rooted in the requirements of sustainable development.This is visible already at the level of the group's mission, which invokes improving thewelfare of society [PBG 2011, p. 2]. Environmental and social aspects are also listedamong the declared principles [PBG 2011, p. 2].
B. Braun declares that its main operational goal is to remain a family company thatmaintains and increases revenues and profits on the dynamic market of health carewith the use of its own resources. The financial targets of the company are to achieveannual revenue growth of 5 to 7% and the EBITDA margin of 16-18% by the year2020 [B. Braun 2015a, p. 5]. In the case of B. Braun, taking into consideration the en-vironmental and social aspects is one of the pillars of company's philosophy, as it restson three core values, that is innovation, efficiency and sustainability [B. Braun 2015b, p. 2].Considering the area of activity of the entire group of companies, accounting for envi-ronmental and social aspects seems natural.
PKN Orlen 'is focused on the pursuit of the principle of company value growthwith benefit to all the stakeholder groups (among others, employees, clients, stock-holders, local communities and others) based on sustainable and responsible use ofresources' [PKN Orlen 2015f]. PKN Orlen core values underlying both internal andexternal relations are: [PKN Orlen 2015g]:
responsibility ('we respect our customers, shareholders, the natural environmentand local communities'),
development ('we explore new possibilities'), people ('we are characterised by our know-how, teamwork and integrity'), energy ('we are enthusiastic about what we do'), dependability ('you can rely on us').
The three declared pillars of PKN Orlen's strategy for the years 2014-2017 are valuecreation, financial strength and people. The third of these pillars revolves around respon-sibility for people, for the natural environment and for partners [PKN Orlen 2015a].
It must be noted that over the past few years, PKN Orlen's declarations regardingits objectives have evolved towards a stronger emphasis on the principles of sustainabledevelopment and corporate social responsibility. Up until the year 2012, the company'smission was as follows [PKN Orlen 2011, p. 16]:
'Aiming to become the regional leader, we ensure long-term value creation forour shareholders by offering our customers products and services of highest quality.
14
All our operations adhere to 'best practice' principles of corporate governance and socialresponsibility, with a focus on care for our employees and the natural environment.'
In 2012, the company's mission changed to [PKN Orlen 2013, p. 82]:'We discover and process natural resources to fuel the future'.The shift in the mission, mirrored in the declared values of the company and in its
current strategy pillars, confirms the strengthening accentuation of the importance ofaccounting for environmental and social aspects in its business. Company's declara-tions regarding the current objectives of its operations may, then, be summed up asclearly geared towards sustainable development.
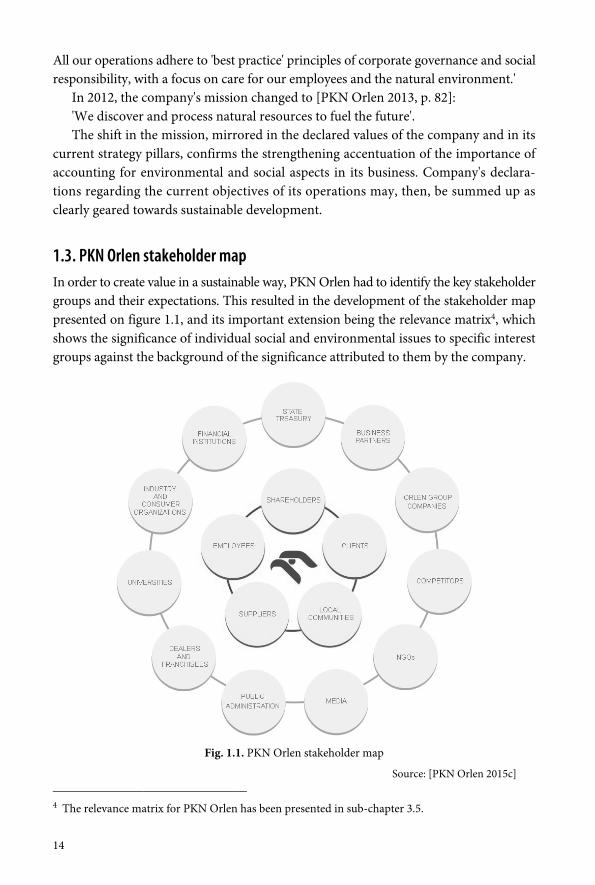
1.3. PKN Orlen stakeholder mapIn order to create value in a sustainable way, PKN Orlen had to identify the key stakeholdergroups and their expectations. This resulted in the development of the stakeholder mappresented on figure 1.1, and its important extension being the relevance matrix4, whichshows the significance of individual social and environmental issues to specific interestgroups against the background of the significance attributed to them by the company.
Fig. 1.1. PKN Orlen stakeholder map
Source: [PKN Orlen 2015c]
4 The relevance matrix for PKN Orlen has been presented in sub-chapter 3.5.
15
PKN Orlen singles out two groups of stakeholders, that is key stakeholders (innercircle) and major stakeholders (outer circle). Importantly, these two groups are notalways separable.
PKN Orlen has identified the following groups as its key stakeholders [PKNOrlen 2015c]:
shareholders (of which the largest are: State Treasury, Nationale-NederlandenOpen Pension Fund and Aviva Open Pension Fund),
employees, with whom the company ensures social dialogue based on inde-pendence of all parties, legal compliance, mutual trust, willingness to compro-mise, and observance of the rules. The company also provides them with supportin the form of social benefits5.
clients, including both individual customers (such as drivers) and institutionalclients representing virtually all industry sectors (among others, the chemical,automotive, aviation, power, construction, packaging, agricultural, and foodproduction business)6,
suppliers, with whom the company strives to establish steady cooperation, andwhose selection is of great importance to the company7,
local communities, i.e. residents of areas adjacent to company's productionplants, storage facilities and locations where it carries out exploration and pro-duction activities, who, at the same time, are often employees or trading partnersof the company.
As regards major stakeholders, PKN Orlen lists [PKN Orlen 2015c]:
State Treasury, business partners, i.e. natural persons or legal entities who are parties to trans-
actions with the company (this group includes both the company's suppliersand customers who purchase company's products or services), stable and partnerrelationship with them is what the company believes results in growth of valueand trust in PKN Orlen,
5 These benefits include, among others, co-financing of employee holidays or sanatorium, child care,holidays for small children and teenagers, school starter kits, recreation and sports activities, culturaland educational activities, non-repayable allowances, repayable housing loans, financial supportfor families with low incomes, and Christmas gifts for employees’ children.
6 The company sells its products to customers in 58 countries across 4 continents.7 In 2014, the concern cooperated with more than 17,000 offerors and 3,000 suppliers, and completed
over 10,500 purchases and 1,700 electronic auctions.
16
PKN Orlen Group companies, engaged in production, trade, services and ex-ploration for and appraisal of hydrocarbon deposits, as well as power generation,transmission, distribution and trade,
competitors (Grupa Lotos, Mitteldeutschland refinery at Leuna/Spergau, PCKrefinery at Schwedt, Slavnaft refinery, Mozyr refinery),
NGOs, whose strengthening, through transfer of knowledge and financial support,is in the public's and PKN ORLEN's best interest,
media, that is the main channel used by the company to communicate with thestakeholders, to provide information on its achievements, plans and performance,and to address any business-related enquiries and doubts,
public administration, which, given the scale and scope of the concern's opera-tions, is a very broad and diversified group (among others, State Treasury,market regulators and public services, local government administration on in-vestment sites),
dealers and franchisees, who contribute to the steady strengthening of the com-pany's leading position in retail fuel sales and who significantly contribute tocustomer perception of PKN ORLEN brand,
universities (mainly technical ones, including the AGH University of Scienceand Technology and Warsaw University of Technology), on whose participa-tion rests the continued modernization and building of company's competitiveadvantages8,
industry and consumer organizations, financial institutions, such as banks, insurance companies, and stock exchange
institutions which determine the group's shape, dynamics and directions ofgrowth.
A synthetic summary of the analysis of stakeholders and relations that PKN Orlenwishes to build with them can be found in the company's vision, which states [PKNOrlen 2015h, p. 8] that it wants to be perceived as a 'good and responsible employerthat pursues principles of mutual trust, commitment and employee energy efficiency,while caring for their safety and supporting their life-work balance'. As regards theclose surroundings, the emphasis is on 'development of social sensitivity' of company'sbusiness partners, that is clients, business partners, local communities, suppliers, share-holders and, as regards its further surroundings, the stress is on driving change,promoting innovativeness and setting 'highest industry standards within the scopeof business ethics and protection of the natural environment.'
8 The concern cooperates not only with Polish universities, but has also established educationalcentres abroad, including a modern R&D centre in Litvinov, the Czech Republic.
17
1.4. Value added creation at Hochtief Group
An increasing number of companies bases shareholder value creation on respect forthe rights and needs of stakeholders, or directly declares its objective to be stakeholdervalue creation.
One possible manifestation of such approach is the analysis of value added creationwithin the company in the context of the sources of its origin and it distribution amongstakeholder groups.
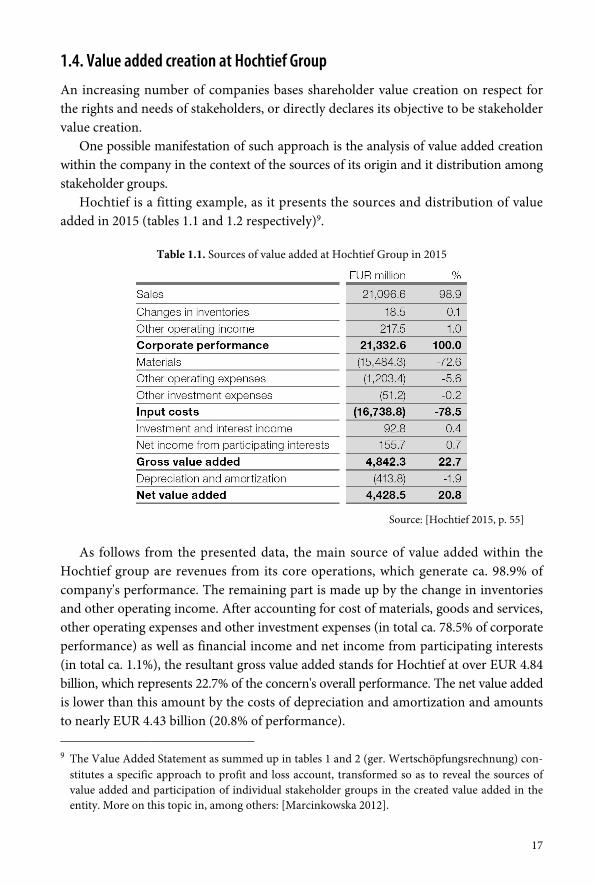
Hochtief is a fitting example, as it presents the sources and distribution of valueadded in 2015 (tables 1.1 and 1.2 respectively)9.
Table 1.1. Sources of value added at Hochtief Group in 2015
Source: [Hochtief 2015, p. 55]
As follows from the presented data, the main source of value added within theHochtief group are revenues from its core operations, which generate ca. 98.9% ofcompany's performance. The remaining part is made up by the change in inventoriesand other operating income. After accounting for cost of materials, goods and services,other operating expenses and other investment expenses (in total ca. 78.5% of corporateperformance) as well as financial income and net income from participating interests(in total ca. 1.1%), the resultant gross value added stands for Hochtief at over EUR 4.84billion, which represents 22.7% of the concern's overall performance. The net value addedis lower than this amount by the costs of depreciation and amortization and amountsto nearly EUR 4.43 billion (20.8% of performance).
9 The Value Added Statement as summed up in tables 1 and 2 (ger. Wertschöpfungsrechnung) con-stitutes a specific approach to profit and loss account, transformed so as to reveal the sources ofvalue added and participation of individual stakeholder groups in the created value added in theentity. More on this topic in, among others: [Marcinkowska 2012].
18
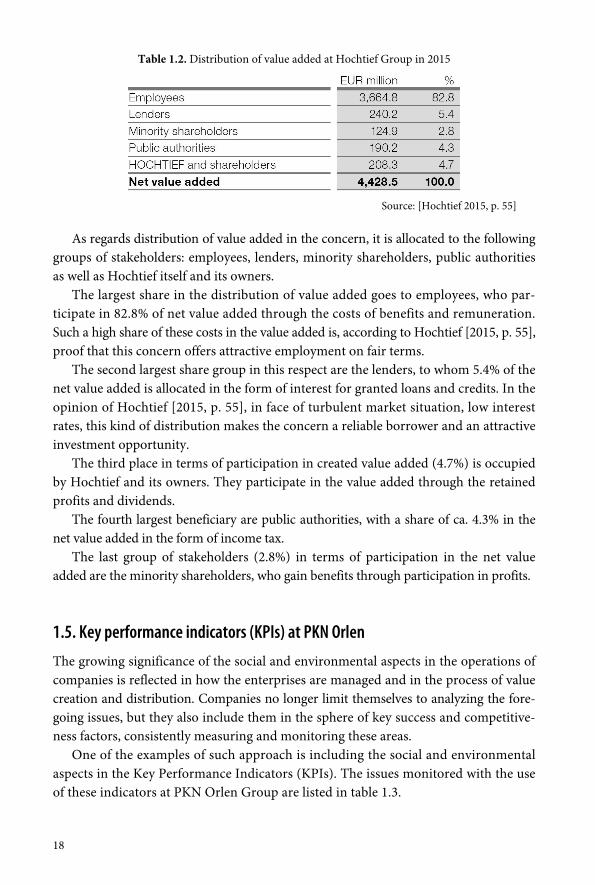
Table 1.2. Distribution of value added at Hochtief Group in 2015
Source: [Hochtief 2015, p. 55]
As regards distribution of value added in the concern, it is allocated to the followinggroups of stakeholders: employees, lenders, minority shareholders, public authoritiesas well as Hochtief itself and its owners.
The largest share in the distribution of value added goes to employees, who par-ticipate in 82.8% of net value added through the costs of benefits and remuneration.Such a high share of these costs in the value added is, according to Hochtief [2015, p. 55],proof that this concern offers attractive employment on fair terms.
The second largest share group in this respect are the lenders, to whom 5.4% of thenet value added is allocated in the form of interest for granted loans and credits. In theopinion of Hochtief [2015, p. 55], in face of turbulent market situation, low interestrates, this kind of distribution makes the concern a reliable borrower and an attractiveinvestment opportunity.
The third place in terms of participation in created value added (4.7%) is occupiedby Hochtief and its owners. They participate in the value added through the retainedprofits and dividends.
The fourth largest beneficiary are public authorities, with a share of ca. 4.3% in thenet value added in the form of income tax.
The last group of stakeholders (2.8%) in terms of participation in the net valueadded are the minority shareholders, who gain benefits through participation in profits.
1.5. Key performance indicators (KPIs) at PKN Orlen
The growing significance of the social and environmental aspects in the operations ofcompanies is reflected in how the enterprises are managed and in the process of valuecreation and distribution. Companies no longer limit themselves to analyzing the fore-going issues, but they also include them in the sphere of key success and competitive-ness factors, consistently measuring and monitoring these areas.
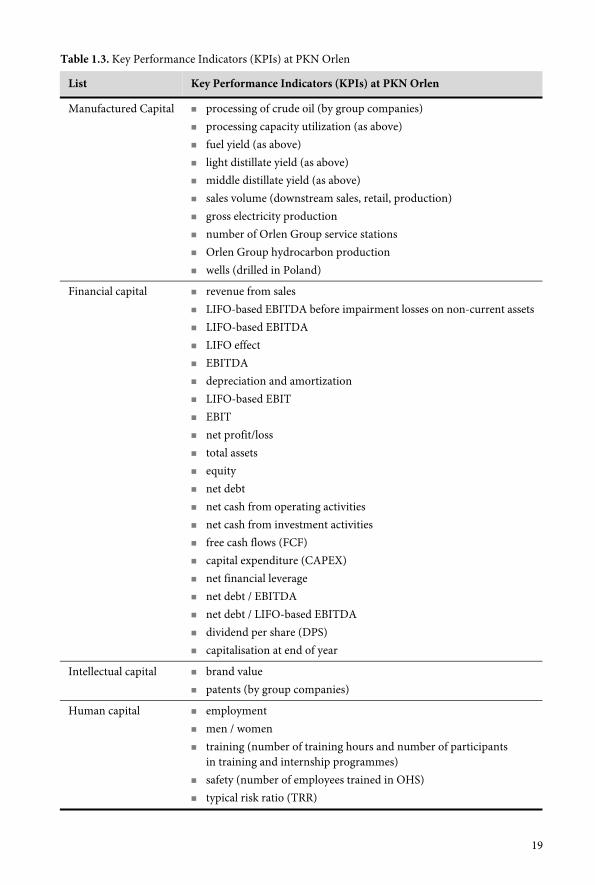
One of the examples of such approach is including the social and environmentalaspects in the Key Performance Indicators (KPIs). The issues monitored with the useof these indicators at PKN Orlen Group are listed in table 1.3.
19
Table 1.3. Key Performance Indicators (KPIs) at PKN Orlen
List Key Performance Indicators (KPIs) at PKN Orlen
Manufactured Capital processing of crude oil (by group companies) processing capacity utilization (as above) fuel yield (as above) light distillate yield (as above) middle distillate yield (as above) sales volume (downstream sales, retail, production) gross electricity production number of Orlen Group service stations Orlen Group hydrocarbon production wells (drilled in Poland)
Financial capital revenue from sales LIFO-based EBITDA before impairment losses on non-current assets LIFO-based EBITDA LIFO effect EBITDA depreciation and amortization LIFO-based EBIT EBIT net profit/loss total assets equity net debt net cash from operating activities net cash from investment activities free cash flows (FCF) capital expenditure (CAPEX) net financial leverage net debt / EBITDA net debt / LIFO-based EBITDA dividend per share (DPS) capitalisation at end of year
Intellectual capital brand value patents (by group companies)
Human capital employment men / women training (number of training hours and number of participants
in training and internship programmes) safety (number of employees trained in OHS) typical risk ratio (TRR)
20
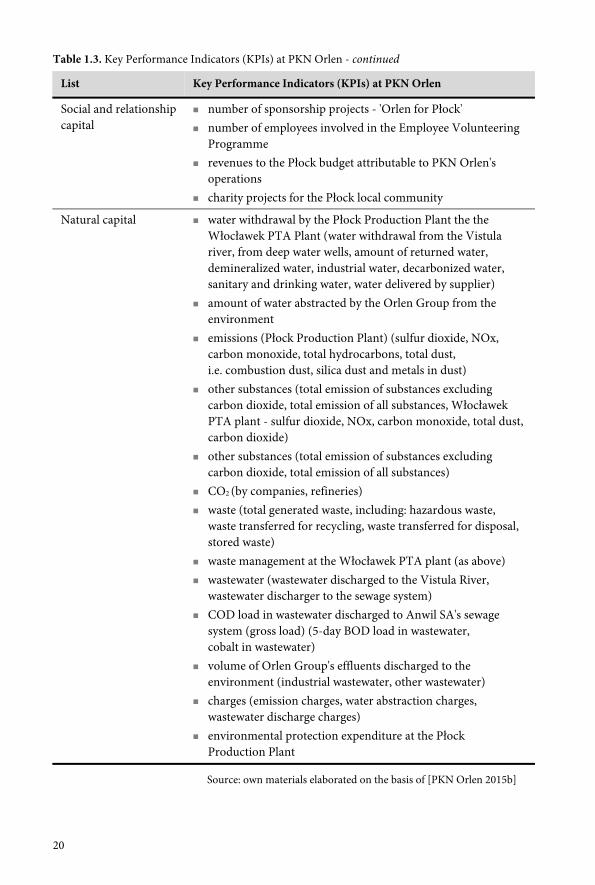
Table 1.3. Key Performance Indicators (KPIs) at PKN Orlen - continued
List Key Performance Indicators (KPIs) at PKN Orlen
Social and relationshipcapital
number of sponsorship projects - 'Orlen for Płock' number of employees involved in the Employee Volunteering
Programme revenues to the Płock budget attributable to PKN Orlen's
operations charity projects for the Płock local community
Natural capital water withdrawal by the Płock Production Plant the theWłocławek PTA Plant (water withdrawal from the Vistulariver, from deep water wells, amount of returned water,demineralized water, industrial water, decarbonized water,sanitary and drinking water, water delivered by supplier)
amount of water abstracted by the Orlen Group from theenvironment
emissions (Płock Production Plant) (sulfur dioxide, NOx,carbon monoxide, total hydrocarbons, total dust,i.e. combustion dust, silica dust and metals in dust)
other substances (total emission of substances excludingcarbon dioxide, total emission of all substances, WłocławekPTA plant - sulfur dioxide, NOx, carbon monoxide, total dust,carbon dioxide)
other substances (total emission of substances excludingcarbon dioxide, total emission of all substances)
CO2 (by companies, refineries) waste (total generated waste, including: hazardous waste,
waste transferred for recycling, waste transferred for disposal,stored waste)
waste management at the Włocławek PTA plant (as above) wastewater (wastewater discharged to the Vistula River,
wastewater discharger to the sewage system) COD load in wastewater discharged to Anwil SA's sewage
system (gross load) (5-day BOD load in wastewater,cobalt in wastewater)
volume of Orlen Group's effluents discharged to theenvironment (industrial wastewater, other wastewater)
charges (emission charges, water abstraction charges,wastewater discharge charges)
environmental protection expenditure at the PłockProduction Plant
Source: own materials elaborated on the basis of [PKN Orlen 2015b]
21
As evidenced by the presented data, the issues analyzed at PKN Orlen as part ofthe Key Performance Indicators (KPIs) entail six important areas, namely: of manu-factured, financial, intellectual, human, social and relationship and natural capital.
The first two types of capital may be qualified as part of classic interests of eco-nomic analysis, covering both technological and economic aspects (such as processingof crude oil, production, wells) and strictly financial ones (such as income, differenttypes of financial results, capital structure, cash flows, capitalization, etc.).
The other four areas of KPIs are related to non-tangible company assets (such asintellectual capital in the form of brand and patents) and to its social responsibility, inthe context of effects on employees (i.e. diversity, safety, training), on the local com-munities (sponsorship, employee volunteering projects, charitable activities) and onthe natural environment (water abstraction, emissions, waste, wastewater, charges orenvironmental protection expenditures).
It is worth noting that in terms of the sheer number of various KPI issues (theseare sometimes further divided into smaller, more detailed partial indicators), thenatural capital sphere comes second (13 issues), right after the finance capital (25) andbefore manufactured capital (10). Human and social and relationship capital matters aremuch less numerous (5 and 4 issues respectively), as is the intellectual capital (2 issues).
1.6. CSR activities at Aesculap Chifa, Amica, Aquanet and Solaris Bus & Coach
Based on the analysis of CSR reports, environmental reports or information obtaineddirectly from companies Aesculap Chifa, Amica, Aquanet and Solaris Bus & Coach, it maybe concluded that these companies are involved in CSR initiatives in three key areas,that is the broadly understood social area (accounting for the perspectives of clients,suppliers and local communities), employee area and natural environment area.
As regards the social area, these activities relate mainly to:
charity (charitable activities, foundations, employee volunteer programmes,support for the disadvantaged, for NGOs),
educational and informational initiatives (Internet portals, debates, conferences,publications, educational programmes, scholarship programmes for school anduniversity students, internships and apprenticeships, vocational training classes,safety promotion, open days at company's venues),
supporting the healthy lifestyle (promotion of amateur and competitive sports,active leisure, sponsorship and organization of events),
supporting handicapped persons (employment of disabled persons, financialsupport),
ensuring high quality of products (their utility, safety, effectiveness),
22
observance of corporate values and principles of conduct with business part-ners (application of the principles of corporate governance, monitoring thelevel of satisfaction with products, services, communication, cooperation withthe company),
supporting local communities (supporting local suppliers, employing inhabi-tants of a given city or region, cooperation with municipal authorities, carryingout investments and social projects),
supporting projects related to culture and protection of national heritage.
As regards employee relations, these companies focus on:
improvement of safety, work organization and conditions (including monitoringthese elements and employee satisfaction),
supporting employees and their families (co-financing of holidays, health care,child care, workplace nurseries and preschools, Christmas gifts for children,co-financing of school starter kits, non-repayable allowances, repayable housingloans, co-financing for sports activities),
ensuring equal opportunities and remunerations, as well as appropriate moti-vational schemes,
organization of training, workshops and opportunities for employees' profes-sional development,
initiatives geared toward pensioners (including the employee pension pro-gramme).
Concerning the natural environment, these initiatives typically include:
meeting environmental standards, monitoring and minimizing resource use, emissions and waste (improved effi-
ciency of use of energy and resources, both in production and auxiliary proc-esses, and of the end-product use; waste segregation, recycling and disposal,product safety),
fostering eco-friendly attitudes (social campaigns), investments in and expenditures for environmental protection.
Of course, the foregoing areas, as well as activities taken up as their part, are mu-tually overlapping, and the associated benefits may be noticed by many differentstakeholders10.
10 The broad range of advantages brought about by accounting for social and environmental issuesin the operation of business has been presented in: [Mikołajewicz and Nowicki 2016a, 2016b].
23
One fitting example are internship or workshop programmes, vocational trainingclasses and cooperation with academic centres. On the one hand, these companiesstrengthen their brand (by becoming a desired and reliable employer), they secure theintake of specialized staff and new organizational and technological thought while, onthe other hand, this gives rise to social advantages stemming from the availability ofworkplaces and the attendant sensation of security, as well as from the improved edu-cational offer and scientific development (including also within the scope of environ-mental solutions). Such measures are taken up by, among others, Aesculap Chifa,Amica, Aquanet and Solaris Bus & Coach.
And so, for example Aesculap Chifa is involved in an on-going cooperation withthe Stanisław Staszic Complex of Schools No. 2 in Nowy Tomyśl, with the John Paul IIComplex of Secondary Schools in Radzyń Podlaski and with the Poznan University ofTechnology. Practical classes take place on plant premises, in school workshops andin production departments, thus allowing students to obtain theoretical and practicalknowledge related to professions of a machine fitter with specialization in toolmakingand (since 2015) of mechanic technician, with the qualifications of a cutting tooloperator. Each student is assigned an experienced employee who acts as their trainer,and throughout the training period, they have the status of 'adolescent employees'.After having completed their education and obtained the hands-on knowledge, stu-dents are guaranteed employment (in the case of mechanic technicians, three topgraduates will be hired). The company sponsors to five best fitter students a month-long stay in Germany for extra training which, following a successfully passed exami-nation, results in the obtainment of an IHK certificate that allows fitters to work intheir profession across all of the European Union (in 2011, the Regional ExaminationBoard in Poznań appointed an examination centre at Aesculap Chifa, and since 2014,workshops have been offered at the school in Radzyń Podlaski). As regards cooperationwith the Poznan University of Technology, it entails organization of internships andapprenticeships, conferences and 'Lean Tours' with the Chair of Production Manage-ment and Engineering, whose aim is to exchange knowledge and experience in thescope of improvement of production processes. Amica and Wix-Filtron are also in-volved in the project.
Amica has also completed a programme entitled 'Science through the Kitchen Door',within which it conducted workshops and apprenticeships and students of vocationaland technical schools in Wronki.
Aquanet, for its part, has established cooperation with universities in Poznań. Studentsof the Poznan University of Technology, of the Adam Mickiewicz University, of thePoznan University of Life Sciences, but also of the AGH University of Science andTechnology in Krakow are completing internships at the company.
24
Since 2006, Solaris Bus & Coach has been the co-developer of a vocational trainingclass at the Basic Vocational School in Murowana Goślina, which imparts educationin the profession of a mechatronics technician, with 20 new students each year. Thecurriculum allows students to get to know the entire production process, and theknowledge they obtain enables them to complete as much as 75% of the tasks involvedin the job of a full-time employee. The programme of Practical Professional Trainingat Solaris Bus & Coach, developed in cooperation with other vocational schools, alsocovers the plant in Środa Wielkopolska, where students are learning to become fitters.
Advantages generated by companies active in the CSR area are confirmed by imageresearch conducted both among their customers and employees. What is more, pro-social and and pro-ecological measures enjoy broad social support.
And so, for example a poll conducted in Poznań and in its suburban communities,has proved the positive image of Aquanet among its customers [CBS 2015, pp. 26, 27,37, 42]. They perceive this company as responsible, reliable and trustworthy, as well asa modern enterprise that cares for the high quality of services (over 75% of respon-dents have indicated this answer). Contacts with Aquanet's employees have garneredjust as much positive feedback, regarding payment collectors, Customer AttentionCentre employees and technical employees alike. Local residents also appreciate thecompany's social campaigns, expressing their high support (over 95%) of its invest-ments accounting for ecological issues (only 1% of the respondents did not indicatetheir support for this type of measures and 4% did not have an opinion). As regardsthe work conditions at Aquanet [CBS 2014, pp. 10, 11, 17], they are assessed by com-pany's employees as good. Nearly 2/3 of the respondents are of the opinion that theirwork conditions are either much or somewhat better than at competitive enterprises.Also contacts with other employees, work conditions and relations with superiors areevaluated as very positive. The great majority of surveyed Aquanet employees (58%)are not considering switching jobs in the foreseeable future (this option is ponderedby on average one in eight employees, while there is a significant group of uncertainrespondents - nearly 1/3 of them indicated the answer 'hard to tell').
1.7. Final remarks
The purpose of this chapter has been to identify the declared objectives of enterprisesand whether these include social and environmental aspects, as well as to point outthe key stakeholder groups. This goal has also covered an evaluation of the sources anddistribution of created value added in the enterprise from the perspective of stakeholders,of accounting for social and environmental aspects in the key performance indicators(KPIs) and an identification of CSR measures and their attendant advantages.
25
This objective has been fulfilled. As follows from the conducted research, a part ofthe enterprises declared value creation for more than one stakeholder as the objectiveof their operations. From among the analyzed enterprises, the ones that indicate thegoal of creation of shareholder value, at the same time declare a focus on environ-mental and social issues, which makes it justified to qualify them as subscribing to the'enlightened' value maximization theory.
As regards identification of stakeholders, the chapter presents the map of stakeholdersdeveloped by PKN Orlen, which divides them into two groups: key stakeholders (share-holders, employees, clients, suppliers, local community) and major stakeholders (StateTreasury, PKN Orlen Group companies, competitors, NGOs, media, public admini-stration, dealers and franchisees, universities, industry and consumer organizations,financial institutions).
In evaluating the value created at an enterprise from the perspective of stakeholders,the chapter examined the sources of value added at Hochtief group, as well as its distri-bution among the following stakeholder groups: employees, lenders, minority stock-holders, public authorities and the entity itself along with its owners.
The example of PKN Orlen illustrates that the natural environment occupies animportant spot within KPIs, and that the main issues also entail the manufactured, fi-nancial, intellectual, human and social capital.
Concerning CSR measures in the examined companies (Aesculap Chifa, Amica,Aquanet, Solaris Bus & Coach), they are carried out in three main areas, namely: thebroadly understood social area (accounting for the perspectives of clients, suppliersand local communities), employee area and natural environment area. The chapteralso briefly addresses the attendant advantages as perceived by the companies.

C H A P T E R 2
Environmental and social aspects in the corporate strategyof Aquanet
2.1. Introductory remarks
From the point of view of economic thought, there is no doubt nowadays that a watersupply enterprise should be managed within a strategic framework. Considering envi-ronmental, social and economic determinants of functioning of water supply enter-prises, it seems justified, or indeed necessary, for them to implement steps aiming atthe inclusion of objectives and processes of sustainable development in the strategicplans of such companies.
The purpose of this chapter is to identify elements of sustainable development atthe Aquanet SA waterworks in Poznań.
2.2. Strategic management process at a waterworks
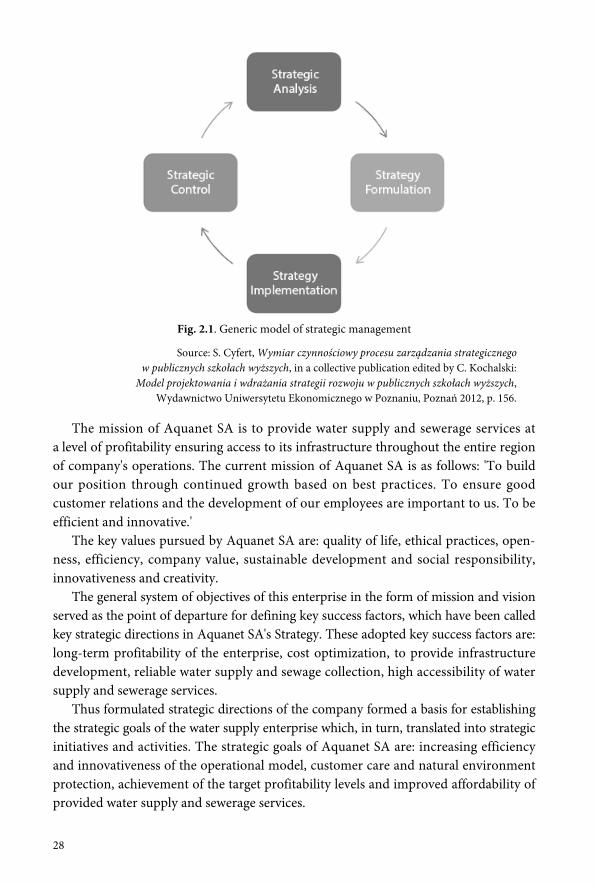
As observed by S. Cyfert, the generic model of strategic management entails the accom-plishment of four stages (see fig. 2.1). These are: strategic analysis, strategy formulation,strategy implementation and strategic control.
Although the primary focus of this chapter is on the formulated strategy of the dis-cussed water supply company, it must be emphasized at this point that the shape ofthe strategy was strongly influenced by the results of strategic analysis of both externaland internal company environment. Analytical works carried out in formulating theAquanet SA. Strategy were performed by Ernst & Young in cooperation with theAquanet SA Analytical and Strategic Team.
The obtained results of strategic analysis, in reference to the expectations of thecompany's external environment and to the internal potential of the enterprise, facili-tated the formulation of Aquanet SA's mission (the core reason for its existence) andvision (the image of the enterprise in the future).
28
Fig. 2.1. Generic model of strategic management
Source: S. Cyfert, Wymiar czynnościowy procesu zarządzania strategicznegow publicznych szkołach wyższych, in a collective publication edited by C. Kochalski:
Model projektowania i wdrażania strategii rozwoju w publicznych szkołach wyższych,Wydawnictwo Uniwersytetu Ekonomicznego w Poznaniu, Poznań 2012, p. 156.
The mission of Aquanet SA is to provide water supply and sewerage services ata level of profitability ensuring access to its infrastructure throughout the entire regionof company's operations. The current mission of Aquanet SA is as follows: 'To buildour position through continued growth based on best practices. To ensure goodcustomer relations and the development of our employees are important to us. To beefficient and innovative.'
The key values pursued by Aquanet SA are: quality of life, ethical practices, open-ness, efficiency, company value, sustainable development and social responsibility,innovativeness and creativity.
The general system of objectives of this enterprise in the form of mission and visionserved as the point of departure for defining key success factors, which have been calledkey strategic directions in Aquanet SA's Strategy. These adopted key success factors are:long-term profitability of the enterprise, cost optimization, to provide infrastructuredevelopment, reliable water supply and sewage collection, high accessibility of watersupply and sewerage services.
Thus formulated strategic directions of the company formed a basis for establishingthe strategic goals of the water supply enterprise which, in turn, translated into strategicinitiatives and activities. The strategic goals of Aquanet SA are: increasing efficiencyand innovativeness of the operational model, customer care and natural environmentprotection, achievement of the target profitability levels and improved affordability ofprovided water supply and sewerage services.
29
Aquanet SA sets its strategies for five-year periods with the option of possibleupdates at half-term. The current strategy of Aquanet SA covers the period from 2016to 2020. Readers may find out for themselves how great the changes in the strategicdevelopment of this company are by comparing the current strategy with the formerone, implemented for the years 2012-2016.
2.3. Changes in the expectations of the external environmentand in company capacities - comparison of strategic analyses results
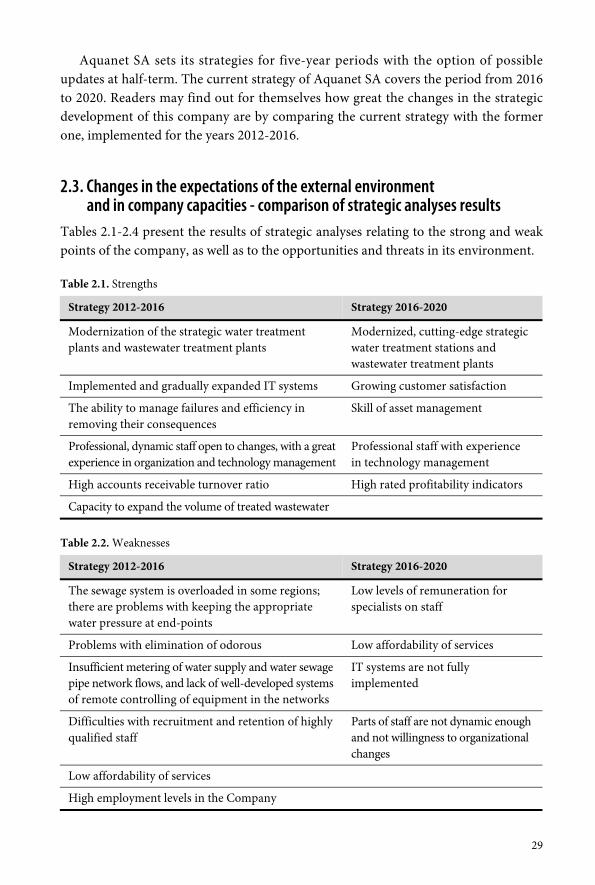
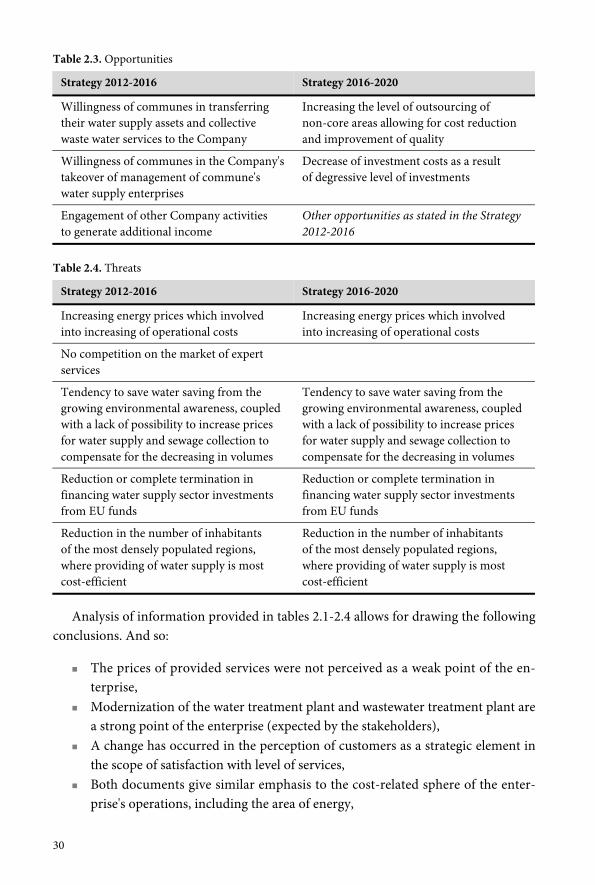
Tables 2.1-2.4 present the results of strategic analyses relating to the strong and weakpoints of the company, as well as to the opportunities and threats in its environment.
Table 2.1. Strengths
Strategy 2012-2016 Strategy 2016-2020
Modernization of the strategic water treatmentplants and wastewater treatment plants
Modernized, cutting-edge strategicwater treatment stations andwastewater treatment plants
Implemented and gradually expanded IT systems Growing customer satisfaction
The ability to manage failures and efficiency inremoving their consequences
Skill of asset management
Professional, dynamic staff open to changes, with a greatexperience in organization and technology management
Professional staff with experiencein technology management
High accounts receivable turnover ratio High rated profitability indicators
Capacity to expand the volume of treated wastewater
Table 2.2. Weaknesses
Strategy 2012-2016 Strategy 2016-2020
The sewage system is overloaded in some regions;there are problems with keeping the appropriatewater pressure at end-points
Low levels of remuneration forspecialists on staff
Problems with elimination of odorous Low affordability of services
Insufficient metering of water supply and water sewagepipe network flows, and lack of well-developed systemsof remote controlling of equipment in the networks
IT systems are not fullyimplemented
Difficulties with recruitment and retention of highlyqualified staff
Parts of staff are not dynamic enoughand not willingness to organizationalchanges
Low affordability of services
High employment levels in the Company
30
Table 2.3. Opportunities
Strategy 2012-2016 Strategy 2016-2020
Willingness of communes in transferringtheir water supply assets and collectivewaste water services to the Company
Increasing the level of outsourcing ofnon-core areas allowing for cost reductionand improvement of quality
Willingness of communes in the Company'stakeover of management of commune'swater supply enterprises
Decrease of investment costs as a resultof degressive level of investments
Engagement of other Company activitiesto generate additional income
Other opportunities as stated in the Strategy2012-2016
Table 2.4. Threats
Strategy 2012-2016 Strategy 2016-2020
Increasing energy prices which involvedinto increasing of operational costs
Increasing energy prices which involvedinto increasing of operational costs
No competition on the market of expertservices
Tendency to save water saving from thegrowing environmental awareness, coupledwith a lack of possibility to increase pricesfor water supply and sewage collection tocompensate for the decreasing in volumes
Tendency to save water saving from thegrowing environmental awareness, coupledwith a lack of possibility to increase pricesfor water supply and sewage collection tocompensate for the decreasing in volumes
Reduction or complete termination infinancing water supply sector investmentsfrom EU funds
Reduction or complete termination infinancing water supply sector investmentsfrom EU funds
Reduction in the number of inhabitantsof the most densely populated regions,where providing of water supply is mostcost-efficient
Reduction in the number of inhabitantsof the most densely populated regions,where providing of water supply is mostcost-efficient
Analysis of information provided in tables 2.1-2.4 allows for drawing the followingconclusions. And so:
The prices of provided services were not perceived as a weak point of the en-terprise,
Modernization of the water treatment plant and wastewater treatment plant area strong point of the enterprise (expected by the stakeholders),
A change has occurred in the perception of customers as a strategic element inthe scope of satisfaction with level of services,
Both documents give similar emphasis to the cost-related sphere of the enter-prise's operations, including the area of energy,
31
Attention has been given to the need to improve the managerial competencesof the management, especially as regards the non-technical area,
The situation in the social and business environment has undergone significantchanges.
Changes in the expectations of enterprise's stakeholder and in its internal potentialhave keystone the need to update the strategy items relating to vision, strategic goals,initiatives and strategic enterprises.
2.4. Evolution of the vision of the company
The vision of Aquanet SA as formulated in the Strategy for the years 2012-2016 was asfollows:
'We are one of the leading water supply and waste water company in Poland. We haveaccomplished our position through optimum employment of our resources and thedevelopment of our water supply and sewerage operations within the region of ouractivity. Our operations concentrate on the city of Poznań and its surrounding com-munes, while we actively seek investment opportunities in the public utility sectorto increase the value of our company.'
The vision quoted earlier on (from the Aquanet SA's Strategy for the years 2016-2020)places emphasis on satisfying both the needs and expectations of customers and ofemployees, perceived as key stakeholders in driving competitive advantage.
2.5. Change of the strategic goals and initiatives of the company
The strategic goals of this company for the years 2012-2016 were:
Year-to-year improvement of the ROCE indicator and EBITDA in the years2012-2016,
Steady, year-to-year reduction of manageable costs1 in real terms in the years2012-2016,
Continuous maintaining of the required environmental protection standards, Continuous maintaining of the required level of services norms, Fulfillment of requirements regarding the sewage infrastructure development2
as laid down in the NPMWWT3 for the period ending on 31 December 2015.
1 The manageable costs are those which, with account of determinants of functioning of water supplyenterprises in Poland, may be directly influenced by the management (Chudziński, 2014).
32
Redistribution of strategic goals into strategic initiatives was aimed at undertakingactivities with the objective of:
Optimizing tariffs, Analysis and identification of areas with cost-reduction potential, Implementation of a system of monitoring and control of compliance with legal
norms regarding environmental protection.
The results of the performed strategic analysis and the high level of accomplishmentof strategic goals for the years 2012-2016 prompted the enterprise management to setnew strategic goals for the years 2016-2020. These are:
Development of an efficient and innovative operating model, Customer care and protection of the natural environment, Maintaining EBITDA in the years 2016-2020 at a level of at least 45%, Improvement of the affordability of water supply and sewerage services de-
livered by Aquanet.
Achievement of strategic goals takes place through the accomplishment of strategicinitiatives. The most characteristic ones, from the perspective of changes in approachto the strategy, are:
Optimization of business processes, Implementation of mechanisms to measure work efficiency and quality, Building an experienced team to achieve the strategic goals by way of measuring
and development of function-specific skills, Optimization of communication and process of strategy communication, To maintain of high customer satisfaction levels, To provide infrastructure to inhabited areas, Analysis of price burden and of the tariff modification potential to increase the
affordability of Company's services.
The analysis of divergences between the strategic goals as set in the years 2012 and2016 shows that:
The considered enterprise views its development more holistically, for exampleby grouping customers and natural environment together,
It is visible the company striving to keep achieved financial performance, The examined enterprise strives to reduce the price burden of its services.
2 The essence of this goal was to accomplish a certain level of accessibility to waste water networkthroughout the entire region of Company's operations; for the Poznań agglomeration, the targetwas set at 98%.
3 NPMWWT - National Programme for Municipal Waste Water Treatment (KZGW, 2010).
33
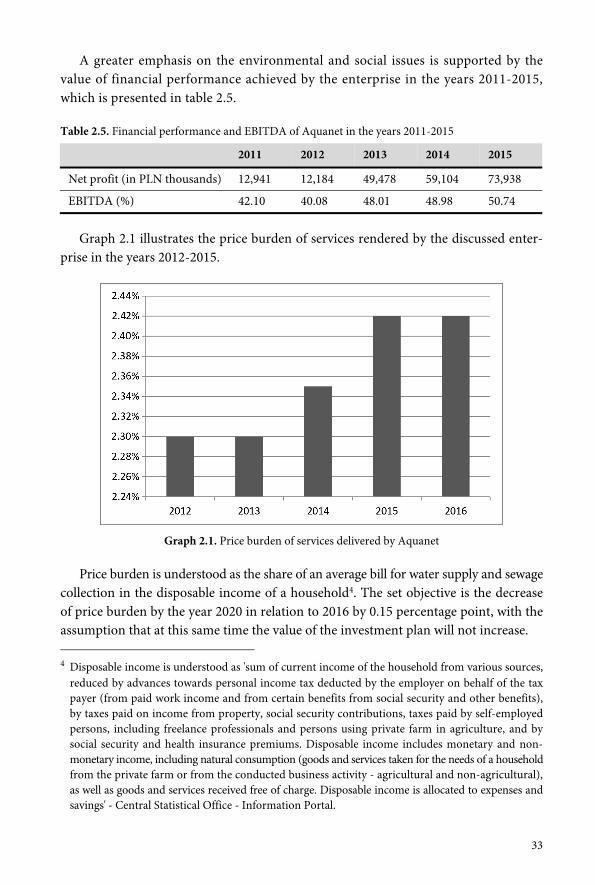
A greater emphasis on the environmental and social issues is supported by thevalue of financial performance achieved by the enterprise in the years 2011-2015,which is presented in table 2.5.
Table 2.5. Financial performance and EBITDA of Aquanet in the years 2011-2015
2011 2012 2013 2014 2015
Net profit (in PLN thousands) 12,941 12,184 49,478 59,104 73,938
EBITDA (%) 42.10 40.08 48.01 48.98 50.74
Graph 2.1 illustrates the price burden of services rendered by the discussed enter-prise in the years 2012-2015.
Graph 2.1. Price burden of services delivered by Aquanet
Price burden is understood as the share of an average bill for water supply and sewagecollection in the disposable income of a household4. The set objective is the decreaseof price burden by the year 2020 in relation to 2016 by 0.15 percentage point, with theassumption that at this same time the value of the investment plan will not increase.
4 Disposable income is understood as 'sum of current income of the household from various sources,reduced by advances towards personal income tax deducted by the employer on behalf of the taxpayer (from paid work income and from certain benefits from social security and other benefits),by taxes paid on income from property, social security contributions, taxes paid by self-employedpersons, including freelance professionals and persons using private farm in agriculture, and bysocial security and health insurance premiums. Disposable income includes monetary and non-monetary income, including natural consumption (goods and services taken for the needs of a householdfrom the private farm or from the conducted business activity - agricultural and non-agricultural),as well as goods and services received free of charge. Disposable income is allocated to expenses andsavings' - Central Statistical Office - Information Portal.
34
At the same time, the 2012-2016 strategy did not introduce a disintegration of thestrategic goal related to the maintenance of environmental protection standards intoindividual strategic initiatives, but the current document split the achievement of thisgoal into the following measures:
1. Self-monitoring of own emissions means as the capability to automatically verifycompliance of own measurements conducted on Company's objects with thenorms and permits within the given period, as well as the capability to estimatethe cost of environmental fees.
2. 'Carbon footprint5' of own emissions generated in the process of water treatment,wastewater treatment and their transmission.
3. Industry Card - recording pollutants discharged to the sewage system so as toenable monitoring compliance with the required environmental protection norms.
2.6. Final remarks
The analysis of the Aquanet SA's 2016-2020 strategy indicates that this enterprise haschanged its approach to perceiving its role and place within its environment. Less em-phasis is placed on the increase of financial results, while greater attention is paid tosuch areas as customer relations and protection of the natural environment. This issignificant given the fact that this water supply and sewerage company operates inconditions of a natural monopoly.
Issues in connection with environmental protection have been strongly highlightedin the company's strategy for the years 2016-2020, which is manifested in the strategicinitiatives to be pursued, such as monitoring the condition of the natural environmentand ensuring enterprise's ecological compliance with the relevant acts of law. The initia-tive regarding the 'carbon footprint' comes forth as a reflection of the enterprise's re-sponsibility for climate change.
One strategic area which was not previously stressed too clearly relates to the enter-prise's employees. The 2016-2020 strategy places much more emphasis on the develop-ment of function-specific skills of the employees and on improving of management'scompetences.
Considering the foregoing, the contents of the Aquanet SA's 2016-2020 strategyattest to a more pronounced shift of the enterprise toward following the principles ofsustainable development.
5 Carbon footprint – the total set of greenhouse gas emissions caused by the production process,services or other activity, expressed as CO2.
C H A P T E R 3
Selected ESG issues in strategic analysis at Amica, Aquanet,B. Braun, PKN Orlen and Solaris Bus & Coach
3.1. Introductory remarks
Strategic analysis is a significant element of strategic controlling. It employs manyvarious methods, both regarding the analysis of enterprise's external conditions andof its internal issues, also those accounting for environmental and social determinantsof enterprise's operations, which are in line with the requirements of sustainabledevelopment1.
The purpose of this chapter is to demonstrate solutions related to strategic analysisat Amica, Aquanet, B. Braun, PKN Orlen and Solaris Bus & Coach enterprises, withan indication of those regarding sustainable development. The achievement of thisgoal dictated case studies as the research method of choice, as well determined thelayout of the chapter. First, research was conducted to verify whether the selected en-terprises declare interest in requirements of sustainable development at the strategiclevel. In order to achieve this, strategic documents of Amica, Aquanet and B. Braunwere analyzed to assess the declared extent of concern for environmental and socialaspects. Next, the main priorities have been presented, as well as the methods of strate-gic analysis employed at the Amica corporate group. Benchmarking applied at Aquanetis of interest in terms of the methodology of strategic analysis incorporating sustain-able development. It is the subject of the next part of this chapter. One of the methodsof strategic analysis incorporating environmental and social determinants is the analysisof stakeholder expectations. The use of this particular method at PKN Orlen is alsocovered in the following sub-chapter. The chapter concludes with a demonstrationof how the company Solaris Bus & Coach accounts for environmental aspects in itsanalysis of product life cycle.
1 Methods of strategic analysis of external and internal aspects of an enterprise, accounting for envi-ronmental and social determinants, have been discussed in: [Kochalski and Nowicki 2016].
36
3.2. Declared extent of concern for environmental and social aspectsin the strategic documents of Amica, Aquanet and B. Braun
The HIT 2023 strategy, currently pursued by the Amica corporate group, outlines thecompany's strategic goals and plans up until the year 2023. None of the success factors,which are simultaneously the determinants of the strategy, do not relate directly toenvironmental or social aspects [Amica 2014, p. 7]2. The company's strategy is firmlyrooted in the business determinants, characteristic for the market on which it operates.However, the mission of Amica group features some ESG elements, as it indicates thevarious company stakeholders. The mission of Amica reads as follows:
'Our ability to quickly respond to customer needs makes us an important supplierfor a wide range of household appliances in Europe. We focus on improving customersatisfaction; efficiently and effectively adapting business processes and structures tothe challenges of the market, creating value for shareholders, employees and localcommunities' [Amica 2014, p. 8].
The social sphere stakeholders indicated in the mission are:
customers, whose needs are in the centre of the company's business model, andthe ability to respond to them quickly is emphasized as a key strategic ability;
shareholders, employees and local communities, for whom the company createsvalue, through adapting business processes and structures to the challenges ofthe market.
Amica's vision gives centre stage to financial indicators, such as revenues, EBITDAand debt/EBITDA ratio, as well as to key markets and product portfolio [Amica 2014,p. 9]. Thus, the vision does not directly address ESG factors. It is noticeable that Amica'sstrategic concept is firmly based upon the market reality. However, the five componentsof the HIT 2023 strategy, along expansion onto new markets, strong regional brands,own product lines of home appliances and high kitchen production potential, also namea fifth element: excellence of internal processes and committed people in the group -and this relates directly to the social determinants of the company's operations [Amica2014, p. 11]. It is precisely within the strategy component that a set of measures hasbeen designed to build Amica's image as a reliable employer [Amica 2016].
At Aquanet, ESG factors are deeply embedded in the company's operational strategyfor the years 2016-2020. They are present on various levels of the detailed strategy,appearing in the vision, among the strategic goals and strategic projects alike.
2 Success factors included in Amica's strategy are listed further on in this chapter.
37
Aquanet's vision is [Ernst & Young 2015, p. 2]:
'To build our position through continued growth based on best practices. To ensuregood customer relations and the development of our employees. To be efficient andinnovative.'
Already the very vision of Aquanet incorporates social aspects of its operations,in the form of care for good customer relations and employee development. Thesedeclarations are further developed into strategic goals. Aquanet's operational strategyfor the years 2016-2020 contains four strategic goals [Ernst & Young 2015, p. 2]:
'C1 - development of an efficient and innovative operating model, C2 - customer care and protection of the natural environment, C3 - maintaining EBITDA margin in the years 2016-2020 at a level of at least 40%, C4 - improvement of affordability of water supply and sewerage services rendered
by Aquanet'.
The analysis of the foregoing declarations indicates that two of the four strategic goalsdirectly refer to incorporation of environmental and social aspects in the company'soperations - the second strategic goal expressly commands accounting for environmentaldeterminants and satisfying customer needs, while the fourth strategic goals invokes a sig-nificant social aspect of company operations, that is affordability of services rendered.
The above is broken down into more detailed measures as expressed in the strategicprojects which are to be pursued within the framework of each strategic goal. All strate-gic projects under the second goal relate to environmental and social aspects, as theyfocus on maintaining high customer satisfaction levels, observance of environmentalprotection norms and bringing infrastructure to inhabited areas [Ernst & Young 2015,p. 3]. Also the strategic project entailed by the fourth strategic goal concerns social as-pects, as it focuses on the analysis of price burden and potential for tariff modificationto increase affordability of services [Ernst & Young 2015, p. 4]. It must be noted, however,that also the two remaining strategic goals are to involve strategic projects of socialand environmental relevance, such as connecting new customers to the existing watersupply and sewage network (within the third strategic goal) and building an experiencedworkforce through the measurement and enhancement of function-specific compe-tences (within the first strategic goal) [Ernst & Young 2015, pp. 3-4].
The high share of declared environmental and social aspects in the strategic docu-ments of Aquanet seems a natural consequence of the characteristics of the enterprise'score activity, that is mainly water supply and sewerage services for inhabitants of the re-gion, coupled with a paramount significance of environmental impact. The strong focus onESG factors is also understandable given that this enterprise is a public utility company.
The B. Braun group 2015-2020 strategy rests on three values, that is innovation,efficiency and sustainability [B. Braun 2015a, p. 42]. The ultimate objective of the
38
company is to remain a family-owned enterprise and to finance its growth from itsown resources, while the strategic goals take on a tangible, quantifiable form (annualrevenue increase of 5 to 7% and EBITDA margin at a level of 16-18% all the way until2020) [B. Braun 2015a, p. 5], but direct references to environmental and social aspectsas one of the core values underpinning the company's philosophy are a clear declarationin this respect. This is understandable given not only the specific market on which thecompany operates (health care), but also the assumptions underlying the foundationsof running a family business, such as B. Braun.
3.3. Strategic analysis at Amica groupStrategic analysis at Amica corporate group preceded the drafting of the currently im-plemented strategy of the company, HIT 2023. The methodological approach to com-pany's strategic analysis entailed its macro- and micro-environment [Amica 2016].
This strategic analysis facilitated the singling out of both principal strategic di-lemmas and priorities of the company [Amica 2016]. The strategic priorities include[Amica 2015, pp. 18-25]:
expansion onto new markets, especially in Western Europe, through both acqui-sitions and organic growth (diversification);
building its brand position on key markets; development of own product lines; high kitchen appliances production potential, to be achieved through invest-
ments in raising production capacities and through development of new pro-duction competences and optimization of production costs;
excellence of internal processes and committed people in Amica group.
As regards the foregoing, the strategic analysis resulted in the indication of thefollowing success factors in the Amica strategy [Amica 2014, p. 7]:
'strong position on chosen European markets and a good financial standing ofAmica as a springboard for dynamic growth on both current and new markets;
the need to scale up the business, to build strong brands, to diversify sales throughgrowth on new markets and through new distribution channels, to offer a fullportfolio of home appliances and to increase efficiency so as to avoid takeoverby main competitors;
fragmentation of the market and significant market share of local players inWestern and Southern Europe pose and opportunity for Amica to develop itssales through their takeovers'.
Methods employed in the company's strategic analysis involve SWOT analysis, useof the BCG or ADL matrices, as well as benchmarking analysis [Amica 2016].
39
3.4. Employment of benchmarking in the strategic analysis at Aquanet
One of the methods employed in strategic analysis is benchmarking. Considering thespecificity of Aquanet's operations, benchmarking has proved an efficient tool in thestrategic diagnostics of the enterprise. The company participates in the 'EuropeanBenchmarking Co-operation' (EBC) project, whose 2014 research covered 43 watersupply and wastewater companies from 17 countries [European Benchmarking Co-operation 2015a, p. 1]. Given that sale prices in the company’s cannot be easily influenced,benchmarking serves not only as a tool of strategic analysis used to compare the per-formance of various enterprises representing the same industry; it is also a valuablemethod of indication of the most important Key Performance Indicators (KPIs),which are mainly cost indicators in this industry.
For example, Aquanet, as regards data for the year 2014, scored above the averagein the following areas: [European Benchmarking Co-operation 2015a, pp. 1-66; EuropeanBenchmarking Co-operation 2015b, pp. 1-72]:
energy consumption for wastewater treatment (kWh/population equivalentserved) - throughout the years 2010-2014, it was below the industry average inEurope;
distribution losses per mains length (m3/km/day) - in the years 2010-2014, itwas below the industry average in Europe;
mains failures (number of failures/100 km of network) - in 2011, below the in-dustry average in Europe, in the years 2010, 2012, 2013 and 2014 - above it;
total cost per unit (euro/m3) - in the years 2010-2014, it was below the industryaverage in Europe;
average age of the sewer system - in 2014, it was below the industry average inEurope;
average water supply network age - in 2014, it was below the industry averagein Europe;
customer service costs per connected property (euro/1000 m3) - in the years2012-2014, it was below the industry average in Europe.
The areas where Aquanet scored worse than its peers regarded the following indi-cators [European Benchmarking Co-operation 2015a, pp. 1-66; European BenchmarkingCo-operation 2015b, pp. 1-72]:
electricity use for water production and distribution (kWh//m3) - in the years2011-2014, it was above the industry average in Europe;
sewerage network blockages (number of blockages/100 km of network) - in theyears 2011-2014, it was above the industry average in Europe;
40
personnel intensity in water supply (full-time employees/1000 properties) - in theyears 2010-2014, it was above the industry average in Europe;
personnel intensity in water production process (full-time employees/m3 mln) -in the years 2010-2014, it was above the industry average in Europe;
personnel intensity in customer services connected to water supply operations(full-time employees/1000 properties) - in the years 2010-2014, it was abovethe industry average in Europe;
personnel intensity in wastewater operations (full-time employees/1000 proper-ties) - in the years 2010-2014, it was above the industry average in Europe.
The extensive data provided by benchmarking allows for an analysis of dynamicsin individual areas spread over subsequent years, for identification of reasons behindcompany's situation as compared to its industry peers from various countries, whichmay be applied in the process of designing measures in the strategic, tactical and op-erational dimension. One example within this context is the recurring higher thanaverage number of blockages in the sewerage network, whose analysis gave rise to theimplementation of an information campaign to reduce waste discharged into the net-work by its users [Aquanet 2016a]. Similarly, the poor performance regarding afforda-bility of utility services as compared to other European enterprises [European Bench-marking Co-operation 2015a, p. 20; European Benchmarking Co-operation 2015b, p. 21]has resulted in the incorporation of this issue into the operational strategy of Aquanet SAfor the years 2016-2020 as the fourth strategic goal [Ernst & Young 2015, p. 2].
3.5. Application of the analysis of stakeholders' expectations as a methodof strategic analysis accounting for environmental and social aspectsat PKN Orlen
The analysis of stakeholders' expectations (in German: Analyse der Stakeholderer-wartungen) is a method of strategic analysis accounting for environmental and socialaspects. One of the premises of this analysis is that long-term success of an enterprisehinges on striking a balance between the interests of various stakeholders [Steinke etal., 2014, pp. 54-55]. This analysis indicates not only the relevance of the individualissues to particular groups of interest; it also indicates their relevance to the businessoperations3.
The relevance matrix presented by PKN Orlen and included in this chapter asfigure 3.1 is an interesting example of the application of this analysis.
3 The analysis of stakeholders' expectations has been discussed in, among others: [Kochalski andNowicki 2016].
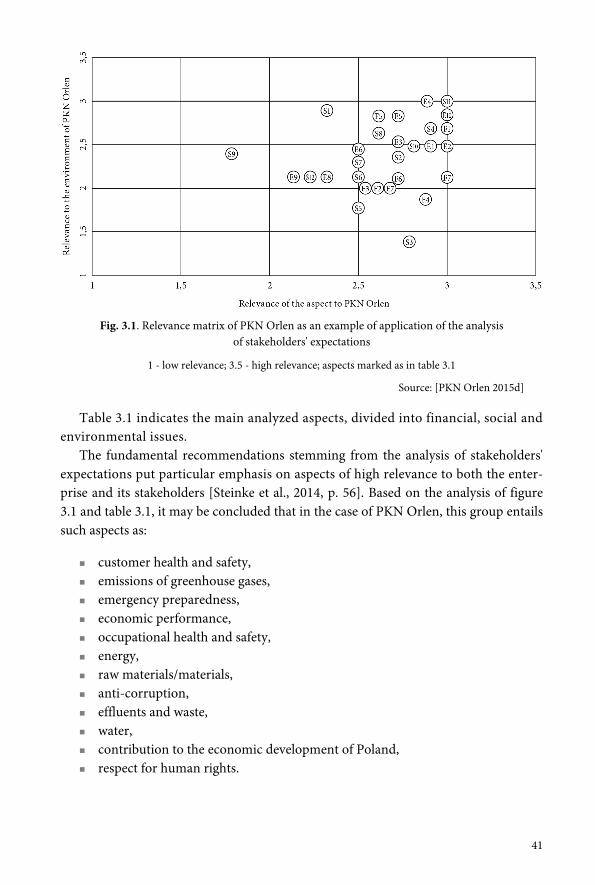
41
Fig. 3.1. Relevance matrix of PKN Orlen as an example of application of the analysisof stakeholders' expectations
1 - low relevance; 3.5 - high relevance; aspects marked as in table 3.1
Source: [PKN Orlen 2015d]
Table 3.1 indicates the main analyzed aspects, divided into financial, social andenvironmental issues.
The fundamental recommendations stemming from the analysis of stakeholders'expectations put particular emphasis on aspects of high relevance to both the enter-prise and its stakeholders [Steinke et al., 2014, p. 56]. Based on the analysis of figure3.1 and table 3.1, it may be concluded that in the case of PKN Orlen, this group entailssuch aspects as:
customer health and safety, emissions of greenhouse gases, emergency preparedness, economic performance, occupational health and safety, energy, raw materials/materials, anti-corruption, effluents and waste, water, contribution to the economic development of Poland, respect for human rights.
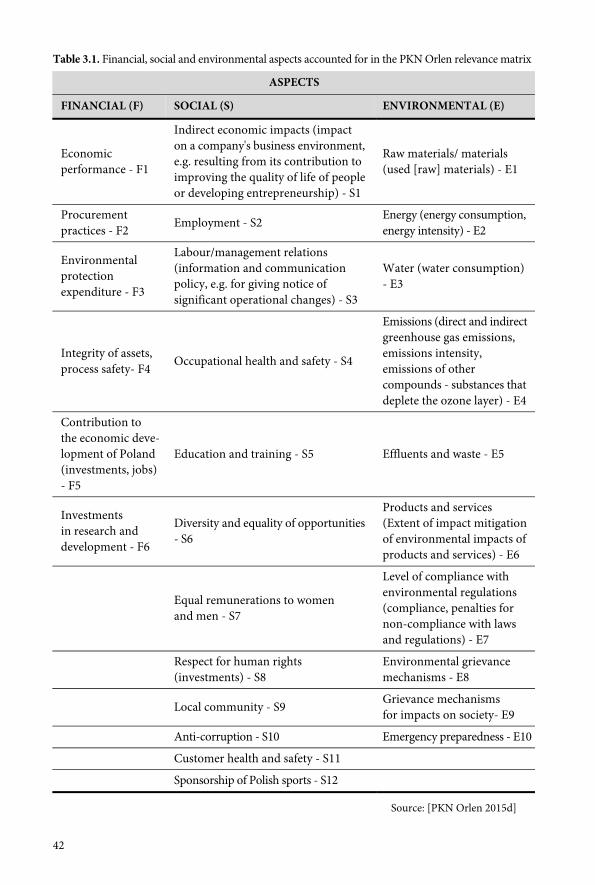
42
Table 3.1. Financial, social and environmental aspects accounted for in the PKN Orlen relevance matrix
ASPECTS
FINANCIAL (F) SOCIAL (S) ENVIRONMENTAL (E)
Economicperformance - F1
Indirect economic impacts (impacton a company's business environment,e.g. resulting from its contribution toimproving the quality of life of peopleor developing entrepreneurship) - S1
Raw materials/ materials(used [raw] materials) - E1
Procurementpractices - F2 Employment - S2 Energy (energy consumption,
energy intensity) - E2
Environmentalprotectionexpenditure - F3
Labour/management relations(information and communicationpolicy, e.g. for giving notice ofsignificant operational changes) - S3
Water (water consumption)- E3
Integrity of assets,process safety- F4 Occupational health and safety - S4
Emissions (direct and indirectgreenhouse gas emissions,emissions intensity,emissions of othercompounds - substances thatdeplete the ozone layer) - E4
Contribution tothe economic deve-lopment of Poland(investments, jobs)- F5
Education and training - S5 Effluents and waste - E5
Investmentsin research anddevelopment - F6
Diversity and equality of opportunities- S6
Products and services(Extent of impact mitigationof environmental impacts ofproducts and services) - E6
Equal remunerations to womenand men - S7
Level of compliance withenvironmental regulations(compliance, penalties fornon-compliance with lawsand regulations) - E7
Respect for human rights(investments) - S8
Environmental grievancemechanisms - E8
Local community - S9 Grievance mechanismsfor impacts on society- E9
Anti-corruption - S10 Emergency preparedness - E10
Customer health and safety - S11
Sponsorship of Polish sports - S12
Source: [PKN Orlen 2015d]
43
Pursuant to the recommendations of the analysis of stakeholders' expectations, theareas of high relevance to stakeholders, but of lower relevance from the perspective ofthe enterprise, should be given more attention, especially as regards the area of com-munication [Steinke et al., 2014, p. 56]. Based on the analysis of figure 3.1 and table 3.1,it may be concluded that in the case of PKN Orlen, this group entails the local community.
3.6. Accounting for environmental aspects in the product life cycleat Solaris Bus & Coach
The living standards in urban areas (where over 50% of global population live) de-pend to a great extent on whether these areas pursue the policy of sustainable trans-portation, which meets the expectations of the society, which is economically viableand which minimizes the negative environmental impacts. With the foregoing inmind, Solaris Bus & Coach consistently follows a path of investing in technologicalinnovations, improving their fleet in terms of quality and functionality, as well as interms of the ecological impact of the vehicles and by tapping into the opportunitiesoffered by alternative energy sources, for example by producing and advocating effi-cient electrical4, hybrid or biogas-fuelled buses [Solaris 2015, p. 38].
Concerning the area of production and management, in 2005 Solaris Bus & Coachmade the decision to implement an Environmental Management System compliantwith the international ISO 14001 standard. The implementation of this system has fa-cilitated the identification and assessment of environmental aspects in connection withcompany's functioning and the undertaking of measures to mitigate the negative im-pact of the enterprise on the environment.
Solaris Bus & Coach has identified the following environmental areas [Solaris 2015,p. 9]: consumption of natural resources, generation of waste, gas emissions, noise andvibrations, generation and discharge of wastewater and leakages.
The most important measures undertaken to mitigate the negative impact on theenvironment include [Solaris 2015, pp. 9, 10]:
'expanding the product range to include vehicles with a reduced negative im-pact on the natural environment (trams and hybrid buses, electric buses, diesel-engine buses meeting the most restrictive standards),
conducting research on reducing vehicle mass (less fuel consumption, lowerimpact on the road surface), reduction of vibration and noise inside the vehiclesand optimization of fuel consumption,
4 The applied innovations, along with the cutting-edge charging systems, guarantee operational relia-bility of buses that matches the performance of vehicles with combustion engines, with the simulta-neous significant reduction of costs of use. Another advantage is the enormous benefit to the naturalenvironment as regards emission of pollutants (zero exhaust emissions) [Solaris 2015, p. 36].
44
investments in the infrastructure, to reduce utility consumption in the processof production,
investments in the infrastructure, to reduce the negative impact on the naturalenvironment,
trainings for employees, to heighten their ecological awareness, introduction of information bulletins for vehicle users, imparting training sessions for users regarding economic use of Solaris vehicles, introduction of electronic documents and recommendation of double-sided
print of materials to reduce paper consumption, introduction of the 'material for material' programme (i.e. employees receive
new equipment once they bring in the old one).'
The foregoing measures are consistently pursued, and the method of their imple-mentation and following is constantly monitored by the management and throughinternal audits5.
In its Integrated Management System and Technical Safety Policy, the companyhas undertaken to [Solaris 2015, p. 22]:
'minimize the amount of technical solutions which may negatively affect theenvironment,
to carry out all activities in compliance with the provisions of law and withother requirements binding at Solaris,
to reduce energy and natural resources consumption in the process of vehicleproduction, their use and in the overall operations of the company,
to make all employees accountable not only for product quality, but also for theprotection of the natural environment,
to pursue rational management of waste and hazardous substances so as to re-duce their negative impact on the environment,
to enhance the ecological awareness of their employees, clients and subcontractors.'
As regards the use of company's products, Solaris Bus & Coach provides all its cli-ents with a maintenance bulletin, covering detailed instructions on how to use andservice the vehicles, and in particular including the summary of vehicle characteristicsand data on how they match the most restrictive environmental norms, a detailed firesafety instruction for the drivers, recommendations on eco-driving, instructions onmeasures to be taken in case of leakages and a description of how to dispose of spentparts and operating fluids. This document has been drawn up to minimize the negative
5 The Integrated Management System implemented at the company covers all locations and it meetsthe requirements of six different standards, i.e.: ISO 9001, ISO 14001, IRIS, on welding systems(EN ISO 3834-2 and DIN EN 15085-2) and regarding adhesive bonding (DIN 6701-2) [Solaris2015, pp. 25, 26].
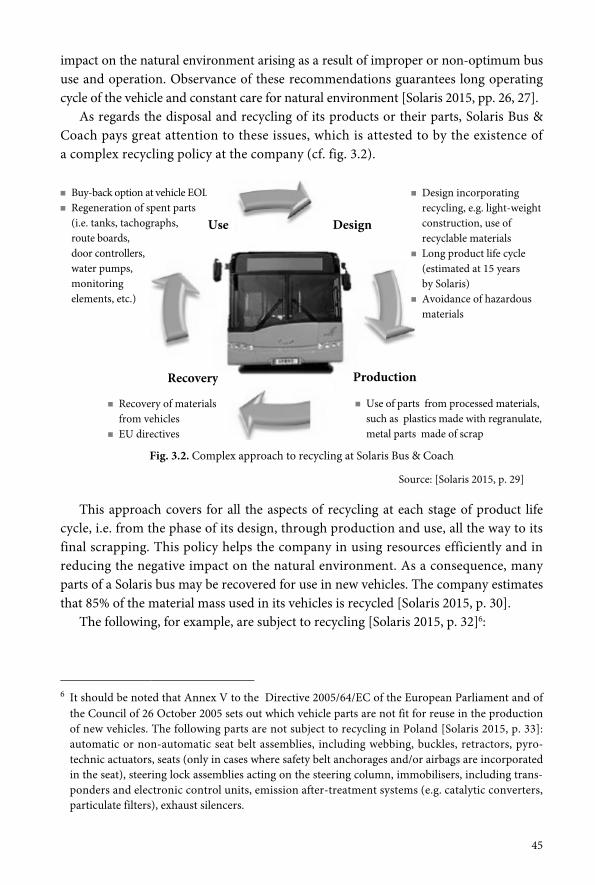
45
impact on the natural environment arising as a result of improper or non-optimum bususe and operation. Observance of these recommendations guarantees long operatingcycle of the vehicle and constant care for natural environment [Solaris 2015, pp. 26, 27].
As regards the disposal and recycling of its products or their parts, Solaris Bus &Coach pays great attention to these issues, which is attested to by the existence ofa complex recycling policy at the company (cf. fig. 3.2).
Fig. 3.2. Complex approach to recycling at Solaris Bus & Coach
Source: [Solaris 2015, p. 29]
This approach covers for all the aspects of recycling at each stage of product lifecycle, i.e. from the phase of its design, through production and use, all the way to itsfinal scrapping. This policy helps the company in using resources efficiently and inreducing the negative impact on the natural environment. As a consequence, manyparts of a Solaris bus may be recovered for use in new vehicles. The company estimatesthat 85% of the material mass used in its vehicles is recycled [Solaris 2015, p. 30].
The following, for example, are subject to recycling [Solaris 2015, p. 32]6:
6 It should be noted that Annex V to the Directive 2005/64/EC of the European Parliament and ofthe Council of 26 October 2005 sets out which vehicle parts are not fit for reuse in the productionof new vehicles. The following parts are not subject to recycling in Poland [Solaris 2015, p. 33]:automatic or non-automatic seat belt assemblies, including webbing, buckles, retractors, pyro-technic actuators, seats (only in cases where safety belt anchorages and/or airbags are incorporatedin the seat), steering lock assemblies acting on the steering column, immobilisers, including trans-ponders and electronic control units, emission after-treatment systems (e.g. catalytic converters,particulate filters), exhaust silencers.
Design incorporatingrecycling, e.g. light-weightconstruction, use ofrecyclable materials
Long product life cycle(estimated at 15 yearsby Solaris)
Avoidance of hazardousmaterials
Buy-back option at vehicle EOL Regeneration of spent parts
(i.e. tanks, tachographs,route boards,door controllers,water pumps,monitoringelements, etc.)
Recovery of materialsfrom vehicles
EU directives
Use of parts from processed materials,such as plastics made with regranulate,metal parts made of scrap
Use Design
Recovery Production
46
aluminium (beams, rear engine covers, lower side panels, elements of the gearbox, elements of the engine, radiators),
steel (frame, wheel covers, external doors, elements of the engine, wheel centres,side flaps, axis components, drive shafts, elements of the exhaust and suctionsystem, elements of the heating system, pneumatic pipes, railings, rims, seatinganchorages, door elements, engine cushions, disabled ramps),
copper (electric cables), oils and fluids (fuel oil, AdBlue fluid, coolant, windshield wiper fluid, brake fluid,
oils in control augmentation system, hydraulic oil, engine oil, gear box oil, fansystem drive oil, AC freon, battery acid),
polymers (bumpers, window beams, fluid containers, pipe joints, electrical in-stallation, reflector mounts and covers, elements of the driver's cabin, externalcovers, passenger seats, heating/AC channels, registration plate mounts, driver'sseats, air intake grates, floor splats, linings),
elastomers (gaskets, tyres, Sika waterstops, splash guards, suspension compo-nents, engine cushions, cable insulation),
glass (external windshields, sunroofs, partition walls, door glazing), others (plywood, batteries, catalysts, dibond composites, electronic elements).
3.7. Final remarks
The purpose of this chapter was to present selected aspects of strategic analysis at Amica,Aquanet, B. Braun, PKN Orlen and Solaris Bus & Coach. It was examined which of theapplied methods directly respond to the requirements of sustainable development.
This objective has been fulfilled. Declared extent of concern for environmental andsocial aspects in the strategic documents of Amica, Aquanet and B. Braun has beenanalyzed. Next, the main priorities and methods of strategic analysis employed at theAmica corporate group have been presented. The chapter also explores the strategicdeterminants of benchmarking application at Aquanet, a company whose operationsare strictly connected to both environmental and social aspects. The next part of thechapter examines the application of the stakeholders' expectations analysis method atPKN Orlen. Accounting for environmental aspects in the product life cycle at SolarisBus & Coach has also been indicated. Each of the sub-chapters offers a commentary onthe practical solutions employed at the discussed enterprises.
C H A P T E R 4
Financial planning in the assessmentof profitability of green investmentsillustrated by the example of a wind farm
4.1. Introductory remarks
This chapter, based on the example of an investment in a wind farm, explores the im-portance of financial planning in the context of investment decisions of enterprisesfocused on green objectives. The chapter applies financial planning techniques pre-sented from a theoretical standpoint in the book 'Green Controlling and Finance.Theoretical Framework.'
The present chapter indicates the significance and development of wind power in-dustry. It further presents basic assumptions relating to a wind farm investment, placingmost emphasis on estimation of investment expenditures. The subsequent two sub-chapters focus, respectively, on the presentation and justification of the adopted as-sumptions as regards income and costs of the discussed project. The following part ofthe chapter presents and discusses the main income statement items and cash flowstatement of the enterprise. Next, the analysis shifts to characterize the guiding prin-ciples applied in determining the value of cash flows considered when evaluatingeffectiveness of this investment and estimating the discount rate (weighted averagecost of capital). Application of these principles has facilitated calculation of basic meas-ures of project profitability, such as NPV, IRR, MIRR or payback period. Analysis ofNPV sensitivity to key project parameters is of paramount importance in the processof building a financial plan designed to assess investment profitability. This analysisenabled to determine the risk involved with investment in a wind farm.
48
4.2. Development of wind power industry as one of the formsof renewable energy
One of the assumptions underlying the 'Europe 2020' Strategy [European Commis-sion 2010, p. 12] is reduction of emission of greenhouse gases by 20% as comparedwith the emission levels from 1990, as well as to increase the share of renewable en-ergy up to 20% of overall energy consumption. Poland should therefore lower theshare of energy generated from conventional sources in favour of renewable sources.Costs of green energy generation are higher than those of energy generated from carboncombustion, hence the need for the State's support of producers of e.g. wind energy.Such support is channelled through the so-called 'green certificate' market.
Wind power industry is a fast-growing energy sector. The technology of wind en-ergy generation is constantly improved. Over the last 20 years, there has been an al-most hundred-fold increase (from 25 kW to 2500 kW and more) in power output ofa single turbine, while the costs of production of one unit of energy has shrunk toabout one-fifth [Wiśniewski, Michałowska-Knap and Koć 2012, p. 12].
The development of the wind power industry (market introduction of turbines de-signed for terrains with low wind speeds) has made it economically feasible to pro-duce energy in most areas of Poland, providing the turbines are appropriately selectedfor the location and the wind farm is duly optimized. The technical potential of windenergy is largely dependent on the spatial layout of open terrains. [Wiśniewski,Michałowska-Knap and Koć 2012, p. 14]. Two-thirds of Poland's territory present ad-vantageous conditions for use of wind energy. The best locations in this respect are theBaltic Coast and the Suwałki Region, where the average annual wind speed exceeds 4.5 m/s[Gnatowska and Wąs 2015, p. 24].
4.3. Investment outlays and fundamental project assumptions
The integrated appraisal of the efficiency of energy generation from renewable sourcesdoes not hinge merely on economic assessment [Dzik 2005]. The process of profitabilityassessment of a green investment should start with a technical assessment study (in thecase of wind farms to evaluate wind power efficiency), followed by economic, social andenvironmental assessment. In view of the nature of this work, the present chapter willfocus on the financial evaluation of investment effectiveness, with particular emphasis onNPV sensitivity analysis. Technical aspects will not receive much coverage here, althoughthey are certainly relevant to the final economic calculus. In the following appraisal ofinvestment in a wind farm, the technical parameters related to determination of expen-ditures, income from the amount of generated power and operating costs have beendetermined based on publications of following authors: R. Gnatowska and A. Wąs [2015],M. Suska-Szczerbicka and E. Weiss [2013], R. Pesta [2009], J. Paska [2008].
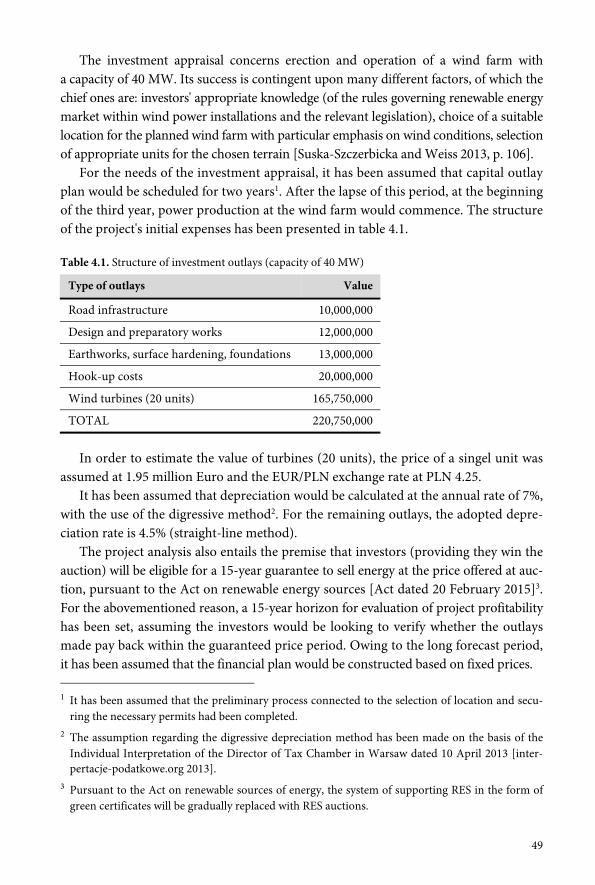
49
The investment appraisal concerns erection and operation of a wind farm witha capacity of 40 MW. Its success is contingent upon many different factors, of which thechief ones are: investors' appropriate knowledge (of the rules governing renewable energymarket within wind power installations and the relevant legislation), choice of a suitablelocation for the planned wind farm with particular emphasis on wind conditions, selectionof appropriate units for the chosen terrain [Suska-Szczerbicka and Weiss 2013, p. 106].
For the needs of the investment appraisal, it has been assumed that capital outlayplan would be scheduled for two years1. After the lapse of this period, at the beginningof the third year, power production at the wind farm would commence. The structureof the project's initial expenses has been presented in table 4.1.
Table 4.1. Structure of investment outlays (capacity of 40 MW)
Type of outlays Value
Road infrastructure 10,000,000
Design and preparatory works 12,000,000
Earthworks, surface hardening, foundations 13,000,000
Hook-up costs 20,000,000
Wind turbines (20 units) 165,750,000
TOTAL 220,750,000
In order to estimate the value of turbines (20 units), the price of a singel unit wasassumed at 1.95 million Euro and the EUR/PLN exchange rate at PLN 4.25.
It has been assumed that depreciation would be calculated at the annual rate of 7%,with the use of the digressive method2. For the remaining outlays, the adopted depre-ciation rate is 4.5% (straight-line method).
The project analysis also entails the premise that investors (providing they win theauction) will be eligible for a 15-year guarantee to sell energy at the price offered at auc-tion, pursuant to the Act on renewable energy sources [Act dated 20 February 2015]3.For the abovementioned reason, a 15-year horizon for evaluation of project profitabilityhas been set, assuming the investors would be looking to verify whether the outlaysmade pay back within the guaranteed price period. Owing to the long forecast period,it has been assumed that the financial plan would be constructed based on fixed prices.
1 It has been assumed that the preliminary process connected to the selection of location and secu-ring the necessary permits had been completed.
2 The assumption regarding the digressive depreciation method has been made on the basis of theIndividual Interpretation of the Director of Tax Chamber in Warsaw dated 10 April 2013 [inter-pertacje-podatkowe.org 2013].
3 Pursuant to the Act on renewable sources of energy, the system of supporting RES in the form ofgreen certificates will be gradually replaced with RES auctions.
50
It has been assumed that within the first year, 33% of outlays for fixed assets wouldbe incurred and financed from equity, while in the second year, the remaining outlayswould be made and financed with a loan. The investment, then, would be financedin 33% from equity and in 67% from external capital in the form of a bank loan4.The assumed loan interest rate is 6.53%5, and the loan to be paid off within 15 years.
4.4. Sales revenues
A wind farm's income comes from the sale of energy. Power production depends ona number of variables: for example wind conditions, commercial terms as laid downin the connection and sale contracts and the prices of electric power. For the purposeof potential income estimation, the following technical assumptions have been adopted:
wind farm capacity - 40 MW, maximum efficiency - 2400 MWh/MW.
In order to forecast income, it has been cautiously assumed that efficiency wouldreach 2200 MWh/MW, which would translate into 88 000 MWh of annual power output.
As already indicated before, it has been assumed that investors would be eligiblefor the 15-year guarantee to sell energy at the prices offered at auction. Pursuant to theRegulation of the Minister of Economy on the reference price of electric power fromrenewable sources of energy, in year 2016 [Regulation dated 13 November 2015], themaximum price for the sale of energy from new RES installations, launching energyproduction based on auctions, will stand at PLN 385/MWh for onshore wind powerplants with a capacity exceeding 1 MW. Considering the industry expectations relatingto the price levels acceptable to investors6, for the purpose of this analysis, a price ofPLN 380/MWh, being very close to the maximum price, has been assumed. Under theabove assumptions about the amount and unit price of produced power, the total an-nual income would amount to PLN 33,440,000.
4 Such capital structure has been laid down in relation to the decision to adopt, for the analyzedproject, the discount rate of weighted average cost of capital (WACC) as recommended by DiaCore(institution appointed by the European Parliament to support renewable energy policies withinthe EU). According to DiaCore's guidelines regarding WACC for enterprises pursuing investmentsin renewable sources of energy in Poland are the point of departure for the above-quoted sharesof equity and debt.
5 The credit interest rate has been adopted in accordance with the assumptions made in the evalu-ation of WACC by DiaCore for the year 2014, uprated by inflation factor (99.1 [Central StatisticalOffice]) in 2015.
6 Ciepiela D., 2015, Czy nowy system wsparcia OZE będzie skuteczny?, http://energetyka.wnp.pl/czy-nowy-system-wsparcia-oze-bedzie-skuteczny,257326_1_0_0.html
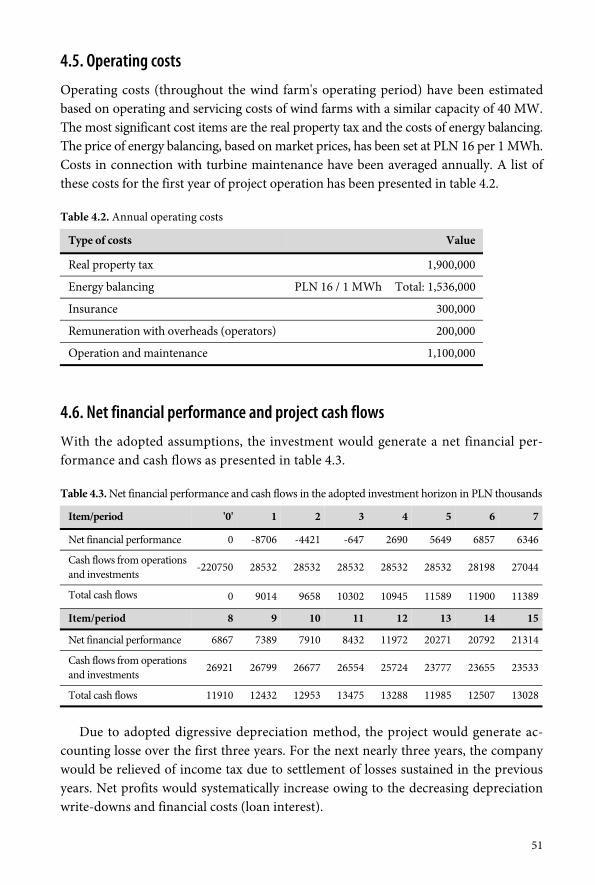
51
4.5. Operating costs
Operating costs (throughout the wind farm's operating period) have been estimatedbased on operating and servicing costs of wind farms with a similar capacity of 40 MW.The most significant cost items are the real property tax and the costs of energy balancing.The price of energy balancing, based on market prices, has been set at PLN 16 per 1 MWh.Costs in connection with turbine maintenance have been averaged annually. A list ofthese costs for the first year of project operation has been presented in table 4.2.
Table 4.2. Annual operating costs
Type of costs Value
Real property tax 1,900,000
Energy balancing PLN 16 / 1 MWh Total: 1,536,000
Insurance 300,000
Remuneration with overheads (operators) 200,000
Operation and maintenance 1,100,000
4.6. Net financial performance and project cash flows
With the adopted assumptions, the investment would generate a net financial per-formance and cash flows as presented in table 4.3.
Table 4.3. Net financial performance and cash flows in the adopted investment horizon in PLN thousands
Item/period '0' 1 2 3 4 5 6 7
Net financial performance 0 -8706 -4421 -647 2690 5649 6857 6346
Cash flows from operationsand investments
-220750 28532 28532 28532 28532 28532 28198 27044
Total cash flows 0 9014 9658 10302 10945 11589 11900 11389
Item/period 8 9 10 11 12 13 14 15
Net financial performance 6867 7389 7910 8432 11972 20271 20792 21314
Cash flows from operationsand investments
26921 26799 26677 26554 25724 23777 23655 23533
Total cash flows 11910 12432 12953 13475 13288 11985 12507 13028
Due to adopted digressive depreciation method, the project would generate ac-counting losse over the first three years. For the next nearly three years, the companywould be relieved of income tax due to settlement of losses sustained in the previousyears. Net profits would systematically increase owing to the decreasing depreciationwrite-downs and financial costs (loan interest).
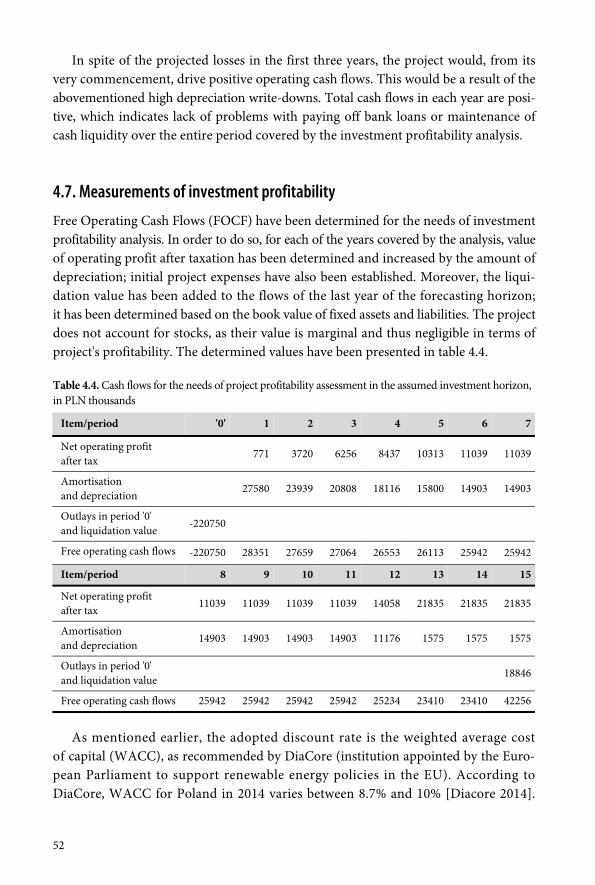
52
In spite of the projected losses in the first three years, the project would, from itsvery commencement, drive positive operating cash flows. This would be a result of theabovementioned high depreciation write-downs. Total cash flows in each year are posi-tive, which indicates lack of problems with paying off bank loans or maintenance ofcash liquidity over the entire period covered by the investment profitability analysis.
4.7. Measurements of investment profitability
Free Operating Cash Flows (FOCF) have been determined for the needs of investmentprofitability analysis. In order to do so, for each of the years covered by the analysis, valueof operating profit after taxation has been determined and increased by the amount ofdepreciation; initial project expenses have also been established. Moreover, the liqui-dation value has been added to the flows of the last year of the forecasting horizon;it has been determined based on the book value of fixed assets and liabilities. The projectdoes not account for stocks, as their value is marginal and thus negligible in terms ofproject's profitability. The determined values have been presented in table 4.4.
Table 4.4. Cash flows for the needs of project profitability assessment in the assumed investment horizon,in PLN thousands
Item/period '0' 1 2 3 4 5 6 7
Net operating profitafter tax 771 3720 6256 8437 10313 11039 11039
Amortisationand depreciation
27580 23939 20808 18116 15800 14903 14903
Outlays in period '0'and liquidation value
-220750
Free operating cash flows -220750 28351 27659 27064 26553 26113 25942 25942
Item/period 8 9 10 11 12 13 14 15
Net operating profitafter tax
11039 11039 11039 11039 14058 21835 21835 21835
Amortisationand depreciation 14903 14903 14903 14903 11176 1575 1575 1575
Outlays in period '0'and liquidation value
18846
Free operating cash flows 25942 25942 25942 25942 25234 23410 23410 42256
As mentioned earlier, the adopted discount rate is the weighted average costof capital (WACC), as recommended by DiaCore (institution appointed by the Euro-pean Parliament to support renewable energy policies in the EU). According toDiaCore, WACC for Poland in 2014 varies between 8.7% and 10% [Diacore 2014].
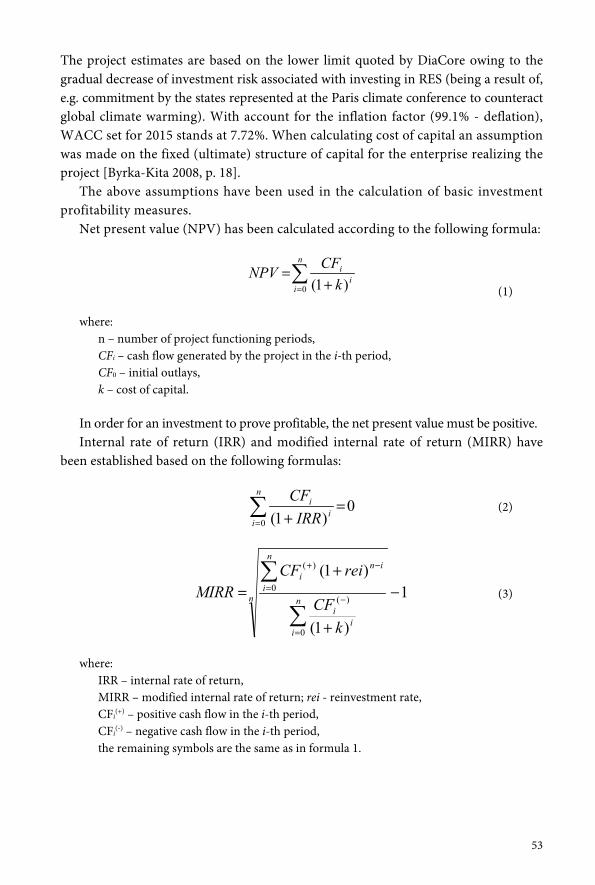
53
The project estimates are based on the lower limit quoted by DiaCore owing to thegradual decrease of investment risk associated with investing in RES (being a result of,e.g. commitment by the states represented at the Paris climate conference to counteractglobal climate warming). With account for the inflation factor (99.1% - deflation),WACC set for 2015 stands at 7.72%. When calculating cost of capital an assumptionwas made on the fixed (ultimate) structure of capital for the enterprise realizing theproject [Byrka-Kita 2008, p. 18].
The above assumptions have been used in the calculation of basic investmentprofitability measures.
Net present value (NPV) has been calculated according to the following formula:
n
ii
i
kCFNPV
0 )1( (1)
where:n – number of project functioning periods,CFi – cash flow generated by the project in the i-th period,CF0 – initial outlays,k – cost of capital.
In order for an investment to prove profitable, the net present value must be positive.Internal rate of return (IRR) and modified internal rate of return (MIRR) have
been established based on the following formulas:
0)1(0
n
ii
i
IRRCF
(2)
1
)1(
)1(
0
)(0
)(
n n
ii
i
n
i
ini
kCF
reiCFMIRR (3)
where:IRR – internal rate of return,MIRR – modified internal rate of return; rei - reinvestment rate,CFi
(+) – positive cash flow in the i-th period,CFi
(-) – negative cash flow in the i-th period,the remaining symbols are the same as in formula 1.
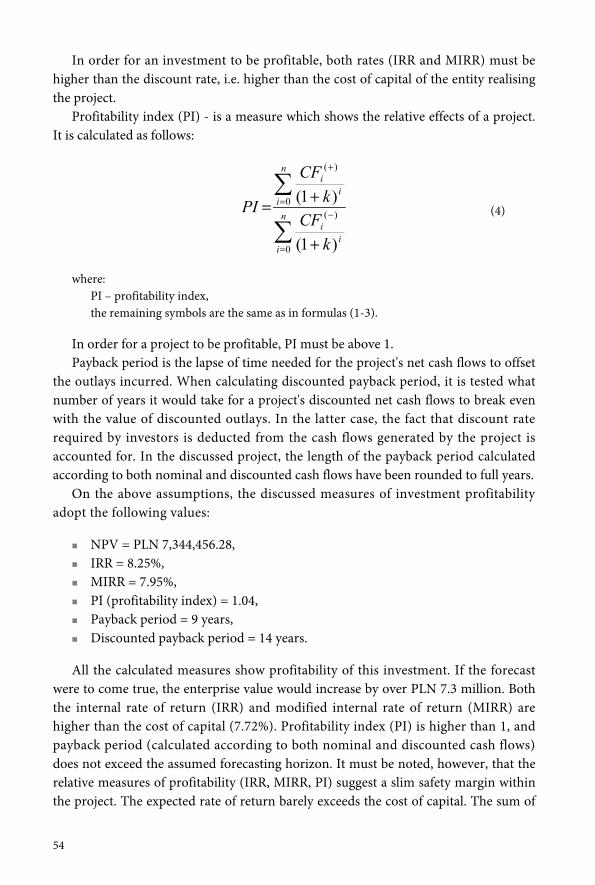
54
In order for an investment to be profitable, both rates (IRR and MIRR) must behigher than the discount rate, i.e. higher than the cost of capital of the entity realisingthe project.
Profitability index (PI) - is a measure which shows the relative effects of a project.It is calculated as follows:
n
ii
i
n
ii
i
kCFk
CF
PI
0
)(0
)(
)1(
)1((4)
where:PI – profitability index,the remaining symbols are the same as in formulas (1-3).
In order for a project to be profitable, PI must be above 1.Payback period is the lapse of time needed for the project's net cash flows to offset
the outlays incurred. When calculating discounted payback period, it is tested whatnumber of years it would take for a project's discounted net cash flows to break evenwith the value of discounted outlays. In the latter case, the fact that discount raterequired by investors is deducted from the cash flows generated by the project isaccounted for. In the discussed project, the length of the payback period calculatedaccording to both nominal and discounted cash flows have been rounded to full years.
On the above assumptions, the discussed measures of investment profitabilityadopt the following values:
NPV = PLN 7,344,456.28, IRR = 8.25%, MIRR = 7.95%, PI (profitability index) = 1.04, Payback period = 9 years, Discounted payback period = 14 years.
All the calculated measures show profitability of this investment. If the forecastwere to come true, the enterprise value would increase by over PLN 7.3 million. Boththe internal rate of return (IRR) and modified internal rate of return (MIRR) arehigher than the cost of capital (7.72%). Profitability index (PI) is higher than 1, andpayback period (calculated according to both nominal and discounted cash flows)does not exceed the assumed forecasting horizon. It must be noted, however, that therelative measures of profitability (IRR, MIRR, PI) suggest a slim safety margin withinthe project. The expected rate of return barely exceeds the cost of capital. The sum of
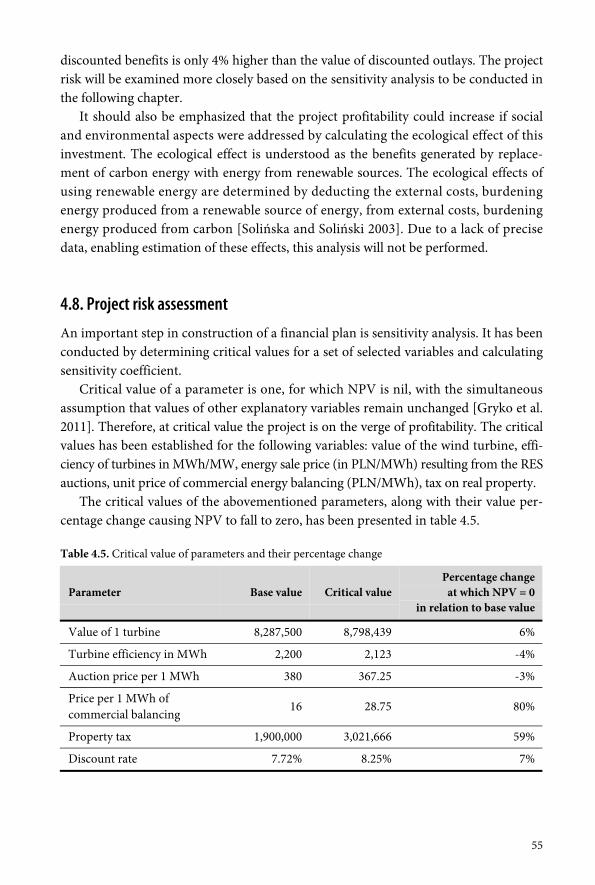
55
discounted benefits is only 4% higher than the value of discounted outlays. The projectrisk will be examined more closely based on the sensitivity analysis to be conducted inthe following chapter.
It should also be emphasized that the project profitability could increase if socialand environmental aspects were addressed by calculating the ecological effect of thisinvestment. The ecological effect is understood as the benefits generated by replace-ment of carbon energy with energy from renewable sources. The ecological effects ofusing renewable energy are determined by deducting the external costs, burdeningenergy produced from a renewable source of energy, from external costs, burdeningenergy produced from carbon [Solińska and Soliński 2003]. Due to a lack of precisedata, enabling estimation of these effects, this analysis will not be performed.
4.8. Project risk assessment
An important step in construction of a financial plan is sensitivity analysis. It has beenconducted by determining critical values for a set of selected variables and calculatingsensitivity coefficient.
Critical value of a parameter is one, for which NPV is nil, with the simultaneousassumption that values of other explanatory variables remain unchanged [Gryko et al.2011]. Therefore, at critical value the project is on the verge of profitability. The criticalvalues has been established for the following variables: value of the wind turbine, effi-ciency of turbines in MWh/MW, energy sale price (in PLN/MWh) resulting from the RESauctions, unit price of commercial energy balancing (PLN/MWh), tax on real property.
The critical values of the abovementioned parameters, along with their value per-centage change causing NPV to fall to zero, has been presented in table 4.5.
Table 4.5. Critical value of parameters and their percentage change
Parameter Base value Critical valuePercentage change
at which NPV = 0in relation to base value
Value of 1 turbine 8,287,500 8,798,439 6%
Turbine efficiency in MWh 2,200 2,123 -4%
Auction price per 1 MWh 380 367.25 -3%
Price per 1 MWh ofcommercial balancing
16 28.75 80%
Property tax 1,900,000 3,021,666 59%
Discount rate 7.72% 8.25% 7%
56
The analysis of values presented in table 5 allows for a conclusion that profitabilityof the examined investment depends primarily on the price, the wind farm would beable to receive for 1 MWh of produced power. Considering that the maximum priceaccepted by the Ministry of Economy is PLN 385/MWh, investor representatives atauctions should not settle for prices significantly lower than the maximum rates. Project'sNPV also hinges on turbine efficiency which, in turn, depends also on wind forces.Efficiency reduction by more than 4% equals drop in energy output rendering theproject unprofitable. NPV displays high sensitivity to change of turbine price. Of course,regardless of whether the change is caused by change in manufacturer's price or a changein the EUR/PLN exchange rate, a 6% increase will bring the investment to the brink ofprofitability. The tax on real property or the fees for commercial energy balancinghave much less profound effects on project profitability. Whereas comparison of IRRand WACC, shows that an increase in capital cost in excess of 7% will render theproject unprofitable.
Also, sensitivity coefficient has been calculated for the foregoing variables. It deter-mines how NPV (or another explanatory variable) will change when the input variablechanges by 1% [Wiśniewski 2008, p. 172]. Its formula is as follows:
1002
21
2
21
ZZZNPV
NPVNPV
Wwr (5)
where:NPV1 – NPV value at input variable equal to Z1,
NPV2 – NPV value at input variable equal to Z2,
Z1 – value of the input variable after change,Z2 – base value of the input variable.
The values in table 4.6 confirm the conclusions drawn on the basis of critical valuesof individual parameters. Of the greatest significance for investment's success are theprice of sold energy and the efficiency (production volume). Also the price of turbinesand the cost of capital are very important. By applying sensitivity analysis, the investoracquires information on the type of variables that particularly require verification forcorrectness or should be watched with particular care, as changes in their values mayimpede accomplishment of desired objectives.
In order to better illustrate the influence of individual parameters on NPV, a graphhas been drawn, visualising how NPV would change in response to the change of individ-ual input parameters by: –10%, –5%, –3%, 3%, 5% and 10%, respectively. The greaterthe inclination angle of the curve, the larger the influence of a given parameter on the NPV.The graph confirms that of the highest significance for project's success are the price andamount of produced energy, as well as of the price of wind turbines and discount rates.
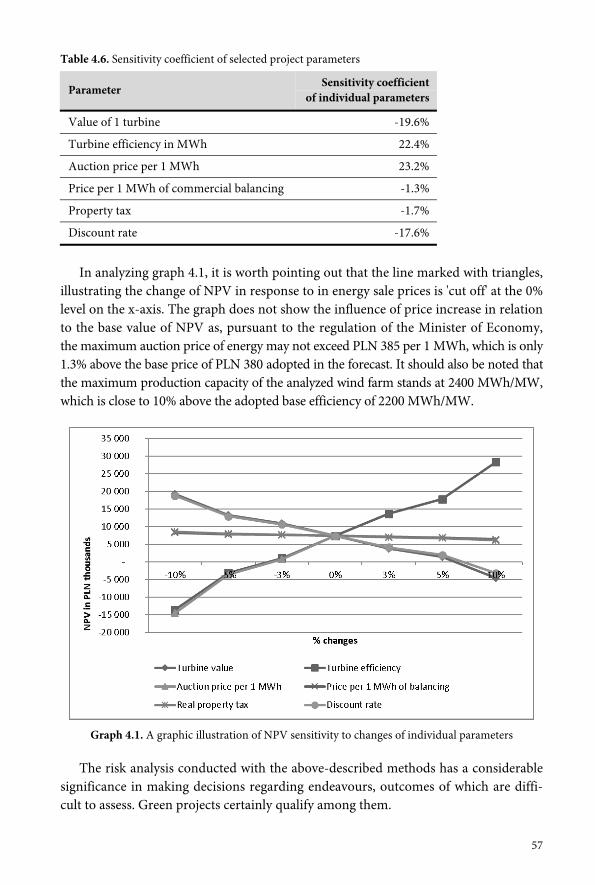
57
Table 4.6. Sensitivity coefficient of selected project parameters
Parameter Sensitivity coefficientof individual parameters
Value of 1 turbine -19.6%
Turbine efficiency in MWh 22.4%
Auction price per 1 MWh 23.2%
Price per 1 MWh of commercial balancing -1.3%
Property tax -1.7%
Discount rate -17.6%
In analyzing graph 4.1, it is worth pointing out that the line marked with triangles,illustrating the change of NPV in response to in energy sale prices is 'cut off' at the 0%level on the x-axis. The graph does not show the influence of price increase in relationto the base value of NPV as, pursuant to the regulation of the Minister of Economy,the maximum auction price of energy may not exceed PLN 385 per 1 MWh, which is only1.3% above the base price of PLN 380 adopted in the forecast. It should also be noted thatthe maximum production capacity of the analyzed wind farm stands at 2400 MWh/MW,which is close to 10% above the adopted base efficiency of 2200 MWh/MW.
Graph 4.1. A graphic illustration of NPV sensitivity to changes of individual parameters
The risk analysis conducted with the above-described methods has a considerablesignificance in making decisions regarding endeavours, outcomes of which are diffi-cult to assess. Green projects certainly qualify among them.
58
4.9. Final remarks
Financial planning makes it possible for interested entities to verify whether their goalsmay be achieved, and to determine the financial outcome of this process. What is par-ticularly important, it facilitates assessment of risk associated with achievement of pro-jected results from company's operation. The presented investment appraisal of windenergy production may sensitize some potential stakeholders in this type of projects(investors, public authorities supporting investments in renewable energy) to the ne-cessity of employing appropriate procedures and techniques of financial assessment ofinvestment profitability and, above all, turn their attention to significance of per-forming sensitivity analysis of potential investment results, to show their sensitivity tothe change of significant parameters. It should be noted that the procedure of sensitivityanalysis itself overlooks the likelihood of occurrence of parameter changes. Therefore,the factors determinative of NPV must be evaluated for their proneness to change andscale of such change. The conducted analysis has indicated a considerable influence ofthe sale prices of produced electric power on the project profitability. Pursuant to theregulation of the Minister of Economy, the maximum auction price of energy may notexceed PLN 385 per 1 MWh, which is only 1.3% above the base price of PLN 380adopted in the forecast. This fact commands investors' caution at the stage of auctiontenders. It may be surmised, however, that the industry is well aware that the maximumprice as proposed by the Ministry, even if not ideal, is still acceptable to investors[Ciepiela 2015]. Moreover, it should be kept in mind that investors who plan to buildnew wind farms, besides the support in the form of subsidies to energy market prices, mayalso take advantage of available schemes to finance outlays on infrastructure necessaryto generate energy from renewable sources.
The second most significant parameter determinative of NPV was turbine efficiency,which directly translates into the amount of energy produced. However, it seems therisk of production capacity reduction is small. The progress of science and technologyin the scope of determining wind farm locations, as well as production of increasinglyefficient installations, suggest low likelihood of decrease in rated turbine efficiency.Also the prices of wind turbines are steadily decreasing [Gazeta Prawna 2013], whichmeans that the risk of a sudden spike in the prices is not likely to transpire and this, asshown by the sensitivity analysis, also determined the project value to a great extent.The risk of changes in discount rates may be considered moderate. Any possible in-crease in discount rates, caused by inflation processes, would be offset by the increaseof energy prices at RES auctions, as the regulation of the Minister of Economy expresslystates that the maximum energy price at auctions shall be adjusted by inflation coefficient.What cannot be excluded, of course, is an increase of capital cost, related to e.g. possiblenewunfavourable legislation, governing wind energy generation, coming into force.
C H A P T E R 5
Budgeting in green controlling at B. Braun Melsungen
5.1. Introductory remarks
Budgeting and budget deviation analysis constitute the oldest and one of the best-known controlling tools. From the theoretical point of view [Szulczewska-Remi andZerbst, 2016], the fundamental problems with budgeting in green controlling include:multidimensionality of a green budget, which accounts for economic, environmentaland social aspects, and for reconciliation of the objectives of various stakeholder groupswithin the areas.
The principal objective of this chapter is to present the budgeting process as the fun-damental tool of green controlling at the multinational concern B. Braun Melsungen AG.It explores primarily the innovative example of improved budgeting, i.e. Latest Estimatebudgeting, that forms ground for increased efficiency, simplification and leanness.
As regards environmental aspects, on the other hand, the chapter provides exam-ples of capital budgeting and, in the area of building social capital, it describes the CSRactivity matrix and the budgeting process of one of the company's social projects,Children & Youth Weeks 'New Researchers Needed'.
5.2. Enterprise characteristics
B. Braun Melsungen AG is one of world's leading medical companies, manufacturingand distributing worldwide a wide range of products, from surgical instruments to in-novative implants and medical equipment, available in the form of individual productsor system solutions.
The history of the enterprise dates back to 1839, when one of the ancestors of thecurrent owners purchased a pharmacy in the town of Melsungen, where over timea production plant was established. Throughout its 177-year history, the company hasmarketed a number of innovative products, such as infusion pumps.
60
Currently, the company has subsidiaries in 64 countries and is one of the leadingproviders of health care equipment and materials applied in such areas of medicine assurgery, neurosurgery, orthopaedics, nephrology, urology, cardiology or dentistry.The leading position of this company is attested to by numerous awards, certificatesand honours, placing B. Braun within top 20 largest medical companies, according tothe Top 30 Global Medical Device Companies.
The company's philosophy is founded upon the principle of sharing expertise,which is based on 'a promise from B. Braun to customers and colleagues to sharemedical knowledge and expertise for the benefit of health, to use this knowledge andbuild on it effectively and consistently, in dialogue with partners' (www.bbraun.com).
The B. Braun brand rests on three pillars, namely: supporting innovation, increasingefficiency and sustainable development. Innovation refers not only to products orservices, but also to internal company processes, which are to improve its everydayfunctioning. Efficiency is expressed, among others, through the innovative customerservices with the use of cutting-edge electronic, Internet-based and digital tools.
As a family-owned company, B. Braun assists its employees in all regions of itsoperation; it also delivers the goal of sustainable development through respect for thenatural environment, and also by involvement in social life, through financing andorganizing support for scientific, artistic and cultural projects.
5.3. Green controlling in the economic aspectThe concept of sustainable development of an enterprise also seeks balance betweenthree perspectives in green controlling economy - profit, the environment and society.Thus, achievement of basic premises of the concept is combined with the implemen-tation of company value growth, based on the financial results. This, in turn, is mani-fested in budgeting.
B. Braun Melsungen AG exhibits transparency in all areas of sustainable develop-ment, as evidenced by the B. Braun Group Sustainability Report 2015, which accountsfor all basic guideline premises of the Global Compact GRI G4 programme. Accordingto the guidelines, all reports should provide information regarding such economic in-dicators as income, operating costs, employee remuneration, donations and other bene-fits to the community, undistributed profits, payments to capital owners and state in-stitutions, which are becoming fundamental elements of effective relationships withstakeholders and the grounds for investment decisions.
5.3.1. Increasing income through own resourcesOne of the main strategic objectives of B. Braun is to continue to conduct its businessas a family-owned company, capable of resisting the intervention of external stakeholders(such as shareholders, investment funds, etc.). In order to respond to this challenge,
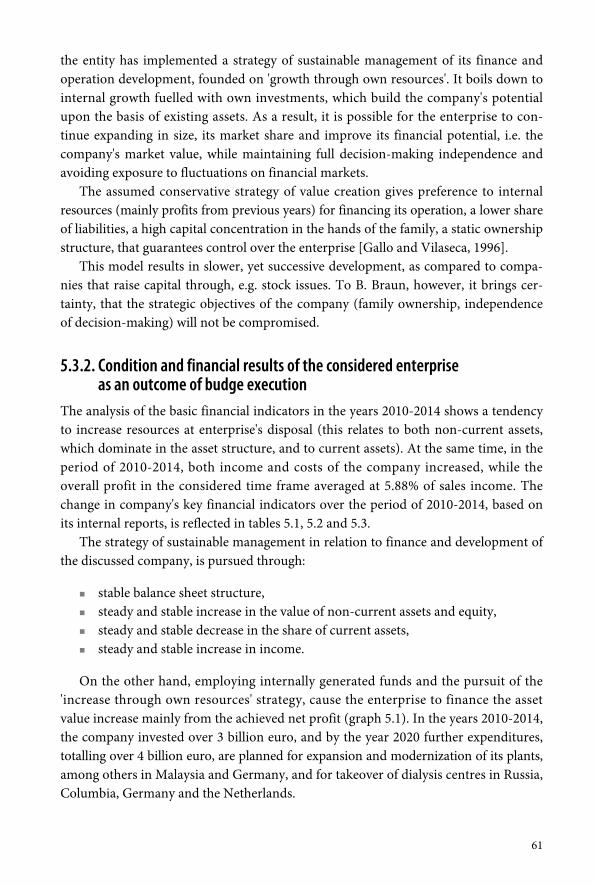
61
the entity has implemented a strategy of sustainable management of its finance andoperation development, founded on 'growth through own resources'. It boils down tointernal growth fuelled with own investments, which build the company's potentialupon the basis of existing assets. As a result, it is possible for the enterprise to con-tinue expanding in size, its market share and improve its financial potential, i.e. thecompany's market value, while maintaining full decision-making independence andavoiding exposure to fluctuations on financial markets.
The assumed conservative strategy of value creation gives preference to internalresources (mainly profits from previous years) for financing its operation, a lower shareof liabilities, a high capital concentration in the hands of the family, a static ownershipstructure, that guarantees control over the enterprise [Gallo and Vilaseca, 1996].
This model results in slower, yet successive development, as compared to compa-nies that raise capital through, e.g. stock issues. To B. Braun, however, it brings cer-tainty, that the strategic objectives of the company (family ownership, independenceof decision-making) will not be compromised.
5.3.2. Condition and financial results of the considered enterpriseas an outcome of budge execution
The analysis of the basic financial indicators in the years 2010-2014 shows a tendencyto increase resources at enterprise's disposal (this relates to both non-current assets,which dominate in the asset structure, and to current assets). At the same time, in theperiod of 2010-2014, both income and costs of the company increased, while theoverall profit in the considered time frame averaged at 5.88% of sales income. Thechange in company's key financial indicators over the period of 2010-2014, based onits internal reports, is reflected in tables 5.1, 5.2 and 5.3.
The strategy of sustainable management in relation to finance and development ofthe discussed company, is pursued through:
stable balance sheet structure, steady and stable increase in the value of non-current assets and equity, steady and stable decrease in the share of current assets, steady and stable increase in income.
On the other hand, employing internally generated funds and the pursuit of the'increase through own resources' strategy, cause the enterprise to finance the assetvalue increase mainly from the achieved net profit (graph 5.1). In the years 2010-2014,the company invested over 3 billion euro, and by the year 2020 further expenditures,totalling over 4 billion euro, are planned for expansion and modernization of its plants,among others in Malaysia and Germany, and for takeover of dialysis centres in Russia,Columbia, Germany and the Netherlands.
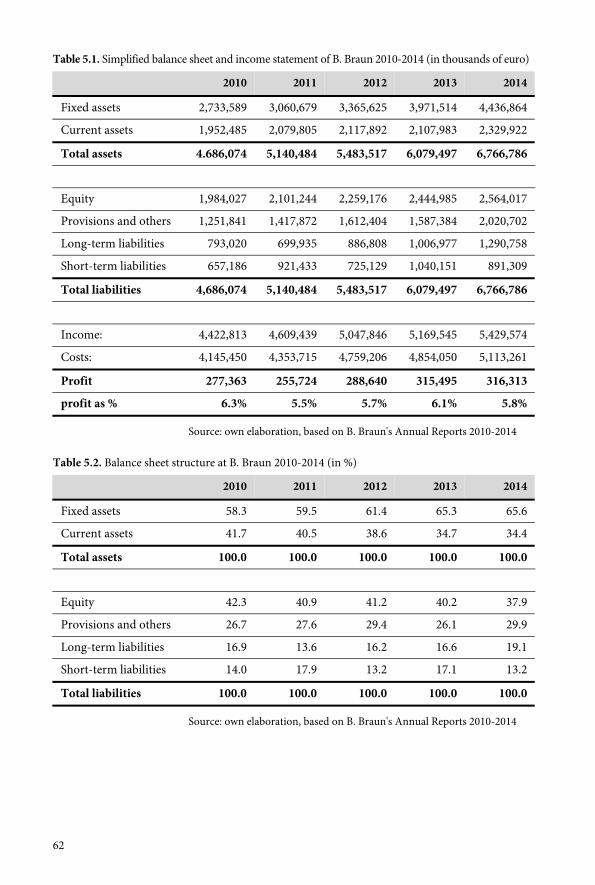
62
Table 5.1. Simplified balance sheet and income statement of B. Braun 2010-2014 (in thousands of euro)
2010 2011 2012 2013 2014
Fixed assets 2,733,589 3,060,679 3,365,625 3,971,514 4,436,864
Current assets 1,952,485 2,079,805 2,117,892 2,107,983 2,329,922
Total assets 4.686,074 5,140,484 5,483,517 6,079,497 6,766,786
Equity 1,984,027 2,101,244 2,259,176 2,444,985 2,564,017
Provisions and others 1,251,841 1,417,872 1,612,404 1,587,384 2,020,702
Long-term liabilities 793,020 699,935 886,808 1,006,977 1,290,758
Short-term liabilities 657,186 921,433 725,129 1,040,151 891,309
Total liabilities 4,686,074 5,140,484 5,483,517 6,079,497 6,766,786
Income: 4,422,813 4,609,439 5,047,846 5,169,545 5,429,574
Costs: 4,145,450 4,353,715 4,759,206 4,854,050 5,113,261
Profit 277,363 255,724 288,640 315,495 316,313
profit as % 6.3% 5.5% 5.7% 6.1% 5.8%
Source: own elaboration, based on B. Braun's Annual Reports 2010-2014
Table 5.2. Balance sheet structure at B. Braun 2010-2014 (in %)
2010 2011 2012 2013 2014
Fixed assets 58.3 59.5 61.4 65.3 65.6
Current assets 41.7 40.5 38.6 34.7 34.4
Total assets 100.0 100.0 100.0 100.0 100.0
Equity 42.3 40.9 41.2 40.2 37.9
Provisions and others 26.7 27.6 29.4 26.1 29.9
Long-term liabilities 16.9 13.6 16.2 16.6 19.1
Short-term liabilities 14.0 17.9 13.2 17.1 13.2
Total liabilities 100.0 100.0 100.0 100.0 100.0
Source: own elaboration, based on B. Braun's Annual Reports 2010-2014
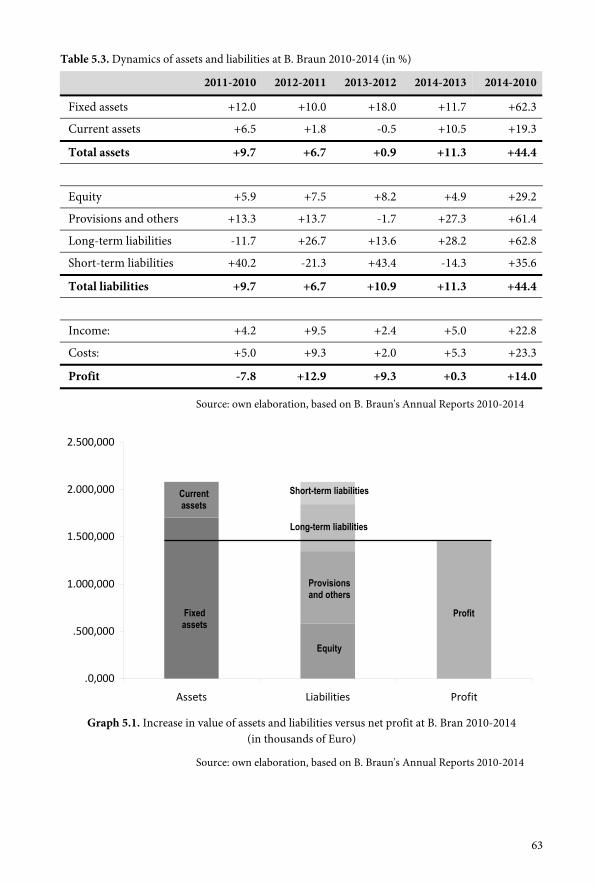
63
Table 5.3. Dynamics of assets and liabilities at B. Braun 2010-2014 (in %)
2011-2010 2012-2011 2013-2012 2014-2013 2014-2010
Fixed assets +12.0 +10.0 +18.0 +11.7 +62.3
Current assets +6.5 +1.8 -0.5 +10.5 +19.3
Total assets +9.7 +6.7 +0.9 +11.3 +44.4
Equity +5.9 +7.5 +8.2 +4.9 +29.2
Provisions and others +13.3 +13.7 -1.7 +27.3 +61.4
Long-term liabilities -11.7 +26.7 +13.6 +28.2 +62.8
Short-term liabilities +40.2 -21.3 +43.4 -14.3 +35.6
Total liabilities +9.7 +6.7 +10.9 +11.3 +44.4
Income: +4.2 +9.5 +2.4 +5.0 +22.8
Costs: +5.0 +9.3 +2.0 +5.3 +23.3
Profit -7.8 +12.9 +9.3 +0.3 +14.0
Source: own elaboration, based on B. Braun's Annual Reports 2010-2014
.0,000
.500,000
1.000,000
1.500,000
2.000,000
2.500,000
Assets Liabilities Profit
Graph 5.1. Increase in value of assets and liabilities versus net profit at B. Bran 2010-2014(in thousands of Euro)
Source: own elaboration, based on B. Braun's Annual Reports 2010-2014
Currentassets
Fixedassets
Short-term liabilities
Long-term liabilities
Provisionsand others
Equity
Profit
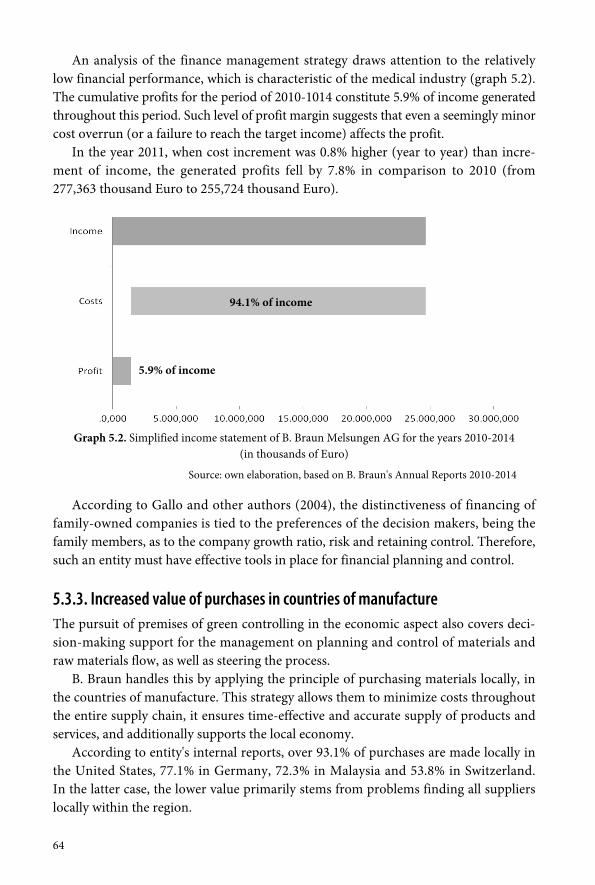
64
An analysis of the finance management strategy draws attention to the relativelylow financial performance, which is characteristic of the medical industry (graph 5.2).The cumulative profits for the period of 2010-1014 constitute 5.9% of income generatedthroughout this period. Such level of profit margin suggests that even a seemingly minorcost overrun (or a failure to reach the target income) affects the profit.
In the year 2011, when cost increment was 0.8% higher (year to year) than incre-ment of income, the generated profits fell by 7.8% in comparison to 2010 (from277,363 thousand Euro to 255,724 thousand Euro).
Graph 5.2. Simplified income statement of B. Braun Melsungen AG for the years 2010-2014(in thousands of Euro)
Source: own elaboration, based on B. Braun's Annual Reports 2010-2014
According to Gallo and other authors (2004), the distinctiveness of financing offamily-owned companies is tied to the preferences of the decision makers, being thefamily members, as to the company growth ratio, risk and retaining control. Therefore,such an entity must have effective tools in place for financial planning and control.
5.3.3. Increased value of purchases in countries of manufactureThe pursuit of premises of green controlling in the economic aspect also covers deci-sion-making support for the management on planning and control of materials andraw materials flow, as well as steering the process.
B. Braun handles this by applying the principle of purchasing materials locally, inthe countries of manufacture. This strategy allows them to minimize costs throughoutthe entire supply chain, it ensures time-effective and accurate supply of products andservices, and additionally supports the local economy.
According to entity's internal reports, over 93.1% of purchases are made locally inthe United States, 77.1% in Germany, 72.3% in Malaysia and 53.8% in Switzerland.In the latter case, the lower value primarily stems from problems finding all supplierslocally within the region.
94.1% of income
5.9% of income
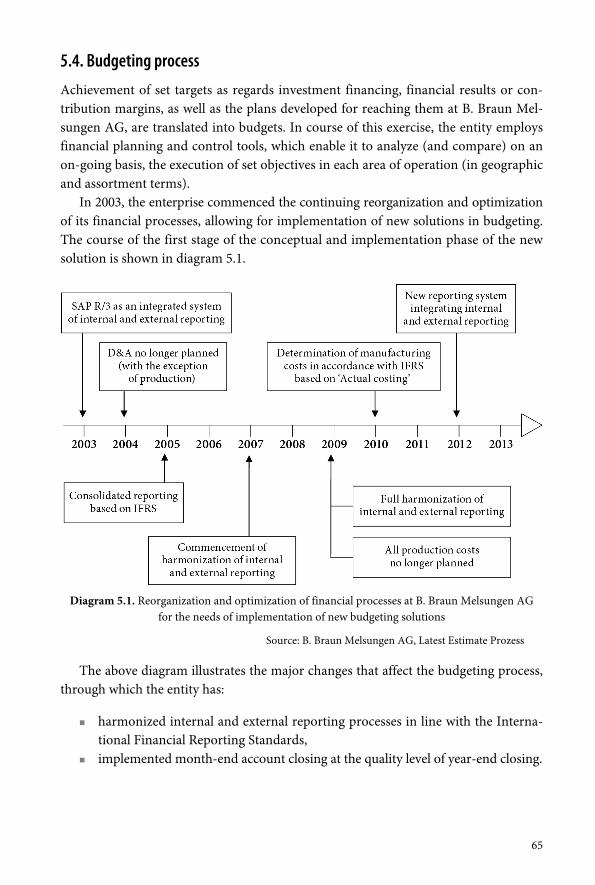
65
5.4. Budgeting process
Achievement of set targets as regards investment financing, financial results or con-tribution margins, as well as the plans developed for reaching them at B. Braun Mel-sungen AG, are translated into budgets. In course of this exercise, the entity employsfinancial planning and control tools, which enable it to analyze (and compare) on anon-going basis, the execution of set objectives in each area of operation (in geographicand assortment terms).
In 2003, the enterprise commenced the continuing reorganization and optimizationof its financial processes, allowing for implementation of new solutions in budgeting.The course of the first stage of the conceptual and implementation phase of the newsolution is shown in diagram 5.1.
Diagram 5.1. Reorganization and optimization of financial processes at B. Braun Melsungen AGfor the needs of implementation of new budgeting solutions
Source: B. Braun Melsungen AG, Latest Estimate Prozess
The above diagram illustrates the major changes that affect the budgeting process,through which the entity has:
harmonized internal and external reporting processes in line with the Interna-tional Financial Reporting Standards,
implemented month-end account closing at the quality level of year-end closing.
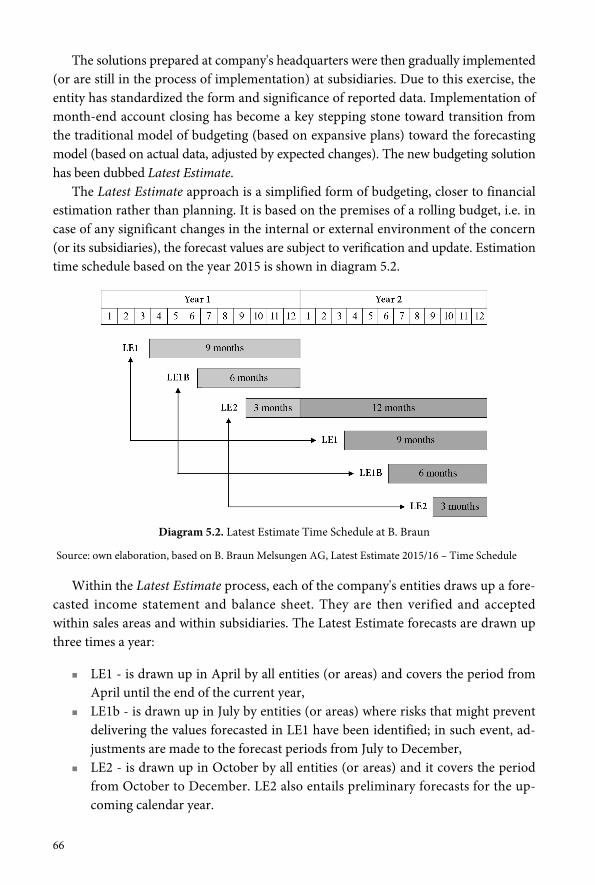
66
The solutions prepared at company's headquarters were then gradually implemented(or are still in the process of implementation) at subsidiaries. Due to this exercise, theentity has standardized the form and significance of reported data. Implementation ofmonth-end account closing has become a key stepping stone toward transition fromthe traditional model of budgeting (based on expansive plans) toward the forecastingmodel (based on actual data, adjusted by expected changes). The new budgeting solutionhas been dubbed Latest Estimate.
The Latest Estimate approach is a simplified form of budgeting, closer to financialestimation rather than planning. It is based on the premises of a rolling budget, i.e. incase of any significant changes in the internal or external environment of the concern(or its subsidiaries), the forecast values are subject to verification and update. Estimationtime schedule based on the year 2015 is shown in diagram 5.2.
Diagram 5.2. Latest Estimate Time Schedule at B. Braun
Source: own elaboration, based on B. Braun Melsungen AG, Latest Estimate 2015/16 – Time Schedule
Within the Latest Estimate process, each of the company's entities draws up a fore-casted income statement and balance sheet. They are then verified and acceptedwithin sales areas and within subsidiaries. The Latest Estimate forecasts are drawn upthree times a year:
LE1 - is drawn up in April by all entities (or areas) and covers the period fromApril until the end of the current year,
LE1b - is drawn up in July by entities (or areas) where risks that might preventdelivering the values forecasted in LE1 have been identified; in such event, ad-justments are made to the forecast periods from July to December,
LE2 - is drawn up in October by all entities (or areas) and it covers the periodfrom October to December. LE2 also entails preliminary forecasts for the up-coming calendar year.
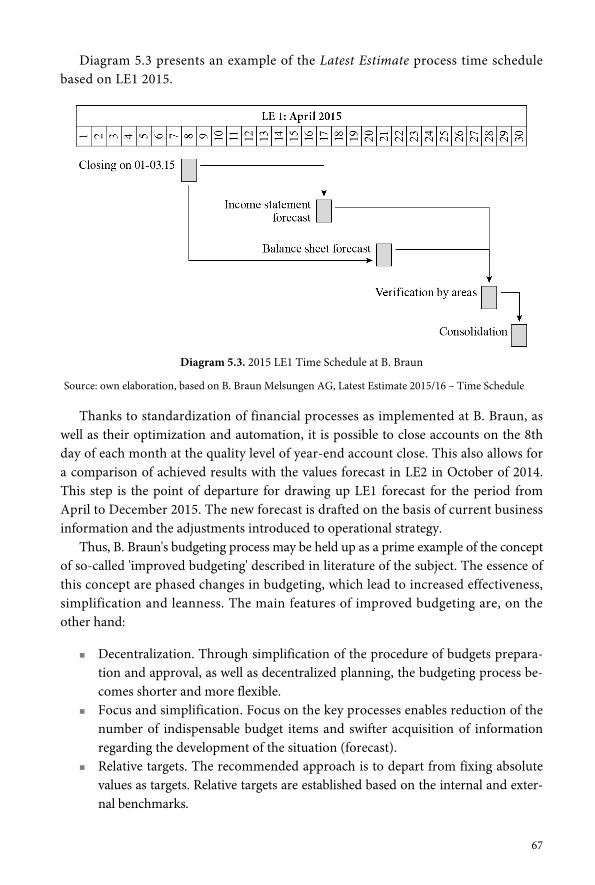
67
Diagram 5.3 presents an example of the Latest Estimate process time schedulebased on LE1 2015.
Diagram 5.3. 2015 LE1 Time Schedule at B. Braun
Source: own elaboration, based on B. Braun Melsungen AG, Latest Estimate 2015/16 – Time Schedule
Thanks to standardization of financial processes as implemented at B. Braun, aswell as their optimization and automation, it is possible to close accounts on the 8thday of each month at the quality level of year-end account close. This also allows fora comparison of achieved results with the values forecast in LE2 in October of 2014.This step is the point of departure for drawing up LE1 forecast for the period fromApril to December 2015. The new forecast is drafted on the basis of current businessinformation and the adjustments introduced to operational strategy.
Thus, B. Braun's budgeting process may be held up as a prime example of the conceptof so-called 'improved budgeting' described in literature of the subject. The essence ofthis concept are phased changes in budgeting, which lead to increased effectiveness,simplification and leanness. The main features of improved budgeting are, on theother hand:
Decentralization. Through simplification of the procedure of budgets prepara-tion and approval, as well as decentralized planning, the budgeting process be-comes shorter and more flexible.
Focus and simplification. Focus on the key processes enables reduction of thenumber of indispensable budget items and swifter acquisition of informationregarding the development of the situation (forecast).
Relative targets. The recommended approach is to depart from fixing absolutevalues as targets. Relative targets are established based on the internal and exter-nal benchmarks.
68
Strategy Orientation. Rolling forecasts. Means departure from annual planning, oriented on a given
budgeting period, and replacing it, as at B. Braun, with three-, six-, nine- andtwelve-month rolling forecasts.
Support of planning processes. A wider employment of latest communicationtechnologies and planning methods enable to accelerate budgeting and reduceexpenditures required for its execution [Horvath, 2009].
5.5. Environmental aspects in budgeting
Green controlling in the environmental aspect is understood primarily as a tool forholistic and eco-friendly enterprise management, which entails regular recording andanalysis of all physical and financial consequences related to the environment that resultfrom the enterprise's operation [Sommer, 2013]. Within this context, B. Braun Mel-sungen AG employs this modern tool mainly in environmental management, whichforms part of the overall management system.
The entity's concern for the environmental aspects of the its operation is primarilya consequence of need for consumption of materials, water and energy in productionprocesses, coupled with emission of pollution, gas and dust into the air, discharge ofwastewater or generation and disposal of waste. Therefore, separation of green con-trolling results from the ecological consciousness of the entity's stakeholders and itallows to dynamically respond to environmental changes, thus supporting the enter-prise's pro-ecological activities [Balicka, 2015].
One of the manifestations of these activities was to incorporate, into the processesof capital budgeting, the standards of both eco-management and audit scheme (EMAS)and the energy management system (ISO) or the investment project connection withmodernization of 34 dialysis centres of B. Braun Avitum in Czech Republic and inSlovakia, as well as erection of a modern logistics centre of B. Braun Austria in MariaEnzersdorf near Vienna. Introduction of recovery technologies has resulted in reductionwater and energy consumption, as well as the amount of wastewater generated duringa single dialysis from 1.8 to 1.2 kilograms, thus reducing by 1/3 the impact of haemo-dialysis on the environment. Optimization of energy efficiency, in turn, has increasedthe share of renewable energy, e.g. in Germany from 31% in 2012 up to 34% in 2014,simultaneously lowering the emission of harmful substances. Additionally, throughadoption of renewable energy media obtained from natural sources, the cost of energyacquisition at the enterprise was reduced by 26%.
69
One of the world's first buildings in medical technology industry, that has beenawarded a sustainable building LEED certificate (Leadership in Energy and Environ-mental Design) was erected at the company's Berin location, while in Melsungen,there is an operational biomass power plant with a rated capacity of 21 MW, wherepart of thus generated energy is used by B. Braun and the remaining part is transmittedto 10 thousand households in the region.
Therefore, incorporation of environmental issues into capital budgeting baresa significant influence on the enterprise's finances, it allows for selection of invest-ment projects along with their financing while ensuring environmental care.
5.6. Social activities in budgeting
Green controlling in the social aspect has acquired special significance in both on-goingand strategic operation of the enterprise, as running a business calls for increasinglywider consideration for and respect of social factors. A modern company operateswithin a society of ever better educated and ever more conscious of their rights citi-zens, clients, business partners, investors and employees [Dziawgo, 2009]. Accordingto Dziawgo (2014), social capital has by now assumed the position of one of the keyresources of a modern enterprise (alongside e.g. financial capital or human capital)and, as such, it is becoming a priority in increasing company market value.
5.6.1. Matrix of CSR activitiesThe global character of operations of B. Braun Melsungen AG requires coordinationof undertaken pro-social activities so as to increase the effectiveness of resources ear-marked for this purpose, but also to integrate social activities with the economicoperation. For that reason, B. Braun has implemented budgeting social projectswithin the developed CSR matrix, which constitutes a fundamental tool for socialprojects management.
One of the arguments supporting development of the matrix was the conclusionthat coordinating initiatives does not mean they should all address the same social orenvironmental challenge. It means they form a coherent portfolio in keeping with thefirm's purpose and values [Rangan et al., 2015], which acquires strategic significancein the event of a company that employs over 55 thousand people across 64 countries.Development of the CSR activities matrix was, on the one hand, to enable perform-ance of social projects in line with the objectives and values of the entity, while, onthe other hand, to facilitate access to information on the scale and content of pursuedprojects.
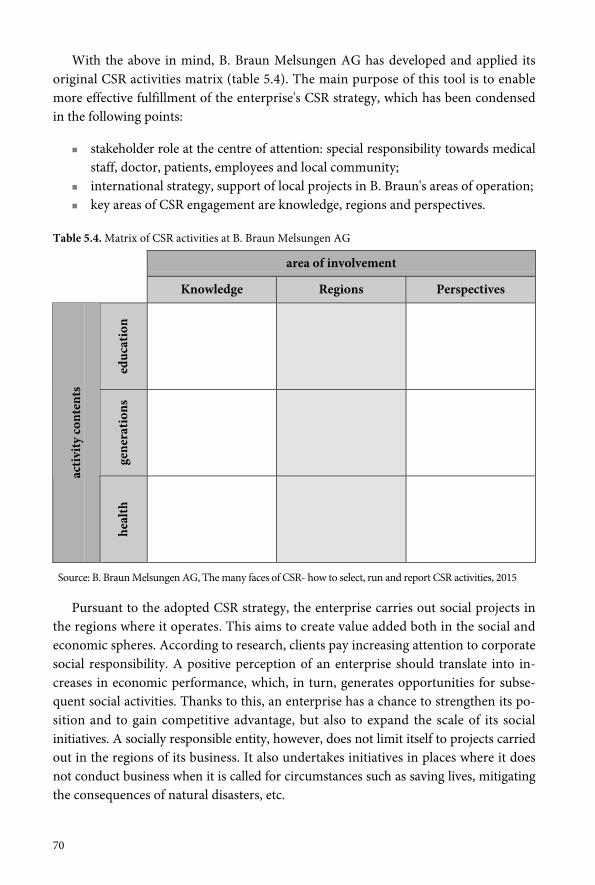
70
With the above in mind, B. Braun Melsungen AG has developed and applied itsoriginal CSR activities matrix (table 5.4). The main purpose of this tool is to enablemore effective fulfillment of the enterprise's CSR strategy, which has been condensedin the following points:
stakeholder role at the centre of attention: special responsibility towards medicalstaff, doctor, patients, employees and local community;
international strategy, support of local projects in B. Braun's areas of operation; key areas of CSR engagement are knowledge, regions and perspectives.
Table 5.4. Matrix of CSR activities at B. Braun Melsungen AG
area of involvement
Knowledge Regions Perspectives
educ
atio
nge
nera
tions
activ
ity co
nten
ts
heal
th
Source: B. Braun Melsungen AG, The many faces of CSR- how to select, run and report CSR activities, 2015
Pursuant to the adopted CSR strategy, the enterprise carries out social projects inthe regions where it operates. This aims to create value added both in the social andeconomic spheres. According to research, clients pay increasing attention to corporatesocial responsibility. A positive perception of an enterprise should translate into in-creases in economic performance, which, in turn, generates opportunities for subse-quent social activities. Thanks to this, an enterprise has a chance to strengthen its po-sition and to gain competitive advantage, but also to expand the scale of its socialinitiatives. A socially responsible entity, however, does not limit itself to projects carriedout in the regions of its business. It also undertakes initiatives in places where it doesnot conduct business when it is called for circumstances such as saving lives, mitigatingthe consequences of natural disasters, etc.
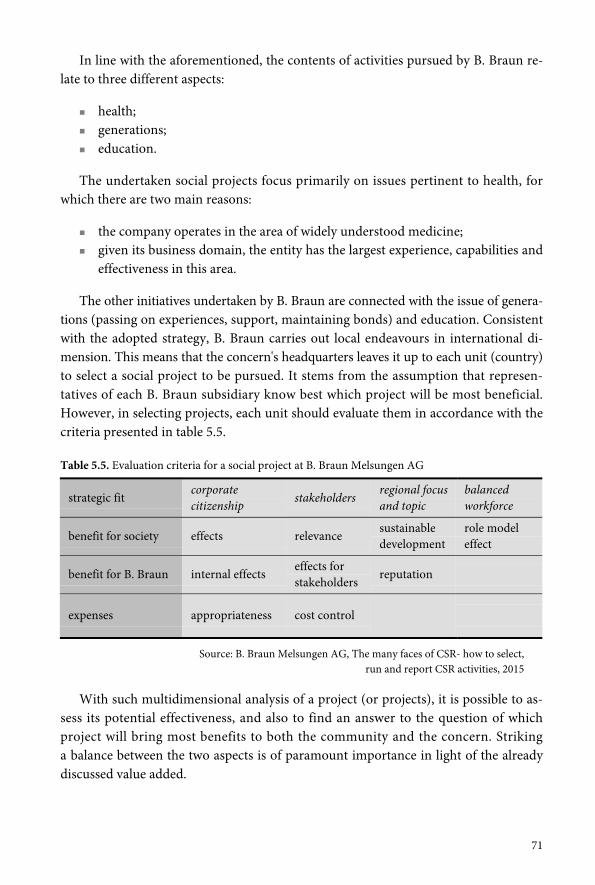
71
In line with the aforementioned, the contents of activities pursued by B. Braun re-late to three different aspects:
health; generations; education.
The undertaken social projects focus primarily on issues pertinent to health, forwhich there are two main reasons:
the company operates in the area of widely understood medicine; given its business domain, the entity has the largest experience, capabilities and
effectiveness in this area.
The other initiatives undertaken by B. Braun are connected with the issue of genera-tions (passing on experiences, support, maintaining bonds) and education. Consistentwith the adopted strategy, B. Braun carries out local endeavours in international di-mension. This means that the concern's headquarters leaves it up to each unit (country)to select a social project to be pursued. It stems from the assumption that represen-tatives of each B. Braun subsidiary know best which project will be most beneficial.However, in selecting projects, each unit should evaluate them in accordance with thecriteria presented in table 5.5.
Table 5.5. Evaluation criteria for a social project at B. Braun Melsungen AG
strategic fitcorporatecitizenship stakeholders
regional focusand topic
balancedworkforce
benefit for society effects relevancesustainabledevelopment
role modeleffect
benefit for B. Braun internal effectseffects forstakeholders
reputation
expenses appropriateness cost control
Source: B. Braun Melsungen AG, The many faces of CSR- how to select,run and report CSR activities, 2015
With such multidimensional analysis of a project (or projects), it is possible to as-sess its potential effectiveness, and also to find an answer to the question of whichproject will bring most benefits to both the community and the concern. Strikinga balance between the two aspects is of paramount importance in light of the alreadydiscussed value added.
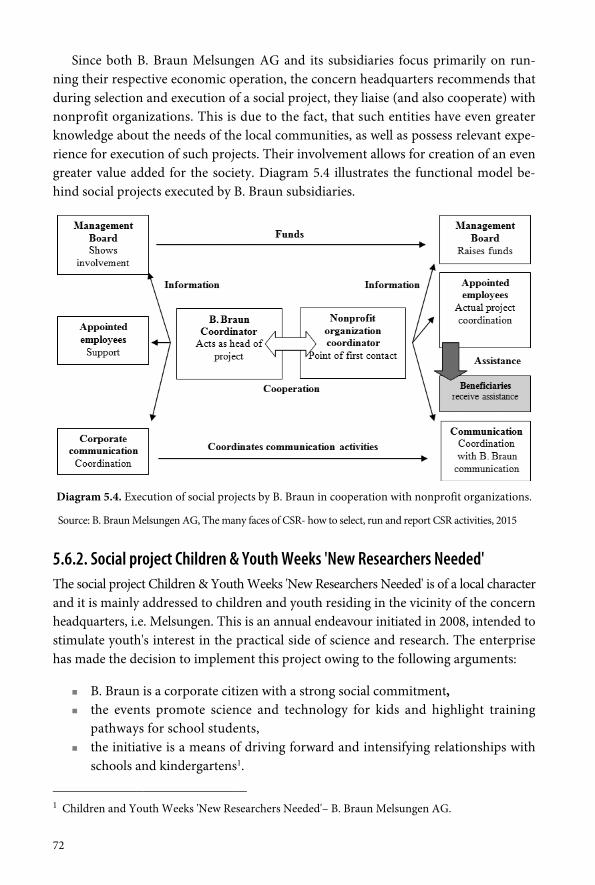
72
Since both B. Braun Melsungen AG and its subsidiaries focus primarily on run-ning their respective economic operation, the concern headquarters recommends thatduring selection and execution of a social project, they liaise (and also cooperate) withnonprofit organizations. This is due to the fact, that such entities have even greaterknowledge about the needs of the local communities, as well as possess relevant expe-rience for execution of such projects. Their involvement allows for creation of an evengreater value added for the society. Diagram 5.4 illustrates the functional model be-hind social projects executed by B. Braun subsidiaries.
Diagram 5.4. Execution of social projects by B. Braun in cooperation with nonprofit organizations.
Source: B. Braun Melsungen AG, The many faces of CSR- how to select, run and report CSR activities, 2015
5.6.2. Social project Children & Youth Weeks 'New Researchers Needed'The social project Children & Youth Weeks 'New Researchers Needed' is of a local characterand it is mainly addressed to children and youth residing in the vicinity of the concernheadquarters, i.e. Melsungen. This is an annual endeavour initiated in 2008, intended tostimulate youth's interest in the practical side of science and research. The enterprisehas made the decision to implement this project owing to the following arguments:
B. Braun is a corporate citizen with a strong social commitment, the events promote science and technology for kids and highlight training
pathways for school students, the initiative is a means of driving forward and intensifying relationships with
schools and kindergartens1.
1 Children and Youth Weeks 'New Researchers Needed'– B. Braun Melsungen AG.
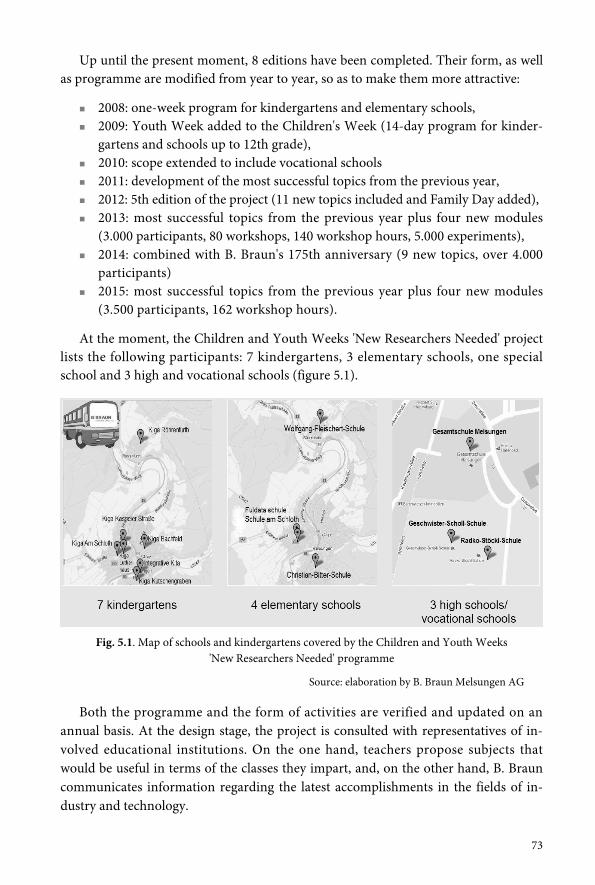
73
Up until the present moment, 8 editions have been completed. Their form, as wellas programme are modified from year to year, so as to make them more attractive:
2008: one-week program for kindergartens and elementary schools, 2009: Youth Week added to the Children's Week (14-day program for kinder-
gartens and schools up to 12th grade), 2010: scope extended to include vocational schools 2011: development of the most successful topics from the previous year, 2012: 5th edition of the project (11 new topics included and Family Day added), 2013: most successful topics from the previous year plus four new modules
(3.000 participants, 80 workshops, 140 workshop hours, 5.000 experiments), 2014: combined with B. Braun's 175th anniversary (9 new topics, over 4.000
participants) 2015: most successful topics from the previous year plus four new modules
(3.500 participants, 162 workshop hours).
At the moment, the Children and Youth Weeks 'New Researchers Needed' projectlists the following participants: 7 kindergartens, 3 elementary schools, one specialschool and 3 high and vocational schools (figure 5.1).
Fig. 5.1. Map of schools and kindergartens covered by the Children and Youth Weeks'New Researchers Needed' programme
Source: elaboration by B. Braun Melsungen AG
Both the programme and the form of activities are verified and updated on anannual basis. At the design stage, the project is consulted with representatives of in-volved educational institutions. On the one hand, teachers propose subjects thatwould be useful in terms of the classes they impart, and, on the other hand, B. Brauncommunicates information regarding the latest accomplishments in the fields of in-dustry and technology.
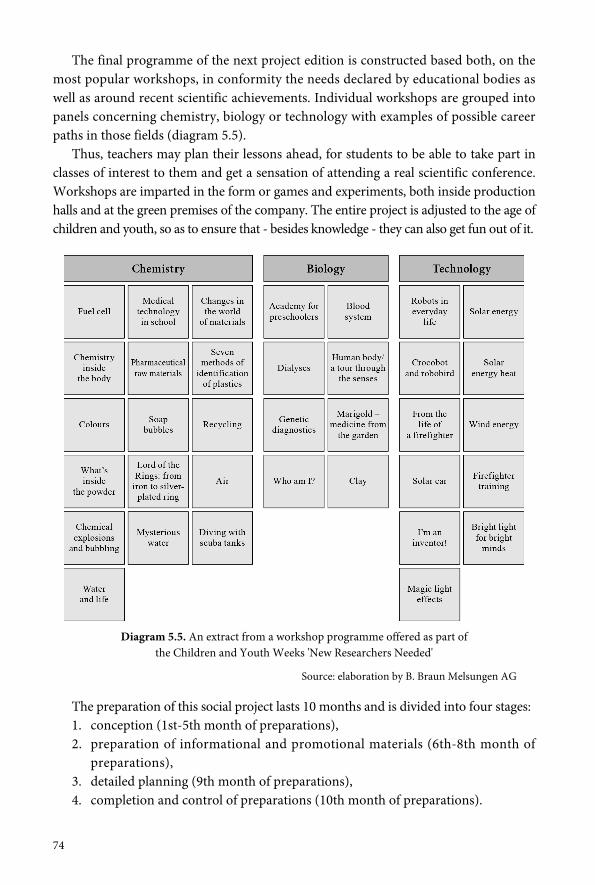
74
The final programme of the next project edition is constructed based both, on themost popular workshops, in conformity the needs declared by educational bodies aswell as around recent scientific achievements. Individual workshops are grouped intopanels concerning chemistry, biology or technology with examples of possible careerpaths in those fields (diagram 5.5).
Thus, teachers may plan their lessons ahead, for students to be able to take part inclasses of interest to them and get a sensation of attending a real scientific conference.Workshops are imparted in the form or games and experiments, both inside productionhalls and at the green premises of the company. The entire project is adjusted to the age ofchildren and youth, so as to ensure that - besides knowledge - they can also get fun out of it.
Diagram 5.5. An extract from a workshop programme offered as part ofthe Children and Youth Weeks 'New Researchers Needed'
Source: elaboration by B. Braun Melsungen AG
The preparation of this social project lasts 10 months and is divided into four stages:1. conception (1st-5th month of preparations),2. preparation of informational and promotional materials (6th-8th month of
preparations),3. detailed planning (9th month of preparations),4. completion and control of preparations (10th month of preparations).
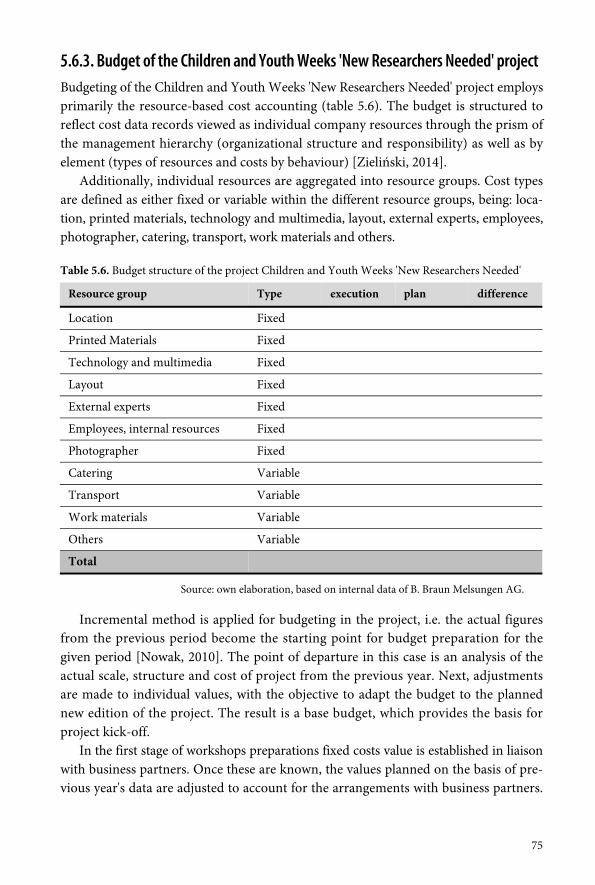
75
5.6.3. Budget of the Children and Youth Weeks 'New Researchers Needed' projectBudgeting of the Children and Youth Weeks 'New Researchers Needed' project employsprimarily the resource-based cost accounting (table 5.6). The budget is structured toreflect cost data records viewed as individual company resources through the prism ofthe management hierarchy (organizational structure and responsibility) as well as byelement (types of resources and costs by behaviour) [Zieliński, 2014].
Additionally, individual resources are aggregated into resource groups. Cost typesare defined as either fixed or variable within the different resource groups, being: loca-tion, printed materials, technology and multimedia, layout, external experts, employees,photographer, catering, transport, work materials and others.
Table 5.6. Budget structure of the project Children and Youth Weeks 'New Researchers Needed'
Resource group Type execution plan difference
Location Fixed
Printed Materials Fixed
Technology and multimedia Fixed
Layout Fixed
External experts Fixed
Employees, internal resources Fixed
Photographer Fixed
Catering Variable
Transport Variable
Work materials Variable
Others Variable
Total
Source: own elaboration, based on internal data of B. Braun Melsungen AG.
Incremental method is applied for budgeting in the project, i.e. the actual figuresfrom the previous period become the starting point for budget preparation for thegiven period [Nowak, 2010]. The point of departure in this case is an analysis of theactual scale, structure and cost of project from the previous year. Next, adjustmentsare made to individual values, with the objective to adapt the budget to the plannednew edition of the project. The result is a base budget, which provides the basis forproject kick-off.
In the first stage of workshops preparations fixed costs value is established in liaisonwith business partners. Once these are known, the values planned on the basis of pre-vious year's data are adjusted to account for the arrangements with business partners.
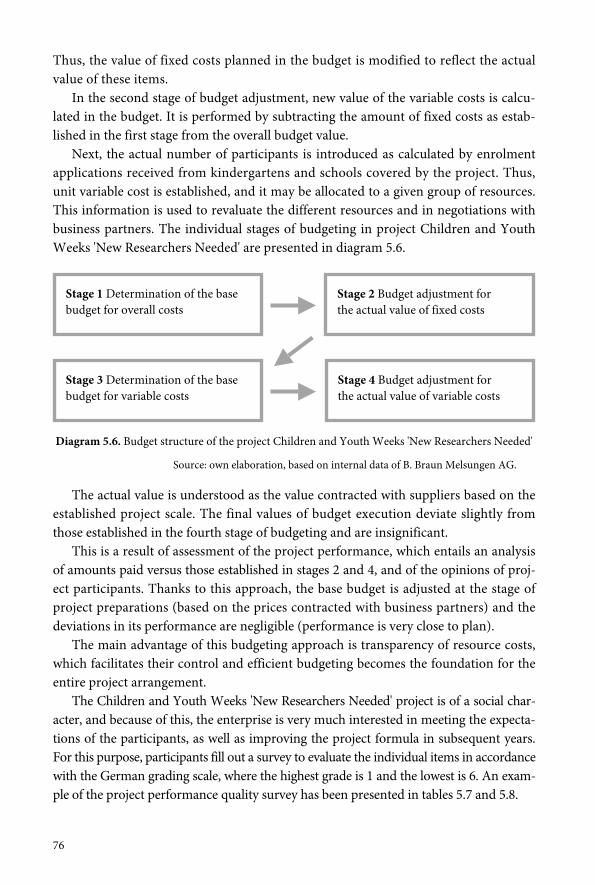
76
Thus, the value of fixed costs planned in the budget is modified to reflect the actualvalue of these items.
In the second stage of budget adjustment, new value of the variable costs is calcu-lated in the budget. It is performed by subtracting the amount of fixed costs as estab-lished in the first stage from the overall budget value.
Next, the actual number of participants is introduced as calculated by enrolmentapplications received from kindergartens and schools covered by the project. Thus,unit variable cost is established, and it may be allocated to a given group of resources.This information is used to revaluate the different resources and in negotiations withbusiness partners. The individual stages of budgeting in project Children and YouthWeeks 'New Researchers Needed' are presented in diagram 5.6.
Diagram 5.6. Budget structure of the project Children and Youth Weeks 'New Researchers Needed'
Source: own elaboration, based on internal data of B. Braun Melsungen AG.
The actual value is understood as the value contracted with suppliers based on theestablished project scale. The final values of budget execution deviate slightly fromthose established in the fourth stage of budgeting and are insignificant.
This is a result of assessment of the project performance, which entails an analysisof amounts paid versus those established in stages 2 and 4, and of the opinions of proj-ect participants. Thanks to this approach, the base budget is adjusted at the stage ofproject preparations (based on the prices contracted with business partners) and thedeviations in its performance are negligible (performance is very close to plan).
The main advantage of this budgeting approach is transparency of resource costs,which facilitates their control and efficient budgeting becomes the foundation for theentire project arrangement.
The Children and Youth Weeks 'New Researchers Needed' project is of a social char-acter, and because of this, the enterprise is very much interested in meeting the expecta-tions of the participants, as well as improving the project formula in subsequent years.For this purpose, participants fill out a survey to evaluate the individual items in accordancewith the German grading scale, where the highest grade is 1 and the lowest is 6. An exam-ple of the project performance quality survey has been presented in tables 5.7 and 5.8.
Stage 1 Determination of the basebudget for overall costs
Stage 2 Budget adjustment forthe actual value of fixed costs
Stage 3 Determination of the basebudget for variable costs
Stage 4 Budget adjustment forthe actual value of variable costs
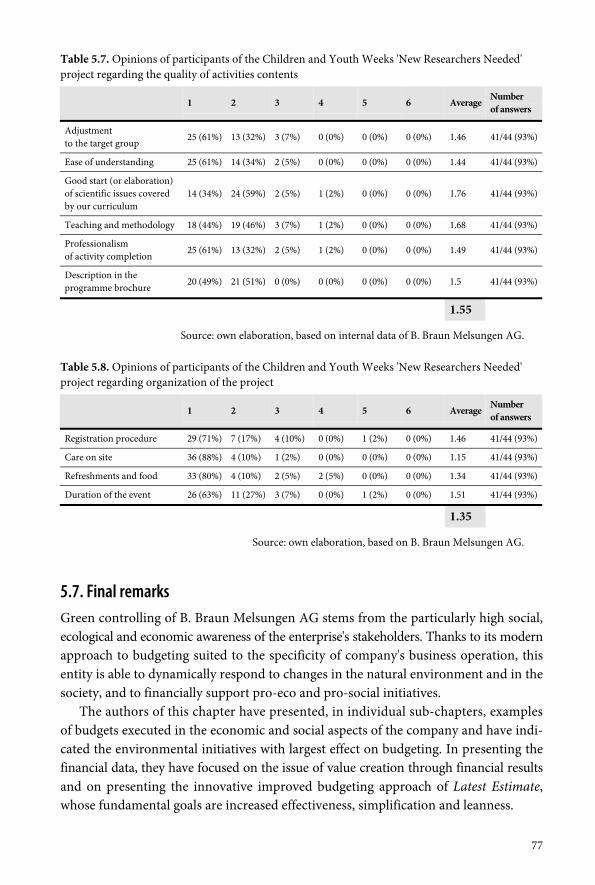
77
Table 5.7. Opinions of participants of the Children and Youth Weeks 'New Researchers Needed'project regarding the quality of activities contents
1 2 3 4 5 6 Average Numberof answers
Adjustmentto the target group
25 (61%) 13 (32%) 3 (7%) 0 (0%) 0 (0%) 0 (0%) 1.46 41/44 (93%)
Ease of understanding 25 (61%) 14 (34%) 2 (5%) 0 (0%) 0 (0%) 0 (0%) 1.44 41/44 (93%)
Good start (or elaboration)of scientific issues coveredby our curriculum
14 (34%) 24 (59%) 2 (5%) 1 (2%) 0 (0%) 0 (0%) 1.76 41/44 (93%)
Teaching and methodology 18 (44%) 19 (46%) 3 (7%) 1 (2%) 0 (0%) 0 (0%) 1.68 41/44 (93%)
Professionalismof activity completion
25 (61%) 13 (32%) 2 (5%) 1 (2%) 0 (0%) 0 (0%) 1.49 41/44 (93%)
Description in theprogramme brochure 20 (49%) 21 (51%) 0 (0%) 0 (0%) 0 (0%) 0 (0%) 1.5 41/44 (93%)
1.55
Source: own elaboration, based on internal data of B. Braun Melsungen AG.
Table 5.8. Opinions of participants of the Children and Youth Weeks 'New Researchers Needed'project regarding organization of the project
1 2 3 4 5 6 Average Numberof answers
Registration procedure 29 (71%) 7 (17%) 4 (10%) 0 (0%) 1 (2%) 0 (0%) 1.46 41/44 (93%)
Care on site 36 (88%) 4 (10%) 1 (2%) 0 (0%) 0 (0%) 0 (0%) 1.15 41/44 (93%)
Refreshments and food 33 (80%) 4 (10%) 2 (5%) 2 (5%) 0 (0%) 0 (0%) 1.34 41/44 (93%)
Duration of the event 26 (63%) 11 (27%) 3 (7%) 0 (0%) 1 (2%) 0 (0%) 1.51 41/44 (93%)
1.35
Source: own elaboration, based on B. Braun Melsungen AG.
5.7. Final remarksGreen controlling of B. Braun Melsungen AG stems from the particularly high social,ecological and economic awareness of the enterprise's stakeholders. Thanks to its modernapproach to budgeting suited to the specificity of company's business operation, thisentity is able to dynamically respond to changes in the natural environment and in thesociety, and to financially support pro-eco and pro-social initiatives.
The authors of this chapter have presented, in individual sub-chapters, examplesof budgets executed in the economic and social aspects of the company and have indi-cated the environmental initiatives with largest effect on budgeting. In presenting thefinancial data, they have focused on the issue of value creation through financial resultsand on presenting the innovative improved budgeting approach of Latest Estimate,whose fundamental goals are increased effectiveness, simplification and leanness.
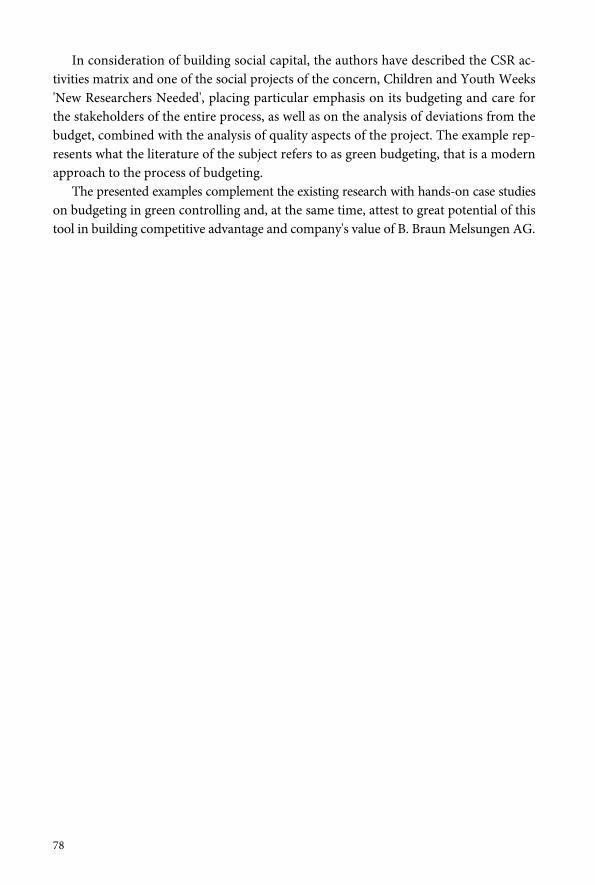
78
In consideration of building social capital, the authors have described the CSR ac-tivities matrix and one of the social projects of the concern, Children and Youth Weeks'New Researchers Needed', placing particular emphasis on its budgeting and care forthe stakeholders of the entire process, as well as on the analysis of deviations from thebudget, combined with the analysis of quality aspects of the project. The example rep-resents what the literature of the subject refers to as green budgeting, that is a modernapproach to the process of budgeting.
The presented examples complement the existing research with hands-on case studieson budgeting in green controlling and, at the same time, attest to great potential of thistool in building competitive advantage and company's value of B. Braun Melsungen AG.
C H A P T E R 6
System of measures and indicatorsemployed in green controlling at Kompania Piwowarska
6.1. Introductory remarks
The shaping and coordination of the processes of planning, control and informationsupply, oriented at managing the enterprise with a view of sustainable developmentgoals, which constitute the essence of green controlling, is possible thanks to applica-tion of an appropriate system of measures and indicators. The correct development ofsuch a system requires solution of problems regarding selection, measurement and in-tegration of measures and indicators of sustainable development. The problem of se-lection is related to the system of measurement of economic effects, already estab-lished in theory and practice, against a background of unstructured sets of measuresand indicators of social and environmental activities. The problem of measurementstems from the divergences between units of measure of economic activity outcomesagainst those of social and environmental activities, as well as from the difficultieswith quantifiable identification of the influence of CSR initiatives on the economicperformance of the enterprise. The problem of integration primarily covers the dimen-sion of goals (strategic and operational), as well as the dimension of sustainable de-velopment areas (economic, social and environmental). Another considerable chal-lenge regarding the development of a correct system of measures and indicators ofsustainable development is also the selection of appropriate IT tools to support con-trolling processes.
The purpose of this chapter is to present solutions regarding integration of measuresand indicators between strategic and operational objectives of sustainable development,with the use of appropriate IT tools to support the processes of planning, control andinformation supply. Execution of the purpose has been based on the case study ofKompania Piwowarska SA.
80
6.2. Kompania Piwowarska - basic information
The objective of Kompania Piwowarska SA with its registered office in Poznań is theproduction and sale of beer. The Company operates three breweries with long-standingtraditions: Tyskie Browary Książęce (established in 1629), Browar Dojlidy in Białystok(1768) and Lech Browary Wielkopolski in Poznań (1895). The most renowned brandsof Kompania Piwowarska include Żubr, Tyskie, Lech, Dębowe, Redd's, Książęce. TheCompany's sales of beer hovers around 13.5 million of hectoliters annually, which isequivalent to 36% of market share, thus placing the Company first in beer industry ofPoland. Sales revenue of the Company stood at around PLN 4,249 million in the lastreporting period1, while net income reached PLN 743 million. The assets value of theCompany was equivalent to about PLN 2,996 million, while its equity amounted toPLN 1,083 million [EMIS 2016].
All of Kompania Piwowarska's shares are owned by the multinational corporategroup SABMiller, whose portfolio consists of a number of beer industry companies.SABMiller plc2 with its registered office in the United Kingdom, pursues its manufac-turing and sales activities across 6 continents, in over 80 countries, offering in excessof 200 beer brands, including Peroni, Miller, Pilsner Urquell. In the last reporting year,the Group sold 324 million hectoliters of beer, as well as other alcoholic and non-alcoholicbeverages, bringing up its revenue to over USD 26,288 million [SABMiller 2016].
6.3. Integration of measures and indicators
Integration of measures and indicators3 of sustainable development is a necessarycondition to properly shape green controlling. Lack of integration impedes incorpora-tion of the undertaken social and environmental initiatives in the processes of planning,control and information supply, and thus may reduce the idea of sustainable develop-ment to a mere marketing tool.
The necessity of an integrated approach has been asserted in a communication ofthe European Commission [2011], in which it was emphasized that 'to fully meet theircorporate social responsibility, enterprises should have a process to integrate social,
1 SABMiller plc, along with its subsidiaries, have adopted as their reporting year the period from1 April to 31 March. Thus, the last reporting year at Kompania Piwowarska, to which this chapterrefers, runs from 1 April 2014 to 31 March 2015.
2 As at the date of completion of this chapter, the company Anheuser-Busch InBev SA/NV of Belgiumis in the process of concluding the purchase of SABMiller plc.
3 The words 'measure' and 'indicator' are often use interchangeably, but their semantic scope is notidentical. A measure is a denominate number, expressed as any unit, while an indicator is a deno-minate number compared with another denominate number, which serves as a basis of reference[Kochalski 2011]. Therefore, indicators may take on a denominate or non-denominate value.
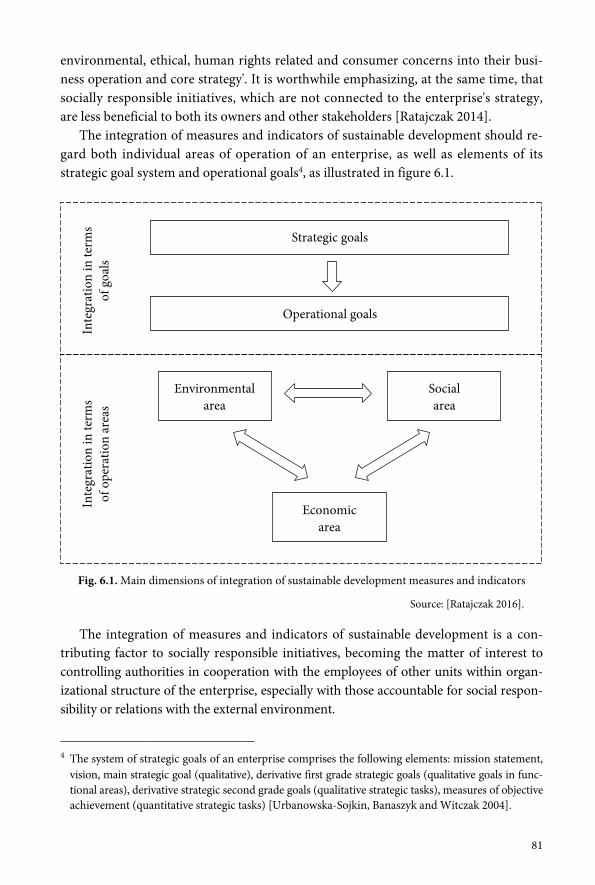
81
environmental, ethical, human rights related and consumer concerns into their busi-ness operation and core strategy'. It is worthwhile emphasizing, at the same time, thatsocially responsible initiatives, which are not connected to the enterprise's strategy,are less beneficial to both its owners and other stakeholders [Ratajczak 2014].
The integration of measures and indicators of sustainable development should re-gard both individual areas of operation of an enterprise, as well as elements of itsstrategic goal system and operational goals4, as illustrated in figure 6.1.
Fig. 6.1. Main dimensions of integration of sustainable development measures and indicators
Source: [Ratajczak 2016].
The integration of measures and indicators of sustainable development is a con-tributing factor to socially responsible initiatives, becoming the matter of interest tocontrolling authorities in cooperation with the employees of other units within organ-izational structure of the enterprise, especially with those accountable for social respon-sibility or relations with the external environment.
4 The system of strategic goals of an enterprise comprises the following elements: mission statement,vision, main strategic goal (qualitative), derivative first grade strategic goals (qualitative goals in func-tional areas), derivative strategic second grade goals (qualitative strategic tasks), measures of objectiveachievement (quantitative strategic tasks) [Urbanowska-Sojkin, Banaszyk and Witczak 2004].
Strategic goals
Operational goals
Environmentalarea
Socialarea
Economicarea
Inte
grat
ion
in te
rms
of g
oals
Inte
grat
ion
in te
rms
of o
pera
tion
area
s
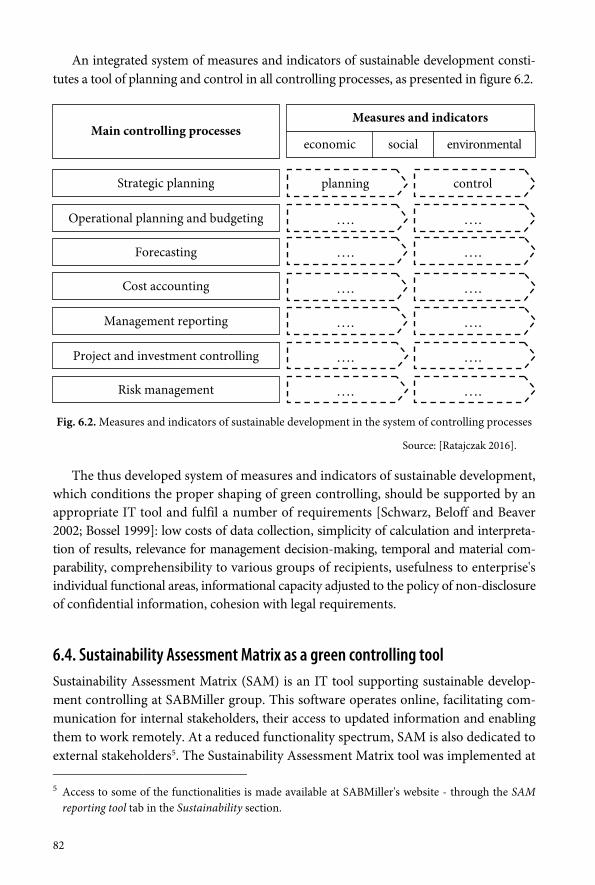
82
An integrated system of measures and indicators of sustainable development consti-tutes a tool of planning and control in all controlling processes, as presented in figure 6.2.
Fig. 6.2. Measures and indicators of sustainable development in the system of controlling processes
Source: [Ratajczak 2016].
The thus developed system of measures and indicators of sustainable development,which conditions the proper shaping of green controlling, should be supported by anappropriate IT tool and fulfil a number of requirements [Schwarz, Beloff and Beaver2002; Bossel 1999]: low costs of data collection, simplicity of calculation and interpreta-tion of results, relevance for management decision-making, temporal and material com-parability, comprehensibility to various groups of recipients, usefulness to enterprise'sindividual functional areas, informational capacity adjusted to the policy of non-disclosureof confidential information, cohesion with legal requirements.
6.4. Sustainability Assessment Matrix as a green controlling toolSustainability Assessment Matrix (SAM) is an IT tool supporting sustainable develop-ment controlling at SABMiller group. This software operates online, facilitating com-munication for internal stakeholders, their access to updated information and enablingthem to work remotely. At a reduced functionality spectrum, SAM is also dedicated toexternal stakeholders5. The Sustainability Assessment Matrix tool was implemented at
5 Access to some of the functionalities is made available at SABMiller's website - through the SAMreporting tool tab in the Sustainability section.
Measures and indicators
Strategic planning planning control
economic social environmentalMain controlling processes
Operational planning and budgeting
Forecasting
Cost accounting
Management reporting
Project and investment controlling
Risk management
…. ….
…. ….
…. ….
…. ….
…. ….
…. ….
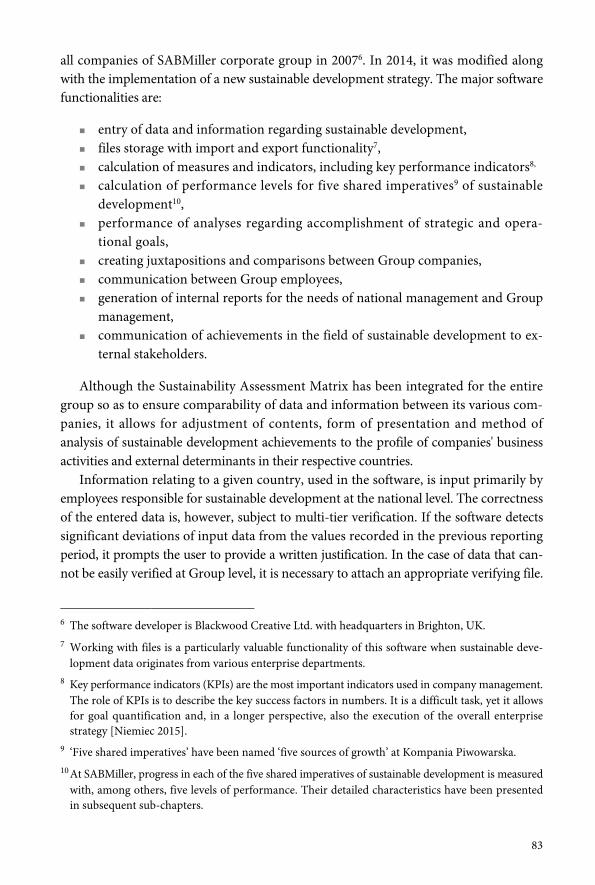
83
all companies of SABMiller corporate group in 20076. In 2014, it was modified alongwith the implementation of a new sustainable development strategy. The major softwarefunctionalities are:
entry of data and information regarding sustainable development, files storage with import and export functionality7, calculation of measures and indicators, including key performance indicators8,
calculation of performance levels for five shared imperatives9 of sustainabledevelopment10,
performance of analyses regarding accomplishment of strategic and opera-tional goals,
creating juxtapositions and comparisons between Group companies, communication between Group employees, generation of internal reports for the needs of national management and Group
management, communication of achievements in the field of sustainable development to ex-
ternal stakeholders.
Although the Sustainability Assessment Matrix has been integrated for the entiregroup so as to ensure comparability of data and information between its various com-panies, it allows for adjustment of contents, form of presentation and method ofanalysis of sustainable development achievements to the profile of companies' businessactivities and external determinants in their respective countries.
Information relating to a given country, used in the software, is input primarily byemployees responsible for sustainable development at the national level. The correctnessof the entered data is, however, subject to multi-tier verification. If the software detectssignificant deviations of input data from the values recorded in the previous reportingperiod, it prompts the user to provide a written justification. In the case of data that can-not be easily verified at Group level, it is necessary to attach an appropriate verifying file.
6 The software developer is Blackwood Creative Ltd. with headquarters in Brighton, UK.7 Working with files is a particularly valuable functionality of this software when sustainable deve-
lopment data originates from various enterprise departments.8 Key performance indicators (KPIs) are the most important indicators used in company management.
The role of KPIs is to describe the key success factors in numbers. It is a difficult task, yet it allowsfor goal quantification and, in a longer perspective, also the execution of the overall enterprisestrategy [Niemiec 2015].
9 ‘Five shared imperatives’ have been named ‘five sources of growth’ at Kompania Piwowarska.10At SABMiller, progress in each of the five shared imperatives of sustainable development is measured
with, among others, five levels of performance. Their detailed characteristics have been presentedin subsequent sub-chapters.
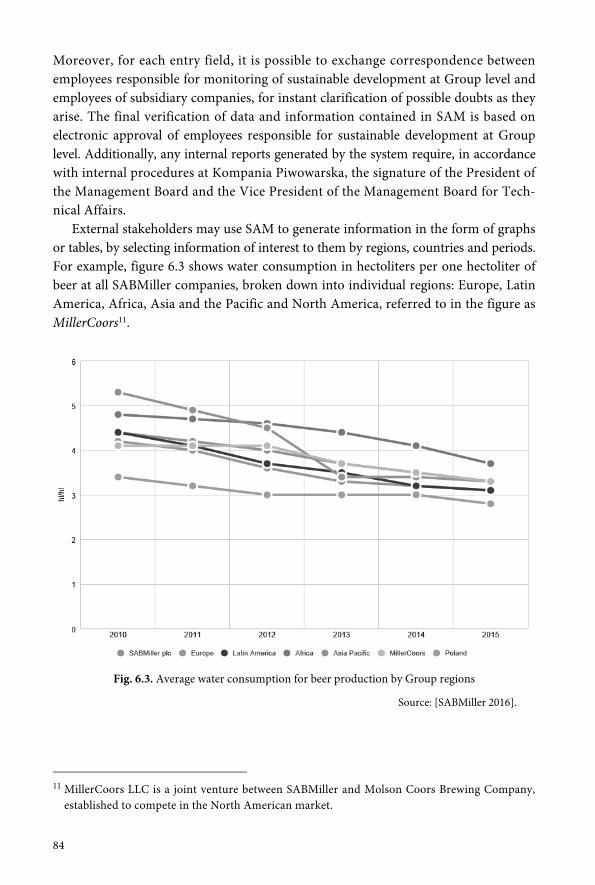
84
Moreover, for each entry field, it is possible to exchange correspondence betweenemployees responsible for monitoring of sustainable development at Group level andemployees of subsidiary companies, for instant clarification of possible doubts as theyarise. The final verification of data and information contained in SAM is based onelectronic approval of employees responsible for sustainable development at Grouplevel. Additionally, any internal reports generated by the system require, in accordancewith internal procedures at Kompania Piwowarska, the signature of the President ofthe Management Board and the Vice President of the Management Board for Tech-nical Affairs.
External stakeholders may use SAM to generate information in the form of graphsor tables, by selecting information of interest to them by regions, countries and periods.For example, figure 6.3 shows water consumption in hectoliters per one hectoliter ofbeer at all SABMiller companies, broken down into individual regions: Europe, LatinAmerica, Africa, Asia and the Pacific and North America, referred to in the figure asMillerCoors11.
Fig. 6.3. Average water consumption for beer production by Group regions
Source: [SABMiller 2016].
11 MillerCoors LLC is a joint venture between SABMiller and Molson Coors Brewing Company,established to compete in the North American market.
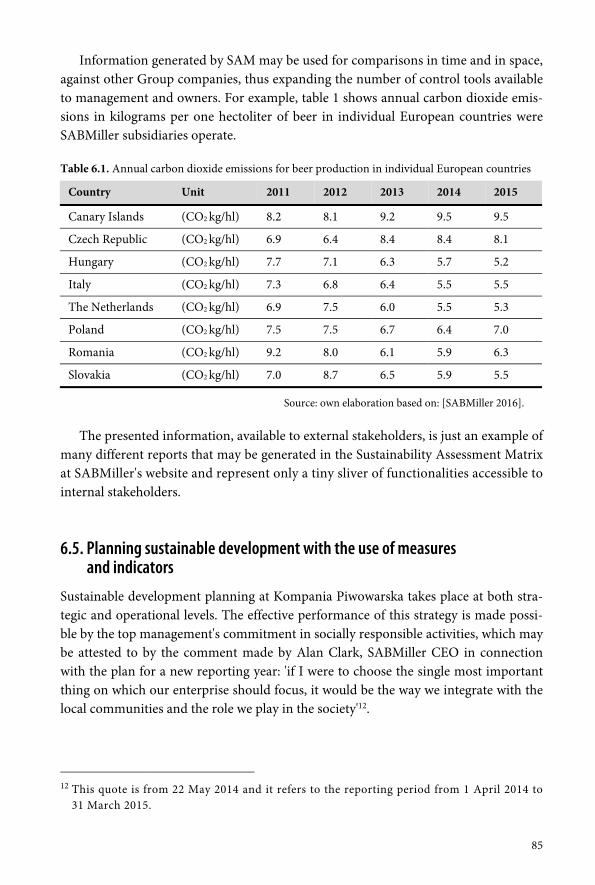
85
Information generated by SAM may be used for comparisons in time and in space,against other Group companies, thus expanding the number of control tools availableto management and owners. For example, table 1 shows annual carbon dioxide emis-sions in kilograms per one hectoliter of beer in individual European countries wereSABMiller subsidiaries operate.
Table 6.1. Annual carbon dioxide emissions for beer production in individual European countries
Country Unit 2011 2012 2013 2014 2015
Canary Islands (CO2 kg/hl) 8.2 8.1 9.2 9.5 9.5
Czech Republic (CO2 kg/hl) 6.9 6.4 8.4 8.4 8.1
Hungary (CO2 kg/hl) 7.7 7.1 6.3 5.7 5.2
Italy (CO2 kg/hl) 7.3 6.8 6.4 5.5 5.5
The Netherlands (CO2 kg/hl) 6.9 7.5 6.0 5.5 5.3
Poland (CO2 kg/hl) 7.5 7.5 6.7 6.4 7.0
Romania (CO2 kg/hl) 9.2 8.0 6.1 5.9 6.3
Slovakia (CO2 kg/hl) 7.0 8.7 6.5 5.9 5.5
Source: own elaboration based on: [SABMiller 2016].
The presented information, available to external stakeholders, is just an example ofmany different reports that may be generated in the Sustainability Assessment Matrixat SABMiller's website and represent only a tiny sliver of functionalities accessible tointernal stakeholders.
6.5. Planning sustainable development with the use of measuresand indicators
Sustainable development planning at Kompania Piwowarska takes place at both stra-tegic and operational levels. The effective performance of this strategy is made possi-ble by the top management's commitment in socially responsible activities, which maybe attested to by the comment made by Alan Clark, SABMiller CEO in connectionwith the plan for a new reporting year: 'if I were to choose the single most importantthing on which our enterprise should focus, it would be the way we integrate with thelocal communities and the role we play in the society'12.
12 This quote is from 22 May 2014 and it refers to the reporting period from 1 April 2014 to31 March 2015.
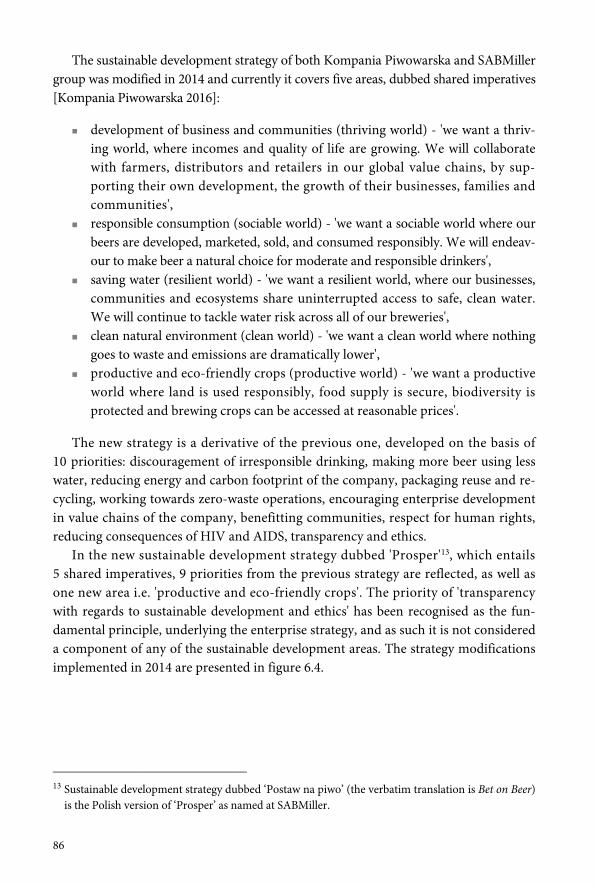
86
The sustainable development strategy of both Kompania Piwowarska and SABMillergroup was modified in 2014 and currently it covers five areas, dubbed shared imperatives[Kompania Piwowarska 2016]:
development of business and communities (thriving world) - 'we want a thriv-ing world, where incomes and quality of life are growing. We will collaboratewith farmers, distributors and retailers in our global value chains, by sup-porting their own development, the growth of their businesses, families andcommunities',
responsible consumption (sociable world) - 'we want a sociable world where ourbeers are developed, marketed, sold, and consumed responsibly. We will endeav-our to make beer a natural choice for moderate and responsible drinkers',
saving water (resilient world) - 'we want a resilient world, where our businesses,communities and ecosystems share uninterrupted access to safe, clean water.We will continue to tackle water risk across all of our breweries',
clean natural environment (clean world) - 'we want a clean world where nothinggoes to waste and emissions are dramatically lower',
productive and eco-friendly crops (productive world) - 'we want a productiveworld where land is used responsibly, food supply is secure, biodiversity isprotected and brewing crops can be accessed at reasonable prices'.
The new strategy is a derivative of the previous one, developed on the basis of10 priorities: discouragement of irresponsible drinking, making more beer using lesswater, reducing energy and carbon footprint of the company, packaging reuse and re-cycling, working towards zero-waste operations, encouraging enterprise developmentin value chains of the company, benefitting communities, respect for human rights,reducing consequences of HIV and AIDS, transparency and ethics.
In the new sustainable development strategy dubbed 'Prosper'13, which entails5 shared imperatives, 9 priorities from the previous strategy are reflected, as well asone new area i.e. 'productive and eco-friendly crops'. The priority of 'transparencywith regards to sustainable development and ethics' has been recognised as the fun-damental principle, underlying the enterprise strategy, and as such it is not considereda component of any of the sustainable development areas. The strategy modificationsimplemented in 2014 are presented in figure 6.4.
13 Sustainable development strategy dubbed ‘Postaw na piwo’ (the verbatim translation is Bet on Beer)is the Polish version of ‘Prosper’ as named at SABMiller.
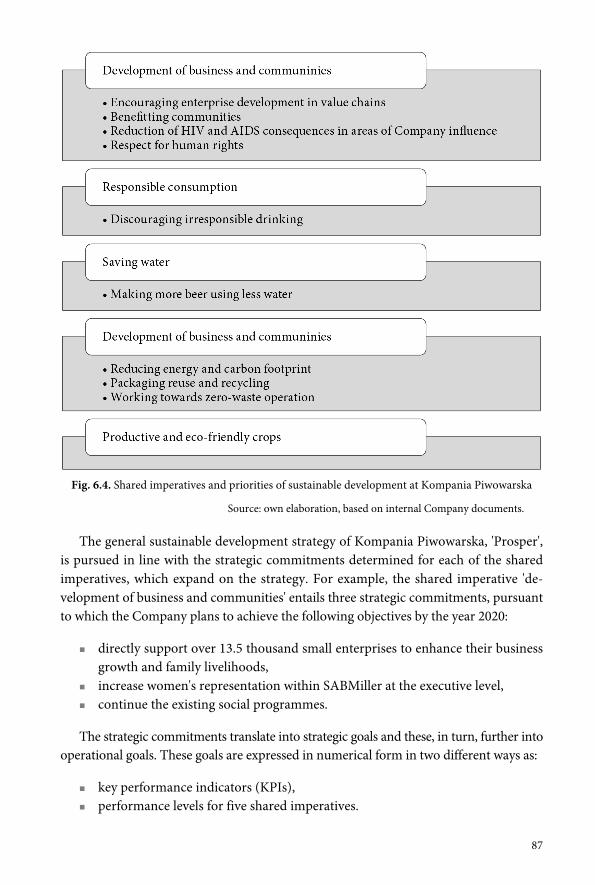
87
Fig. 6.4. Shared imperatives and priorities of sustainable development at Kompania Piwowarska
Source: own elaboration, based on internal Company documents.
The general sustainable development strategy of Kompania Piwowarska, 'Prosper',is pursued in line with the strategic commitments determined for each of the sharedimperatives, which expand on the strategy. For example, the shared imperative 'de-velopment of business and communities' entails three strategic commitments, pursuantto which the Company plans to achieve the following objectives by the year 2020:
directly support over 13.5 thousand small enterprises to enhance their businessgrowth and family livelihoods,
increase women's representation within SABMiller at the executive level, continue the existing social programmes.
The strategic commitments translate into strategic goals and these, in turn, further intooperational goals. These goals are expressed in numerical form in two different ways as:
key performance indicators (KPIs), performance levels for five shared imperatives.
88
Key performance indicators are expressed with measures and indicators, whileperformance levels are reflected on a scale of 0 to 5, providing both quantitative andqualitative information used in their calculation. The achievement of a given level re-quires fulfilling a number of different conditions determined for this level, as well asall the requirements set for the lower levels.
Goals in the form of key performance indicators are set for each of the subsidiaries,as a derivative of Group's overall goals, also on the basis of analysis of previous per-formance, macroeconomic determinants of a given country and company's declara-tions. The ultimate objective, however, is set by the Group Management Board. Goalsin the form of performance levels are first determined by national management boardsand then approved at Group level.
Goals expressed as key performance indicators and performance levels are setevery six months for the next year and for the time horizon up to 2020, which is thetime-frame for the strategy implemented in 2014. It merits a mention that some of thegoals of crucial importance to Kompania Piwowarska have been broken down intomore detailed schedules - for every year within the strategy time-frame. One example ofthe performance levels set by Kompania Piwowarska in 2015 is shown in figure 6.514.
Fig. 6.5. Goals in the form of sustainable development performance levels
Source: [Report 2015].
14 Years in this figure are represented by letter 'F' meaning a financial year which does not corre-spond to the calendar year.
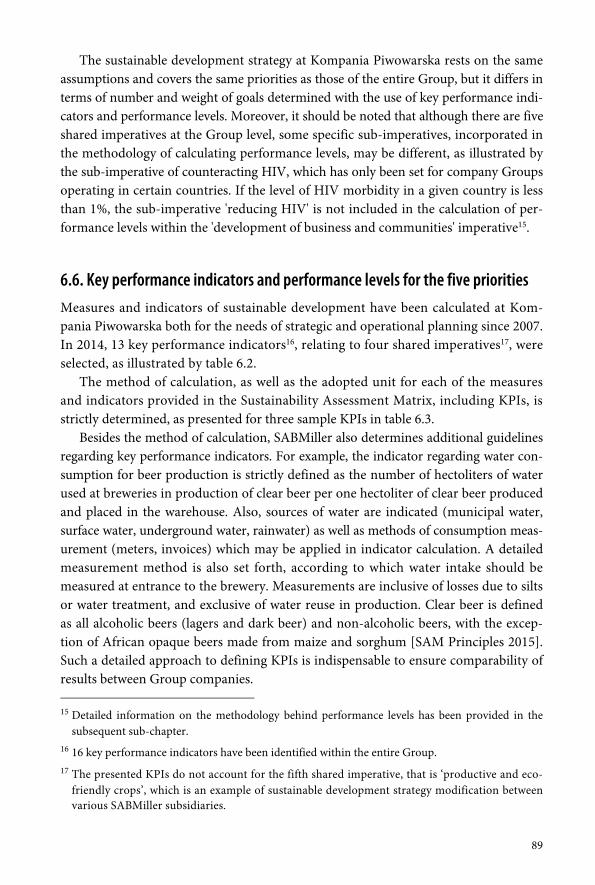
89
The sustainable development strategy at Kompania Piwowarska rests on the sameassumptions and covers the same priorities as those of the entire Group, but it differs interms of number and weight of goals determined with the use of key performance indi-cators and performance levels. Moreover, it should be noted that although there are fiveshared imperatives at the Group level, some specific sub-imperatives, incorporated inthe methodology of calculating performance levels, may be different, as illustrated bythe sub-imperative of counteracting HIV, which has only been set for company Groupsoperating in certain countries. If the level of HIV morbidity in a given country is lessthan 1%, the sub-imperative 'reducing HIV' is not included in the calculation of per-formance levels within the 'development of business and communities' imperative15.
6.6. Key performance indicators and performance levels for the five priorities
Measures and indicators of sustainable development have been calculated at Kom-pania Piwowarska both for the needs of strategic and operational planning since 2007.In 2014, 13 key performance indicators16, relating to four shared imperatives17, wereselected, as illustrated by table 6.2.
The method of calculation, as well as the adopted unit for each of the measuresand indicators provided in the Sustainability Assessment Matrix, including KPIs, isstrictly determined, as presented for three sample KPIs in table 6.3.
Besides the method of calculation, SABMiller also determines additional guidelinesregarding key performance indicators. For example, the indicator regarding water con-sumption for beer production is strictly defined as the number of hectoliters of waterused at breweries in production of clear beer per one hectoliter of clear beer producedand placed in the warehouse. Also, sources of water are indicated (municipal water,surface water, underground water, rainwater) as well as methods of consumption meas-urement (meters, invoices) which may be applied in indicator calculation. A detailedmeasurement method is also set forth, according to which water intake should bemeasured at entrance to the brewery. Measurements are inclusive of losses due to siltsor water treatment, and exclusive of water reuse in production. Clear beer is definedas all alcoholic beers (lagers and dark beer) and non-alcoholic beers, with the excep-tion of African opaque beers made from maize and sorghum [SAM Principles 2015].Such a detailed approach to defining KPIs is indispensable to ensure comparability ofresults between Group companies.
15 Detailed information on the methodology behind performance levels has been provided in thesubsequent sub-chapter.
16 16 key performance indicators have been identified within the entire Group.17 The presented KPIs do not account for the fifth shared imperative, that is ‘productive and eco-
friendly crops’, which is an example of sustainable development strategy modification betweenvarious SABMiller subsidiaries.
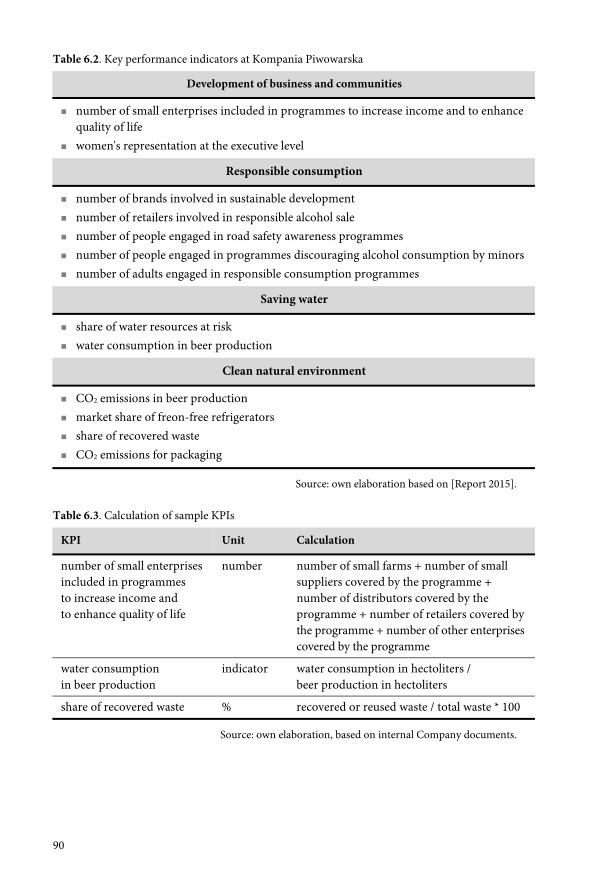
90
Table 6.2. Key performance indicators at Kompania Piwowarska
Development of business and communities
number of small enterprises included in programmes to increase income and to enhancequality of life
women's representation at the executive level
Responsible consumption
number of brands involved in sustainable development number of retailers involved in responsible alcohol sale number of people engaged in road safety awareness programmes number of people engaged in programmes discouraging alcohol consumption by minors number of adults engaged in responsible consumption programmes
Saving water
share of water resources at risk water consumption in beer production
Clean natural environment
CO2 emissions in beer production market share of freon-free refrigerators share of recovered waste CO2 emissions for packaging
Source: own elaboration based on [Report 2015].
Table 6.3. Calculation of sample KPIs
KPI Unit Calculation
number of small enterprisesincluded in programmesto increase income andto enhance quality of life
number number of small farms + number of smallsuppliers covered by the programme +number of distributors covered by theprogramme + number of retailers covered bythe programme + number of other enterprisescovered by the programme
water consumptionin beer production
indicator water consumption in hectoliters /beer production in hectoliters
share of recovered waste % recovered or reused waste / total waste * 100
Source: own elaboration, based on internal Company documents.
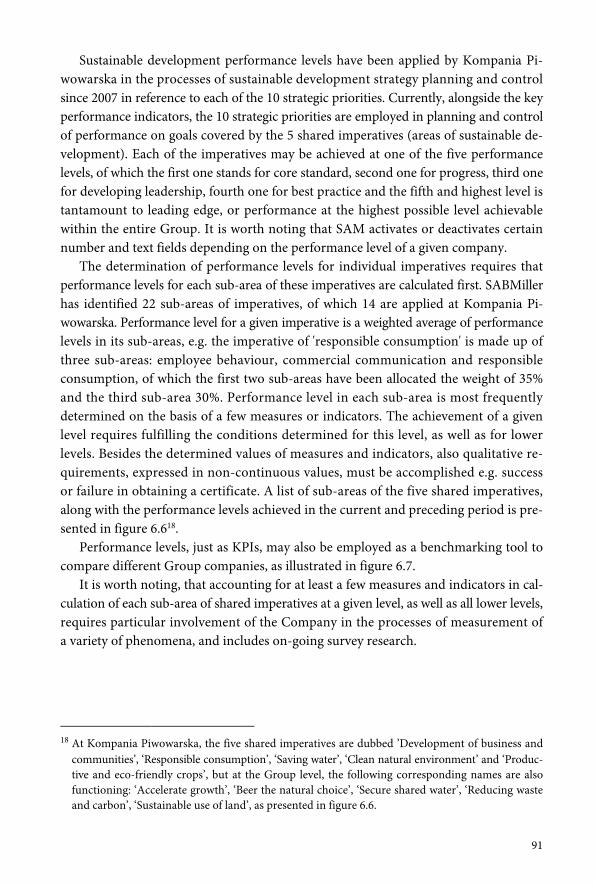
91
Sustainable development performance levels have been applied by Kompania Pi-wowarska in the processes of sustainable development strategy planning and controlsince 2007 in reference to each of the 10 strategic priorities. Currently, alongside the keyperformance indicators, the 10 strategic priorities are employed in planning and controlof performance on goals covered by the 5 shared imperatives (areas of sustainable de-velopment). Each of the imperatives may be achieved at one of the five performancelevels, of which the first one stands for core standard, second one for progress, third onefor developing leadership, fourth one for best practice and the fifth and highest level istantamount to leading edge, or performance at the highest possible level achievablewithin the entire Group. It is worth noting that SAM activates or deactivates certainnumber and text fields depending on the performance level of a given company.
The determination of performance levels for individual imperatives requires thatperformance levels for each sub-area of these imperatives are calculated first. SABMillerhas identified 22 sub-areas of imperatives, of which 14 are applied at Kompania Pi-wowarska. Performance level for a given imperative is a weighted average of performancelevels in its sub-areas, e.g. the imperative of 'responsible consumption' is made up ofthree sub-areas: employee behaviour, commercial communication and responsibleconsumption, of which the first two sub-areas have been allocated the weight of 35%and the third sub-area 30%. Performance level in each sub-area is most frequentlydetermined on the basis of a few measures or indicators. The achievement of a givenlevel requires fulfilling the conditions determined for this level, as well as for lowerlevels. Besides the determined values of measures and indicators, also qualitative re-quirements, expressed in non-continuous values, must be accomplished e.g. successor failure in obtaining a certificate. A list of sub-areas of the five shared imperatives,along with the performance levels achieved in the current and preceding period is pre-sented in figure 6.618.
Performance levels, just as KPIs, may also be employed as a benchmarking tool tocompare different Group companies, as illustrated in figure 6.7.
It is worth noting, that accounting for at least a few measures and indicators in cal-culation of each sub-area of shared imperatives at a given level, as well as all lower levels,requires particular involvement of the Company in the processes of measurement ofa variety of phenomena, and includes on-going survey research.
18 At Kompania Piwowarska, the five shared imperatives are dubbed ’Development of business andcommunities’, ‘Responsible consumption’, ‘Saving water’, ‘Clean natural environment’ and ‘Produc-tive and eco-friendly crops’, but at the Group level, the following corresponding names are alsofunctioning: ‘Accelerate growth’, ‘Beer the natural choice’, ‘Secure shared water’, ‘Reducing wasteand carbon’, ‘Sustainable use of land’, as presented in figure 6.6.
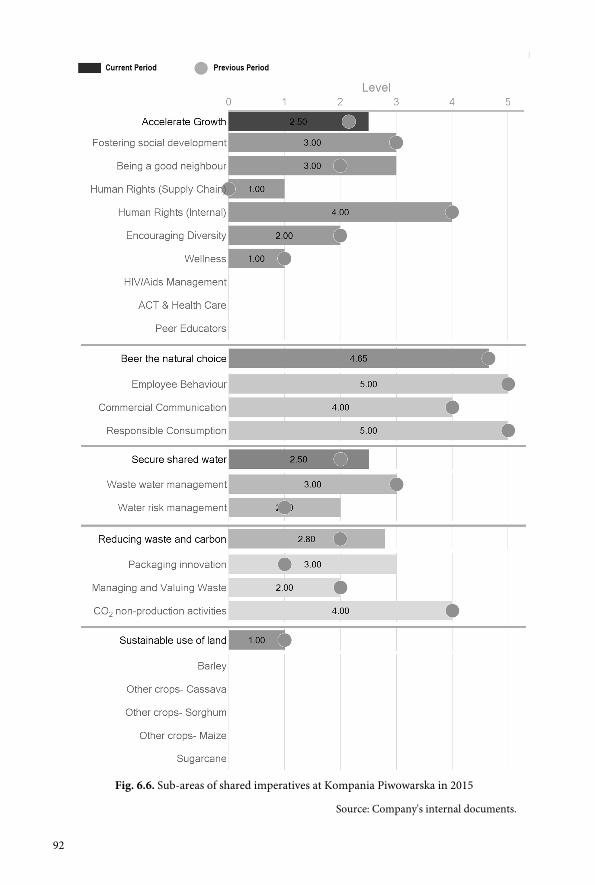
92
Fig. 6.6. Sub-areas of shared imperatives at Kompania Piwowarska in 2015
Source: Company's internal documents.
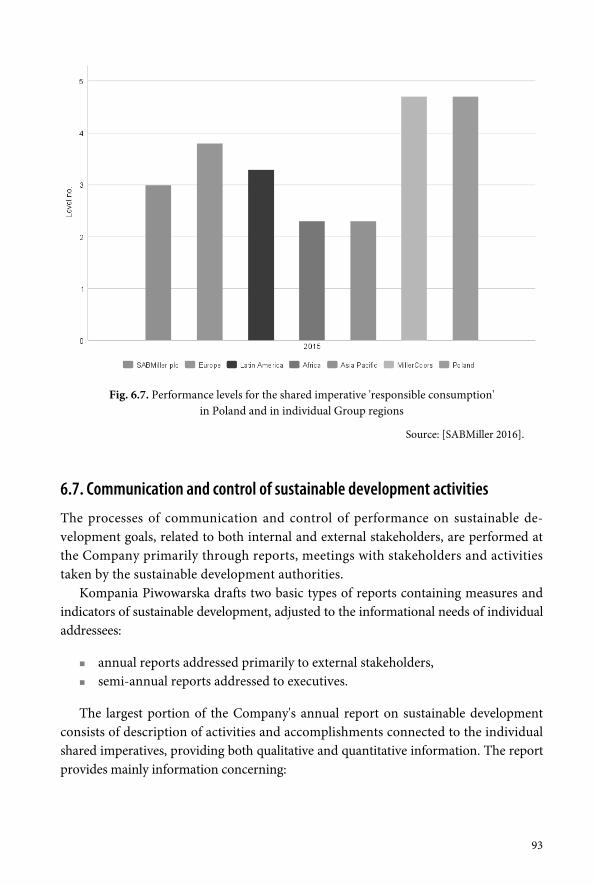
93
Fig. 6.7. Performance levels for the shared imperative 'responsible consumption'in Poland and in individual Group regions
Source: [SABMiller 2016].
6.7. Communication and control of sustainable development activities
The processes of communication and control of performance on sustainable de-velopment goals, related to both internal and external stakeholders, are performed atthe Company primarily through reports, meetings with stakeholders and activitiestaken by the sustainable development authorities.
Kompania Piwowarska drafts two basic types of reports containing measures andindicators of sustainable development, adjusted to the informational needs of individualaddressees:
annual reports addressed primarily to external stakeholders, semi-annual reports addressed to executives.
The largest portion of the Company's annual report on sustainable developmentconsists of description of activities and accomplishments connected to the individualshared imperatives, providing both qualitative and quantitative information. The reportprovides mainly information concerning:
94
the history and brief outline of Company's operation, sustainable development strategy along with the related undertaken commitments, socially responsible projects and initiatives, as well as the motives behind them, methods of delivery on strategic commitments, including pursued investments, main accomplishments in sustainable development in the last reporting period, foundations with which the Company cooperates in the course of execution of
selected socially responsible projects and initiatives, basic information regarding the reporting methodology.
Quantitative information provided in an annual report comprises mainly key per-formance indicators and performance levels for each of the shared imperative. Apartfrom those, also other measures and indicators of significance to external stakeholdersare presented in reports. Some of them relate to projects performed within the given re-porting period, while others are of relatively recurring nature, allowing for their valuesto be monitored over time. Measures and indicators of significance to stakeholdersof Kompania Piwowarska in 2015, of recurring nature but not constituting keyperformance indicators, have been presented in reference to individual shared im-peratives in table 6.4.
The annual report also contains measures and indicators pertaining to projectsconducted in a given reporting period, e.g. the weight of waste collected in the 'Eco Zone'at Woodstock Festival, the number of people registered as potential bone marrow do-nors under the project 'Non-trivial Valentine's Day', the number of rear-windshieldstickers handed out to drivers within the 'I Never Drink and Drive' campaign, thecount of downloads of the 'Check Your Blood Alcohol Content' application, numberof trees planted and number of participants of the 'Go for Bike' action.
It is also worthwhile to take a look at the detailed measures and indicators per-taining to the performance of strategic commitments through investments pursued.In its annual report, the Company disseminates information about expected ecologi-cal effects of, e.g. modernization of the water treatment station for the ammonia com-pressor, which is expected to save 0.07 hectoliter of water per one hectoliter of beer.Another example is the modernization of the open system of condensate tanks in-stalled in the production halls, consisting of addition of a water seal, which will enablethe operation of tanks in a closed system under working pressure of 0.2 bar leading toelimination of condensate loss through evaporation and will prevent the associatedheat energy loss at a level of 22,996 CO2 kg annually [Report 2015].
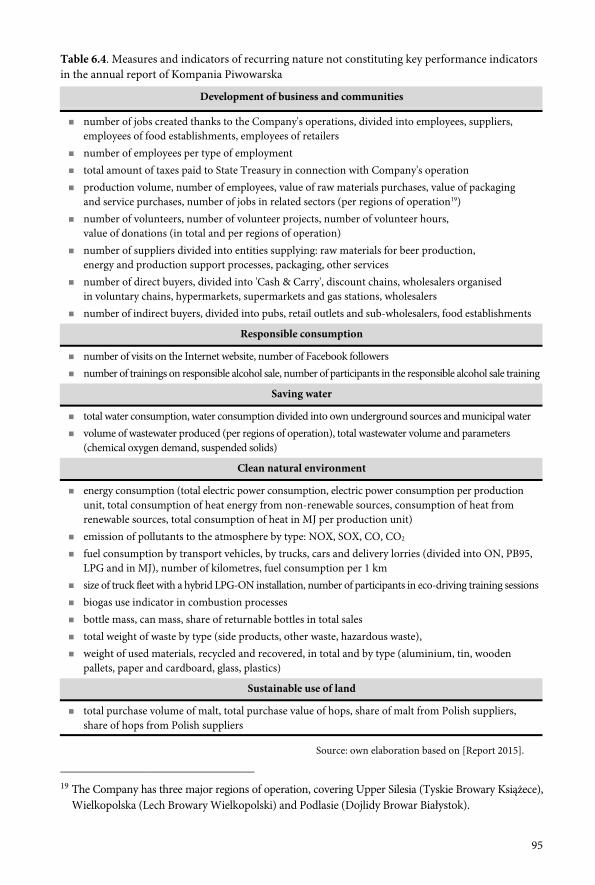
95
Table 6.4. Measures and indicators of recurring nature not constituting key performance indicatorsin the annual report of Kompania Piwowarska
Development of business and communities
number of jobs created thanks to the Company's operations, divided into employees, suppliers,employees of food establishments, employees of retailers
number of employees per type of employment total amount of taxes paid to State Treasury in connection with Company's operation production volume, number of employees, value of raw materials purchases, value of packaging
and service purchases, number of jobs in related sectors (per regions of operation19) number of volunteers, number of volunteer projects, number of volunteer hours,
value of donations (in total and per regions of operation) number of suppliers divided into entities supplying: raw materials for beer production,
energy and production support processes, packaging, other services number of direct buyers, divided into 'Cash & Carry', discount chains, wholesalers organised
in voluntary chains, hypermarkets, supermarkets and gas stations, wholesalers number of indirect buyers, divided into pubs, retail outlets and sub-wholesalers, food establishments
Responsible consumption
number of visits on the Internet website, number of Facebook followers number of trainings on responsible alcohol sale, number of participants in the responsible alcohol sale training
Saving water
total water consumption, water consumption divided into own underground sources and municipal water volume of wastewater produced (per regions of operation), total wastewater volume and parameters
(chemical oxygen demand, suspended solids)
Clean natural environment
energy consumption (total electric power consumption, electric power consumption per productionunit, total consumption of heat energy from non-renewable sources, consumption of heat fromrenewable sources, total consumption of heat in MJ per production unit)
emission of pollutants to the atmosphere by type: NOX, SOX, CO, CO2
fuel consumption by transport vehicles, by trucks, cars and delivery lorries (divided into ON, PB95,LPG and in MJ), number of kilometres, fuel consumption per 1 km
size of truck fleet with a hybrid LPG-ON installation, number of participants in eco-driving training sessions biogas use indicator in combustion processes bottle mass, can mass, share of returnable bottles in total sales total weight of waste by type (side products, other waste, hazardous waste), weight of used materials, recycled and recovered, in total and by type (aluminium, tin, wooden
pallets, paper and cardboard, glass, plastics)
Sustainable use of land
total purchase volume of malt, total purchase value of hops, share of malt from Polish suppliers,share of hops from Polish suppliers
Source: own elaboration based on [Report 2015].
19 The Company has three major regions of operation, covering Upper Silesia (Tyskie Browary Książece),Wielkopolska (Lech Browary Wielkopolski) and Podlasie (Dojlidy Browar Białystok).
96
The semi-annual report, unlike the annual report, is intended for internal use andis addressed exclusively to Company employees, in particular its executives, both atthe Company level and at the SABMiller group level. The report is generated with theuse of the Sustainability Assessment Matrix and it provides the most significant measuresand indicators pertaining to the achievement of enterprise goals in strategic and opera-tional dimensions. Information contained in the semi-annual report of Kompania Pi-wowarska is structured according to five elements:
approval of data for the report, overview of sustainable development achievements, key performance indicators by shared imperatives, performance levels for sub-areas of shared imperatives, occupational health and safety.
Approval of data used for the report generation, which is the first step in draftingof this report, is connected with the procedure of verification of information originatingfrom the Sustainability Assessment Matrix. The second part of the report - overviewof sustainable development achievements - focuses on information regarding accom-plishments in the area of sustainability from the perspective of the managing directorand managers of various departments. The subsequent parts refer to the five sharedimperatives in relation to key performance indicators and the performance levels forindividual sub-areas of shared imperatives. The part concerning occupational healthand safety presents measures and indicators related to four aspects: number of majorinjuries, number of fatalities, injury rate per 200,000 hours, number of road vehicleaccidents. Information presented in the five report parts is as condensed as possible,taking up less than 10 pages. Additionally, an annex to the report contains a run-downof all the key performance indicators of the Company. A summary of the most impor-tant sustainability results of Kompania Piwowarska provided in the internal report forthe second half of the reporting year 2015 is presented in figure 6.8.
A graphic summary of the most important results, as appearing in the internalreport, is a synthesis of key performance indicators (upper part of the figure) andsustainability performance levels (lower part of the figure), for each of the five sharedimperatives. KPI values are expressed with the use of suitable measures or indicators.A further part of the report presents the year-to-year change of KPI values, expressedin relevant units (in the case of measures) or in percentages (in the case of indicators).The achieved performance levels are shown in relation to values planned for the years2016 and 2020.
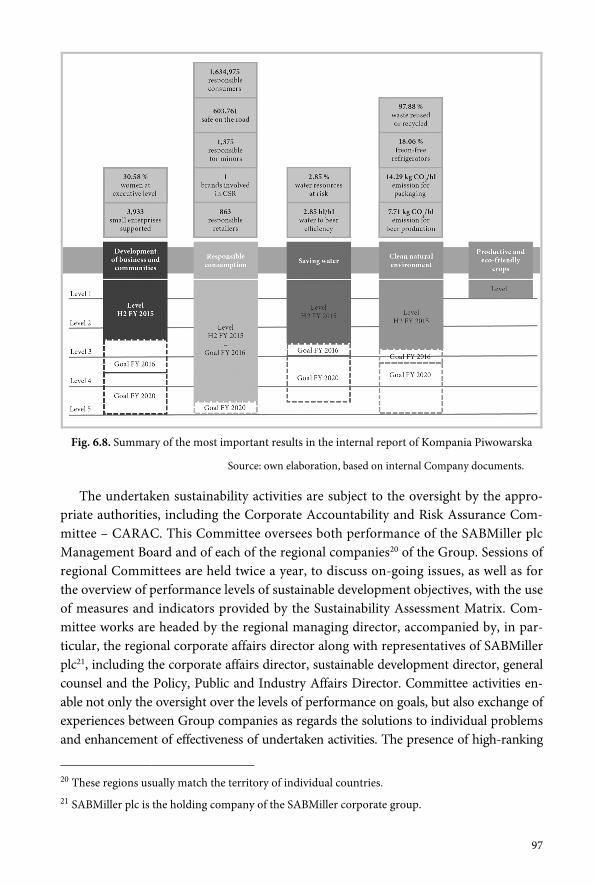
97
Fig. 6.8. Summary of the most important results in the internal report of Kompania Piwowarska
Source: own elaboration, based on internal Company documents.
The undertaken sustainability activities are subject to the oversight by the appro-priate authorities, including the Corporate Accountability and Risk Assurance Com-mittee – CARAC. This Committee oversees both performance of the SABMiller plcManagement Board and of each of the regional companies20 of the Group. Sessions ofregional Committees are held twice a year, to discuss on-going issues, as well as forthe overview of performance levels of sustainable development objectives, with the useof measures and indicators provided by the Sustainability Assessment Matrix. Com-mittee works are headed by the regional managing director, accompanied by, in par-ticular, the regional corporate affairs director along with representatives of SABMillerplc21, including the corporate affairs director, sustainable development director, generalcounsel and the Policy, Public and Industry Affairs Director. Committee activities en-able not only the oversight over the levels of performance on goals, but also exchange ofexperiences between Group companies as regards the solutions to individual problemsand enhancement of effectiveness of undertaken activities. The presence of high-ranking
20 These regions usually match the territory of individual countries.21 SABMiller plc is the holding company of the SABMiller corporate group.
98
executives with broad competences and decision-making powers lends special signifi-cance to the Committee in terms of control of Company initiatives in the field of sus-tainable development of the entire SABMiller group.
Besides the Corporate Accountability and Risk Assurance Committee, which oper-ates at all of Group's companies, Kompania Piwowarska have also appointed an EthicsCommittee, which functions as a permanent body. The Committee focuses primarilyon all ethics-related issues, including active promotion of ethical standards and servingemployees with its consultancy and advisory capacities. In 2012, a former CEO of Kom-pania Piwowarska was appointed president of the Committee, which goes to prove thatthe Company strategically perceives its socially responsible endeavours.
Oversight and communication within the sustainable development at KompaniaPiwowarska is also undertaken in liaison with external stakeholders. At least once a year,meetings with key Company's stakeholders are held. Among the stakeholders are rep-resentatives of local authorities, NGOs, media, business partners and employees. Thepurpose of these meetings is to discuss the completed socially responsible activities, aswell as to determine the initiatives and projects, important and needed from viewpointof external stakeholders, to be pursued in the future..
Oversight and communication of socially responsible activities at Kompania Pi-wowarska leads to systematic improvement on performance with regards to goals setin the sustainable development strategy, as evidenced by, for example, the increase ofthe average performance level within the Group from 1.7 in 2007 to 3.4 in 2014. Duringthe same period of time, the number of subsidiaries which were classified on the firstperformance level, as regards any of the ten sustainable development priorities, fell - from71 companies in 2007 to only 2 companies in 201422.
6.8. Final remarksThe application of an appropriate system of measures and indicators in green con-trolling is one of the conditions of correct shaping and coordination of the processesof planning, control and information supply, oriented at managing the entire enter-prise with a view of sustainable development goals. The effectiveness of this system isdetermined by, among others, the employed solutions as regards integration of meas-ures and indicators between the strategic and operational goals of sustainable devel-opment, as well as by application of appropriate IT tools. This chapter presented theso-called 'good practices' applied at Kompania Piwowarska, particularly those relatedto the Sustainability Assessment Matrix software, application of key performance in-dicators and performance levels in strategic and operational planning, as well as toolsused in communication and oversight of the degree of goals achievement.
22 Up until the year 2014, the sustainable development strategy had been based on 10 priorities.
C H A P T E R 7
Reporting in green controlling at selected companies
7.1. Introductory remarks
The functioning of enterprises in the modern economy is connected with exerting animpact on the natural environment. The scale of this impact varies, depending on thetypes of processes pursued by business entities. The national legislation and EU direc-tives oblige enterprises to monitor levels of pollution and to carry out environmentalreporting. The reporting path, types of reports and the obligatory solutions within thisscope have been presented in the first, theoretical part of book.1 The present chaptertransposes theoretical issues relating to environmental reporting onto the field of eco-nomic practice.
Given the vast scope of the subject, the chapter covers only some selected report-ing methods and types of reports presented to companies' stakeholders. They corre-spond with the provisions of the EU Directive dated 22 October 2014. The Directiveaims to harmonize the structure and scope of non-financial information to be dis-closed by enterprises.2
Results of empirical research pertain to four case studies. The first two were con-ducted at companies operating in extractive industry. The next two present reportingby example of two types of reports: integrated report (LOTOS Group) and Eco-Management and Audit Scheme (EMAS) report.
1 Cf: Green Controlling and Finance. Theoretical Framework, [ed. C. Kochalski], Wydawnictwo C.H. Beck,Warsaw 2016, p. 251 et seq.
2 Directive 2014/95/UE of the European Parliament and Council amending Directive 2013/34/EUas regards disclosure of non-financial and diversity information by certain large undertakings andgroups. Official Journal of the European Union 15.11.2014 L330/1.
100
The impact of extractive industry on the natural environment is relatively intense,primarily due to discharge of mine water to rivers, generation of large amounts ofwaste, deformation of earth surface or emission of various types of dust and gases tothe atmosphere, both directly, i.e. in the course of the processes performed, and indi-rectly, through high energy consumption. Given the above, the following extractivecompanies were selected for the research: coal mine LW Bogdanka and the miningand metallurgy enterprise ZGH Bolesław SA. LW Bogdanka is a public joint-stockcompany listed on the regulated market at Warsaw Stock Exchange (WSE). Environ-mental reporting, being the focus of the research, constitutes a part of the company'sintegrated report. The company has been awarded a 'Golden Laurel' journalists' awardfor the scope and quality of its report. The scope of data obtained from LW Bogdankaand contained in the present chapter stems from the legal obligations binding companieslisted on stock exchange.
ZGH Bolesław SA is not stock listed. It is the holding company of the CorporateGroup ZGH Bolesław SA. The Group does not draw up consolidated reports in thearea of environmental impacts. Each of the companies in the Group reports separatelyto the Voivodeship Inspectorates for Environmental Protection (VIEPs), to Voivode-ship Marshals who grant environmental permits and to the Central Statistical Office,as well as to other central-level offices responsible for the monitoring of pollution levelsof the natural environment in the country.
The third case study is that of LOTOS Group. The group runs extractive, refineryand trade activities. Its impact on the broadly understood natural environment is thereforeirrefutable. The report issued by the LOTOS Group is an integrated report. The Grouphas been publishing its report in this form since 2009. It has received a number of awardsand distinctions for its pro-environmental and pro-social initiatives, such as the 'CrystalLaurel of Skills and Competence' for combining business activities with social respon-sibility and for its contribution to development of Polish economy in 2014. It has alsoreceived accolades for its integrated report (3rd award in 2014) in the 'Best AnnualReport' contest. This report is addressed to stockholders and all other interested parties.As a result, the scope of disclosed information covers the entire spectrum of com-pany's operations within a given year.
The final example is RAFAKO SA with its environmental report drafted accordingto the Eco-Management and Audit Scheme (EMAS), compliant with the ISO 14000standard. This report focuses mainly on environmental aspects, yet it may also bea standard for the harmonized structure and scope of non-financial information asstipulated in the above-mentioned directive.
The purpose of this chapter is to present the best practices in green reporting.
101
7.2. Environmental reporting system at GK LW Bogdanka SA
7.2.1. Brief description of the company
The core activity of the corporate group GK LW Bogdanka SA is the extraction ofhard coal used for production of electrical and heat power and cement. It also hasa number of applications in the chemical industry. The coal recipients are industrialplants operating in the electric power industry, located primarily in Eastern andNorth-Eastern Poland.
LW Bogdanka SA corporate group entails:
mine LW 'Bogdanka' SA, EcoKLINKIER construction ceramics enterprise, Łęczyńska Energetyka Sp. z o.o., repair enterprise RG Bogdanka Sp z o.o., transportation enterprise Ecotrans Bogdanka.
The CSR strategy of GK LW Bogdanka SA assumes remaining the leader of effi-ciency in the mining industry and maintaining a strong leadership in the field of in-novative technological solutions dubbed 'Smart Mine'. The Group expects to doubleits resources and to maintain the company's operations until ca. 2050. The plannedactivities are co-dependent with measures in the field of social responsibility, whichrepresents a significant element of the business development strategy. The priorities ofsocial responsibility adopted in this strategy for the years 2014-2017 reflect the key areasof social and environmental impacts. The strategy is based on continued adherence tofour priorities, for which measures and quantifiable goals have been defined. Specific,main activity directions have been determined for the goals.
The priorities for the years 2014-2017 are:3
Goal 1 - To strive to increase the safety of workforce, Goal 2 - To guarantee the safety of local natural environment, Goal 3 - To ensure safety and support development of local community, Goal 4 - Transparent and responsible management practices.
The listed goals focus on the social and environmental dimension.
3 Corporate Social Responsibility Report of GK LW Bogdanka for the years 2012-2013, p. 55,www.lw.com.pl (downloaded on 8.01.2016)
102
7.2.2. Monitoring the natural environment condition
In order to mitigate the impact of its extractive operations on the environment, thecompany has undertaken a number of initiatives. It has implemented the integratedSystem of Quality, Environment and OHS Management. The key processes have beenoutlined in the Integrated Management System Book, which governs environmentalmanagement. They are:
Identification and assessment of environmental aspects, Monitoring of the key characteristics of environmental aspects, Identification of legal and other requirements and compliance assessment, Development of environmental programmes.
The environmental aspects are also accounted for as key issues on the corporaterisk map. The integrated system of corporate risk management involves an entire groupof environmental risks, dividing them into the following categories:
risk associated with recultivation and mining damages, risk associated with the increasingly stringent standards and legal regulations
as regards environmental protection legislation and the obligation to obtainpermits to use the natural environment,
risk associated with management of waste generated following the expansion ofthe mining site,
investment risk associated with the protected areas.
Activities pursued for a number of years have by now brought the risk exposuredown to an acceptable level.
The Corporate Group LW Bogdanka SA systematically monitors its impact on thenatural environment. The long-standing monitoring has enabled in depth knowledgeand understanding of the majority of impact mechanisms of mine's operations on thecondition of the natural environment in the vicinities of the mining site, especiallymechanisms of water circulation, migration of contaminants, etc. The company hasa particular responsibility, as areas of unique aquatic and mire value, protected by thelaw, are located in its direct surroundings. Table 7.1 presents the legal grounds formonitoring the level of Group's environmental impact, the frequency of measurementsand the organizational units where measurement documentation is kept.
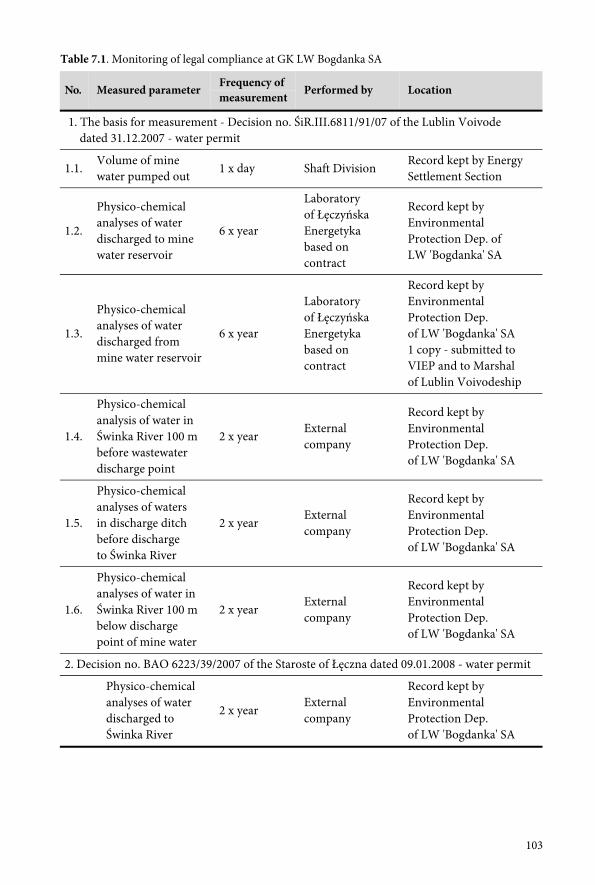
103
Table 7.1. Monitoring of legal compliance at GK LW Bogdanka SA
No. Measured parameter Frequency ofmeasurement
Performed by Location
1. The basis for measurement - Decision no. ŚiR.III.6811/91/07 of the Lublin Voivodedated 31.12.2007 - water permit
1.1.Volume of minewater pumped out
1 x day Shaft DivisionRecord kept by EnergySettlement Section
1.2.
Physico-chemicalanalyses of waterdischarged to minewater reservoir
6 x year
Laboratoryof ŁęczyńskaEnergetykabased oncontract
Record kept byEnvironmentalProtection Dep. ofLW 'Bogdanka' SA
1.3.
Physico-chemicalanalyses of waterdischarged frommine water reservoir
6 x year
Laboratoryof ŁęczyńskaEnergetykabased oncontract
Record kept byEnvironmentalProtection Dep.of LW 'Bogdanka' SA1 copy - submitted toVIEP and to Marshalof Lublin Voivodeship
1.4.
Physico-chemicalanalysis of water inŚwinka River 100 mbefore wastewaterdischarge point
2 x yearExternalcompany
Record kept byEnvironmentalProtection Dep.of LW 'Bogdanka' SA
1.5.
Physico-chemicalanalyses of watersin discharge ditchbefore dischargeto Świnka River
2 x yearExternalcompany
Record kept byEnvironmentalProtection Dep.of LW 'Bogdanka' SA
1.6.
Physico-chemicalanalyses of water inŚwinka River 100 mbelow dischargepoint of mine water
2 x yearExternalcompany
Record kept byEnvironmentalProtection Dep.of LW 'Bogdanka' SA
2. Decision no. BAO 6223/39/2007 of the Staroste of Łęczna dated 09.01.2008 - water permit
Physico-chemicalanalyses of waterdischarged toŚwinka River
2 x yearExternalcompany
Record kept byEnvironmentalProtection Dep.of LW 'Bogdanka' SA
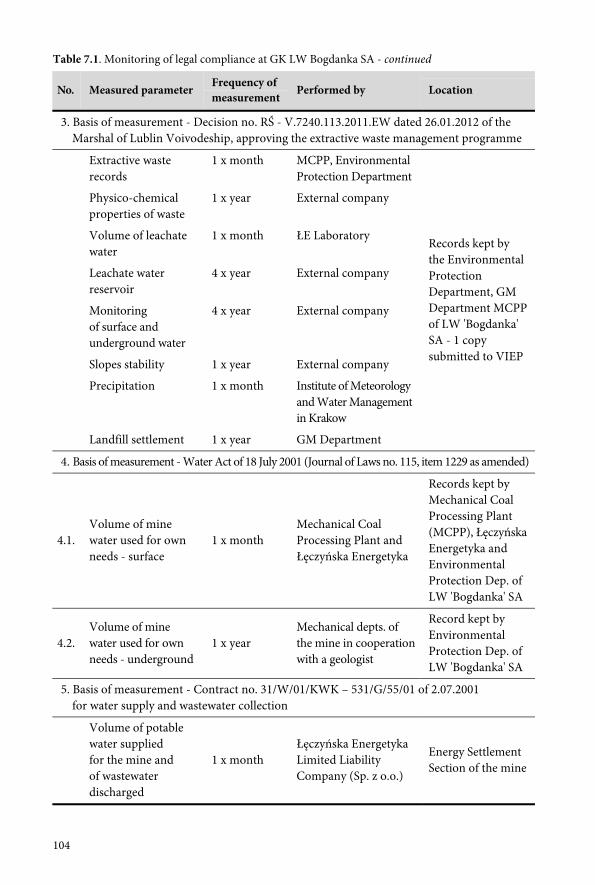
104
Table 7.1. Monitoring of legal compliance at GK LW Bogdanka SA - continued
No. Measured parameter Frequency ofmeasurement
Performed by Location
3. Basis of measurement - Decision no. RŚ - V.7240.113.2011.EW dated 26.01.2012 of theMarshal of Lublin Voivodeship, approving the extractive waste management programme
Extractive wasterecords
Physico-chemicalproperties of waste
Volume of leachatewater
Leachate waterreservoir
Monitoringof surface andunderground water
Slopes stability
Precipitation
Landfill settlement
1 x month
1 x year
1 x month
4 x year
4 x year
1 x year
1 x month
1 x year
MCPP, EnvironmentalProtection Department
External company
ŁE Laboratory
External company
External company
External company
Institute of Meteorologyand Water Managementin Krakow
GM Department
Records kept bythe EnvironmentalProtectionDepartment, GMDepartment MCPPof LW 'Bogdanka'SA - 1 copysubmitted to VIEP
4. Basis of measurement - Water Act of 18 July 2001 (Journal of Laws no. 115, item 1229 as amended)
4.1.Volume of minewater used for ownneeds - surface
1 x monthMechanical CoalProcessing Plant andŁęczyńska Energetyka
Records kept byMechanical CoalProcessing Plant(MCPP), ŁęczyńskaEnergetyka andEnvironmentalProtection Dep. ofLW 'Bogdanka' SA
4.2.Volume of minewater used for ownneeds - underground
1 x yearMechanical depts. ofthe mine in cooperationwith a geologist
Record kept byEnvironmentalProtection Dep. ofLW 'Bogdanka' SA
5. Basis of measurement - Contract no. 31/W/01/KWK – 531/G/55/01 of 2.07.2001for water supply and wastewater collection
Volume of potablewater suppliedfor the mine andof wastewaterdischarged
1 x monthŁęczyńska EnergetykaLimited LiabilityCompany (Sp. z o.o.)
Energy SettlementSection of the mine
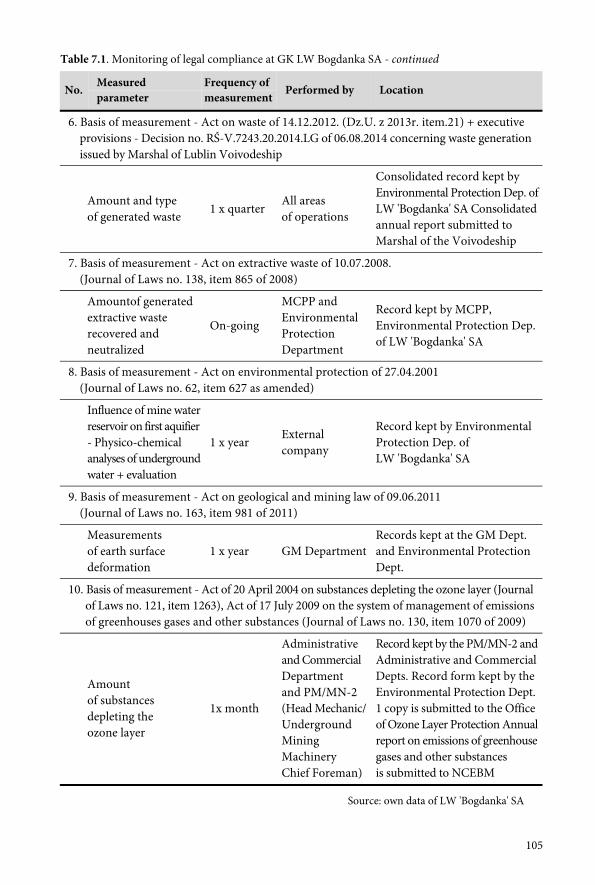
105
Table 7.1. Monitoring of legal compliance at GK LW Bogdanka SA - continued
No. Measuredparameter
Frequency ofmeasurement
Performed by Location
6. Basis of measurement - Act on waste of 14.12.2012. (Dz.U. z 2013r. item.21) + executiveprovisions - Decision no. RŚ-V.7243.20.2014.LG of 06.08.2014 concerning waste generationissued by Marshal of Lublin Voivodeship
Amount and typeof generated waste
1 x quarterAll areasof operations
Consolidated record kept byEnvironmental Protection Dep. ofLW 'Bogdanka' SA Consolidatedannual report submitted toMarshal of the Voivodeship
7. Basis of measurement - Act on extractive waste of 10.07.2008.(Journal of Laws no. 138, item 865 of 2008)
Amountof generatedextractive wasterecovered andneutralized
On-going
MCPP andEnvironmentalProtectionDepartment
Record kept by MCPP,Environmental Protection Dep.of LW 'Bogdanka' SA
8. Basis of measurement - Act on environmental protection of 27.04.2001(Journal of Laws no. 62, item 627 as amended)
Influence of mine waterreservoir on first aquifier- Physico-chemicalanalyses of undergroundwater + evaluation
1 x yearExternalcompany
Record kept by EnvironmentalProtection Dep. ofLW 'Bogdanka' SA
9. Basis of measurement - Act on geological and mining law of 09.06.2011(Journal of Laws no. 163, item 981 of 2011)
Measurementsof earth surfacedeformation
1 x year GM DepartmentRecords kept at the GM Dept.and Environmental ProtectionDept.
10. Basis of measurement - Act of 20 April 2004 on substances depleting the ozone layer (Journalof Laws no. 121, item 1263), Act of 17 July 2009 on the system of management of emissionsof greenhouses gases and other substances (Journal of Laws no. 130, item 1070 of 2009)
Amountof substancesdepleting theozone layer
1x month
Administrativeand CommercialDepartmentand PM/MN-2(Head Mechanic/UndergroundMiningMachineryChief Foreman)
Record kept by the PM/MN-2 andAdministrative and CommercialDepts. Record form kept by theEnvironmental Protection Dept.1 copy is submitted to the Officeof Ozone Layer Protection Annualreport on emissions of greenhousegases and other substancesis submitted to NCEBM
Source: own data of LW 'Bogdanka' SA
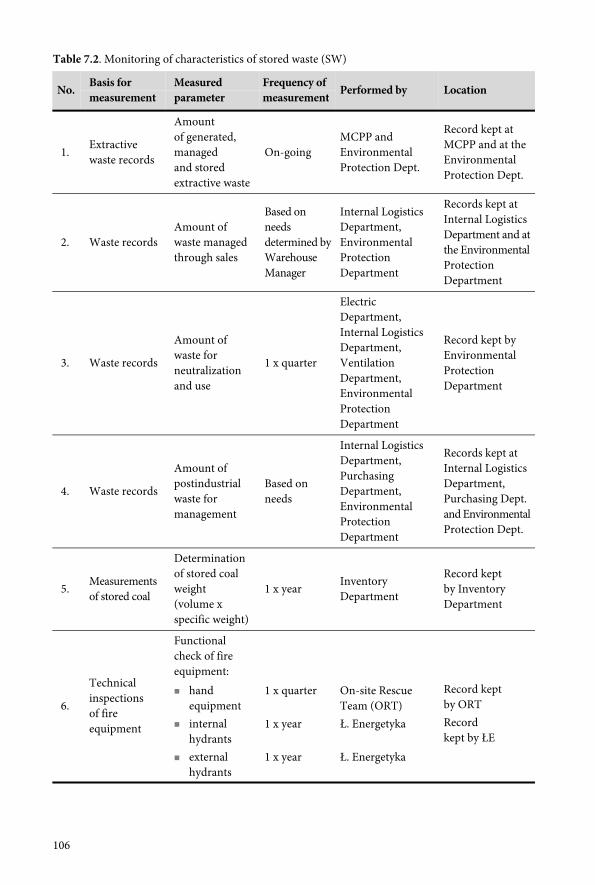
106
Table 7.2. Monitoring of characteristics of stored waste (SW)
No. Basis formeasurement
Measuredparameter
Frequency ofmeasurement
Performed by Location
1.Extractivewaste records
Amountof generated,managedand storedextractive waste
On-goingMCPP andEnvironmentalProtection Dept.
Record kept atMCPP and at theEnvironmentalProtection Dept.
2. Waste recordsAmount ofwaste managedthrough sales
Based onneedsdetermined byWarehouseManager
Internal LogisticsDepartment,EnvironmentalProtectionDepartment
Records kept atInternal LogisticsDepartment and atthe EnvironmentalProtectionDepartment
3. Waste records
Amount ofwaste forneutralizationand use
1 x quarter
ElectricDepartment,Internal LogisticsDepartment,VentilationDepartment,EnvironmentalProtectionDepartment
Record kept byEnvironmentalProtectionDepartment
4. Waste records
Amount ofpostindustrialwaste formanagement
Based onneeds
Internal LogisticsDepartment,PurchasingDepartment,EnvironmentalProtectionDepartment
Records kept atInternal LogisticsDepartment,Purchasing Dept.and EnvironmentalProtection Dept.
5.Measurementsof stored coal
Determinationof stored coalweight(volume xspecific weight)
1 x yearInventoryDepartment
Record keptby InventoryDepartment
6.
Technicalinspectionsof fireequipment
Functionalcheck of fireequipment:
handequipment
internalhydrants
externalhydrants
1 x quarter
1 x year
1 x year
On-site RescueTeam (ORT)Ł. Energetyka
Ł. Energetyka
Record keptby ORTRecordkept by ŁE
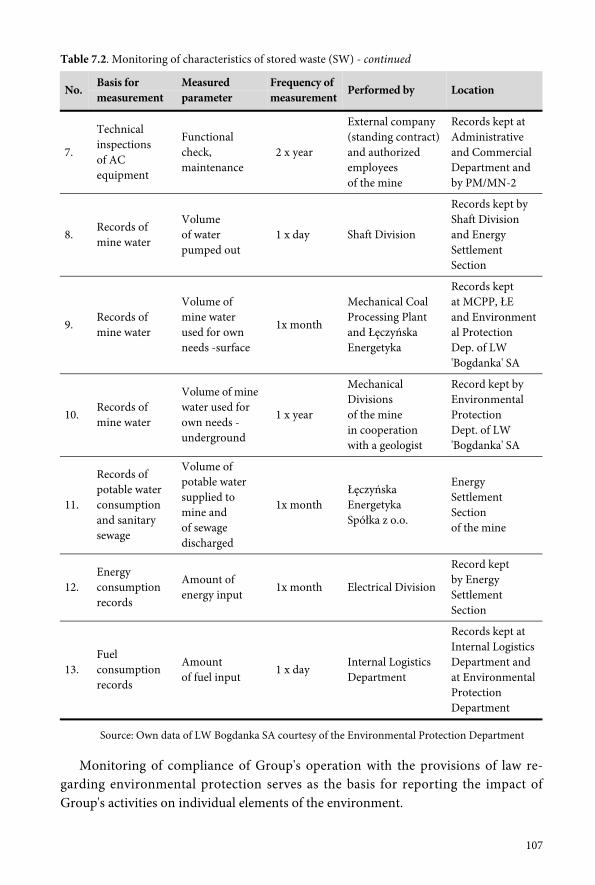
107
Table 7.2. Monitoring of characteristics of stored waste (SW) - continued
No. Basis formeasurement
Measuredparameter
Frequency ofmeasurement
Performed by Location
7.
Technicalinspectionsof ACequipment
Functionalcheck,maintenance
2 x year
External company(standing contract)and authorizedemployeesof the mine
Records kept atAdministrativeand CommercialDepartment andby PM/MN-2
8.Records ofmine water
Volumeof waterpumped out
1 x day Shaft Division
Records kept byShaft Divisionand EnergySettlementSection
9.Records ofmine water
Volume ofmine waterused for ownneeds -surface
1x month
Mechanical CoalProcessing Plantand ŁęczyńskaEnergetyka
Records keptat MCPP, ŁEand Environmental ProtectionDep. of LW'Bogdanka' SA
10.Records ofmine water
Volume of minewater used forown needs -underground
1 x year
MechanicalDivisionsof the minein cooperationwith a geologist
Record kept byEnvironmentalProtectionDept. of LW'Bogdanka' SA
11.
Records ofpotable waterconsumptionand sanitarysewage
Volume ofpotable watersupplied tomine andof sewagedischarged
1x monthŁęczyńskaEnergetykaSpółka z o.o.
EnergySettlementSectionof the mine
12.Energyconsumptionrecords
Amount ofenergy input
1x month Electrical Division
Record keptby EnergySettlementSection
13.Fuelconsumptionrecords
Amountof fuel input
1 x dayInternal LogisticsDepartment
Records kept atInternal LogisticsDepartment andat EnvironmentalProtectionDepartment
Source: Own data of LW Bogdanka SA courtesy of the Environmental Protection Department
Monitoring of compliance of Group's operation with the provisions of law re-garding environmental protection serves as the basis for reporting the impact ofGroup's activities on individual elements of the environment.
108
7.2.3. Reporting procedure and contents of environmental reports
Environmental reports are drafted at LW Bogdanka SA by its Environmental Pro-tection Department. This department is responsible for drafting consolidated reportsbased on interim reports provided by subsidiary companies. Each subsidiary has theirown Department of Environmental Management, whose purpose is to measure thelevel of company's impact on the natural environment on a regular basis and to reportit to the Group.
Up until 2014, LW Bogdanka SA published its own reports. In October 2015, L.W.Bogdanka SA was taken over by the energy group Enea. The group has its EcologicalControlling Department, whose scope of tasks, besides the monitoring of impacts onthe natural environment, recording costs and outlays on green endeavours, also includesreporting on sustainable development issues. Bogdanka's reports will be included inthe consolidated report of Enea Group for the year 2015.
Environmental reports at LW Bogdanka SA are drawn up on a regular basis, eachquarter and at year's end. However, as need may be, the Management Board receivesoccasional reports, which are employed in the processes of making on-going environ-mental decisions, in connection with, e.g. complaints from local residents concerningcracks in buildings or other real estate damages caused by the extractive industry.Occasional reports are also used by the Management Board to solve various otherproblems of the company as they arise.
The Management Board of Corporate Group LW Bogdanka SA has not as of yetissued an instruction which would determine the types and scope of environmentalreports. Regular reports are drafted in compliance with the provisions of law regardingenvironmental reporting and with administrative decisions of Voivodeship authoritiesconcerning the use of natural resources by the company. Legal bases relating to measure-ments and drafting reports have been specified in the foregoing sub-chapter. Occasionalreports are drawn up based on one-off orders or instructions of the President of theManagement Board and are employed for the internal needs of the company connectedwith drafting of key documents for the Management Board.
Corporate Group LW Bogdanka SA also prepares interim internal reports on thecompany's impact on individual elements of the natural environment in connectionwith the use and treatment of water, emissions to the atmosphere or volume of gener-ated waste. Indicated employees of the Environmental Protection Department are re-sponsible for the interim reports. Annual reports, besides information on the emis-sions volume, also cover the level of environmental charges, costs of environmentalprotection as well as material and financial extent of ecological endeavours. The latterforms part of the Investment Outlays Plan of Corporate Group LW Bogdanka SA.Interim reports are later used in the drafting of consolidated annual reports. They aretransferred to the team responsible for the preparation and publication on integratedreports. The entire Environmental Protection Department is accountable for accurate
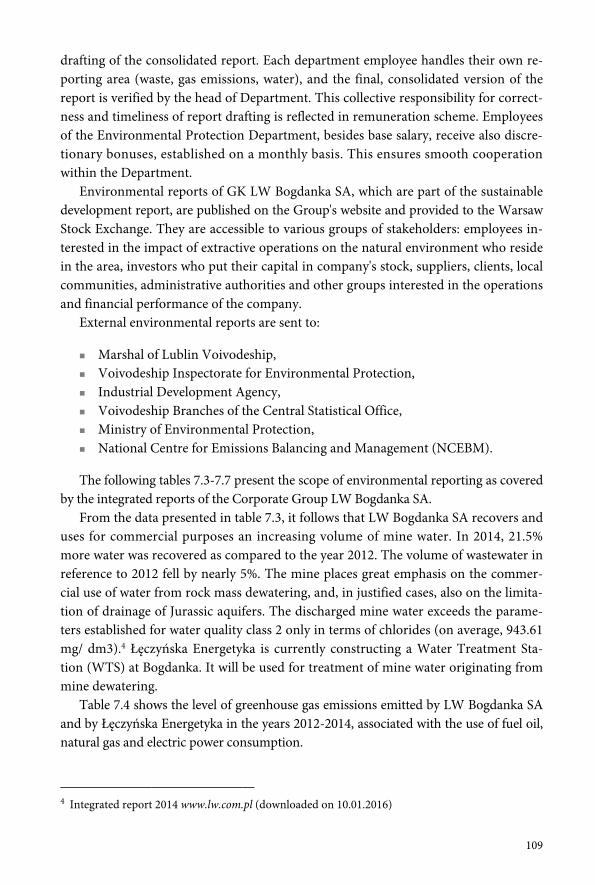
109
drafting of the consolidated report. Each department employee handles their own re-porting area (waste, gas emissions, water), and the final, consolidated version of thereport is verified by the head of Department. This collective responsibility for correct-ness and timeliness of report drafting is reflected in remuneration scheme. Employeesof the Environmental Protection Department, besides base salary, receive also discre-tionary bonuses, established on a monthly basis. This ensures smooth cooperationwithin the Department.
Environmental reports of GK LW Bogdanka SA, which are part of the sustainabledevelopment report, are published on the Group's website and provided to the WarsawStock Exchange. They are accessible to various groups of stakeholders: employees in-terested in the impact of extractive operations on the natural environment who residein the area, investors who put their capital in company's stock, suppliers, clients, localcommunities, administrative authorities and other groups interested in the operationsand financial performance of the company.
External environmental reports are sent to:
Marshal of Lublin Voivodeship, Voivodeship Inspectorate for Environmental Protection, Industrial Development Agency, Voivodeship Branches of the Central Statistical Office, Ministry of Environmental Protection, National Centre for Emissions Balancing and Management (NCEBM).
The following tables 7.3-7.7 present the scope of environmental reporting as coveredby the integrated reports of the Corporate Group LW Bogdanka SA.
From the data presented in table 7.3, it follows that LW Bogdanka SA recovers anduses for commercial purposes an increasing volume of mine water. In 2014, 21.5%more water was recovered as compared to the year 2012. The volume of wastewater inreference to 2012 fell by nearly 5%. The mine places great emphasis on the commer-cial use of water from rock mass dewatering, and, in justified cases, also on the limita-tion of drainage of Jurassic aquifers. The discharged mine water exceeds the parame-ters established for water quality class 2 only in terms of chlorides (on average, 943.61mg/ dm3).4 Łęczyńska Energetyka is currently constructing a Water Treatment Sta-tion (WTS) at Bogdanka. It will be used for treatment of mine water originating frommine dewatering.
Table 7.4 shows the level of greenhouse gas emissions emitted by LW Bogdanka SAand by Łęczyńska Energetyka in the years 2012-2014, associated with the use of fuel oil,natural gas and electric power consumption.
4 Integrated report 2014 www.lw.com.pl (downloaded on 10.01.2016)
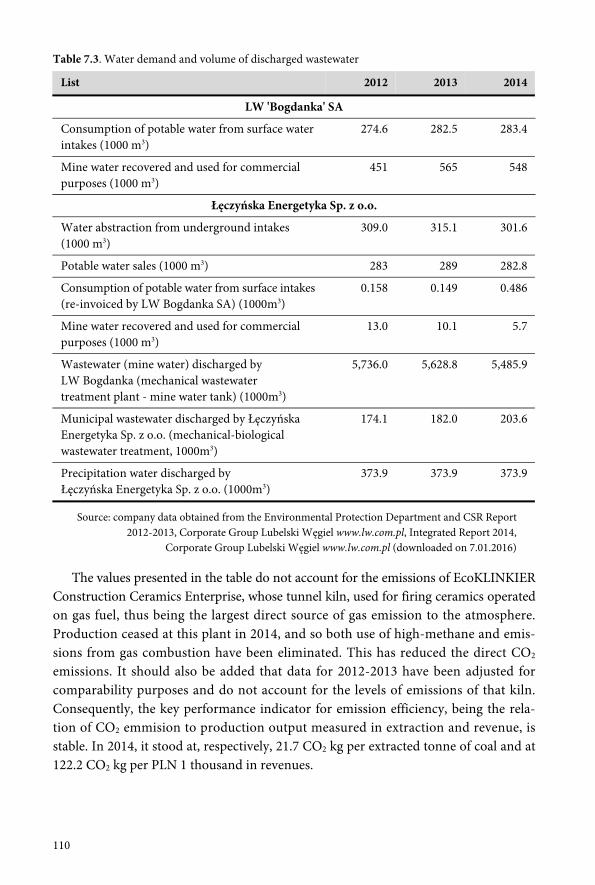
110
Table 7.3. Water demand and volume of discharged wastewater
List 2012 2013 2014
LW 'Bogdanka' SA
Consumption of potable water from surface waterintakes (1000 m3)
274.6 282.5 283.4
Mine water recovered and used for commercialpurposes (1000 m3)
451 565 548
Łęczyńska Energetyka Sp. z o.o.
Water abstraction from underground intakes(1000 m3)
309.0 315.1 301.6
Potable water sales (1000 m3) 283 289 282.8
Consumption of potable water from surface intakes(re-invoiced by LW Bogdanka SA) (1000m3)
0.158 0.149 0.486
Mine water recovered and used for commercialpurposes (1000 m3)
13.0 10.1 5.7
Wastewater (mine water) discharged byLW Bogdanka (mechanical wastewatertreatment plant - mine water tank) (1000m3)
5,736.0 5,628.8 5,485.9
Municipal wastewater discharged by ŁęczyńskaEnergetyka Sp. z o.o. (mechanical-biologicalwastewater treatment, 1000m3)
174.1 182.0 203.6
Precipitation water discharged byŁęczyńska Energetyka Sp. z o.o. (1000m3)
373.9 373.9 373.9
Source: company data obtained from the Environmental Protection Department and CSR Report2012-2013, Corporate Group Lubelski Węgiel www.lw.com.pl, Integrated Report 2014,
Corporate Group Lubelski Węgiel www.lw.com.pl (downloaded on 7.01.2016)
The values presented in the table do not account for the emissions of EcoKLINKIERConstruction Ceramics Enterprise, whose tunnel kiln, used for firing ceramics operatedon gas fuel, thus being the largest direct source of gas emission to the atmosphere.Production ceased at this plant in 2014, and so both use of high-methane and emis-sions from gas combustion have been eliminated. This has reduced the direct CO2
emissions. It should also be added that data for 2012-2013 have been adjusted forcomparability purposes and do not account for the levels of emissions of that kiln.Consequently, the key performance indicator for emission efficiency, being the rela-tion of CO2 emmision to production output measured in extraction and revenue, isstable. In 2014, it stood at, respectively, 21.7 CO2 kg per extracted tonne of coal and at122.2 CO2 kg per PLN 1 thousand in revenues.
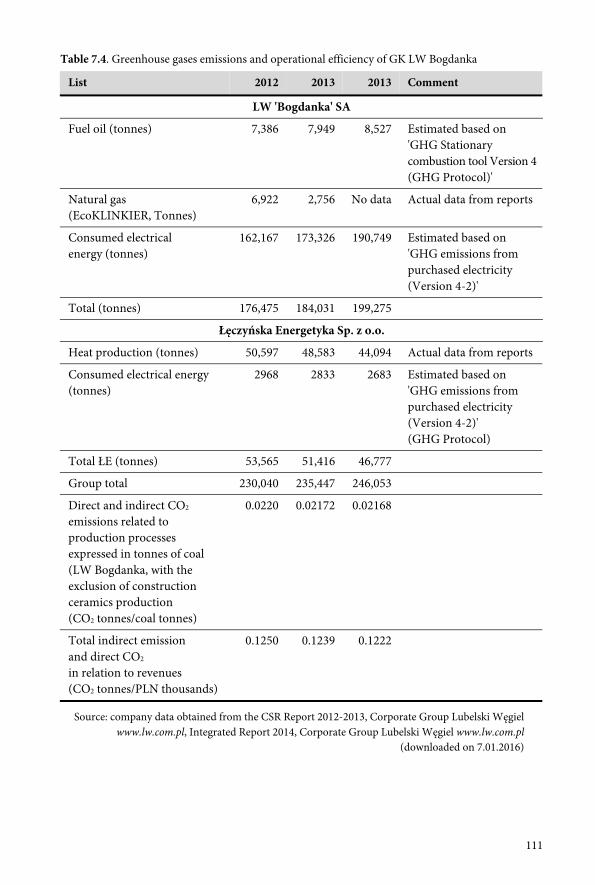
111
Table 7.4. Greenhouse gases emissions and operational efficiency of GK LW Bogdanka
List 2012 2013 2013 Comment
LW 'Bogdanka' SA
Fuel oil (tonnes) 7,386 7,949 8,527 Estimated based on'GHG Stationarycombustion tool Version 4(GHG Protocol)'
Natural gas(EcoKLINKIER, Tonnes)
6,922 2,756 No data Actual data from reports
Consumed electricalenergy (tonnes)
162,167 173,326 190,749 Estimated based on'GHG emissions frompurchased electricity(Version 4-2)'
Total (tonnes) 176,475 184,031 199,275
Łęczyńska Energetyka Sp. z o.o.
Heat production (tonnes) 50,597 48,583 44,094 Actual data from reports
Consumed electrical energy(tonnes)
2968 2833 2683 Estimated based on'GHG emissions frompurchased electricity(Version 4-2)'(GHG Protocol)
Total ŁE (tonnes) 53,565 51,416 46,777
Group total 230,040 235,447 246,053
Direct and indirect CO2
emissions related toproduction processesexpressed in tonnes of coal(LW Bogdanka, with theexclusion of constructionceramics production(CO2 tonnes/coal tonnes)
0.0220 0.02172 0.02168
Total indirect emissionand direct CO2
in relation to revenues(CO2 tonnes/PLN thousands)
0.1250 0.1239 0.1222
Source: company data obtained from the CSR Report 2012-2013, Corporate Group Lubelski Węgielwww.lw.com.pl, Integrated Report 2014, Corporate Group Lubelski Węgiel www.lw.com.pl
(downloaded on 7.01.2016)
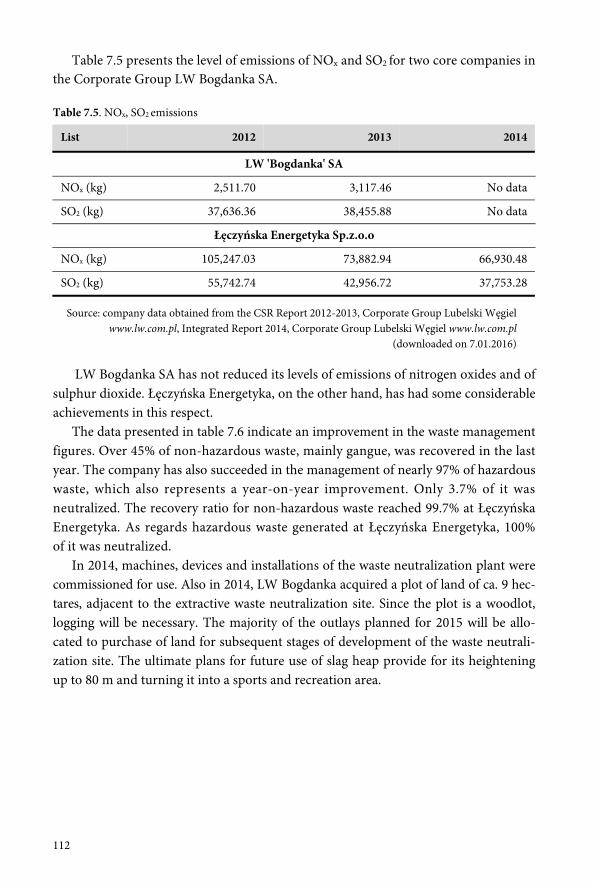
112
Table 7.5 presents the level of emissions of NOx and SO2 for two core companies inthe Corporate Group LW Bogdanka SA.
Table 7.5. NOx, SO2 emissions
List 2012 2013 2014
LW 'Bogdanka' SA
NOx (kg) 2,511.70 3,117.46 No data
SO2 (kg) 37,636.36 38,455.88 No data
Łęczyńska Energetyka Sp.z.o.o
NOx (kg) 105,247.03 73,882.94 66,930.48
SO2 (kg) 55,742.74 42,956.72 37,753.28
Source: company data obtained from the CSR Report 2012-2013, Corporate Group Lubelski Węgielwww.lw.com.pl, Integrated Report 2014, Corporate Group Lubelski Węgiel www.lw.com.pl
(downloaded on 7.01.2016)
LW Bogdanka SA has not reduced its levels of emissions of nitrogen oxides and ofsulphur dioxide. Łęczyńska Energetyka, on the other hand, has had some considerableachievements in this respect.
The data presented in table 7.6 indicate an improvement in the waste managementfigures. Over 45% of non-hazardous waste, mainly gangue, was recovered in the lastyear. The company has also succeeded in the management of nearly 97% of hazardouswaste, which also represents a year-on-year improvement. Only 3.7% of it wasneutralized. The recovery ratio for non-hazardous waste reached 99.7% at ŁęczyńskaEnergetyka. As regards hazardous waste generated at Łęczyńska Energetyka, 100%of it was neutralized.
In 2014, machines, devices and installations of the waste neutralization plant werecommissioned for use. Also in 2014, LW Bogdanka acquired a plot of land of ca. 9 hec-tares, adjacent to the extractive waste neutralization site. Since the plot is a woodlot,logging will be necessary. The majority of the outlays planned for 2015 will be allo-cated to purchase of land for subsequent stages of development of the waste neutrali-zation site. The ultimate plans for future use of slag heap provide for its heighteningup to 80 m and turning it into a sports and recreation area.
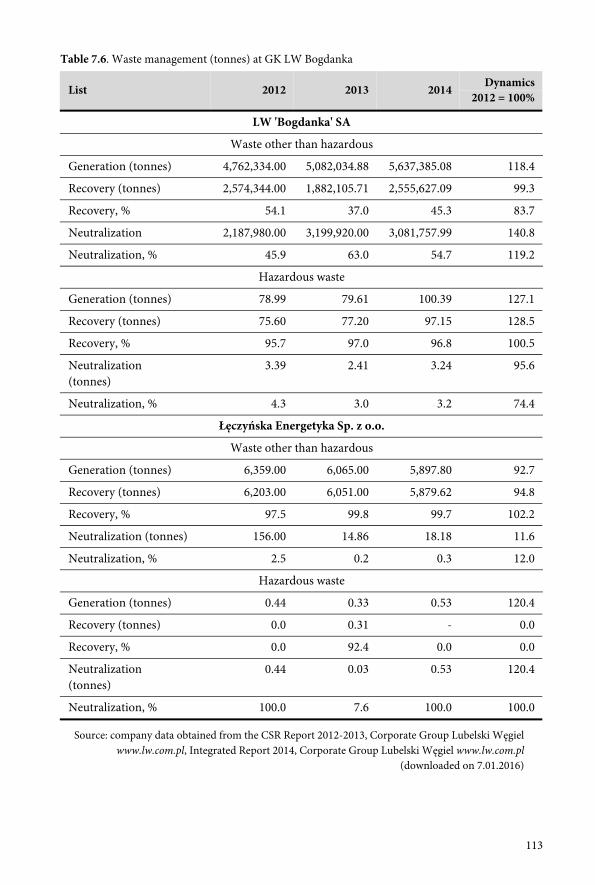
113
Table 7.6. Waste management (tonnes) at GK LW Bogdanka
List 2012 2013 2014 Dynamics2012 = 100%
LW 'Bogdanka' SA
Waste other than hazardous
Generation (tonnes) 4,762,334.00 5,082,034.88 5,637,385.08 118.4
Recovery (tonnes) 2,574,344.00 1,882,105.71 2,555,627.09 99.3
Recovery, % 54.1 37.0 45.3 83.7
Neutralization 2,187,980.00 3,199,920.00 3,081,757.99 140.8
Neutralization, % 45.9 63.0 54.7 119.2
Hazardous waste
Generation (tonnes) 78.99 79.61 100.39 127.1
Recovery (tonnes) 75.60 77.20 97.15 128.5
Recovery, % 95.7 97.0 96.8 100.5
Neutralization(tonnes)
3.39 2.41 3.24 95.6
Neutralization, % 4.3 3.0 3.2 74.4
Łęczyńska Energetyka Sp. z o.o.
Waste other than hazardous
Generation (tonnes) 6,359.00 6,065.00 5,897.80 92.7
Recovery (tonnes) 6,203.00 6,051.00 5,879.62 94.8
Recovery, % 97.5 99.8 99.7 102.2
Neutralization (tonnes) 156.00 14.86 18.18 11.6
Neutralization, % 2.5 0.2 0.3 12.0
Hazardous waste
Generation (tonnes) 0.44 0.33 0.53 120.4
Recovery (tonnes) 0.0 0.31 - 0.0
Recovery, % 0.0 92.4 0.0 0.0
Neutralization(tonnes)
0.44 0.03 0.53 120.4
Neutralization, % 100.0 7.6 100.0 100.0
Source: company data obtained from the CSR Report 2012-2013, Corporate Group Lubelski Węgielwww.lw.com.pl, Integrated Report 2014, Corporate Group Lubelski Węgiel www.lw.com.pl
(downloaded on 7.01.2016)
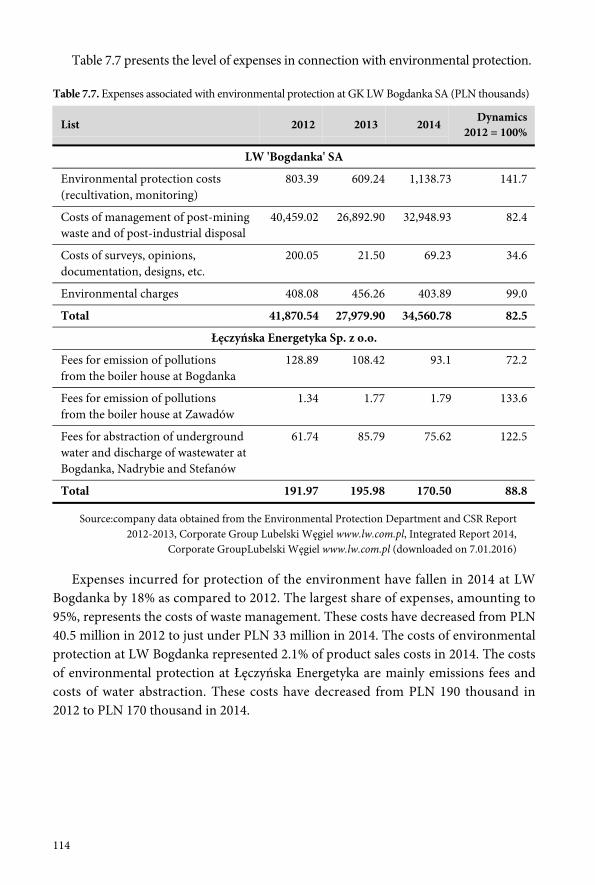
114
Table 7.7 presents the level of expenses in connection with environmental protection.
Table 7.7. Expenses associated with environmental protection at GK LW Bogdanka SA (PLN thousands)
List 2012 2013 2014 Dynamics2012 = 100%
LW 'Bogdanka' SA
Environmental protection costs(recultivation, monitoring)
803.39 609.24 1,138.73 141.7
Costs of management of post-miningwaste and of post-industrial disposal
40,459.02 26,892.90 32,948.93 82.4
Costs of surveys, opinions,documentation, designs, etc.
200.05 21.50 69.23 34.6
Environmental charges 408.08 456.26 403.89 99.0
Total 41,870.54 27,979.90 34,560.78 82.5
Łęczyńska Energetyka Sp. z o.o.
Fees for emission of pollutionsfrom the boiler house at Bogdanka
128.89 108.42 93.1 72.2
Fees for emission of pollutionsfrom the boiler house at Zawadów
1.34 1.77 1.79 133.6
Fees for abstraction of undergroundwater and discharge of wastewater atBogdanka, Nadrybie and Stefanów
61.74 85.79 75.62 122.5
Total 191.97 195.98 170.50 88.8
Source:company data obtained from the Environmental Protection Department and CSR Report2012-2013, Corporate Group Lubelski Węgiel www.lw.com.pl, Integrated Report 2014,
Corporate GroupLubelski Węgiel www.lw.com.pl (downloaded on 7.01.2016)
Expenses incurred for protection of the environment have fallen in 2014 at LWBogdanka by 18% as compared to 2012. The largest share of expenses, amounting to95%, represents the costs of waste management. These costs have decreased from PLN40.5 million in 2012 to just under PLN 33 million in 2014. The costs of environmentalprotection at LW Bogdanka represented 2.1% of product sales costs in 2014. The costsof environmental protection at Łęczyńska Energetyka are mainly emissions fees andcosts of water abstraction. These costs have decreased from PLN 190 thousand in2012 to PLN 170 thousand in 2014.
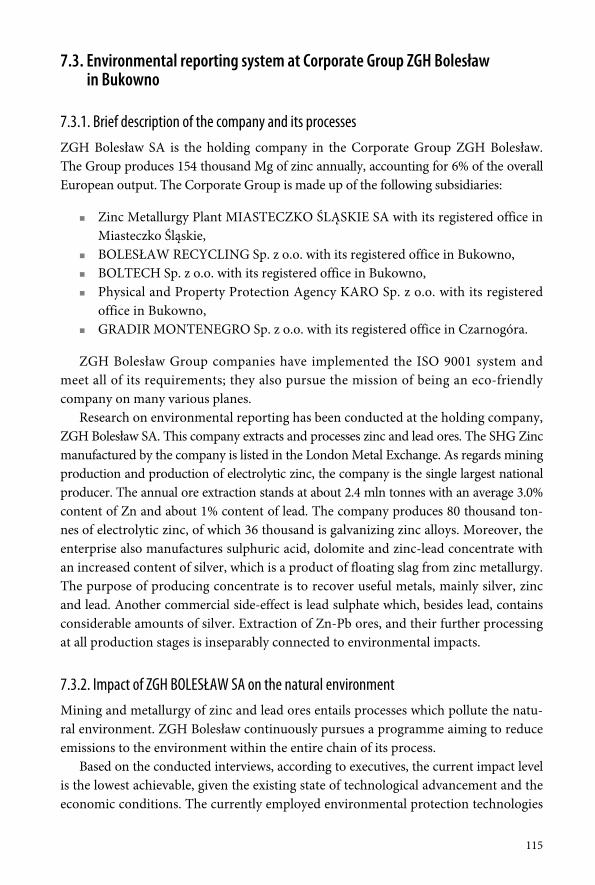
115
7.3. Environmental reporting system at Corporate Group ZGH Bolesławin Bukowno
7.3.1. Brief description of the company and its processes
ZGH Bolesław SA is the holding company in the Corporate Group ZGH Bolesław.The Group produces 154 thousand Mg of zinc annually, accounting for 6% of the overallEuropean output. The Corporate Group is made up of the following subsidiaries:
Zinc Metallurgy Plant MIASTECZKO ŚLĄSKIE SA with its registered office inMiasteczko Śląskie,
BOLESŁAW RECYCLING Sp. z o.o. with its registered office in Bukowno, BOLTECH Sp. z o.o. with its registered office in Bukowno, Physical and Property Protection Agency KARO Sp. z o.o. with its registered
office in Bukowno, GRADIR MONTENEGRO Sp. z o.o. with its registered office in Czarnogóra.
ZGH Bolesław Group companies have implemented the ISO 9001 system andmeet all of its requirements; they also pursue the mission of being an eco-friendlycompany on many various planes.
Research on environmental reporting has been conducted at the holding company,ZGH Bolesław SA. This company extracts and processes zinc and lead ores. The SHG Zincmanufactured by the company is listed in the London Metal Exchange. As regards miningproduction and production of electrolytic zinc, the company is the single largest nationalproducer. The annual ore extraction stands at about 2.4 mln tonnes with an average 3.0%content of Zn and about 1% content of lead. The company produces 80 thousand ton-nes of electrolytic zinc, of which 36 thousand is galvanizing zinc alloys. Moreover, theenterprise also manufactures sulphuric acid, dolomite and zinc-lead concentrate withan increased content of silver, which is a product of floating slag from zinc metallurgy.The purpose of producing concentrate is to recover useful metals, mainly silver, zincand lead. Another commercial side-effect is lead sulphate which, besides lead, containsconsiderable amounts of silver. Extraction of Zn-Pb ores, and their further processingat all production stages is inseparably connected to environmental impacts.
7.3.2. Impact of ZGH BOLESŁAW SA on the natural environment
Mining and metallurgy of zinc and lead ores entails processes which pollute the natu-ral environment. ZGH Bolesław continuously pursues a programme aiming to reduceemissions to the environment within the entire chain of its process.
Based on the conducted interviews, according to executives, the current impact levelis the lowest achievable, given the existing state of technological advancement and theeconomic conditions. The currently employed environmental protection technologies
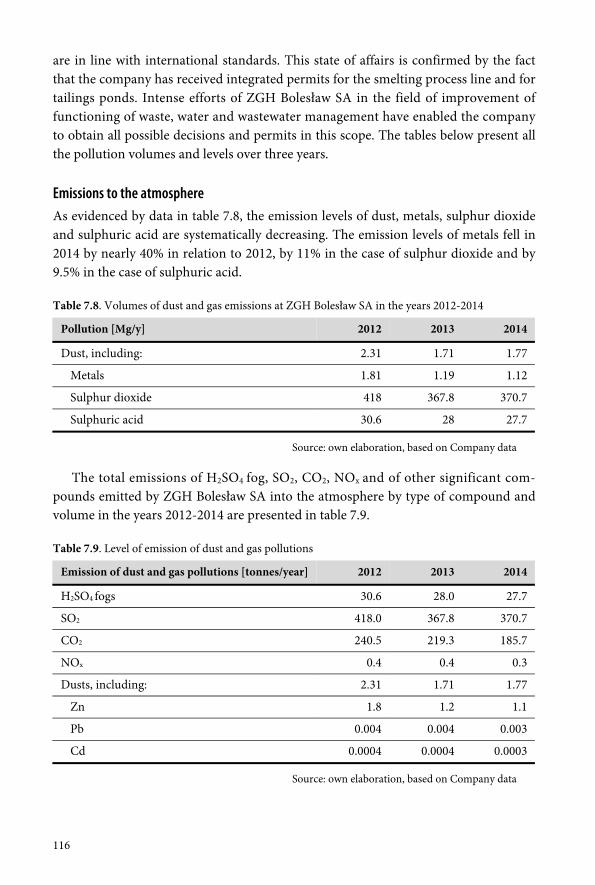
116
are in line with international standards. This state of affairs is confirmed by the factthat the company has received integrated permits for the smelting process line and fortailings ponds. Intense efforts of ZGH Bolesław SA in the field of improvement offunctioning of waste, water and wastewater management have enabled the companyto obtain all possible decisions and permits in this scope. The tables below present allthe pollution volumes and levels over three years.
Emissions to the atmosphereAs evidenced by data in table 7.8, the emission levels of dust, metals, sulphur dioxideand sulphuric acid are systematically decreasing. The emission levels of metals fell in2014 by nearly 40% in relation to 2012, by 11% in the case of sulphur dioxide and by9.5% in the case of sulphuric acid.
Table 7.8. Volumes of dust and gas emissions at ZGH Bolesław SA in the years 2012-2014
Pollution [Mg/y] 2012 2013 2014
Dust, including: 2.31 1.71 1.77
Metals 1.81 1.19 1.12
Sulphur dioxide 418 367.8 370.7
Sulphuric acid 30.6 28 27.7
Source: own elaboration, based on Company data
The total emissions of H2SO4 fog, SO2, CO2, NOx and of other significant com-pounds emitted by ZGH Bolesław SA into the atmosphere by type of compound andvolume in the years 2012-2014 are presented in table 7.9.
Table 7.9. Level of emission of dust and gas pollutions
Emission of dust and gas pollutions [tonnes/year] 2012 2013 2014
H2SO4 fogs 30.6 28.0 27.7
SO2 418.0 367.8 370.7
CO2 240.5 219.3 185.7
NOx 0.4 0.4 0.3
Dusts, including: 2.31 1.71 1.77
Zn 1.8 1.2 1.1
Pb 0.004 0.004 0.003
Cd 0.0004 0.0004 0.0003
Source: own elaboration, based on Company data
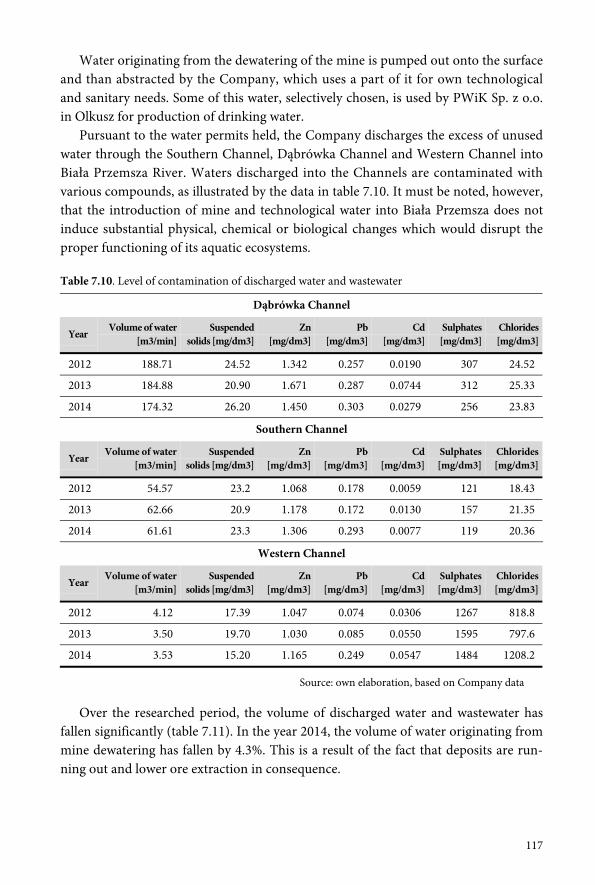
117
Water originating from the dewatering of the mine is pumped out onto the surfaceand than abstracted by the Company, which uses a part of it for own technologicaland sanitary needs. Some of this water, selectively chosen, is used by PWiK Sp. z o.o.in Olkusz for production of drinking water.
Pursuant to the water permits held, the Company discharges the excess of unusedwater through the Southern Channel, Dąbrówka Channel and Western Channel intoBiała Przemsza River. Waters discharged into the Channels are contaminated withvarious compounds, as illustrated by the data in table 7.10. It must be noted, however,that the introduction of mine and technological water into Biała Przemsza does notinduce substantial physical, chemical or biological changes which would disrupt theproper functioning of its aquatic ecosystems.
Table 7.10. Level of contamination of discharged water and wastewater
Dąbrówka Channel
YearVolume of water
[m3/min]Suspended
solids [mg/dm3]Zn
[mg/dm3]Pb
[mg/dm3]Cd
[mg/dm3]Sulphates
[mg/dm3]Chlorides[mg/dm3]
2012 188.71 24.52 1.342 0.257 0.0190 307 24.52
2013 184.88 20.90 1.671 0.287 0.0744 312 25.33
2014 174.32 26.20 1.450 0.303 0.0279 256 23.83
Southern Channel
YearVolume of water
[m3/min]Suspended
solids [mg/dm3]Zn
[mg/dm3]Pb
[mg/dm3]Cd
[mg/dm3]Sulphates[mg/dm3]
Chlorides[mg/dm3]
2012 54.57 23.2 1.068 0.178 0.0059 121 18.43
2013 62.66 20.9 1.178 0.172 0.0130 157 21.35
2014 61.61 23.3 1.306 0.293 0.0077 119 20.36
Western Channel
YearVolume of water
[m3/min]Suspended
solids [mg/dm3]Zn
[mg/dm3]Pb
[mg/dm3]Cd
[mg/dm3]Sulphates[mg/dm3]
Chlorides[mg/dm3]
2012 4.12 17.39 1.047 0.074 0.0306 1267 818.8
2013 3.50 19.70 1.030 0.085 0.0550 1595 797.6
2014 3.53 15.20 1.165 0.249 0.0547 1484 1208.2
Source: own elaboration, based on Company data
Over the researched period, the volume of discharged water and wastewater hasfallen significantly (table 7.11). In the year 2014, the volume of water originating frommine dewatering has fallen by 4.3%. This is a result of the fact that deposits are run-ning out and lower ore extraction in consequence.
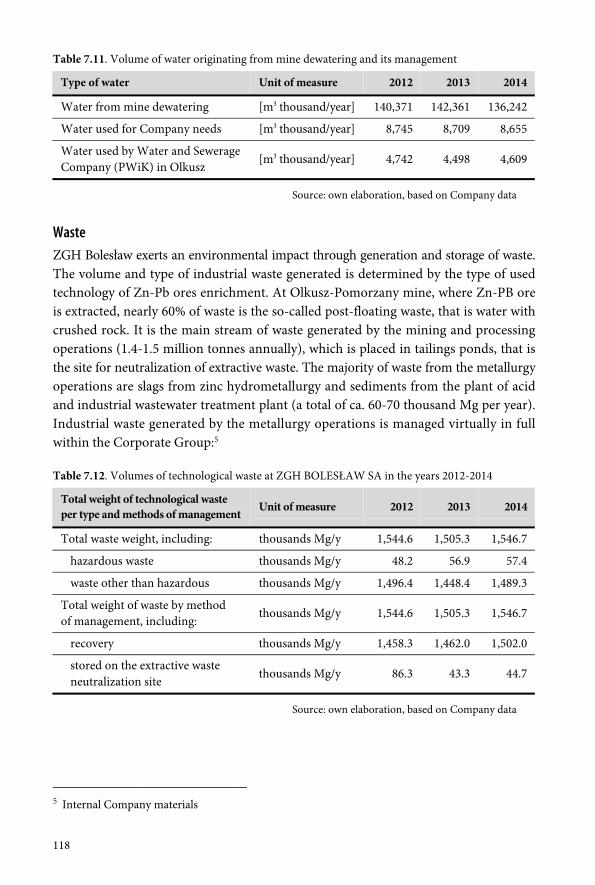
118
Table 7.11. Volume of water originating from mine dewatering and its management
Type of water Unit of measure 2012 2013 2014
Water from mine dewatering [m3 thousand/year] 140,371 142,361 136,242
Water used for Company needs [m3 thousand/year] 8,745 8,709 8,655
Water used by Water and SewerageCompany (PWiK) in Olkusz
[m3 thousand/year] 4,742 4,498 4,609
Source: own elaboration, based on Company data
WasteZGH Bolesław exerts an environmental impact through generation and storage of waste.The volume and type of industrial waste generated is determined by the type of usedtechnology of Zn-Pb ores enrichment. At Olkusz-Pomorzany mine, where Zn-PB oreis extracted, nearly 60% of waste is the so-called post-floating waste, that is water withcrushed rock. It is the main stream of waste generated by the mining and processingoperations (1.4-1.5 million tonnes annually), which is placed in tailings ponds, that isthe site for neutralization of extractive waste. The majority of waste from the metallurgyoperations are slags from zinc hydrometallurgy and sediments from the plant of acidand industrial wastewater treatment plant (a total of ca. 60-70 thousand Mg per year).Industrial waste generated by the metallurgy operations is managed virtually in fullwithin the Corporate Group:5
Table 7.12. Volumes of technological waste at ZGH BOLESŁAW SA in the years 2012-2014
Total weight of technological wasteper type and methods of management
Unit of measure 2012 2013 2014
Total waste weight, including: thousands Mg/y 1,544.6 1,505.3 1,546.7
hazardous waste thousands Mg/y 48.2 56.9 57.4
waste other than hazardous thousands Mg/y 1,496.4 1,448.4 1,489.3
Total weight of waste by methodof management, including:
thousands Mg/y 1,544.6 1,505.3 1,546.7
recovery thousands Mg/y 1,458.3 1,462.0 1,502.0
stored on the extractive wasteneutralization site
thousands Mg/y 86.3 43.3 44.7
Source: own elaboration, based on Company data
5 Internal Company materials
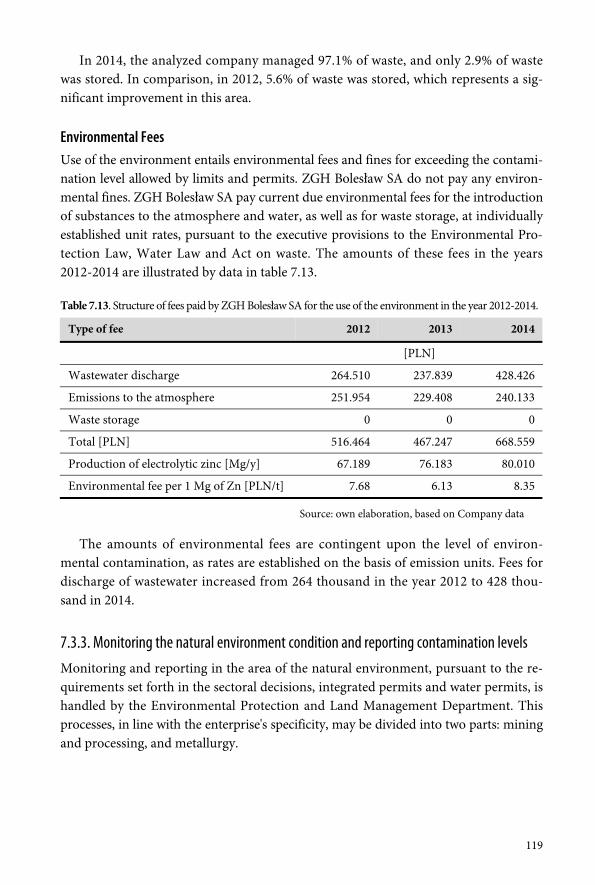
119
In 2014, the analyzed company managed 97.1% of waste, and only 2.9% of wastewas stored. In comparison, in 2012, 5.6% of waste was stored, which represents a sig-nificant improvement in this area.
Environmental FeesUse of the environment entails environmental fees and fines for exceeding the contami-nation level allowed by limits and permits. ZGH Bolesław SA do not pay any environ-mental fines. ZGH Bolesław SA pay current due environmental fees for the introductionof substances to the atmosphere and water, as well as for waste storage, at individuallyestablished unit rates, pursuant to the executive provisions to the Environmental Pro-tection Law, Water Law and Act on waste. The amounts of these fees in the years2012-2014 are illustrated by data in table 7.13.
Table 7.13. Structure of fees paid by ZGH Bolesław SA for the use of the environment in the year 2012-2014.
Type of fee 2012 2013 2014
[PLN]
Wastewater discharge 264.510 237.839 428.426
Emissions to the atmosphere 251.954 229.408 240.133
Waste storage 0 0 0
Total [PLN] 516.464 467.247 668.559
Production of electrolytic zinc [Mg/y] 67.189 76.183 80.010
Environmental fee per 1 Mg of Zn [PLN/t] 7.68 6.13 8.35
Source: own elaboration, based on Company data
The amounts of environmental fees are contingent upon the level of environ-mental contamination, as rates are established on the basis of emission units. Fees fordischarge of wastewater increased from 264 thousand in the year 2012 to 428 thou-sand in 2014.
7.3.3. Monitoring the natural environment condition and reporting contamination levels
Monitoring and reporting in the area of the natural environment, pursuant to the re-quirements set forth in the sectoral decisions, integrated permits and water permits, ishandled by the Environmental Protection and Land Management Department. Thisprocesses, in line with the enterprise's specificity, may be divided into two parts: miningand processing, and metallurgy.
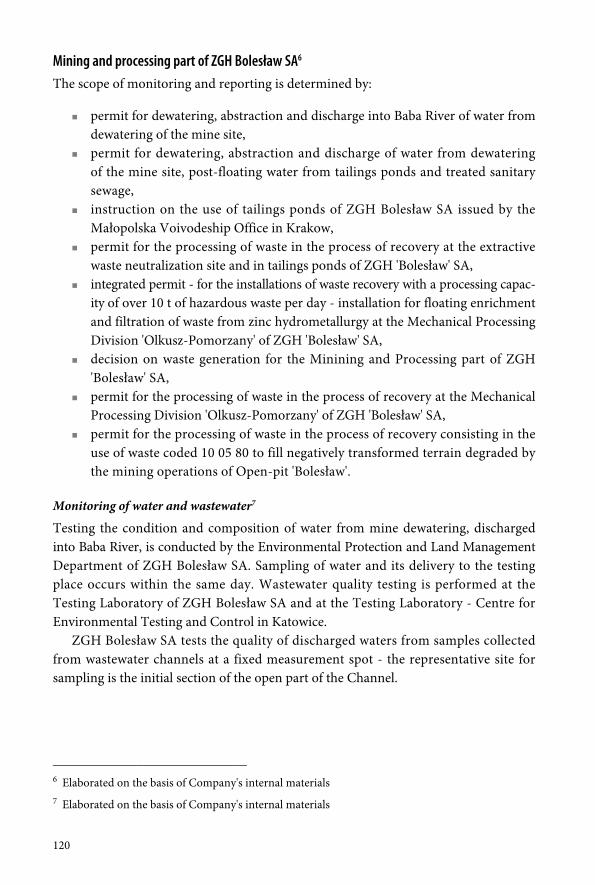
120
Mining and processing part of ZGH Bolesław SA6
The scope of monitoring and reporting is determined by:
permit for dewatering, abstraction and discharge into Baba River of water fromdewatering of the mine site,
permit for dewatering, abstraction and discharge of water from dewateringof the mine site, post-floating water from tailings ponds and treated sanitarysewage,
instruction on the use of tailings ponds of ZGH Bolesław SA issued by theMałopolska Voivodeship Office in Krakow,
permit for the processing of waste in the process of recovery at the extractivewaste neutralization site and in tailings ponds of ZGH 'Bolesław' SA,
integrated permit - for the installations of waste recovery with a processing capac-ity of over 10 t of hazardous waste per day - installation for floating enrichmentand filtration of waste from zinc hydrometallurgy at the Mechanical ProcessingDivision 'Olkusz-Pomorzany' of ZGH 'Bolesław' SA,
decision on waste generation for the Minining and Processing part of ZGH'Bolesław' SA,
permit for the processing of waste in the process of recovery at the MechanicalProcessing Division 'Olkusz-Pomorzany' of ZGH 'Bolesław' SA,
permit for the processing of waste in the process of recovery consisting in theuse of waste coded 10 05 80 to fill negatively transformed terrain degraded bythe mining operations of Open-pit 'Bolesław'.
Monitoring of water and wastewater7
Testing the condition and composition of water from mine dewatering, dischargedinto Baba River, is conducted by the Environmental Protection and Land ManagementDepartment of ZGH Bolesław SA. Sampling of water and its delivery to the testingplace occurs within the same day. Wastewater quality testing is performed at theTesting Laboratory of ZGH Bolesław SA and at the Testing Laboratory - Centre forEnvironmental Testing and Control in Katowice.
ZGH Bolesław SA tests the quality of discharged waters from samples collectedfrom wastewater channels at a fixed measurement spot - the representative site forsampling is the initial section of the open part of the Channel.
6 Elaborated on the basis of Company's internal materials7 Elaborated on the basis of Company's internal materials
121
Analysis samples collected from the channels concern:
waters from the dewatering of the mine site (shafts: Mieszko and Dąbrówka), sludge supernatant discharged through the Post-floatation Channel, treated sanitary sewage from the enterprise's treatment plant (SSTP), and treated sewage from the City of Olkusz Treatment Plant, sewage from the Water Treatment Station of PWiK Olkusz Sp. z o.o., treated sewage from the Laski Treatment Plant.
The testing scope covers:
pH, suspended solids, sum of chlorides and sulphates, Zn, Pb and Cd at monthlyintervals, from mean daily samples; total suspended solids, zinc, lead, cadmium,sulphates, chlorides once every two months,
Hg, Cu, Ni, Cr, As, V, Ag, Tl, ChZTCr, BZT5, Tl, Fe, and volatile phenols(phenol index).
Results of quality tests of discharged wastewater and sewage are submitted to theVIEP Krakow and to the Marshal of Małopolska Voivodeship, within 30 days after theend of each quarter.
Noise monitoringNoise level measurements are conducted at the border of acoustic protection zone, lo-cated adjacent to ZGH Bolesław SA. These measurements are conducted at least onceevery two years. The measurements are conducted pursuant to reference methodology,by an appropriately accredited external company.
Monitoring of generated, recovered and neutralized wasteQualitative and quantitative records of waste is conducted with the use waste recordcards and waste transfer cards as well as forms designed for drafting and submissionof consolidated records of waste data, pursuant to the relevant waste regulations. Theserecords are maintained by the Environmental Protection and Land Use Department.
The amount of waste transferred to ponds is controlled on the basis of monthlymass balance sheet of ores, concentrate and waste. This balance sheet is drawn up byMPD 'Olkusz-Pomorzany' of ZGH Bolesław SA.
Monitoring of precipitationMeasurement of precipitation volumes – is conducted at the waste neutralization site,once a day. Measurement results are recorded in a so-called report book. At the end ofeach month, the average monthly precipitation is calculated and compared againstmean monthly precipitation recorded at the meteorological station representative forthe location of the extractive waste neutralization site. Measurements are carried outby tailings ponds employees.
122
Monitoring of sludge supernatant and excess waterThe measurement of sludge supernatant and excess water discharged through thePost-floatation Channel is conducted with the use of rectangular spillway mounted inthe channel. Measurement and recording of the water column above the bottom part ofthe spillway is conducted once every shift by an employee of the Mechanical ProcessingDivision 'Olkusz-Pomorzany'.
Qquality testing of the waters discharged from the plant and from the tailings pondsis carried out by the Environmental Protection and Land Management Department inDąbrówka Channel and in Post-floatation Channel:
once a month to test: pH, specific conductance of electrolytes, Zn, Pb, Cd, SO4,Cl, ChZT, BZT5 - in Dąbrówka Channel and in Post-floatation Channel,
one a quarter to test: Hg, Cu, As, Cr, Ni, V, Ag, phenols, BZT5 – in the Post-floatation Channel.
Monitoring of indicative substances and parameters in underground watersTesting of indicative substances and parameters in underground waters entails analysisof composition and level of the waters. Monitoring of underground waters is conductedby the Geological Measurements Department and by the Environmental Protection andLand Management Department.
Frequency and scope of measurements:
underground water table – measured once a quarter, quality of underground water in observation wells - tested once a quarter for:
pH, specific conductance of electrolytes, SO4, Cl, Zn, Pb, Cd, Fe, Mn, Ca, Mg,Na, K, Sr,
quality of underground water discharged through shafts - tested once a quarterfor: suspended solids, pH, Zn, Pb, Cd, SO4 and Cl.
Monitoring of the settling of waste neutralization site surfaceThe testing of the waste neutralization site surface settling is carried out by the Geo-logical Measurements Division of ZGH Bolesław SA. Once a year.
Monitoring of tailings ponds embankmentsThe height of tailings ponds embankments is measured against three reference pointslocated on the southern side of the ponds and against the benchmark located on thenorthern side of the ponds. Measurements are carried out periodically, depending onthe needs, as the embankments are heightened, by the Geological Measurements Divi-sion of ZGH Bolesław SA.
123
Monitoring of air qualityDust deposition measurements are conducted by the Environmental Protection and LandUse Departments at three measurement sites located in the vicinity of tailings ponds.
The measurements are carried out once a month, and the testing scope covers: or-ganic matter, non-organic matter, Zn, Pb, Cd, Mn, SO4, pH.
Monitoring of technological processesIt is conducted in line with the dedicated technological instructions. It is carried outby the Production and Auxiliary Divisions of the Mining and Processing TechnologicalLine of ZGH Bolesław SA.
The above measurement results are recorded and kept by the Environmental Pro-tection and Land Management Department at ZGH Bolesław SA. This data is appliedin drafting the reports required by the law, as well as made available to oversightauthorities.
Metallurgy part of ZGH Bolesław SA8
The scope of monitoring and reporting is determined by:
the integrated permit - for the installation of electrolytic zinc production issuedby the Małopolska Voivode; the integrated permit - for the installation of deepdechlorination, defluorization and leaching of raw zinc oxide, issued by theMarshal of Małopolska Voivodeship,
permit for dewatering, abstraction and discharge of treated wastewater to BiałaPrzemsza River through the Western Channel and Warwas watercourse.
Monitoring of emissions into the atmosphereMeasurements of emissions introduced into the atmosphere as a result of technologicalprocesses is conducted at:
Sulphuric Acid Plant: sulphuric acid and sulphur dioxide – once a quarter, Zinc Electrolysis Division: dust from induction furnaces – twice a year, Leaching Plant: sulphuric acid – twice a year.
Measurements of dust and gas emissions are conducted at ZGH 'Bolesław' SA bycompany Eko-Norm Sp. z o.o Katowice. Chemical analysis of dusts is carried out bythe Śląskie Centrum Ochrony Pracy Sp. z o.o. (Silesian Center of Work Protection) inKatowice. Results of the dust and gas emissions measurements are submitted within30 days from the end of each quarter to the VIEP Krakow and to the Marshal ofMałopolska Voivodeship.
8 Elaborated on the basis of Company's internal materials
124
Monitoring of the amount of abstracted waterAbstraction of water from the dewatering of the mine site through a deep water intakelocated in the shaft pipe of the decommissioned shaft Mieczysław (Bukowno commune)for technological needs of the smelting production line – on-going measurements andrecording of the amount of water pumped out through this intake is conducted on hebasis of the exsiting system of flow meters mounted in dewatering and distributionpipelines. Data is recorded by the enterprise's energy and mechanical employees.
Monitoring of wastewaterThe monitoring of condition and composition of wastewater is conducted by theEnvironmental Protection and Land Management Department of ZGH Bolesław SA.Samples of wastewater are collected for analysis from the outlet channel of the enter-prise's industrial wastewater treatment plant. The quality of wastewater is tested at theTesting Laboratory of ZGH Bolesław SA and at the Center for Environmental Testingand Control Sp. z o.o. in Katowice.
ZGH Bolesław SA is obliged to meet the quality parameters of discharged waste-water regarding the following indicators: pH, suspended solids, SO4 and Cl, Zn, Pb,Cd, F, ChZTCr, BZT5, Hg, Cu, Ni, Cr, As, V, Ag, Tl, volatile phenols.
Results of quality tests of discharged wastewater and sewage are submitted within30 days after the end of each quarter to the VIEP Krakow and to the Marshal of Mało-polska Voivodeship.
Noise monitoringNoise level measurements are conducted at the border of acoustic protection zone, lo-cated just adjacent to ZGH Bolesław SA. These measurements are conducted at leastonce every two years. Measurements are conducted according to the reference meth-odology by an appropriately accredited external company.
Monitoring of generated, recovered and neutralized wasteQualitative and quantitative records of waste is conducted with the use waste recordcards and waste transfer cards as well as forms designed for drafting and submissionof consolidated records of waste data, pursuant to the relevant waste regulations.Conducted by the Environmental Protection and Land Management Department.
Monitoring of technological processesMonitoring of technological processes is conducted in line with the dedicated tech-nological instructions. It is carried out by the Production and Auxiliary Divisions ofthe Mining and Processing Technological Line of ZGH Bolesław SA.
The above measurement results are recorded and kept by the Environmental Pro-tection and Land Management Department at ZGH Bolesław SA. The data is appliedin drafting the reports required by the law, as well as made available to oversight units.
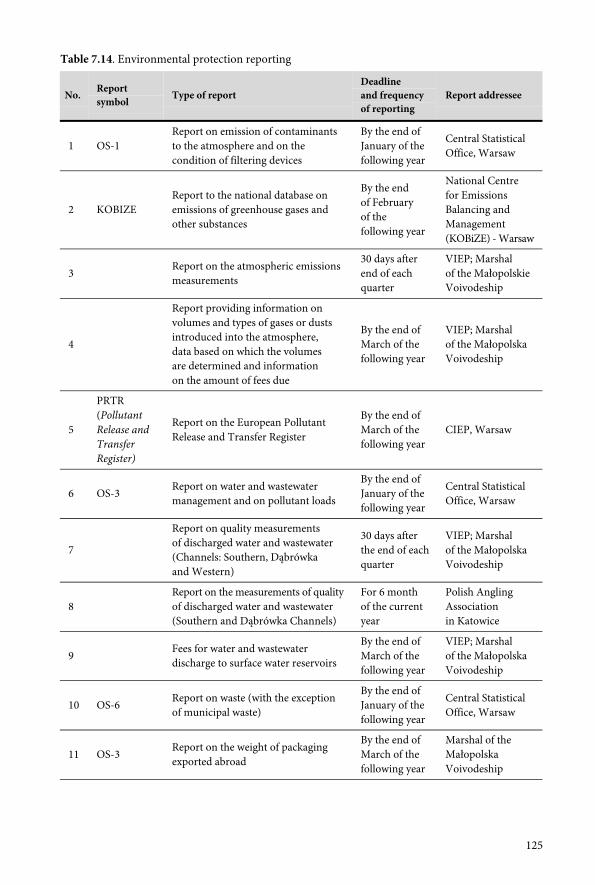
125
Table 7.14. Environmental protection reporting
No.Reportsymbol
Type of reportDeadlineand frequencyof reporting
Report addressee
1 OS-1Report on emission of contaminantsto the atmosphere and on thecondition of filtering devices
By the end ofJanuary of thefollowing year
Central StatisticalOffice, Warsaw
2 KOBIZEReport to the national database onemissions of greenhouse gases andother substances
By the endof Februaryof thefollowing year
National Centrefor EmissionsBalancing andManagement(KOBiZE) - Warsaw
3 Report on the atmospheric emissionsmeasurements
30 days afterend of eachquarter
VIEP; Marshalof the MałopolskieVoivodeship
4
Report providing information onvolumes and types of gases or dustsintroduced into the atmosphere,data based on which the volumesare determined and informationon the amount of fees due
By the end ofMarch of thefollowing year
VIEP; Marshalof the MałopolskaVoivodeship
5
PRTR(PollutantRelease andTransferRegister)
Report on the European PollutantRelease and Transfer Register
By the end ofMarch of thefollowing year
CIEP, Warsaw
6 OS-3 Report on water and wastewatermanagement and on pollutant loads
By the end ofJanuary of thefollowing year
Central StatisticalOffice, Warsaw
7
Report on quality measurementsof discharged water and wastewater(Channels: Southern, Dąbrówkaand Western)
30 days afterthe end of eachquarter
VIEP; Marshalof the MałopolskaVoivodeship
8Report on the measurements of qualityof discharged water and wastewater(Southern and Dąbrówka Channels)
For 6 monthof the currentyear
Polish AnglingAssociationin Katowice
9 Fees for water and wastewaterdischarge to surface water reservoirs
By the end ofMarch of thefollowing year
VIEP; Marshalof the MałopolskaVoivodeship
10 OS-6 Report on waste (with the exceptionof municipal waste)
By the end ofJanuary of thefollowing year
Central StatisticalOffice, Warsaw
11 OS-3Report on the weight of packagingexported abroad
By the end ofMarch of thefollowing year
Marshal of theMałopolskaVoivodeship
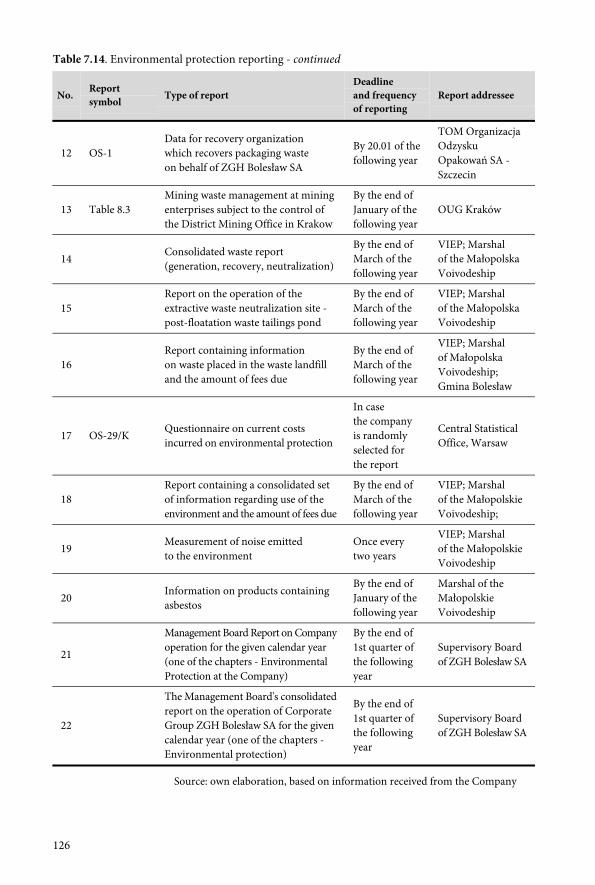
126
Table 7.14. Environmental protection reporting - continued
No.Reportsymbol
Type of reportDeadlineand frequencyof reporting
Report addressee
12 OS-1Data for recovery organizationwhich recovers packaging wasteon behalf of ZGH Bolesław SA
By 20.01 of thefollowing year
TOM OrganizacjaOdzyskuOpakowań SA -Szczecin
13 Table 8.3Mining waste management at miningenterprises subject to the control ofthe District Mining Office in Krakow
By the end ofJanuary of thefollowing year
OUG Kraków
14 Consolidated waste report(generation, recovery, neutralization)
By the end ofMarch of thefollowing year
VIEP; Marshalof the MałopolskaVoivodeship
15Report on the operation of theextractive waste neutralization site -post-floatation waste tailings pond
By the end ofMarch of thefollowing year
VIEP; Marshalof the MałopolskaVoivodeship
16Report containing informationon waste placed in the waste landfilland the amount of fees due
By the end ofMarch of thefollowing year
VIEP; Marshalof MałopolskaVoivodeship;Gmina Bolesław
17 OS-29/K Questionnaire on current costsincurred on environmental protection
In casethe companyis randomlyselected forthe report
Central StatisticalOffice, Warsaw
18Report containing a consolidated setof information regarding use of theenvironment and the amount of fees due
By the end ofMarch of thefollowing year
VIEP; Marshalof the MałopolskieVoivodeship;
19 Measurement of noise emittedto the environment
Once everytwo years
VIEP; Marshalof the MałopolskieVoivodeship
20 Information on products containingasbestos
By the end ofJanuary of thefollowing year
Marshal of theMałopolskieVoivodeship
21
Management Board Report on Companyoperation for the given calendar year(one of the chapters - EnvironmentalProtection at the Company)
By the end of1st quarter ofthe followingyear
Supervisory Boardof ZGH Bolesław SA
22
The Management Board's consolidatedreport on the operation of CorporateGroup ZGH Bolesław SA for the givencalendar year (one of the chapters -Environmental protection)
By the end of1st quarter ofthe followingyear
Supervisory Boardof ZGH Bolesław SA
Source: own elaboration, based on information received from the Company
127
As follows from the data in tables 7.14, companies draw up and provide, accordingto the instructions, a number of reports to the Voivodeship Inspectorate of Environ-mental Protection, Central Inspectorate of Environmental Protection in Warsaw, Mar-shal of Lublin Voivodeship, communal authorities competent for the territory the ofcompany's operation and to other institutions interested in the level of company'simpact on the natural environment.
7.4. Integrated reporting pursuant to the GRI standard illustrated bythe example of LOTOS Group
7.4.1. Brief description of the corporate group
LOTOS Group is an oil enterprise, whose main areas of operations are the extractionand processing of crude oil, as well as wholesale and retail sales of petroleum products.In total, the concern extracts ca. 28 thousand equivalent barrels of crude oil daily.LOTOS Group handles exploration for and production of crude oil through its sub-sidiary companies, that is coporate group LOTOS Petrobaltic SA, LOTOS Exploration andProduction Norge AS (North and Norwegian Seas) and LOTOS Geonafta (Lithuania).The group's refinery processes 10.5 million tonnes of crude oil annually. LOTOS is theproducer and supplier (to LOTOS petrol stations) of, among others, unleaded gasoline,diesel oil, fuel oil for heating purposes, aviation fuel. The company also specializes inthe production and sale of lubricant oils and bitumens, products for the rail industryand car cosmetics and car chemistry, or other products, such as liquid sulphur9
The development directions of corporate group up until 2020 entail the followingobjectives:
to further optimize the management model to achieve top efficiency, by 2020, to have access to extractable and confirmed resources of hydrocarbons
at a level of ca. 330 million oil-equivalent barrels (BOE), to increase extraction up to ca. 100 thousand BOE/day (equivalent to 5 million
tonnes of crude oil annually), to maintain at least 30% share in domestic fuel market, to maintain sales at a level exceeding the refinery's fuel production capacity by 15%, to secure at least 10% share in the domestic retail market, to further improve the economic efficiency of processing raw materials to ensure
optimum utilisation of assets, to strive for the optimization of refinery's energy economy by expanding links
to other energy systems.
9 http://www.lotos.pl/ (accessed on 16.03.2016)
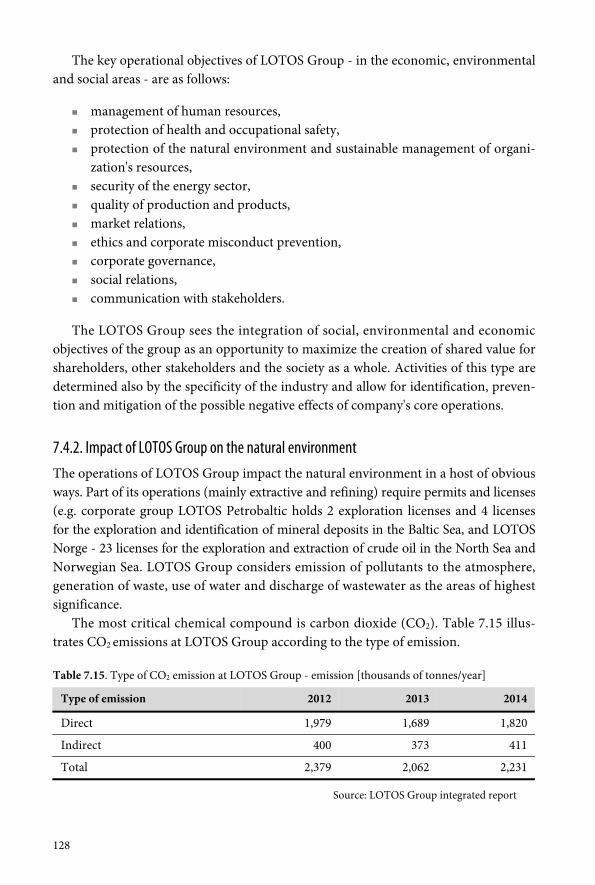
128
The key operational objectives of LOTOS Group - in the economic, environmentaland social areas - are as follows:
management of human resources, protection of health and occupational safety, protection of the natural environment and sustainable management of organi-
zation's resources, security of the energy sector, quality of production and products, market relations, ethics and corporate misconduct prevention, corporate governance, social relations, communication with stakeholders.
The LOTOS Group sees the integration of social, environmental and economicobjectives of the group as an opportunity to maximize the creation of shared value forshareholders, other stakeholders and the society as a whole. Activities of this type aredetermined also by the specificity of the industry and allow for identification, preven-tion and mitigation of the possible negative effects of company's core operations.
7.4.2. Impact of LOTOS Group on the natural environment
The operations of LOTOS Group impact the natural environment in a host of obviousways. Part of its operations (mainly extractive and refining) require permits and licenses(e.g. corporate group LOTOS Petrobaltic holds 2 exploration licenses and 4 licensesfor the exploration and identification of mineral deposits in the Baltic Sea, and LOTOSNorge - 23 licenses for the exploration and extraction of crude oil in the North Sea andNorwegian Sea. LOTOS Group considers emission of pollutants to the atmosphere,generation of waste, use of water and discharge of wastewater as the areas of highestsignificance.
The most critical chemical compound is carbon dioxide (CO2). Table 7.15 illus-trates CO2 emissions at LOTOS Group according to the type of emission.
Table 7.15. Type of CO2 emission at LOTOS Group - emission [thousands of tonnes/year]
Type of emission 2012 2013 2014
Direct 1,979 1,689 1,820
Indirect 400 373 411
Total 2,379 2,062 2,231
Source: LOTOS Group integrated report
129
The volume of emissions reported by LOTOS Group (refining operations) for theyear 2014 is considerably higher than in 2013. The reason behind it is the month-longrepair shutdown during the first half of 2013. For the years 2013-2020, the corporategroup obtained annual allowance limits entailing average annual emissions at a level of1.435 thousand tonnes. This means that the LOTOS Group will purchase CO2 allow-ance limits from other entities, under the EU Emissions Trading System (EU ETS). It is,therefore, considered a key and sensitive element in the appraisal of company's envi-ronmental performance. CO2 emissions are also a key item in the group's environ-mental budget.
The most significant sources of CO2 are:
Direct emission Indirect emission
burning fuel oil and other fuels in the energy systems,steam boilers and crane engines in the operation of rigsof the LOTOS Group Petrobaltic (extractive section)
refining operations of the LOTOS Group
purchase andconsumptionof electrical energy
As regards the operations of the LOTOS Petrobaltic group - natural gas originatingfrom under the Baltic Sea does not contain any chemical compounds or substancesthat could cause emission of greenhouse gases during combustion, other than CO2.Methane, which is a component of the fuel gas, is burnt up and thus not emitted intothe atmosphere. Other products of gas separation do not contain greenhouse gases,and their use by end-users does not lead to emission of gases other than CO2. Emissionvolumes are determined based on the measurement of used fuels, feedstock, as well ashydrocarbons sent to flare stacks, in reference to the relevant emission indicators, cal-culated on the basis of conducted laboratory analyses or reference figures. Emissionsof gases produced in the course of exploration and extraction activities are not regu-lated by either Polish or international law, and therefore are not subject to mandatorymonitoring.
The direct environmental effects disclosed by the group concern:
types of CO2 emissions in total and broken down into main units, emission volumes of other pollutants, such as SO2, Nox, VOC (volatile organic
compounds), dust, also with account for their origins, direct energy consumption by primary energy source, by place of origin, amount of discharge - amount of flare gas, raw materials and consumables by weight and volume, total volume of wastewater by origin, with particular emphasis on formation
water and water generated in the production process,
130
total abstraction of freshwater by sources and processes consuming largequantities of water,
total recycled water and total volume of treated water and wastewater by theirquality and destination
quantity of generated waste and methods of waste management.
Besides the direct effects, the group, pursuant to GRI guidelines, reports also theindirect environmental impacts. They concern, among others:
transportation services performed by and for the group, offered products.
The activities taken up by the LOTOS Group aimed to reduce the impact of roadtransportation of fuel products on the environment, irrespective of the legal require-ments, include:
developing safety requirements for delivery sites, defining safe loading, unloading and transport procedures for fuels and per-
forming regular inspections to ensure they are complied with, setting emergency response rules, supervision of third-party vehicles for compliance with technical requirements, supervision over selection and training of staff responsible for transport of
products.
In respect of products, both gasolines and diesel oils manufactured by the refineryin Gdańsk, feature sulphur content substantially below the legal threshold. The averageannual sulphur content in motor gasolines and diesel oils is 3.3 ppm and 6.2 ppm, re-spectively, both considerably below the required maximum of 10 ppm. This results insubstantially lower sulphur dioxide emissions into the atmosphere. Another long usedmethod of mitigating the environmental impact of fuels is the use of biocomponents,which can be considered a renewable energy source, and therefore limit the impact offuel combustion on the environment.
Initiatives focused on reducing the group's indirect effect on the natural environ-ment also entail bitumens, oils and other groups of products. The LOTOS Group isundertaking a host of initiatives regarding the natural environment. Among others,it develops sets of best practices and regularly tests its safety procedures.
Environmental protection expendituresThe Corporate Group reports costs and expenditures related to environmental pro-tection. The sum of these costs represents just a small fraction of overall group's costs,yet in total, it is a considerable amount. Environmental protection expenditures havebeen increasing at the Group over the years.
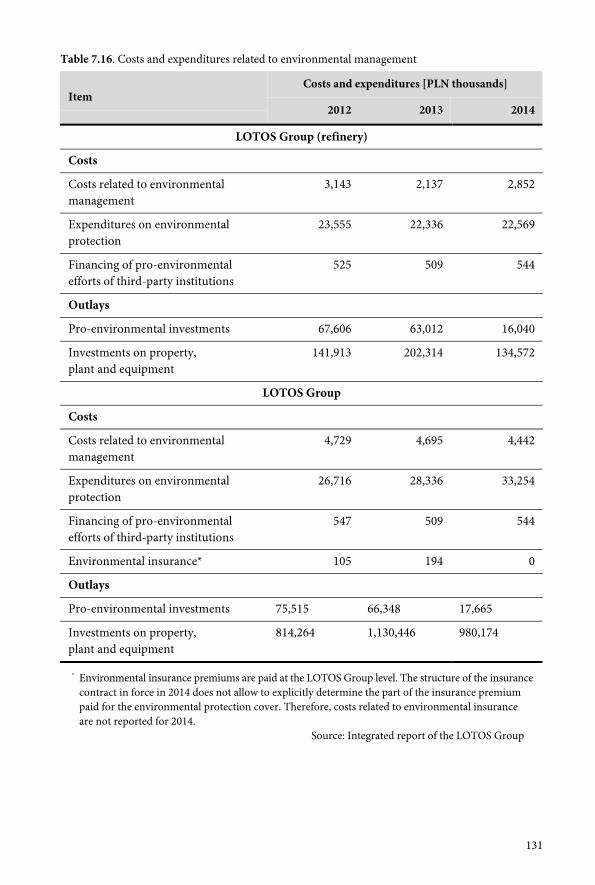
131
Table 7.16. Costs and expenditures related to environmental management
Costs and expenditures [PLN thousands]Item
2012 2013 2014
LOTOS Group (refinery)
Costs
Costs related to environmentalmanagement
3,143 2,137 2,852
Expenditures on environmentalprotection
23,555 22,336 22,569
Financing of pro-environmentalefforts of third-party institutions
525 509 544
Outlays
Pro-environmental investments 67,606 63,012 16,040
Investments on property,plant and equipment
141,913 202,314 134,572
LOTOS Group
Costs
Costs related to environmentalmanagement
4,729 4,695 4,442
Expenditures on environmentalprotection
26,716 28,336 33,254
Financing of pro-environmentalefforts of third-party institutions
547 509 544
Environmental insurance* 105 194 0
Outlays
Pro-environmental investments 75,515 66,348 17,665
Investments on property,plant and equipment
814,264 1,130,446 980,174
* Environmental insurance premiums are paid at the LOTOS Group level. The structure of the insurancecontract in force in 2014 does not allow to explicitly determine the part of the insurance premiumpaid for the environmental protection cover. Therefore, costs related to environmental insuranceare not reported for 2014.
Source: Integrated report of the LOTOS Group
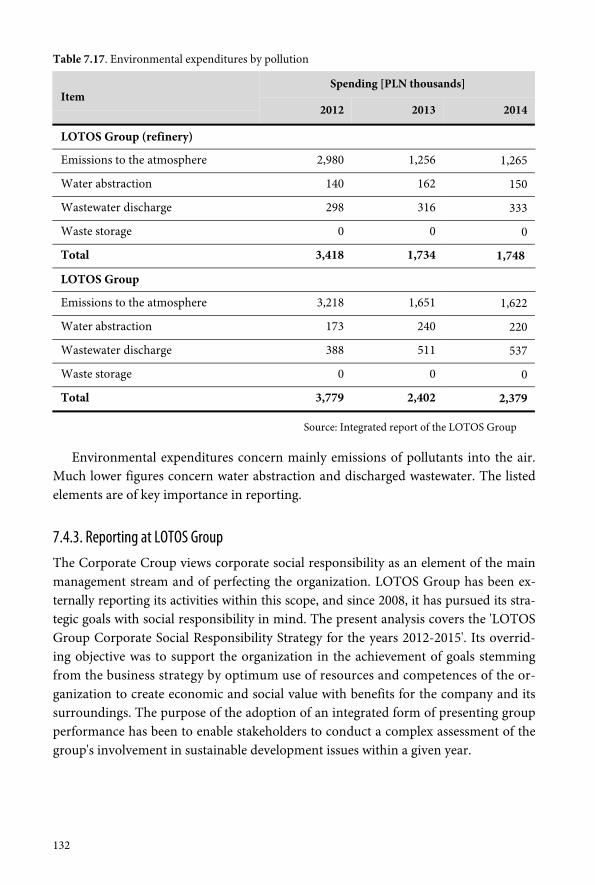
132
Table 7.17. Environmental expenditures by pollution
Spending [PLN thousands]Item
2012 2013 2014
LOTOS Group (refinery)
Emissions to the atmosphere 2,980 1,256 1,265
Water abstraction 140 162 150
Wastewater discharge 298 316 333
Waste storage 0 0 0
Total 3,418 1,734 1,748
LOTOS Group
Emissions to the atmosphere 3,218 1,651 1,622
Water abstraction 173 240 220
Wastewater discharge 388 511 537
Waste storage 0 0 0
Total 3,779 2,402 2,379
Source: Integrated report of the LOTOS Group
Environmental expenditures concern mainly emissions of pollutants into the air.Much lower figures concern water abstraction and discharged wastewater. The listedelements are of key importance in reporting.
7.4.3. Reporting at LOTOS Group
The Corporate Croup views corporate social responsibility as an element of the mainmanagement stream and of perfecting the organization. LOTOS Group has been ex-ternally reporting its activities within this scope, and since 2008, it has pursued its stra-tegic goals with social responsibility in mind. The present analysis covers the 'LOTOSGroup Corporate Social Responsibility Strategy for the years 2012-2015'. Its overrid-ing objective was to support the organization in the achievement of goals stemmingfrom the business strategy by optimum use of resources and competences of the or-ganization to create economic and social value with benefits for the company and itssurroundings. The purpose of the adoption of an integrated form of presenting groupperformance has been to enable stakeholders to conduct a complex assessment of thegroup's involvement in sustainable development issues within a given year.
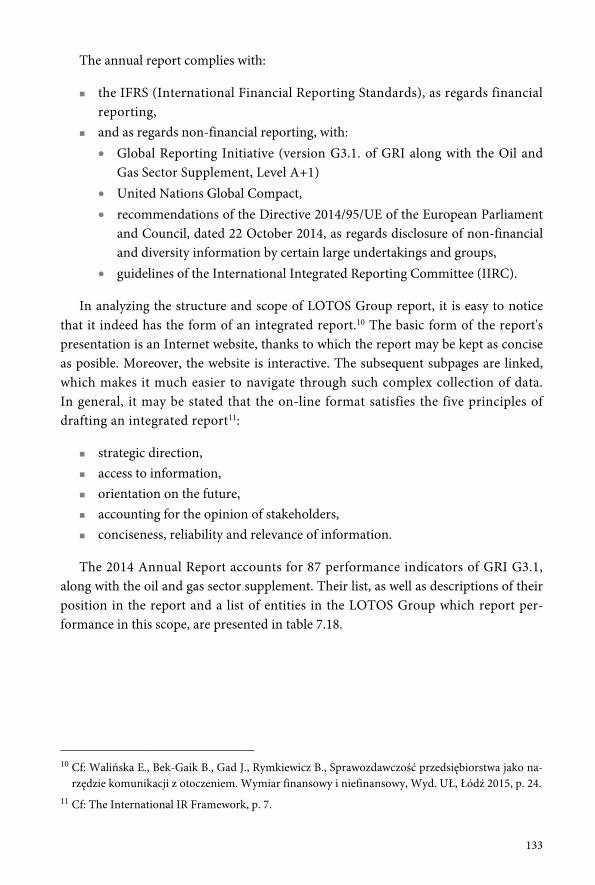
133
The annual report complies with:
the IFRS (International Financial Reporting Standards), as regards financialreporting,
and as regards non-financial reporting, with: Global Reporting Initiative (version G3.1. of GRI along with the Oil and
Gas Sector Supplement, Level A+1) United Nations Global Compact, recommendations of the Directive 2014/95/UE of the European Parliament
and Council, dated 22 October 2014, as regards disclosure of non-financialand diversity information by certain large undertakings and groups,
guidelines of the International Integrated Reporting Committee (IIRC).
In analyzing the structure and scope of LOTOS Group report, it is easy to noticethat it indeed has the form of an integrated report.10 The basic form of the report'spresentation is an Internet website, thanks to which the report may be kept as conciseas posible. Moreover, the website is interactive. The subsequent subpages are linked,which makes it much easier to navigate through such complex collection of data.In general, it may be stated that the on-line format satisfies the five principles ofdrafting an integrated report11:
strategic direction, access to information, orientation on the future, accounting for the opinion of stakeholders, conciseness, reliability and relevance of information.
The 2014 Annual Report accounts for 87 performance indicators of GRI G3.1,along with the oil and gas sector supplement. Their list, as well as descriptions of theirposition in the report and a list of entities in the LOTOS Group which report per-formance in this scope, are presented in table 7.18.
10 Cf: Walińska E., Bek-Gaik B., Gad J., Rymkiewicz B., Sprawozdawczość przedsiębiorstwa jako na-rzędzie komunikacji z otoczeniem. Wymiar finansowy i niefinansowy, Wyd. UŁ, Łódź 2015, p. 24.
11 Cf: The International IR Framework, p. 7.
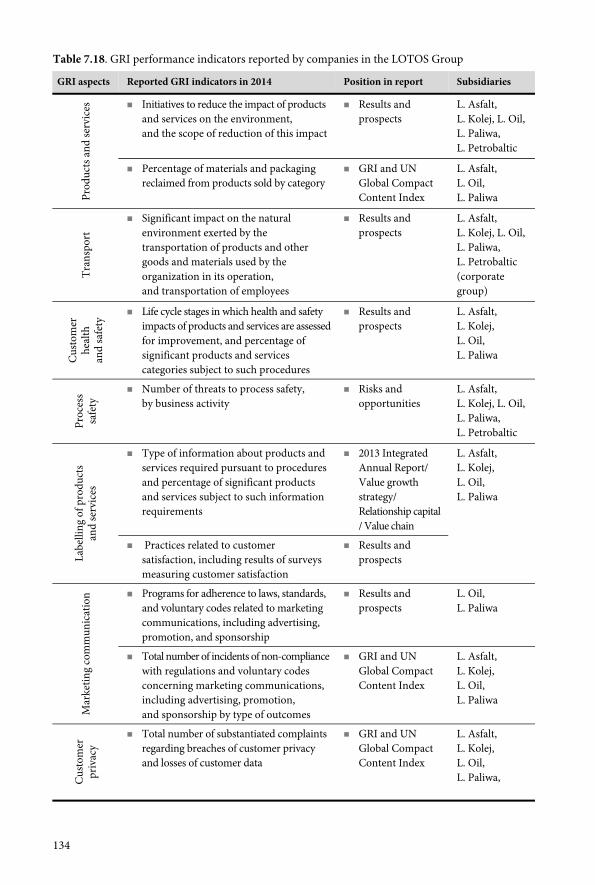
134
Table 7.18. GRI performance indicators reported by companies in the LOTOS Group
GRI aspects Reported GRI indicators in 2014 Position in report Subsidiaries
Initiatives to reduce the impact of productsand services on the environment,and the scope of reduction of this impact
Results andprospects
L. Asfalt,L. Kolej, L. Oil,L. Paliwa,L. Petrobaltic
Prod
ucts
and
serv
ices
Percentage of materials and packagingreclaimed from products sold by category
GRI and UNGlobal CompactContent Index
L. Asfalt,L. Oil,L. Paliwa
Tran
spor
t
Significant impact on the naturalenvironment exerted by thetransportation of products and othergoods and materials used by theorganization in its operation,and transportation of employees
Results andprospects
L. Asfalt,L. Kolej, L. Oil,L. Paliwa,L. Petrobaltic(corporategroup)
Cus
tom
erhe
alth
and
safe
ty
Life cycle stages in which health and safetyimpacts of products and services are assessedfor improvement, and percentage ofsignificant products and servicescategories subject to such procedures
Results andprospects
L. Asfalt,L. Kolej,L. Oil,L. Paliwa
Proc
ess
safe
ty
Number of threats to process safety,by business activity
Risks andopportunities
L. Asfalt,L. Kolej, L. Oil,L. Paliwa,L. Petrobaltic
Type of information about products andservices required pursuant to proceduresand percentage of significant productsand services subject to such informationrequirements
2013 IntegratedAnnual Report/Value growthstrategy/Relationship capital/ Value chain
Labe
lling
of p
rodu
cts
and
serv
ices
Practices related to customersatisfaction, including results of surveysmeasuring customer satisfaction
Results andprospects
L. Asfalt,L. Kolej,L. Oil,L. Paliwa
Programs for adherence to laws, standards,and voluntary codes related to marketingcommunications, including advertising,promotion, and sponsorship
Results andprospects
L. Oil,L. Paliwa
Mar
ketin
g co
mm
unic
atio
n
Total number of incidents of non-compliancewith regulations and voluntary codesconcerning marketing communications,including advertising, promotion,and sponsorship by type of outcomes
GRI and UNGlobal CompactContent Index
L. Asfalt,L. Kolej,L. Oil,L. Paliwa
Cus
tom
erpr
ivac
y
Total number of substantiated complaintsregarding breaches of customer privacyand losses of customer data
GRI and UNGlobal CompactContent Index
L. Asfalt,L. Kolej,L. Oil,L. Paliwa,
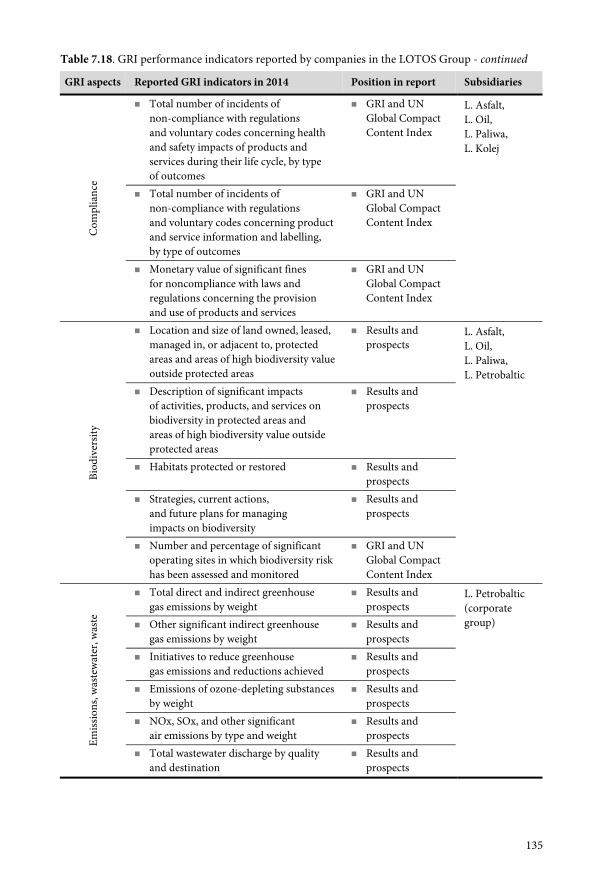
135
Table 7.18. GRI performance indicators reported by companies in the LOTOS Group - continued
GRI aspects Reported GRI indicators in 2014 Position in report Subsidiaries
Total number of incidents ofnon-compliance with regulationsand voluntary codes concerning healthand safety impacts of products andservices during their life cycle, by typeof outcomes
GRI and UNGlobal CompactContent Index
Total number of incidents ofnon-compliance with regulationsand voluntary codes concerning productand service information and labelling,by type of outcomes
GRI and UNGlobal CompactContent Index
Com
plia
nce
Monetary value of significant finesfor noncompliance with laws andregulations concerning the provisionand use of products and services
GRI and UNGlobal CompactContent Index
L. Asfalt,L. Oil,L. Paliwa,L. Kolej
Location and size of land owned, leased,managed in, or adjacent to, protectedareas and areas of high biodiversity valueoutside protected areas
Results andprospects
Description of significant impactsof activities, products, and services onbiodiversity in protected areas andareas of high biodiversity value outsideprotected areas
Results andprospects
Habitats protected or restored Results andprospects
Strategies, current actions,and future plans for managingimpacts on biodiversity
Results andprospects
Biod
iver
sity
Number and percentage of significantoperating sites in which biodiversity riskhas been assessed and monitored
GRI and UNGlobal CompactContent Index
L. Asfalt,L. Oil,L. Paliwa,L. Petrobaltic
Total direct and indirect greenhousegas emissions by weight
Results andprospects
Other significant indirect greenhousegas emissions by weight
Results andprospects
Initiatives to reduce greenhousegas emissions and reductions achieved
Results andprospects
Emissions of ozone-depleting substancesby weight
Results andprospects
NOx, SOx, and other significantair emissions by type and weight
Results andprospects
Emiss
ions
, was
tew
ater
, was
te
Total wastewater discharge by qualityand destination
Results andprospects
L. Petrobaltic(corporategroup)
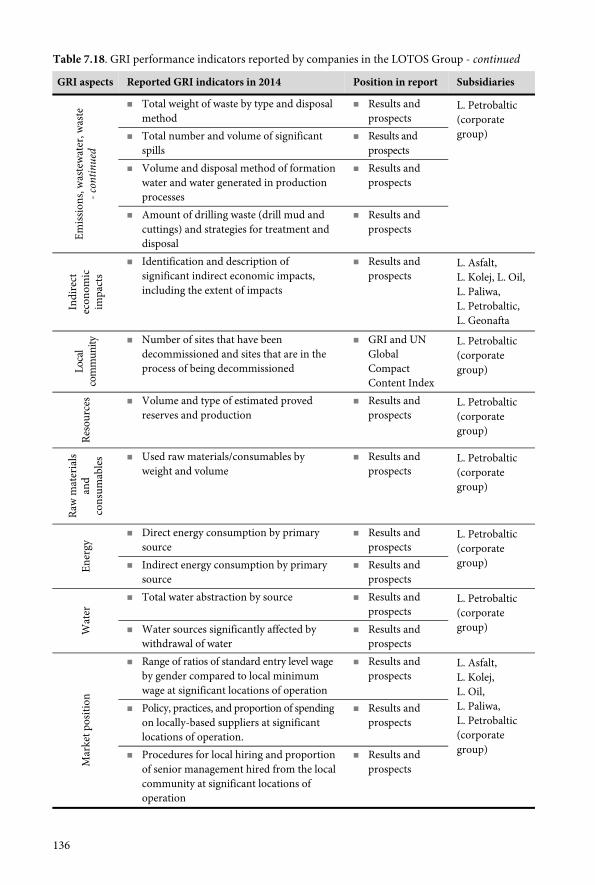
136
Table 7.18. GRI performance indicators reported by companies in the LOTOS Group - continued
GRI aspects Reported GRI indicators in 2014 Position in report Subsidiaries
Total weight of waste by type and disposalmethod
Results andprospects
Total number and volume of significantspills
Results andprospects
Volume and disposal method of formationwater and water generated in productionprocesses
Results andprospects
Emiss
ions
, was
tew
ater
, was
te- c
ontin
ued
Amount of drilling waste (drill mud andcuttings) and strategies for treatment anddisposal
Results andprospects
L. Petrobaltic(corporategroup)
Indi
rect
econ
omic
impa
cts
Identification and description ofsignificant indirect economic impacts,including the extent of impacts
Results andprospects
L. Asfalt,L. Kolej, L. Oil,L. Paliwa,L. Petrobaltic,L. Geonafta
Loca
lco
mm
unity Number of sites that have been
decommissioned and sites that are in theprocess of being decommissioned
GRI and UNGlobalCompactContent Index
L. Petrobaltic(corporategroup)
Reso
urce
s Volume and type of estimated provedreserves and production
Results andprospects
L. Petrobaltic(corporategroup)
Raw
mat
eria
lsan
dco
nsum
able
s Used raw materials/consumables byweight and volume
Results andprospects
L. Petrobaltic(corporategroup)
Direct energy consumption by primarysource
Results andprospects
Ener
gy
Indirect energy consumption by primarysource
Results andprospects
L. Petrobaltic(corporategroup)
Total water abstraction by source Results andprospects
Wat
er
Water sources significantly affected bywithdrawal of water
Results andprospects
L. Petrobaltic(corporategroup)
Range of ratios of standard entry level wageby gender compared to local minimumwage at significant locations of operation
Results andprospects
Policy, practices, and proportion of spendingon locally-based suppliers at significantlocations of operation.
Results andprospects
Mar
ket p
ositi
on
Procedures for local hiring and proportionof senior management hired from the localcommunity at significant locations ofoperation
Results andprospects
L. Asfalt,L. Kolej,L. Oil,L. Paliwa,L. Petrobaltic(corporategroup)
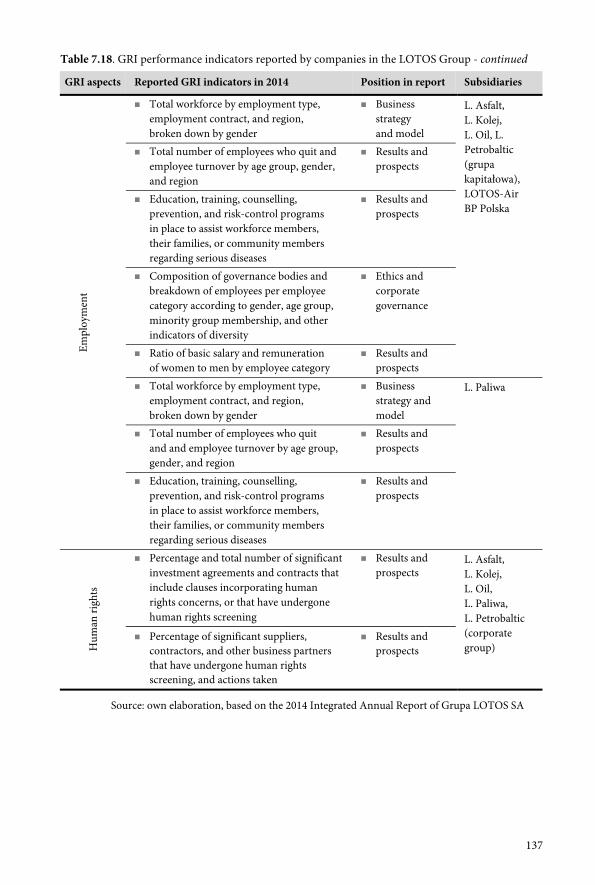
137
Table 7.18. GRI performance indicators reported by companies in the LOTOS Group - continued
GRI aspects Reported GRI indicators in 2014 Position in report Subsidiaries
Total workforce by employment type,employment contract, and region,broken down by gender
Businessstrategyand model
Total number of employees who quit andemployee turnover by age group, gender,and region
Results andprospects
Education, training, counselling,prevention, and risk-control programsin place to assist workforce members,their families, or community membersregarding serious diseases
Results andprospects
Composition of governance bodies andbreakdown of employees per employeecategory according to gender, age group,minority group membership, and otherindicators of diversity
Ethics andcorporategovernance
Ratio of basic salary and remunerationof women to men by employee category
Results andprospects
L. Asfalt,L. Kolej,L. Oil, L.Petrobaltic(grupakapitałowa),LOTOS-AirBP Polska
Total workforce by employment type,employment contract, and region,broken down by gender
Businessstrategy andmodel
Total number of employees who quitand and employee turnover by age group,gender, and region
Results andprospects
Empl
oym
ent
Education, training, counselling,prevention, and risk-control programsin place to assist workforce members,their families, or community membersregarding serious diseases
Results andprospects
L. Paliwa
Percentage and total number of significantinvestment agreements and contracts thatinclude clauses incorporating humanrights concerns, or that have undergonehuman rights screening
Results andprospects
Hum
an ri
ghts
Percentage of significant suppliers,contractors, and other business partnersthat have undergone human rightsscreening, and actions taken
Results andprospects
L. Asfalt,L. Kolej,L. Oil,L. Paliwa,L. Petrobaltic(corporategroup)
Source: own elaboration, based on the 2014 Integrated Annual Report of Grupa LOTOS SA
138
The report structure is broken down into the following chapters:
Key data 2014, Ethics and corporate governance, Risks and opportunities, Results and prospects, Financial information, Useful information.
Key data 2014 is a general chapter, presenting basic financial and non-financialdata concerning the financial year in question (ex post). Non-financial data disclosedby the enterprise concerns:
the natural environment: size of pro-environmental investments, total waterabstraction and CO2 emissions,
community: value of donations for social purposes, workforce: number, turnover and LTIF injury index per 1 million hours worked, market position: share in the market of fuels, crude oil and natural gas extraction.
This chapter also contains a Letter from the Preisent of the Supervisory Board andLetter from the President of the Management Board summarising the financial yearand setting the activities to be taken up for the upcoming years, description of thegroup's organizational structure. Some of the most important elements of the envi-ronmental and social area involve the description of integrated reporting in the LOTOSGroup, the report on the independent limited-scope external assurance (PwC) as wellas awards and distinctions received for CSR initiatives (among others, the CrystalLaurel of Skills and Competence, 3rd place in the Best Annual Report competition).
Ethics and corporate governance is the second chapter, devoted to values guidingthe corporate group. It contains a description of the approach to management, ethics,Corporate Supervision and the roles of the Supervisory Board and ManagementBoard. In this area of social and environmental elements, the group discloses the con-solidated list of management system audits, including of the implemented systemsISO 14001, ISO 50001, PN 18001.
Risks and opportunities is the third part, entirely focusing on the approach tocorporate risk management and basic risk factors in the management, exploration andextraction, operational, financial and trade segments. The group also identifies a num-ber of risk groups associated with environmental activities (Table 7.19).
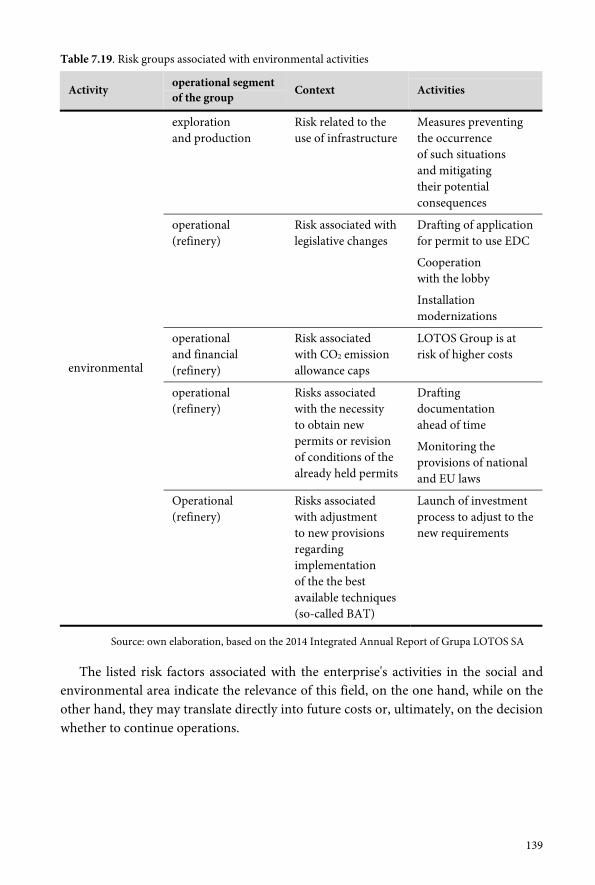
139
Table 7.19. Risk groups associated with environmental activities
Activity operational segmentof the group
Context Activities
explorationand production
Risk related to theuse of infrastructure
Measures preventingthe occurrenceof such situationsand mitigatingtheir potentialconsequences
operational(refinery)
Risk associated withlegislative changes
Drafting of applicationfor permit to use EDC
Cooperationwith the lobby
Installationmodernizations
operationaland financial(refinery)
Risk associatedwith CO2 emissionallowance caps
LOTOS Group is atrisk of higher costs
operational(refinery)
Risks associatedwith the necessityto obtain newpermits or revisionof conditions of thealready held permits
Draftingdocumentationahead of time
Monitoring theprovisions of nationaland EU laws
environmental
Operational(refinery)
Risks associatedwith adjustmentto new provisionsregardingimplementationof the the bestavailable techniques(so-called BAT)
Launch of investmentprocess to adjust to thenew requirements
Source: own elaboration, based on the 2014 Integrated Annual Report of Grupa LOTOS SA
The listed risk factors associated with the enterprise's activities in the social andenvironmental area indicate the relevance of this field, on the one hand, while on theother hand, they may translate directly into future costs or, ultimately, on the decisionwhether to continue operations.
140
Business strategy and model is a chapter of significance from the perspective of theintegrated report and objectives also in the environmental, ecological and economicspheres. It presents a model of the value chain and detailed strategic objectives alongwith critical success factors. The LOTOS Group's CSR strategy until 2015 has definedthe key objectives to be achieved in individual areas of activity:
In the area of investment in human resources the objective is to ensure avail-ability of highly qualified staff required to successfully implement the businessstrategy and enhance the corporate culture based on adopted values,
As regards health and safety improvement, the priority is to increase the aware-ness and involvement in work safety improvement among the management staff,employees and contractors,
As regards integration with the local community, the principal goal is to un-dertake initiatives that help to ensure lasting solutions to social and environ-mental issues vital to the local communities,
In the area of management of natural resources in the production process, thegroup seeks to reduce environmental risk and continually minimize the envi-ronmental impact of the group's operations,
In terms of ethics and the prevention of misconduct, the group seeks to im-prove management by ensuring ethical conduct and transparency of businessprocesses, as well as by protecting the organization against misconduct,
The Group's strategic goal with respect to partnership relations with the marketenvironment is to build lasting customer relationships by focusing on under-standing customers' needs and ensuring expected product quality and safety,
As regards energy sector security, the Group's objective is to support initiativesdesigned to enhance energy sector security in a socially and environmentallyresponsible manner,
As regards communication, the Group aims to ensure that communication withemployees is timely and appropriate to their various needs. The Group also seeksto build organizational culture based on multi-directional, open communication,including through the development of a system of public consultations withinthe LOTOS Group.
Employees and the natural environment are regarded as particularly significant areasfrom the perspective of the business model of the LOTOS Group. The reporting arearegarding employees is the total workforce by employment type, employment con-tract and region and gender. The enterprise also reports key initiatives aiming to ensurethe availability of highly qualified staff required to successfully implement the busi-ness strategy.
141
In the area of natural environment, the Group strives for continuous minimizationof its environmental footprint. The detailed activities entail:
modernization of the last, fourth boiler in the CHP plant in order to adapt it tocombust natural gas (reduction of emissions),
the switchover to natural gas as a source of energy and a feedstock in the pro-duction of hydrogen has enabled the Group to considerably reduce emissionsfrom the production units and CHP plant,
further enhancement of the energy management system, in line with ISO 50001, appointment of the Energy Efficiency Team, whose responsibilities include im-
plementation of two closely related environmental objectives: improvementof energy efficiency of the interplant pipeline steam heating system (to beachieved in 2015) and reduction of primary energy consumption at the LOTOSGroup's refinery,
continued promotion of awareness of best environmental practices and stan-dards among all LOTOS Group employees as well as local communities.
imparting a cycle of lectures and seminars, as well as field trips, with a specialfocus on students and youth,
meeting standards, including the newly implemented requirements pertainingto the protection of soil and underground water, imposed on the operators ofIPPC installations by the Industrial Emissions Directive.
The majority of presented initiatives concern reduction of emissions. This is a criti-cal element. The Group presents here the CO2 emissions by LOTOS Group in the years2005-2014, as well as the emissions of main pollutants from LOTOS Group's CHPplant to the air relative to permitted values.
Results and prospects is a key chapter presenting the group's impact on economic,social and environmental factors. Economic elements, for example, entail market share,use of production capacities, regional profit margins, fuels market data, performanceof individual segments. Social and environmental elements have been described in thepart on sustainable development. It is the largest part presenting the LOTOS Group'sperformance. It contains nearly all GRI performance indicators reported by compa-nies in the LOTOS Group. This part also covers the Group's environmental footprint(see chapter 7.4.2)
Financial information is the next chapter in the report. The form and scope aretypical of financial reports of stock exchange listed companies.
The chapter devoted to useful information is also of interest. It contains the GRIand UN Global Compact Content Index. The index lists all the elements required bythe GRI 3.1 standard, along with the oil and gas segment supplement. The table is infact a guide to the report, helpful in locating significant environmental and socialcontent. It also has links to specific articles presenting more detailed data.
142
The table also presents some very important data and indicators, such as the mone-tary value of significant fines for noncompliance with laws and regulations concerningthe provision and use of products and services, the total number of incidents of non-compliance with regulations and voluntary codes concerning health and safety impactsof products and services during their life cycle, by type of outcomes, or the percentageof materials and packagings reclaimed from products sold by category.
7.4.4. Conclusions
In summary, the LOTOS Group exerts a significant impact on the natural environ-ment and highly values the social and environmental elements of its operation. Thereport, in line with the integrated report standard, is a derivative of the businessmodel built upon the mentioned elements.
This Group was one of the first ones to attempt to draw up an integrated report inaccordance with best global practices. The report has received numerous awards andit is a model to be followed by others, both as regards theory and practice of integratedreports. It has a strategic direction, thanks to the description of business strategy andmodel, which are a critical point of the report. Access to information is very broad,as the data provided is detailed and, through its connection with the system of objec-tives, it refers to both the past and future activities. The presented data is reliable, rele-vant, and it accounts for the stakeholders' opinions. One outstandingly convenientsolution is the GRI and UN Global Compact Content Index, which orders the reportcontent in terms of provided data. It may be concluded that in its current form, thereport is an example of a good practice in the sphere of reporting economic, socialand environmental effects.
7.5. EMAS environmental reporting compliant with ISO 14001illustrated with the example of RAFAKO SA
RAFAKO SA is a company established in 199312 as a result of privatisation of FabrykaUrządzeń Technicznych (Technical Devices Factory)13. It has operated continuouslysince 1949. Since 1994, it has been listed on the Warsaw Stock Exchange. Currently,since 2011, a subsidiary of PBG Group.
The enterprise is the unquestionable leader in the market of energy boilers and en-vironmental protection devices for the energy sector in Poland and in Europe, as well asan important player worldwide (as the leading global producer of boiler components).Since 2008, it has been an independent producer of complete power generation units
12 Uniform Statute of RAFAKO Spółka Akcyjna in Racibórz, Chapter V, § 33.13 Fabryka Kotłów Rafako ma 60 lat, Nasz Racibórz, 29.09.2010
143
(for example for Jaworzno III Power Plant - 910 MW14). Over the last several years, ithas gained the position of Poland's leader in the field of installations for flue gasdesulphurization with the wet lime method and semi-dry method. The company isheadquartered in Racibórz, where all the design and technological offices are located,along with five production plants and company management. Over the last few years,the company base has expanded to include design offices in Gliwice, Częstochowa andBelgrade. The Electrostatic Precipitators Enterprise has been operating in Pszczynasince 2009 and in the nearby locality of Wyry, production of electrostatic precipitatorcomponents has been launched.15
The company offer is supplemented by a number of various maintenance services, fromdiagnostics, through repairs, renovations and supply of replacement parts, to complexmodernizations of boilers and boiler paraphernalia. As regards environmental protec-tion, the company designs, performs and completes turn-key installations for flue gasdesulphurization, reduction of NOx emissions and dust removal equipment.16
7.5.1. Brief description of the company
Rafako SA keenly undertakes social and environmental initiatives. For many yearsnow it has viewed human beings as the most significant element of both the enterpriseand the entire ecosystem. In line with this approach, human beings must be orientedon taking responsibility for other people and for the world in which they live and cre-ate heritage for future generations.17 The enterprise's current mission is to activelyparticipate in the modernization and improvement of safety and comfort of everydaylife through the development of eco-friendly energy sources.18
The sphere of social activities entails sponsorship of sports initiatives. This is inline with the enterprise's value system and the general focus on energy in all forms.The company sponsors the cross country skier, Justyna Kowalczyk, the triathlonist EwaBugdoł and it supports and sponsors initiatives such as 'Run to the Olympics' (a series ofcontests for children and youth) or 'Hussars Poland (WSB University team). Someother local sports initiatives supported by the company include the sponsorship of AZSRAFAKO Racibórz, KS RAFAKO soccer team, mountain biking club RAFAKO MTBTeam and individual athletes and teams representing the company at sports events.
As regards activities in connection with pro-ecological measures, RAFAKO SA hasheld, since 1998, a certificate of environmental management in accordance with ISO 14001.In 2002, the Environmental Management System in accordance with the PN-ISO 14001
14 A. Roguski, Rafako gotowe do skoku, Parkiet, 26.02.201615 http://encyklopedia.pwn.pl/haslo/3913853/ideologia.html (accessed on 09.03.2016)16 http://encyklopedia.pwn.pl/haslo/3913853/ideologia.html (accessed on 09.03.2016)17 Company Profile RAFAKO SA, Wydawnictwo ART, 2001, p. 2.18 http://encyklopedia.pwn.pl/haslo/3913853/ideologia.html (accessed on 09.03.2016)
144
standard was integrated with the Quality Management System in accordance with therequirements of PN-EN 9001 standard. 19 True to its outstanding concern for the naturalenvironment, in 2006 the company implemented the requirements of the then bind-ing regulation 761/2001/EC (EMAS) and, in early 2007, it was entered in the NationalEMAS Register.
7.5.2. EMAS environmental declaration reporting scope20
The report submitted by the enterprise within EMAS is in the form of the so-calledenvironmental declaration. Both EMAS and ISO 14001 are based on the same premises.The fundamental difference between EMAS and ISO 14001 is limited to the obligationto publish the environmental declaration and to the approach to legal compliance, aswell as a few other minor elements listed in Annex 2 to the regulation, 'Environmentalmanagement system requirements and additional issues to be addressed by organiza-tions implementing EMAS'21. The purpose of the environmental declaration is to providethe society and other interested parties with environmental information concerningimpact on the natural environment and effects of its environmental performance, as wellas on continuous enhancements of the organization's environmental performance. It issubmitted at first registration, and subsequently every three years.
Information in the environmental declaration covers: 22
a) a clear and unambiguous description of the organization registering under EMASand a summary of its activities, products and services and its relationship to anyparent organizations as appropriate,
b) the environmental policy and a brief description of the environmental manage-ment system of the organization,
c) a description of all the significant direct and indirect environmental aspectswhich result in significant environmental impacts of the organization and anexplanation of the nature of the impacts as related to these aspects (Annex I.2),
d) a description of the environmental objectives and targets in relation to thesignificant environmental aspects and impacts,
19 http://encyklopedia.pwn.pl/haslo/3913853/ideologia.html (accessed on 09.03.2016)20 Developed on the basis of the EMAS RAFAKO SA environmental declaration.21 Regulation (EC) No. 1221/2009 of the European Parliament and Council of 25 Novemeber 2009 on
the voluntary participation by organizations in a Community eco-management and audit scheme(EMAS), repealing Regulation (EC) No 761/2001 and Commission Decisions 2001/681/EC and2006/193/EC, EU Official Journal L 342/23.
22 Regulation (EC) No. 1221/2009 of the European Parliament and Council of 25 Novemeber 2009 onthe voluntary participation by organizations in a Community eco-management and audit scheme(EMAS), repealing Regulation (EC) No 761/2001 and Commission Decisions 2001/681/EC and2006/193/EC, EU Official Journal L 342/23.
145
e) a summary of the data available on the performance of the organization againstits environmental objectives and targets with respect to its significant environ-mental impacts. Reporting is to be on the core indicators and on other relevantexisting environmental performance indicators as set out in Section C,
f) other factors regarding environmental performance including performanceagainst legal provisions with respect to their significant environmental impacts,
g) a reference to the applicable legal requirements relating to the environment,h) the name and accreditation or licence number of the environmental verifier
and the date of validation.
In the environmental declaration of RAFAKO SA for the year 2015, the descriptionof basic information about the enterprise and of its profile of activities is contained inchapters 1-3. Besides the basic information regarding the company and its productsand services, the enterprise has also provided information concerning product andprocess innovations of ecological character.
The description of the environmental policy and a brief description of the eco-management system is represented by chapters 4-6. The framework of the environmentalpolicy at the company is set by the earlier mentioned Environmental ManagementSystem, whose purpose is to continuously minimize the negative influence of operationsof RAFAKO SA by way of:
reducing waste emissions and waste segregation, reducing emissions of pollutants into the atmosphere, improvement of the quality of wastewater discharged to surface water, designing products with account of environmental aspects.
The description of environmental aspects of the enterprise's economic activities isprovided by Chapter 7 of RAFAKO's environmental declaration. In order to definethe environmental aspects which have or may have a significant influence on the envi-ronment, an organization should establish and maintain procedures for the identifi-cation of environmental aspects related to its activities, products or services, which itmay supervise and influence. The organization should ensure that the significant envi-ronmental aspects are taken into account in establishing its environmental objectives.23
The discussed report is structured so as to identify both direct and indirect impacts ofthe company's economic operation on the natural environment.
23 Regulation (EC) No. 1221/2009 of the European Parliament and Council of 25 November 2009 onthe voluntary participation by organizations in a Community eco-management and audit scheme(EMAS), repealing Regulation (EC) No 761/2001 and Commission Decisions 2001/681/EC and2006/193/EC, Annex I - A.3.1 and Annex VI, EU Official Journal L 342/23.
146
Environmental aspects are divided into direct and indirect ones. The direct envi-ronmental aspects are related to the operation, products and services of the organiza-tion, over which it has direct managerial control. The identified direct environmentalaspects include: emission of pollutants into the atmosphere, waste management, dis-charge of wastewater to surface water and consumption of electrical energy, natural gasand technical gases.
The scope of the disclosed information covers the operation with the mentionedenvironmental aspect, the type of substances influencing the environment and techni-cal solutions applied by the enterprise in order to reduce this influence over the pastyears. For example, one of the chief environmental aspects is the emission of pollutantsinto the atmosphere.
At RAFAKO SA, it is primarily an effect of the boiler house, as well as of certainproduction aspects, such as shot-blasting, gas and plasma cutting, forming and thermalprocessing, etc. Emission of pollutants into the atmosphere at RAFAKO SA takes placein both organized and non-organized manners. Organized emission takes place through24 emitters, of which each has a determined emission cap as determined by the relevantdecision. Non-organized emission originates mostly from welding processes. The greatestshare in organized emission is represented by emissions from the boiler house. The pol-lutants emitted into the atmosphere are mostly dust, sulphur dioxide and nitrogen oxides.The boiler house is fitted with five WLM 2.5 boilers and two WLM 1.25 boilers, mod-ernized within the projects carried out in the years 2000-2007.
All the listed direct environmental aspects of the enterprise have been described ina similar way.
Indirect environmental aspects may stem from the organization's relations withthird parties, over which the organization applying for registration in EMAS may havea degree of influence. Indirect environmental aspects at RAFAKO SA account for en-vironmental impacts exerted by the offered products and services and in relation tothe chosen suppliers. The company's environmental influence through its productsand services is reduced by the fact that the offered products have better environmentalparameters (lower emissions of SO2, NOx, dusts).24 The company designs and imple-ments new technologies within this scope. RAFAKO SA also evaluates its suppliers interms of the influence of their operations on the environment (legal requirements,contractual provisions, employee trainings).
The evaluation of environmental aspects, both direct and indirect, takes placeevery year. The individual aspects are ranked on a scale of 1 to 5, where 1 stands fornegligible influence and 5 stands for very negative influence. The company regardsthose which obtained a grade of 3.5 or more, in the process of environmental influ-ence evaluation, to be significant. The company publishes detailed indexes of aspects,along with their relation to tasks and targets.
24 RAFAKO SA environmental declaration 2015, pp. 12-13.
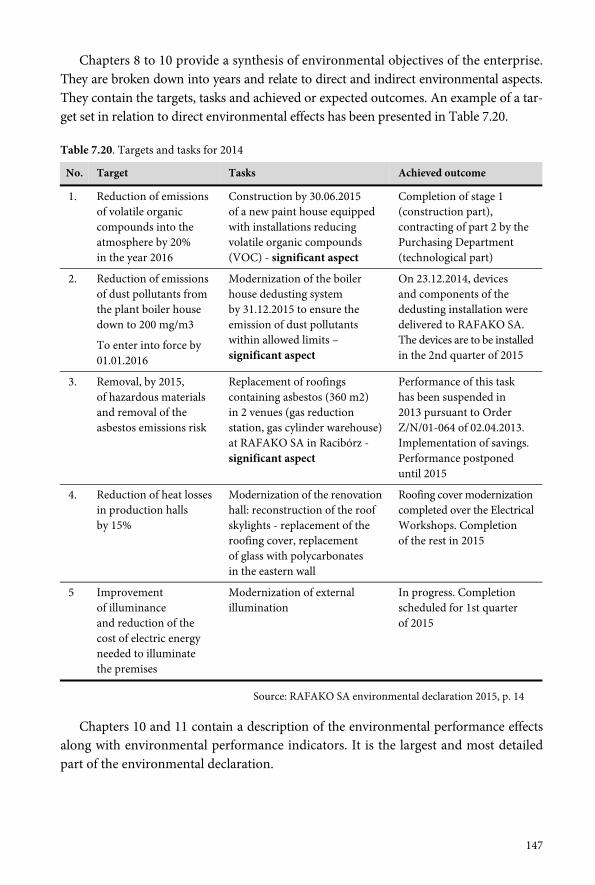
147
Chapters 8 to 10 provide a synthesis of environmental objectives of the enterprise.They are broken down into years and relate to direct and indirect environmental aspects.They contain the targets, tasks and achieved or expected outcomes. An example of a tar-get set in relation to direct environmental effects has been presented in Table 7.20.
Table 7.20. Targets and tasks for 2014
No. Target Tasks Achieved outcome
1. Reduction of emissionsof volatile organiccompounds into theatmosphere by 20%in the year 2016
Construction by 30.06.2015of a new paint house equippedwith installations reducingvolatile organic compounds(VOC) - significant aspect
Completion of stage 1(construction part),contracting of part 2 by thePurchasing Department(technological part)
2. Reduction of emissionsof dust pollutants fromthe plant boiler housedown to 200 mg/m3
To enter into force by01.01.2016
Modernization of the boilerhouse dedusting systemby 31.12.2015 to ensure theemission of dust pollutantswithin allowed limits –significant aspect
On 23.12.2014, devicesand components of thededusting installation weredelivered to RAFAKO SA.The devices are to be installedin the 2nd quarter of 2015
3. Removal, by 2015,of hazardous materialsand removal of theasbestos emissions risk
Replacement of roofingscontaining asbestos (360 m2)in 2 venues (gas reductionstation, gas cylinder warehouse)at RAFAKO SA in Racibórz -significant aspect
Performance of this taskhas been suspended in2013 pursuant to OrderZ/N/01-064 of 02.04.2013.Implementation of savings.Performance postponeduntil 2015
4. Reduction of heat lossesin production hallsby 15%
Modernization of the renovationhall: reconstruction of the roofskylights - replacement of theroofing cover, replacementof glass with polycarbonatesin the eastern wall
Roofing cover modernizationcompleted over the ElectricalWorkshops. Completionof the rest in 2015
5 Improvementof illuminanceand reduction of thecost of electric energyneeded to illuminatethe premises
Modernization of externalillumination
In progress. Completionscheduled for 1st quarterof 2015
Source: RAFAKO SA environmental declaration 2015, p. 14
Chapters 10 and 11 contain a description of the environmental performance effectsalong with environmental performance indicators. It is the largest and most detailedpart of the environmental declaration.
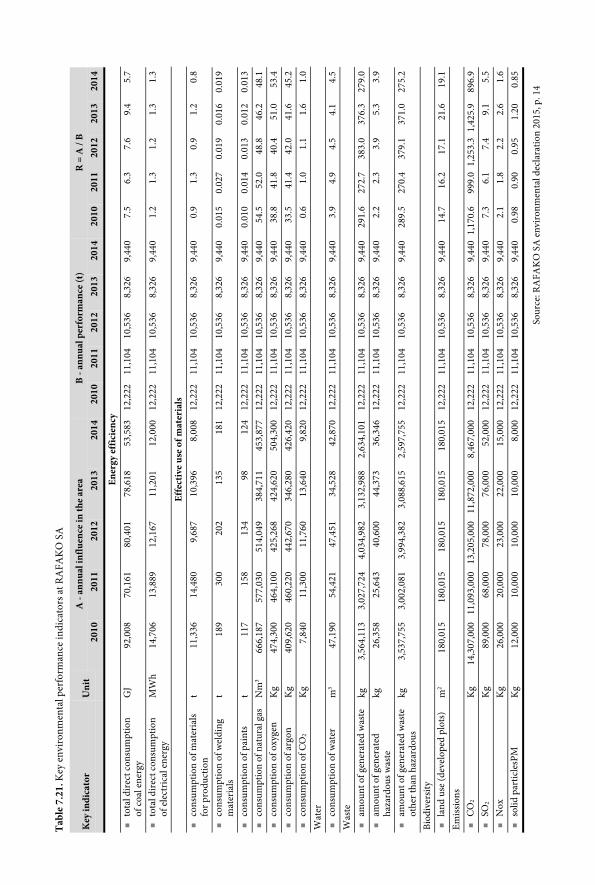
Tab
le 7
.21.
Key
env
iron
men
tal p
erfo
rman
ce in
dica
tors
at R
AFA
KO
SA
A -
annu
al in
fluen
ce in
the
area
B - a
nnua
l per
form
ance
(t)
R =
A /
BK
ey in
dica
tor
Uni
t20
1020
1120
1220
1320
1420
1020
1120
1220
1320
1420
1020
1120
1220
1320
14
Ener
gy e
ffic
ienc
y
tota
l dir
ect c
onsu
mpt
ion
of c
oal e
nerg
yG
J92
,008
70,1
6180
,401
78,6
1853
,583
12,2
2211
,104
10,5
368,
326
9,44
07.
56.
37.
69.
45.
7
to
tal d
irec
t con
sum
ptio
nof
ele
ctri
cal e
nerg
yM
Wh
14,7
0613
,889
12,1
6711
,201
12,0
0012
,222
11,1
0410
,536
8,32
69,
440
1.2
1.3
1.2
1.3
1.3
Effe
ctiv
e us
e of
mat
eria
ls
cons
umpt
ion
of m
ater
ials
for p
rodu
ctio
nt
11,3
3614
,480
9,68
710
,396
8,00
812
,222
11,1
0410
,536
8,32
69,
440
0.9
1.3
0.9
1.2
0.8
co
nsum
ptio
n of
wel
ding
mat
eria
lst
189
300
202
135
181
12,2
2211
,104
10,5
368,
326
9,44
00.
015
0.02
70.
019
0.01
60.
019
co
nsum
ptio
n of
pai
nts
t11
715
813
498
124
12,2
2211
,104
10,5
368,
326
9,44
00.
010
0.01
40.
013
0.01
20.
013
cons
umpt
ion
of n
atur
al g
asN
m3
666,
187
577,
030
514,
049
384,
711
453,
877
12,2
2211
,104
10,5
368,
326
9,44
054
.552
.048
.846
.248
.1
cons
umpt
ion
of o
xyge
nK
g47
4,30
046
4,10
042
5,26
842
4,62
050
4,30
012
,222
11,1
0410
,536
8,32
69,
440
38.8
41.8
40.4
51.0
53.4
co
nsum
ptio
n of
arg
onK
g40
9,62
046
0,22
044
2,67
034
6,28
042
6,42
012
,222
11,1
0410
,536
8,32
69,
440
33.5
41.4
42.0
41.6
45.2
co
nsum
ptio
n of
CO
2K
g7,
840
11,3
0011
,760
13,6
409,
820
12,2
2211
,104
10,5
368,
326
9,44
00.
61.
01.
11.
61.
0W
ater
co
nsum
ptio
n of
wat
erm
347
,190
54,4
2147
,451
34,5
2842
,870
12,2
2211
,104
10,5
368,
326
9,44
03.
94.
94.
54.
14.
5W
aste
am
ount
of g
ener
ated
was
tekg
3,56
4,11
33,
027,
724
4,03
4,98
23,
132,
988
2,63
4,10
112
,222
11,1
0410
,536
8,32
69,
440
291.
627
2.7
383.
037
6.3
279.
0
amou
nt o
f gen
erat
edha
zard
ous w
aste
kg26
,358
25,6
4340
,600
44,3
7336
,346
12,2
2211
,104
10,5
368,
326
9,44
02.
22.
33.
95.
33.
9
am
ount
of g
ener
ated
was
teot
her t
han
haza
rdou
skg
3,53
7,75
53,
002,
081
3,99
4,38
23,
088,
615
2,59
7,75
512
,222
11,1
0410
,536
8,32
69,
440
289.
527
0.4
379.
137
1.0
275.
2
Biod
iver
sity
la
nd u
se (d
evel
oped
plo
ts)
m2
180,
015
180,
015
180,
015
180,
015
180,
015
12,2
2211
,104
10,5
368,
326
9,44
014
.716
.217
.121
.619
.1Em
issio
ns
CO
2K
g14
,307
,000
11,0
93,0
0013
,205
,000
11,8
72,0
008,
467,
000
12,2
2211
,104
10,5
368,
326
9,44
01,
170.
699
9.0
1,25
3.3
1,42
5.9
896.
9
SO2
Kg
89,0
0068
,000
78,0
0076
,000
52,0
0012
,222
11,1
0410
,536
8,32
69,
440
7.3
6.1
7.4
9.1
5.5
N
oxK
g26
,000
20,0
0023
,000
22,0
0015
,000
12,2
2211
,104
10,5
368,
326
9,44
02.
11.
82.
22.
61.
6
solid
par
ticle
sPM
Kg
12,0
0010
,000
10,0
0010
,000
8,00
012
,222
11,1
0410
,536
8,32
69,
440
0.98
0.90
0.95
1.20
0.85
Sour
ce: R
AFA
KO
SA
env
iron
men
tal d
ecla
ratio
n 20
15, p
. 14
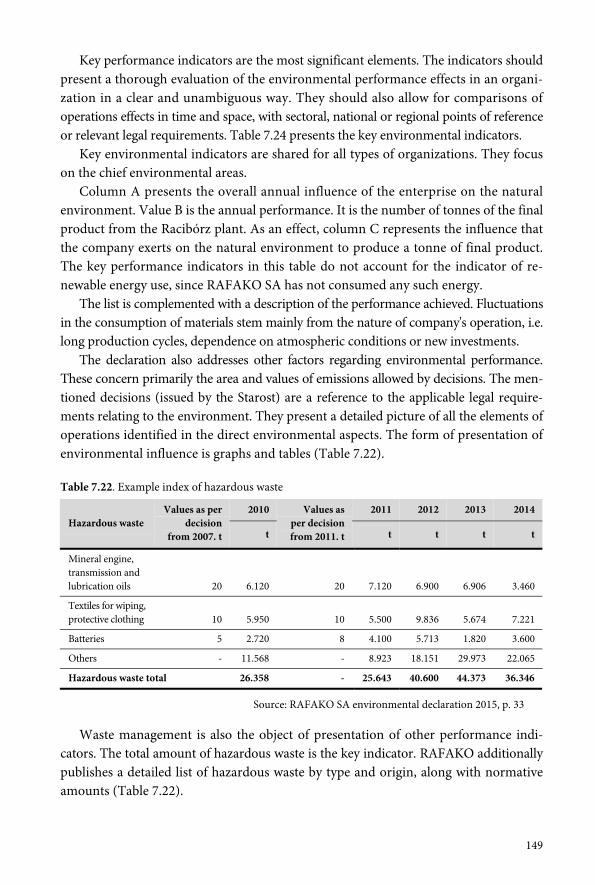
149
Key performance indicators are the most significant elements. The indicators shouldpresent a thorough evaluation of the environmental performance effects in an organi-zation in a clear and unambiguous way. They should also allow for comparisons ofoperations effects in time and space, with sectoral, national or regional points of referenceor relevant legal requirements. Table 7.24 presents the key environmental indicators.
Key environmental indicators are shared for all types of organizations. They focuson the chief environmental areas.
Column A presents the overall annual influence of the enterprise on the naturalenvironment. Value B is the annual performance. It is the number of tonnes of the finalproduct from the Racibórz plant. As an effect, column C represents the influence thatthe company exerts on the natural environment to produce a tonne of final product.The key performance indicators in this table do not account for the indicator of re-newable energy use, since RAFAKO SA has not consumed any such energy.
The list is complemented with a description of the performance achieved. Fluctuationsin the consumption of materials stem mainly from the nature of company's operation, i.e.long production cycles, dependence on atmospheric conditions or new investments.
The declaration also addresses other factors regarding environmental performance.These concern primarily the area and values of emissions allowed by decisions. The men-tioned decisions (issued by the Starost) are a reference to the applicable legal require-ments relating to the environment. They present a detailed picture of all the elements ofoperations identified in the direct environmental aspects. The form of presentation ofenvironmental influence is graphs and tables (Table 7.22).
Table 7.22. Example index of hazardous waste
2010 2011 2012 2013 2014Hazardous waste
Values as perdecision
from 2007. t t
Values asper decisionfrom 2011. t t t t t
Mineral engine,transmission andlubrication oils 20 6.120 20 7.120 6.900 6.906 3.460
Textiles for wiping,protective clothing 10 5.950 10 5.500 9.836 5.674 7.221
Batteries 5 2.720 8 4.100 5.713 1.820 3.600
Others - 11.568 - 8.923 18.151 29.973 22.065
Hazardous waste total 26.358 - 25.643 40.600 44.373 36.346
Source: RAFAKO SA environmental declaration 2015, p. 33
Waste management is also the object of presentation of other performance indi-cators. The total amount of hazardous waste is the key indicator. RAFAKO additionallypublishes a detailed list of hazardous waste by type and origin, along with normativeamounts (Table 7.22).
150
The other elements of the presentation are discharge of wastewater to surface wa-ter and utility management (coal, electrical energy, natural gas, oxygen, argon, CO2).
The last part of the declaration is the statement by the environmental verifier con-cerning verification and validation activities performed. It contains the name and ac-creditation or licence number of the environmental verifier and the date of validation.
7.5.3. Place of the EMAS environmental declaration within the system of external reporting
Environmental declaration is separate from annual, semi-annual, quarterly or currentreports. Data published in the declaration in the case of RAFAKO do not have anyequivalents in financial reporting. As regards the scope of disclosure, however, it isone of the reports named by the EU Directive on the harmonization of structure andscope of non-financial information published by enterprises.
As pointed out by J. Nycz - Wróbel, the form of presentation and the scopes of en-vironmental performance indicators naturally differ between entities depending onthe type of their operations. However, even in the case of organizations running similaroperations, the form of presenting this information may differ in terms of, e.g. numberof pages devoted in the declaration for presentation of this information, form of pres-entation (one table, a number of tables, graphs), measurement units used to presentthe indicator values (number A and B), time spans, for which the indicators are given.These various differences render the analysis of information regarding environmentalperformance indicators a very difficult and time-consuming exercise. 25
7.6. Final remarks
To summarise the consideration on environmental reporting, it must be emphasizedthat reports are some of the most crucial documents applied in environmental man-agement. The basis of environmental reporting are measurements of the degree towhich enterprises' operations influence the various individual elements of the naturalenvironment. Research regarding this degree is conducted either by in-house labora-tories and environmental protection departments of by appropriately accredited exter-nal companies. Measurement records are kept at the departments which conduct themeasurements and at the Environmental Protection Department. Enterprises draw upinternal reports which serve as a basis for managerial decisions as well as external re-ports pursuant to requirements of legal provisions. External reports are drawn upon a regular basis: each month, each quarter or annually. Internal reports are primarilyof occasional nature and are drafted in response to the needs of the Management Board.
25 J. Nycz-Wróbel, Różnice w sposobie prezentowania informacji dotyczących wskaźników efektyw-ności środowiskowej, Humanities and Social Sciences, vol. XIX, no. 21 (3/2014), pp. 173-184.
151
It should be emphasized that both internal and external reports are interim reportsand focus on specific elements of the natural environment. Water contaminationlevel, level of emission of dusts and gases to the atmosphere, level of waste and the de-gree of its management or the influence of operation on earth surface are all reportedseparately. Reports are sent to the Voivodeship Inspectorate of Environmental Pro-tection, to the Central Inspectorate of Environmental Protection, to the VoivodeshipMarshal, to the Central Statistical Office, to the National Centre for Emissions Balancingand Management and to other institutions interested in the influence exerted by eco-nomic entities on the natural environment. Pursuant to the permits, compliance withenvironmental standards and unit costs connected with emissions, the amounts of en-vironmental fees are established. Those may amount to a considerable part of fixedcosts of enterprises' operations.

C H A P T E R 8
Cost management with accountof sustainable development at Aquanet
8.1. Introductory remarks
Aquanet SA is a water supply and wastewater company serving the Poznań agglom-eration, with a population of ca. 800 thousand inhabitants. The tariff regulators as re-gards water supply and wastewater collection, and at the same time the owners of theenterprise, are local councils competent for the territory of the company’s operation.
The analyzed enterprise manages its costs strategically, and benchmarking is themain tool used in the shaping of amount and structure of costs in the long run, as re-gards value creation with account of environmental and social aspects.
The opportunities and determinants for increasing enterprise eco-efficiency in theoperational sphere have been presented in the collective work entitled 'Green Con-trolling and Finance. Theoretical Framework', while the purpose of this chapter is topresent the effects of cost management in sustainable development with particularemphasis on environmental aspects at Aquanet.
8.2. Cost management at Aquanet SA
Water supply and wastewater companies are characterized by a high share of fixed costsunderstood as property-related costs1. The share of property-related costs in the waterand wastewater tariffs in selected cities of Poland have been presented in graph 8.1.
1 'Property-related costs' are understood as costs incurred by an enterprise in association with themanufacture or acquisition of new assets. In the case of water supply and wastewater companies,these 'property-related costs' entail: depreciation costs, real property taxes, fees for installation ofinfrastructure within road reserves and financial costs related to financing asset acquisition.(Chudziński, 2014)
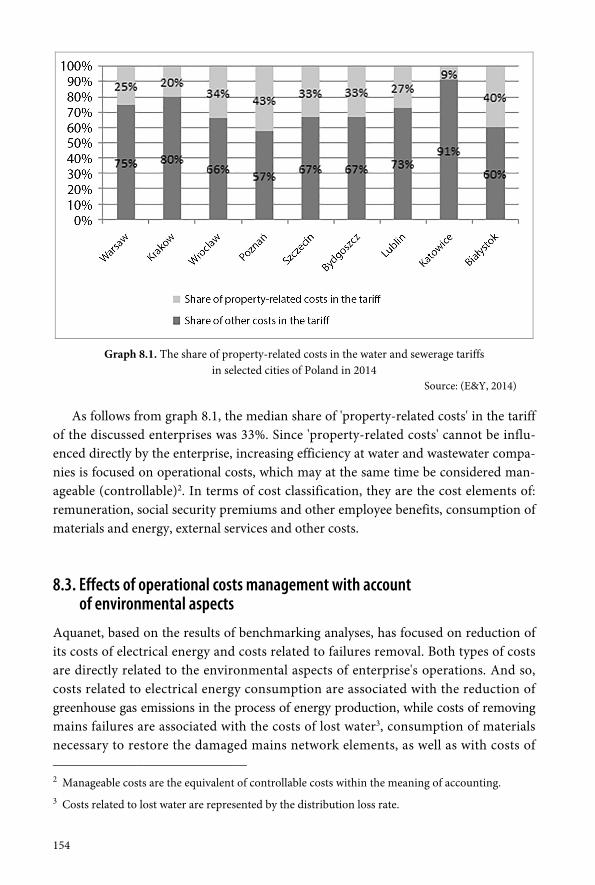
154
Graph 8.1. The share of property-related costs in the water and sewerage tariffsin selected cities of Poland in 2014
Source: (E&Y, 2014)
As follows from graph 8.1, the median share of 'property-related costs' in the tariffof the discussed enterprises was 33%. Since 'property-related costs' cannot be influ-enced directly by the enterprise, increasing efficiency at water and wastewater compa-nies is focused on operational costs, which may at the same time be considered man-ageable (controllable)2. In terms of cost classification, they are the cost elements of:remuneration, social security premiums and other employee benefits, consumption ofmaterials and energy, external services and other costs.
8.3. Effects of operational costs management with accountof environmental aspects
Aquanet, based on the results of benchmarking analyses, has focused on reduction ofits costs of electrical energy and costs related to failures removal. Both types of costsare directly related to the environmental aspects of enterprise's operations. And so,costs related to electrical energy consumption are associated with the reduction ofgreenhouse gas emissions in the process of energy production, while costs of removingmains failures are associated with the costs of lost water3, consumption of materialsnecessary to restore the damaged mains network elements, as well as with costs of
2 Manageable costs are the equivalent of controllable costs within the meaning of accounting.3 Costs related to lost water are represented by the distribution loss rate.
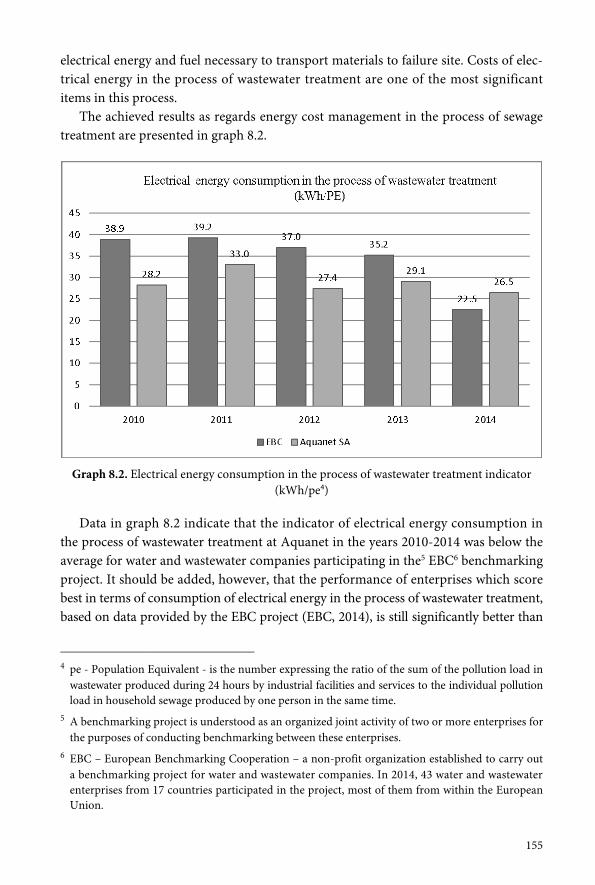
155
electrical energy and fuel necessary to transport materials to failure site. Costs of elec-trical energy in the process of wastewater treatment are one of the most significantitems in this process.
The achieved results as regards energy cost management in the process of sewagetreatment are presented in graph 8.2.
Graph 8.2. Electrical energy consumption in the process of wastewater treatment indicator(kWh/pe4)
Data in graph 8.2 indicate that the indicator of electrical energy consumption inthe process of wastewater treatment at Aquanet in the years 2010-2014 was below theaverage for water and wastewater companies participating in the5 EBC6 benchmarkingproject. It should be added, however, that the performance of enterprises which scorebest in terms of consumption of electrical energy in the process of wastewater treatment,based on data provided by the EBC project (EBC, 2014), is still significantly better than
4 pe - Population Equivalent - is the number expressing the ratio of the sum of the pollution load inwastewater produced during 24 hours by industrial facilities and services to the individual pollutionload in household sewage produced by one person in the same time.
5 A benchmarking project is understood as an organized joint activity of two or more enterprises forthe purposes of conducting benchmarking between these enterprises.
6 EBC – European Benchmarking Cooperation – a non-profit organization established to carry outa benchmarking project for water and wastewater companies. In 2014, 43 water and wastewaterenterprises from 17 countries participated in the project, most of them from within the EuropeanUnion.
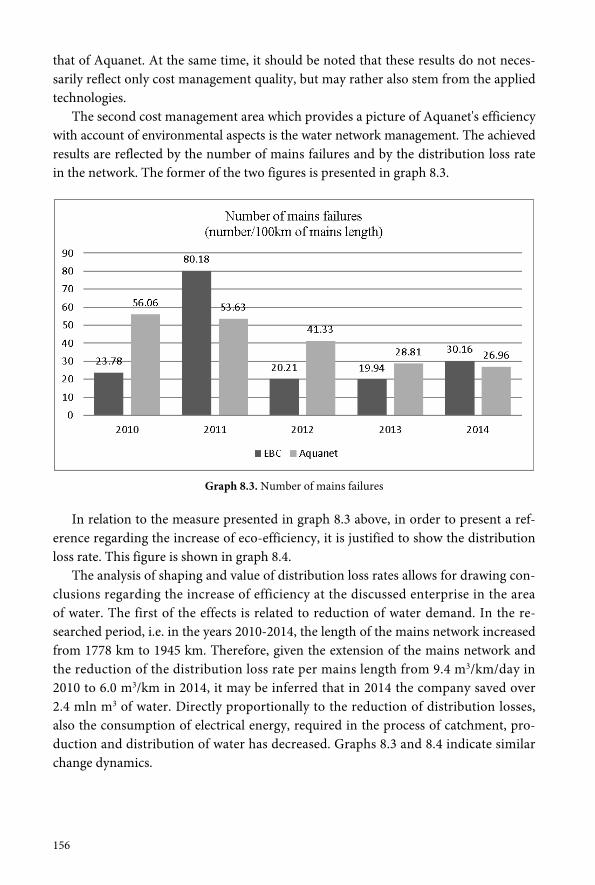
156
that of Aquanet. At the same time, it should be noted that these results do not neces-sarily reflect only cost management quality, but may rather also stem from the appliedtechnologies.
The second cost management area which provides a picture of Aquanet's efficiencywith account of environmental aspects is the water network management. The achievedresults are reflected by the number of mains failures and by the distribution loss ratein the network. The former of the two figures is presented in graph 8.3.
Graph 8.3. Number of mains failures
In relation to the measure presented in graph 8.3 above, in order to present a ref-erence regarding the increase of eco-efficiency, it is justified to show the distributionloss rate. This figure is shown in graph 8.4.
The analysis of shaping and value of distribution loss rates allows for drawing con-clusions regarding the increase of efficiency at the discussed enterprise in the areaof water. The first of the effects is related to reduction of water demand. In the re-searched period, i.e. in the years 2010-2014, the length of the mains network increasedfrom 1778 km to 1945 km. Therefore, given the extension of the mains network andthe reduction of the distribution loss rate per mains length from 9.4 m3/km/day in2010 to 6.0 m3/km in 2014, it may be inferred that in 2014 the company saved over2.4 mln m3 of water. Directly proportionally to the reduction of distribution losses,also the consumption of electrical energy, required in the process of catchment, pro-duction and distribution of water has decreased. Graphs 8.3 and 8.4 indicate similarchange dynamics.
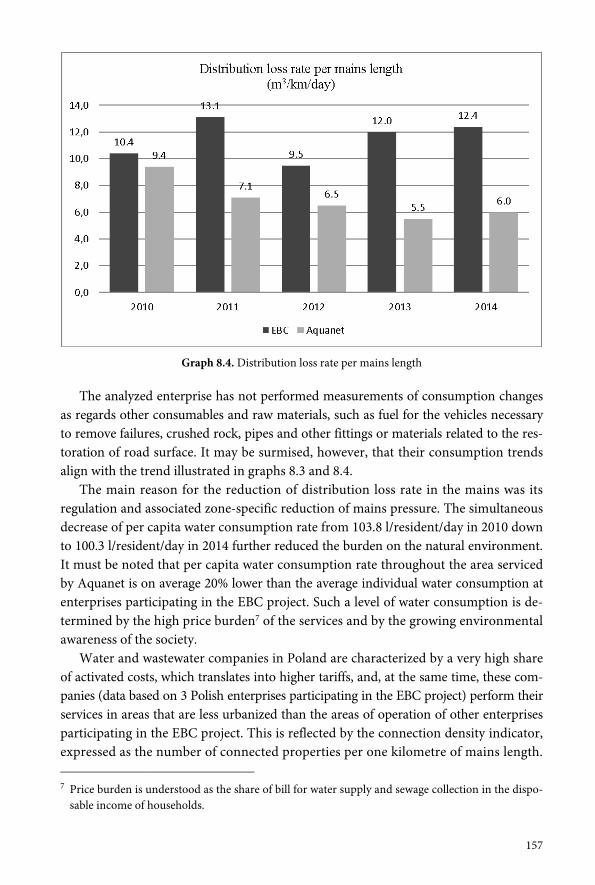
157
Graph 8.4. Distribution loss rate per mains length
The analyzed enterprise has not performed measurements of consumption changesas regards other consumables and raw materials, such as fuel for the vehicles necessaryto remove failures, crushed rock, pipes and other fittings or materials related to the res-toration of road surface. It may be surmised, however, that their consumption trendsalign with the trend illustrated in graphs 8.3 and 8.4.
The main reason for the reduction of distribution loss rate in the mains was itsregulation and associated zone-specific reduction of mains pressure. The simultaneousdecrease of per capita water consumption rate from 103.8 l/resident/day in 2010 downto 100.3 l/resident/day in 2014 further reduced the burden on the natural environment.It must be noted that per capita water consumption rate throughout the area servicedby Aquanet is on average 20% lower than the average individual water consumption atenterprises participating in the EBC project. Such a level of water consumption is de-termined by the high price burden7 of the services and by the growing environmentalawareness of the society.
Water and wastewater companies in Poland are characterized by a very high shareof activated costs, which translates into higher tariffs, and, at the same time, these com-panies (data based on 3 Polish enterprises participating in the EBC project) perform theirservices in areas that are less urbanized than the areas of operation of other enterprisesparticipating in the EBC project. This is reflected by the connection density indicator,expressed as the number of connected properties per one kilometre of mains length.
7 Price burden is understood as the share of bill for water supply and sewage collection in the dispo-sable income of households.
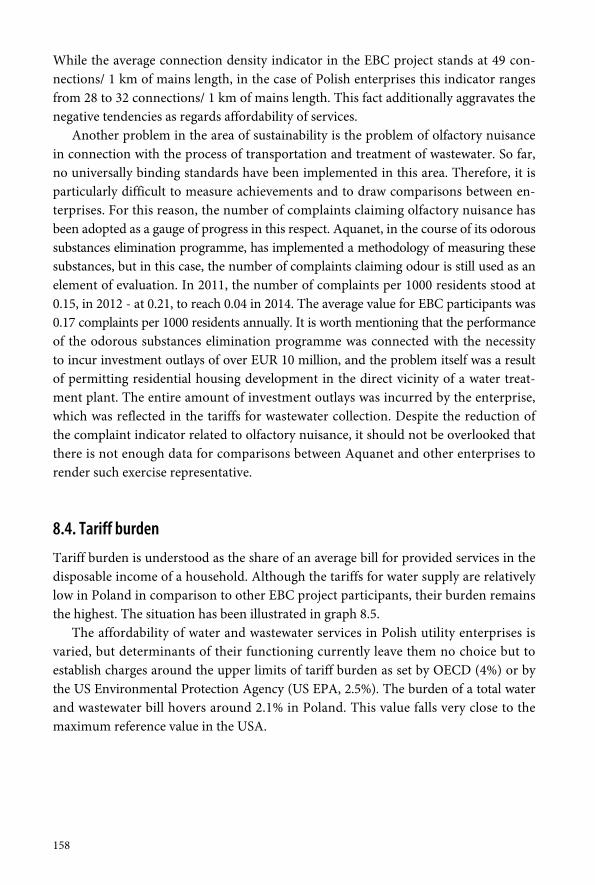
158
While the average connection density indicator in the EBC project stands at 49 con-nections/ 1 km of mains length, in the case of Polish enterprises this indicator rangesfrom 28 to 32 connections/ 1 km of mains length. This fact additionally aggravates thenegative tendencies as regards affordability of services.
Another problem in the area of sustainability is the problem of olfactory nuisancein connection with the process of transportation and treatment of wastewater. So far,no universally binding standards have been implemented in this area. Therefore, it isparticularly difficult to measure achievements and to draw comparisons between en-terprises. For this reason, the number of complaints claiming olfactory nuisance hasbeen adopted as a gauge of progress in this respect. Aquanet, in the course of its odoroussubstances elimination programme, has implemented a methodology of measuring thesesubstances, but in this case, the number of complaints claiming odour is still used as anelement of evaluation. In 2011, the number of complaints per 1000 residents stood at0.15, in 2012 - at 0.21, to reach 0.04 in 2014. The average value for EBC participants was0.17 complaints per 1000 residents annually. It is worth mentioning that the performanceof the odorous substances elimination programme was connected with the necessityto incur investment outlays of over EUR 10 million, and the problem itself was a resultof permitting residential housing development in the direct vicinity of a water treat-ment plant. The entire amount of investment outlays was incurred by the enterprise,which was reflected in the tariffs for wastewater collection. Despite the reduction ofthe complaint indicator related to olfactory nuisance, it should not be overlooked thatthere is not enough data for comparisons between Aquanet and other enterprises torender such exercise representative.
8.4. Tariff burden
Tariff burden is understood as the share of an average bill for provided services in thedisposable income of a household. Although the tariffs for water supply are relativelylow in Poland in comparison to other EBC project participants, their burden remainsthe highest. The situation has been illustrated in graph 8.5.
The affordability of water and wastewater services in Polish utility enterprises isvaried, but determinants of their functioning currently leave them no choice but toestablish charges around the upper limits of tariff burden as set by OECD (4%) or bythe US Environmental Protection Agency (US EPA, 2.5%). The burden of a total waterand wastewater bill hovers around 2.1% in Poland. This value falls very close to themaximum reference value in the USA.
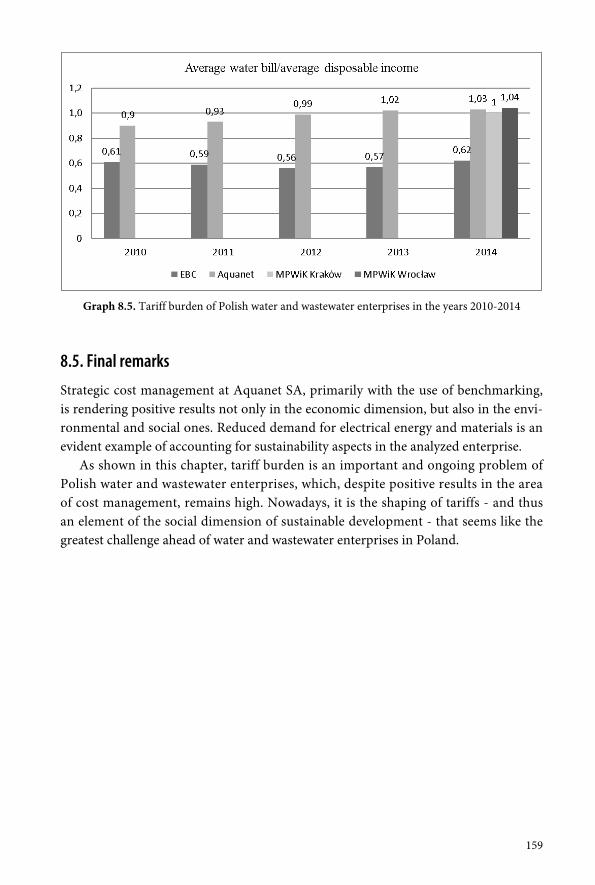
159
Graph 8.5. Tariff burden of Polish water and wastewater enterprises in the years 2010-2014
8.5. Final remarks
Strategic cost management at Aquanet SA, primarily with the use of benchmarking,is rendering positive results not only in the economic dimension, but also in the envi-ronmental and social ones. Reduced demand for electrical energy and materials is anevident example of accounting for sustainability aspects in the analyzed enterprise.
As shown in this chapter, tariff burden is an important and ongoing problem ofPolish water and wastewater enterprises, which, despite positive results in the areaof cost management, remains high. Nowadays, it is the shaping of tariffs - and thusan element of the social dimension of sustainable development - that seems like thegreatest challenge ahead of water and wastewater enterprises in Poland.

C H A P T E R 9
Investment project appraisal with account of environmentaland social aspects at Aquanet and Amica
9.1. Introductory remarks
In economic practice, there are many different methods of investment project ap-praisal that may be employed. This appraisal may be approached from a number ofangles. The classic methodology of investment appraisal adopts the shareholder'spoint of view. Accounting for environmental and social determinants in the analysisof investment opportunities shifts the appraisal perspective to align it with that of theentire society1.
The purpose of this chapter is to present the practical aspects of employment ofvarious approaches to investment profitability appraisal and various assessment meth-ods in the operations of enterprises such as Aquanet and Amica. The achievement ofthis goal dictated case studies as the research method of choice, as well as determinedthe layout of the chapter. First, Aquanet's approach to investment project assessmentis characterized. Next, methodological solutions applied at the company in referenceto business projects are presented. They are dominated by the employment of finan-cial methods of investment appraisal. What follows is an example of evaluation of so-cial impacts of an investment project carried out by Aquanet. This topic is then elabo-rated with a description of a possible approach to valuation of social impacts as part ofcost-benefit analysis, illustrated with the example of traffic congestion in Poznań.Lastly, the chapter provides a characterization of methodological solutions applied inassessment of investment projects at Amica.
1 Different perspectives applied in investment project appraisal, as well as methods employed in thevarious approaches have been discussed in: [Nowicki 2016]. The classic methods used in the capi-tal budgeting process, adopting the shareholder perspective, such as NPV or IRR, are referred totherein as financial methods of investment appraisal, while the assessment performed from theperspective of the entire society and accounting for various environmental and social aspects isperformed with non-financial methods of investment appraisal.
162
9.2. Approach to investment project appraisal at Aquanet
Aquanet is very active in the process of analysis and performance of investment projects,which is attested to by the fact that in the years 2013-2014, it allocated PLN 473 mln asinvestment outlays on tasks such as: modernization of the water treatment station inMosina, hermetization of the Central Wastewater Treatment Plant tanks, constructionof a sanitary sewer in Kamionki, protection of the acquifier zone Marlewo, moderni-zation of the wastewater treatment plant in Mosina or the construction of a trunksewer under Al. Niepodległości in Poznań [Aquanet Investments 2016]. The companyhas no intention of stopping at the above investments, as it is in the process of completingthe largest investment programme in the history of the enterprise [Aquanet 2015d,p. 10] and, moreover, continuous investments are in a way at the core of company'smission - the list of design documentation in progress covers 74 items [Aquanet In-vestments 2016].
The approach of Aquanet to the appraisal of investment projects carried out bythe enterprise could be referred to as rational and deeply rooted in business reality.This is due to the fact that the decision on whether to perform an investment projectappraisal and, if the answer is yes, to what extent, is driven by rational premises pro-vided by the analysis of company's operations. From the perspective of the considera-tions in this chapter, investment projects pursued by the company may be divided intothree groups [Aquanet 2016c]:
investment projects related to the expansion of the water network, investment projects related to operations above and beyond the regular op-
erations of this entity, but not related to the expansion of the water network(business projects),
investment projects with a significant impact on the natural and social envi-ronment.
This division is significant owing to the scope of performed investment appraisalanalyses, as, in the case of investments related to the expansion of the water networkappraisals are not carried out at all; in the case of investment projects above and be-yond the regular operations of the entity, such formal profitability analyses are per-formed for internal needs; whereas in the case of investment projects with a significantimpact on the natural and social environment, analysis of this impact is considered.
The reason that the company does not perform any analyses of profitability of in-vestment projects related to the expansion of its network is that expansion is under-taken based on premises other than their feasibility to the company. As regards thistype of projects, neither the net present value nor the internal rate of return are known,since no formal profitability analysis is performed. One fitting example of this type ofproject is connection of a new housing estate to the water network.
163
As regards other investment projects above and beyond the regular activities of theentity, formal profitability appraisals, focusing on the assessment of financial feasibility2,are prepared for internal needs. The relevant decision on performance or rejection ofan investment project is made based on the outcome of this analysis and the resultantrecommendation. For example, investment projects of this type considered in 2015,entailed [Aquanet 2015g]:
Left-bank Wastewater Treatment Plant (LWTP), bioreactors - replacement ofcurrent compressors and blowers with more energy-efficient equipment,
Water Treatment Station (WTS) Wiśniowa - electrical and heat energy supply(heat pumps, power generation unit, replacement of piping),
decommissioning of the wastewater treatment plant in Chludowo, WTS Mosina - carbon filters washings recirculation, construction of a secondary disinfection point on the eastern main in Czapury, the option to supply water to Zielątkowo, Golęczewo, Chludowo and Rokietnica
from the Poznań Water Network System (PWNS), LWTP - replacement of positive displacement pumps with rotary pumps in the
sludge recirculation system, construction of an installation to transfer post-filtration sludge from WTS Mosina
to the Central Wastewater Treatment Plant (CWTP), electrical energy supply for the Water Intake Promienko, LWTP - construction of a CNG fuelling station.
As regards investment projects with a significant impact on the social and naturalenvironment, the company considers performance of a social and environmental im-pact analysis, which would represent a case of application of non-financial methods ofinvestment appraisal. In such a situation, analysis results are taken into account in thedecision-making process. One example of such a project is the construction of theright-bank trunk sewer II in Poznań.
However, even in the case of investment projects for which a formal analysisof social or environmental impacts is not performed, Aquanet naturally, owing tothe profile of its operations, puts great emphasis on environmental and social issues.Moreover, the financing of a considerable share of investment outlays incurred by thecompany from the EU Cohesion Fund under the Infrastructure and EnvironmentProgramme [Aquanet and EU 2016] forces the company to achieve the so-calledenvironmental effect [Aquanet 2015d, p. 49]. Therefore, environmental and socialaspects are significant determinants in Aquanet's making of investment decisions
2 The division of investment profitability appraisal methods into financial and non-financial methods
is discussed in [Nowicki 2016].
164
[Lasocka-Gomuła 2008, pp. 8-11]. What follows are examples of investment projects witha significant impact on the social and natural environment [Aquanet 2015d, pp. 37-49]:
modernization of the Wastewater Treatment Plant in Mosina (pro-social andpro-environmental project),
modernization of the Water Treatment Station in Mosina (pro-social and pro-environmental project),
construction of a combined trunk sewer with storm overflow beneath Al. Nie-podległości in Poznań (project of significant social impact - an important com-munication route in downtown Poznań, under custody of the Municipal Officeof Heritage Preservation, archeological works),
modernization of the sanitary sewer in the Sołacz residential estate in Poznań(pro-environmental project),
new building of the 100-years-old 'Garbary' Wastewater Pumping Plant (strictcustody of the Municipal Office of Heritage Preservation),
construction of the Junikowo trunk sewer (pro-social project with a plan ofcompensation planting),
construction of the Umultowo-Suchy Las trunk sewer (pro-social project), works on sludge management and generation of energy from biogas (pro-
environmental project), introduction of co-digestion to company's plants (pro-environmental project), odour reduction programme at Aquanet SA (among others, hermetization of
sedimentation tanks at wastewater treatment plants - pro-environmental andpro-social project).
9.3. Business investment project appraisal at Aquanet
Financial appraisal of profitability is performed for investment projects that go beyondand above the regular operations of the entity, other than expansion of the water net-work. The financial methods of investment appraisal employed at the company include[Aquanet 2015a, 2015b, 2015c, 2015e, 2015f]:
net present value (NPV), internal rate of return (IRR), net present value ratio (NPVR), payback period (PP), discounted payback period (DPP).
165
The modified internal rate of return, or MIRR, is not calculated in the analyses,and neither is the modified net present value, MNPV.
Moreover, the appraisal based on the net present value is performed according totwo methodological approaches:
in reference to the detailed forecast period only, in reference to the detailed forecast period with account of the investment value
after the lapse of this period (residual value).
Investment appraisal reports at Aquanet typically involve the following elements[Aquanet 2015a, 2015b, 2015c, 2015e, 2015f]:
definition of the purpose and object of analysis, discussion of analyzed variants, indication of data sources, description of the main technological and financial assumptions, description of the material scope and of investment outlays, presentation of a time schedule, discussion of changes in revenues and costs (savings, additional operating costs), presentation of analysis results, summary, which is finalized with a recommendation as to the advisability of
the analyzed investment endeavour.
Although this is not expressly stated in Aquanet's investment appraisal reports, theanalysis of financial models of individual investment endeavours shows that the de-tailed method of formulating discounted cash flows is the free cash flow to equity, orFCFE method3, although in the case of investment projects for the analytical needs ofwhich the company assumed financing from equity, without the use of debt, thesecash flows are identical to those under FCFF method.
The analysis of Aquanet's investment appraisal reports indicates that the main de-cision-making criteria are the net present value and the discounted payback period.This, and especially the focus on NPV in the decision-making process, is in line withthe most universal recommendations on making investment decisions to be found inthe literature of the subject.
3 This is one of the two most frequent methods of defining cash flows subject to discounting, besidesthe free cash flow to firm (FCFF) method. More on this subject: [Nowicki 2016].
166
9.4. Example of evaluation of social impacts of an investment projectat Aquanet
The project of construction of the right-bank trunk sewer II in Poznań, executed in2010-2012, may be used as a fitting example of an investment project with a significantimpact on the social environment. At the pre-investment stage, Aquanet, fully awareof the significant repercussions of this project for the social environment, decided toperform an analysis of its social impacts. This task was commissioned to an externalcompany, and the final outcome was the report drafted in June 2008 [Grontmij 2008].
This endeavour was to consist in the construction of a 4 km-long sanitary trunksewer with a diameter of 1.8-2.4 m, in the section from Główna Street to the intersectionof Milczańska and Bolesława Krzywoustego Streets in Poznań, as well as of a 1 km-longstorm water trunk sewer with a diameter of 1.2 m beneath Berdychowo Street. Thepurpose of this project was to relieve the sewer system in the right-bank part ofPoznań. It was planned that, upon completion, the right-bank trunk sewer II woulddeliver wastewater to the Central Wastewater Treatment Plant, among others fromthe areas of Łacina, Szczepankowo, Starołęka, Żegrze and Swarzędz, while the stormwater trunk sewer was to act as an outlet for precipitation from the non-connectedpart of Łacina and regions of Rataje [Right-bank trunk sewer II 2016]. Owing to theconsiderable size of the trunk sewer and its planned location, the endeavour was tocause road nuisances to the residents, even though a part of works was to take place byway of microtunneling, it was not possible to avoid the open-excavation method aswell [Right-bank trunk sewer II 2016].
Considering the above, the aim of the analysis was to determine the lower limitof social costs [Grontmij 2008, p. 4]. The objective associated with this and resultingfrom the analysis, was to find justification for signing a time incentive contract withthe contractor, which would contain a financial incentive for the quickest possiblecompletion of works, thus leading to reduction of the social costs [Grontmij 2008,pp. 17, 19].
The performed social costs analysis was based on the methodology of cost-benefitanalysis (CBA). The analysis used the notion of willingness to pay (WTP) and methodsof monetization of unquantified external effects such as [Grontmij 2008, s. 4-5]4:
travel cost method, benefit transfer method, productivity analysis method.
4 The fundamentals of cost-benefit analysis have been discussed, among others, in: [Nowicki 2016].The work also provides a brief characterization of the key methods of monetization of unquantifiedexternal effects in the economic appraisal of investment projects [Nowicki 2016].
167
The analysis provides an explanation on why the following methods were notapplied [Grontmij 2008, p. 5]:
hedonic pricing, contingent valuation method.
In the course of the performed analysis, it was possible to quantify the followingsocial costs [Grontmij 2008, pp. 10-14]:
increased costs of vehicle operation, cost of the increased commute time in passenger and freight car transportation, costs of the increased emission of exhaust fume components, cost of the decreased recreational attractiveness of the Malta Lake and its
surroundings, potential cost of losing the chance to host the World Rowing Cup.
Besides, the analysis lists social costs which could not be successfully expressed asa monetary value, such as [Grontmij 2008, p. 14]:
cost of the increased time of tram commutes, delay or suspension of other investment projects located close to the construction
site of the right-bank trunk sewer II, temporary loss of value of real estate in the vicinity of the trunk sewer construction, costs of accidents, difficulties with traffic coordination/telematics systems of the City of Poznań, slowdown of car traffic on streets in the vicinity of the trunk sewer construction, decrease in numbers of customers of the nearby Galeria Malta shopping mall in
the investment period.
From the methodological perspective, it should be noted that the authors of theanalysis have limited themselves to the valuation of social costs of the consideredinvestment project in search for a justification of proposing a time incentive contractto the investment contractor. The analysis points out possible social benefits of theinvestment, but no attempts were made to quantify them [Grontmij 2008, pp. 17-18].As a result, it was not possible to perform a global assessment of the social costs andbenefits generated by the investment endeavour in question. What must be considereda shortcoming of the performed valuation is the fact that the social costs account wasprovided in nominal values for the expected period of works estimated at 24 months,and so the time value of money was not accounted for. The analysis did not employany of the non-financial methods of investment appraisal, which are the crowing ofthe economic analysis conducted under the CBA, such as:
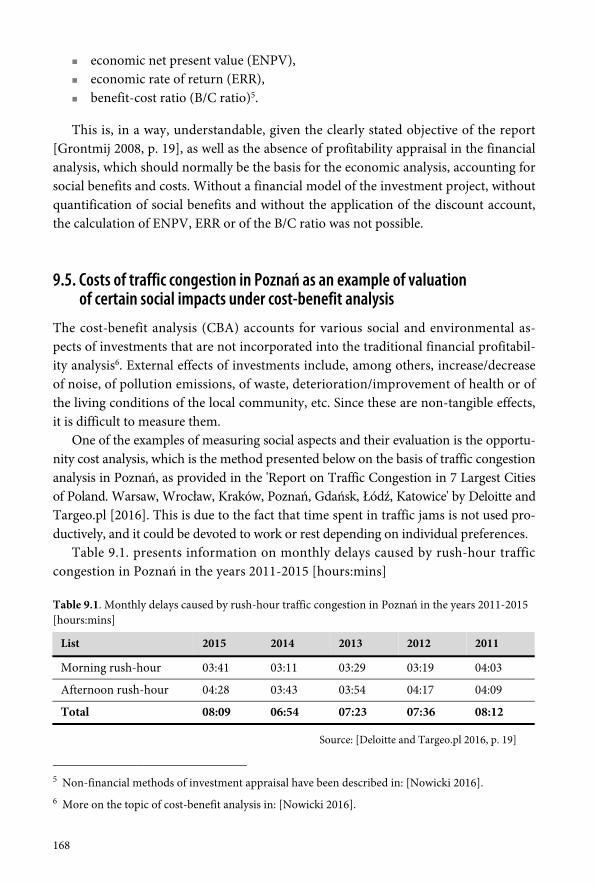
168
economic net present value (ENPV), economic rate of return (ERR), benefit-cost ratio (B/C ratio)5.
This is, in a way, understandable, given the clearly stated objective of the report[Grontmij 2008, p. 19], as well as the absence of profitability appraisal in the financialanalysis, which should normally be the basis for the economic analysis, accounting forsocial benefits and costs. Without a financial model of the investment project, withoutquantification of social benefits and without the application of the discount account,the calculation of ENPV, ERR or of the B/C ratio was not possible.
9.5. Costs of traffic congestion in Poznań as an example of valuationof certain social impacts under cost-benefit analysis
The cost-benefit analysis (CBA) accounts for various social and environmental as-pects of investments that are not incorporated into the traditional financial profitabil-ity analysis6. External effects of investments include, among others, increase/decreaseof noise, of pollution emissions, of waste, deterioration/improvement of health or ofthe living conditions of the local community, etc. Since these are non-tangible effects,it is difficult to measure them.
One of the examples of measuring social aspects and their evaluation is the opportu-nity cost analysis, which is the method presented below on the basis of traffic congestionanalysis in Poznań, as provided in the 'Report on Traffic Congestion in 7 Largest Citiesof Poland. Warsaw, Wrocław, Kraków, Poznań, Gdańsk, Łódź, Katowice' by Deloitte andTargeo.pl [2016]. This is due to the fact that time spent in traffic jams is not used pro-ductively, and it could be devoted to work or rest depending on individual preferences.
Table 9.1. presents information on monthly delays caused by rush-hour trafficcongestion in Poznań in the years 2011-2015 [hours:mins]
Table 9.1. Monthly delays caused by rush-hour traffic congestion in Poznań in the years 2011-2015[hours:mins]
List 2015 2014 2013 2012 2011
Morning rush-hour 03:41 03:11 03:29 03:19 04:03
Afternoon rush-hour 04:28 03:43 03:54 04:17 04:09
Total 08:09 06:54 07:23 07:36 08:12
Source: [Deloitte and Targeo.pl 2016, p. 19]
5 Non-financial methods of investment appraisal have been described in: [Nowicki 2016].6 More on the topic of cost-benefit analysis in: [Nowicki 2016].
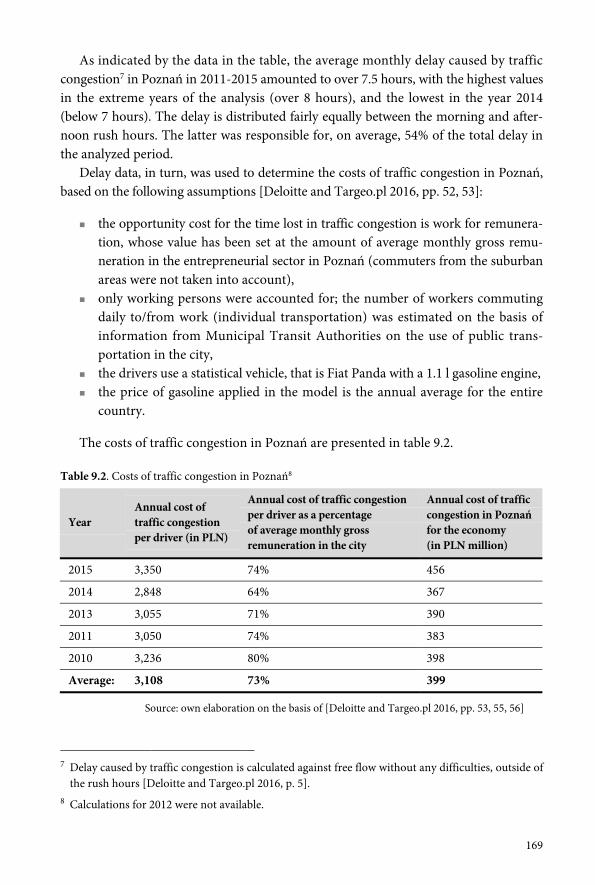
169
As indicated by the data in the table, the average monthly delay caused by trafficcongestion7 in Poznań in 2011-2015 amounted to over 7.5 hours, with the highest valuesin the extreme years of the analysis (over 8 hours), and the lowest in the year 2014(below 7 hours). The delay is distributed fairly equally between the morning and after-noon rush hours. The latter was responsible for, on average, 54% of the total delay inthe analyzed period.
Delay data, in turn, was used to determine the costs of traffic congestion in Poznań,based on the following assumptions [Deloitte and Targeo.pl 2016, pp. 52, 53]:
the opportunity cost for the time lost in traffic congestion is work for remunera-tion, whose value has been set at the amount of average monthly gross remu-neration in the entrepreneurial sector in Poznań (commuters from the suburbanareas were not taken into account),
only working persons were accounted for; the number of workers commutingdaily to/from work (individual transportation) was estimated on the basis ofinformation from Municipal Transit Authorities on the use of public trans-portation in the city,
the drivers use a statistical vehicle, that is Fiat Panda with a 1.1 l gasoline engine, the price of gasoline applied in the model is the annual average for the entire
country.
The costs of traffic congestion in Poznań are presented in table 9.2.
Table 9.2. Costs of traffic congestion in Poznań8
YearAnnual cost oftraffic congestionper driver (in PLN)
Annual cost of traffic congestionper driver as a percentageof average monthly grossremuneration in the city
Annual cost of trafficcongestion in Poznańfor the economy(in PLN million)
2015 3,350 74% 456
2014 2,848 64% 367
2013 3,055 71% 390
2011 3,050 74% 383
2010 3,236 80% 398
Average: 3,108 73% 399
Source: own elaboration on the basis of [Deloitte and Targeo.pl 2016, pp. 53, 55, 56]
7 Delay caused by traffic congestion is calculated against free flow without any difficulties, outside ofthe rush hours [Deloitte and Targeo.pl 2016, p. 5].
8 Calculations for 2012 were not available.
170
As follows from the data presented in the table, the average annual cost of trafficcongestion per driver in Poznań amounts to ca. PLN 3,108, which represents nearly73% of the average monthly gross remuneration in this city. The highest costs wereobserved in the extreme years of the analysis, especially in 2010, when they reachedPLN 3,236, i.e. 80% of the average gross monthly remuneration at that time. The lowestvalues were observed in 2014, amounting to PLN 2,848 and 64% respectively.
The presented calculation also accounts for the annual cost of traffic congestion inPoznań for the Polish economy, which is the difference between costs to drivers (fueland opportunity cost) and revenues to the state budget (from VAT and fuel excise tax)[Deloitte and Targeo.pl 2016, p. 56]. The average cost on account of this in the ana-lyzed period amounted to nearly PLN 400 million, and it turned out to be the highestin 2015 (PLN 456 million).
According to the authors of this research [Deloitte and Targeo.pl 2016, p. 53], 'dataand assumptions adopted in our calculations seem conservative, it is therefore highlyprobable that the economic assessment of opportunity costs of traffic congestion incities is underestimated'.
This happens for a number of reasons. Firstly, the costs of traffic congestion in thismodel only adopt conservative premises, such as those regarding the statistical vehicledriven by working persons or the price of gasoline, which has been established at theannual average for the entire country (while in cities these prices can be higher), and,secondly, the model does not incorporate environmental and health costs (such as ex-haust fumes, noise, etc.).
9.6. Investment project appraisal at Amica group
Owing to the group's dynamic development, it pursues a number of investment proj-ects in various areas of activity. The performed investment projects may be dividedinto the following categories [Amica 2016]:
investments to increase production capacities and to further the developmentof new technologies,
investments oriented on product development, IT projects, other investments.
The company has a formalized system for investment project appraisal, which isa part of the project management system [Amica 2016]. Each year, the corporate groupdrafts a development plan which defines the expected investment outlays. Annual de-velopment plans must be in line with the longterm investment plan drawn up in thecourse of setting the company strategy. At that stage, the proposed investment projects
171
were scored according to criteria such as project profitability, level of strategy support,risk level [Amica 2016]. Prior to the performance of a project, it is thoroughly assessedin terms of profitability. A report from this appraisal is performed for the internaldecision-making needs of the company. Investment appraisal at Amica focuses onthe financial issues, and the primary methods applied by the company are net presentvalue (NPV) and the internal rate of return (IRR) [Amica 2016]. Non-financial methodsof investment appraisal are not employed at the company [Amica 2016].
The cohesion and consistency of Amica, reflected in the compliance between de-clared objectives of company's operations and the applied methods of investment ap-praisal, are noteworthy. Since the declared objective of the company is to create valuefor shareholders [Rutkowski 2015, p. 1; Amica 2015, p. 18, 27-28; Amica 2014, p. 8],the most fitting method of investment appraisal is the one based on net present value,a measure fully aligned with thus formulated objective of operations.
The fact that Amica considers the financial methods of investment appraisal to bedecisive, does not mean that it does not account for environmental and social aspectsin its investment operations. These are incorporated on many different planes. Forexample, in the case of investment projects aiming to increase production capacitiesand to further the development of new technologies, the company places great emphasison ensuring that the implemented technology will reduce energy intensity of produc-tion [Amica 2016]. Moreover, investment projects oriented on product developmentfocus also on endeavours meant to increase their energy class [Amica 2016]. Also underprojects not related to the core operations of the company, Amica takes the mentionedaspects into consideration, as was the case with, for example, the construction of a work-place kindergarten [Amica 2016].
9.7. Final remarks
The purpose of this chapter was to present the practical aspects of employment ofvarious approaches to investment profitability appraisal as well as various appraisalmethods. The objective was fulfilled by the case study analysis of solutions applied atAquanet and Amica.
The objective of the chapter has been reached. It characterizes the approach ofAquanet to investment project appraisal, indicating the rationale behind performinginvestment appraisal only for those projects, which the company will decide to pursueor reject based on the outcome of the analysis. The chapter also shed light on methodo-logical solutions applied at Aquanet in relation to business projects, where the invest-ment decisions are made based on the outcome of financial methods of investmentappraisal. As regards environmental and social aspects accounted for in investmentappraisal, the chapter presented an example of Aquanet's social impacts evaluation of
172
an investment consisting in the construction of the right-bank trunk sewer II in Poznań.This topic was then elaborated with a description of a possible approach to valuationof social impacts as part of cost-benefit analysis, illustrated with the example of trafficcongestion in Poznań. Lastly, the chapter provided a characterization of methodologi-cal solutions applied in the appraisal of investment projects at Amica. Each of the sub-chapters offered a commentary on the practical solutions employed at the discussedenterprises.
C H A P T E R 1 0
Risk and cost of capital accountingfor social and environmental issuesat Aquanet, Amica, B. Braun and PKN Orlen
10.1. Introductory remarks
The chapter 'Risk Analysis and Cost of Capital Estimation in Sustainable Business' in thebook entitled 'Green Controlling and Finance. Theoretical Framework' [Mikołajewiczand Nowicki 2016a], defines various types of risk associated with running a business.It presents possible approaches of accounting for risk in the enterprise analysis or inthe investment appraisal, as well as discusses the basic methods of risk analysis. It alsoaddresses the chief methods of estimating the cost of capital and the factors that influ-ence this cost, thus building a model approach to this issue on the basis of prevailingtheories. In a synthetic manner, it presents the results of empirical research on the in-fluence of corporate governance, social and environmental issues (ESG) on the cost ofcapital in an enterprise.
In the present chapter, the primary focus is on the practical aspects of risk man-agement and estimation of the cost of capital at enterprises that follow the model ofsustainable development, and the main problems regard:
identification of key global risks and trends, presentation of the risk management system employed at enterprises, presentation of approaches and methods applied at enterprises with regard to
risk analysis and estimation of the cost of capital.
The above problems are explored as case studies in subsequent sub-chapters.
174
10.2. Key global risks and trends
Risk management and its mitigation are acquiring growing significance owing to theincreasingly volatile market conditions coupled with the scale and reach of enterprises'operations. Effective risk management requires identification of its sources and on-goingmonitoring.
The Global Risk Report [WEF 2016], drafted by the World Economic Forum (WEF),may prove helpful in identification of the threats.
A global risk is defined as 'an uncertain event or condition that, if it occurs, cancause significant negative impact for several countries or industries within the next10 years.' [WEF 2016, p. 85.
WEF groups global threats into five major categories, that is economic, environ-mental, geopolitical, social and technological risks.
In the economic area, the following types of risks have been identified [WEF 2016,p. 85]:
asset bubble in a major economy, deflation in a major economy, failure of a major financial mechanism or institution, failure/shortfall of critical infrastructure, fiscal crises in key economies, high structural unemployment or underemployment, illicit trade (e.g. illicit financial flow, tax evasion, human trafficking, organized
crime, etc.), severe energy price shock (increase or decrease), unmanageable inflation.
As regards environmental threats, they include such risks as [WEF 2016, p. 85]:
extreme weather events (e.g. floods, storms, etc.) failure of climate-change mitigation and adaptation, major biodiversity loss and ecosystem collapse (land or ocean), major natural catastrophes (e.g. earthquake, tsunami, volcanic eruption, geo-
magnetic storms), man-made environmental catastrophes (e.g. oil spill, radioactive contami-
nation, etc.).
In the geopolitical aspect, the following risks have been identified [WEF 2016, p. 86]:
failure of national governance (e.g. failure of rule of law, corruption, politicaldeadlock, etc.),
interstate conflict with regional consequences,
175
large-scale terrorist attacks, state collapse or crisis (e.g. civil conflict, military coup, failed states, etc.), weapons of mass destruction.
In the social area, the following risks have been identified [WEF 2016, p. 86]:
failure of urban planning, food crises, large-scale involuntary migration, profound social instability, rapid and massive spread of infectious diseases, water crises.
In the area of technological threats, notice should be taken of the following risks[WEF 2016, p. 86]:
adverse consequences of technological advances, breakdown of critical information infrastructure and networks, large-scale cyberattacks, massive incident of data fraud/theft.
An analysis of the 2016 report conclusions [WEF 2016, p. 6] indicates that the sig-nificance in the environmental and social categories is on the rise. Risk associatedwith climate change has been identified as the most important threat in terms of im-pact, and over the last three years, it has permanently been within the top five. Thesecond place is occupied by the threat of weapons of mass destruction and the thirdby water crises. The next two positions are taken by the risk of involuntary migrationand risk of energy price shocks, respectively.
Most of these types of risks are also pointed out in terms of likelihood of occurrence.And so, the most likely risk according to the report is the risk of involuntary migration,followed by the risk of extreme weather events and climate change, with the risk ofinterstate conflict and natural catastrophes closing the top five.
Besides the global risks listed above, WEF identifies also key global trends. A trendis defined as 'a long-term pattern that is currently taking place and that could con-tribute to amplifying global risks and/or altering the relationship between them.'[WEF 2016, p. 87].
WEF lists the following key trends [WEF 2016, p. 87]:
ageing population, changing landscape of international governance, climate change,
176
environmental degradation, growing middle class in emerging economies, increasing national sentiment, increasing polarization of societies, rise of chronic diseases, rise of cyber dependency, rising geographic mobility, rising income and wealth disparity, shifts in power (in the state, economy, society), urbanization.
Importantly, both the various types of risks and trends, as well as the two groups,overlap and co-exist.
10.3. Integrated enterprise risk management system at PKN Orlen
An increasing number of companies implement solutions for active risk management,through on-going risk monitoring and assessment and through undertaking steps tomitigate its influence on the entity's business.
One example of such approach is the Integrated Enterprise Risk Management Sys-tem implemented at PKN Orlen. It is one of the key elements supporting achievementof strategic and operational goals of the concern.
The Integrated Enterprise Risk Management System (IERMS) at PKN Orlen con-sists of [PKN Orlen 2015e]:
Supervisory Board (Audit Committee), which performs an annual assessmentof the effectiveness of IERMS, monitors the level of risks affecting achievementof business objectives, provides the General Meeting with an evaluation of theinternal control system and of IERMS,
The Management Board, which oversees the process of enterprise risk man-agement, approves the objectives and principles of risk management and pro-vides the Supervisory Board with comprehensive information about businessrisks and how they are managed,
Audit and Enterprise Risk Management Office, which coordinates and super-vises the process of enterprise risk management at all levels of organization (itdevelops policies and procedures for risk management at the corporate level,periodically reports risk assessment results to the Management Board and theSupervisory Board's Audit Committee),
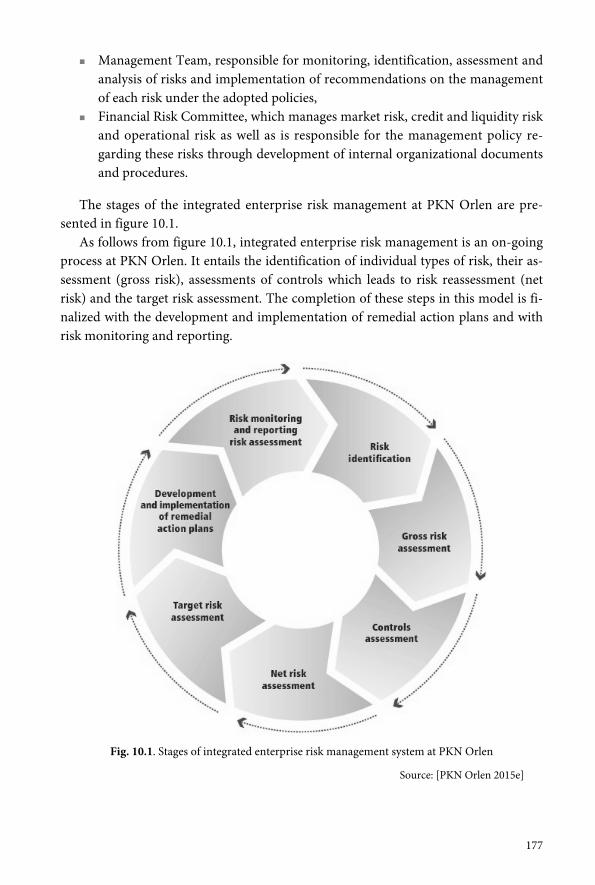
177
Management Team, responsible for monitoring, identification, assessment andanalysis of risks and implementation of recommendations on the managementof each risk under the adopted policies,
Financial Risk Committee, which manages market risk, credit and liquidity riskand operational risk as well as is responsible for the management policy re-garding these risks through development of internal organizational documentsand procedures.
The stages of the integrated enterprise risk management at PKN Orlen are pre-sented in figure 10.1.
As follows from figure 10.1, integrated enterprise risk management is an on-goingprocess at PKN Orlen. It entails the identification of individual types of risk, their as-sessment (gross risk), assessments of controls which leads to risk reassessment (netrisk) and the target risk assessment. The completion of these steps in this model is fi-nalized with the development and implementation of remedial action plans and withrisk monitoring and reporting.
Fig. 10.1. Stages of integrated enterprise risk management system at PKN Orlen
Source: [PKN Orlen 2015e]
178
The company has identified the following key risk types [PKN Orlen 2015e]:
market risk (commodity risk, currency risk and risk associated with changes ininterest rates),
liquidity and credit risk, sector risks (fuel consumption, crude processing/feedstock supplies), regulatory risks (costs of meeting the obligation to achieve the National Indica-
tive Target1, CO2 emission allowances, industrial emissions, 'colour' certificates,mandatory stocks, shale gas, gas market liberalization, new business areas, op-erational and incidental losses, court and regulatory proceedings, tax, customsand excise duty inspections, risks related to changes in laws and regulations,risks related to the stability and security of IT systems and data).
10.4. Risk analysis and cost of capital at Aquanet, Amica and B. Braun
Investment appraisal analyses drafted by Aquanet for the internal decision-makingneeds regarding investment projects above and beyond the regular operations of theentity, other than projects to expand the water network, apply certain risk analysismethods.
It should be noted that risk in the analysis is expressed as risk-adjusted discountrate [Aquanet 2015a, 2015b, 2015c, 2015e, 2015f]. This is in line with the universalpractice within this scope, which stems from certain difficulties with the application ofthe certainty equivalent method2.
In its investment appraisal analyses, Aquanet uses two basic risk analysis methods3:scenario analysis and qualitative risk analysis. Scenario analysis entails preparation ofa number of alternative models, varied in terms of the detailed forecast period length,various technological solutions or different operating times of analyzed devices[Aquanet 2015a, 2015b, 2015c, 2015e, 2015f].
Figure 10.2 presents an example of considerations of various alternatives under thescenario analysis method.
1 National Indicative Target (NIT) specifies the minimum share of biocomponents and other re-newable fuels, calculated according to their calorific value, in the total amount of fuels and liquidbiofuels consumed during a calendar year in the transport sector.
2 Among risk apprehension methods in the analysis, the certainty equivalent (CE) method or therisk-adjusted discount rate (RADR) method can be employed. A description of these methods maybe found in: [Mikołajewicz and Nowicki 2016a].
3 The basic risk analysis methods include sensitivity analysis, threshold value analysis, scenario analysisand Monte Carlo simulation analysis [Mikołajewicz and Nowicki 2016a].
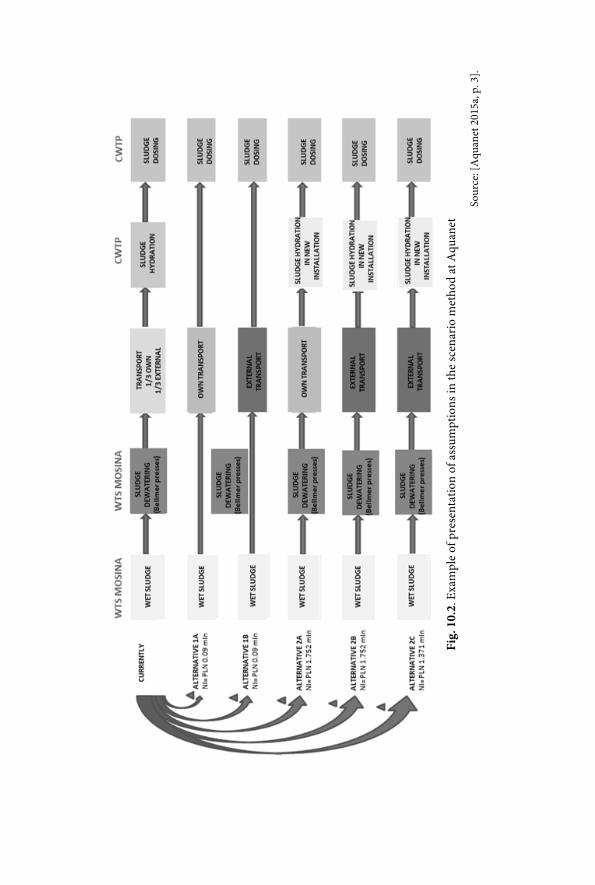
Fig.
10.
2. E
xam
ple
of p
rese
ntat
ion
of a
ssum
ptio
ns in
the
scen
ario
met
hod
at A
quan
et
Sour
ce: [
Aqu
anet
201
5a, p
. 3].
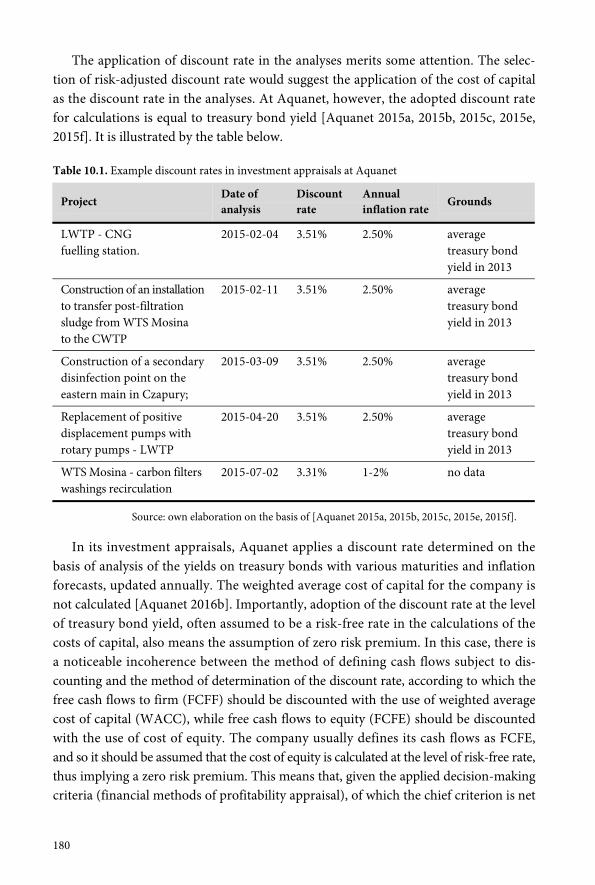
180
The application of discount rate in the analyses merits some attention. The selec-tion of risk-adjusted discount rate would suggest the application of the cost of capitalas the discount rate in the analyses. At Aquanet, however, the adopted discount ratefor calculations is equal to treasury bond yield [Aquanet 2015a, 2015b, 2015c, 2015e,2015f]. It is illustrated by the table below.
Table 10.1. Example discount rates in investment appraisals at Aquanet
ProjectDate ofanalysis
Discountrate
Annualinflation rate
Grounds
LWTP - CNGfuelling station.
2015-02-04 3.51% 2.50% averagetreasury bondyield in 2013
Construction of an installationto transfer post-filtrationsludge from WTS Mosinato the CWTP
2015-02-11 3.51% 2.50% averagetreasury bondyield in 2013
Construction of a secondarydisinfection point on theeastern main in Czapury;
2015-03-09 3.51% 2.50% averagetreasury bondyield in 2013
Replacement of positivedisplacement pumps withrotary pumps - LWTP
2015-04-20 3.51% 2.50% averagetreasury bondyield in 2013
WTS Mosina - carbon filterswashings recirculation
2015-07-02 3.31% 1-2% no data
Source: own elaboration on the basis of [Aquanet 2015a, 2015b, 2015c, 2015e, 2015f].
In its investment appraisals, Aquanet applies a discount rate determined on thebasis of analysis of the yields on treasury bonds with various maturities and inflationforecasts, updated annually. The weighted average cost of capital for the company isnot calculated [Aquanet 2016b]. Importantly, adoption of the discount rate at the levelof treasury bond yield, often assumed to be a risk-free rate in the calculations of thecosts of capital, also means the assumption of zero risk premium. In this case, there isa noticeable incoherence between the method of defining cash flows subject to dis-counting and the method of determination of the discount rate, according to which thefree cash flows to firm (FCFF) should be discounted with the use of weighted averagecost of capital (WACC), while free cash flows to equity (FCFE) should be discountedwith the use of cost of equity. The company usually defines its cash flows as FCFE,and so it should be assumed that the cost of equity is calculated at the level of risk-free rate,thus implying a zero risk premium. This means that, given the applied decision-makingcriteria (financial methods of profitability appraisal), of which the chief criterion is net
181
present value, Aquanet considers satisfactory a rate of return on investments exceedingrisk-free rate of return.
In relation to the example of social cost analysis in the investment project consist-ing in the construction of the right-bank trunk sewer II in Poznań, it must be statedthat the analysis drafted by an external company was based on nominal values for theexpected investment time of 24 months, and so it failed to account for the time valueof money [Grontmij 2008]. As a result, the social costs more remote in time were notdiscounted to the present value at zero moment of analysis (this moment, incidentally,was not determined at all in the document); and so the social discount rate was not de-termined or used in the analysis. Despite the fact that the discount rate was not usedto incorporate risk into the analysis, the document does employ some basics of riskanalysis in the form of the scenario method, as two alternative models were analyzed:an optimistic and a pessimistic one [Grontmij 2008, p. 19].
Risk analysis in the process of project management at Aquanet is based on goodproject management practices as recommended by the Project Management Institute(PMI) with the use of the Earn Value method [Kaziród and Beszterda 2013, p. 30].Based on this methodology, risk analysis for each project is performed on a monthly basisby the contractor, contract engineer and by the commissioning party, that is Aquanetin this case [Kaziród and Beszterda 2013, p. 34]. The pursued approach also assumes thatat the initial stage of the project, work breakdown structure (WBS) should be defined,as it places emphasis on planning and allows for risk reduction [Kaziród i Beszterda 2013,pp. 35-38]. Employment of WBS facilitates appropriate communication with the con-tractor, guarantees influence over contract performance and, thanks to division intosections and tasks, control over time and scope, allocation of outlays to specific tasksand focus on key performance indicators (KPIs) increases the likelihood of timelyperformance [Kaziród and Beszterda 2013, pp. 36-38].
At Aquanet, one of the applied risk analysis tools is benchmarking. It enablesstrategic diagnosis of the enterprise and identification of possible types of risks occurringin the analyzed areas. One of these areas analyzed under a benchmarking project inwhich the company participates is sustainability [European Benchmarking Co-operation2015a, p. 20; European Benchmarking Co-operation 2015b, p. 21].
Moreover, the company performs risk analysis with account of environmental andsocial risks in the course of the conducted investments. One significant example in thisscope is the analysis of climate risk and vulnerability assessment (CRVA) prepared forthe company's investment programme for the years 2012-2016, financed from the ISPAFund, from the Cohesion Fund (three stages) and from equity and loans, includingfrom the European Investment Bank [Grontmij 2014a]. The purpose of climate riskand vulnerability assessment was to establish whether the investment programme inits existing form was solid and resilient to climate-related risks. The risk analysis alsoemployed such methods as:
182
sensitivity analysis which, in combination with the exposure assessments, resultsin the foundations of analysis of vulnerability to change,
risk analysis through quantification of probability and potential impact of each risk, identification of adjusted alternatives or the evaluation of adaptive capability
[Grontmij 2014b, p. 2].
The voluminous report contains, among other, environmental risk analysis for theentire investment programme.
At Amica Group, the cost of capital is determined for the needs of investment ap-praisals and it is calculated as the weighted average cost of capital (WACC) with the useof expert methods [Grontmij 2014b, p. 2]. The company, when probed for informationregarding the impact of ESG initiatives on the cost of capital, stated that such influencehas not been observed, neither on cost of debt nor on cost of equity [Amica 2016].
Moreover, Amica applies various risk analysis methods in its day-to-day management,both at the strategic and operational levels, as well as within the investment projectmanagement system. The main approach to risk analysis as applied at the companyfocuses on the qualitative risk analysis method [Amica 2016].
From the strategic angle, the risk analysis has identified the following key risks tothe achievement of HIT 2023 strategy objectives [Amica 2014, p. 10]:
'ineffective entry on new markets, political, economic and financial risks, ineffective takeovers and integration of new companies/brands, ineffective cooperation with suppliers in the scope of development of own
product lines, aggressive competition and aggressive pricing policies of competitors.'
Steps aiming to mitigate these types of risks were defined in Amica's EnterpriseRisk Management System [Amica 2014, p. 10].
As regards risk analysis methods, it should be pointed out that minimization ofcurrency risk through effective hedging is identified as one of the objectives in relationto financial management and controlling, included under one of the five componentsof HIT 2023 strategy (excellent processes).
At B. Braun Group, one of the primary tasks of controlling is risk analysis and man-agement, which are to allow for the identification, documentation, evaluation, monitoringand control of risk [B. Braun 2015a, p. 58]. Risks arising from operating activities arequickly identified and evaluated under the controlling system. The company also iden-tifies and controls risks that do not stem directly from group's operations [B. Braun2015a, p. 58]. The following types of risk are analyzed [B. Braun 2015a, pp. 58-60]:
macroeconomic risk, sector risk,
183
supply risk (risk of procurement), product risk, human resources risk, IT risk, financial risk.
ESG factors are accounted for in many of the above-mentioned risk areas. For ex-ample, the company strives to minimize the sector risk related to the policy of favouringthe offer of domestic producers whenever their products are comparable, which isemerging on certain markets (e.g. in Russia), by strengthening its relations with localproducers and its regional presence [B. Braun 2015a, p. 59]. In an attempt to managethe human resources risk associated with possible regional shortage of appropriatelyqualified workforce, B. Braun tries to build its image as an attractive employer, by im-plementing various professional development programmes, continuing education,initiatives to improve employees' work-life balance, performance-based remunerationor flexible work models [B. Braun 2015a, p. 60].
10.5. Final remarks
The purpose of this chapter has been to identify key global types of risks and trends,to present risk management systems applied at the enterprises and to describe themethods used by enterprises in risk analysis and estimation of the cost of capital.
This objective has been fulfilled. As follows from the conducted research, globalthreats may be grouped into five major categories, that is economic, environmental,geopolitical, social and technological risks, with the noticeable rising significance ofenvironmental and social threats. Climate change risk has been identified as the risk oflargest impact, followed directly by the risk associated with weapons of mass destructionand water crises. The next two positions are taken by the risk of involuntary migrationand risk of energy price shocks, respectively.
The performed research has confirmed that the discussed enterprises have riskmanagement systems in place, an example of this being the Integrated Enterprise RiskManagement System at PKN Orlen or the risk management system at Amica.
Risk analysis employs, among others, approaches such as qualitative methods, sce-nario analysis, sensitivity analysis, social cost analysis, Earned Value method, bench-marking or climate risk and vulnerability assessment (CRVA). Estimation of the costof capital in enterprises is based on estimation of weighted average cost of capital(WACC) or, in the simplified approach, on the application of risk-free rate as the dis-count rate.

Conclusions
This monograph presents results of research on the application of controlling for theachievement of sustainable development concepts, with the assumption that activitiescoordinated under controlling should be regarded in connection with finance. The per-formed research indicates that:
strategic documents of the explored enterprises account for social and envi-ronmental aspects,
the analyzed enterprises that adhere to the purpose of value creation for share-holders may be classified as pursuing 'enlightened' value maximization,
the considered enterprises employ numerous methods of strategic analysis,especially: benchmarking, methods of stakeholder expectation analysis, productlife cycle,
financial planning enables the interested entities to verify the feasibility of goalachievement, along with the determination of the financial outcomes of thisprocess, as well as allows the enterprises to assess the risk associated with theaccomplishment of enterprise's business objectives,
owing to modern budgeting concepts tailored to the specificity of company'soperations, the discussed entities have been able to dynamically respond tochanges in the natural and social environment and to financially support ini-tiatives in these areas,
the application of an appropriate system of measures and indicators in greencontrolling is one of the conditions of correct shaping and coordination of theprocesses of planning, control and reporting at the analyzed enterprises,
reports are one of the chief types of documents applied in environmental man-agement,
taking into account of environmental and social aspects in cost managementmay improve economic performance of an enterprise,
environmental and social aspects may be noticed in investment project appraisalsin the explored companies,
186
the discussed enterprises have risk management systems in place; social andenvironmental risks are acquiring a growing significance, and risk analysis em-ploys approaches such as: scenario analysis, sensitivity analysis, social costsanalysis, earned value method, benchmarking or climate risk and vulnerabilityassessment (CRVA),
estimation of the cost of capital at analyzed enterprises is based on determinationof weighted average cost of capital or, in the simplified approach, on the appli-cation of risk-free rate as the discount rate.
The conducted research allows for drawing the general conclusion, albeit still a ten-tative one, that the application of green controlling in connection with finance con-tributes to enterprise value creation in the long run. Further, more profound research,is necessary to confirm this conclusion with a greater degree of certainty.
Bibliography
Act on renewable energy sources dated 20 February 2015, Journal of Laws No. 2015, item 478,vol. 1.
Amica, (2014), Wyniki skonsolidowane grupy Amica 2013, prezentacja dla relacji inwestorskich,http://www.pandl.pl/tl_files/raporty i prezentacje/HIT2023_prezentacjaIR_v8.pdf(accessed on 01.03.2016).
Amica, (2015), Strategia HIT 2023. Prezentacja dla inwestorów, 17.03.2015,https://www.amica.pl/files/strategia_hit_2023.pdf (accessed on 01.03.2016).
Amica, (2016), Materiały przygotowane przez kierownictwo i pracowników spółki Amicana potrzeby niniejszego badania z 22.03.2016 roku, internal materials of the company.
Aquanet and UE, (2016), Aquanet i UE. Wspólne inwestycje – opis projektów współfinansowanychz Funduszu Spójności UE, http://inwestycjeunijne.aquanet.pl/o-projekcie(accessed on 01.03.2016).
Aquanet, (2011), Strategia AQUANET SA na lata 2012-2016, Poznań.Aquanet, (2015a), Aktualizacja strategii operacyjnej Aquanet SA na lata 2016-2020, Poznań.Aquanet, (2015b), Budowa instalacji do przejęcia osadów pofiltracyjnych z SUW Mosina na COŚ
(Nr zadania w aktualnym PI-10: 4-05-12-035-0). Wyniki analizy opłacalności,raport wewnętrzny spółki Aquanet z 11.02.2015 wraz z analizą opłacalnościsporządzoną w arkuszu kalkulacyjnym Excel, internal materials of the company.
Aquanet, (2015c), Budowa punktu wtórnej dezynfekcji wody na magistrali wschodniej w Czapurach.Analiza porównawcza typów elektrolizera (Nr zadania w aktualnym PI-10: 3-05-03-304-1).Wyniki analizy opłacalności, raport wewnętrzny spółki Aquanet z 09.03.2015 wraz z analiząopłacalności sporządzoną w arkuszu kalkulacyjnym Excel, internal materials of the company.
Aquanet, (2015d), LOŚ – stacja paliw CNG (Nr zadania w aktualnym PI-10: 6-05-14-072-1).Wyniki analizy opłacalności, raport wewnętrzny spółki Aquanet z 04.02.2015 wraz z analiząopłacalności sporządzoną w arkuszu kalkulacyjnym Excel, internal materials of the company.
Aquanet, (2015e), Raport roczny 2014, Aquanet SA i Agencja reklamowa ADV, Poznań.Aquanet, (2015f), SUW Mosina – wody popłuczne po filtrach węglowych. Wyniki analizy
opłacalności, raport wewnętrzny spółki Aquanet z 02.07.2015 wraz z analizą opłacalnościsporządzoną w arkuszu kalkulacyjnym Excel, internal materials of the company.
Aquanet, (2015g), Wymiana pomp wyporowych na wirowe – LOŚ OB.27 (4-05-15-078-0).Wyniki analizy opłacalności, raport wewnętrzny spółki Aquanet z 20.04.2015 wraz z analiząopłacalności sporządzoną w arkuszu kalkulacyjnym Excel, internal materials of the company.
188
Aquanet, (2015h), Subjects of feasibility studies conducted in 2015, internal materials of the company.Aquanet, (2016a), Kampania „Nie śmieć w sieć”, opis kampanii oraz filmy edukacyjne,
http://www.aquanet.pl/nie-smiec-w-siec,506 (accessed on 01.03.2016).Aquanet, (2016b), Wyjaśnienia spółki Aquanet na temat kosztu kapitału z 11.03.2016 roku,
internal materials of the company.Aquanet, (2016c), Wywiad pogłębiony z kierownictwem spółki Aquanet przeprowadzony
w dniu 12.02.2016 roku w siedzibie spółki.Aquanet Investments, (2016), Podsumowanie inwestycji realizowanych przez Aquanet,
http://www.aquanet.pl/inwestycje,5 (accessed on 02.03.2016).Balicka A., (2015), Controlling ekologiczny w przedsiębiorstwie,
Prace Naukowe Uniwersytetu Ekonomicznego we Wrocławiu, vol. 399, pp. 13-21.Bossel H., (1999), Indicators for Sustainable Development: Theory, Method, Applications,
A Report to the Balaton Group, International Institute For Sustainable Development, Winnipeg.B. Braun, (2015a), Sharing Expertise. Annual Report 2014, B. Braun Melsungen AG,
http://www.bbraun.com/ documents/2014_Annual_Report_digital.pdf (accessed on 01.03.2016).B. Braun, (2015b), Taking responsibility. B. Braun Group Sustainability Report 2015,
internal materials of the company.Byrka-Kita K., (2008), Metody szacowania kosztu kapitału własnego. Teoria a praktyka,
Wydawnictwo Uniwersytetu Szczecińskiego, Szczecin.CBS, (2014), Raport z badania: Pracownicy spółki Aquanet. Diagnoza funkcjonowania firmy,
Centrum Badań Stosowanych Ultex Ankieter sp. z o.o., October, internal materialsof the company.
CBS, (2015), Raport z badania: Badanie wizerunku spółki Aquanet SA wśród klientówz aglomeracji poznańskiej, Centrum Badań Stosowanych Ultex Ankieter sp. z o.o.,November, internal materials of the company.
Chudziński P., (2014), Wykorzystanie benchmarkingu w zarządzaniu kosztami w przedsiębiorstwiewodociągowym, Ph.D. dissertation, Poznan University of Economics and Business, Poznań
Ciepiela D., (2015), Czy nowy system wsparcia OZE będzie skuteczny?,http://energetyka.wnp.pl/czy-nowy-system-wsparcia-oze-bedzie-skuteczny,257326_1_0_0.html(accessed on 01.03.2016).
Deloitte, Targeo.pl, (2016), Raport o korkach w 7 największych miastach Polski. Warszawa,Wrocław, Kraków, Poznań, Gdańsk, Łódź, Katowice, March, http://www2.deloitte.com/content/dam/Deloitte/pl/Documents/Reports/pl_Raport_korki_2016.pdf (accessed on 03.03.2016).
DiaCore, (2014), http://diacore.eu/component/content/article?id=11 (accessed on 01.03.2016).Directive 2014/95/UE of the European Parliament and Council amending Directive
2013/34/EU as regards disclosure of non-financial and diversity information by certainlarge undertakings and groups. Official Journal of the European Union 15.11.2014 L330/1.
Dziawgo D., Dziawgo L., (2014), Społeczna rewolucja rynku finansowego. CSR i IR – wybraneaspekty. Nauki o finansach, vol. 1(18), pp. 29-39.
Dziawgo L. (2009), Bank jako „instytucja BRAKU zaufania publicznego”, in: Szambelańczyk J.(ed.), Globalny kryzys finansowy i jego konsekwencje w opiniach ekonomistów polskich,ZBP, Warsaw.
Dzik R., (2005), Zintegrowana ocena efektywności pozyskiwania energii elektrycznej ze źródełodnawialnych, Rynek Energii 2005, no. 2.
EMAS, (2016), http://emas.gdos.gov.pl/lista-rejestru-emas (accessed on 01.02.2016).
189
EMIS, (2016), https://www.emis.com (accessed on 01.03.2016).Ernst & Young, (2015), Aktualizacja Strategii Operacyjnej Aquanet SA na lata 2016-2020,
10.06.2015, internal materials of the company.European Benchmarking Co-operation, (2015a), International Benchmark 2014. Water supply,
Final company report Aquanet SA advanced, 02.12.2015, internal materials of the company.European Benchmarking Co-operation, (2015b), International Benchmark 2014. Wastewater,
Final company report Aquanet SA advanced, 02.12.2015, internal materials of the company.European Commission, (2010), A Strategy for Smart, Sustainable and Inclusive Growth
Fostering Social Cohesion, p. 12, http://eur-lex.europa.eu/LexUriServ/LexUriServ.do?uri=COM:2010:2020: FIN:PL:PDF, (as at 20.02.2016).
European Commission, (2010), A Renewed EU Strategy 2011-2014 for Corporate SocialResponsibility, COM (2011) 681, Brussels.
Gallo M.A., Tapies J., Cappuyns K., (2004), Comparison of Family Business and NonfamilyBusiness: Financial Logic and Personal Preferences, Family Business Review, vol. 17, pp. 303-318.
Gallo M.A., Vilaseca A., (1996), Finance in family business, Family Business Review, vol. 9(4),pp. 387-401.
Gazeta Prawna.pl. Biznes Energetyka, 28.05.2013,http://serwisy.gazetaprawna.pl/energetyka/artykuly/707416 (accessed on 28.02.2016).
Gnatowska R., Wąs A., (2015), Analiza opłacalności inwestycji w produkcję energii ze źródełodnawialnych na przykładzie farmy wiatrowej, przy założeniu wsparcia rządu dla„zielonej energii”, Inżynieria i Ochrona Środowiska 2015, vol. 18, no. 1.
Grontmij, (2008), Analiza kosztów społecznych budowy kolektora prawobrzeżnego II od ulicyGłównej do Katowickiej, Grontmij Polska Sp. z o.o., Poznań, June 2008, Aquanet's internalmaterials of the company.
Grontmij, (2014a), Ocena ryzyka wynikającego ze zmian klimatycznych i podatności na nie(w skrócie ang. CRVA) programu AQUANET WATER AND WASTEWATER,raport przygotowany przez Grontmij Polska Sp. z o.o., Poznań, 31.01.2014,Aquanet's internal materials of the company.
Grontmij, (2014b), Streszczenie – Ocena ryzyka wynikającego ze zmian klimatycznychi podatności na nie (w skrócie ang. CRVA) programu AQUANET WATER ANDWASTEWATER, Streszczenie raportu przygotowanego przez Grontmij Polska Sp. z o.o.,Poznań, December 2014, Aquanet's internal materials of the company.
Gryko J., Kluzek M., Kubiak J., Nowaczyk T., (2011), Planowanie finansowe w przedsiębiorstwie,Wyd. Uniwersytetu Ekonomicznego w Poznaniu, Poznań.
Hochtief, (2015), Group Report 2015. Combined Annual Report and Sustainability Report,http://reports. hochtief.com/reports/mmdbdownload?id=153935&format=4(accessed on 01.03.2016).
Horvath P., (2009), Controlling, Vahlen, Munich, p. 219.GK LW Bogdanka, (2001, 2007-2016), Internal company materials of GK LW Bogdanka.Individual Interpretation of the Director of Tax Chamber in Warsaw of 10 April 2013,
https://interpretacje-podatkowe.org/stawka-amortyzacyjna/ippb3-423-66-13-2-ms(accessed on 02.03.2016).
Kaziród A., Beszterda K., (2013), FS w Aquanet SA, presentation of 11.06.2013,http://pois.nfosigw.gov.pl/ (dostęp 02.03.2016).
190
Kochalski C. (ed.), (2011), Model projektowania i wdrażania strategii rozwoju w publicznychszkołach wyższych w Polsce, Wydawnictwo Uniwersytetu Ekonomicznego w Poznaniu, Poznań.
Kochalski C. (ed.), (2016), Zielony controlling i finanse. Podstawy teoretyczne,Wydawnictwo C.H. Beck, Warsaw.
Kochalski C., Nowicki J., (2016), Analiza strategiczna jako narzędzie projektowania strategiiekorozwoju, in: Kochalski C. (ed.), Zielony Controlling i Finanse. Podstawy teoretyczne,Wydawnictwo C.H. Beck, Warsaw.
Kolektor prawobrzeżny II, (2016), opis inwestycji Kolektor Prawobrzeżny II,http://inwestycjeunijne.aquanet.pl/ inwestycje/3/9 (accessed on 02.03.2016).
Kompania Piwowarska, (2015), Raport zrównoważonego rozwoju Kompanii Piwowarskiej 2015,http://www.kp.pl/files/social_reports/pol/kp_raport_2015.pdf (accessed on 01.03.2016).
Kompania Piwowarska, (2016), http://www.kp.pl/ (accessed on 01.03.2016).KZGW, (2010), Aktualizacja Krajowego Programu Oczyszczania Ścieków Komunalnych,
Krajowy Zarząd Gospodarki Wodnej.Lasocka-Gomuła I., (2008), Firma Aquanet jako dostawca wody dla miasta Poznania oraz jego
działalność w zgodzie ze środowiskiem, paper delivered at a conference in Seville in 2008.Lotos, (2015), Integrated Report 2014, http://www.lotos.pl/ (accessed on 01.02.2016).Lotos, (2016), http://www.lotos.pl/ (accessed on 01.02.2016).Marcinkowska, M., (2012), Sprawozdanie z wartości dodanej – przykład oceny wyników
przedsiębiorstwa z perspektywy interesariuszy, Zeszyty Naukowe UniwersytetuSzczecińskiego. Finanse, rynki finansowe, ubezpieczenia, no. 51/690,www.wneiz.pl/nauka_wneiz/frfu/51-2012/FRFU-51-335.pdf (accessed on 01.03.2016).
Mikołajewicz G., Nowicki J., (2016a), Risk Analysis and Cost of Capital Estimationin Sustainable Business, in: Kochalski C. (ed.), Green Controlling and Finance.Theoretical Framework, Wydawnictwo C.H. Beck, Warsaw 2016.
Mikołajewicz G., Nowicki J., (2016b), Value Creation Concept in Sustainable Business, in:Kochalski C. (ed.), Green Controlling and Finance. Theoretical Framework,Wydawnictwo C.H. Beck, Warsaw 2016.
Ministry of Development, (2016), https://www.mr.gov.pl/strony/zadania/bezpieczenstwo-gospodarcze/bezpieczenstwo-produktow-i-uslug/system-reach/ (accessed on 01.02.2016).
Ministry of the Environment, (2016), https://ippc.mos.gov.pl/ippc (accessed on 01.02.2016).MPWiK Leszno, (2016), mpwik-leszno.pl. http://www.mpwik-leszno.pl/
index.php?option=com_content&view= article&id=56&Itemid=113 (accessed on 01.03.2016).MPWiK Warsaw, (2016), mpwik.com.pl. http://www.mpwik.com.pl/o-firmie/dane-spolki/strategia
(accessed on 01.03.2016).Niemiec, A., (2015), Możliwość zastosowania analizy istotności osiągnięć w identyfikacji i ewaluacji
zestawu kluczowych mierników dokonań (KPIs), Zeszyty Naukowe Uniwersytetu Szczecińskiego,no. 873.
Nowak E., Nita B., (2010), Budżetowanie w przedsiębiorstwie. Organizacja, procedury,zastosowanie, Oficyna Wolters Kluwer Polska Sp. z o.o., Warsaw.
Nowicki J., (2016), Evaluation of Investment Projects with Environmental and Social Insight, in:Kochalski C. (ed.), Green Controlling and Finance. Theoretical Framework,Wydawnictwo C.H. Beck, Warsaw.
191
Nycz-Wróbel J., (2014), Różnice w sposobie prezentowania informacji dotyczących wskaźnikówefektywności środowiskowej, Humanities and Social Sciences, vol. XIX, no. 21 (3/2014),pp. 173-184.
OFWAT, (2016), www.ofwat.gov.uk., http://www.ofwat.gov.uk/regulated-companies/price-review(accessed on 01.03.2016).
Paska J., (2008), Reliability Issues in Electric Power Systems with Distributed Generation,Rynek Energii 2008 no. 5.
PBG (2011), CSR w Grupie Kapitałowej PBG, Biuletyn Korporacyjny Ogniwo,special edition XII 2011.
Pesta R., (2009), Analiza opłacalności budowy farmy wiatrowej o mocy 40 MW,Rynek Energii 2009 no. 1.
PKN Orlen, (2011), Raport roczny 2010, http://www.orlen.pl/PL/RelacjeInwestorskie/Raportyroczne/Strony/ default.aspx (accessed on 01.03.2016).
PKN Orlen, (2013), Raport roczny 2012, http://www.orlen.pl/PL/RelacjeInwestorskie/Raportyroczne/Strony/ default.aspx (accessed on 01.03.2016).
PKN Orlen, (2015a), Integrated Report 2014. Pillars of PKN Orlen’s strategy,http://integratedreport.orlen.pl/en/our-strategy/orlen-group-strategy-2014-2017/pillars-pkn-orlens-strategy (accessed on 01.03.2016).
PKN Orlen, (2015b), Integrated Report 2014. Interactive KPI,http://integratedreport.orlen.pl/en/tools/interactive-kpi, (accessed on 01.03.2016).
PKN Orlen, (2015b), Integrated Report 2014. Stakeholder Map,http://integratedreport.orlen.pl/en/tools/stakeholder-map (accessed on 01.03.2016).
PKN Orlen, (2015d), Integrated Report 2014. Relevance Matrix,http://integratedreport.orlen.pl/en/tools/relevance-matrix (accessed on 01.03.2016).
PKN Orlen, (2015e), Integrated Report 2014. Risks,http://integratedreport.orlen.pl/en/node/475/market-risks (accessed on 01.03.2016).
PKN Orlen, (2015f), Integrated Report 2014. CSR strategy,http://integratedreport.orlen.pl/en/our-strategy/csr-strategy (accessed on 01.03.2016).
PKN Orlen, (2015g), Integrated Report 2014. Core Values and Standards of Conduct,http://integratedreport.orlen.pl/en/our-company/who-we-are/core-values-and-standards-conduct(accessed on 01.03.2016).
PKN Orlen, (2015h), Strategia CSR dla PKN ORLEN,http://www.orlen.pl/PL/Odpowiedzialny_Biznes/Documents/Strategia_CSR_dla_PKN_ORLEN_prezentacja_15.07.2015.pdf (accessed on 01.03.2016).
Rafako SA, (2001), Company Profile RAFAKO SA, Wydawnictwo ART, p. 2.Rafako SA, (2010), Fabryka Kotłów Rafako ma 60 lat, Nasz Racibórz, 29.09.2010.Rafako SA, (2013-2016), Internal company materials of RAFAKO SA.Rafako SA, (2015), Deklaracja środowiskowa RAFAKO SA, pp. 12-13.Rafako, (2016), http://www.rafako.com.pl/ (accessed on 01.02.2016).Rafako SA, Jednolity Tekst Statut RAFAKO Spółka Akcyjna w Raciborzu, Chapter V, § 33.Rangan V.K., Chase L.A., Karim S., (2015), The truth about CSR, Harvard Business Review, vol. 1.Ratajczak, P., (2014), Powiązanie działalności społecznie odpowiedzialnej ze strategią
przedsiębiorstwa a wartość dla jego właścicieli oraz pozostałych interesariuszy, in:Urbanowska-Sojkin, E. (ed.), Studia Oeconomica Posnaniensia, vol. 2, no. 11 (272), pp. 122-137.
192
Ratajczak, P., (2016), Mierniki i wskaźniki w controllingu ekologicznym, in: Kochalski, C. (ed.),(2016), Zielony controlling i finanse. Podstawy teoretyczne, Wydawnictwo C.H. Beck,Warsaw, pp. 203-226.
Regulation of the Minister of Economy on the reference price of electric power from renewablesources of energy in 2016 dated 13 November 2015, Journal of Laws of 2015, item 2063),
Regulation (EC) No. 1221/2009 of the European Parliament and Council of 25 November 2009on the voluntary participation by organizations in a Community eco-management andaudit scheme (EMAS), repealing Regulation (EC) No 761/2001 and Commission Decisions2001/681/EC and 2006/193/EC, EU Official Journal L 342/23.
Roguski A., (2016), Rafako gotowe do skoku, Parkiet, 26.02.2016.Rutkowski J., (2015), List Prezesa Zarządu AMICA SA (do Akcjonariuszy), dołączony do
Raportu rocznego za rok obrotowy 2014 (stan prawny na dzień 28 kwietnia 2015),https://www.amica.pl/files/calendar/skonsolidowane_sprawozdanie22.pdf (dostęp 03.03.2016).
SABMiller, (2016), http://www.sabmiller.com/ (accessed on 01.03.2016).SAM Principles, (2015), SABMiller plc Sustainable Development Reporting Principles
and Methodology for Assured Indicators in The Year Ended 31 March 2015,http://www.sabmiller.com/docs/default-source/sustainability-documents/sustainable-development-reporting-principles-june-2015.pdf?sfvrsn=4 (accessed on 01.03.2016).
Schwarz, J., Beloff, B., Beaver, E., (2002), Use Sustainability Metrics to Guide Decision-Making,Chemical Engineering Progress, July, pp. 58-63.
Solaris, (2015), Raport środowiskowy Solaris Bus & Coach SA 2014, Annual Report,Solaris Bus & Coach – internal materials of the company.
Solaris, (2016), Rekordowe przychody Solarisa w roku 2015. Spółka trzynasty rok z rzędu lideremw segmencie autobusów miejskich, Press Release, Solaris Bus & Coach, Bolechowo/Warsaw,16.02.2016.
Solińska M, Soliński L., (2003), Efektywność ekonomiczna proekologicznych inwestycji,Uczelniane Wydawnictwa Naukowo-Dydaktyczne AGH, Krakow.
Sommer P., (2013), Instrumenty wspomagające zarządzanie środowiskiem, in: Kryński A.,Kramer M. (eds.) Zintegrowane zarządzanie środowiskiem: systemowe zależności międzypolityką, prawem i techniką, Caekelbergh A.F., Oficyna Wolters Kluwer business, Warsaw.
Steinke K-H., Schulze M., Berlin S., Stehle A., Georg J. (eds.), (2014), Green Controlling,Leitfaden für die erfolgreiche Integration ökologischer Zielsetzungen in Unternehmensplanungund – steuerung, Internationaler Controller Verein, Haufe Gruppe, Freiburg – Munich.
Suska-Szczerbicka M., Weiss E., (2013), Ocena opłacalności przedsięwzięcia inwestycyjnegoprodukcji energii elektrycznej farmy wiatrowej, Rynek Energii 2013, vol. 1.
Szulczewska-Remi A., Zerbst S., (2016), Budżetowanie i analiza odchyleń w controllinguekologicznym, in: Kochalski C. (ed.) Zielony Controlling i Finanse. Podstawy teoretyczne,Wydawnictwo C.H. Beck, Warsaw, pp. 166-185.
The International IR Framework, http://integratedreporting.org/, p. 7.TUV-NORD, (2016), http://www.tuv-nord.com/ (accessed on 01.02.2016).Urbanowska-Sojkin E., Banaszyk P., Witczak H., (2004), Zarządzanie strategiczne
przedsiębiorstwem, PWE, Warsaw.Walińska E., Bek-Gaik B., Gad J., Rymkiewicz B., Sprawozdawczość przedsiębiorstwa
jako narzędzie komunikacji z otoczeniem. Wymiar finansowy i niefinansowy, Wyd. UŁ,Łódź 2015, p. 24.

193
WEF, (2016), The Global Risk Report 2016, 11th Edition, World Economic Forum,http://www3.weforum.org/ docs/GRR/WEF_GRR16.pdf (accessed on 03.03.2016).
Wiśniewski G., Michałowska-Knap K., Koć S., (2012), Energetyka wiatrowa – stan aktualnyi perspektywy rozwoju w Polsce, Raport Instytutu Energetyki Odnawialnej, Warsaw.
Wiśniewski, T., (2008), Ocena efektywności inwestycji rzeczowych ze szczególnymuwzględnieniem ryzyka, Wydawnictwo Naukowe Uniwersytetu Szczecińskiego, Szczecin.
Zieliński T.M., (2014), Zasobowo-procesowy rachunek kosztów w przedsiębiorstwie, Ph.D.dissertation. Poznan University of Economics ande Business in Poznań.
ZGH Bolesław, (2012-2016), Internal company materials of ZGH Bolesław in Bukowno.ZGH Bolesław, (2016), http://zghboleslaw.org/pl/ (accessed on 01.02.2016).Zmysłowska A., Nowakowski T., (2003), Pozwolenia zintegrowane IPPC. Folder informacyjny
dla przemysłu i administracji publicznej, Ministry of the Environment, Warsaw.

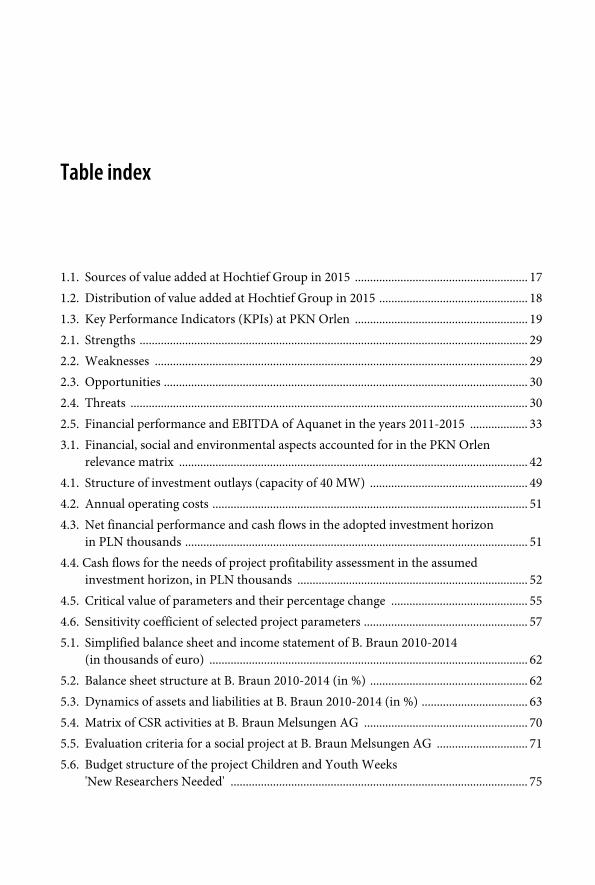
Table index
1.1. Sources of value added at Hochtief Group in 2015 ......................................................... 171.2. Distribution of value added at Hochtief Group in 2015 ................................................. 181.3. Key Performance Indicators (KPIs) at PKN Orlen ......................................................... 192.1. Strengths ................................................................................................................................ 292.2. Weaknesses ........................................................................................................................... 292.3. Opportunities ........................................................................................................................ 302.4. Threats ................................................................................................................................... 302.5. Financial performance and EBITDA of Aquanet in the years 2011-2015 ................... 333.1. Financial, social and environmental aspects accounted for in the PKN Orlen
relevance matrix ................................................................................................................... 424.1. Structure of investment outlays (capacity of 40 MW) .................................................... 494.2. Annual operating costs ........................................................................................................ 514.3. Net financial performance and cash flows in the adopted investment horizon
in PLN thousands ................................................................................................................. 514.4. Cash flows for the needs of project profitability assessment in the assumed
investment horizon, in PLN thousands ............................................................................ 524.5. Critical value of parameters and their percentage change ............................................. 554.6. Sensitivity coefficient of selected project parameters ...................................................... 575.1. Simplified balance sheet and income statement of B. Braun 2010-2014
(in thousands of euro) ......................................................................................................... 625.2. Balance sheet structure at B. Braun 2010-2014 (in %) .................................................... 625.3. Dynamics of assets and liabilities at B. Braun 2010-2014 (in %) ................................... 635.4. Matrix of CSR activities at B. Braun Melsungen AG ...................................................... 705.5. Evaluation criteria for a social project at B. Braun Melsungen AG .............................. 715.6. Budget structure of the project Children and Youth Weeks
'New Researchers Needed' .................................................................................................. 75
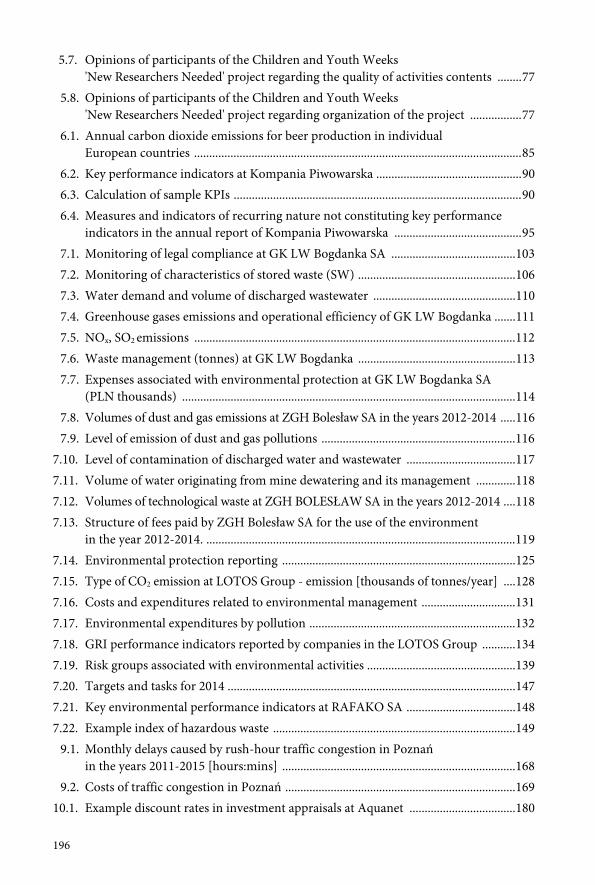
196
5.7. Opinions of participants of the Children and Youth Weeks'New Researchers Needed' project regarding the quality of activities contents ........77
5.8. Opinions of participants of the Children and Youth Weeks'New Researchers Needed' project regarding organization of the project .................77
6.1. Annual carbon dioxide emissions for beer production in individualEuropean countries ............................................................................................................85
6.2. Key performance indicators at Kompania Piwowarska ................................................906.3. Calculation of sample KPIs ...............................................................................................906.4. Measures and indicators of recurring nature not constituting key performance
indicators in the annual report of Kompania Piwowarska ..........................................957.1. Monitoring of legal compliance at GK LW Bogdanka SA .........................................1037.2. Monitoring of characteristics of stored waste (SW) ....................................................1067.3. Water demand and volume of discharged wastewater ...............................................1107.4. Greenhouse gases emissions and operational efficiency of GK LW Bogdanka .......1117.5. NOx, SO2 emissions ..........................................................................................................1127.6. Waste management (tonnes) at GK LW Bogdanka ....................................................1137.7. Expenses associated with environmental protection at GK LW Bogdanka SA
(PLN thousands) ..............................................................................................................1147.8. Volumes of dust and gas emissions at ZGH Bolesław SA in the years 2012-2014 .....1167.9. Level of emission of dust and gas pollutions ................................................................116
7.10. Level of contamination of discharged water and wastewater ....................................1177.11. Volume of water originating from mine dewatering and its management .............1187.12. Volumes of technological waste at ZGH BOLESŁAW SA in the years 2012-2014 ....1187.13. Structure of fees paid by ZGH Bolesław SA for the use of the environment
in the year 2012-2014. ......................................................................................................1197.14. Environmental protection reporting .............................................................................1257.15. Type of CO2 emission at LOTOS Group - emission [thousands of tonnes/year] ....1287.16. Costs and expenditures related to environmental management ...............................1317.17. Environmental expenditures by pollution ....................................................................1327.18. GRI performance indicators reported by companies in the LOTOS Group ...........1347.19. Risk groups associated with environmental activities .................................................1397.20. Targets and tasks for 2014 ...............................................................................................1477.21. Key environmental performance indicators at RAFAKO SA ....................................1487.22. Example index of hazardous waste ................................................................................149
9.1. Monthly delays caused by rush-hour traffic congestion in Poznańin the years 2011-2015 [hours:mins] .............................................................................168
9.2. Costs of traffic congestion in Poznań ............................................................................16910.1. Example discount rates in investment appraisals at Aquanet ...................................180
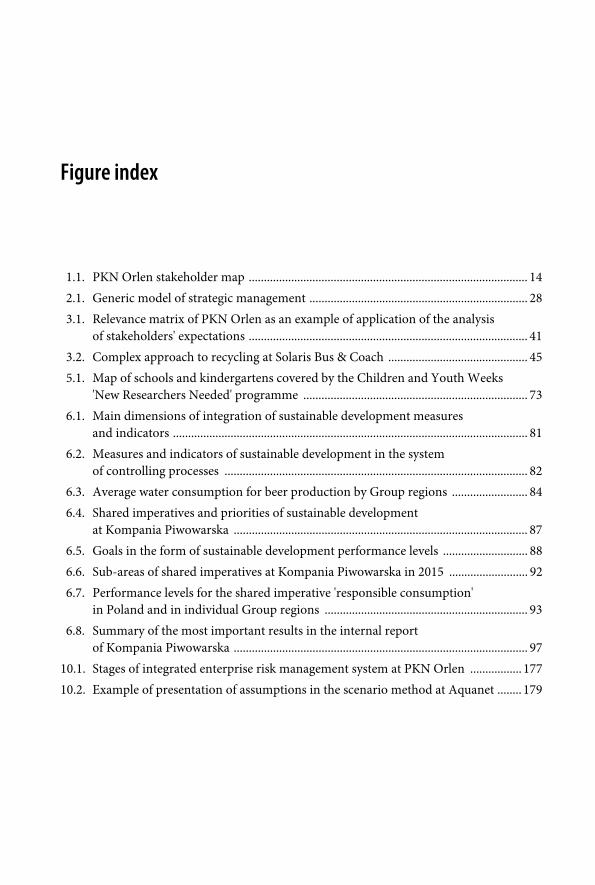
Figure index
1.1. PKN Orlen stakeholder map ............................................................................................ 142.1. Generic model of strategic management ........................................................................ 283.1. Relevance matrix of PKN Orlen as an example of application of the analysis
of stakeholders' expectations ............................................................................................ 413.2. Complex approach to recycling at Solaris Bus & Coach .............................................. 455.1. Map of schools and kindergartens covered by the Children and Youth Weeks
'New Researchers Needed' programme .......................................................................... 736.1. Main dimensions of integration of sustainable development measures
and indicators ..................................................................................................................... 816.2. Measures and indicators of sustainable development in the system
of controlling processes .................................................................................................... 826.3. Average water consumption for beer production by Group regions ......................... 846.4. Shared imperatives and priorities of sustainable development
at Kompania Piwowarska ................................................................................................. 876.5. Goals in the form of sustainable development performance levels ............................ 886.6. Sub-areas of shared imperatives at Kompania Piwowarska in 2015 .......................... 926.7. Performance levels for the shared imperative 'responsible consumption'
in Poland and in individual Group regions ................................................................... 936.8. Summary of the most important results in the internal report
of Kompania Piwowarska ................................................................................................. 9710.1. Stages of integrated enterprise risk management system at PKN Orlen ................. 17710.2. Example of presentation of assumptions in the scenario method at Aquanet ........ 179
Diagram index
5.1. Reorganization and optimization of financial processes at B. Braun Melsungen AGfor the needs of implementation of new budgeting solutions ........................................65
5.2. Latest Estimate Time Schedule at B. Braun ......................................................................665.3. 2015 LE1 Time Schedule at B. Braun .................................................................................675.4. Execution of social projects by B. Braun in cooperation
with nonprofit organizations ..............................................................................................725.5. An extract from a workshop programme offered as part
of the Children and Youth Weeks 'New Researchers Needed' .......................................745.6. Budget structure of the project Children and Youth Weeks
'New Researchers Needed' ...................................................................................................76
Graph index
2.1. Price burden of services delivered by Aquanet ................................................................ 334.1. A graphic illustration of NPV sensitivity to changes of individual parameters .......... 575.1. Increase in value of assets and liabilities versus net profit at B. Bran 2010-2014
(in thousands of Euro) ......................................................................................................... 635.2. Simplified income statement of B. Braun Melsungen AG for the years 2010-2014
(in thousands of Euro) ......................................................................................................... 648.1. The share of property-related costs in the water and sewerage tariffs
in selected cities of Poland in 2014 .................................................................................. 1548.2. Electrical energy consumption in the process of wastewater treatment indicator
(kWh/pe) ............................................................................................................................. 1558.3. Number of mains failures ................................................................................................. 1568.4. Distribution loss rate per mains length ........................................................................... 1578.5. Tariff burden of Polish water and wastewater enterprises in the years 2010-2014 .... 159