Supporting Information Temporal inhibition of mouse ...Kseniia Porshneva 1, Diana Papiernik ,...
6
Supporting Information Temporal inhibition of mouse mammary gland cancer metastasis by CORM-A1 and DETA/NO combination therapy Kseniia Porshneva 1 , Diana Papiernik 1 , Mateusz Psurski 1 , Agnieszka Łupicka-Słowik 2 Rafał Matkowski 3,4 , Marcin Ekiert 3,4 , Marcin Nowak 5 , Joanna Jarosz 1 , Joanna Banach 1 , Magdalena Milczarek 1 , Tomasz M. Goszczyński 1 , Marcin Sieńczyk 2 , Joanna Wietrzyk 1 1 Department of Experimental Oncology, Hirszfeld Institute of Immunology and Experimental Therapy, Polish Academy of Sciences, Wroclaw, Poland 2 Faculty of Chemistry, Division of Medicinal Chemistry and Microbiology, Wroclaw University of Science and Technology, Wroclaw, Poland 3 Division of Surgical Oncology and Clinical Oncology; Department of Oncology, Wroclaw Medical University, Wroclaw, Poland 4 Lower Silesian Oncology Center, Wroclaw, Poland 5 Faculty of Veterinary Medicine, Wroclaw University of Environmental and Life Sciences, Wroclaw, Poland Supplementary Figures
Transcript of Supporting Information Temporal inhibition of mouse ...Kseniia Porshneva 1, Diana Papiernik ,...
Supporting Information
Temporal inhibition of mouse mammary gland cancer metastasis by CORM-A1 and
DETA/NO combination therapy
Kseniia Porshneva1, Diana Papiernik1, Mateusz Psurski1, Agnieszka Łupicka-Słowik2 Rafał
Matkowski3,4, Marcin Ekiert3,4, Marcin Nowak5, Joanna Jarosz1, Joanna Banach1, Magdalena
Milczarek1, Tomasz M. Goszczyński1, Marcin Sieńczyk2, Joanna Wietrzyk1
1Department of Experimental Oncology, Hirszfeld Institute of Immunology and Experimental
Therapy, Polish Academy of Sciences, Wroclaw, Poland
2Faculty of Chemistry, Division of Medicinal Chemistry and Microbiology, Wroclaw
University of Science and Technology, Wroclaw, Poland
3Division of Surgical Oncology and Clinical Oncology; Department of Oncology, Wroclaw
Medical University, Wroclaw, Poland
4Lower Silesian Oncology Center, Wroclaw, Poland
5Faculty of Veterinary Medicine, Wroclaw University of Environmental and Life Sciences,
Wroclaw, Poland
Supplementary Figures

Figure S1. The impact of CORM-A1 and DETA/NO on protein levels in heart tissue in
the experimental models of metastasis of 4T1-luc2-tdTomato cells. (A) Total VASP, (B)
pVASPSer239, (D) PKG and (E) HO-1 densitometric analysis (mean optical density of bands of
protein tested to Commassie loading control) and representative blots (F). (C) Calculated
pVASPSer239/VASP ratio. “L” means lower dose of CORM-A1 and DETA/NO (0.5 mg/kg/12h
and 1.57 mg/kg/24h, respectively; treatment schedule indicated by yellow circle in Scheme 1A
and Figure 1A). “H” means higher dose of CORM-A1 and DETA/NO (1.5 mg/kg/12h and
2.358 mg/kg/24h, respectively; treatment schedule indicated by green circle in Scheme 1A and
Figure 1A). Data presented as mean with standard deviation with points for individual
measurements. Number of mice: 4-5 per group. Healthy mice used as a control: 4-5. Statistical
analysis: (B) Sidak’s multiple comparison tests. *p< 0.05 as compared to control or as indicated.

Figure S2. (A) VEGF and (B) myeloperoxidase (MPO) measured in plasma, lung and
heart tissue as well as (C) lipids peroxidation (malondialdehyde, MDA level) measured in
lung and heart tissue in the experimental models of metastasis of 4T1-luc2-tdTomato cells.
“L” means lower dose of CORM-A1 and DETA/NO (0.5 mg/kg/12h and 1.57 mg/kg/24h,
respectively; treatment schedule indicated by yellow circle in Scheme 1A and Figure 1A). “H”
means higher dose of CORM-A1 and DETA/NO (1.5 mg/kg/12h and 2.358 mg/kg/24h,
respectively; treatment schedule indicated by green circle in Scheme 1A and Figure 1A). Data
presented as mean with standard deviation with points for individual measurements. Number
of mice: 4-5 per group. Healthy mice used as a control: 4-5. Statistical analysis: Dunnett’s
multiple comparison tests. *p< 0.05 as compared to control or as indicated.

Figure S3. The influence of DETA/NO, CORM-A1 and their combination on the (A) tumor
growth kinetics; (B) body weight change of BALB/c mice bearing 4T1 tumors. The treatment
started 7 days after tumor cells transplantation. Mice were euthanized, and tissue samples were
collected for further analysis on the day 14, 21 and 28 after tumor cells transplantation to
investigate the action of substances in the different stages of tumor progression. DETA/NO was
administered intraperitoneally (i.p.) 1.6 mg/kg/24h. CORM-A1 was administered
intraperitoneally (i.p.) 0.5 mg/kg/12h. The number of mice in the experiment: 8 - 12. The results
are presented as a mean values ± standard deviation (A) or calculated as BWC from the formula:
𝐵𝑊𝐶 [%] =𝐵𝑊𝑁
𝐵𝑊𝑂 𝑥 100 − 100%
BWC – Body weight change [%]
BWN – The average body weight of mice in a group on the n-day of the experiment
BWO – The average body weight of mice in a group on the day 0 of experiment
Designations:
- control; - DETA/NO (NO); - CORM-A1 (CO); - DETA/NO + CORM-A1 (NO + CO).
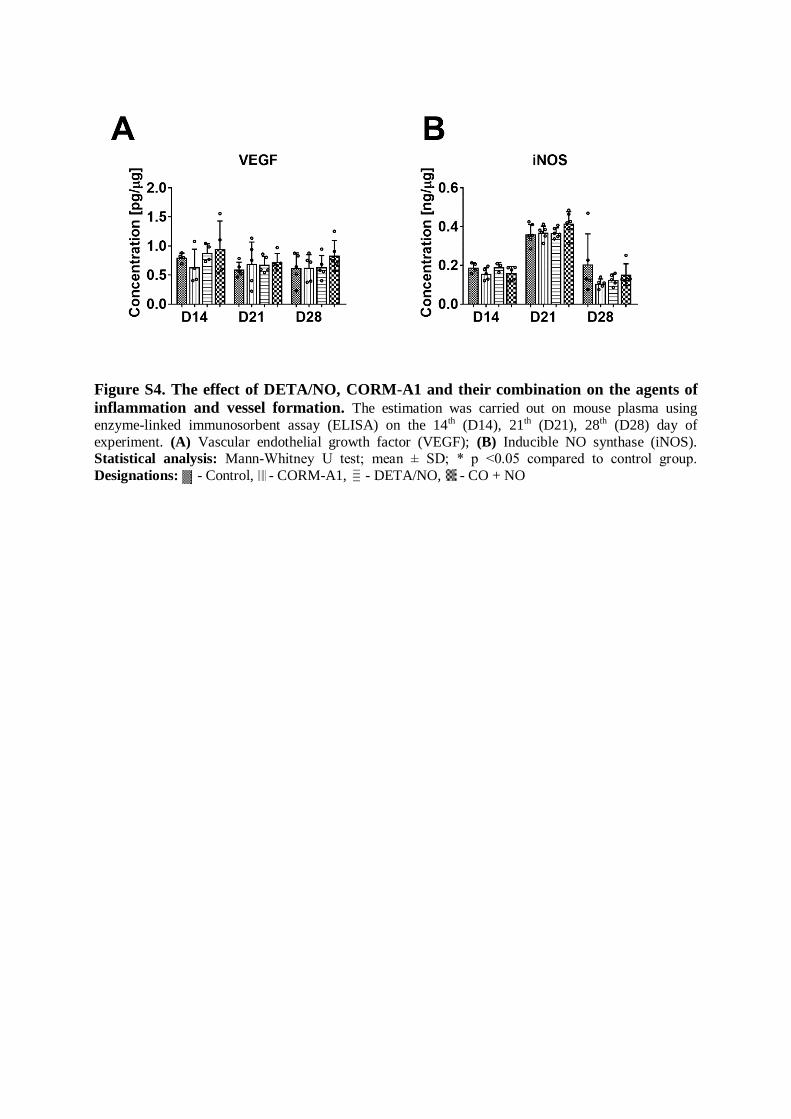
Figure S4. The effect of DETA/NO, CORM-A1 and their combination on the agents of
inflammation and vessel formation. The estimation was carried out on mouse plasma using
enzyme-linked immunosorbent assay (ELISA) on the 14th (D14), 21th (D21), 28th (D28) day of
experiment. (A) Vascular endothelial growth factor (VEGF); (B) Inducible NO synthase (iNOS). Statistical analysis: Mann-Whitney U test; mean ± SD; * p <0.05 compared to control group.
Designations: - Control, - CORM-A1, - DETA/NO, - CO + NO
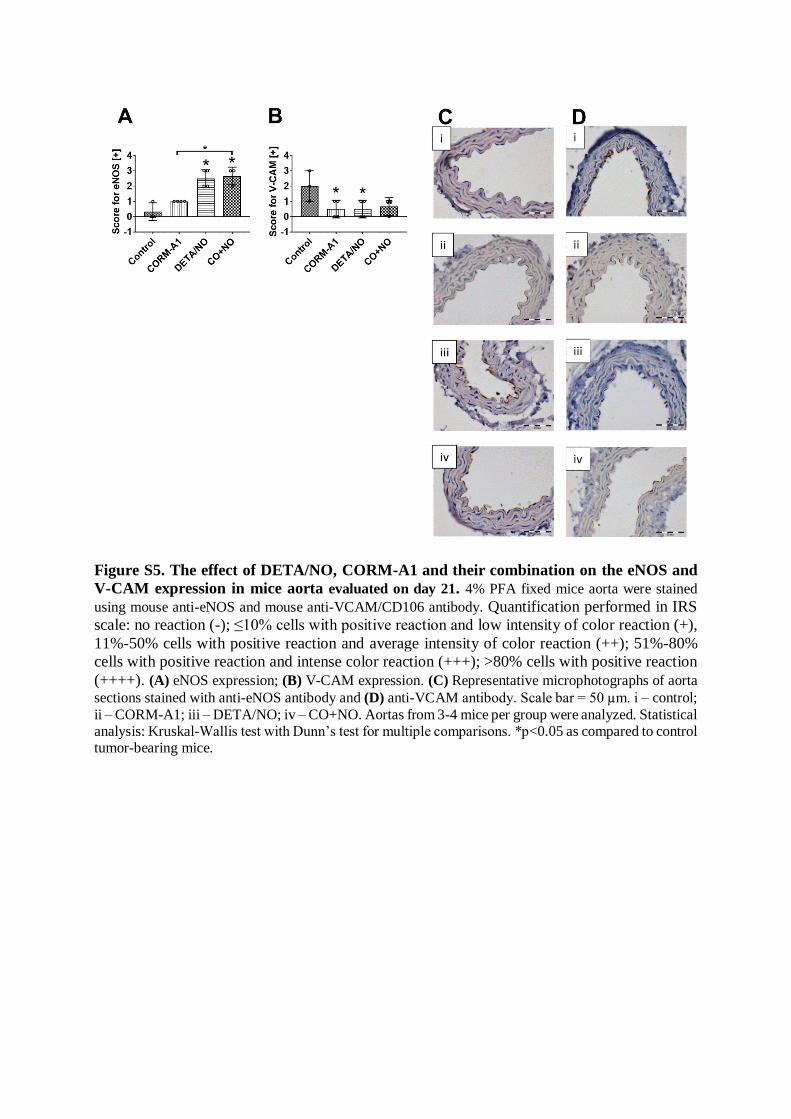
Figure S5. The effect of DETA/NO, CORM-A1 and their combination on the eNOS and
V-CAM expression in mice aorta evaluated on day 21. 4% PFA fixed mice aorta were stained
using mouse anti-eNOS and mouse anti-VCAM/CD106 antibody. Quantification performed in IRS
scale: no reaction (-); ≤10% cells with positive reaction and low intensity of color reaction (+),
11%-50% cells with positive reaction and average intensity of color reaction (++); 51%-80%
cells with positive reaction and intense color reaction (+++); >80% cells with positive reaction
(++++). (A) eNOS expression; (B) V-CAM expression. (C) Representative microphotographs of aorta
sections stained with anti-eNOS antibody and (D) anti-VCAM antibody. Scale bar = 50 µm. i – control;
ii – CORM-A1; iii – DETA/NO; iv – CO+NO. Aortas from 3-4 mice per group were analyzed. Statistical analysis: Kruskal-Wallis test with Dunn’s test for multiple comparisons. *p<0.05 as compared to control tumor-bearing mice.