Przetwarzanie informacji muzycznej w mózgu -...
15
Przetwarzanie informacji muzycznej w mózgu NEUROESTETYKA PIOTR PRZYBYSZ Wyk ł ad monograficzny. UAM Pozna ń 2010
Transcript of Przetwarzanie informacji muzycznej w mózgu -...
Przetwarzanieinformacji muzycznej w
mózgu
NEUROESTETYKA
PIOTR PRZYBYSZ Wykład monograficzny. UAM Poznań 2010

Neuroestetyka muzyki?
• Neuroestetyka sztuk wizualnych a neuropsychologia muzyki
• Czy prawa i reguły przetwarzania przez mózg obrazu i dźwięku różnią się?
• Czy istnieją wspólne zasady estetyczne rządzące poczuciem piękna w muzyce i sztukach wizualnych?
• Przekaz muzyczny w sztukach wielomodalnych
Dźwięk i słyszenie
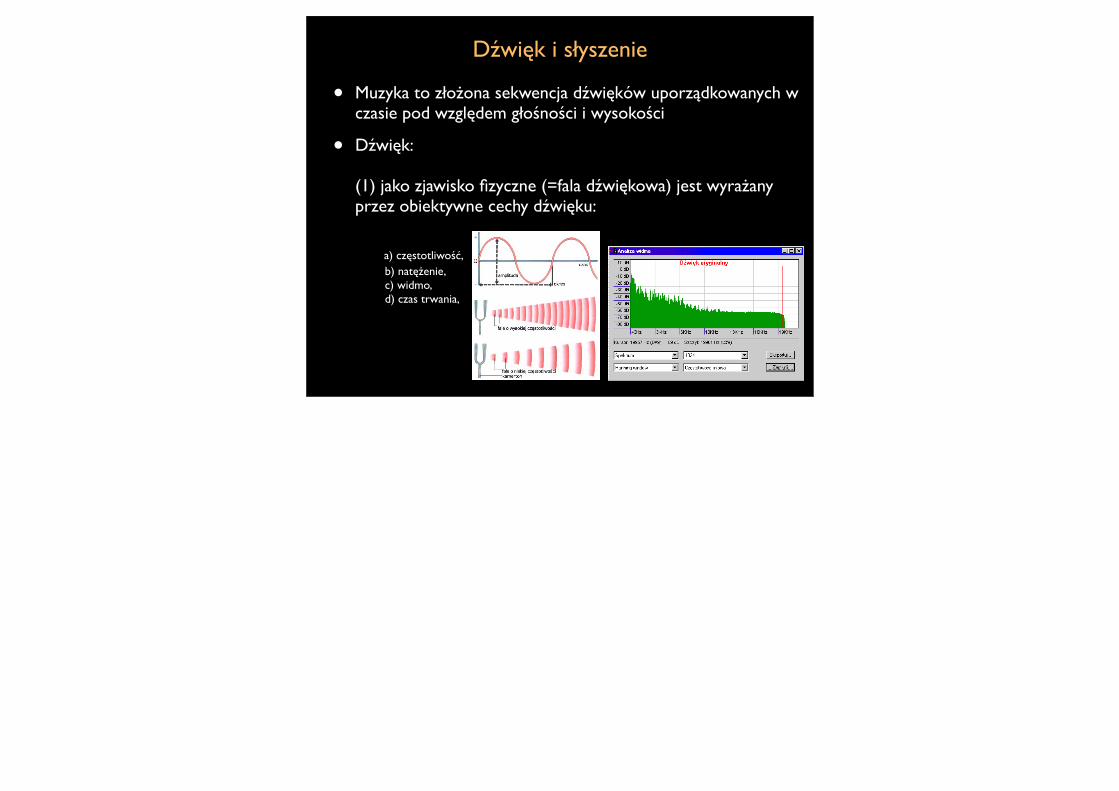
• Muzyka to złożona sekwencja dźwięków uporządkowanych w czasie pod względem głośności i wysokości
• Dźwięk:
(1) jako zjawisko fizyczne (=fala dźwiękowa) jest wyrażany przez obiektywne cechy dźwięku: a) częstotliwość, b) natężenie, c) widmo, d) czas trwania,

(II) jako zjawisko psychologiczne (=wrażenie dzwiękowe) charakteryzowany jest przez a) wysokość, b) głosność, c) barwę, d) czas trwania

Zagadnienie słuchu absolutnego
• Słuch absolutny = zdolność do odczytania wysokości dźwięku bez porównywania z dźwiękiem odniesienia.
• Własność pozamuzyczna, akustyczna, percepcji słuchowej.
• Dotyczy max. 0,1 % populacji (duże rozbieżności danych); częściej spotykany w środowisku osób muzykujących (w szkołach muzycznych ok 15 %); znacznie częściej spotykany wśród nacji posługujących się językami tonalnymi (np. w chińskich szkołach muzycznych do 60 % osób, które zaczęły wcześnie edukację).

Droga słuchowa (1)artists on science
312 NATURE | VOL 434 | 17 MARCH 2005 | www.nature.com/nature
We tend to consider art and culture froma humanistic or historical perspective
rather than a biological one. Yet these prod-ucts of human cognition must have theirorigin in the function and structure of thehuman nervous system. As such, theyshould be able to yield valuable scientificinsights. This line of reasoning is nowheremore evident than in the contemporaryinterest in the neuroscience of music.
Music provides a tool to study numerousaspects of neuroscience, from motor-skilllearning to emotion. Indeed, from a psychol-ogist’s point of view, listening to and produc-ing music involves a tantalizing mix ofpractically every human cognitive function.Even a seemingly simple activity, such ashumming a familiar tune, necessitatescomplex auditory pattern-processing mech-anisms, attention, memory storage andretrieval, motor programming, sensory–motor integration,and so forth (Fig.1).
Likewise, the musician does not considermusic to be monolithic, but recognizeswithin it multiple features includingmelodies, chords, themes, riffs, rhythms andtempos. This complexity — both psychol-ogical and musicological — makes music achallenging topic for a scientific researchprogramme. Increasing numbers of investi-gators are convinced that music can yieldvaluable information about how the brain
Music,the food of neuroscience?Playing, listening to andcreating music involvespractically every cognitivefunction. Robert Zatorreexplains how music canteach us about speech,brain plasticity and eventhe origins of emotion.
Figure 1 The processing of sound waves from a musical instrument. After being transduced into neuralimpulses by the inner ear, information travels through several waystations in the brainstem and midbrainto reach the auditory cortex. The auditory cortex contains distinct subregions that are important fordecoding and representing the various aspects of the complex sound. In turn, information from the audi-tory cortex interacts with many other brain areas, especially the frontal lobe, for memory formation andinterpretation. The orbitofrontal region is one of many involved in emotional evaluation. The motorcortex is involved in sensory–motor feedback circuits, and in controlling the movements needed toproduce music using an instrument.
zattore feature 4/3/05 10:11 am Page 312
Nature Publishing Group© 2005

Droga słuchowa (1I)
Mapy mózgowe i ich przestrajanie
go, natomiast przez pozosta!e 10 lat ˝ycia zachowa! zdolnoÊçpisania muzyki. Tak wi´c przypuszczenia o niezale˝nym prze-twarzaniu mogà byç s!uszne, choç nowsze badania prowadzàdo bardziej wywa˝onej koncepcji, w której przyk!ada si´ wi´k-szà wag´ do cech wspólnych muzyki i j´zyka – funkcji komu-nikacyjnej oraz sk!adni, czyli zbioru regu! okreÊlajàcych w!a-Êciwe kombinacje elementów (odpowiednio nut lub s!ów).Na podstawie wyników badaƒ z wykorzystaniem techniki
neuroobrazowania Aniruddh D. Patel z Neurosciences Insti-tute w San Diego stwierdzi!, ˝e w p!acie czo!owym istniejeobszar, który zajmuje si´ sk!adnià zarówno muzyki, jak i j´-zyka, natomiast pozosta!e okolice mózgu odpowiadajà za in-ne aspekty przetwarzania i j´zyka, i muzyki.
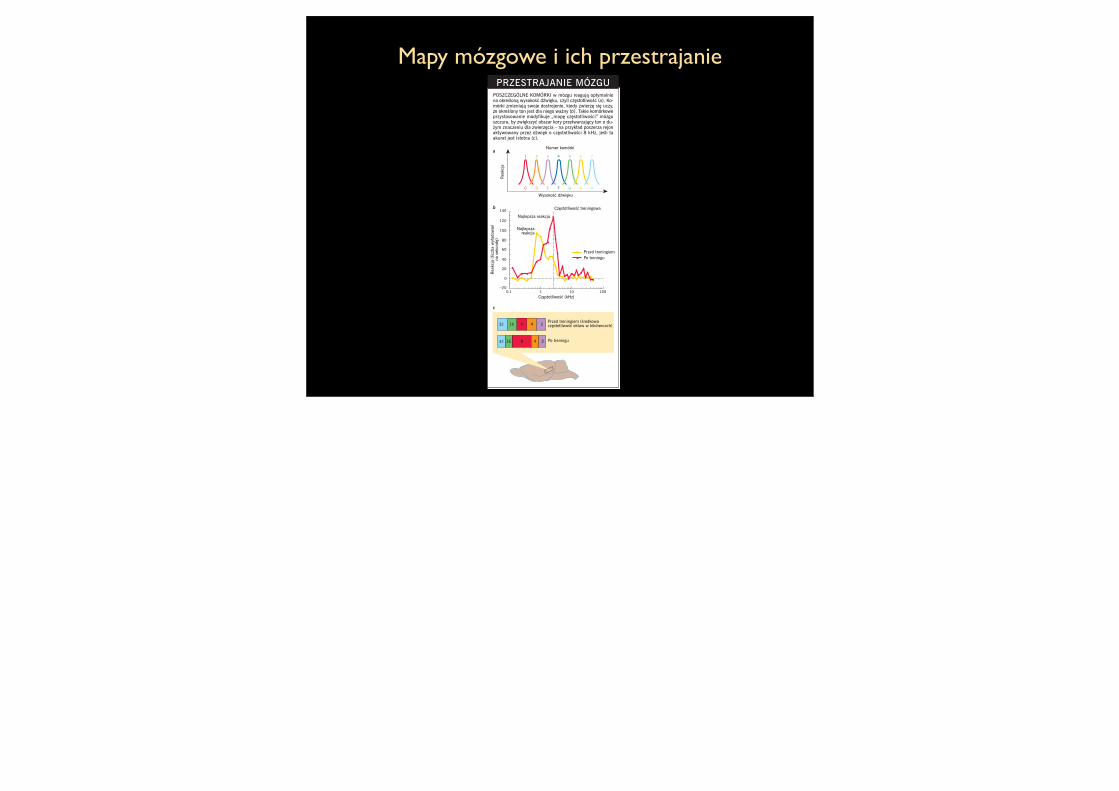
Badania obrazowe dajà tak˝e doÊç precyzyjny wglàd w to,jak mózg reaguje na muzyk´. Ich wyniki naj!atwiej zro-zumieç, jeÊli weêmie si´ pod uwag´ sposób przekazywaniaprzez ucho dêwi´ków do mózgu [ramka na poprzedniej stro-nie]. Podobnie jak inne zmys!y s!uch jest zorganizowany hie-rarchicznie. Sk!ada si´ z ciàgu neuronalnych stacji przetwa-rzania bodêca – od ucha a˝ do poziomu najwy˝szego, czylis!uchowych obszarów kory mózgu. Przetwarzanie dêwi´kówtakich jak te, z których sk!ada si´ muzyka, zaczyna si´ w uchuwewn´trznym (Êlimaku), które rozk!ada z!o˝one dêwi´ki, naprzyk!ad brzmienie skrzypiec, na poszczególne cz´stotliwoÊci.Âlimak przekazuje te informacje dalej jako sekwencje wy!a-dowaƒ neuronalnych, które biegnà przez w!ókna nerwu s!u-chowego nastrojone na ró˝ne cz´stotliwoÊci. Wreszcie se-kwencje te docierajà do kory s!uchowej p!ata skroniowego. NaokreÊlone cz´stotliwoÊci reagujà ró˝ne komórki. Po!o˝oneobok siebie majà zaz´biajàce si´ krzywe strojenia (profilewra˝liwoÊci na cz´stotliwoÊç). W rezultacie, poniewa˝ sàsia-dujàce ze sobà komórki sà nastrojone na podobne cz´stotli-woÊci, na powierzchni kory s!uchowej tworzy si´ „mapa cz´-stotliwoÊci” [ramka z lewej].
Sam odbiór muzyki jest jednak bardziej z!o˝ony. Muzyka tosekwencja dêwi´ków, a jej percepcja polega na spostrzega-niu relacji pomi´dzy nimi. W przetwarzanie ró˝nych aspek-tów muzyki w!àczonych jest wiele obszarów mózgu. Weêmyna przyk!ad dêwi´k, który ma zarówno okreÊlonà cz´stotli-woÊç, jak i g!oÊnoÊç. KiedyÊ badacze przypuszczali, ˝e wy-krycie danej cz´stotliwoÊci zawsze wywo!uje takie same reak-cje komórek, które sà na nià nastrojone.
Jednak w drugiej po!owie lat osiemdziesiàtych, gdy wspól-nie z Thomasem M. McKennà pracowa!em w moim labora-torium w University of California w Irvine, zakwestionowa-liÊmy ten poglàd, zbadawszy kontur melodii, czyli wzórwznoszenia si´ i opadania linii melodycznej, który stanowipodstaw´ ka˝dej melodii. NapisaliÊmy melodie sk!adajàcesi´ z tych samych pi´ciu dêwi´ków, ale ró˝niàce si´ konturem,i rejestrowaliÊmy reakcje pojedynczych neuronów w korze s!u-chowej kotów. Okaza!o si´, ˝e reakcje komórek ró˝ni!y si´w zale˝noÊci od konturu. Zale˝a!y od umiejscowienia dane-go dêwi´ku w melodii. Komórki mogà silniej reagowaç nadêwi´k poprzedzany przez inne ni˝ na dêwi´k rozpoczyna-jàcy sekwencj´. Ponadto reagujà na ten sam dêwi´k inaczej,gdy jest on elementem konturu wznoszàcego si´ (dêwi´ki co-raz wy˝sze), a inaczej, kiedy wchodzi w sk!ad konturu opa-dajàcego lub mieszanego. Wyniki te pokazujà, ˝e przebiegmelodii ma du˝e znaczenie – przetwarzanie s!uchowe niepolega na prostym odwzorowaniu dêwi´ku jak w telefonieczy zestawie hi-fi.
Choç wi´kszoÊç badaƒ koncentruje si´ na melodii, rytm(wzgl´dny czas trwania dêwi´ków i odst´pów mi´dzy nimi),harmonia (wzajemna relacja wysokoÊci co najmniej dwóchrównoczeÊnie brzmiàcych tonów) i barwa dêwi´ku (charak-terystyczna ró˝nica w brzmieniu tego samego tonu wytwa-rzanego przez dwa ró˝ne instrumenty) tak˝e sà obiektem na-ukowych dociekaƒ. Wyniki wielu badaƒ nad rytmem sugerujà,
54 ÂWIAT NAUKI GRUDZIE¡ 2004
LAU
RIE
GR
ACE
1
32 16 8 4 2
32 16 8 4 2
2 3 4 5 6 7
C D E F G A H
140
120
0.1 1 10 100
100
80
60
40
20
0
–20
POSZCZEGÓLNE KOMÓRKI w mózgu reagujà optymalniena okreÊlonà wysokoÊç dêwi´ku, czyli cz´stotliwoÊç (a). Ko-mórki zmieniajà swoje dostrojenie, kiedy zwierz´ si´ uczy,˝e okreÊlony ton jest dla niego wa˝ny (b). Takie komórkoweprzystosowanie modyfikuje „map´ cz´stotliwoÊci” mózguszczura, by zwi´kszyç obszar kory przetwarzajàcy ton o du-˝ym znaczeniu dla zwierz´cia – na przyk!ad poszerza rejonaktywowany przez dêwi´k o cz´stotliwoÊci 8 kHz, jeÊli taakurat jest istotna (c).
a
b
c
Przed treningiem (Êrodkowacz´stotliwoÊç oktaw w kilohercach)
Po treningu
Przed treningiemPo treningu
Cz´stotliwoÊç treningowa
Numer komórki
Rea
kcja
Rea
kcja
(lic
zba
wy!
adow
aƒna
sek
und´
)
WysokoÊç dêwi´ku
Najlepsza reakcja
Najlepszareakcja
Cz´stotliwoÊç (kHz)
PRZESTRAJANIE MÓZGU

Muzyka w mózgu
• Z
Despite the gaps, scientists are piecing togethera general understanding of where the brain “hears”music. We know, for example, that both sides, orhemispheres, of the brain are involved, thoughasymmetrically. For a long time, it was common tobelieve in a distinct division between the left brain’sprocessing of language (the side that also handlesreasoning tasks) and the right brain’s processing ofmusic (the half that contains emotional and spatialinformation). Many medical textbooks includedthis simplified theory until the 1980s. In recentyears, however, researchers have established thatinjuries to either side can impair musical abilities.This happens not only in the case of damage to theauditory areas in the temporal lobe but also whenassociated regions of the frontal lobe and the pari-
etal regions are affected. (If the Heschl’s gyrus is de-stroyed on both sides, incidentally, total deafnessdoes not occur. Instead the ability to distinguish be-tween various sounds is severely impaired. A pa-tient with this condition would not be able to un-derstand language or perceive music at all.)
Early stages of music perception, such as pitch(a note’s frequency) and volume, occur in the pri-mary and secondary auditory cortices in bothhemispheres. The secondary auditory areas, whichlie in a half-circle formation around the primaryauditory cortex, process more complex music pat-terns of harmony, melody and rhythm (the dura-tion of a series of notes). Adjoining tertiary audi-tory areas are thought to integrate these patternsinto an overall perception of music. Farther for-
28 SCIENTIFIC AMERICAN MIND
THO
MA
S B
RA
UN
G&
G
Where Does the Brain “Hear”?
Left
RhythmRhythm
Parietal lobe
OccipitallobeTemporal
lobe
CerebellumRhythm
Frontallobe
Rhythm
Left Hemisphere: RhythmMusic is processed in various areas of the brain, whichchange depending on the focus of the listener and his orher experience. When the brain of an amateur musicianprocesses simple rhythmic relations in a melody, such asthe variance in length between certain tones, he utilizesthe premotor, or movement-preparation, regions as well assections of the parietal lobe in the left hemisphere. If thetemporal relations among the tones are more complex,premotor and frontal lobe regions in the right hemispherebecome active. In both cases, the cerebellum (which iscommonly supposed to be involved in movement control)also participates. In contrast, musicians who are discern-ing between rhythms or meter predominantly employ partsof the frontal and temporal lobes in the right hemisphere.Rhythmic relations display a similar picture: people whoare not musically trained process in the left side, where-as experienced musicians generally do so in the right.
Right Hemisphere: Pitch and MelodyWhen a musical layperson compares different pitches, theright posterior frontal lobe and right upper temporal lobeconvolution are active. The tones are stored for future useand comparison in the auditory working memory locatedin the temporal region. The middle and lower areas of thetemporal lobe are also active when processing more com-plex musical structures or structures being stored in mem-ory for a longer period. In contrast, professional musiciansshow increased activity in the left hemisphere when theyare differentiating among pitches or perceiving chords.
When the listener is focusing on whole melodiesrather than individual tones or chords, entirely differentsections of the brain become active: in addition to the pri-mary and secondary auditory cortices, the auditory asso-ciative regions in the upper temporal lobe are at work. Inthis case, the activity is once again concentrated in theright hemisphere.
Right
Parietal lobe
Occipitallobe
TemporallobeCerebellum
Frontal lobe
Auditorycortex
Complexmusicalstructures
Auditoryworkingmemory
Melodies
Pitchcomparison
Melodies
COPYRIGHT 2003 SCIENTIFIC AMERICAN, INC.
Zasady przetwarzania muzyki:
a) rozproszoność/asymetria półkulowa (ograniczona), b) hierarchiczność, c) modularność.

R E V I E W
690 VOLUME 6 | NUMBER 7 | JULY 2003 NATURE NEUROSCIENCE
foot (thus a direct connection to tapping inFig. 1; see accompanying review36 in thisissue). Both the melodic and temporal path-ways send their respective outputs to eitherthe ‘musical lexicon’ or the ‘emotion expres-sion analysis’ component. The musical lexiconis a representational system that contains allthe representations of the specific musicalphrases to which one has been exposed duringone’s lifetime. The same system also keeps arecord of any new incoming musical input.Accordingly, successful recognition of a famil-iar tune depends on a selection procedure thattakes place in the musical lexicon. The output of the musical lexiconcan feed two different components, depending on task requirements.If the goal is to sing a song like “Happy Birthday,” the correspondingmelody, represented in the musical lexicon, will be paired with its asso-ciated lyrics that are stored in the phonological lexicon and will betightly integrated and planned in a way that is suitable for vocal pro-duction. If the task requires retrieving nonmusical information abouta musical selection, such as naming the tune or retrieving a relatedexperience from memory, the associated knowledge stored in the ‘asso-ciative memories’ component will be invoked.
In parallel with memory processes, but independently, the percep-tual modules will feed their outputs into an emotion expression analy-sis component, allowing the listener to recognize and experience theemotion expressed by the music37. This emotional pathway also con-tributes to recognition via the musical lexicon. Emotion expressionanalysis is a pivotal processing component because music has thepower to elicit strong emotional responses. It takes as input emotion-specific musical features, such as mode (e.g. major or minor) andtempo (e.g. slow or fast) as computed by the melodic and temporalpathways, respectively. What is currently unclear is to what extent thisemotion expression analysis component is specific to music asopposed to being involved in more general kinds of emotional pro-cessing. A patient who could recognize pieces of music but could notrespond emotionally to them, while being able to respond emotionallyto other media, would be informative here.
In sum, we propose a modular functional architecture for musicprocessing that comprises several component modules. Our model(Fig. 1) also describes the pathways of information flow among thesecomponent modules. The characterization of each box and arrow rep-resented in the model has been provided by the detailed study ofbrain-damaged patients with selective impairments or preservationsof particular musical abilities (for review, see ref. 24). The inclusion of
three new output modules again stems from the study of neurologicalpatients: singing performance in aphasic patients38 and tapping abili-ties in adults suffering from congenital amusia39. Thus, our proposedmodular architecture for processing music provides a plausible frame-work for further investigating the neural mechanisms of music pro-cessing.
ACKNOWLEDGMENTSBased on research supported by grants from the Natural Sciences and EngineeringResearch Council of Canada and the Canadian Institutes of Health Research to I.P.We thank C. Palmer and T. Griffiths for insightful comments made on an earlierdraft.
Received 18 March; accepted 21 April 2003Published online 25 June 2003; doi:10.1038/nn1083
1. Handel, S. Listening: an Introduction to the Perception of Auditory Events (MITpress, Cambridge, Massachusetts, 1989).
2. Bregman, A. Auditory Scene Analysis. The Perceptual Organization of Sound. (MITpress, London, 1990).
3. Zatorre, R. & Peretz, I. (eds.) The Biological Foundations of Music (NY Acad. Sci.,New York, 2001).
4. Fodor, J. The Modularity of Mind (MIT press, Cambridge, Massachusetts, 1983).5. Fodor, J. The Mind Doesn’t Work That Way (MIT press, Cambridge, Massachusetts,
2001).6. Coltheart, M. Modularity and cognition. Trends Cogn. Sci. 3, 115–120 (1999).7. Gardner, H. Musical intelligence. in Frames of Mind (ed. Gardner, H.) 31–58 (Basic
Books, New York, 1983).8. Jackendoff, R. Consciousness and the Computational Mind (MIT Press, Cambridge,
Massachusetts, 1987).9. Peretz, I. & Morais, J. Music and modularity. Contemporary Music Rev. 4, 277–291
(1989).10. Peretz, I. et al. Functional dissociations following bilateral lesions of auditory cortex.
Brain 117, 1283–1302 (1994).11. Peretz, I., Belleville, S. & Fontaine, S. Dissociations entre musique et langage après
atteinte cérébrale: un nouveau cas d’amusie sans aphasie. Can. J. Exp. Psychol. 51,354–368 (1997).
12. Griffiths, T.D. et al. Spatial and temporal auditory processing deficits following righthemisphere infarction: a psychophysical study. Brain 120, 785–794 (1997).
13. Wilson, S.J. & Pressing, J. Neuropsychological assessment and the modeling of
Acoustic input
Pitch organization
Intervalanalysis
Tonalencoding
Contouranalysis
Acoustic analysis
Temporalorganization
Rhythmanalysis
Meteranalysis
Acoustic-to-phonologicalconversation
Phonologicallexicon
Speaking
Musicallexicon
Emotionexpressionanalysis
Tapping
Associativememories
Vocal planformation
Singing
Ivelisse Robles
Figure 1 A modular model of music processing.Each box represents a processing component,and arrows represent pathways of informationflow or communication between processingcomponents. A neurological anomaly may eitherdamage a processing component (box) orinterfere with the flow of information betweentwo boxes. All components whose domainsappear to be specific to music are in green;others are in blue. There are three neurallyindividuated components in italics—rhythmanalysis, meter analysis and emotion expressionanalysis—whose specificity to music is currentlyunknown. They are represented here in blue, butfuture work may provide evidence forrepresenting them in green.
©20
03 N
atur
e Pu
blis
hing
Gro
up h
ttp://
ww
w.n
atur
e.co
m/n
atur
eneu
rosc
ienc
e
Isabelle Peretz & Max Colthear (2003) Modularity of music processing, Nature Review Neuroscience, vol.6, iss. 7.
Przypadek Maurice Ravela
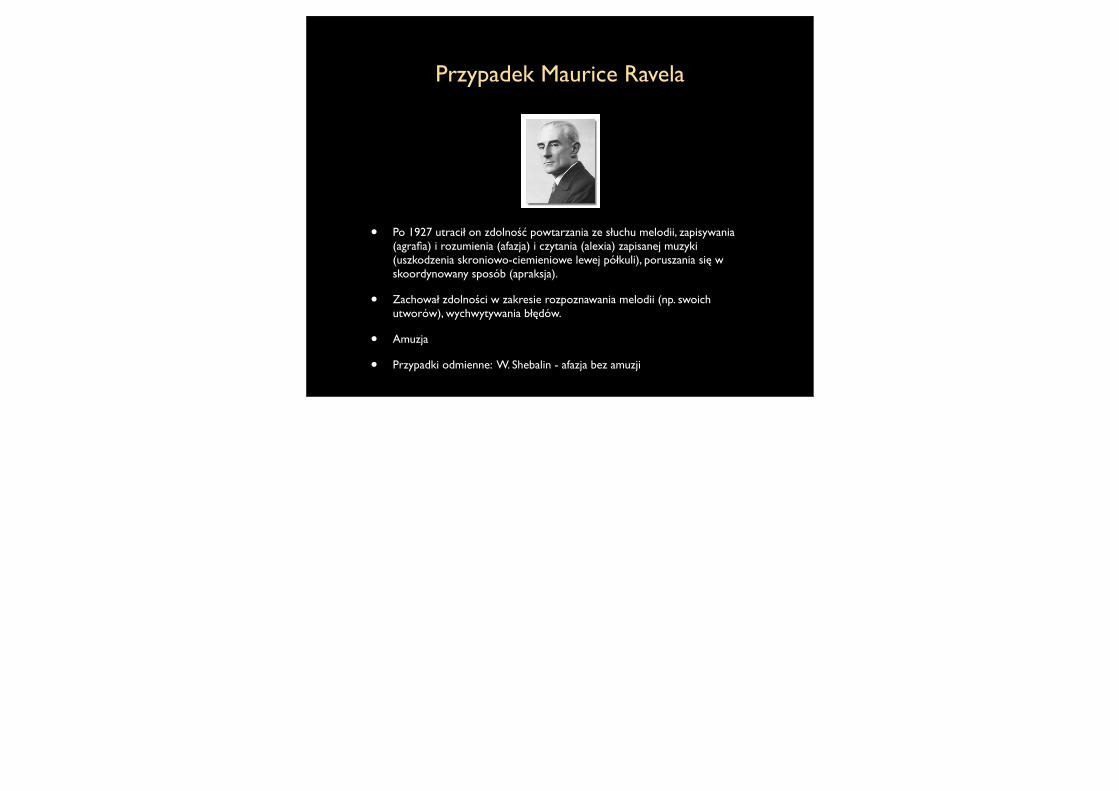
• Po 1927 utracił on zdolność powtarzania ze słuchu melodii, zapisywania (agrafia) i rozumienia (afazja) i czytania (alexia) zapisanej muzyki (uszkodzenia skroniowo-ciemieniowe lewej półkuli), poruszania się w skoordynowany sposób (apraksja).
• Zachował zdolności w zakresie rozpoznawania melodii (np. swoich utworów), wychwytywania błędów.
• Amuzja
• Przypadki odmienne: W. Shebalin - afazja bez amuzji

Mózgi muzyków i nie muzykówarticles
nature neuroscience • volume 5 no 7 • july 2002 689
frequency and ranged from 78% (1,100 Hz, P < 0.0001) to 144%(5,600 Hz, P < 0.0001).
We next averaged the peak-to-peak N19m-P30m dipoleamplitudes for each group (Fig. 3a). Amateur musicians showed an intermediate average increase of 37 ± 11% over non-musicians (F1,23 = 7.8, P < 0.05). The differencebetween amateur musicians and non-musicianswas significant only in the low frequency range(<1,000 Hz, P < 0.05). There was a frequency !group interaction (F10,165 = 2.9, P < 0.01) thatranged from 77% (100 Hz, P < 0.01) to 14%(2,500 Hz, nonsignificant (n.s.)).
In professional musicians, dipole amplitudeswere significantly larger in the right than in the lefthemisphere at all frequencies. On average, theN19m-P30m signal was 21 ± 9% larger in the righthemisphere (F1,11 = 47.3, P < 0.0001). Comparedto non-musicians, professional musicians had an
Fig. 2. Auditory evoked N19m-P30m signals and 3Dgray matter surface reconstructions of HG for all sub-jects aligned in the same order. Both the neurophysio-logical and the anatomical data show a large increase inprofessional musicians and a smaller increase in ama-teur musicians. Left, dipole strength of the primarycortical response at 500 Hz. Source activities of theright (thick lines) and left (thin lines) hemispheres aresuperimposed. Right, highlighted areas show theamHG for each subject, aligned in the same order asthe primary evoked responses.
average signal that was 115 ± 18% larger over all frequencies inthe right hemisphere (F1,22 = 73.4, P < 0.0001) and 87 ± 17%larger in the left hemisphere (F1,22 = 43.6, P < 0.0001). Non-musi-cians, by contrast, did not have significantly larger dipole ampli-tudes in the right than in the left hemisphere (5 ± 9%, F1,11 = 3.6,n.s). In amateur musicians, dipole amplitudes were 19 ± 14%larger in the right than they were in the left hemisphere (F1,12 =17.8, P < 0.01). This was significant at three frequencies (100 Hz,500 Hz and 1,100 Hz, P < 0.05).
There was a pronounced difference between the early and lateauditory cortical responses. Whereas the early N19m-P30m com-plex was much larger in musicians, the late N100m component,which was evoked by the onset of the sinusoidal tones, showedsimilar amplitudes in all three groups over all frequencies (Fig. 3b).For all groups, the N100m was largest around 1,000 Hz.
Morphology of Heschl’s gyrusThe large neurophysiological difference between musicians and non-musicians at the level of the PAC coincided with a large
Fig. 1. The auditory stimulus, evoked magnetic fields and corticalanatomy. (a) Stimulus waveform. A modulation frequency of 26–37 Hzwas superimposed on sinusoidal tones with carrier frequencies of100–5,600 Hz to measure the responses to tone onset and to each mod-ulation cycle. (b) Typical averaged response at an MEG sensor over theright auditory cortex shows middle latency onset components P30m andP50m, long latency components N100m and the sustained field (SF). Theresponses to the modulation cycles appear superimposed on the SF. (c) Typical early N19m-P30m response of the PAC after deconvolutionof the modulated signals. (d, e) Source model with one equivalent dipolein each hemisphere depicted in sagittal and transversal T1-weighted MRIimages. The transversal section is parallel to the supratemporal plane.The source activity is modeled with dipoles drawn in the left and righthemispheres. (f) Three-dimensional (3D) gray matter surface recon-struction of the right HG. The FTS defines the anterior boundary andthe most posterior HS defines the posterior boundary. The first trans-verse HG is sometimes divided by the SI, a shallow sulcus which does notextend over its full length.
a
b
c
d
e
f
©20
02 N
atur
e Pu
blis
hing
Gro
up h
ttp://
neur
osci
.nat
ure.
com
articles
nature neuroscience • volume 5 no 7 • july 2002 691
and amateur musicians showed an intermediate gray matter volume (189–798 mm3). The total volume of HG, including white and gray matter, showed a larger variance and could not separate the groups (non-musicians, 1,955–4,694 mm3; profes-sionals, 2,629–6,297 mm3; amateurs, 2,151–7,603 mm3). Theasymmetry measures (Methods) showed only one significanteffect: the total volume of HG was 14% larger in the right hemi-sphere of professional musicians (right, 3,986 ± 305 mm3; left,3,468 ± 263 mm3; !HG = 0.14 ± 0.04; F1,11 = 11.7, P < 0.01).
Correlation with musical aptitudeFor all three groups, there was a high correlation between theN19m-P30m signal amplitude and musical aptitude as mea-sured by the AMMA tonal test (Fig. 4b). Both the primarysource activity and the tonal score of musical aptitude com-pletely separated the professional musicians from the non-musicians. The amateur musicians showed an intermediaterange of musical aptitude and dipole amplitudes that over-lapped with the two other groups. Within groups, the correla-tion was significant for non-musicians (r = 0.55, P < 0.05), butnot for amateurs (r = 0.19, n.s.) or professionals (r = 0.05, n.s.).In general, professional musicians had high AMMA scores, highsignal amplitudes and large gray matter volumes of amHG.When analysis was restricted to amateur and professional musi-cians, the correlation was significant (r = 0.52, P < 0.01).
Similarly, the gray matter volume of amHG was highly cor-related with musical aptitude (Fig. 4c). Within groups, the cor-relation was significant for non-musicians (r = 0.71, P < 0.001)and amateurs (r = 0.56, P < 0.05), but not for professionals (r = 0.40, n.s.). When all amateurs and professionals were com-bined, however, the correlation was highly significant (r = 0.70,P < 0.0001). This correlation was smaller when considering thegray matter volume of aHG in its full lateral extent (r = 0.44, P< 0.01) and was nonsignificant when the whole gray mattervolume of HG was calculated (r = 0.26, n.s.). No correlationwas found between musical aptitude and white matter volumesof HG.
Under the assumption that anatomical size determined thesignal strength, a partial correlation was calculated to eliminatethe influence of amHG gray matter volume of on the correla-tion between N19m-P30m amplitude and AMMA score. Thispartial correlation was only r = –0.04 (n.s.), indicating thatanatomical size was the key parameter.
Influence of external variablesWe found no influence of the covariates sex, age or head sizeon either the early dipole amplitudes or on the gray matter vol-ume of amHG. To exclude influences of attention during MEGrecording and of the frequency modulation in the stimulus, wecarried out two additional control sessions in a subgroup of 24stochastically selected subjects. While watching a video, sub-jects detected deviant tones of a different frequency (1,100 Hzinstead of the standard 500 Hz) and indicated them by buttonpress in the attention experiment. We found no significant effectof attention on the primary N19m-P30m component. Withinnoise limits, the N19m-P30m signals for the onset of pure sinu-soidal tones agreed with the signals deconvoluted from themodulated tones23,40.
DISCUSSIONHere we found a large difference in the early neurophysiologicalactivity of the auditory cortex in musicians versus non-musicians,using simple tonal stimuli. In addition, we found strong correla-tions of this activity with the gray matter volume of amHG andwith musical aptitude. Using partial correlations, we showed thatthe gray matter volume of amHG was the key parameter influ-encing the early evoked response of the auditory cortex. The larger gray matter volume in professional musicians was mostpronounced for amHG (130% greater than in non-musicians)and dropped to 37% more volume than in non-musicians whenthe whole HG was used for anatomical reference. Together withevidence from previous EEG20 and MEG21–23 studies that local-ized the origin of the primary auditory-evoked N19-P30 sourceactivity to amHG, our findings provide evidence for the aug-mentation of PAC gray matter in musicians.
This functional–anatomical interpretation is consistent withthe microanatomical24–29 finding that amHG comprises mostof the primary granular core field. However, the macroanatom-ically defined amHG is only an approximate measure of thelocation and extent of PAC, because there is considerable indi-vidual variability27–31. Non-primary cortical fields are mostlikely to be found near the lateral and posterior edges ofamHG2,27–29. Thus, the larger volume of gray matter in musi-cians may comprise PAC as well as surrounding belt areas. Thestrong functional–anatomical correspondence at the level ofamHG is probably related to the stimulation with sinusoidaltones. Whereas functional MRI41,42 and PET43 studies have shown
Fig. 4. Correlations between early neurophysiological source activity, amHG gray matter volume and musical aptitude. (a) The N19m-P30mdipole moment was strongly correlated with the mean gray matter volume of amHG. Values were averaged over the right and left hemispheres.(b, c) The tonal raw score of musical aptitude (AMMA test) was highly correlated with both the N19m-P30m dipole moment (b) and the graymatter volume of amHG (c).
©20
02 N
atur
e Pu
blis
hing
Gro
up h
ttp://
neur
osci
.nat
ure.
com
Tekst
Schneider P, Scherg M, Dosch HG, Specht HJ, Gutschalk A, Rupp A. Morphology of Heschl's gyrus reflects
enhanced activation in the auditory cortex of musicians. Nat Neurosci. 2002 Jul;5(7):688-94.

REPORTS
Increased Cortical Representation of the Fingers of the Left Hand in String Players Thomas Elbert, Christo Pantev, Christian Wienbruch,
Brigitte Rockstroh, Edward Taub
Magnetic source imaging revealed that the cortical representation of the digits of the left hand of string players was larger than that in controls. The effect was smallest for the left thumb, and no such differences were observed for the representations of the right hand digits. The amount of cortical reorganization in the representation of the fingering digits was correlated with the age at which the person had begun to play. These results suggest that the representation of different parts of the body in the primary somatosensory cortex of humans depends on use and changes to conform to the current needs and experiences of the individual.
Evidence has accumulated over the past two decades that indicates that alterations in afferent input can induce plastic reorga- nizational changes within the adult mam- malian central nervous system (1). Changes in the relation between peripheral sensory fields and their central representations have been observed for the somatosensory (2), visual (1, 3, 4), and auditory systems (5), and comparable changes also have been found for motor systems (6). In many of these experiments, the removal of afferent input from a cortical region resulted in an "invasion" by a neighboring area whose innervation remained intact. For example, the cortical region representing a digit be- fore amputation in owl monkeys could be activated after amputation by tactile stim- ulation of an intact adjacent finger (7). The changes noted were of the order of a few millimeters. More extensive plastic changes have recently been observed after the abo- lition of input from larger portions of the body-for example, with somatosensory
deafferentation of an entire forelimb in ma- caque monkeys (8) and upper extremity amputation in humans (9-11).
In addition, it has been shown in studies with owl monkeys that a prolonged increase of tactile stimulation to the distal pad of one or two phalanges results in a greatly increased cortical representation specific to that portion of the fingers (12, 13). Evi- dence has also been reported that suggests an increased cortical representation of the index finger used in reading by blind Braille readers (14).
Violinists and other string players pro- vide a good model for the study of the effects of differential afferent input to the tw,o sides of the brain in humans. During their practice or performance, the second to the fifth digits (D2 to D5) of the left hand are continuously engaged in fingering the strings, a task that involves considerable manual dexterity and enhanced sensory stimulation. At the same time, the thumb grasps the neck of the instrument and, al-
though not as active as the fingers, engages in relatively frequent small shifts of position and pressure. The right hand, which manip- ulates the bow, participates in a task involv- ing much less individual finger movement and fluctuation in tactile and pressure in- put. Here, we present data from magnetic source imaging that indicates that the cere- bral cortices of string players are different from the cortices of controls in that the representation of the digits of the left hand is substantially enlarged in the cortices of string players.
Nine musicians (six violinists, two cel- lists, and one guitarist) who had played their instruments for a mean period of 11.7 years (range, 7 to 17 years) served as sub- jects for our study. Six nonmusicians served as controls (15). The mean age for both groups was 24 ? 3 years. Before our inves- tigation, the musicians kept a diary for 1 week, recording the amount of time prac- ticed per day (mean 9.8 ? 8.4 hours per week), and had estimated the amount of time spent practicing during the previous month and year (10.8 ? 8.8 hours per week).
During the experimental session, so- matosensory stimulation was delivered to the first digit and, in separate runs, to the fifth digit of either hand. Stimulation con- sisted of light superficial pressure applied by means of a pneumatic stimulator with the use of standard, nonpainful stimulation in- tensity (9, 16, 17). The data (Fig. 1) indi- cate that the center of cortical responsivity for tactile stimulation of the digits of the left hand was shifted in musicians as com- pared to that in controls, while at the same time the strength of response increased. The topographic shift was toward the mid- sagittal plane, which, along the surface of the postcentral gyrus, is toward the region
A Dl D5 30- B E 3 C D~~~~~~~~~~~~~~~~~~ E25* 2.5 -
String players 2.5 ~20 ~2-
_ 15 c 15 -i 0 String players
o _ -
10 1 Controls * -
__ O *e~~~~~~~~~~~~~C O :5-
1* ~0.5 - o Controls c
U String players 0 5 10 15 20 D 0 0.5 1 1.5 2 2.5 O~ Controls |Age at inception of musical practice Distance, Dl to D5, left hand (cm) Fig. 1. (A) Equivalent current dipoles elicited by stimulation of the thumb (D1) and fifth finger (D5) of the left hand are superimposed onto an MRI (magnetic resonance imaging) reconstruction of the cerebral cortex of a control, who was selected to provide anatomical landmarks for the interpretation of the MEG-based localization. The arrows represent the location and orientation of the ECD vector for each of the two digits' averaged across musicians (black) and controls (yellow). The length of the arrows represents the mean magni- tude of the dipole moment for the two digits in each group. The average locations of D5 and Dl are shifted medially for the string players compared to
controls; the shift is larger for D5 than for Dl. The dipole moment is also larger for the musicians' D5, as indicated by the greater magnitude of the black arrow. (B) The magnitude of the dipole moment as a function of the age of inception of musical practice; string players are indicated by filled circles, control subjects by hatched circles. Note the larger dipole moment for indi- viduals beginning musical practice before the age of 12. (C) Scatterplot of the Euclidean distances (in centimeters) between the cortical representations of Dl and D5. This distance for the musicians' left hands was greater than that in controls, but this difference is not statistically significant.
SCIENCE * VOL. 270 * 13 OCTOBER 1995 305
Tekst
Elbert T, Pantev C, Wienbruch C, Rockstroh B, Taub E. Increased cortical representation of the fingers of the left hand in
string players Science, 1995 Oct 13; 270(5234): 305-7.

Tekst
Schlaug G, Jäncke L, Huang Y, Staiger JF, Steinmetz H. Increased corpus callosum size in musicians. Neuropsychologia. 1995 Aug; 33(8):1047-55.