POLITECHNIKA WARSZAWSKA WYDZIAŁ BUDOWNICTWA, MECHANIKI...
76
Promienie kosmiczne - nowe wyniki, nowe interpretacje POLITECHNIKA WARSZAWSKA POLITECHNIKA WARSZAWSKA WYDZIAŁ BUDOWNICTWA, MECHANIKI I WYDZIAŁ BUDOWNICTWA, MECHANIKI I PETROCHEMII W PŁOCKU PETROCHEMII W PŁOCKU
Transcript of POLITECHNIKA WARSZAWSKA WYDZIAŁ BUDOWNICTWA, MECHANIKI...

Promienie kosmiczne - nowe wyniki,
nowe interpretacje
POLITECHNIKA WARSZAWSKAPOLITECHNIKA WARSZAWSKAWYDZIAŁ BUDOWNICTWA, MECHANIKI I WYDZIAŁ BUDOWNICTWA, MECHANIKI I
PETROCHEMII W PŁOCKUPETROCHEMII W PŁOCKU
Warsaw University of Technology
Off-Campus Płock
J. KempaJ. Kempa
Cathedral and Castle in Plock
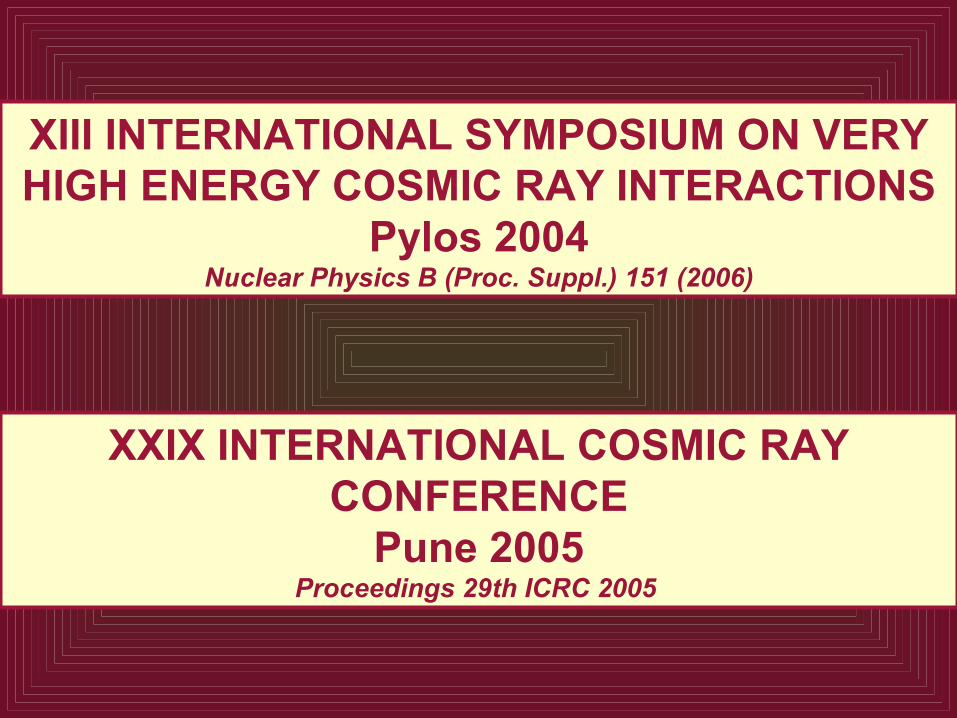
XIII INTERNATIONAL SYMPOSIUM ON VERY HIGH ENERGY COSMIC RAY INTERACTIONS
Pylos 2004Nuclear Physics B (Proc. Suppl.) 151 (2006)
XXIX INTERNATIONAL COSMIC RAY CONFERENCE
Pune 2005Proceedings 29th ICRC 2005
ŹRÓDŁA
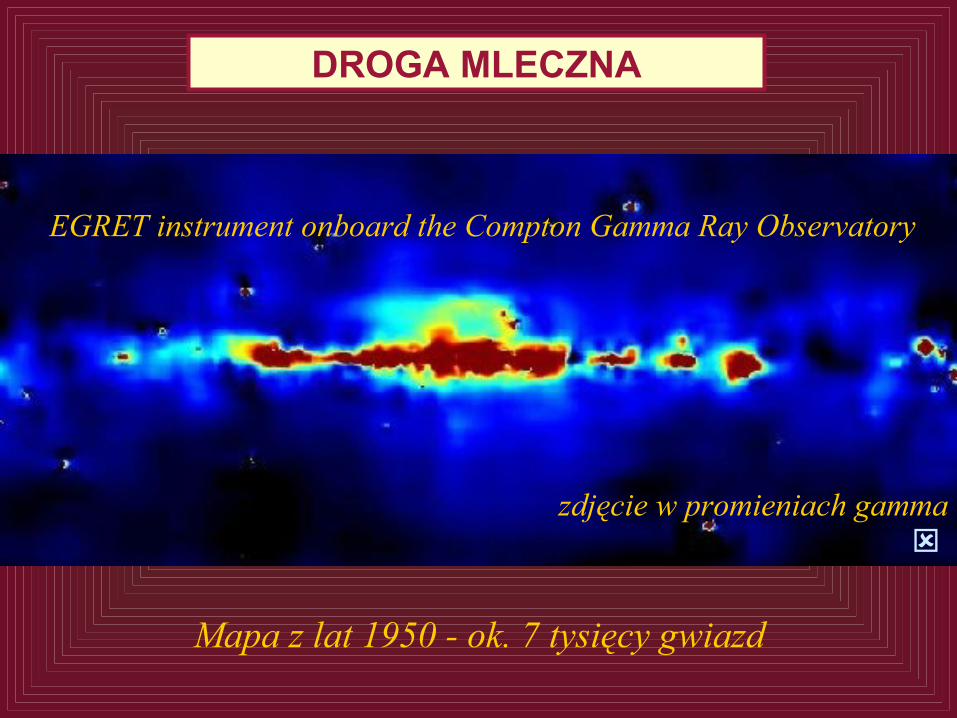
Mapa z lat 1950 - ok. 7 tysięcy gwiazd
EGRET instrument onboard the Compton Gamma Ray Observatory
zdjęcie w promieniach gamma
DROGA MLECZNA
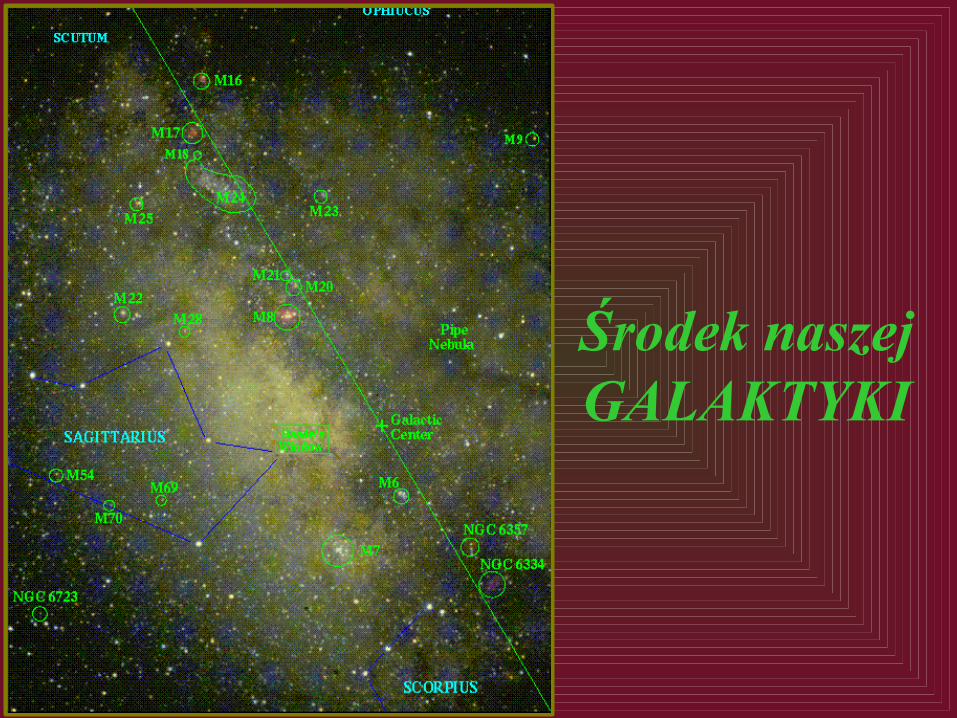
Środek naszejGALAKTYKI
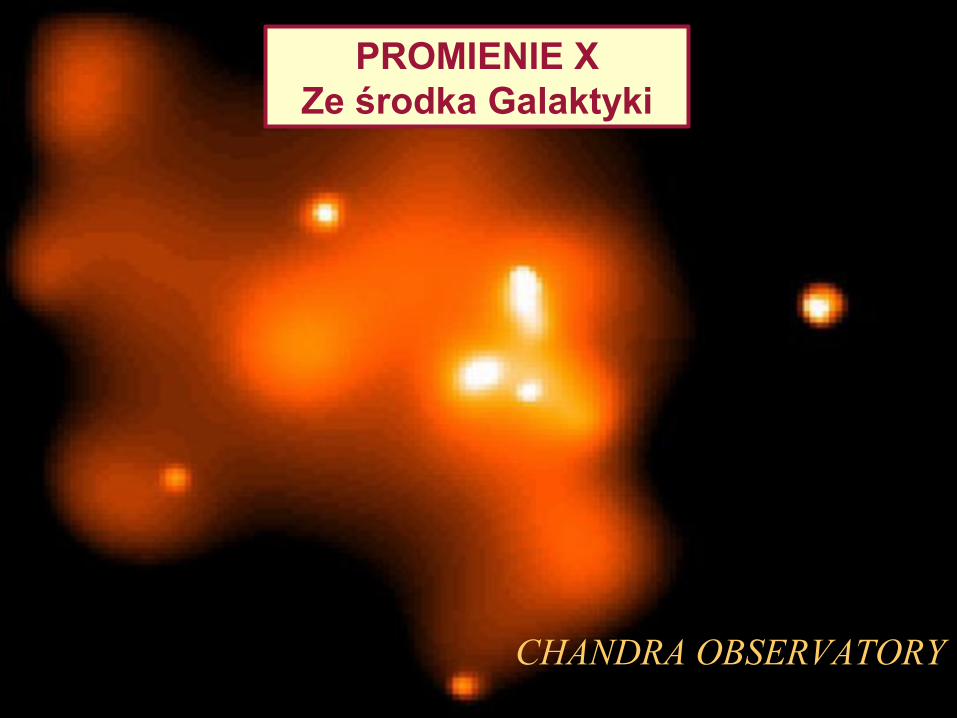
CHANDRA OBSERVATORY
PROMIENIE XZe środka Galaktyki
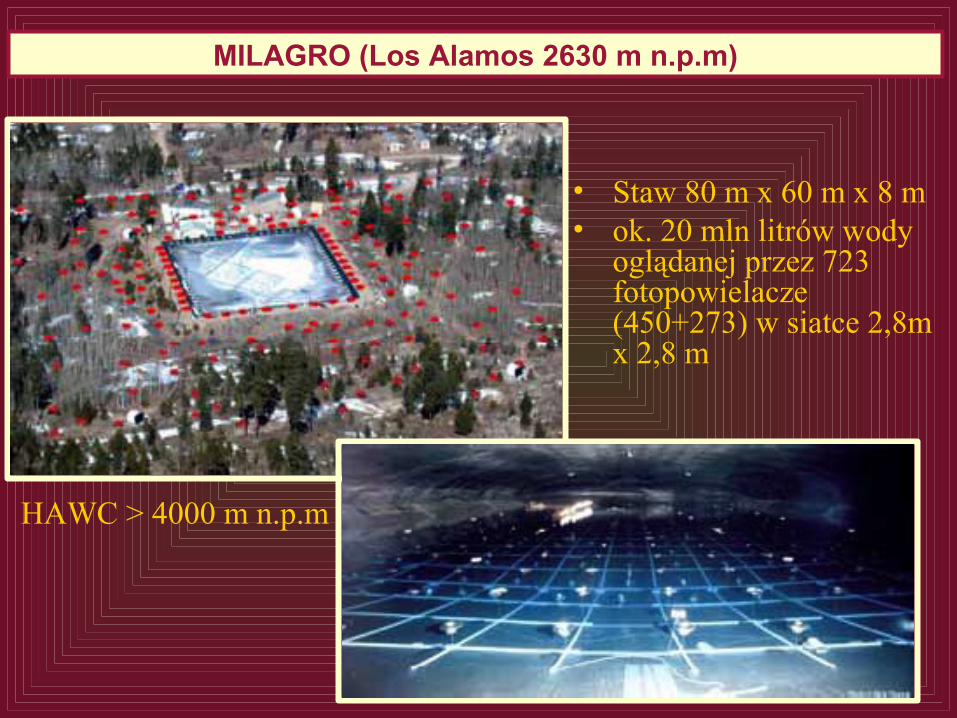
MILAGRO (Los Alamos 2630 m n.p.m)
• Staw 80 m x 60 m x 8 m• ok. 20 mln litrów wody
oglądanej przez 723 fotopowielacze (450+273) w siatce 2,8m x 2,8 m
HAWC > 4000 m n.p.m
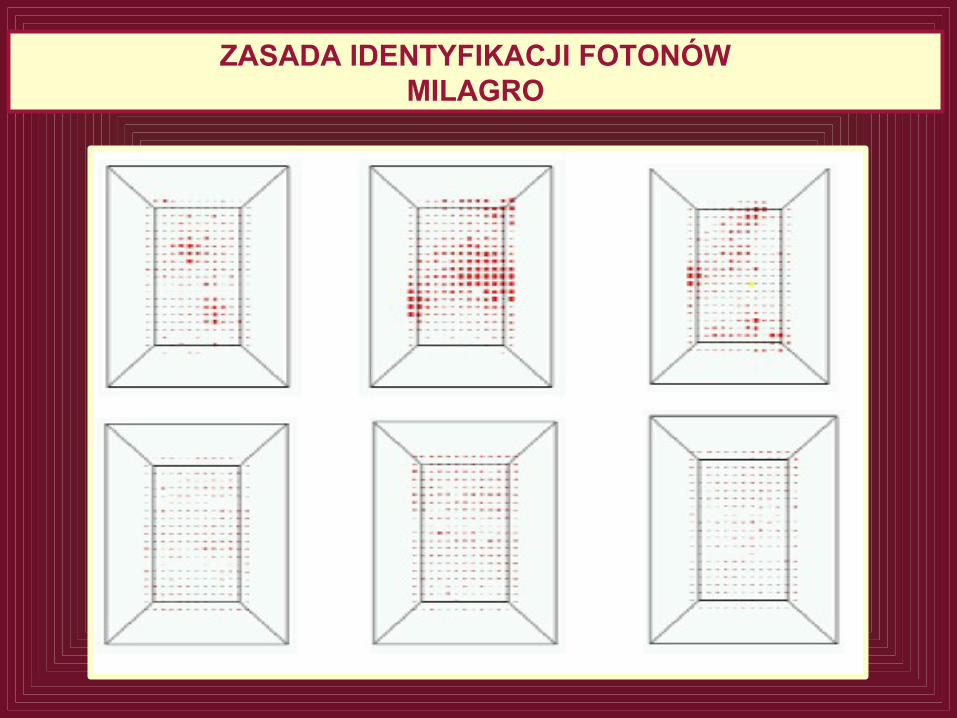
ZASADA IDENTYFIKACJI FOTONÓWMILAGRO
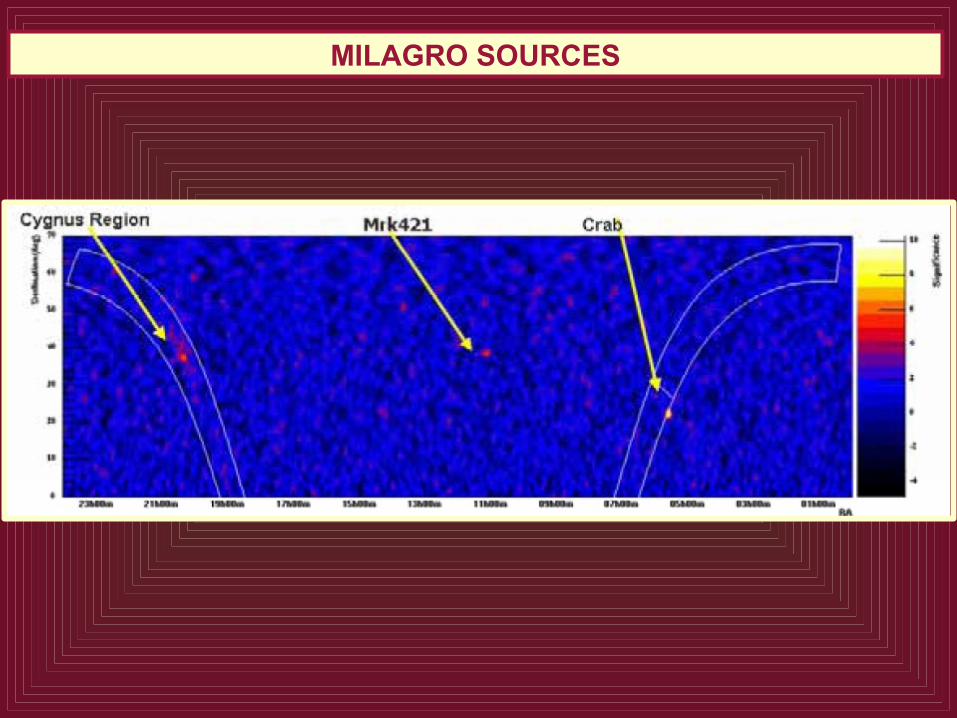
MILAGRO SOURCES
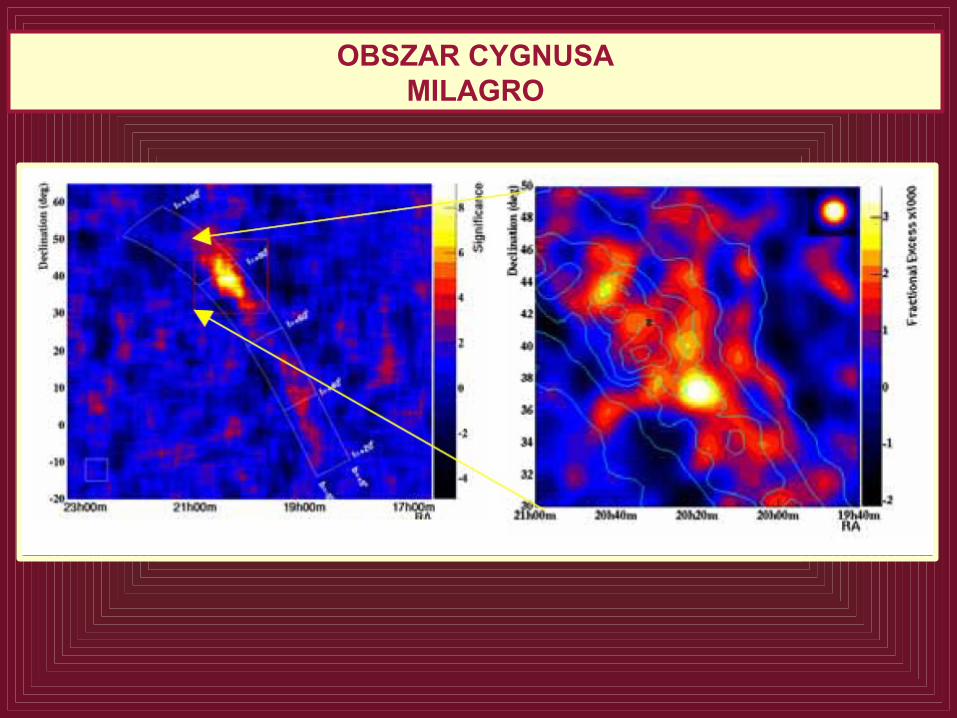
OBSZAR CYGNUSAMILAGRO
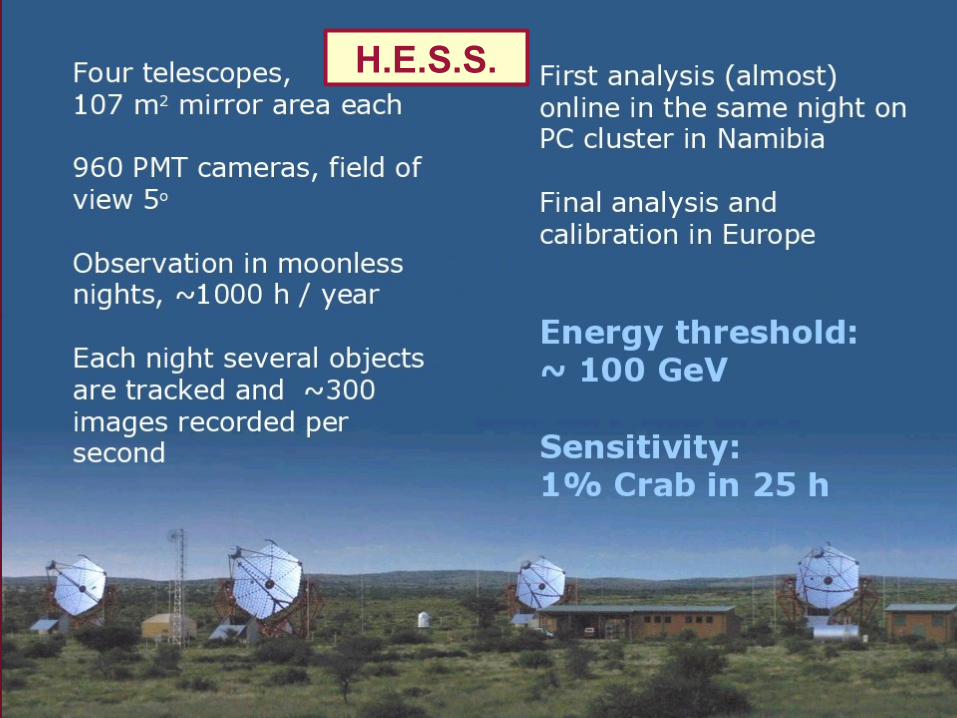
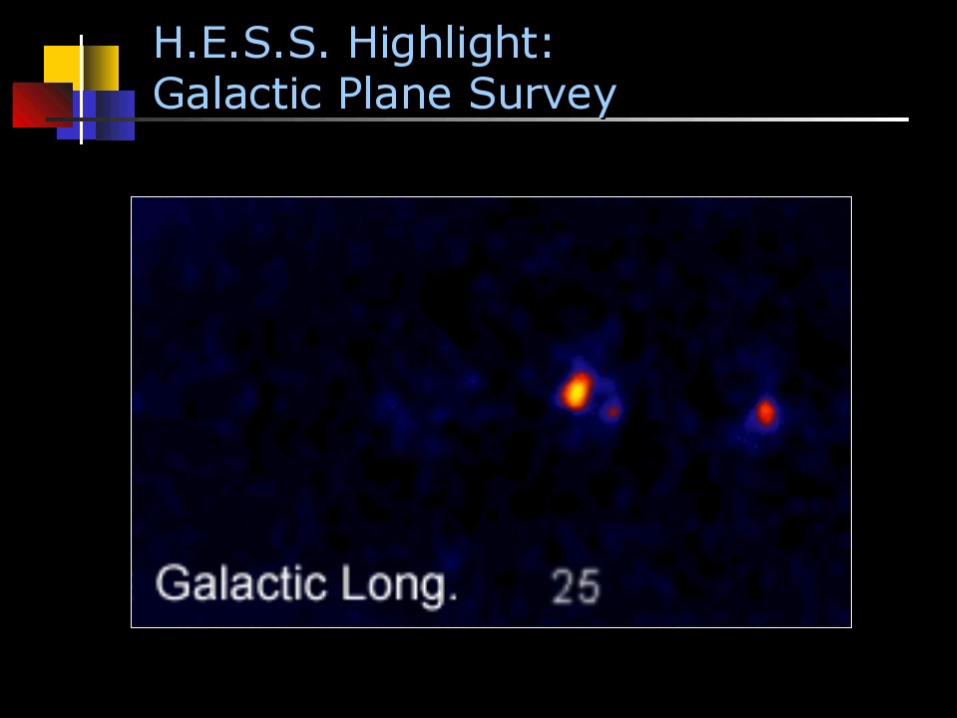
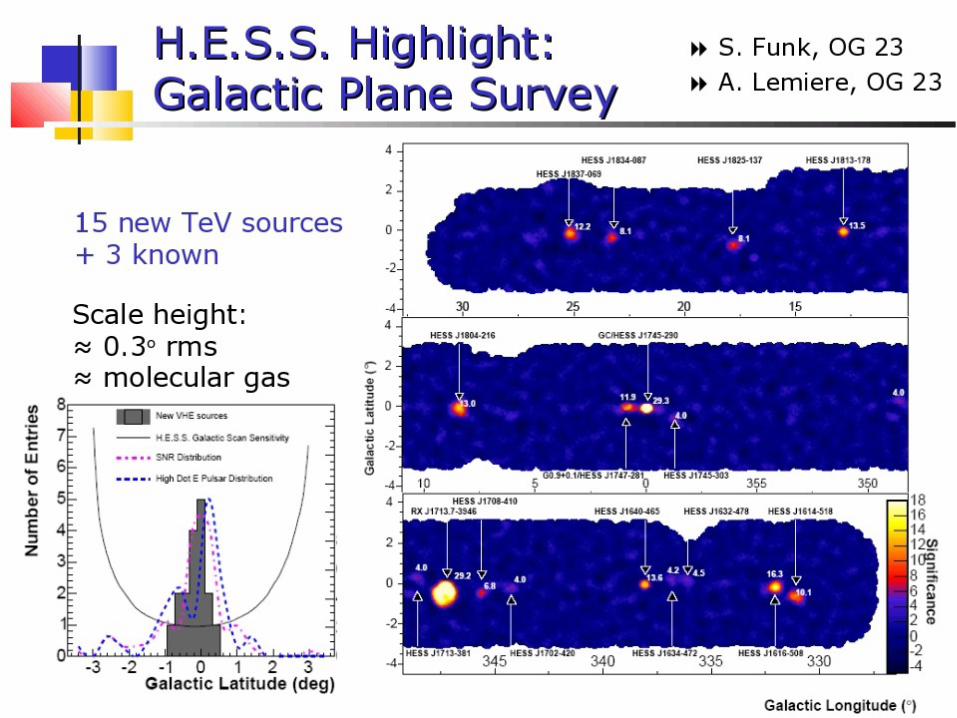
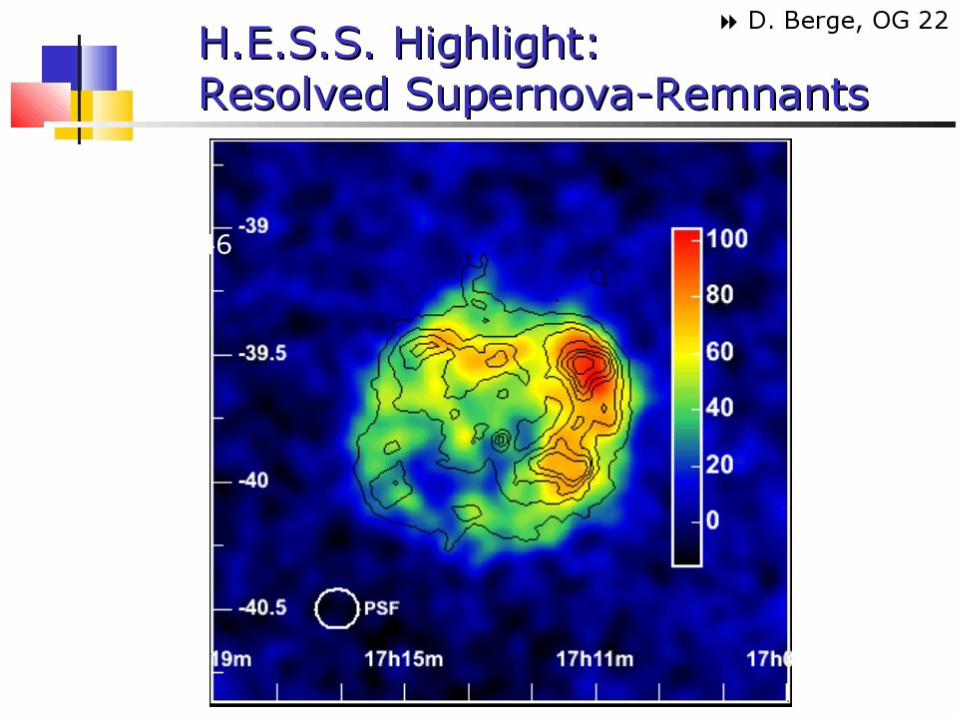
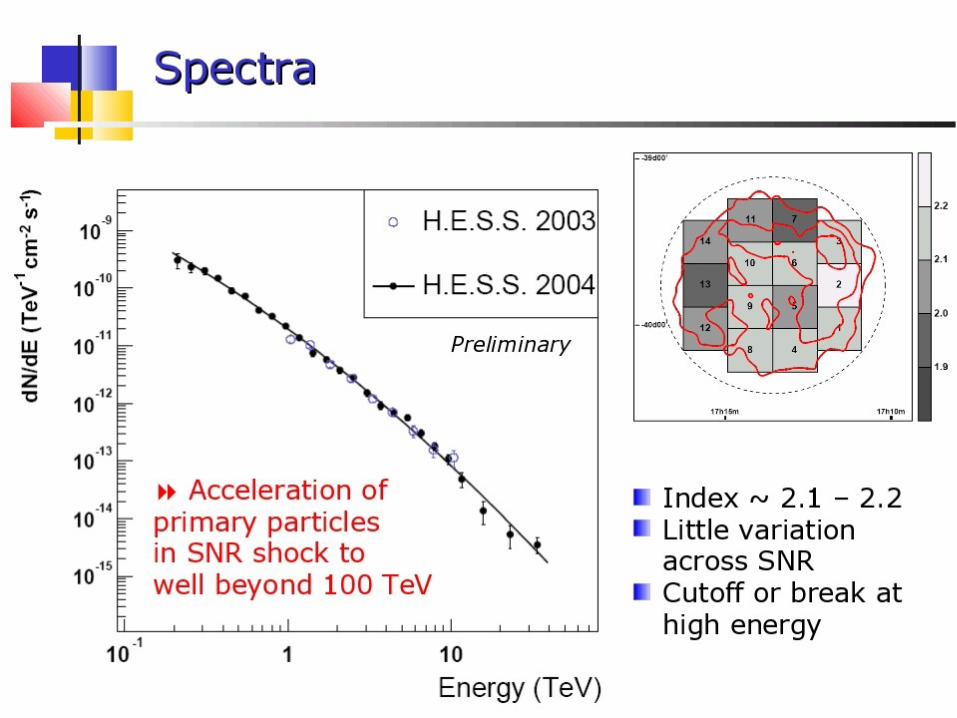
H.E.S.S.
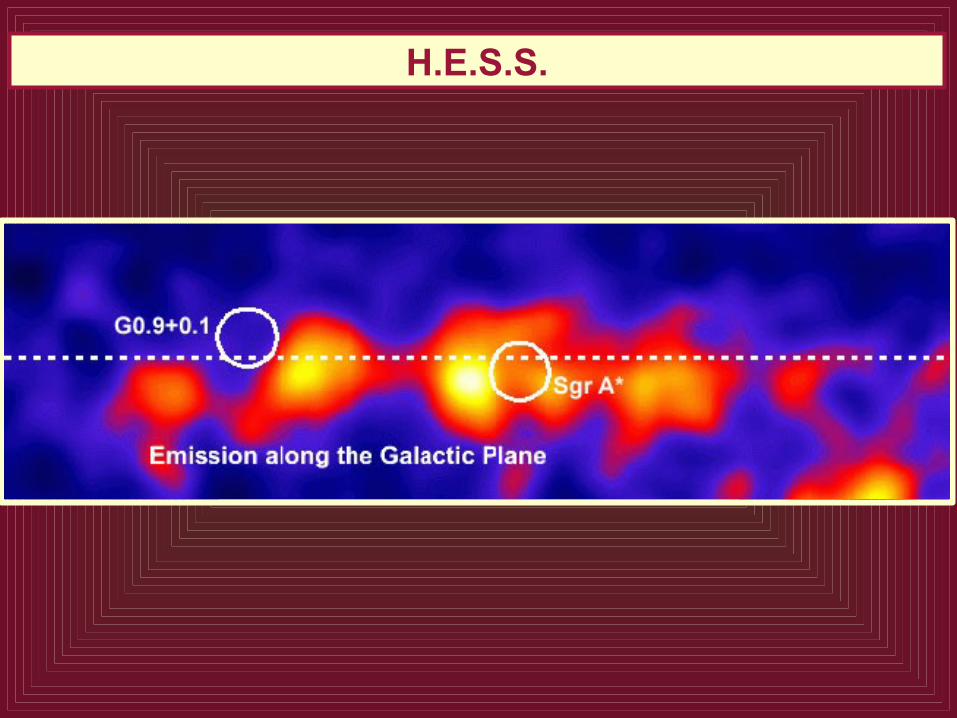
H.E.S.S.
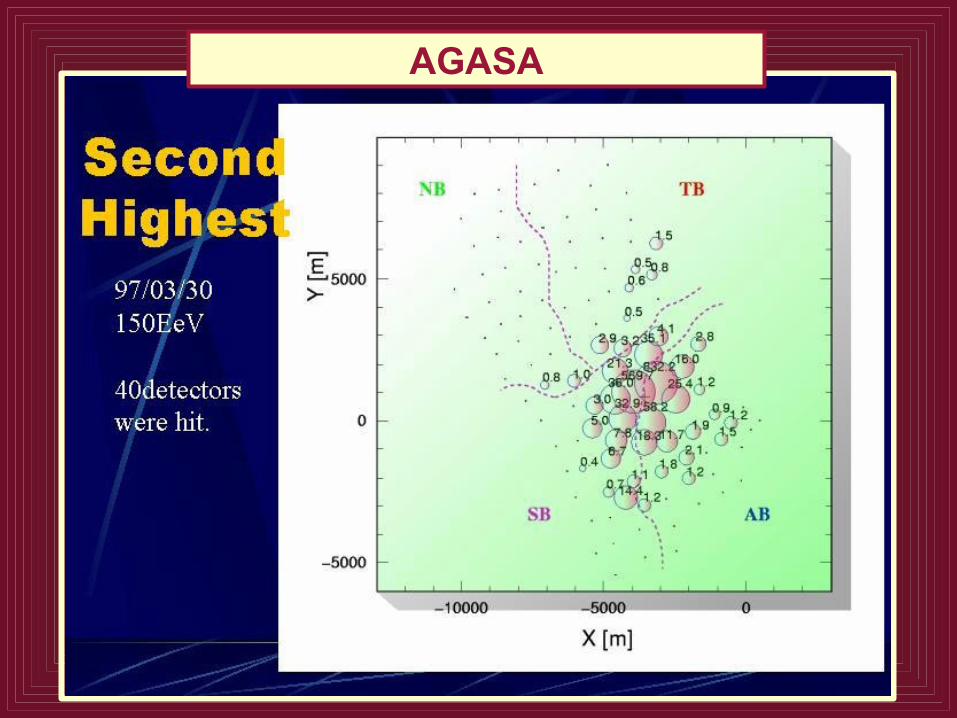
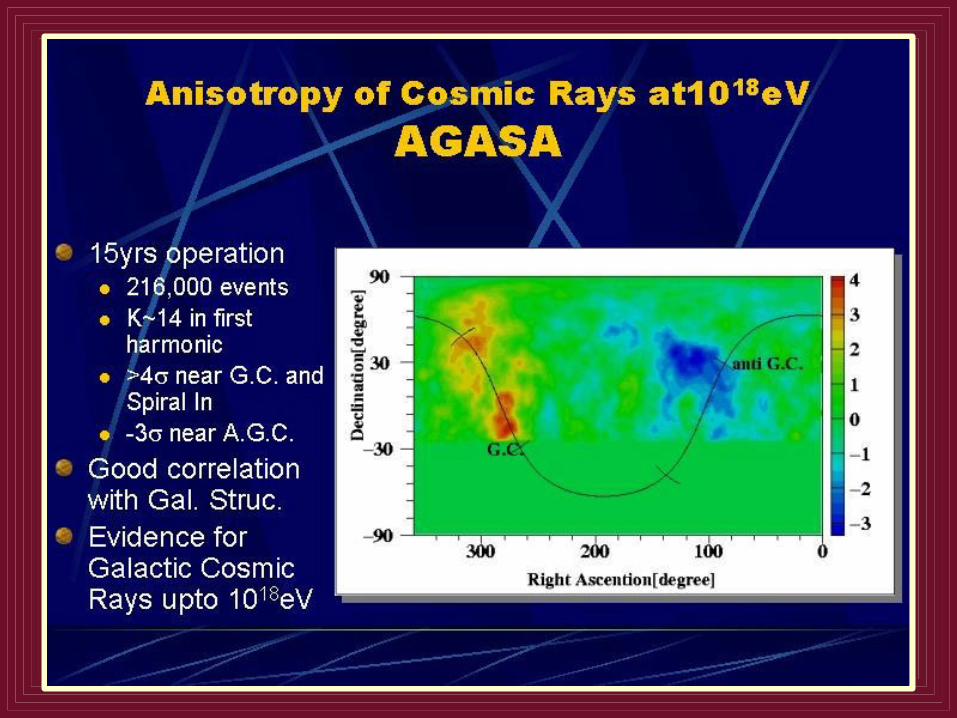
AGASA
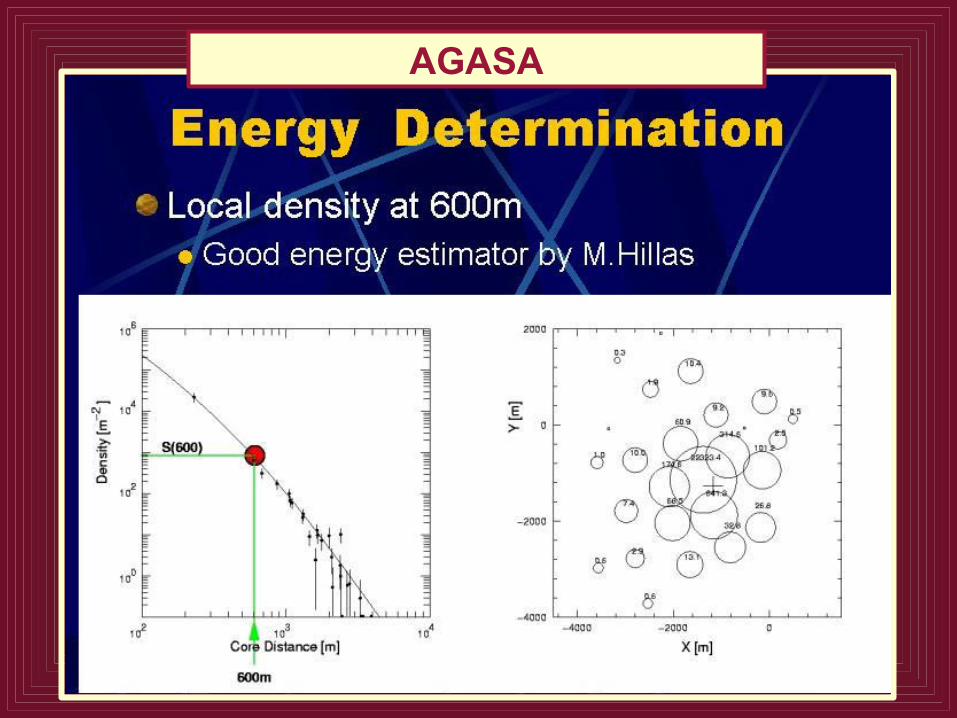
AGASA
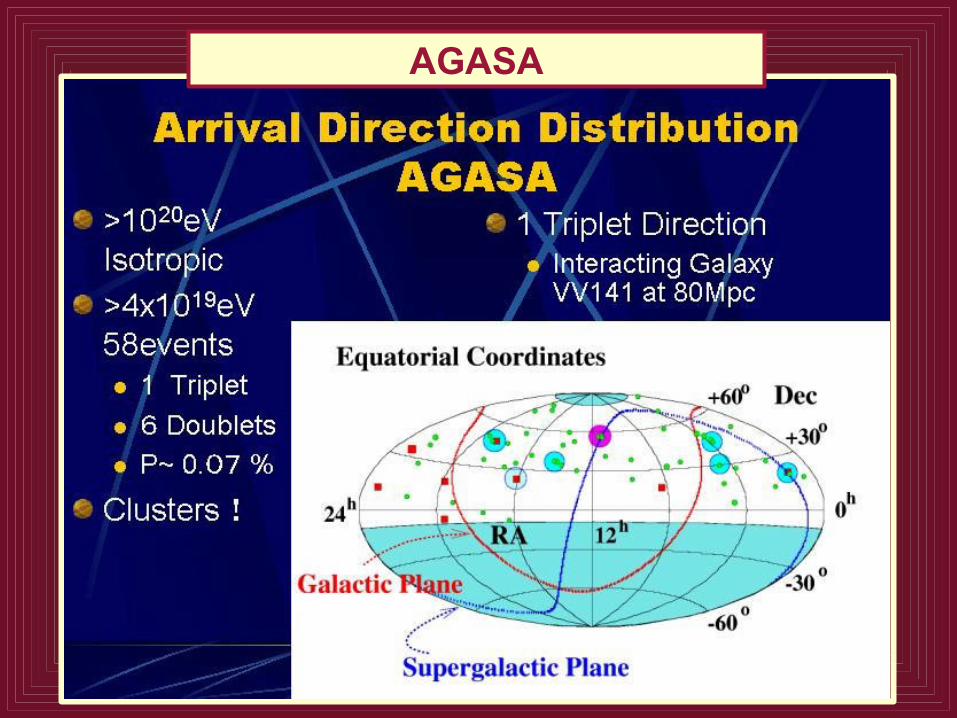
AGASA
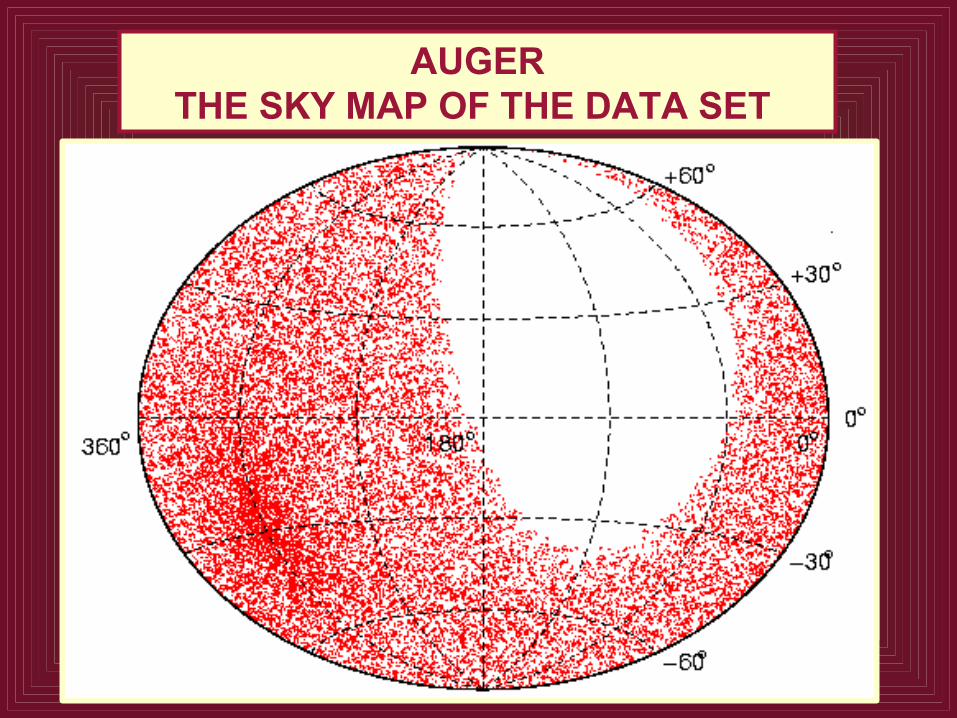
AUGERTHE SKY MAP OF THE DATA SET
WIDMA PIERWOTNE I SKŁAD CHEMICZNYDO ENERGII ok. 10 PeV
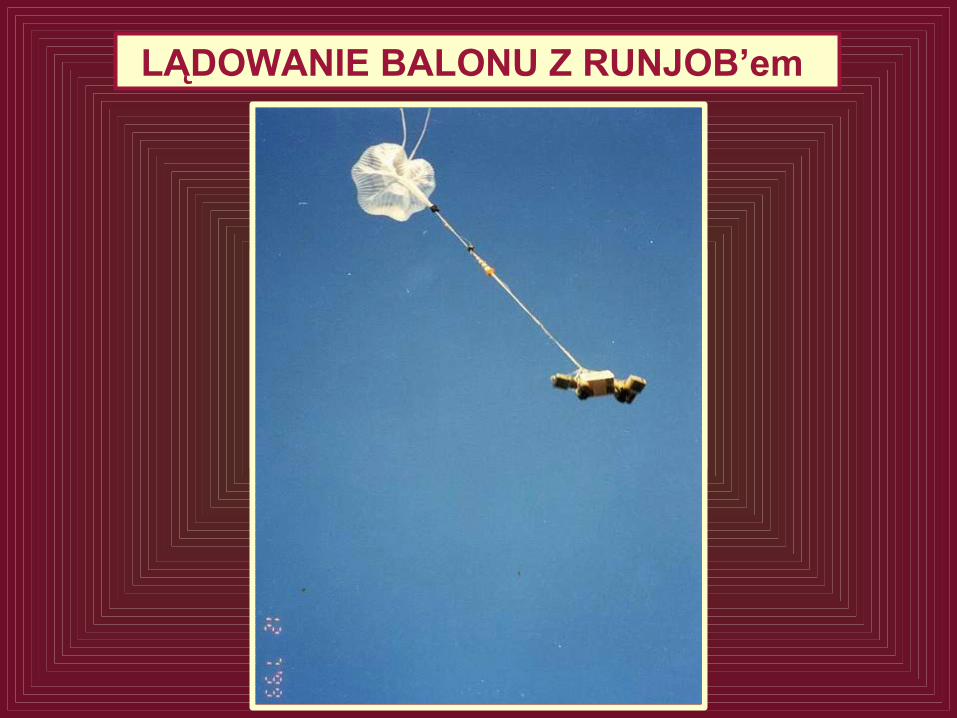
LĄDOWANIE BALONU Z RUNJOB’em
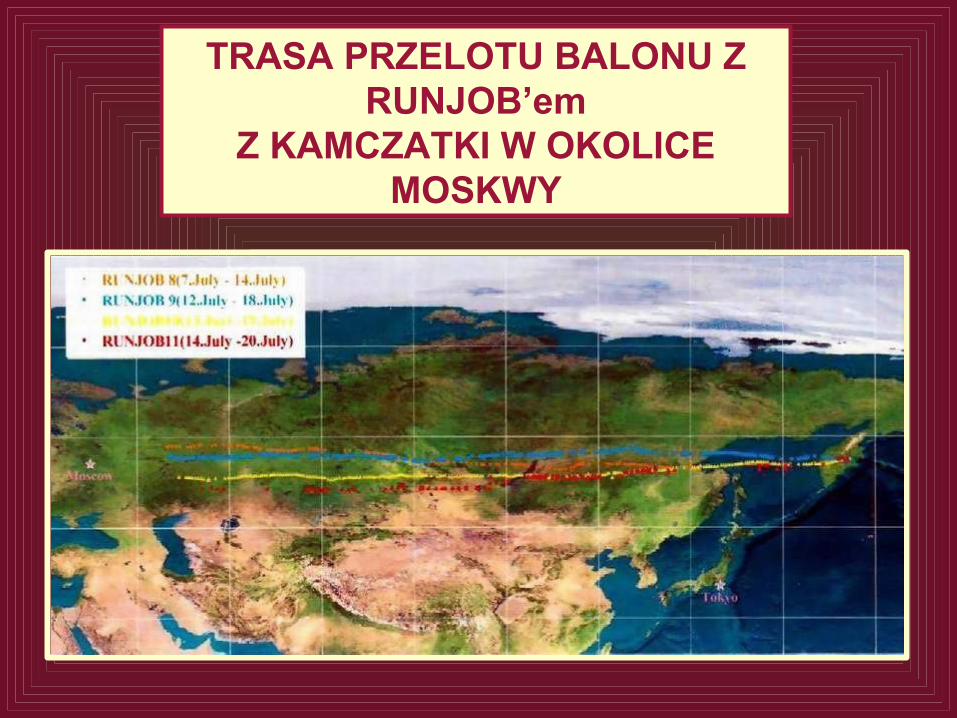
TRASA PRZELOTU BALONU Z RUNJOB’em
Z KAMCZATKI W OKOLICE MOSKWY
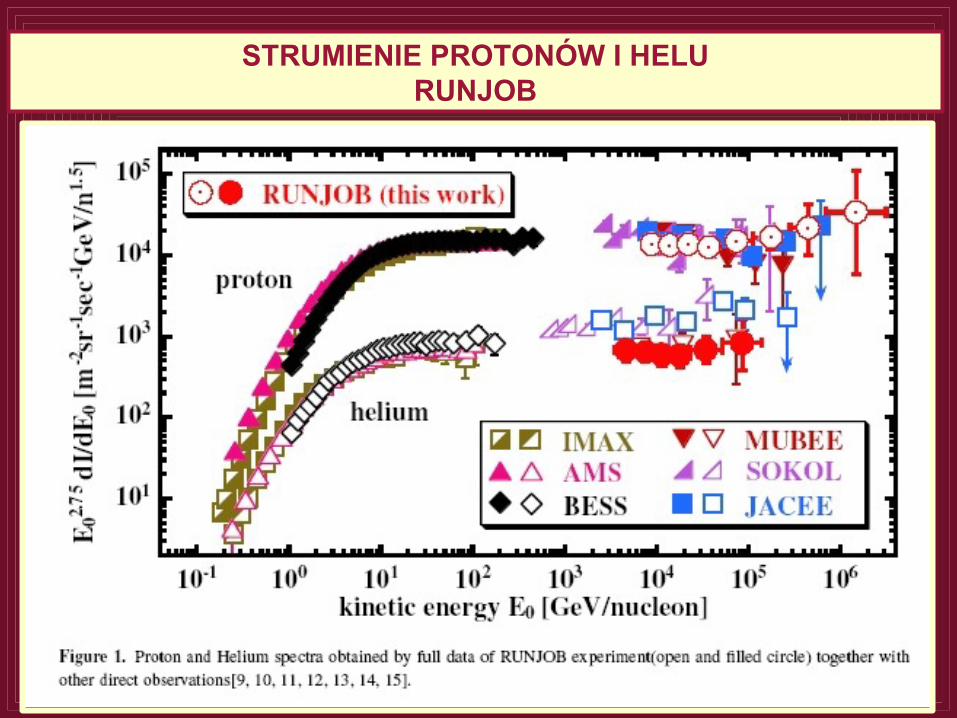
STRUMIENIE PROTONÓW I HELURUNJOB
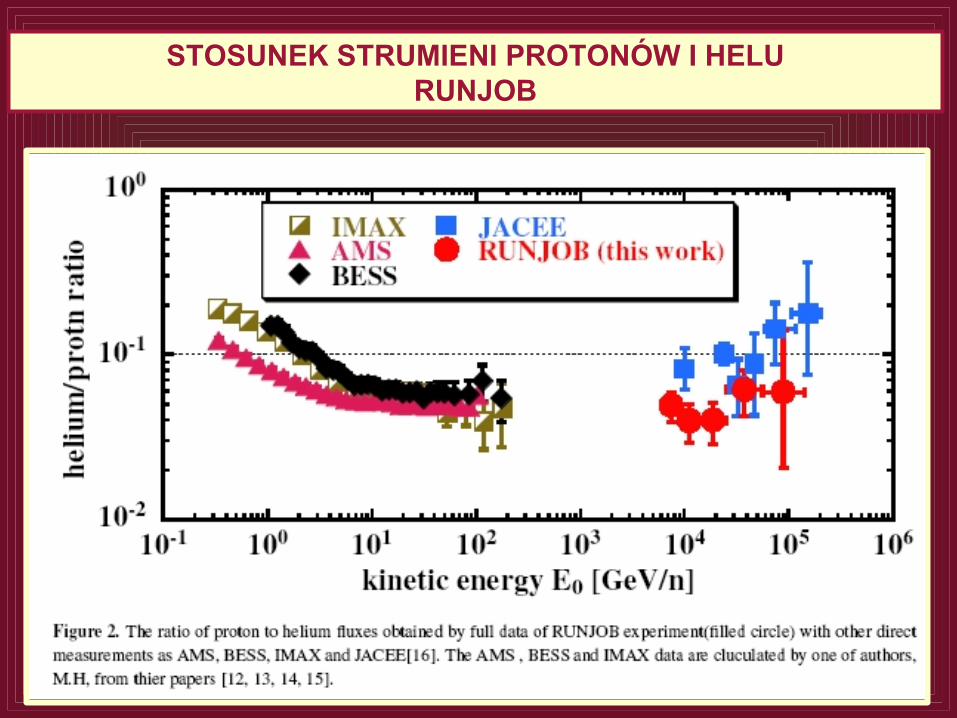
STOSUNEK STRUMIENI PROTONÓW I HELURUNJOB
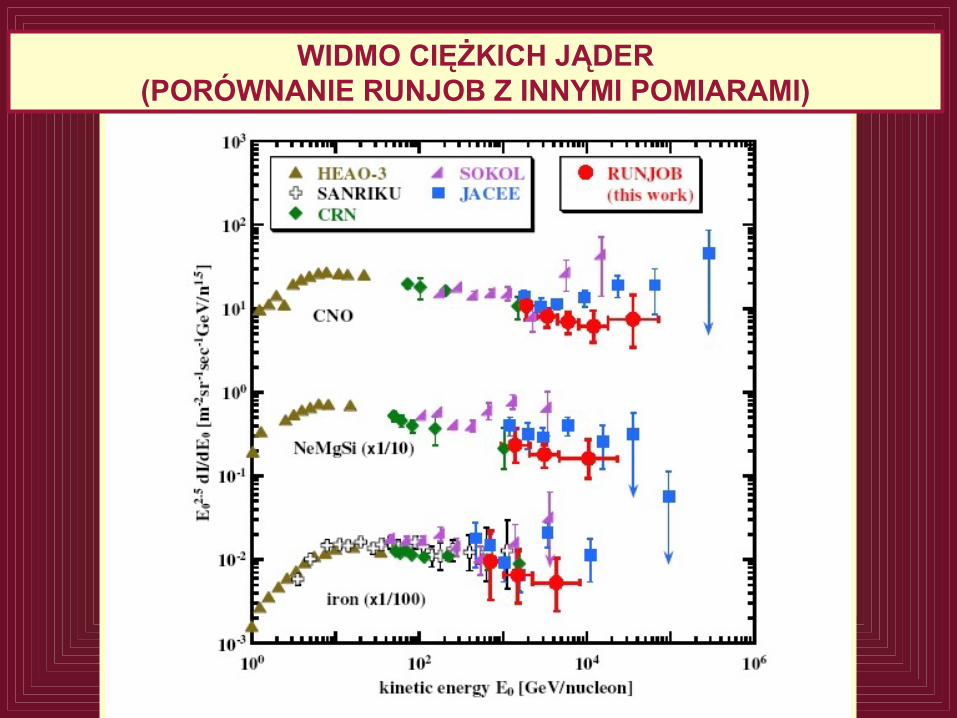
WIDMO CIĘŻKICH JĄDER(PORÓWNANIE RUNJOB Z INNYMI POMIARAMI)
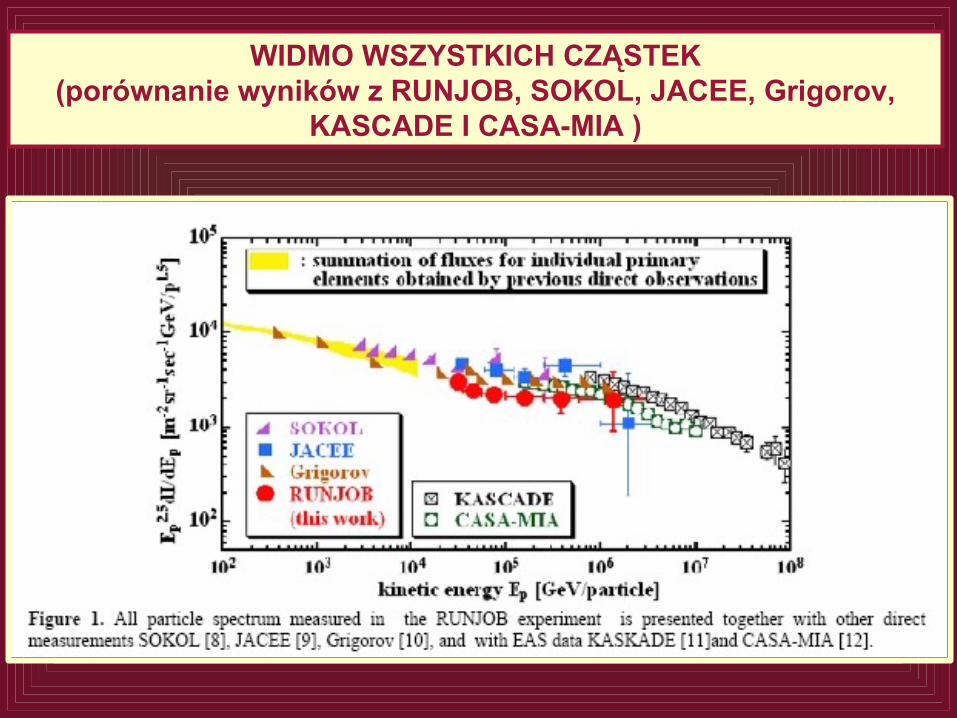
WIDMO WSZYSTKICH CZĄSTEK(porównanie wyników z RUNJOB, SOKOL, JACEE, Grigorov,
KASCADE I CASA-MIA )
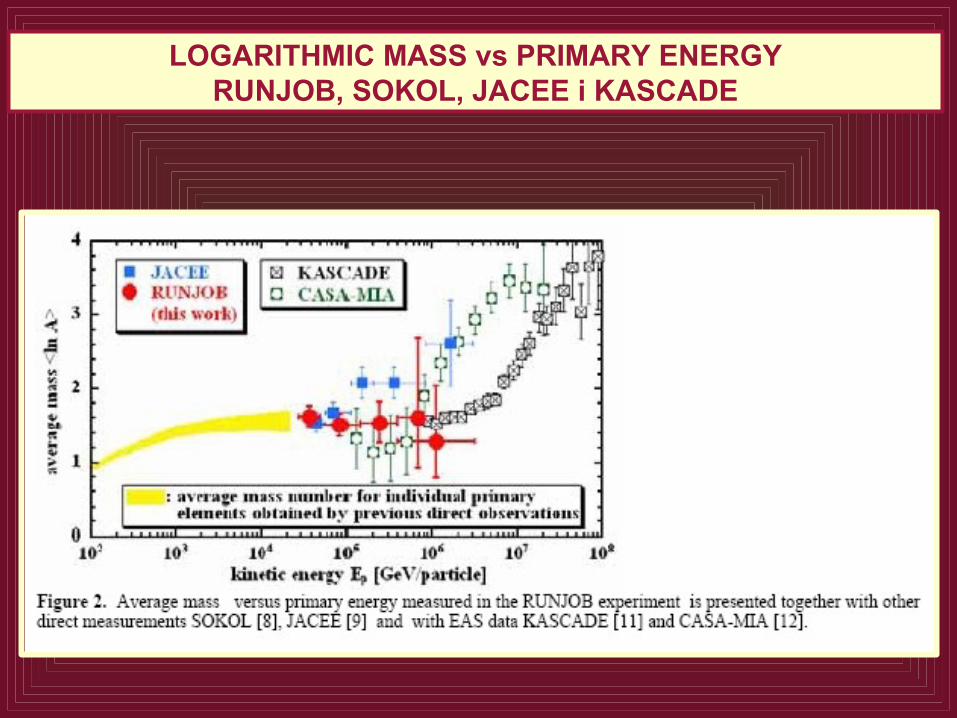
LOGARITHMIC MASS vs PRIMARY ENERGYRUNJOB, SOKOL, JACEE i KASCADE
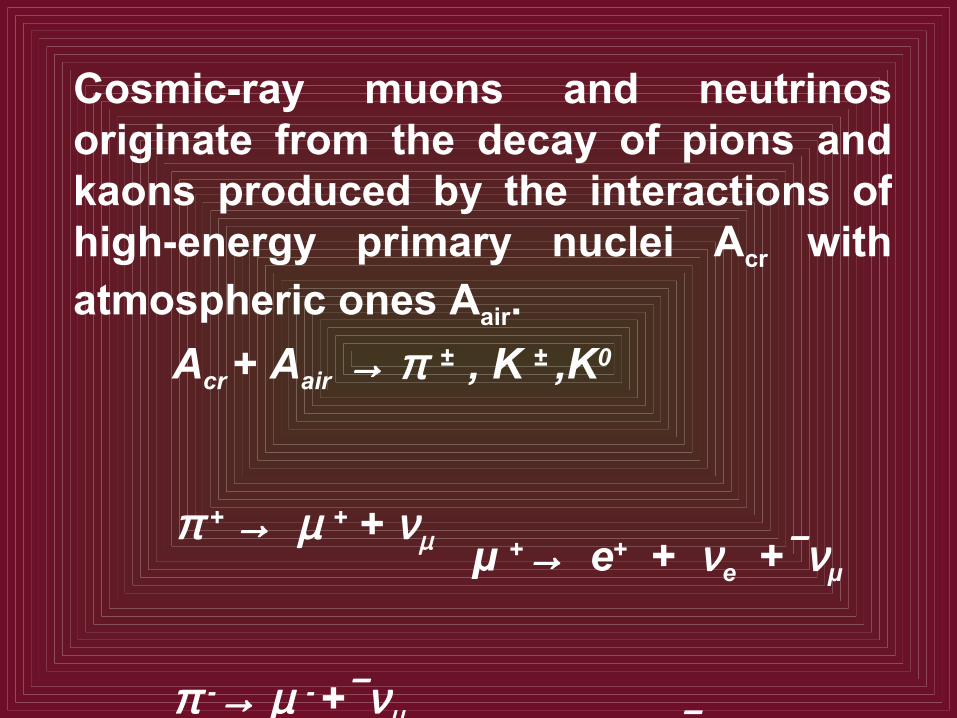
Cosmic-ray muons and neutrinos originate from the decay of pions and kaons produced by the interactions of high-energy primary nuclei Acr with atmospheric ones Aair. Acr + Aair → π
± , K ± ,K0
π + → µ + + νµ
π -→ µ - +νµ
µ +→ e+ + νe +νµ
µ -→ e - + νe + νµ..
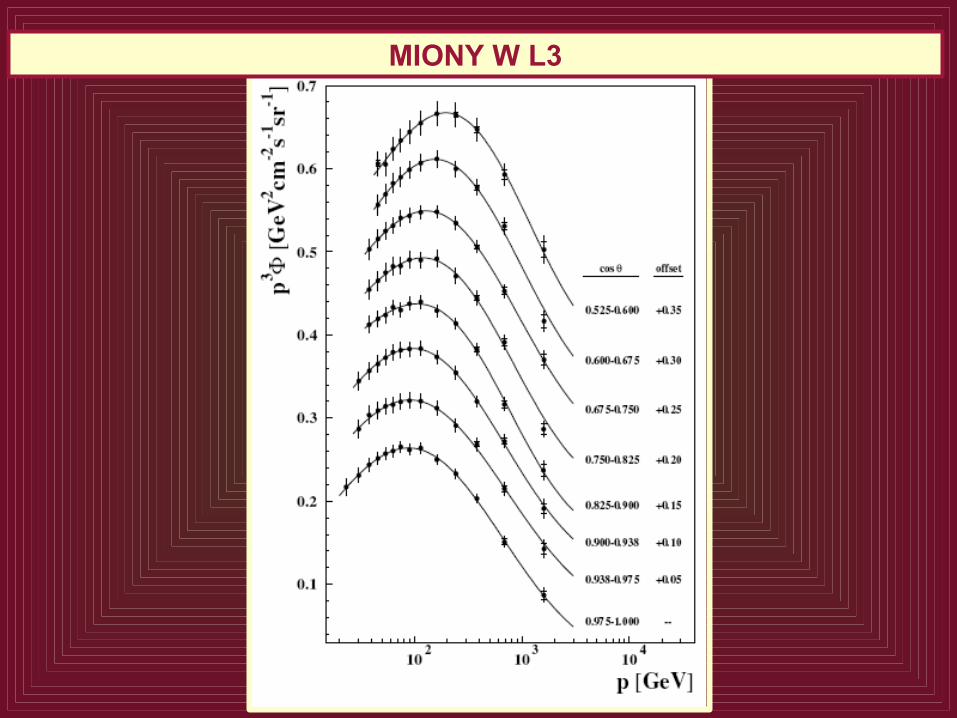
MIONY W L3
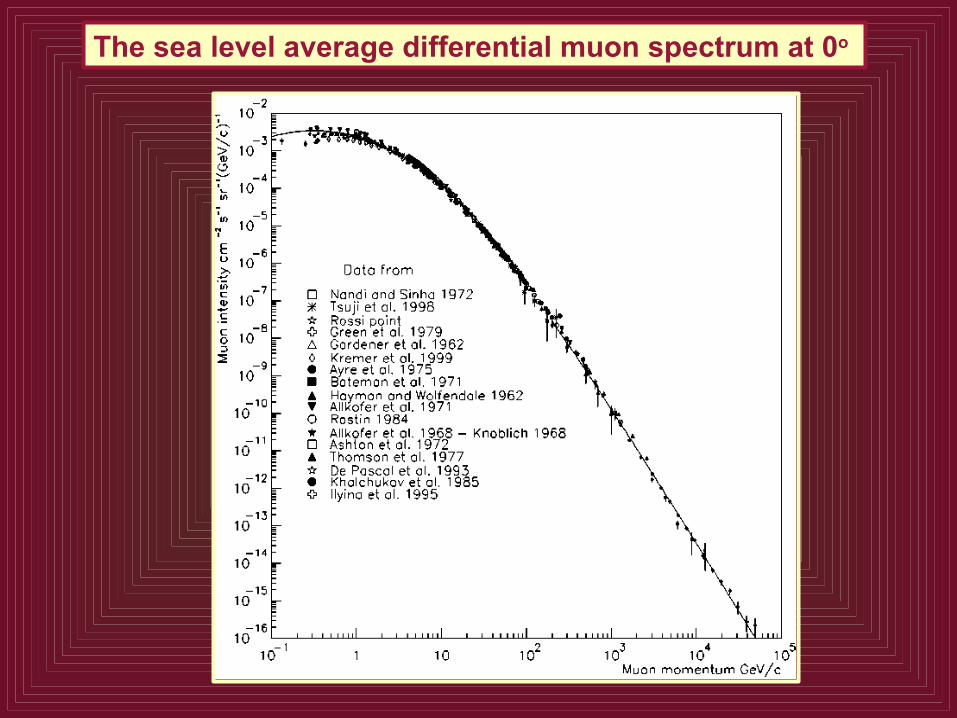
The sea level average differential muon spectrum at 0o
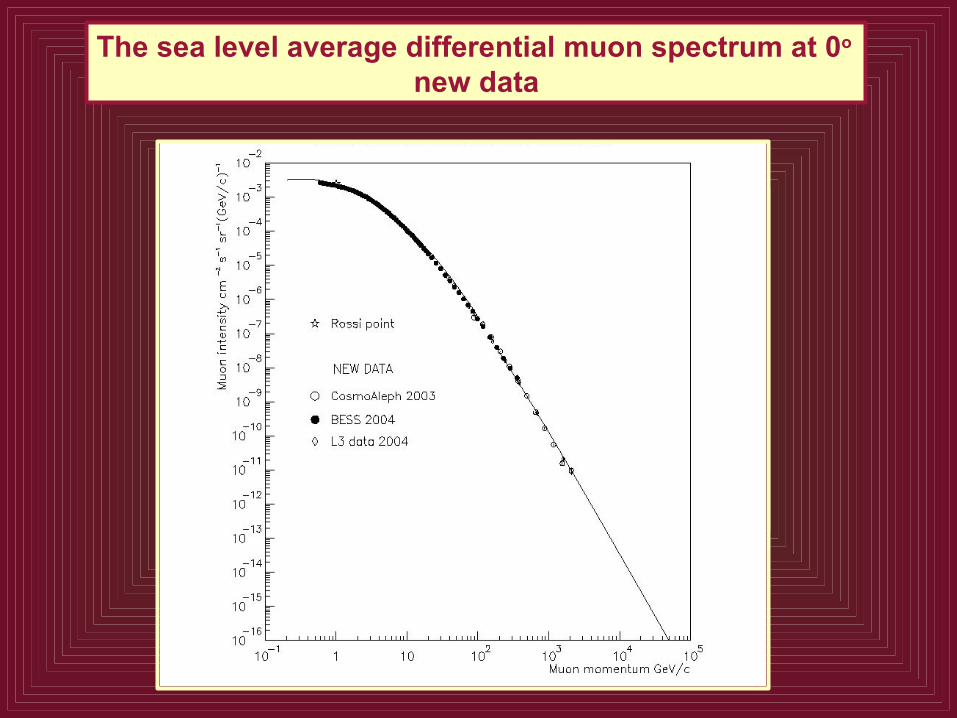
The sea level average differential muon spectrum at 0o
new data
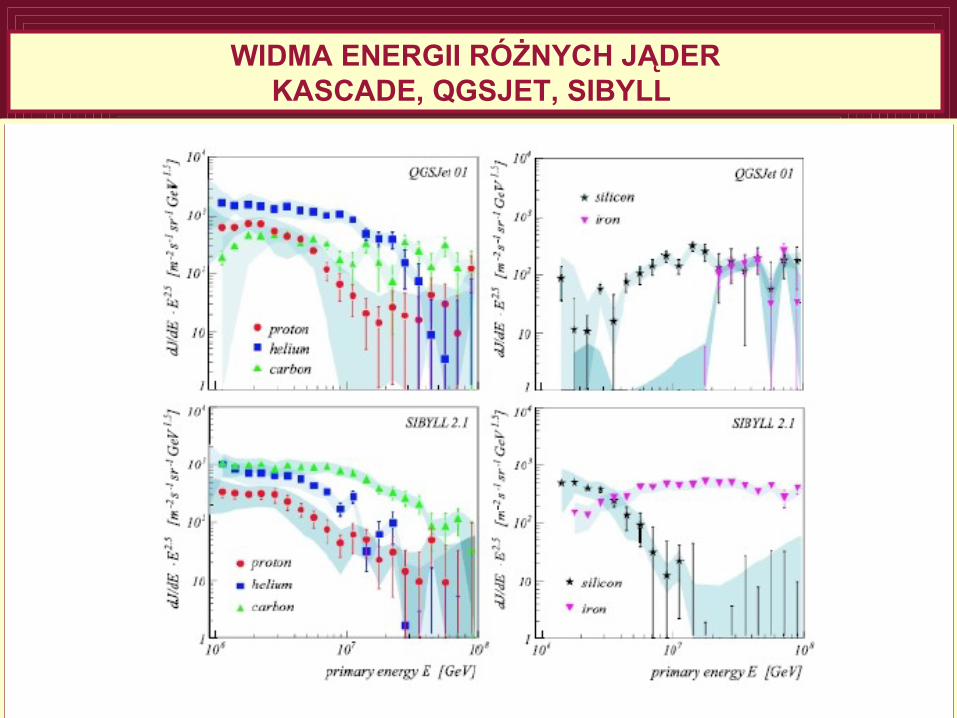
WIDMA ENERGII RÓŻNYCH JĄDERKASCADE, QGSJET, SIBYLL
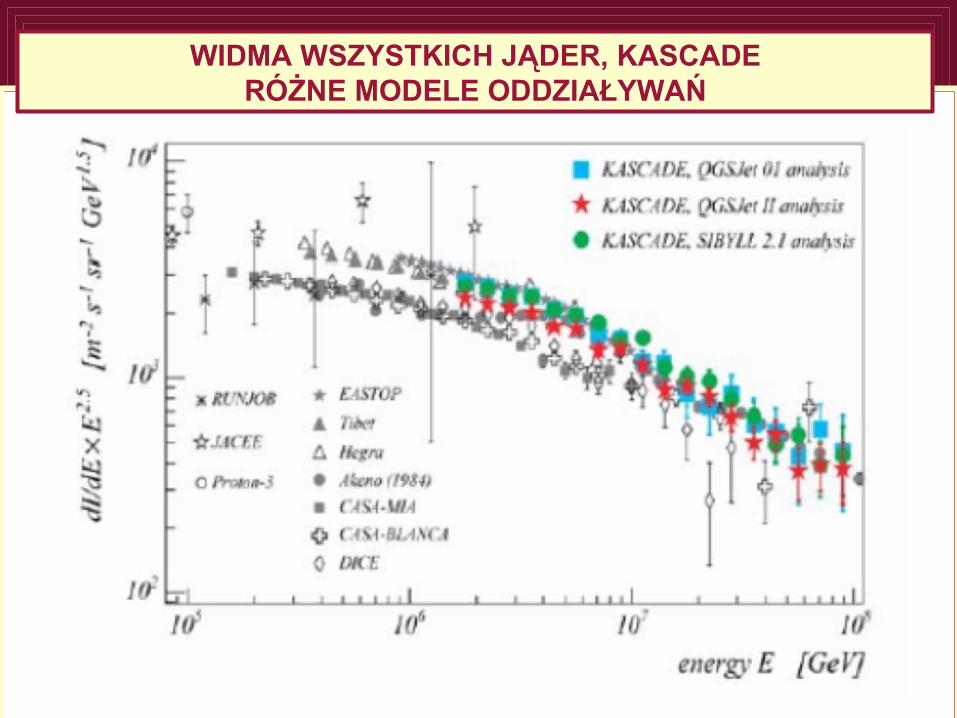
WIDMA WSZYSTKICH JĄDER, KASCADERÓŻNE MODELE ODDZIAŁYWAŃ
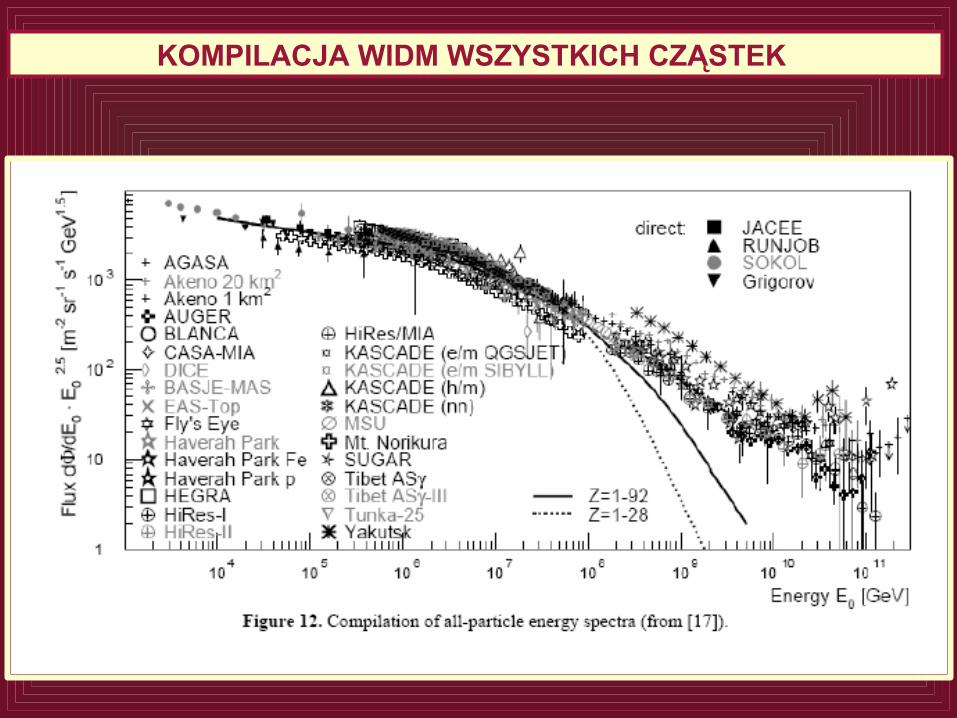
KOMPILACJA WIDM WSZYSTKICH CZĄSTEK
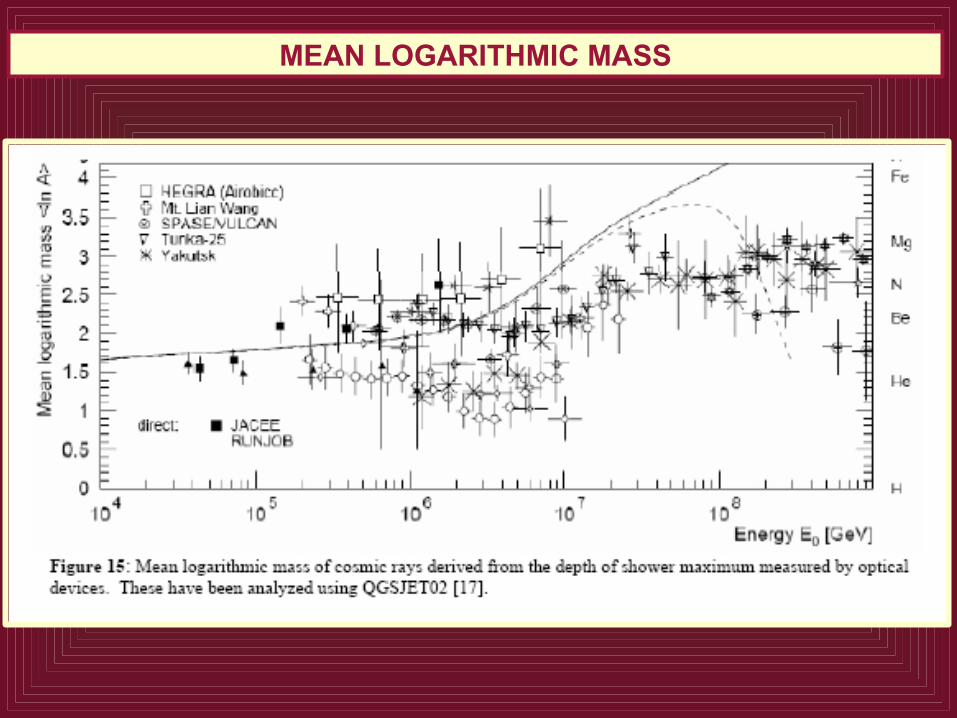
MEAN LOGARITHMIC MASS
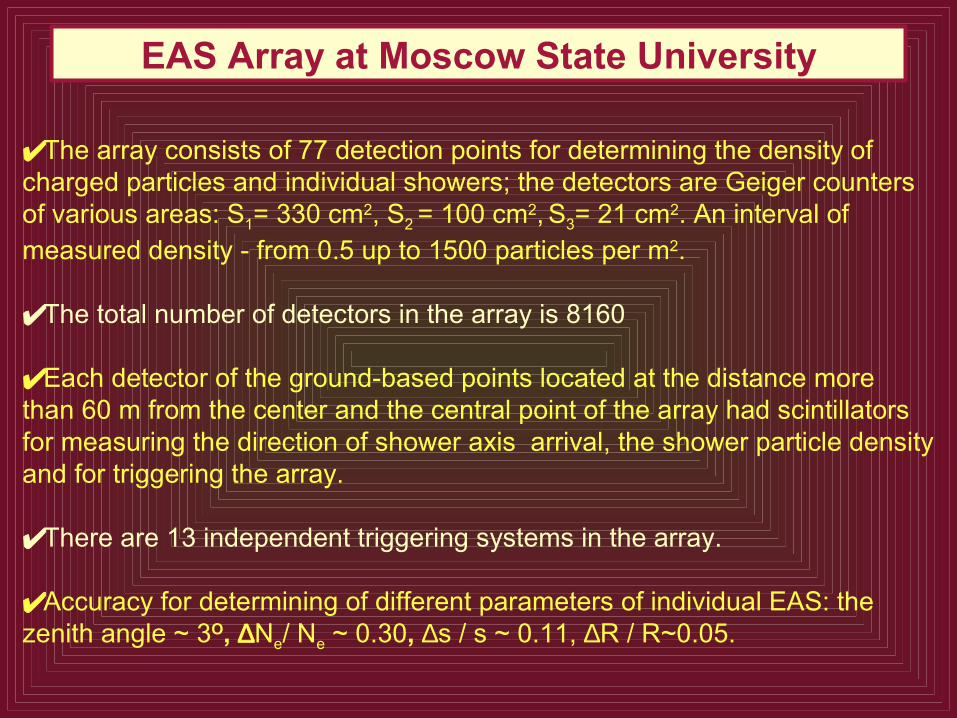
EAS Array at Moscow State University
✔ The array consists of 77 detection points for determining the density of charged particles and individual showers; the detectors are Geiger counters of various areas: S1= 330 cm2, S2 = 100 cm2, S3= 21 cm2. An interval of measured density - from 0.5 up to 1500 particles per m2.
✔ The total number of detectors in the array is 8160
✔ Each detector of the ground-based points located at the distance more than 60 m from the center and the central point of the array had scintillators for measuring the direction of shower axis arrival, the shower particle density and for triggering the array.
✔ There are 13 independent triggering systems in the array.
✔ Accuracy for determining of different parameters of individual EAS: the zenith angle ~ 3O, ∆Ne/ Ne ~ 0.30, ∆s / s ~ 0.11, ∆R / R~0.05.
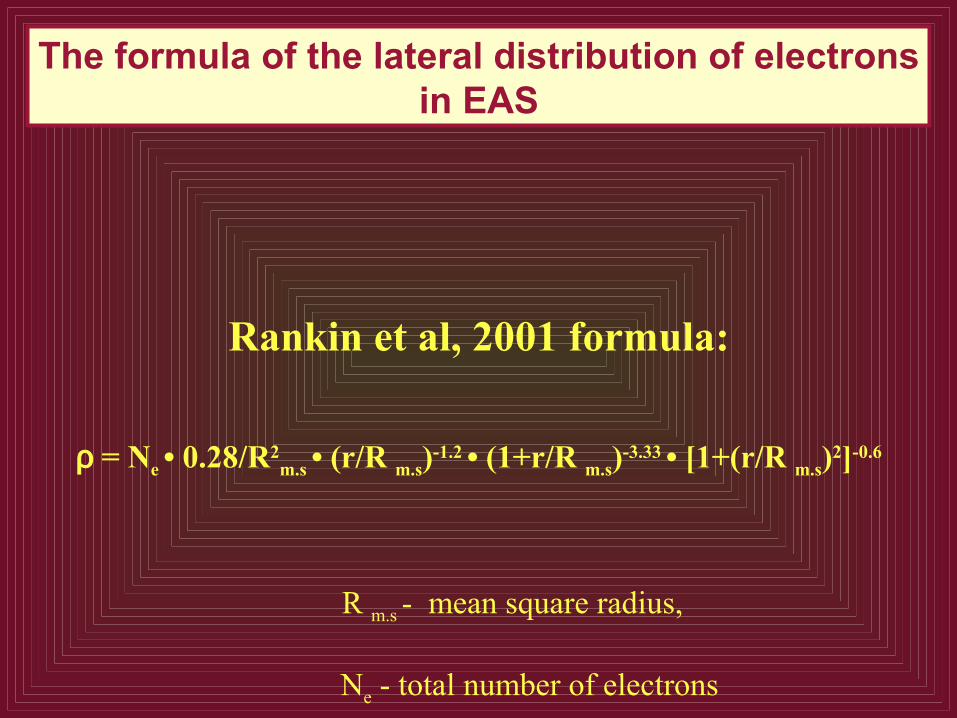
Rankin et al, 2001 formula:
ρ = Ne • 0.28/R2m.s
• (r/R m.s)-1.2 • (1+r/R m.s)-3.33 • [1+(r/R m.s)2]-0.6
R m.s - mean square radius,
Ne - total number of electrons
The formula of the lateral distribution of electrons in EAS
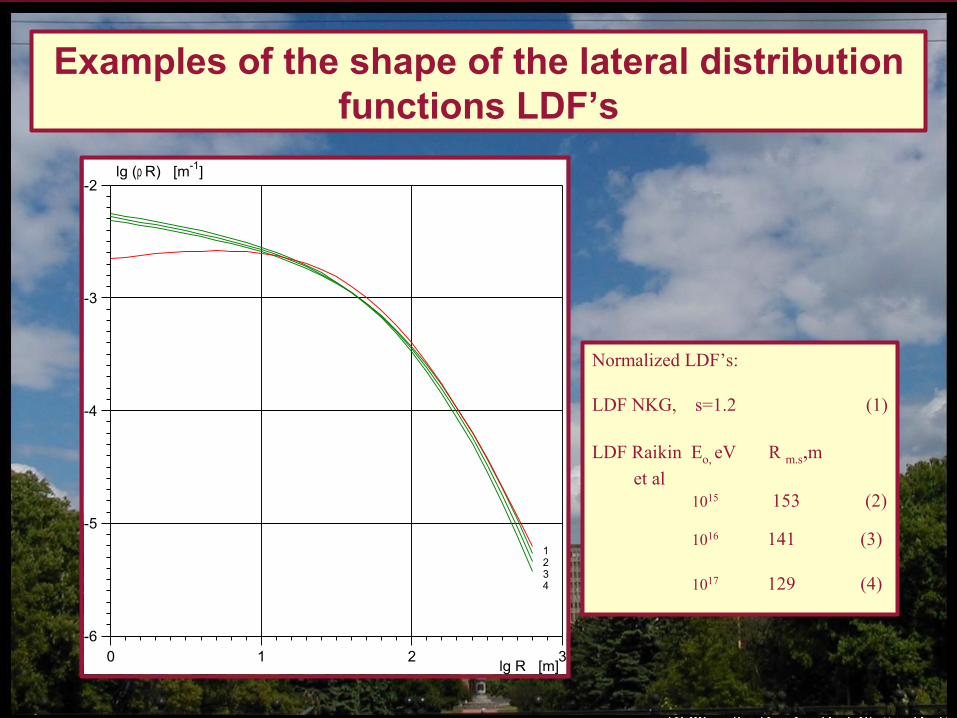
0 1 2 3
-6
-5
-4
-3
-2lg (ρ R) [m-1]
lg R [m]
1234
Normalized LDF’s:
LDF NKG, s=1.2 (1)
LDF Raikin Eo, eV R m.s,m et al 1015 153 (2)
1016 141 (3)
1017 129 (4)
Examples of the shape of the lateral distribution functions LDF’s
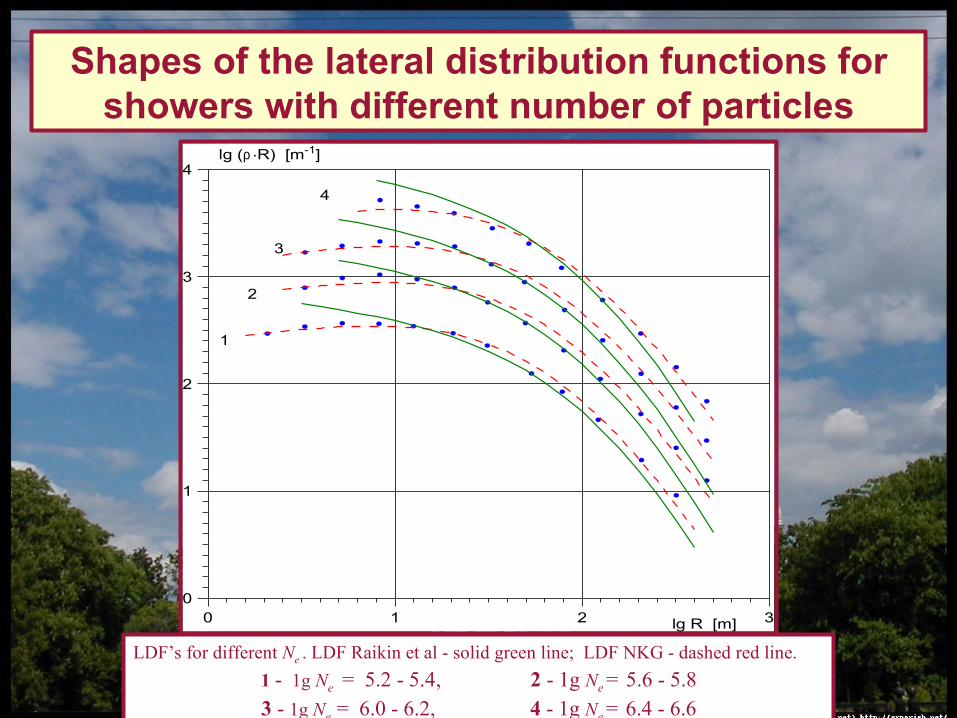
0 1 2 30
1
2
3
4
lg R [m]
lg (ρ .R) [m-1]
1
2
3
4
LDF’s for different Ne . LDF Raikin et al - solid green line; LDF NKG - dashed red line.1 - 1g Ne = 5.2 - 5.4, 2 - 1g Ne = 5.6 - 5.83 - 1g Ne = 6.0 - 6.2, 4 - 1g Ne = 6.4 - 6.6
Shapes of the lateral distribution functions for showers with different number of particles
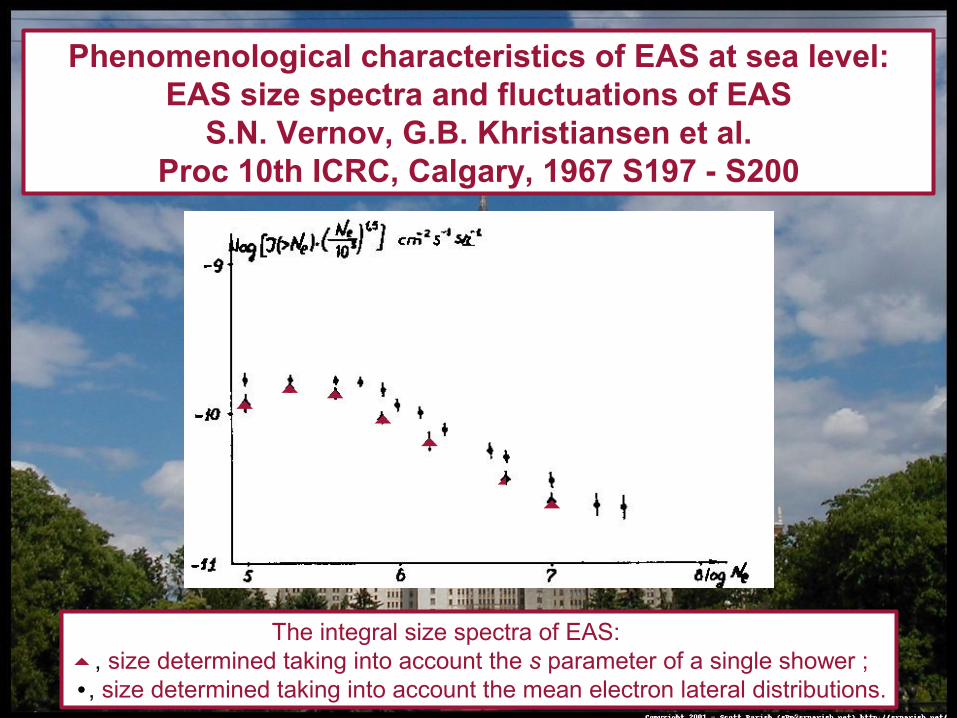
Phenomenological characteristics of EAS at sea level:EAS size spectra and fluctuations of EAS
S.N. Vernov, G.B. Khristiansen et al.Proc 10th ICRC, Calgary, 1967 S197 - S200
The integral size spectra of EAS:, size determined taking into account the s parameter of a single shower ; •, size determined taking into account the mean electron lateral distributions.
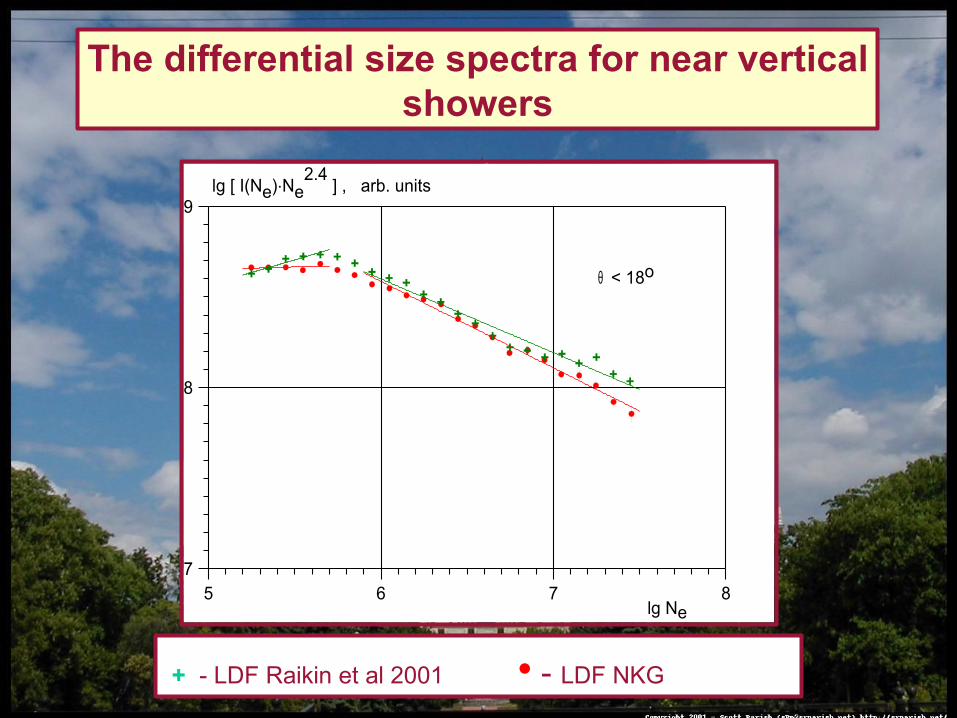
5 6 7 87
8
9
θ < 18o
lg [ I(Ne).Ne2.4 ] , arb. units
lg Ne
The differential size spectra for near vertical showers
+ - LDF Raikin et al 2001 • - LDF NKG
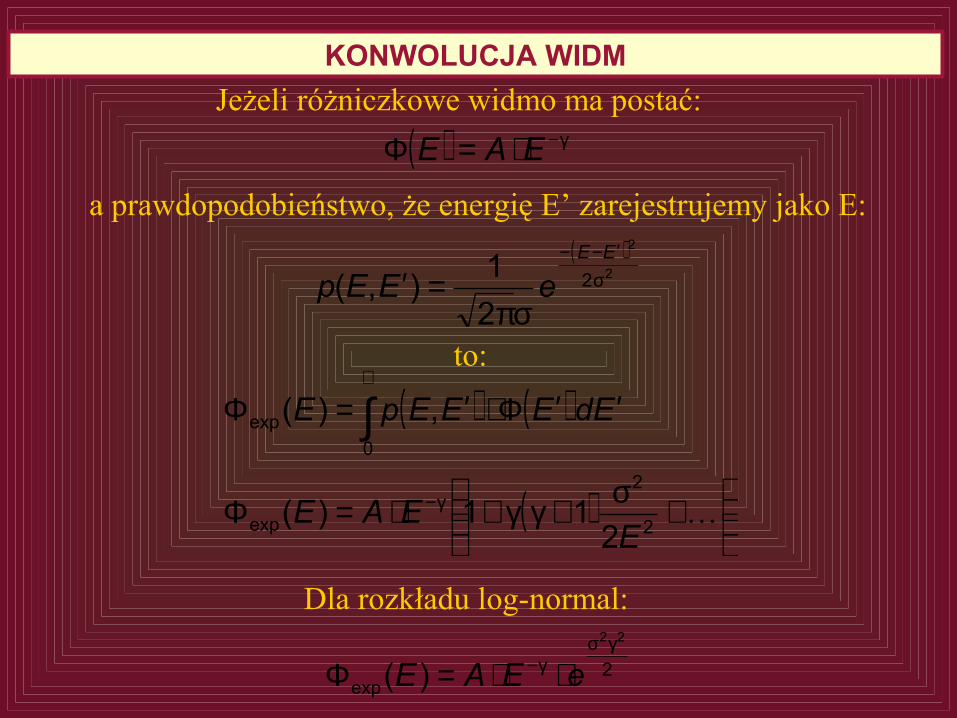
( ) γ−⋅=Φ EAE
KONWOLUCJA WIDMJeżeli różniczkowe widmo ma postać:
a prawdopodobieństwo, że energię E’ zarejestrujemy jako E:( )
2
2
2
21),( σ
′−−
σπ=′
EE
eEEp
( ) ( )
( )
+σ+γγ+⋅=Φ
′′Φ⋅′=Φ
γ−
∝
∫
2
2
exp
0exp
211)(
,)(
EEAE
EdEEEpE
to:
Dla rozkładu log-normal:
2exp
22
)(γσ
γ− ⋅⋅=Φ eEAE
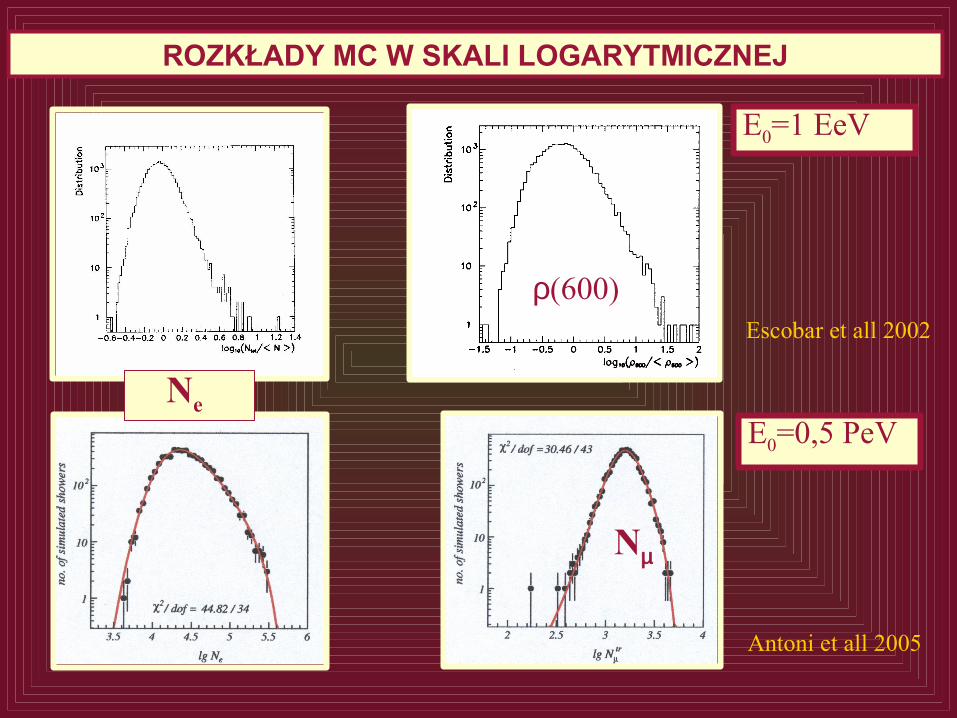
ROZKŁADY MC W SKALI LOGARYTMICZNEJ
E0=1 EeV
Ne
ρ(600)
Nµ
Escobar et all 2002
Antoni et all 2005
E0=0,5 PeV
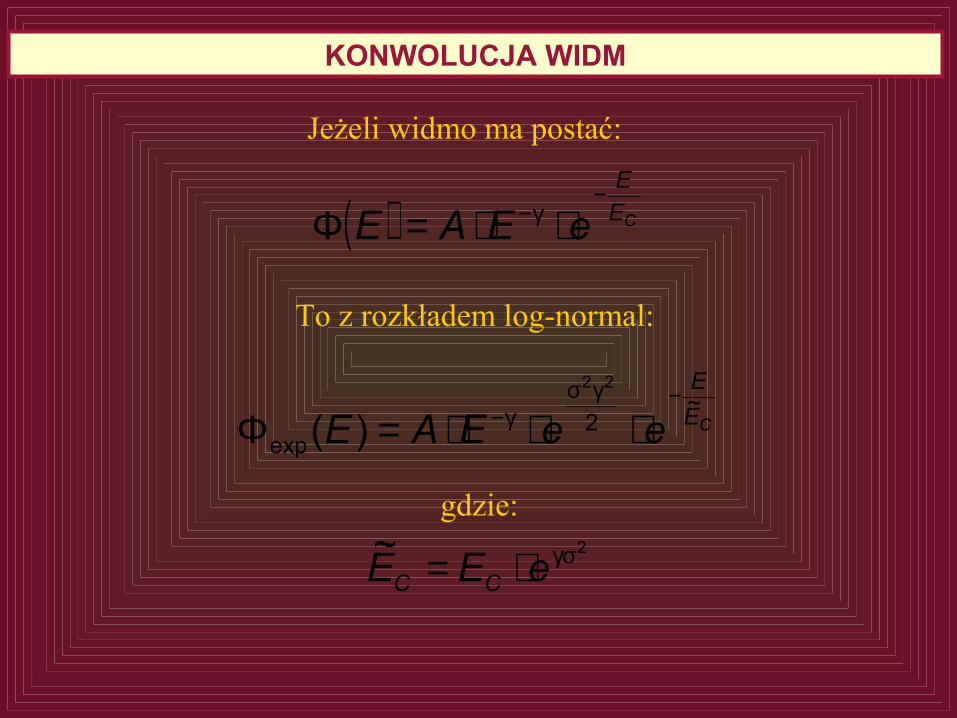
( ) CEE
eEAE−
γ− ⋅⋅=Φ
KONWOLUCJA WIDM
Jeżeli widmo ma postać:
To z rozkładem log-normal:
CEE
eeEAE~
2exp
22
)(−γσ
γ− ⋅⋅⋅=Φ
gdzie:2~ γσ⋅= eEE CC
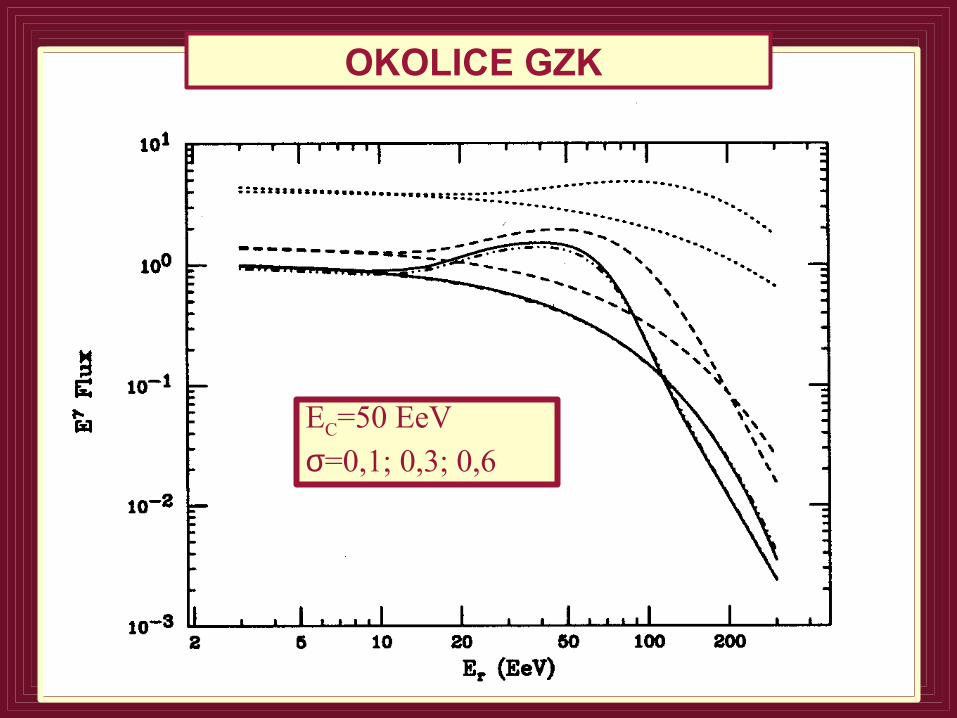
OKOLICE GZK
EC=50 EeVσ=0,1; 0,3; 0,6
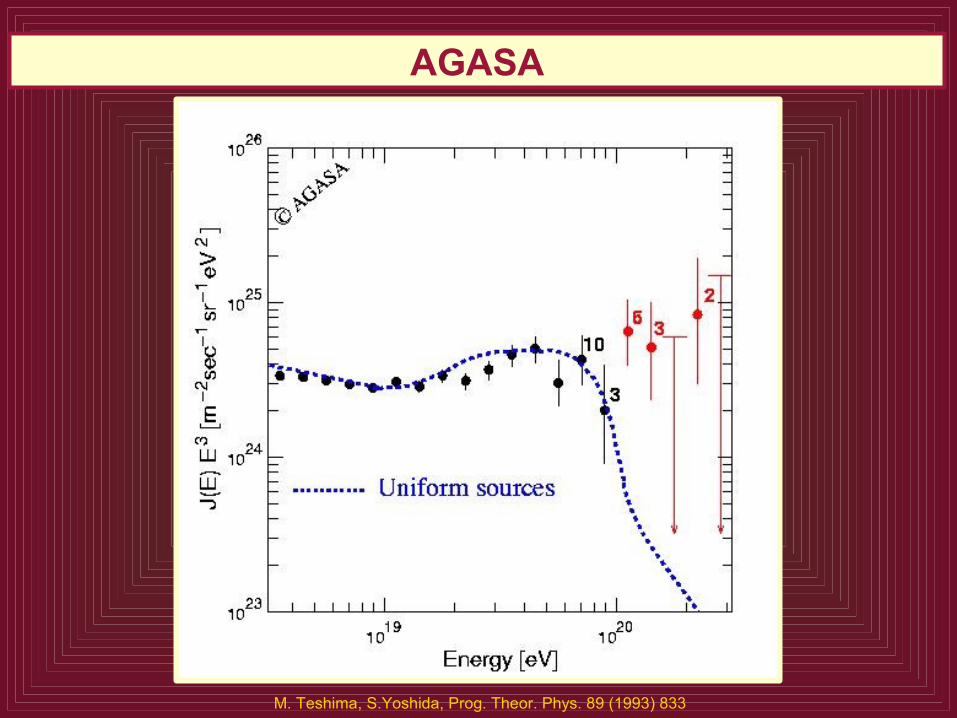
AGASA
M. Teshima, S.Yoshida, Prog. Theor. Phys. 89 (1993) 833
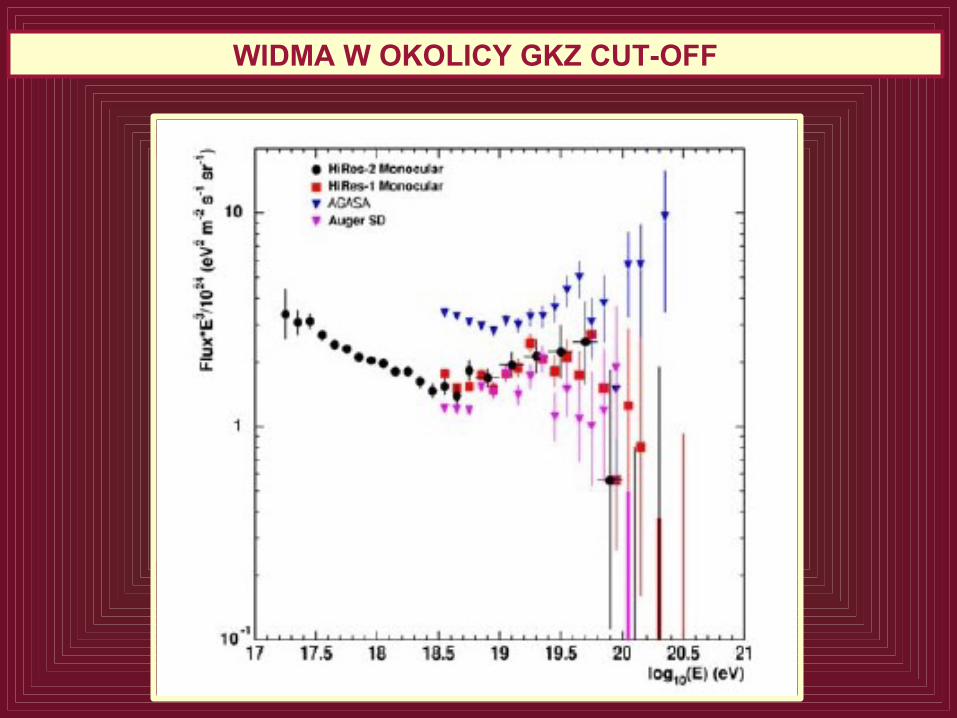
WIDMA W OKOLICY GKZ CUT-OFF
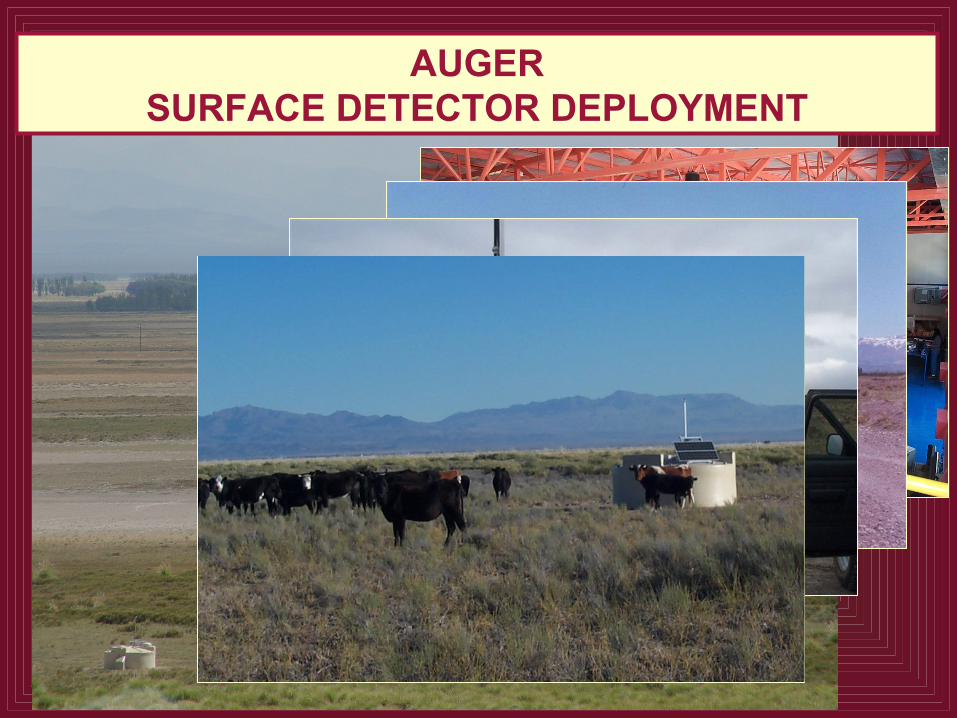
AUGERSURFACE DETECTOR DEPLOYMENT
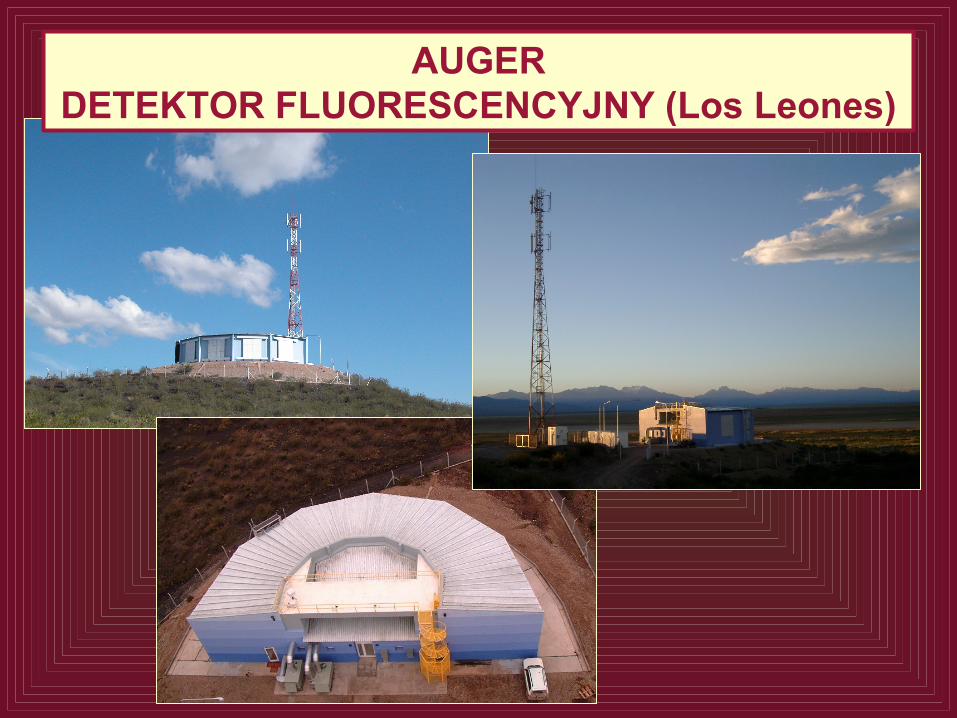
AUGERDETEKTOR FLUORESCENCYJNY (Los Leones)
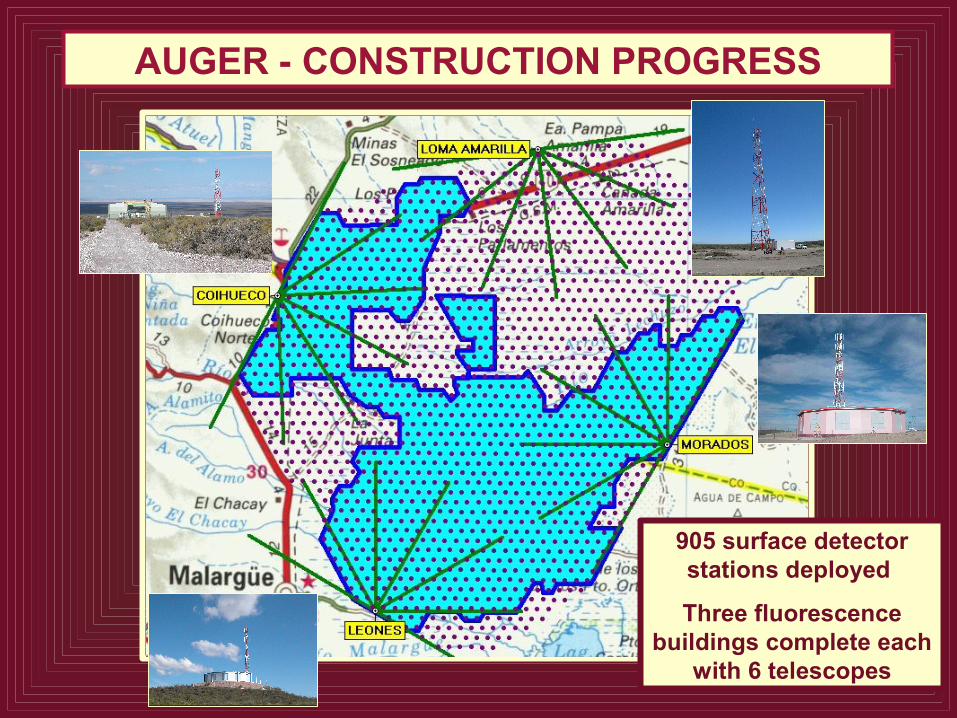
905 surface detector stations deployed
Three fluorescence buildings complete each
with 6 telescopes
AUGER - CONSTRUCTION PROGRESS
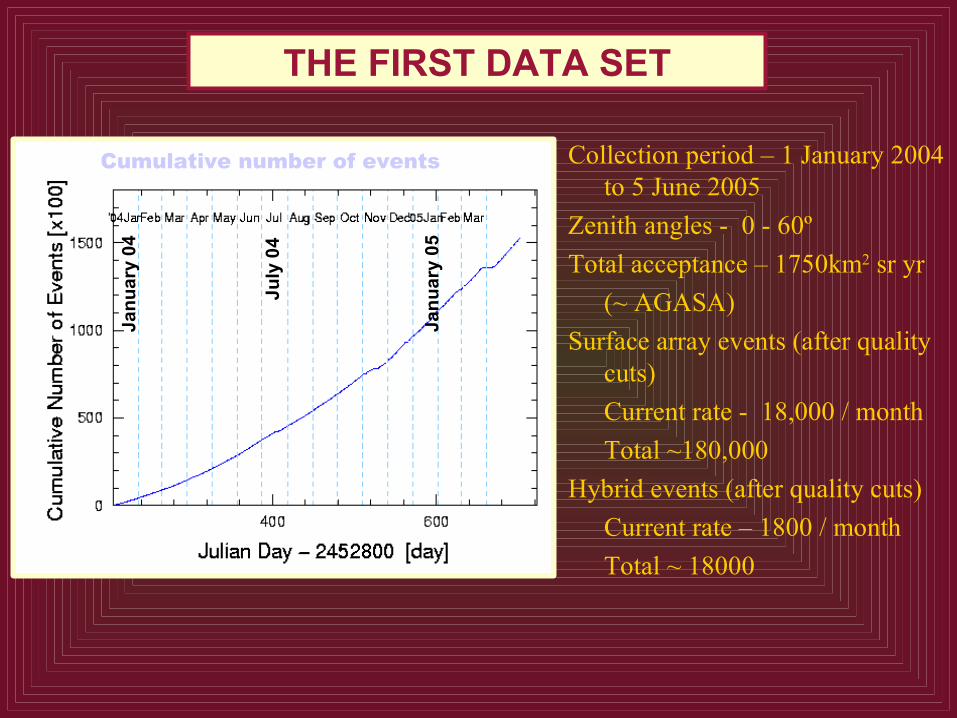
Collection period – 1 January 2004 to 5 June 2005
Zenith angles - 0 - 60ºTotal acceptance – 1750km2 sr yr
(~ AGASA)Surface array events (after quality
cuts)Current rate - 18,000 / monthTotal ~180,000
Hybrid events (after quality cuts) Current rate – 1800 / monthTotal ~ 18000
Cumulative number of eventsJa
nuar
y 04
July
04
Janu
ary
05
THE FIRST DATA SET
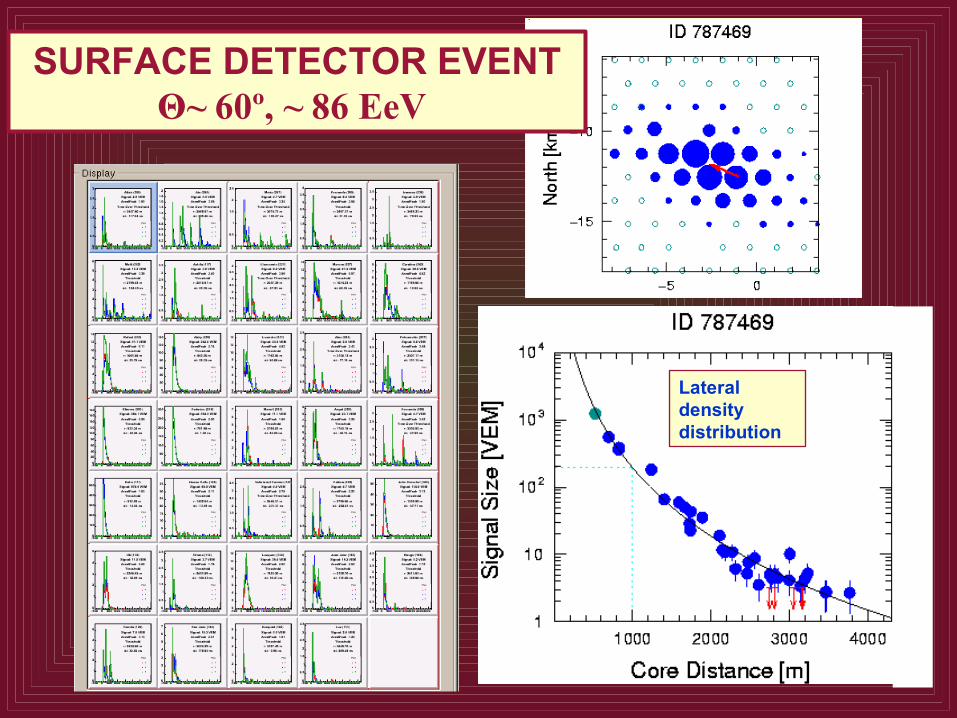
Lateral density distribution
SURFACE DETECTOR EVENTΘ~ 60º, ~ 86 EeV
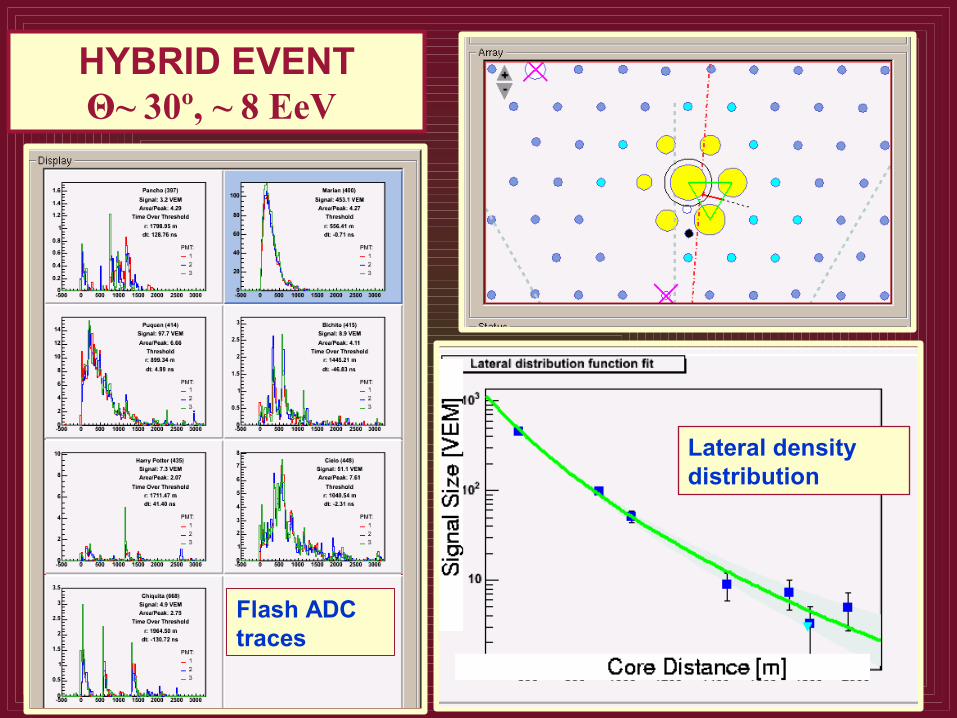
Flash ADC traces
Lateral density distribution
HYBRID EVENTΘ~ 30º, ~ 8 EeV
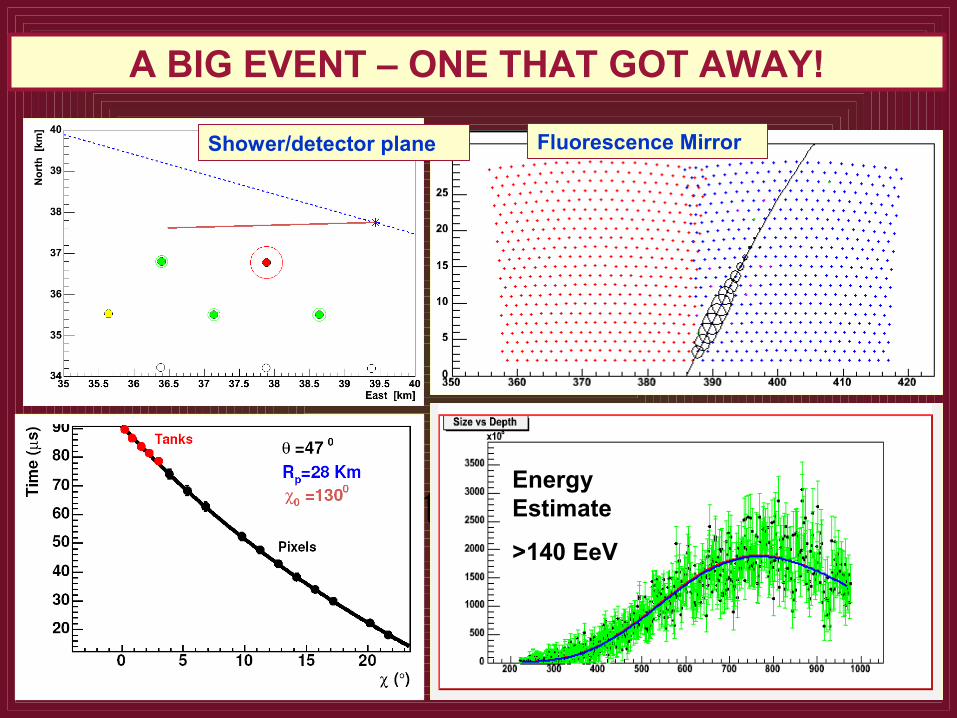
A Big Event - One that got away!
Shower/detector plane Fluorescence Mirror
Energy Estimate
>140 EeV
A BIG EVENT – ONE THAT GOT AWAY!
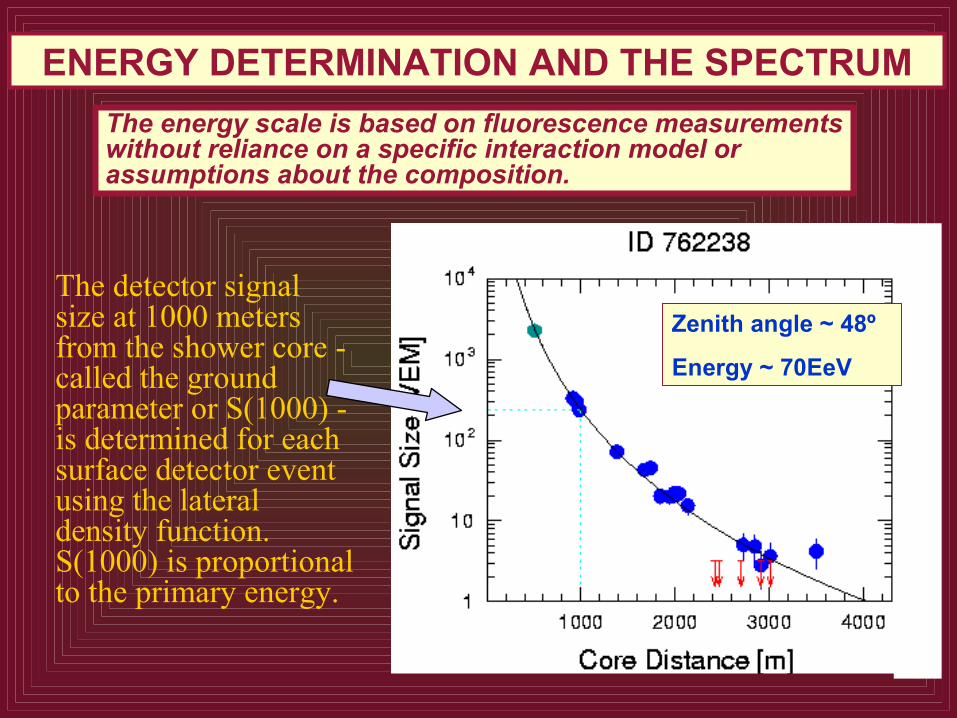
The detector signal size at 1000 meters from the shower core - called the ground parameter or S(1000) - is determined for each surface detector event using the lateral density function. S(1000) is proportional to the primary energy.
The energy scale is based on fluorescence measurements without reliance on a specific interaction model or assumptions about the composition.
Zenith angle ~ 48º
Energy ~ 70EeV
ENERGY DETERMINATION AND THE SPECTRUM
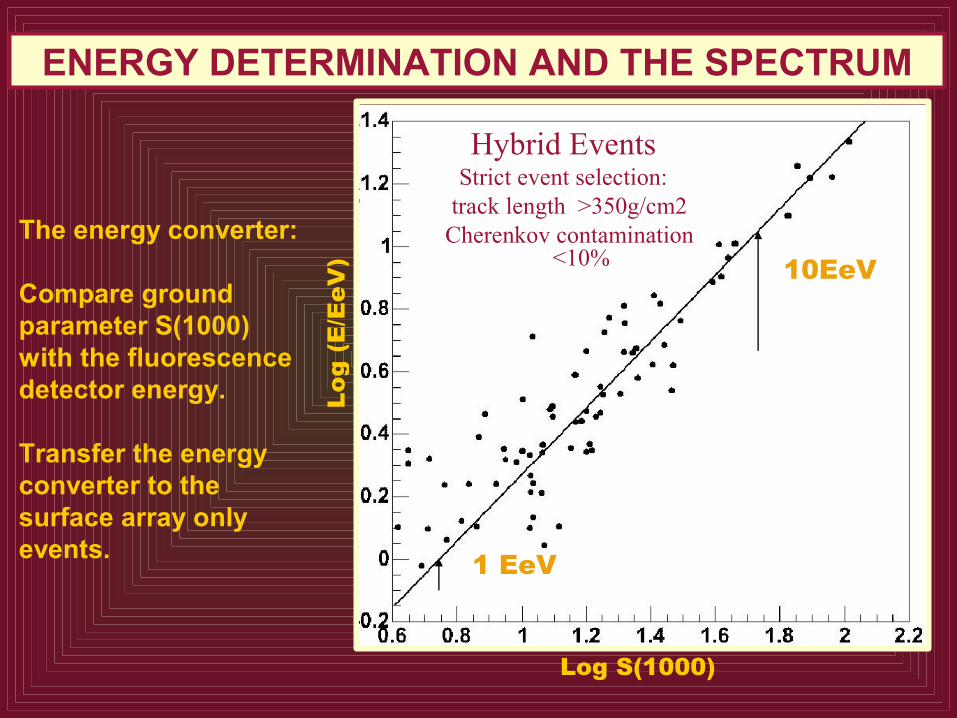
The energy converter:
Compare ground parameter S(1000) with the fluorescence detector energy.
Transfer the energy converter to the surface array only events.
Log S(1000)
Log
(E/E
eV) 10EeV
1 EeV
Hybrid EventsStrict event selection:
track length >350g/cm2 Cherenkov contamination
<10%
ENERGY DETERMINATION AND THE SPECTRUM
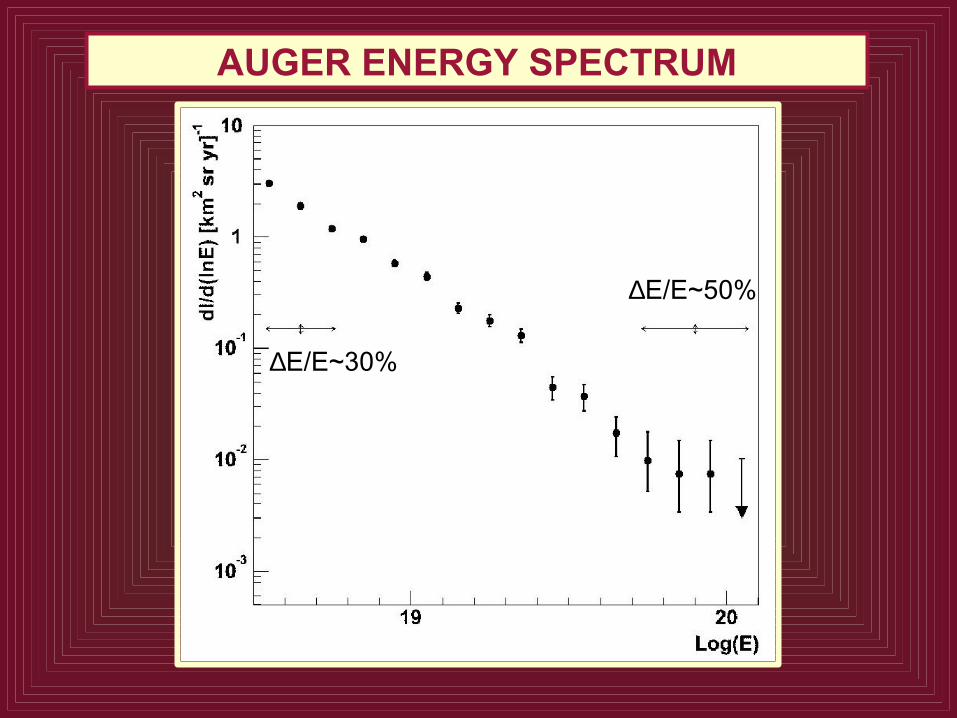
∆E/E~30%
∆E/E~50%
AUGER ENERGY SPECTRUM
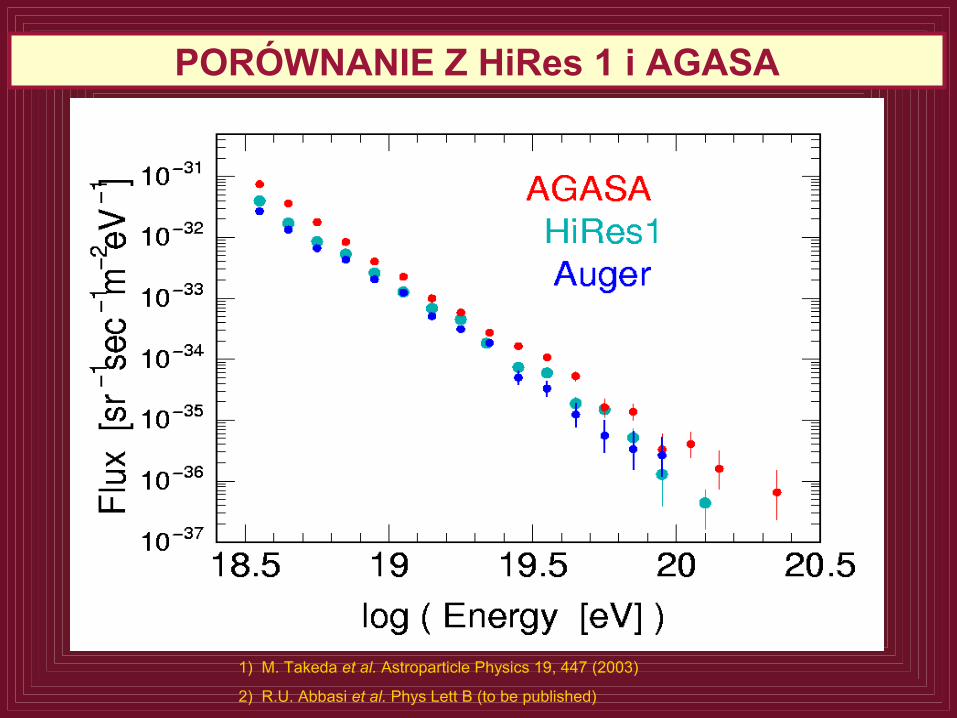
1) M. Takeda et al. Astroparticle Physics 19, 447 (2003)
2) R.U. Abbasi et al. Phys Lett B (to be published)
PORÓWNANIE Z HiRes 1 i AGASA
EGZOTYKA?
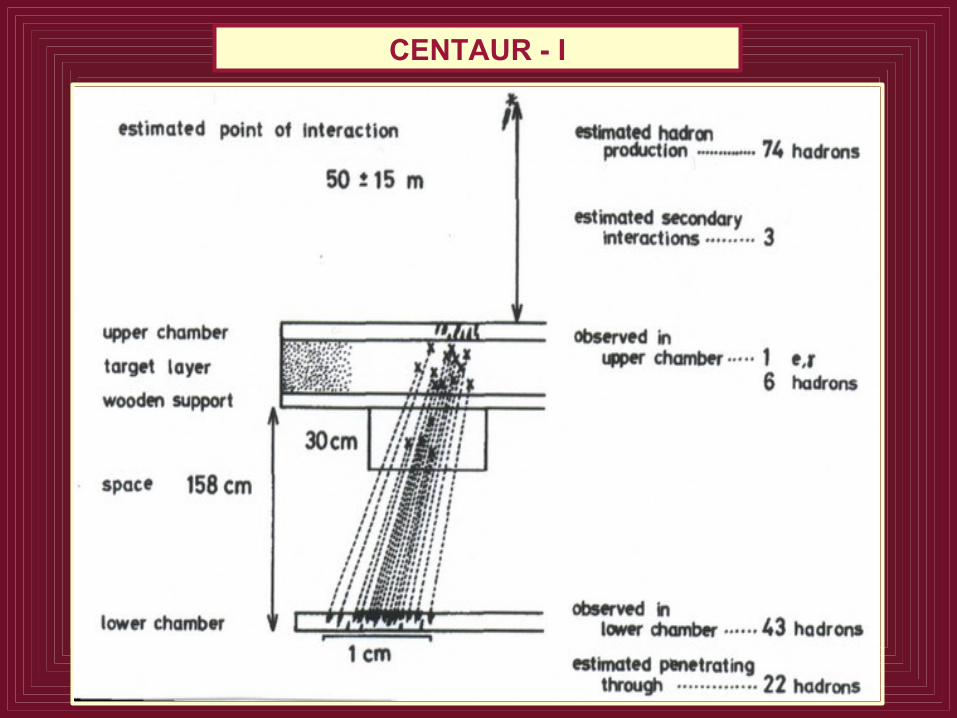
CENTAUR - I
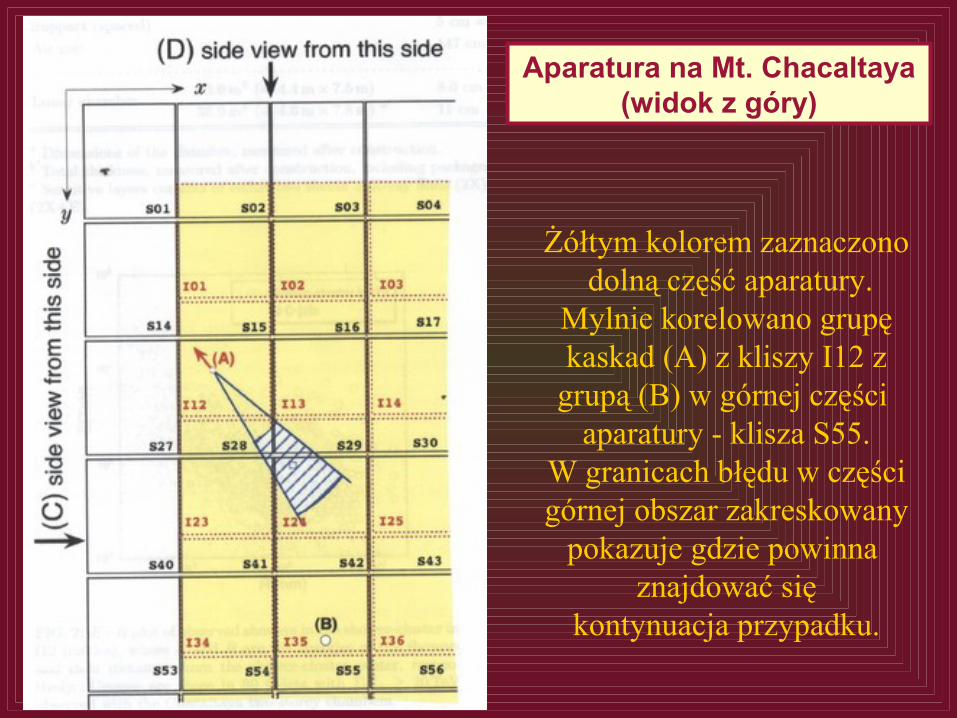
Żółtym kolorem zaznaczono dolną część aparatury.
Mylnie korelowano grupę kaskad (A) z kliszy I12 z grupą (B) w górnej części
aparatury - klisza S55.W granicach błędu w części
górnej obszar zakreskowany pokazuje gdzie powinna
znajdować się kontynuacja przypadku.
Aparatura na Mt. Chacaltaya (widok z góry)
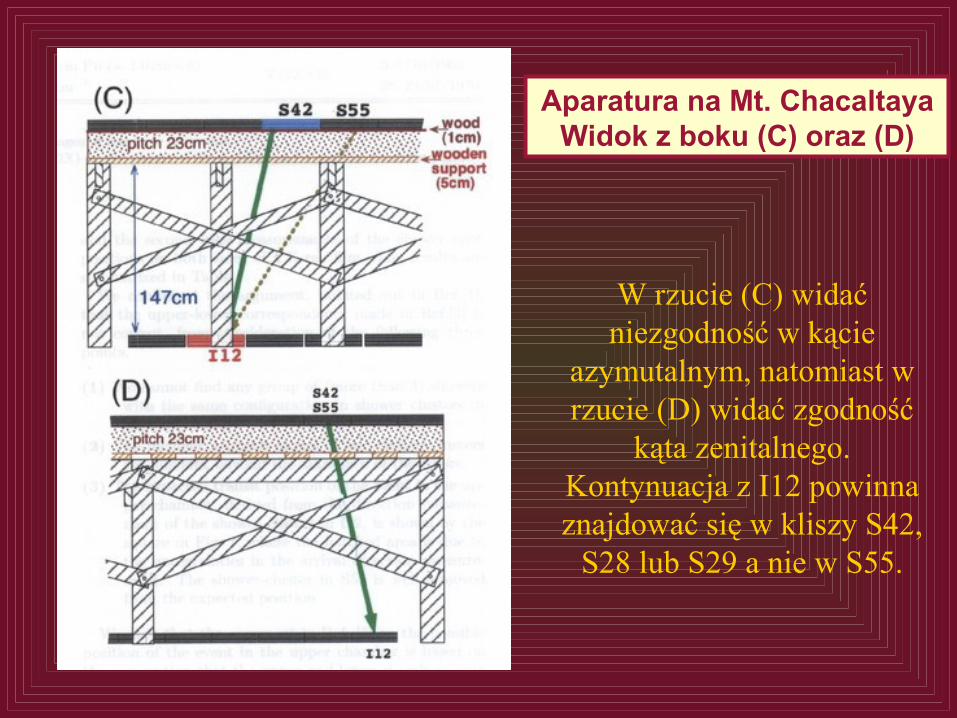
W rzucie (C) widać niezgodność w kącie
azymutalnym, natomiast w rzucie (D) widać zgodność
kąta zenitalnego.Kontynuacja z I12 powinna znajdować się w kliszy S42,
S28 lub S29 a nie w S55.
Aparatura na Mt. Chacaltaya Widok z boku (C) oraz (D)
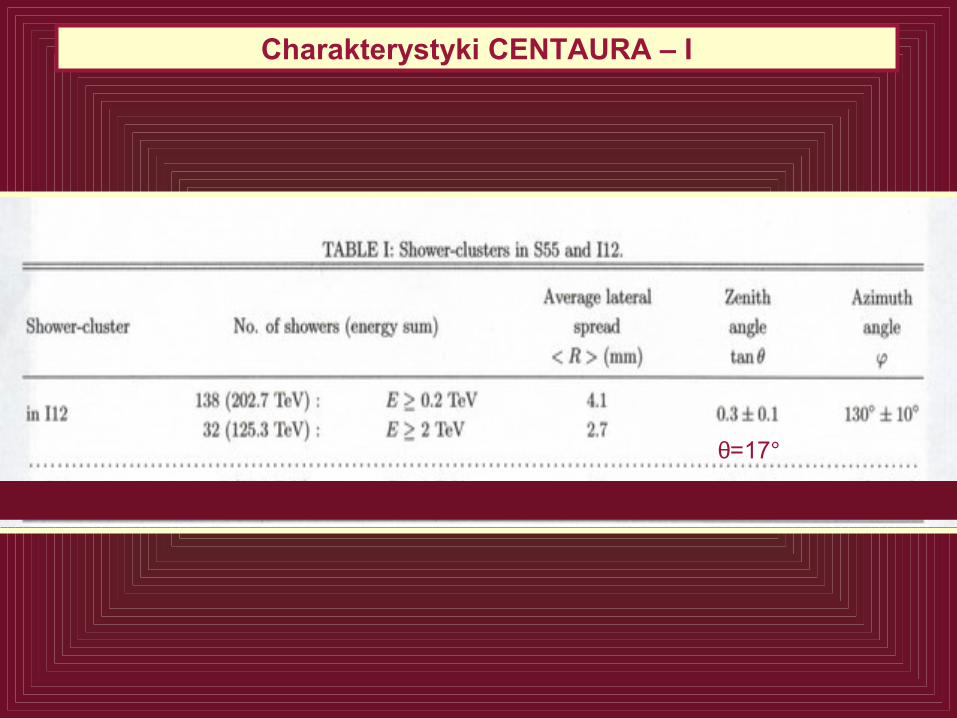
Charakterystyki CENTAURA – I
θ=17°
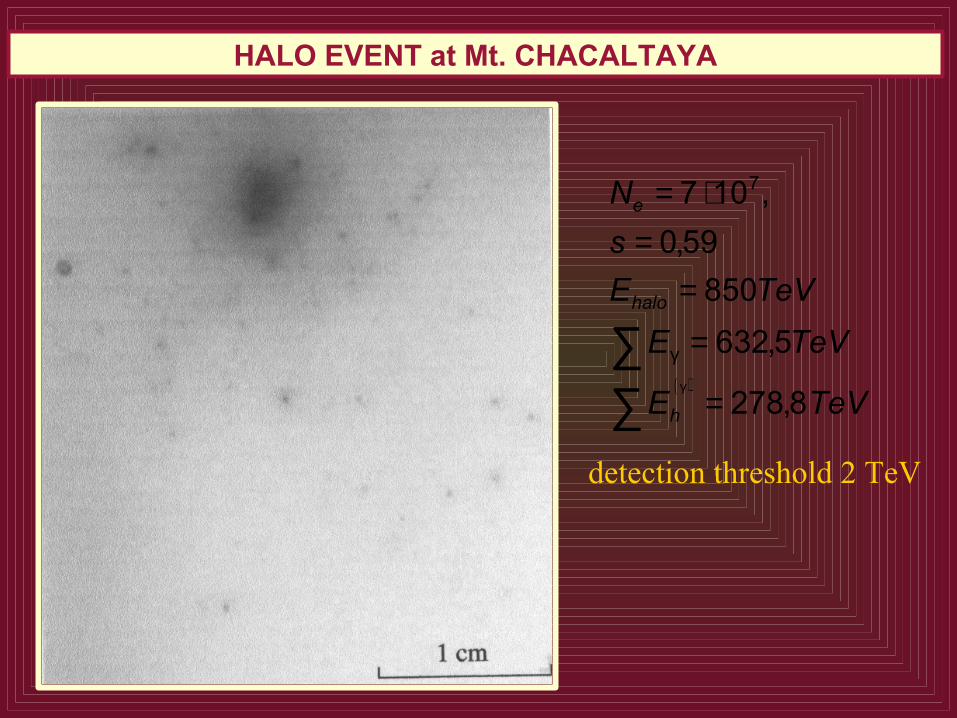
HALO EVENT at Mt. CHACALTAYA
detection threshold 2 TeV
( )TeVE
TeVETeVE
sN
h
halo
e
8,278
5,632850
59,0,107 7
=
=
==
⋅=
∑∑
γ
γ
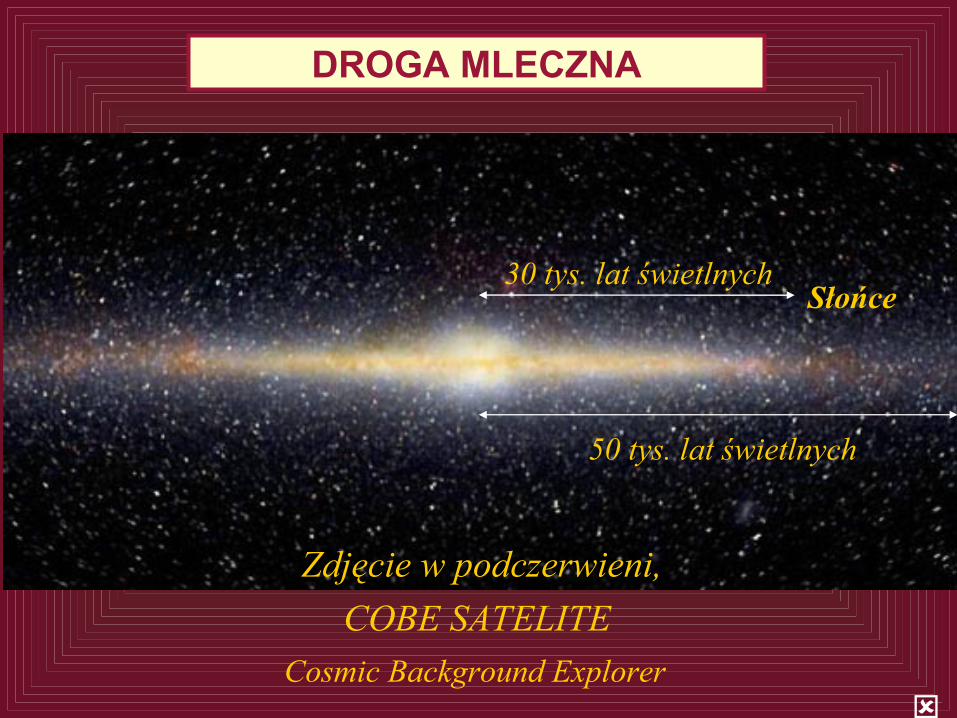
50 tys. lat świetlnych
Słońce
Zdjęcie w podczerwieni,COBE SATELITE
30 tys. lat świetlnych
Cosmic Background Explorer
DROGA MLECZNA
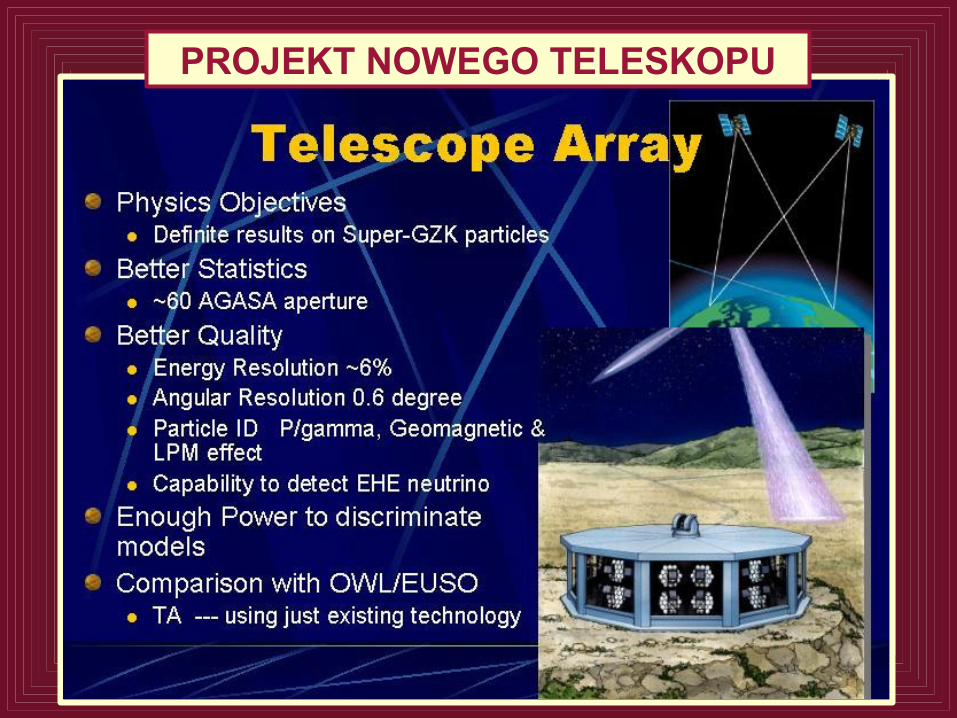
PROJEKT NOWEGO TELESKOPU
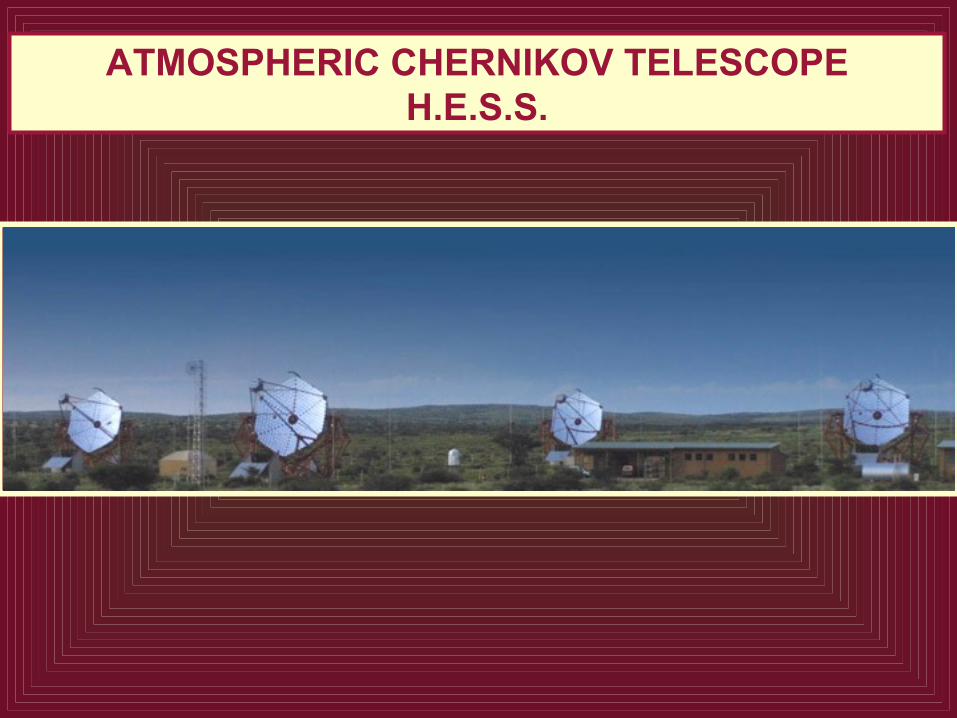
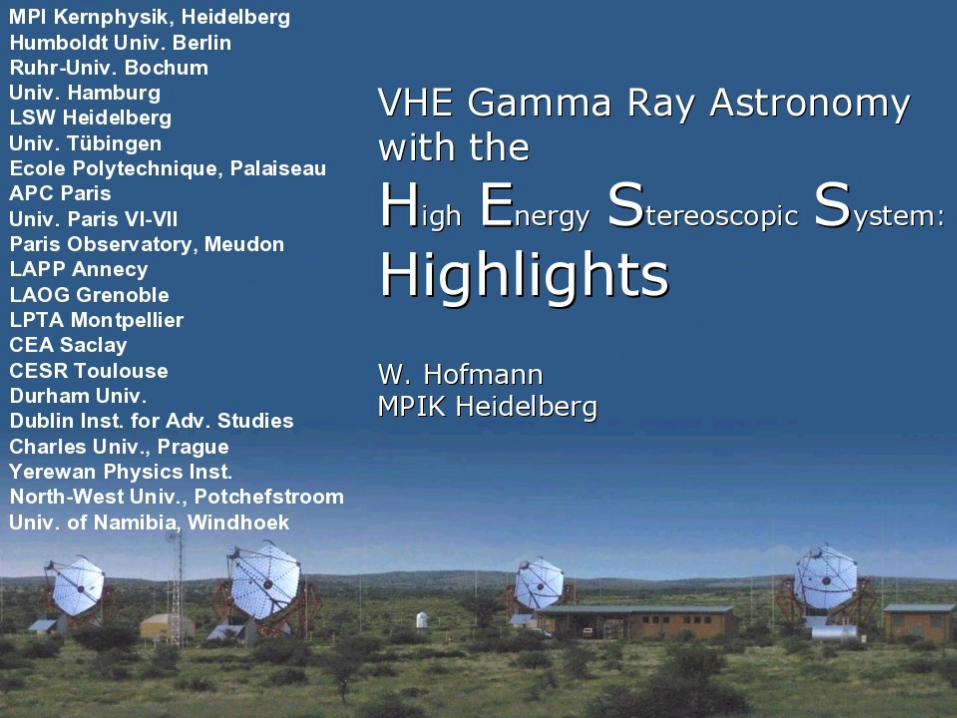
ATMOSPHERIC CHERNIKOV TELESCOPEH.E.S.S.
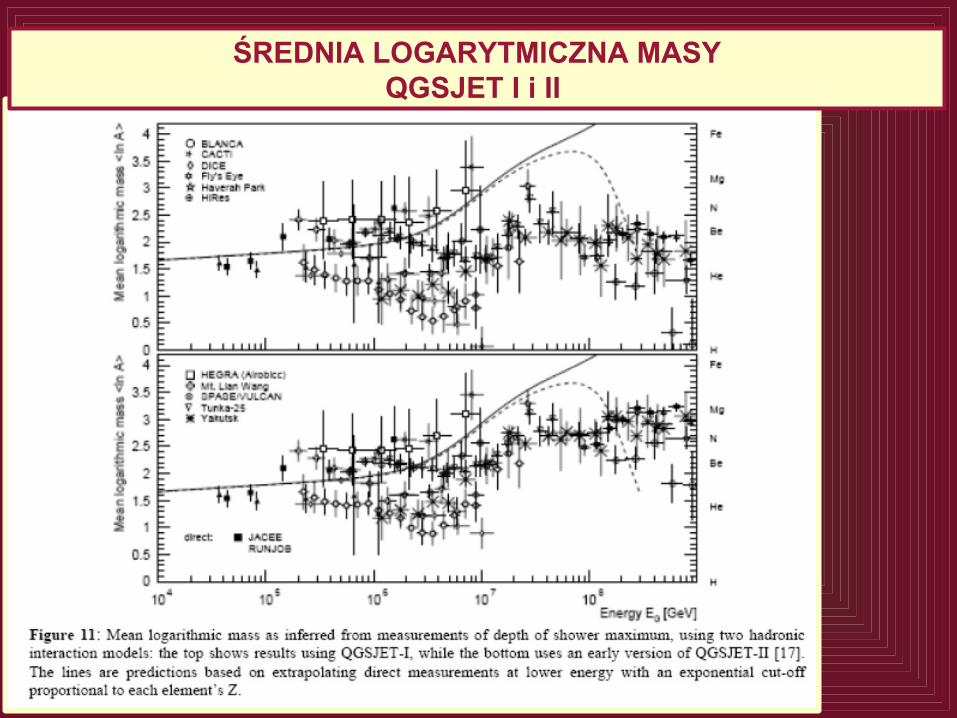
ŚREDNIA LOGARYTMICZNA MASYQGSJET I i II
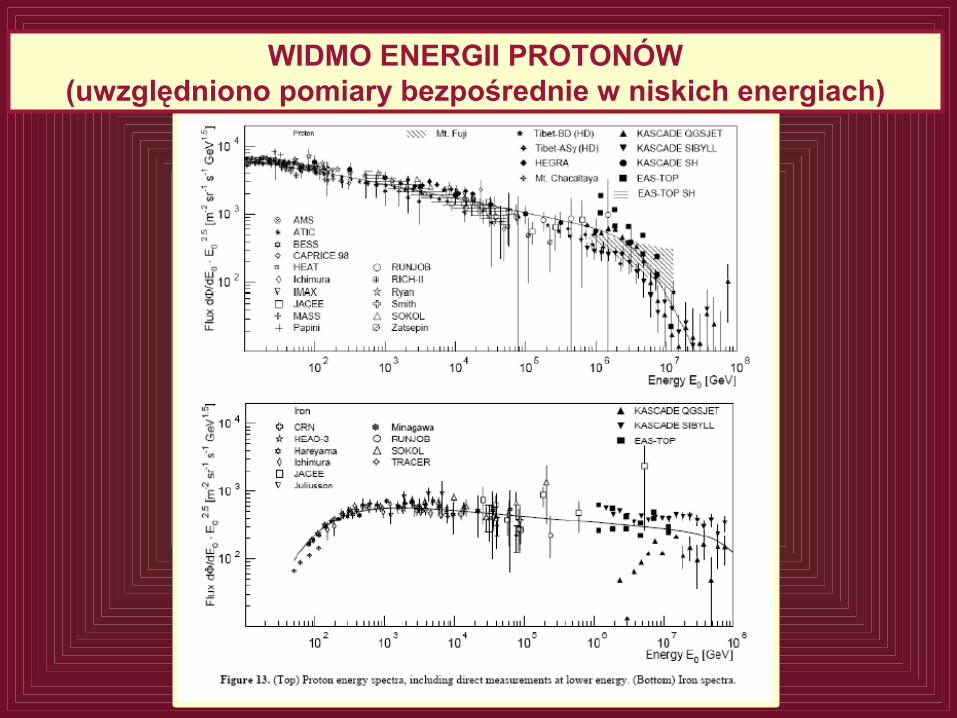
WIDMO ENERGII PROTONÓW(uwzględniono pomiary bezpośrednie w niskich energiach)
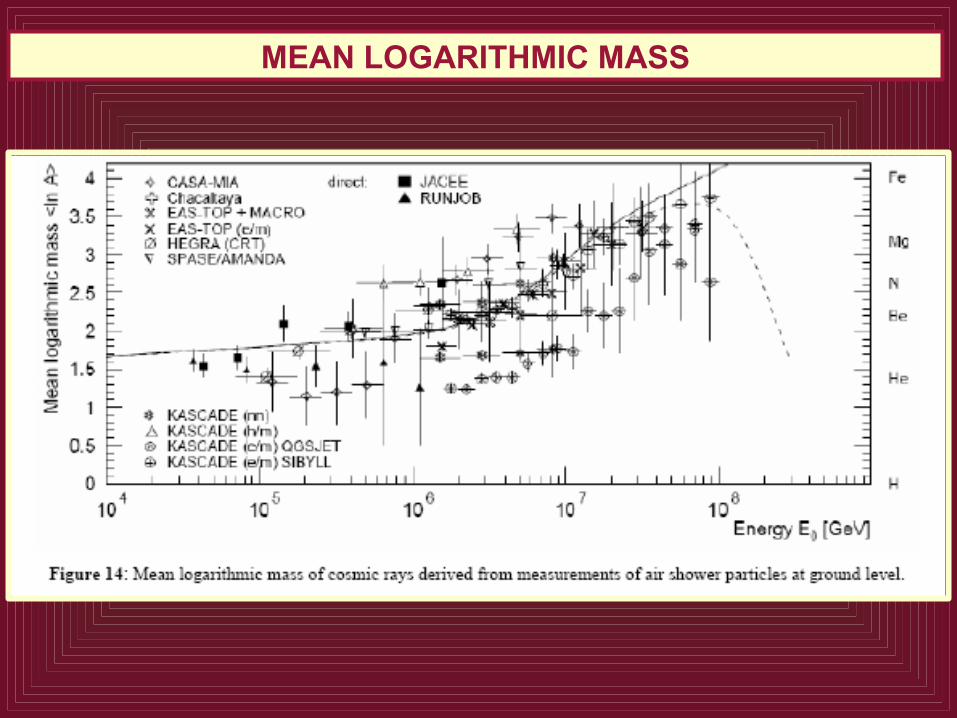
MEAN LOGARITHMIC MASS
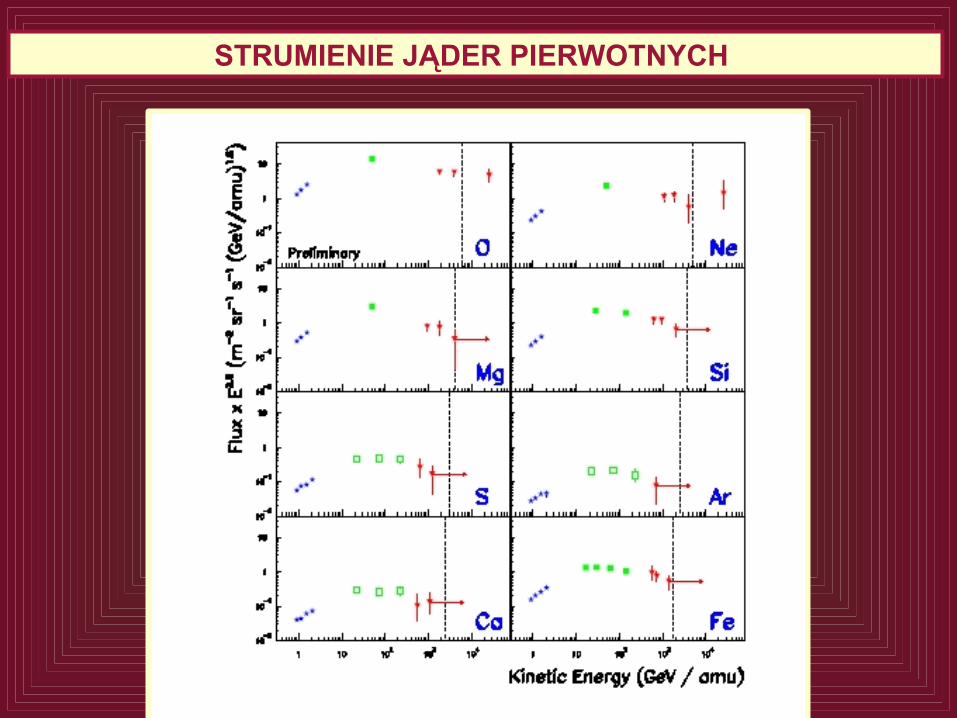
STRUMIENIE JĄDER PIERWOTNYCH