
'~Pl.L4' JUr''3 - Fermilab | Internal Contentlss.fnal.gov/archive/other/ganil-p-01-10.pdf ·...
28
.} Proton reaction cross section measurements on stable and neutron rich nuclei as a probe of the interaction potential A. de Vismes 4 , P. Roussel-Chomaz a , W. Mittig 4 , A. Pakou 4 ,b, N. Alamanos c , J-C. Angelique d , F. Auger C , J. Barrette e , E. Bauge!, A.V. Belozyorov g , C. Borcea h , F. Carstoiu 4 ,h, W. Catford i , M-D. Cortina-Gili, J-P. Delaroche f , Z. Dlouhyk, A. Gillibert C , M. Girod!, D. Hirata 4 , V. Lapoux c , A. Lepine-Szilyl, S. M. Lukyanov g, F. Marie c , A. MusumarraC,l, F. de Oliveira 4 , N. Orrd, S. Ottini-Hustache c , Y.E. Penionzhkevich g , F. Sarazin 4 ,2, H. Savajols4, N. Skobelev g 5 Submitted/or Publication in Nuclear Physics A , , GANIL P 01 10 I JUr''3 l' 2001 ,,")UBRARY
Transcript of '~Pl.L4' JUr''3 - Fermilab | Internal Contentlss.fnal.gov/archive/other/ganil-p-01-10.pdf ·...
.}
Proton reaction cross section measurements on stable and neutron rich nuclei as a probe of the interaction potential
A. de Vismes4, P. Roussel-Chomaza , W. Mittig4, A. Pakou4,b, N. Alamanosc ,�
J-C. Angeliqued, F. AugerC, J. Barrettee , E. Bauge!, A.V. Belozyorovg , C.� Borceah , F. Carstoiu4 ,h, W. Catfordi , M-D. Cortina-Gili, J-P. Delarochef , Z.� Dlouhyk, A. GillibertC, M. Girod!, D. Hirata4, V. Lapouxc , A. Lepine-Szilyl,� S. M. Lukyanov g, F. Mariec , A. MusumarraC,l, F. de Oliveira4, N. Orrd, S.�
Ottini-Hustachec , Y.E. Penionzhkevichg , F. Sarazin4,2, H. Savajols4, N.� Skobelevg�
5 Submitted/or Publication in Nuclear Physics A
, ,
'~Pl.L4' GANIL P 01 10 I JUr''3 l' 2001
,,")UBRARY
Proton reaction cross section Ineasurenlents on stable and neutron rich nuclei as a probe of the interaction potential
A. de Vismesa , P. Roussel-Chomaza, W. Mittiga , A. Pakoua,b, N. Alamanosc,� J-C. Angeliqued
, F. AugerC , J. Barrettee
, E. Baugef , A.V. Belozyorovg , C.� Borceah, F. Carstoiua,h, W. Catfordi , M-D. Cortina-Gilj , J-P. Delarochef , Z.� Dlouhyk, A. GillibertC
, M. Girodf , D. Hirataa , V. Lapouxc, A. Lepine-Szilyl,� S. M. Lukyanov g, F. Mariec, A. Musumarrac,l, F. de Oliveiraa, N. Orrd , S.�
Ottini-Hustachec, Y.E. Penionzhkevichg , F. Sarazina,2, H. Savajolsa, N.� Skobelevg�
a GANIL (DSM/CEA, IN2P3/CNRS), BP 5027, 14076 Caen Cedex 5, France b Department of Physics, The University of Ioannina, 45110 Ioannina, Greece�
C CEA/DSAI/DAPNIA/SPhN, Saclay, 91191 Gif-sur- Yvette Cedex, France� d LPC, IN2P8/CNRS, ISMRa and Univ. of Caen, F-14050 Caen, Cedex,�
France� e Department of Physics, McGill University, Montreal, QC, Canada, H8A 2T8�
f CEA/DAM/DPTA/SPN, 91680 Bruyeres-le-Chatel, BP 12, France� g FLNR,JINR, Dubna, P. O. Box 79, 101 000 Moscow, Russia�
h Inst. Atomic ph'ysics, P. O. Box MG6, Bucharest, Romania� i Department of Physics, University of Surrey, Guilford, Surrey GU2 7XH,�
United Kingdom� j Dpto Fisica de Particulas, Universidad Santiago de Compostela, 15706�
Santiago de Compostela, Spain� k Nuclear Physics Institute, ASCR, 25068 Rez, Czech Republic�
I IFUSP- Universidade de Sao Paulo, C.P. 66818, 05889-970 Sao Paulo, Brazil�
Abstract
Proton reaction cross section measurements on various stable and neutron rich nuclei( 4,6He, 7-9Li, 9- 11 Be, 21-24 F, 22-26 Ne, 25-29 Na and
29-32 Mg) were performed via the attenuation method at intermediate energies ("" 35-75 A MeV) and using a cryogenic hydrogen target. The results are discussed in the framework of different approaches of the nuclear interaction potential.
PACS number(s): 25.60.Dz,24.10.-i KEYWORDS: reaction cross sections, halo nuclei, macroscopIC po
tential, microscopic potential.
1 present address:INFN-Laboratori Nazionali del Sud, Via S. Sofia 44,95123 Catania Italy 2present address:Department of Physics and Astronomy, Edinburgh EH9 3J2, Scotland,
UK
1 Introduction
Reaction cross sections are of fundamental interest in nuclear physics, since they provide a measurement of the size of the nucleus. They are an effective ·tool for revealing unusual features in nuclei such as extended halo or neutron skins [I, 2, 3, 4]. At low energy, they also complement elastic scattering data to obtain information on the nuclear interaction potential. Indeed, absorbing processes affect the elastic scattering angular distributions, therefore reaction cross sections can place restrictions on the amount of absorption, as represented by the imaginary potential [5, 6].
The nuclear interaction potential has been studied extensively through nucleon-nucleus elastic scattering measurements. Concerning the stable nuclei, a vast amount of experimental data for nucleon-nucleus elastic scattering was interpreted in the framework of phenomenological and microscopic potential models with the adjustment of no or only a few parameters [7, 8, 9, 10, 11, 12, 13, 14, 15, 16, 17] .
With the advent of radioactive beam facilities, elastic scattering measurements are currently extended to neutron rich nuclei close to the drip lines (e.g see ref [18, 19, 20, 21]), by using inverse kinematics (secondary beam incident on a proton target). However, because of the low beam intensities, such studies often span a narrow angular range and cannot define unambiguously the interaction potential.
We report in this work on measurements of proton reaction cross sections for a series of isotopes, some of them stable but most of them unstable, aiming at a better understanding of the po.tential for neutron rich nuclei. The measurements were performed, using inverse kinematics and cover the intermediate energy regime (35-75 MeV/nucleon), while previous measurements, even for stable nuclei, existed only for energies lower than 48 MeV or higher than 100 MeV [22]. The data were compared to theoretical predictions based on either global phenomenological parameterizations [9, 11, 12] or the microscopic JLM approach [7], using different types of density distributions.
2 Experinlental details and results
The secondary beams were produced by fragmentation of a 60 MeV/nucleon 48Ca primary beam, delivered by the Ganil accelerator complex, and incident on a 0.5 mm thick Be production target, backed by a Ta layer of 250 /-1.111. The secondary beam ions were selected by the spectrometer LISE [23]. Measurements were performed at two different magnetic rigidity (Bp) settings, in order to optimize the transmission of the light (Z :s 8, Bp = 2.71 T.m) or heavy (Z 2: 8, Bp = 2.40 T.m) fragments. Since the reaction cross section was measured
1
..
simultaneously for different secondary beams at the same magnetic rigidity, the projectile energy was dependent on the considered species.
The reaction cross section (J'R was measured by the attenuation method [24]. In this technique, one simply counts the number of beam particles of each species incident on the target (Nd, and the corresponding number of outgoing particles which have not undergone a reaction in the target (NJ ). This last number includes the residual beam nuclei as well as elastically scattered nuclei within the acceptance of the detectors. The difference between (Ni ) and (NJ ) represents the number of reactions (Nreae ) which occured in the target. The reaction cross section (J'R can then be deduced from the reaction probability through the relation
Nreae NJ Nd PR =-- =1- - = 1 - exp (-(J'R-f), (1)
Nine Ni A
3where d is the target density in gjcm , N the Avogadro number, A the target mass number, and f the thickness of the target in cm.
2.1 Detection system
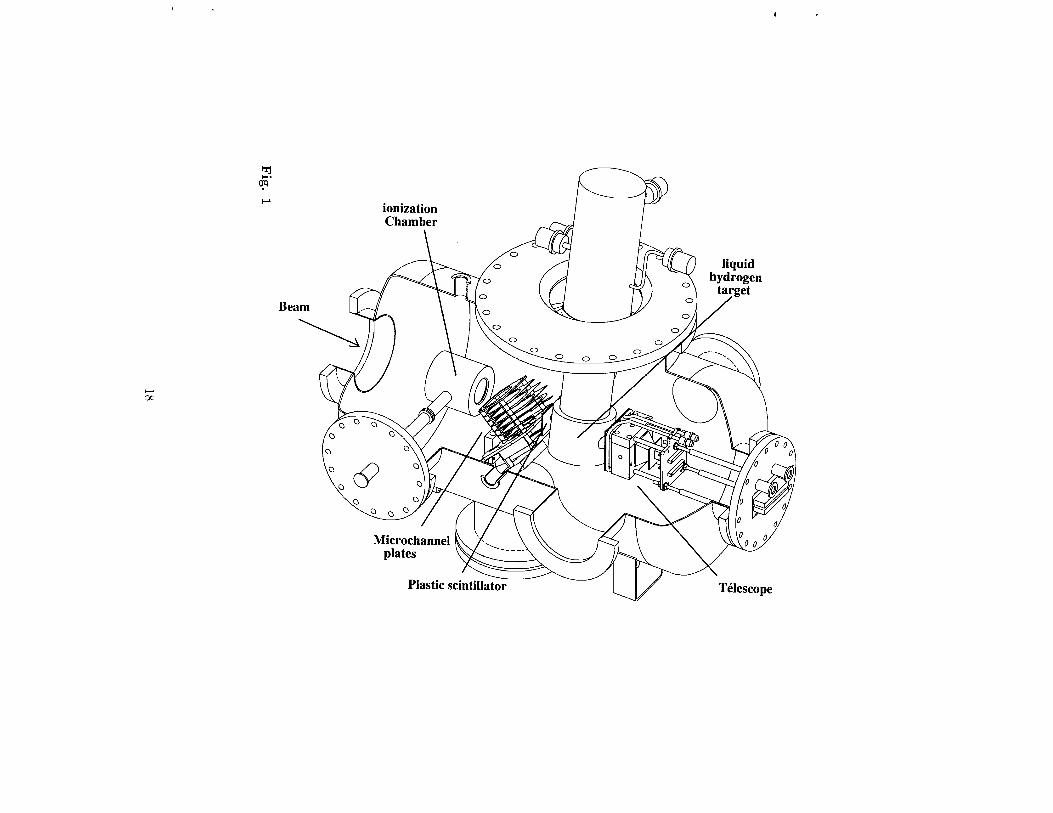
The experimental set-up is schematized in Fig. 1. The incident ions were counted and identified by the ~E-TOF method. Their energy loss was measured in an ionization chamber of 10 cm diameter, 10 cm thick, and filled with isobutane at the 300 mbar pressure. Their time-of-flight was measured with respect to the RF of the cyclotrons with a position sensitive microchannel plate detector [25]. Finally a 2 mm thick plastic scintillator, with a 13 mm diameter hole was used as an active collimator.
Downstream of the target the ions were counted and identified by ~E-E method in a telescope, located 6.5 cm behind the target and composed of a thin microstrip, position sensitive, Si detector (surface 50x50 mm2, thickness 500 pm), a standard semiconductor Si(Li) detector (surface 50x50 mm 2
, thickness 3500 pm) and a thick CsI scintillator (surface 50x50 mm 2
, thickness 4 cm). These detectors were part of the detector system CHARISSA [26]. The light fragments were identified by using the energy loss measured in the Si and Si(Li) detectors and the residual energy in the CsI detector, whereas the heavier fragments did not reach the latter and were therefore identified by their energy loss measured in the Si detector and residual energy in the Si(Li) detector. The absence of results in the present data set for 5 ::; Z ::; 8 nuclei and for some of the isotopes with Z ::; 4, such as 11 Li is because those nuclei were stopped near or in the region of the dead layer of the Si(Li) detector.
2.2 The cryogenic target
2
In the present experiment it is impossible to use as a proton target hydrogenated material such as polypropylene since there would be no possibility to differentiate between reactions on the protons from that on other elements in the target. It was thus necessary to consider a pure hydrogen target. The use of a gaseous hydrogen target was rejected because of its low specific density. To obtain a reasonable reaction probability such a target would have to be rather long and not adapted to our detection system.
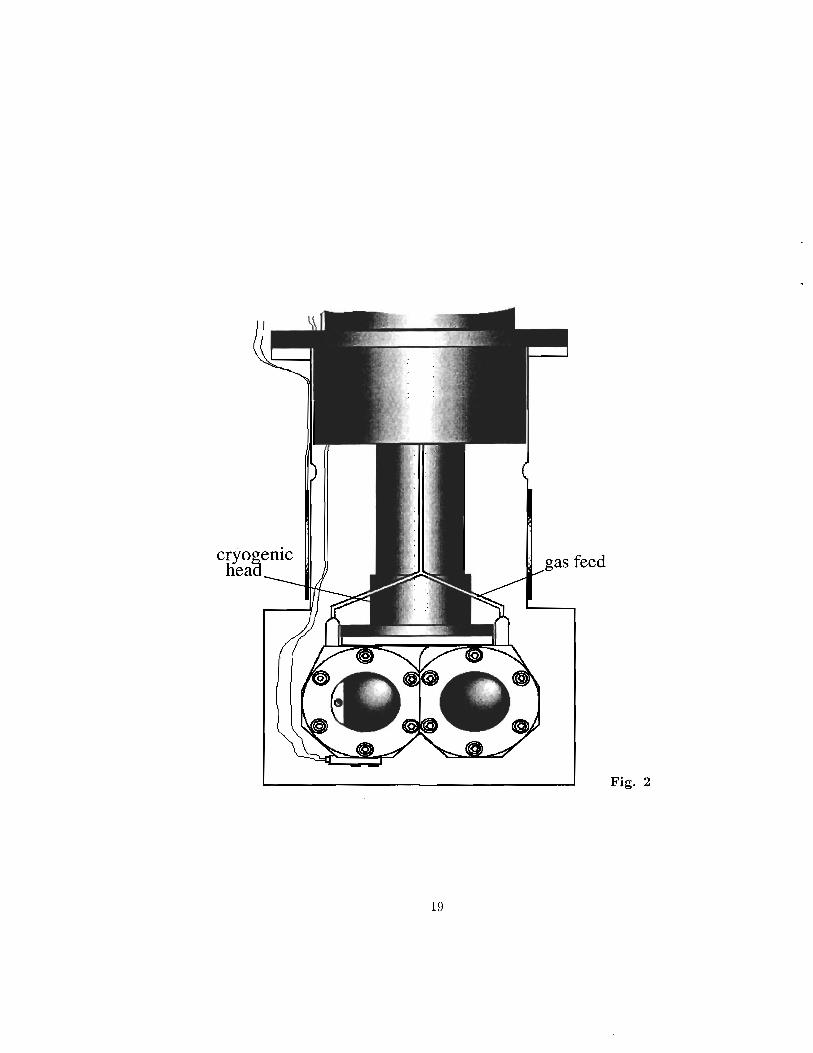
Rather, a cryogenic liquid hydrogen target was built. This target uses the cold head of a cryogenic pump Leybold RW5 [27]. The target and the cold head are represented in Figure 2. The cryogenic head, supplied with a turbocompressor, is composed of a 80K stage with a screen, and a 20K stage. Through thermic contact with the latter, gaseous hydrogen arriving through the capillaries to the target cools down and liquefies. The temperature is measured with an AsGa resistance fixed at the lower part of target. The target is operated at atmospheric pressure where the liquefaction temperature of hydrogen is 20K. During the experiment, the temperature of target stayed below 14K. This temperature was reached within one hour, starting from room temperature. Heating resistances were installed on the 80K screen, so that the time for heating up the target from liquid hydrogen temperature back to room temperature was also of the order of one hour.
The target itself is formed of two parts, 0.5 cm and 1 cm thick, respectively, each of them having a diameter of 2 cm. The windows are 4.4 J..lm thick havar foils. The total thickness of the windows is 7 mg/cm2
, compared to 70 mg/cm 2
of liquid hydrogen for the 1 cm thick target. The corresponding reaction probability on the havar window was of the order of 1% of that for hydrogen and could be exactly subtracted by empty target measurements where the target was heated up to remove hydrogen. A 1 mm wide hole on the left of the target was used for effective target thickness measurements, performed by energy loss differences. In measurements with hydrogen in the target, the target windows were deformed, due to the hydrogen pressure. The average target thickness was found to be equal to 1.12 ± 0.01 cm for the 1 cm thick target and to 0.607 ± 0.006 cm for the 0.5 cm target. Furthermore, in a series of measurements, where the spectrometer settings were optimized for the heavy nuclei (Bp = 2.4 T.m), the liquefaction was not achieved in a homogeneous way, and bubbles appeared. For these measurements, due to the important energy loss of the secondary beams in 1 cm thick target, the reaction probability was measured only in the 0.5 cm target. The average thickness measured in this case by energy loss differences between the full and empty target, presented a slight and regular variation for the different nuclei: from 0.500 cm for 21 F up to 0.538 cm for 31 Mg. This variation was due to the fact that the different secondary beams did not, on average, hit the target at the same position, and therefore saw different effective thicknesses. These different thicknesses for the different nuclei have been considered in the subsequent analysis.
3
2.3 ExperiIl1ental results
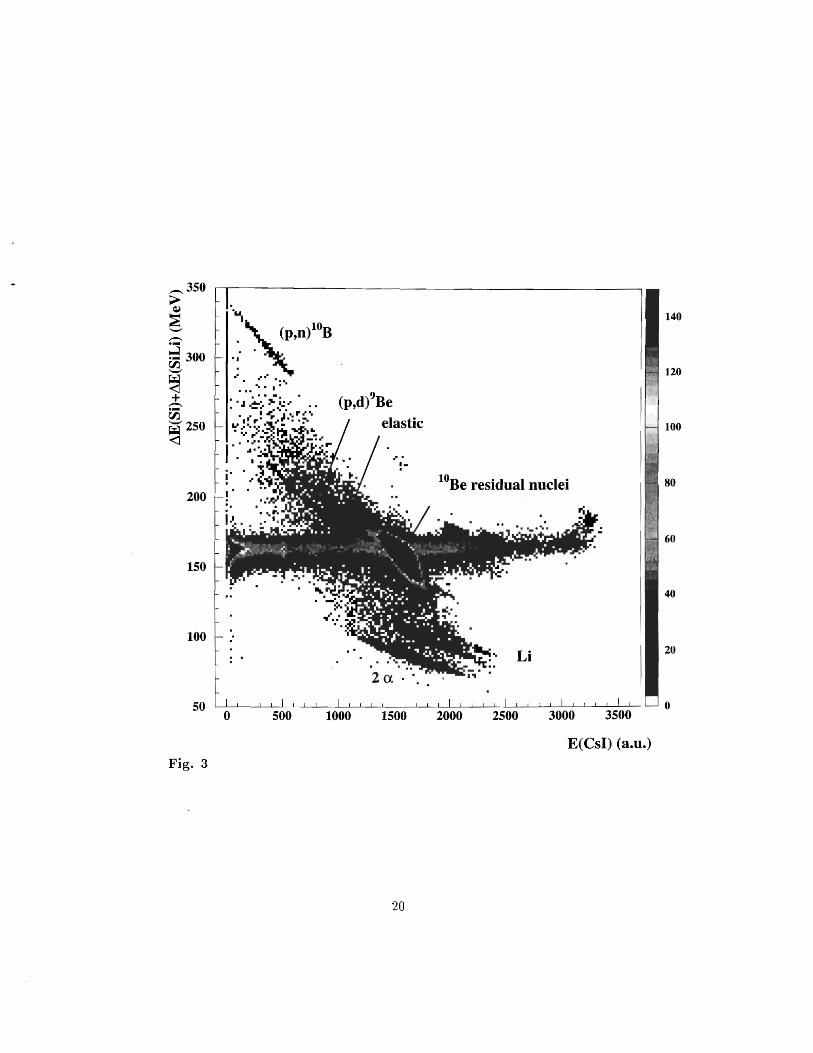
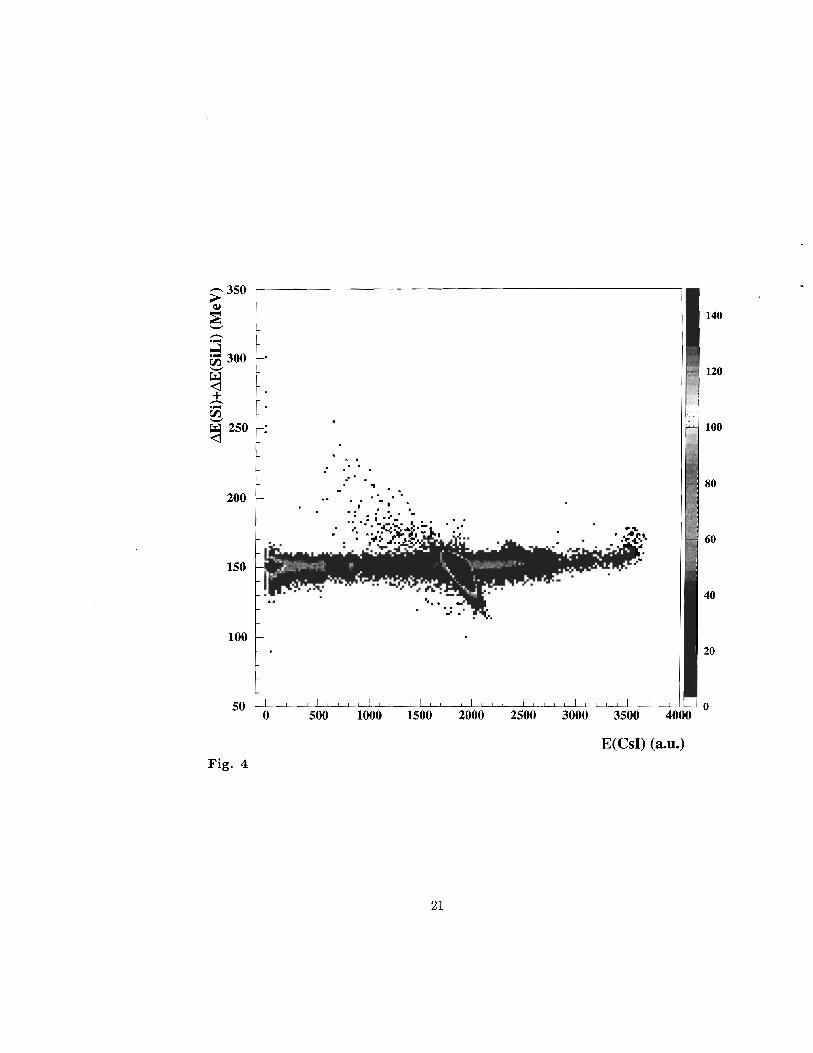
Two typical identification plots for lOBe incident ions with the 1 cm thick target and with empty target are displayed in Figs. 3 and 4, respectively. These two plots were obtained with the conditions that all detectors upstream of the target, except the active plastic collimator, have fired and that the incident particles have been identified as lOBe. Downstream of the target, the identification was obtained by using the sum of energy losses in the Si and Si(Li) detectors and the residual energy deposited in the CsI detector. In Fig. 3, the highest intensity peak corresponds to the lOBe nuclei which did not undergo any reaction or which were elastically or inelastically scattered to the bound excited states of lOBe. This lOBe peak is superimposed on a .1.E = constant line which has two origins. For ECsI ::; ECsleoBe), it originates from the reactions inside the CsI detector, whereas for ECsI ~ ECsleOBe), it is due to the pile-up in the CsI detector. Two Be lines can be clearly distinguished: one corresponding to the kinematical line of elastic and inelastic scattering to bound excited states, starting at the upper left edge of the lOBe peak, and the second one corresponding to the one neutron stripping lOBe(p,d)9Be reaction. In the lower part of the identification plots, two lines corresponding to Li isotopes (proton stripping) are observed as well as the line corresponding to the 2a decay of 8Be following the lOBe(p,t )8Be reaction. Finally lOB fragments are also detected, originating from the lOBe(p,n) lOB charge exhange reaction. The number of nuclei which did not undergo any reaction in the target was obtained by taking the lOBe residual peak, the line of reactions in CsI and pile-up (except the counts attributed to the In transfer reaction along the lOBe(p,d)9Be line, determined using a fitting procedure), and the elastic line. The same identification plot obtained with the empty target is shown in Fig. 4. The final reaction probability is obtained by subtracting the reaction probabilities of the empty from that of the filled target runs. The total error on the experimental values is ±5 %. It includes the error on the determination of the target thickness which is of the order of 1% and the error on the determination of the reaction probability, which is mainly depending on the definition of the graphic cuts for the subtraction of reactions. The statistical errors are negligible.
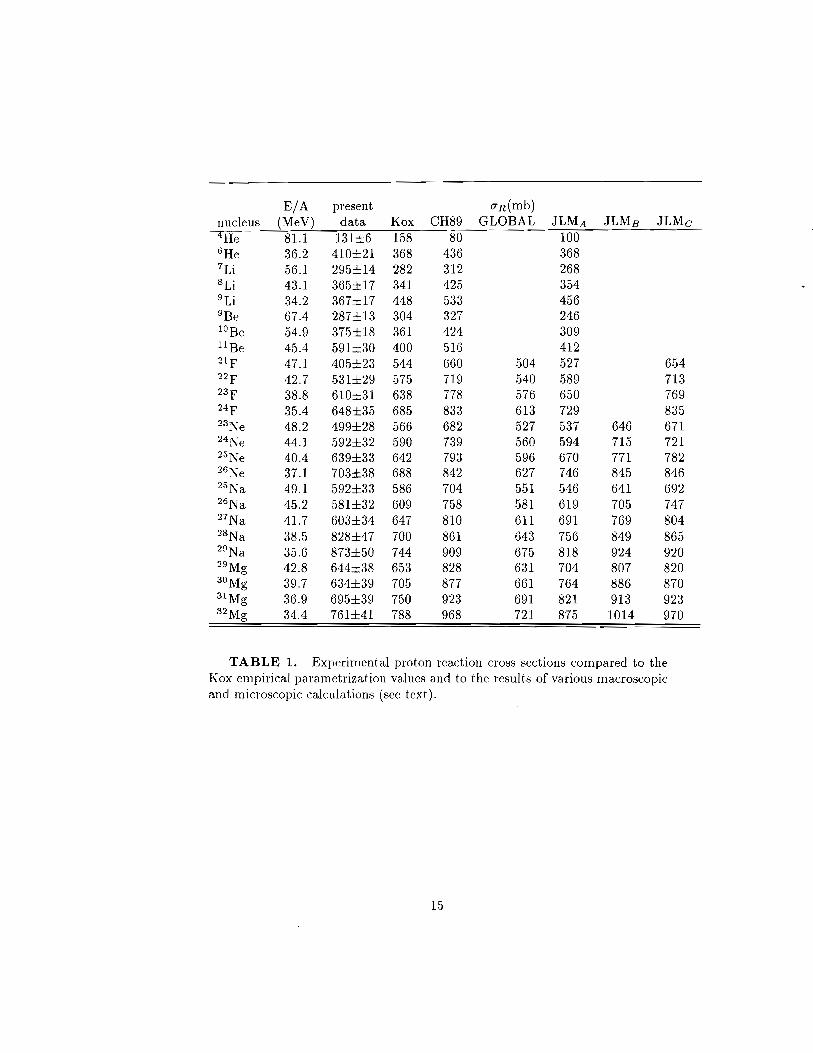
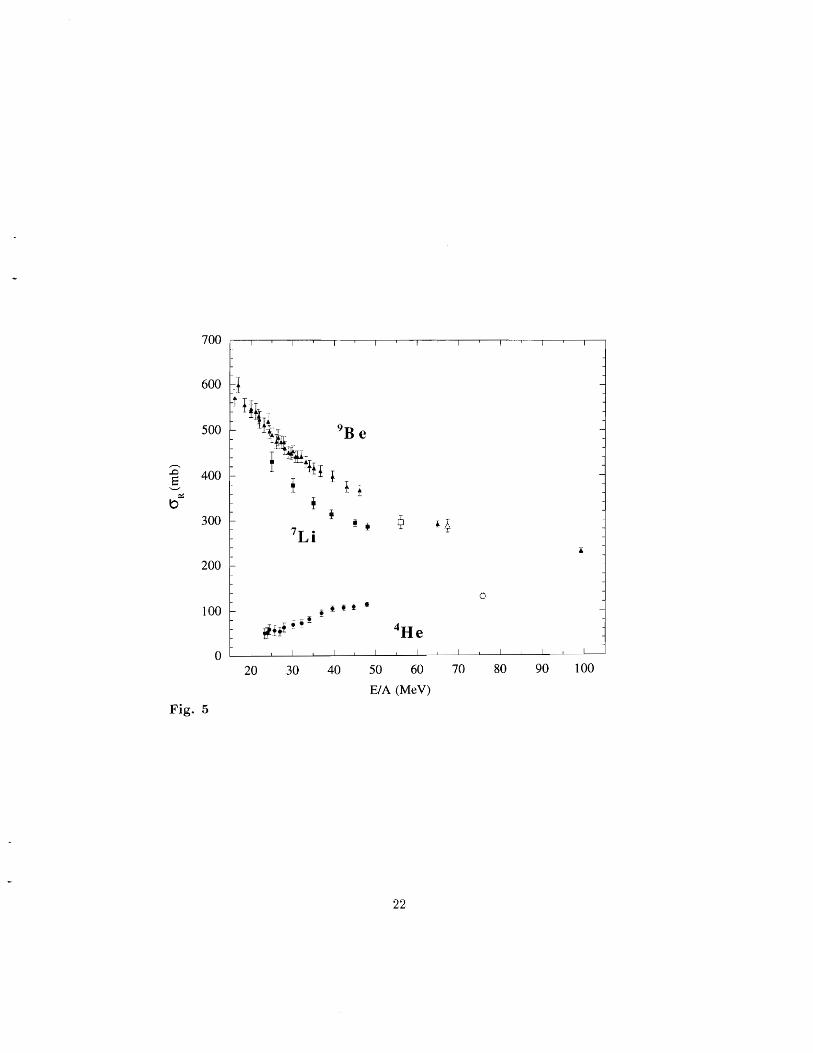
The obtained reaction cross section results, are summarized in Table 1 together with the predictions of the empirical formula of S. Kox et al. [28]. Former results for the stable nuclei measured in the present experiment exist only for energies either lower than 48 MeV or higher than 100 MeV [22] with the exception of a recent measurement for 9Be at 65MeV [29]. This result (O'R = 290.9±6.9 mb) is in very good agreement with our value. Existing measurements for the stable isotopes as a function of energy are shown in Fig. 5 together with the present measurements. Our results are compatible with the trend of the previous data, thus giving a further support to our experimental technique.
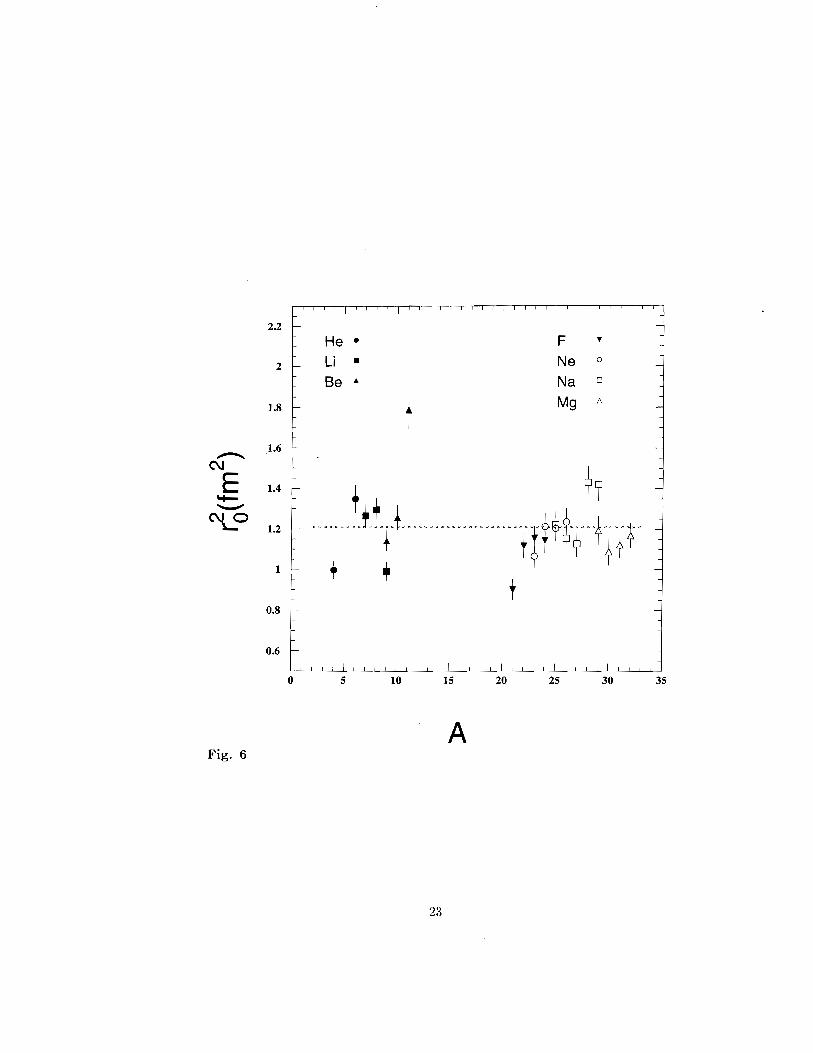
Our results are compared in Fig. 6 with the Kox values via the strong
4
absorption radius 1'20. The horizontal line in the figure corresponds to 1'2 0 = 1.2lfm2 , a value which was shown by Kox to hold for all the stable nuclei. Most of our values are consistent with this prediction. A lower 1'
20 value is deduced for the 4He, 9Li and 21 F isotopes. It should be noted that 4He is not a standard nucleus and that it is not completely surprising that its reaction cross section does not fall in the systematics. In particular the energy dependence of cross sections for p+4He, is opposite to the common behavior (see Fig. 5) due to the very high reaction threshold for 4He. A relatively small radius was also found in previous measurements at higher energies in the case of 9Li [1]. On the other hand the larger value of 1'2 0 obtained for 6He, 11 Be and 28, 29Na may reveal the unusual nature of these nuclei. Similar enhancements in the cross sections were also seen previously for 6He, 11 Be [2] and for the 28, 29Na nuclei [3, 4] and were attributed to the presence in these nuclei of a halo or neutron skin.
3 Analysis and discussion
3.1 Macroscopic calculations
Our results are first compared with the predictions of the optical model using macroscopic phenomelogical potentials CH89 [9] and GLOBAL [11, 12]. Optical model calculations were done with the code ECIS [30].
Varner et al. [9], have developed a phenomenological optical potential (CH89) which uses standard Woods-Saxon form factors for the potential, with the depth and geometry determined from a set of experimental data for stable nuclei. The potential includes effective central, surface and spin-orbit terms with energy and nuclear asymmetry dependent parameters which were obtained by fitting measured differential cross sections for proton and neutron elastic scattering on nuclei in the mass range A = 40-209 and for the energy range E = 1065 MeV. Recently this parametrization was also extended for proton elastic scattering off light stable nuclei, such as 7Li [18]. The present reaction cross section measurements provide a further test of this interaction potential for light exotic nuclei.
In the GLOBAL parametrization, the standard scalar-vector (SV) model of the Dirac phenomenology is used. The obtained parametrizations include energy and/or mass dependence for nuclei in the mass region A = 20-209 and in the energy region E = 21-1040MeV. The global potentials are available through the program GLOBAL [31], which provides the scalar and vector potentials as well as the Schrodinger equivalent central and spin orbit ones. This parametrization was used successfully previously by Ingermasson et al. [29] to describe a series of cross section measurements of 65 MeV protons on various targets from 9Be to 208Pb. The interpolation of the parametrization to targets such as Sn and Ni was successful. However the attempted extrapolation to 9Be was not satisfactory
5
[29]. Thus, we did not use this parametrization for the light isotopes He, Li and Be.
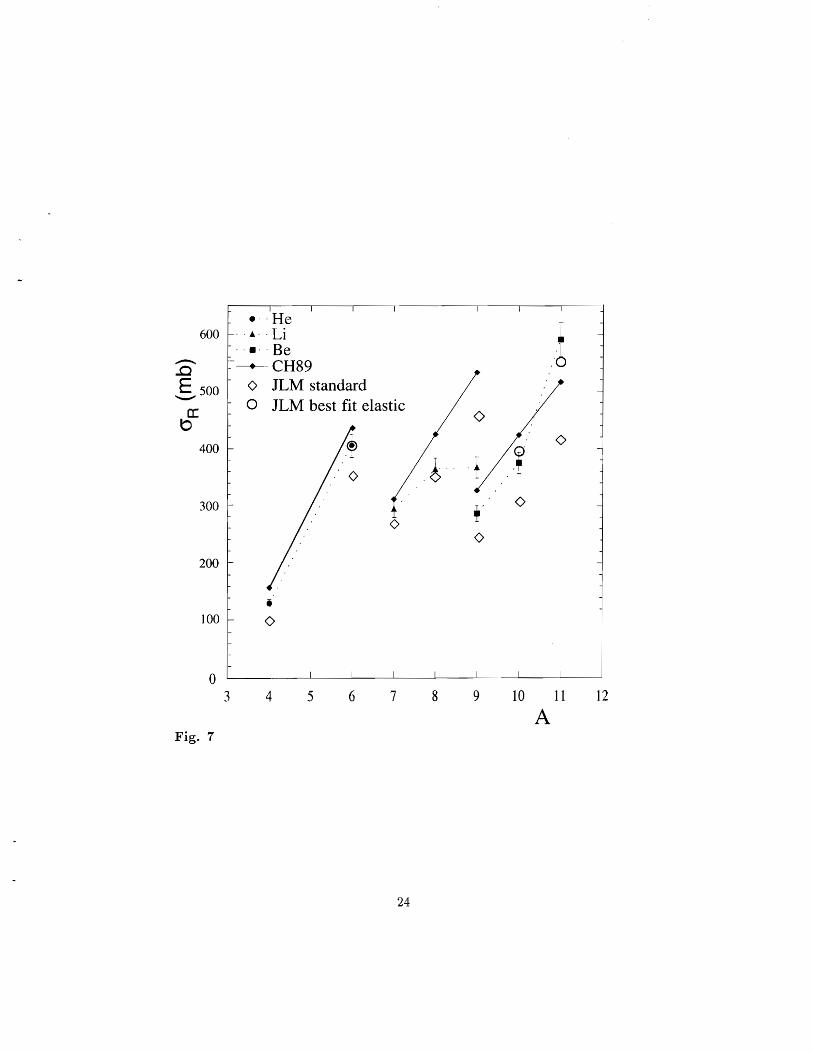
The predicted reaction cross sections with these two interactions are included in Table 1 and compared to the experimental results in Figs. 7 and 8, respectively. For the light nuclei (He, Li and Be), the reaction cross sections obtained with the CH89 parametrization consistently overestimates the experimental results, except for the halo nucleus 11 Be.
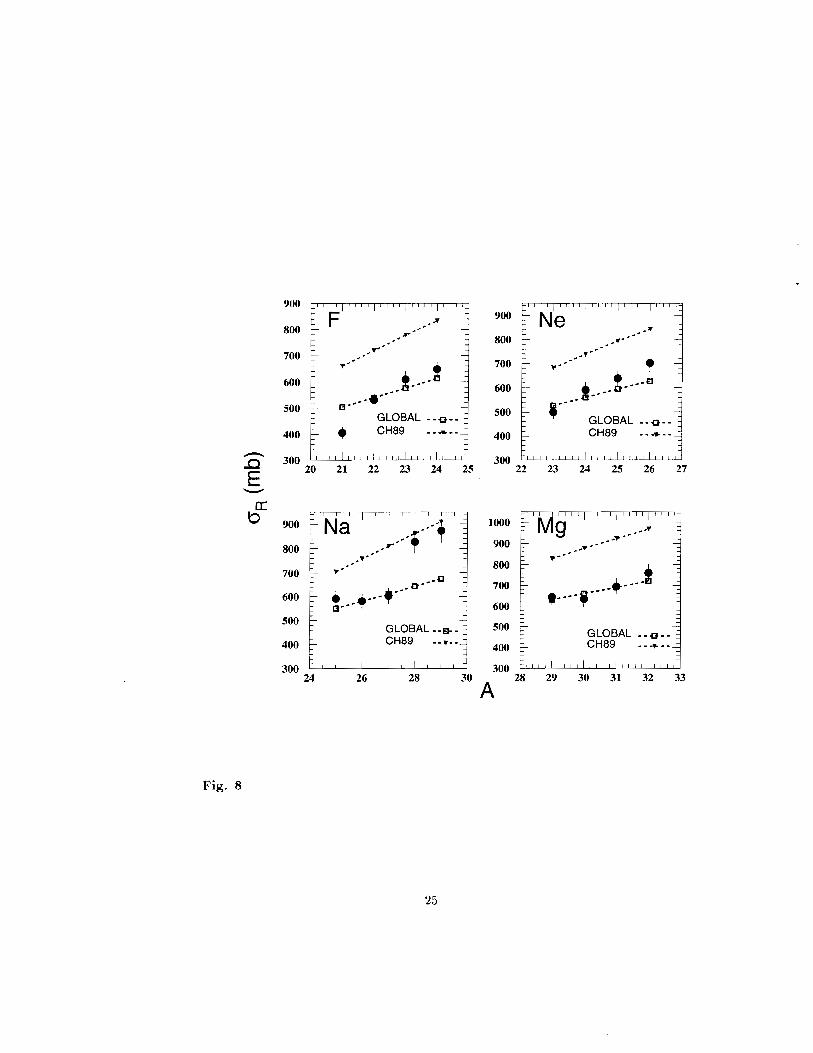
For the Fluor, Neon, Sodium and Magnesium isotopic chains, Fig. 8 shows that the isospin dependence of the CH89 parametrization is in very good agreement with our results; however the absolute values are systematically overestimated by 20 to 40%. It should be reminded that the domain of validity of this CH89 parametrization is restricted to mass 40 :::; A :::; 208. The present results show that, even if the results obtained for elastic scattering angular distribution were quite satisfactory for nuclei as light as 7Li, the extrapolation out of the mass range where the parametrization was established should be considered with extreme caution. Conversely, the reaction cross section values obtained with the GLOBAL parametrization present an isospin dependence which is somewhat too weak, especially for Fluor and Neon isotopic chains, but they are in very good overall agreement with the data, except in the case of the neutron skin nuclei 28, 29Na, for which the experimental values are strongly underestimated. We can conclude that the macroscopic GLOBAL description can be extrapolated to light neutron-rich nuclei with A ~ 20, except in the case of nuclei exhibiting special features such as neutron skins.
3.2 Microscopic calculations
Microscopic calculations were performed using the effective interaction derived from the nuclear matter calculation of Jeukenne, Lejeune and Mahaux (JLM) [7]. The starting point for computing the JLM potentials, is the BruecknerHartree-Fock approximation and the Reid hard core nucleon-nucleon interaction which provides, for energies up to 160 MeV, the energy and density dependence of the isoscalar, isovector and Coulomb components of the complex central optical potential in infinite matter.
The optical model potential of a finite nucleus is obtained in the local density approximation (LDA) by substituting the nuclear matter density with the density distribution of the nucleus. The improved LDA (ILDA) takes into account the finite range of the effective interaction by folding the potential obtained within the LDA approximation with a gaussian form factor, with a range t '" 1 fm. The JLM potential has been extensively studied previously [14, 15, 32, 33]. It has been particularly successful in describing elastic proton and neutron scattering [14, 1.5] as well as inelastic proton scattering, total reaction cross sections and (p,n) angular distributions for stable nuclei [32, 33].
6
We have performed several types of calculations within the above framework. Initially, the code provided by F. Dietrich [34] has been used, assuming real and imaginary normalization factors >"v = 1.0 and >"w = 0.8. These values were deduced from proton and neutron elastic scattering data on stable nuclei and will be referred to as the "standard values" in the following. An isovector adjustment wag also applied, >"isov = 1.4 and 2.5, for the unstable and stable nuclei, respectively, in agreement with the conclusions of [33]. We used the same normalization factors for both the real and imaginary isovector parts. An important input in these calculations is the density distribution of the nucleus of interest. Several density distributions have been used in the present analysis. For all stable isotopes, typical Fermi type densities were constructed by using electron scattering results [35]. For the exotic nuclei, we used Dirac HartreeBogoliubov (HB) density distributions [36]. The results are summarized in Table 1 (column JLM A ) and in Figs. 7 and 9.
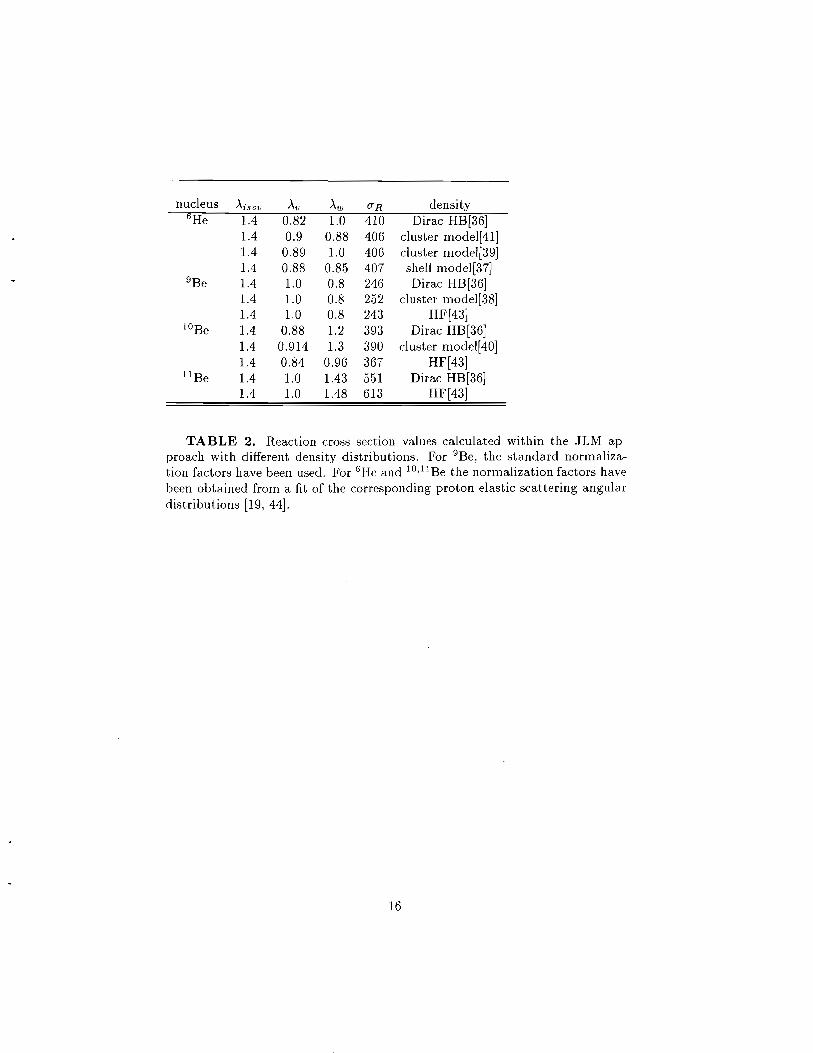
Table 2 also presents the results obtained for He and Be isotopes assuming different density distributions. For 6He, in addition to the Dirac HB density distribution of [36] we used density distributions obtained in the extended shell model approach of S. Karataglidis et al. [37J, and in the three body cluster models of K. Arai et al. [38, 39, 40] and of the Surrey group [41J. A complete picture of this nucleus was given before [42] through a simultaneous study of elastic (p,p) scattering, (p,n) exchange reaction and the present reaction cross section. The "best fit" normalization factors for the potential, compatible with all three sets of data, are given in Table 2 together with the calculated cross sections.
For the 9,lOBe nuclei, Hartree-Fock (HF) densities developed by H. Sagawa et al. [43] together with microscopic cluster densities from K. Arai et al. [38, 39, 40], were also used. In the case of 11 Be, only the HF density was available. For the 9Be nucleus a standard potential was assumed, while for the lO,l1Be nuclei the potential was extracted from previous elastic (p,p) scattering data [44]. The adopted potentials for the best description of both reaction cross sections and elastic scattering data are given in Table 2. The general trend observed for 6He and the Be isotopes is that the imaginary part of the potential has to be increased in order to reproduce the reaction cross section values, while the real part should be, at most, slightly reduced.
In the case of the nuclei with Z ~ 9, we used the microscopic potential calculated within the JLM approach, but including the recent modifications of E. Bauge et al. [45, 46]. These modifications are related to the validity domain, which could be extended up to 200 MeV, to the treatment of the LDA, and to the spin-orbit term. The initial JLM potential included the spin-orbit term of the M3Y interaction [47], with only a real part and for which the results became less and less satisfactory above 65 MeV. Different prescriptions were tested [48, 49, 50], and the Scheerbaum model yielded the best results for a
7
large data set. In this model the spin orbit term is written in the form
1 d 2 1 Us 0 '" - - ( - Pn + - P ) (2)r dr 3 3 p
which favors the density tail in the optical potential. The validity of this modified JLM optical potential is a priori limited to
nuclei with mass A :2: 40. By fitting a large set of data in the mass range 40 :2: A :2: 209, the normalization factors were adjusted and, for proton energies near 45 MeV, the obtained parameterization gives values of Av = 0.98 for the isoscalar real part, Aw = 1.15 for the isoscalar imaginary part and AVl = 1.5 and Awl = 1.2 for the real and imaginary isovector parts, respectively (see (6) of [46J for a more complete description of these parameters).
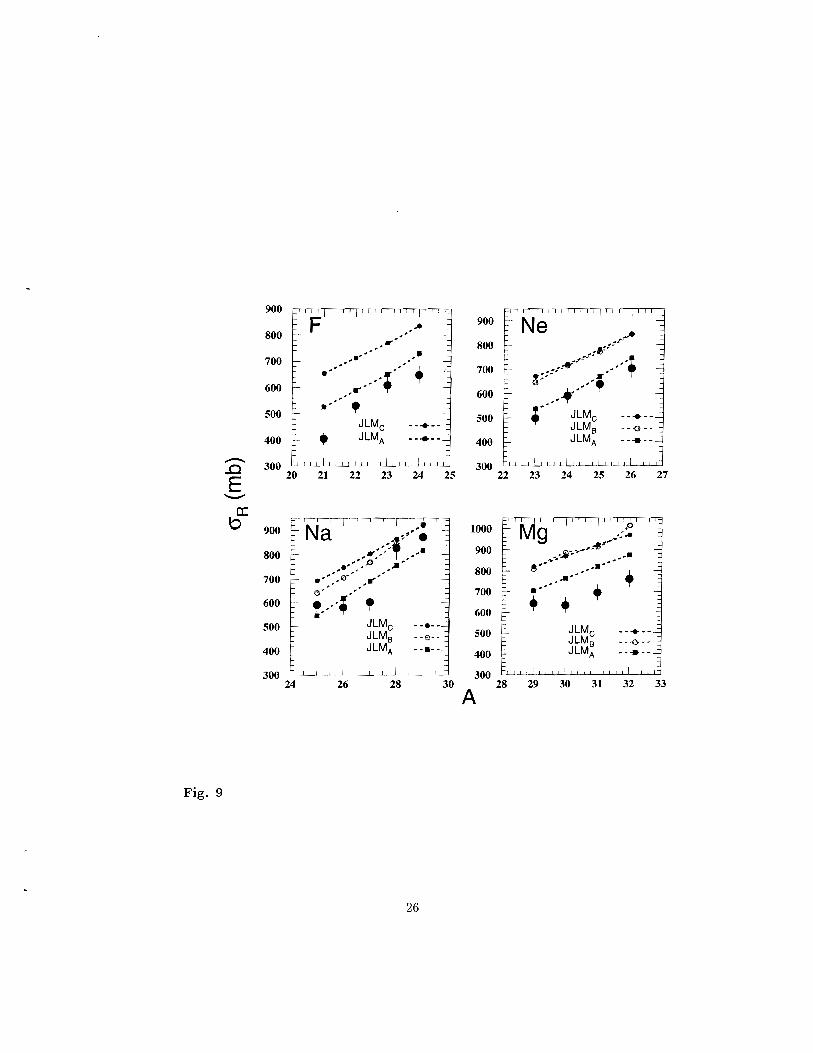
The reaction cross sections for nuclei with 9 ::; Z ::; 12 were calculated within the above approach and with two types of density distributions: HF + BCS density distributions calculated with the density functional of Beiner and Lombard [51], and HFB densities [52] based on the density dependent and finite range DIS Gogny force [53]. The results are displayed in Table 1 (column JLMc and JLMB, respectively) and with dots in Fig. 9 (open and closed dots, respectively). The reaction cross sections calculated with both sets of density distributions are very close to each other, but they exceed the experimental values by roughly 25% on average. It should be reminded that these calculations were performed with an imaginary potential normalization factor Aw ~ 1.15, compatible with the best fit value found by fitting a very complete data set on elastic scattering differential cross sections, analyzing powers and reaction cross sections for nuclei in the mass range A = 40-209 [45, 46], much larger than the standard value Aw = 0.8 adopted previously for lighter nuclei [14, 15]. Note that in [46] errors bars of the order of 10% are assigned to the normalization factor for the imaginary part of the potential, allowing for a better, yet not satisfactory, agreement between data and predictions. In order to account for the remaining differences between the standard normalizations and those of [46], the increasing role of non-locality or dynamical effects with lower masses has been invoked [54J : for heavy nuclei these effects mostly average out whereas for light nuclei they become important. The same calculations, repeated with the standard normalization factor Aw = 0.8, were in close agreement with our data. The standard normalization factor can thus be understood as a factor that includes specific non-locality or dynamical corrections for light nuclei.
The influence of the deformation was also studied with the HFB density distributions. In the case of even-even nuclei, the reaction cross sections were calculated assuming four different prescriptions: i) a spherical ((3 = 0) density distribution used in a spherical optical model framework (SOM), ii) the monopole part of an axially deformed density distribution, in the SOM framework, iii) axially deformed density distribution in a coupled-channel framework (CC) coupling the ground state of the considered nucleus with its first excited state in a rotational model, and iv) the fully dynamically calculated density
8
4
distribution [55, 56] also using CC. For non even-even nuclei, the last type of calculation could not be performed. In the case of CC calculations the normalization of the imaginary part of the potential was readjusted by an additional factor 0.85 to avoid double counting of the inelastic channels explicitely taken into account [57]. The values reported in Table 1 and Figure 9 correspond to the CC calculations, fully dynamical (iv) in the case of even-even nuclei or axially deformed (iii) in the other cases. The dynamical calculations (iv) which make no asumption concerning the reaction model, give approximatively the same results (within 1%) as the CC calculations with the axially deformed densities (iii) showing that the reaction model has a limited role in calculations of the reaction cross-section at the projectile energies investigated here. The effect of the deformation on the reaction cross section values is larger but still rather weak: it increases the values by at most 5%, even for deformation parameters as large as j3 = 0.46 in the case of 32Mg. This effect is mostly due to the increase of the root mean square radii of the densities with increasing deformations since the difference between reaction cross-sections calculated using either the monopole part of axially deformed densities in SaM (ii), or the full axially deformed densities in CC (iii) is only of the order of 1%.
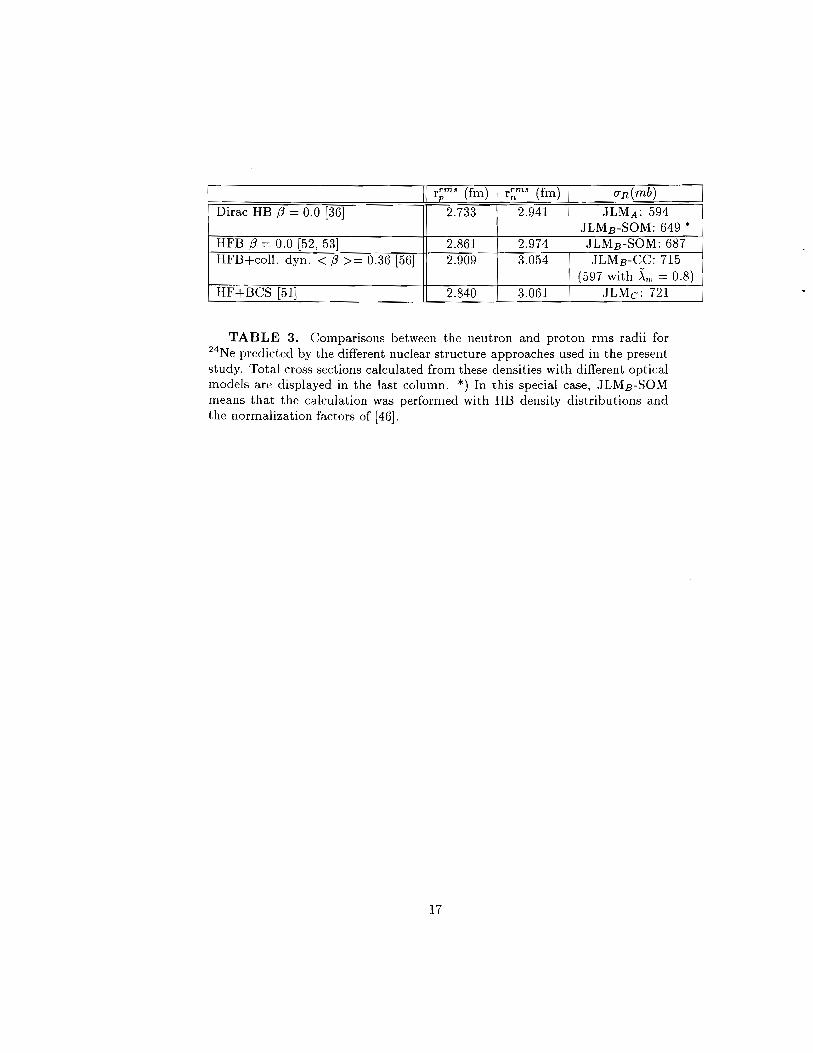
The leading role of the rms radii in reaction cross section calculations motivates the comparison between the rms radii predicted by the different nuclear structure models considered in the present paper. Table 3 displays such a comparison in the case of 24Ne. This table helps to disentangle the effect of nuclear rms radii and of the imaginary normalization factor on the calculated reaction cross section. First let us note that the Dirac HB calculation predicts significantly lower rms radii than the other calculations (HFB, HFB+collective dynamics, HF+BCS). These lower rms radii translate into lower reaction cross sections when put into a microscopic optical model calculation as illustrated by the comparison between JLMB-SOM results obtained using either Dirac HB or spherical HFB densities. Thus, the rms radii differences between Dirac HB and HFB lead to reaction cross section predictions that differ by about 6%. Conversely, the influence of the imaginary norm.?-lization Aw is illustrated by looking at JLMB-CC calculations performed using Aw 3= 1.15 (standard for JLMB calculations) and ,\W = 0.8 (standard value for light nuclei). The effect of ,\W on erR is dramatic showing that the Aw values valid for heavier (A > 40) nuclei should be used with increasing caution when A significantly decreases below 40.
SUll1111ary and conclusions
The proton reaction cross sections have been measured in inverse kinematics for stable and neutron rich nuclei in the mass range A = 4-32 on proton. The
3,\w is the normalization before applying the 0.85 correction factor for CC calculations, thus -\w = 0.855.. w
9
---
target was made of liquid hydrogen, and was used for the first time in this experiment. For the stable nuclei 4He, 7Li and 9Be, only one single data point existed previously for 9Be in the energy range between 48 and 100 MeV. The experimental values obtained in the present work therefore fill this gap and are in good agreement with the general trend observed at lower and higher energy. The first measurement of the reaction cross section on a proton target in this energy range was also obtained for the halo nuclei 6He and 11 Be. The value measured for 6He can be reproduced within the JLM approach with normalization factors very close to the standard values for the isoscalar part of the potential, provided that a normalization of 1.4 was applied to the isovector part, thus confirming the weakness of the isovector potential in the JLM approach [33, 46, 58]. It should be noted that a simultaneous analysis of elastic scattering and charge exchange angular distributions with the present reaction cross section data for 6He showed that the three data sets could be adequately reproduced with these normalization factors [42]. A significant increase of the imaginary part of the potential was necessary in order to reproduce the p+11 Be reaction cross section.
For the heavier nuclei studied in the present work, the values calculated with the CHS9 parametrization of the optical potential systematically overestimated the data by 20 to 40 %, while the GLOBAL parametrization yielded very satisfactory results. Two types of calculations were performed within the JLM approach. The results obtained within the original approach with standard normalization factors were in rather good overall agreement with the data, while the values obtained within the modified approach significantly overestimated the experimental results, due to the larger strength of the imaginary potential. It should be mentioned that the modified JLM approach produced results in much better agreement with the present data when the imaginary normalization factor .Aw = 0.8 was used. This result is an indication that the imaginary potential deduced from data for nuclei in the mass range A 2: 40 cannot be directly extrapolated to the lighter nuclei considered in the present work. This may be due to non-local or dynamical effects, as well as unappropriate local density approximation. One can speculate that a more sophisticated type of LDA might be more relevant in the case of lighter nuclei, like for example the gradient-based LDAs described in [59] in the context of atomic and molecular physics.
Finally, the large body of information collected in this work highlights the usefulness of reaction cross section measurements in assessing the relative merits of different structure and reaction models, beyond what can be inferred from elastic and inelastic scattering.
References
[1] I. Tanihata et al., Phys. Rev. Lett 55 (985) 2676
10
[2] I. Tanihata et al., Phys. Lett. B206 (1988) 592 . •~_.-._--~-_...._---...._-..-._
[3] T. Suzuki et al., Phys. Rev. Lett. 75 (1995) 3241. ......... _.._..__. ,-, ... "_......,.... ,_ .•. ,.~ ..~ ."-,',, -"~- ~.,,,,,~ ..• _..,.,.,,. -, -.
[4] T. Suzuki et al., Nucl. ~~~y~.AQ.3Q ..cH198JBBL ...
[5] A. M. Sawkes et al., Phys. Rev. G13(19_I6).~!5.L....
[6] M. C. Mermaz, ~~~s:..~~:.g,,~0.O.~~Jl~92.Q .. '"
[7] J.P. Jeukenne, A. Lejeune and C. Mahaux, Phys. Rev. g~J!LU977} 80.__
[8] F .A. Brieva and J .R. Rook, ~~.~I_.J:~hy§.: A. 307 (18T8L4~3.
[9] R.L. Varner et al., Phys. Rep. 201 Jt~.~1)51. '• ....".,.".-<'i•. ..• '.~ .. -' •.,._" ..,,",..... ~-..' '''~.~' ~
[10]� F.D. Becchetti and G.W. Greenlees, J:l.hys:.R~Y,.J82 (1969.}119.Q
[11]� E.D. Cooper et al., Phys. Rev. C 47 (1993) ~97.
[12]� S. Hama et al., Phys. Rev. C 41 (1990) 2737.
[13]� F. Petrovich et al., Nucl. Phys. A 56~ (1993) 387.
[14]� J.S. Petler et al., Phys. Rev. C 32 (19.85)673.
[15]� S. Mellema et al., Phys. Rev. C 28 (1983) 2267.
[16]� F. S. Dietrich et al., Phys. Rev. Lett 51 (1983) 2267.
[17]� G. R. Satehler and W.G. Love, Phys. Rep 55 (1979) 184.
[18]� M. D. Cortina-Gil et al., Phys. Lett B 401(1997) 9.
[19]� F. Auger et al., contribution to the Conference proceedings, ENPE 99 Seville - Spain, 21-26June 1999 and A. Lagoyannis et al., to be published.
[20]� A. A. Korsheninnikov et al., Phys.:...Let.t....lt31J:L.(1993) 38.
[21]� A. A. Korsheninnikov et al., Nucl. Phys. A 617 (1997) 45.
[22]� R. F. Carlson, Atomic Data and Nuclear Data Tables 63 (1996) 93. - .. _---- -
[23]� R. Anne et al., Nuel. Inst. Meth. A 257 (l98§)}15..
[24]� R. F. Carlson et al.,.}\Iucl. Inst. Meth. 123 (1975)50~.
[25]� O.H. Odland et al., Nucl. Inst.Meth. A 378 (1996) 149.
[26]� R.L. Cowin et al., NllcLln:'3t.Meth. A 423 (1999) 75;
[27]� J-F. Libin and P. Gangnant, Rapport interne Ganil Aires 01-97.
11
[28]� S. Kox et al., Phys. Rev. C 35 (1987) 1678. ---...._--,----_.- --
[29]� A. Ingemarsson et al., llucl. Phys. A 653 (1999) 341. '.' ~--_.~......~.-. --_._~.-~ ..,~ .. ,
[30]� J. Raynal, Phys. Re:.:.g.~?jl?-~ll.~_5!.L... . .~_., ",'. '
[31]� Program GLOBAL written by S. Hama and can be obtained by B.C. Clark at [email protected]. The code is also available from anonymous ftp at pacific.mps..ohio-state.edu /tmp/global/
[32J� N. Alamanos et al., Nue!. Phys. A660 (1999) 406.t"" . --~--" .,
[33J A. Pakou et al., to be published in Nucl. Phys.�
[34J F. S. Dietrich, private communication�
[35J H. De Vries et al., Atomic and Nu~.I~_~rJ!ata.Tables36 (1987) 495.� '";---- ~.,... _.,,.,, ---� .... - .~. -..... "._. .
[36]� B.V. Carlson and D. Hirata, PhY~LReY. C62 (2000) 0543.10.
[37]� S. Karataglidis et al., Phys .. Rev.CJiljlQQQL024319.
[38]� K. Arai et al., Phys. Rev'.G.!H.ug96J.1?2. ~-_ . '....•..-._ ..,.
[39]� K. Arai et al., Phy'~:.Rev .. ~_9 (1999) 1432.
[40] K. Arai et al., Nucl. Phys. 673(2000) 122.�
[41J J. S. AI-Khalili and J. A. Tostevin Phys. R~v. C 57 .(199§))~46:.
[42]� A. de Vismes et al., Phys. Lett. B505 (2001) 15; and PhD Thesis, University of Caen, France 2000.
[43J� H. Sagawa, Phys. Lett B 286 (1992LZ.:-_._._ '_"_
[44]� V. Lapoux, PhD Thesis, Orsay University 1998.
[45]� E. Bauge, J.P. Delaroche, M. Girod, ehys~.Re.y..G.:i8.. (l9.9.8)....lll8.__~_,
[46]� E. Bauge, J.P. Delaroche, M.Girod , Phys. Rev. C 63, (2001) 024607.
[47]� G.F. Bertsch et al., Nuc!. Phys. A 2.~10~77.n~9.. --- ,".' ---~. ,"-- ." ..-_. --_.
[48]� Ch. Lagrange and J. C Brient,J·Xh.Y13.(.E'a.ris) 44 (J9_83L._. ._
[49]� R. R Scheerbaum et al., Nucl. Ph~:.A.)Q7D976)77. --~_.-'
[50J c. B. Dover and N. Van Giai, Nucl. .fJhys. A 190(1972) 373.
[51J M. Beiner and R.J. Lombard, Ann. ~1~~s...:,(!:':!.:Y:La6 (l974) 262.
12
[52]� J. Decharge and D. Gogny, Phys. Rev: C 21 (~~_~.Ql}568. J. Decharge, 1. Sips and D. Gogny, ~98·lT98]J=ii~1,_.J. DeCharge and L. Sips, Nucl. Phys. A 407(1983) L ---.--,~-_ .. '~.
[53]� J.-F. Berger, M. Girod and D. Gogny, Comput.Pllys:Colunl11n: 63 (1999)365 (tnd references therein. --,_... ,- .. - --... - _. ...--,-----.. "-~ ---_.,..;;..-
[54]� F. Petrovich et al.-\J.).hY§~Ji~.~t,2.QIB.(HL88.)..1;_C. Mahaux, in A1icroscopic Optical Potentials, Proceedings of the Hamburg 1978 Conference, Lectur~~
Notes i~£hl'~i~~Y~1.~.9(~pr.~!1~r.:YeE~~.2...~erlin1979) p. 1.
[55]� F. Marcchal et al., Phys. Rev. C 60,(1999) 034615; H.Scheit et al. , Phys. Rev. C 63, (2.Q9DOJJ2Q4.----._.,-,... ,.,•.._._ ...
[56]� J. Libert, M.Girod, J.P. Delaroche,E~y!... g~~.:..S~,6gJl~99) 05430L
[57]� JE. Bauge, J.P. Delaroche, M.Girod , Proceedings of INPCj9S, Edited by B.Frois, D.Goutte, D.Guillemaud-Mueller, NJJ.£J..:.J~..hs:~~ A._Q.Q.:LLt~~9J~~JS'
E. Bauge et al., Phy~~~~.£.?l (2000) 034306.
[58]� F. S. Dietrich and F. Petrovich, in Proc. of Neutron-Nucleus Collisions-A Probe of Nuclear Structure, eds J. Rapaport, ,AlP ConferencePrQcee.ding~,
.!!-<2._124.~.AIPr New York ,·1g85-}·p.·gO',···
[59]� R.F. Parr, and W. Yang, in Density functional theory of atoms and molecules, Oxford University Press, 1989; R.M. Dreizler and E.K.U. Gross in Density functional the01'Y: an appmach to the quantum many body pmblem, Springer-Verlag, Berlin, 1990.
13
FIGURE CAPTIONS
Fig. 1. Schematic representation of the experimental set-up in the reaction chamber.
Fig. 2. Front view of the cryogenic hydrogen target. Fig. 3. ~E-E matrix for lOBe with the 1 em thick hydrogen target. Fig. 4. ~E-E matrix for lOBe with the empty target. Fig. 5. Previous cross section measurements (closed symbols) for the stable
isotopes 4He, 7Li and 9Be as functions of energy, displayed together with the present measurements (open symbols).
Fig. 6. Square of the strong absorption radii 1'02 deduced from the present reaction cross section derived from the Kox parametrization of the reaction cross section.
Fig. 7. Experimental reaction cross sections for He, Li and Be isotopes compared to calculated values obtained with the CHS9 optical potential (closed diamonds) and with the JLM approach using Dirac HB density distributions. The open diamonds correspond to standard normalization factors for both real and imaginary potentials (Av = 1.0, Aw =0.8), while the open circles correspond to the normalization factors obtained from the best fits to the elastic scattering angular distributions in the case of 6He and 10,llBe (see Table 2).
Fig. 8. Experimental reaction cross sections for F, Ne, Na and Mg isotopes compared to calculated values obtained with the CH89 and GLOBAL optical potentials.
Fig. 9. Experimental reaction cross sections for F, Ne, Na and Mg isotopes compared to calculated values obtained within the JLM approach using different density distributions (see text for the definition of subscripts a,b,c).
14
E/A present O"R(mb) nucleus (MeV) data Kox CH89 GLOBAL JLM A JLMB JLMc 4He 81.1 131±6 158 80 100 6He 36.2 410±21 368 436 368 7Li 56.1 295±14 282 312 268 8Li 43.1 365±17 341 425 354 9Li 34.2 367±17 448 533 456 9Be 67.4 287±13 304 327 246 lOBe 54.9 37.5±18 361 424 309 11Be 45.4 591±30 400 516 412 21 F 47.1 405±23 544 660 .504 527 654 22F 42.7 531±29 575 719 540 589 713 23F 38.8 610±31 638 778 576 650 769 24F 35.4 648±35 685 833 613 729 835 23Ne 48.2 499±28 566 682 527 537 646 671 24Ne 44.1 592±32 590 739 560 594 715 721 25Ne 40.4 639±33 642 793 596 670 771 782 26Ne 37.1 703±38 688 842 627 746 845 846 25Na 49.1 592±33 586 704 551 546 641 692 26Na 45.2 581±32 609 758 581 619 705 747 27Na 41.7 603±34 647 810 611 691 769 804 28 Na 38.5 828±47 700 861 643 756 849 865 29Na 35.6 873±50 744 909 675 818 924 920 29Mg 42.8 644±38 653 828 631 704 807 820 30Mg 39.7 634±39 705 877 661 764 886 870 3lMg 36.9 695±39 750 923 691 821 913 923 32Mg 34.4 761±41 788 968 721 875 1014 970
TABLE 1. Experimental proton reaction cross sections compared to the Kox empirical parametrization values and to the results of various macroscopic and microscopic calculations (see text).
15
nucleus Aisov Av Aw (J"R density� 6He 1.4 0.82 1.0 410 Dirac HB[36]�
1.4 0.9 0.88 406 cluster model[41] 1.4 0.89 1.0 406 cluster model[39] 1.4 0.88 0.8.5 407 shell model[37]�
9Be 1.4 1.0 0.8 246 Dirac HB[36]� 1.4 1.0 0.8 252 cluster model[38] 1.4 1.0 0.8 243 HF[43]�
lOBe 1.4 0.88 1.2 393 Dirac HB [36]� 1.4 0.914 1.3 390 cluster model[40] 1.4 0.84 0.96 367 HF[43]�
11 Be 1.4 1.0 1.43 551 Dirac HB[36]� 1.4 1.0 1.48 613 HF[43]
TABLE 2. Reaction cross section values calculated within the JLM approach with different density distributions. For 9Be, the standard normalization factors have been used. For 6He and 10,llBe the normalization factors have been obtained from a fit of the corresponding proton elastic scattering angular distributions [19, 44].
16
(fm) I (fm) I� Dirac HB f3 = 0.0 [36] 2.733 2.941 JLM A : 594�
JLMB-SOM: 649 *� HFB f3 = 0.0 [52, 53] 2.861 2.974 JLMB-SOM: 687� HFB+coll. dyn. < f3 >= 0.36 [56] 2.909 3.054 JLMB-CC: 715�
(597 with .\W = 0.8)� HF+BCS [51] 2.840 3.061 JLMc: 721�
TABLE 3. Comparisons between the neutron and proton rms radii for 24Ne predicted by the different nuclear structure approaches used in the present study. Total cross sections calculated from these densities with different optical models are displayed in the last column. *) In this special case, JLMB-SOM means that the calculation was performed with HB density distributions and the normalization factors of [46].
17
I':rj ~.
~
liquidhydrogen
targetBeam
.....Cf:)
"0 o 0
0 I
,o;~C>
C> oWj0,
cryogeniclieaa
Fig. 2�
19�
_350 ~ ~
~ '-'-
140
~ ,- 300 ~
~ +-(i3 ~250 <]
(p,d)9Be elastic
120
100
" . I.
200 "
lOBe residual nuclei 80
60
150
40
100 :
Li 20
2a ' "
50 0 500 1000 1500 2000 2500 3000 3500
0
Fig, 3
E(CsI) (a.u.)
20�
-350;;> ~
~ '-'-
140
~ ~ 300 '-'
~ +-~ '-' ~ 250
120
100
200
: .. ",' .
~
I - I
", 80
60
150
40
100 20
50 .I !
o 500 1000 I I !
1500 ! I I !
2000 I I I I I
2500 I I I 1
3000 3500 4000 o·
Fig. 4
E(CsI) (a.o.)
21
700 I I l
600
ItIn T
500 iI·...I- "C-" T
~i1t
I I I I I I
-
-9B e
-- 400 !'~-~t.tI.J::J g l-
! T t
t • t)
:l::
! ,300 , , ¢I-
~ 0
7Li •
-I200
0 f t • I
_ ... i�100 • t
,!~ !! 4He I I I I
I0 I I I I
20 30 40 50 60 70 80 90 100
E/A (MeV)
Fig. 5
22
I
2.2
2
1.8
He Li Be
• • A
t
F Ne Na
Mg
" 0
0
f:"
~
C\I
E '+'-"""
"t...0
1.4
1.2
1
0.8
0.6
30
Fig. 6 A
23�
600
..-.
..c E 500
"'-""
a: b
400
..•. ·Hc
. '.' 'Li ,'.', Be ---+-- CH89
0 JLM standard 0 JLM best fit elastic
!
0
'. G.!
f,'0
0
300 0 !'
0
0
200
100 -.. 0
o 3
Fig. 7
4 5 6 7 8 9 10 11
A 12
24
900
800 F :t" ~~
~., 900 Ne
~" , ~
~~ 800 ~ Jf~
..-..
.0 E
700
600
500
400
300 20
, ... y'"
"' ........ t .."!. ... -......
13 -GLOBAL --0-
• CH89 --.... -
21 22 23 24 25
700
600
500
400
300 22
'f~'"
+......
",'" '
t ...... _-t----£J,--_ ... GLOBAL --0-CH89 ---.,.-
23 24 25 26 27
'-"
a:: b 900
800
700
600
Na ··'r"... ~
" ,'f'
" ",'
O ... -D
t-~ ... , ... ... ·-~'"
1000
900
800
700
600
, _.' ~~-'" ~ ...
• _--I.--,--- -500
400 t300 24
I I I
26 I
GLOBAL - -8-CH89 --.-I I I I I I oj
28 30
500
400
300 28 29
GLOBAL CH89
30 31
- 0 ----.,.-
32 33
A
Fig. 8
25�
900
..-...
.0 E--
800
700
600
500
400
300 20
F ... .. ' , ,,".. ' •,,,,, ... ,,,, .. .. ' .,
+.'
, .... ',.; ..
..... ' . JLMc ..•..
• JLMA .....-
21 22 23 24 2S
900
800
700
600
500
400
300 22
Ne ,~
,e:f~
"f~' ';,:"4t' .....
.';' "o' ..., .. , .... ,"," JLMC• ..• --
JLMs ..{)-
JLMA ......
23 24 25 26 27
a: b 900
800
Na ';, ...: ....~~~1~.
1000
900 .. 700
600
500
400
..... ',.0 .... ' ....... :0" .........' 0'" , .. ,,,
......'; +• JLMC
JLMs JLMA
..•.. - -0-..•..
800
700
600
500
400
.,,, •• + JLMcJLMs ~ILMA
+
300 300 24 26 28 30 28 29 30 31 32 33
A
Fig. 9
26�


![Podstawy Procesów i Konstrukcji Inżynierskichbiofizyka.p.lodz.pl/prezentacje/w9i10_s.pdf · 2013. 6. 6. · Fizyka jądrowa Budowa jądra atomowego Masa [10-30 kg] elektron proton](https://static.fdocuments.pl/doc/165x107/60c9d5d183957b50565e8dcd/podstawy-procesw-i-konstrukcji-inynierskichbiofizykaplodzplprezentacjew9i10spdf.jpg)