Petra Stanat Katrin Böhme Stefan Schipolowski Nicole Haag … › bt › bt › BT2015 › Bericht...
32
WAXMANN Petra Stanat Katrin Böhme Stefan Schipolowski Nicole Haag (Eds.) IQB Trends in Student Achievement 2015 The Second National Assessment of Language Proficiency at the End of the Ninth Grade Summary With the assistance of: Felicitas Federlein, Lars Hoffmann, Daniela Holm, Susanne Hunger, Friederike Keiderling, Ricarda Klein, Katharina Krohmer, Poldi Kuhl, Mischa Mangel, Felix Milles, Hans Anand Pant, Dirk Richter, Camilla Rjosk, Karoline A. Sachse, Susanne Sebald, Maike Wäckerle, and Sebastian Weirich Translated from German by Deborah Anne Bowen
Transcript of Petra Stanat Katrin Böhme Stefan Schipolowski Nicole Haag … › bt › bt › BT2015 › Bericht...
W A X M A N N
Petra Stanat Katrin Böhme
Stefan Schipolowski Nicole Haag
(Eds.)
IQB Trends in Student Achievement 2015The Second National Assessment of Language Proficiency at the End of the Ninth Grade
SummaryWith the assistance of:Felicitas Federlein, Lars Hoffmann, Daniela Holm, Susanne Hunger, Friederike Keiderling, Ricarda Klein, Katharina Krohmer, Poldi Kuhl, Mischa Mangel, Felix Milles, Hans Anand Pant, Dirk Richter, Camilla Rjosk, Karoline A. Sachse, Susanne Sebald, Maike Wäckerle, and Sebastian Weirich
Translated from German by Deborah Anne Bowen

In 2003 and 2004, the Standing Conference of the Ministers of Education and Cultural Affairs of the States in the Federal Republic of Germany (KMK) intro-duced educational standards for the primary level and for secondary level I de-tailing which competencies students are expected to have attained by the time they reach specifi c points in their school career. The focus of these standards was on the subjects of German and mathematics (primary level, secondary level I), the foreign languages of English and French (secondary level I), and the natu-ral sciences (secondary level I) (KMK, 2004a-c, 2005a-h). In accordance with the Standing Conference’s (KMK, 2006, 2015) long-term strategy for educational monitoring in Germany, the 16 federal states (Länder) also decided to implement regular studies assessing the extent to which educational standards are being met at the state level. The Institute for Educational Quality Improvement (IQB) at the Humboldt-Universität zu Berlin is responsible for conducting these assess-ments. The fi rst cycle of surveys in the IQB’s standards-based national assess-ments was completed with studies of 2009 (secondary level I: German, English, French), 2011 (primary level: German, mathematics), and 2012 (secondary level I: mathematics, biology, chemistry, and physics) (Köller, Knigge & Tesch, 2010; Stanat, Pant, Böhme & Richter, 2012; Pant, Stanat, Schroeders, Roppelt, Siegle & Pöhlmann, 2013). The study conducted in 2015, whose results are summarized in the following, marks the beginning of the second cycle. The fi ndings reported here now make it possible, for the fi rst time, to analyze changes in the attainment of educational standards over time. To underscore the importance of trend analy-sis in educational monitoring, all IQB studies from 2015 on will be called “IQB Trends in Student Achievement” (IQB-Bildungstrend).
With the 2015 IQB trend report, student profi ciency in German, English, and—in six states—in French was measured for the second time based on the na-tional educational standards set by the Standing Conference for the end of sec-ondary level I. This provides the basis, fi rst, to describe student profi ciency levels at the end of the ninth grade in 2015. Second, it allows us to analyze changes over time in the domains tested since the fi rst IQB National Assessment Study in 2009. Repeated measurement of these competencies at six-year intervals has sig-nifi cantly broadened the range of analyses possible with the IQB data, and has thus also considerably expanded the informational content of the results relative to past IQB National Assessment Studies.
The test items used in the 2015 IQB Trends in Student Achievement were de-veloped by teachers in close consultation with experts in subject didactics. Their work was based on the educational standards of the Standing Conference and was conducted under the oversight of the IQB. The 2015 IQB study surveyed students’ profi ciency levels in German in the domains of reading, listening, and
IQB Trends in Student Achievement 2015
4 IQB Analysis of Student Achievement 2015 – Summary
orthography, and in the subjects of English and French in the domains of read-ing comprehension and listening comprehension.
To assist in interpreting students’ results in the profi ciency tests, the IQB worked closely with experts in subject didactics to develop profi ciency level models based on the Standing Conference’s educational standards. For the sub-jects of German and English, these are integrated models of profi ciency levels that include all students in the respective subject. For the subject of French, the profi ciency level models cover only those students who are working toward at least the MSA (Mittlerer Schulabschluss) or intermediate school-leaving certifi -cate. These profi ciency level models enable us to describe the demands that stu-dents with a specifi c test score will generally be capable of meeting. They also allow us to determine the extent to which students in the various states are meet-ing the Standing Conference’s educational standards in the subject and domain at hand, and whether they have met the respective “minimum”, “normative”, or “optimal” standards.
Comparative perspectives in IQB Trends in Student Achievement 2015
In IQB Trends in Student Achievement 2015, we report fi ndings on student com-petencies from three comparative perspectives:
From a criterial comparative perspective, we explore the question of how the ninth-graders in the various states were distributed across the various levels of the profi ciency models in 2015. We look in particular at what percentage of stu-dents achieved at least the normative standards, and what percentage failed to meet the minimum standards. Beyond that, we look at the extent to which stu-dents in academically oriented upper secondary school (Gymnasium) achieved the optimal standards.
From an ipsative or temporal comparative perspective, we are also able to de-scribe changes over time (trend estimates). By linking the temporal and criterial perspectives, we can draw conclusions about the extent to which the distribu-tions of students across profi ciency levels in the various states changed between 2009 and 2015—for instance, whether the percentage of young people who fail to meet the minimum standards has declined over time, and whether the percent-age who meet at least the normative standards has increased.
Third, we analyze the results from a social comparative perspective. This al-lows us to see, for instance, which states have higher percentages of students meeting the normative standards, and which states have lower percentages of stu-dents meeting these standards. We also use this perspective to compare students’ mean profi ciency levels across states.
IQB Trends in Student Achievement 2015 also focuses on an aspect of educa-tional equality, namely on the question of whether differences in profi ciency are associated with particular student background characteristics. Here, we studied differences in profi ciency between girls and boys (gender disparities), differences associated with students’ social backgrounds (social disparities), and differences in profi ciency between students from immigrant and non-immigrant families (im-migration-related disparities). Even if the educational system cannot realistical-ly be expected to level the playing fi eld completely and eradicate all inequalities among students from different social backgrounds, educational policy aims to re-
5IQB Analysis of Student Achievement 2015 – Summary
duce these disparities as much as possible. IQB Trends in Student Achievement 2015 assesses the extent to which this has been achieved at the state level both 2015 and over time.
By looking at all four focal points of the analysis together—the assessment of student achievement of educational standards, the examination of changes over time, the comparison of state-level results, and the differentiated analysis of spe-cifi c sub-groups of students—educational policy makers and administrators can get a broad picture of the strengths and weaknesses of Germany’s 16 education-al systems at secondary level I. The trend estimates, which will be crucially im-portant for educational monitoring, also provide indicators of the extent to which quality control measures implemented in educational systems at the state level over the last six years have been successful, and where there is still room for im-provement.
After briefl y describing important aspects of the population defi nition, sample, and reporting metrics used in IQB Trends in Student Achievement 2015, we summarize key results of our analyses in the subjects of German and English.1 This, of course, requires us to reduce the complexity of the highly differentiated picture obtained for each individual state to a certain extent. To draw robust con-clusions from the results reported in IQB Trends in Student Achievement 2015, researchers should examine the pattern of fi ndings in each state in more detail within the context of that state’s educational system.
Population definition, sample, and reporting metrics
In 2015, a total of 33,110 ninth-grade students from all 16 German states partici-pated in our assessment of the achievement of educational standards in the sub-jects of German and English. The randomly selected, representative sample pro-vides the basis for inferences about the population at the state level. The sample tested in the subject of German represents the population of all ninth-grade stu-dents in each of Germany’s states and in Germany as a whole. The population for the subject of English is part of the larger population of students tested in German and only includes those students who took English every year from the fi fth grade on. This is true of the majority of ninth-graders in Germany.
The study population for the analyses reported in IQB Trends in Student Achievement 2015 in the subjects of both German and English includes students with special educational needs in the domains of learning, language, and emo-tional and social development (Förderschwerpunkte Lernen, Sprache, emotionale und soziale Entwicklung). The 2015 IQB trend report was also conducted with adolescents at special needs schools.
In order to represent the student population for whom the educational stand-ards have been developed in the analysis of educational monitoring as accurate-ly as possible, the metrics used in the IQB Trends in Student Achievement 2015 (see below) are based on the test results of all ninth-graders in the target pop-ulation in the subjects of German and English. We therefore included data on students with special needs at both regular schools and at special needs schools
1 We refrain from presenting results for the subject of French, since language profi ciency in this subject was only surveyed in six states. Due to the signifi cant differences between the respective populations, a comparison by state does not provide useful results (Stanat, Böhme, Schipolowski & Haag, 2016, Chapter 5).
6 IQB Analysis of Student Achievement 2015 – Summary
in the analyses.2 The fi rst IQB National Assessment 2009, in contrast, was con-ducted only at regular schools, meaning that the 2009 and 2015 assessments dif-fer with regard to the inclusion of students from special needs schools. The only way to overcome this discrepancy was by excluding special needs students from our analysis of trends over time.3 Our conclusions about changes in the distribu-tion of competencies between 2009 and 2015 thus apply exclusively to students without special needs. This limitation will only affect the analysis of trends over time in the 2015 IQB trend report. Trend estimates in future IQB studies will ap-ply to the total population of ninth-graders including students with special needs.
Since an analysis of changes over time requires that we present the results of the various surveys on a unifi ed scale (“metric”), the data from the IQB National Assessment 2009 were integrated into the reporting metric used in IQB Trends in Student Achievement 2015, and all results are presented using the metric from the 2015 Analysis. The values from 2009 that were reported in the IQB National Assessment 2009 and the corresponding values presented in this IQB Trends in Student Achievement 2015 are therefore not directly comparable. The new metric for the various domains was designed such that the distribution of values across the overall population of students in 2015 has a mean value of M = 500 points and a standard deviation of SD = 100 points.
Participation in the profi ciency tests administered as part of IQB Trends in Student Achievement 2015 was mandatory at most public schools, both for the schools and the students. The overall sample of 33,110 ninth-grade students cor-responds to a weighted participation rate of 93 percent of the student population. This is the same rate as in PISA 2012 (93%; Heine, Sälzer, Borchert, Sibberns & Mang, 2013) and is only slightly lower than in the IQB National Assessment 2009 (95%; Böhme et al., 2010). In the individual states, too, the rate of partici-pation in the profi ciency tests was high overall at 90 to 96 percent.
Along with the rate of participation in the profi ciency tests, the participation rate in the student questionnaires needs to be considered. The student question-naires used in the study serve, among other things, to collect data on student background characteristics for the analysis of social and immigration-related dis-parities. At an overall rate of 85 percent, the participation rate was lower for the student questionnaires than for the profi ciency tests. In addition, the rate of participation in the student questionnaires differed considerably between states, which is due to the fact that only some states mandated questionnaire comple-tion whereas others required parental consent. The information needed to ana-lyze social and immigration-related disparities is therefore lacking for more than 20 percent of the students in three states (Berlin, Hamburg, and Saarland). Since estimates from available data are likely biased, our fi ndings from the analysis of the aforementioned disparities in these three states should be interpreted with caution and are identifi ed accordingly in the discussion of results below.
2 We only excluded special needs students who follow an alternative curriculum that does not lead to a regular school certifi cate (zieldifferente Unterrichtung) from our analyses of the achievement of educational standards. Since there are specifi c de-mands associated with the use of alternative curricula in teaching children and ad-olescents with special needs, it would be inappropriate to use the Standing Con-ference’s educational standards to measure their achievement. The percentage of students who follow an alternative curriculum ranges from 1 to 3 percent across the states, and is thus small overall.
3 Due to the very different ratios of inclusion across states, which also changed be-tween 2009 and 2015, all students with special needs had to be excluded from the analysis of changes over time, no matter what type of school they attended, to guar-antee comparability of populations across states.
7IQB Analysis of Student Achievement 2015 – Summary
Comparing proficiency level distributions by state
The educational standards for secondary level I were defi ned by the Standing Conference in relation to the fi nal qualifi cation at the end of specifi c educa-tional tracks. For the subjects of German, English, and French, the Standing Conference formulated normative standards (Regelstandards) for the HSA (Hauptschulabschluss) or lower secondary school-leaving certifi cate, and for the MSA (Mittlerer Schulabschluss) or intermediate secondary school-leaving certifi -cate. Based on these targets, the IQB developed profi ciency level models that not only describe student achievement at the level of the normative standards, but also cover the entire range of profi ciencies and divide this range into meaningful-ly interpretable segments. The profi ciency level models also defi ne the levels at which students achieve the minimum standard (Minimalstandard), the normative standard, normative standard plus (Regelstandard plus), and the optimal standard (Optimalstandard) for the HSA certifi cate and the MSA certifi cate (for French, only for the latter). In the following summary, we report profi ciency level distri-butions only for the standards defi ned for the MSA certifi cate. The focus is, fi rst, on the question of what percentage of ninth-graders in each state have achieved the normative standards for the MSA certifi cate overall, and second, on what per-centage of students have not achieved the minimum standards for the MSA cer-tifi cate.
8 IQB Analysis of Student Achievement 2015 – Summary
Proficiency level distributions in German in 2015
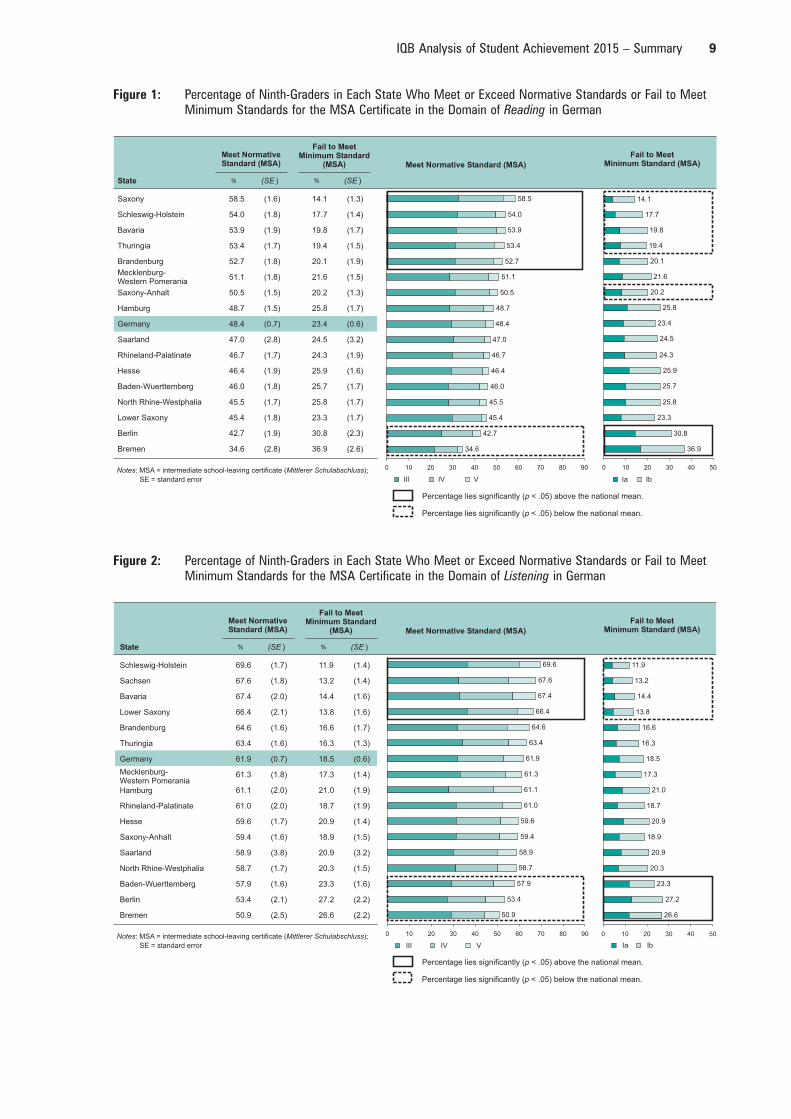
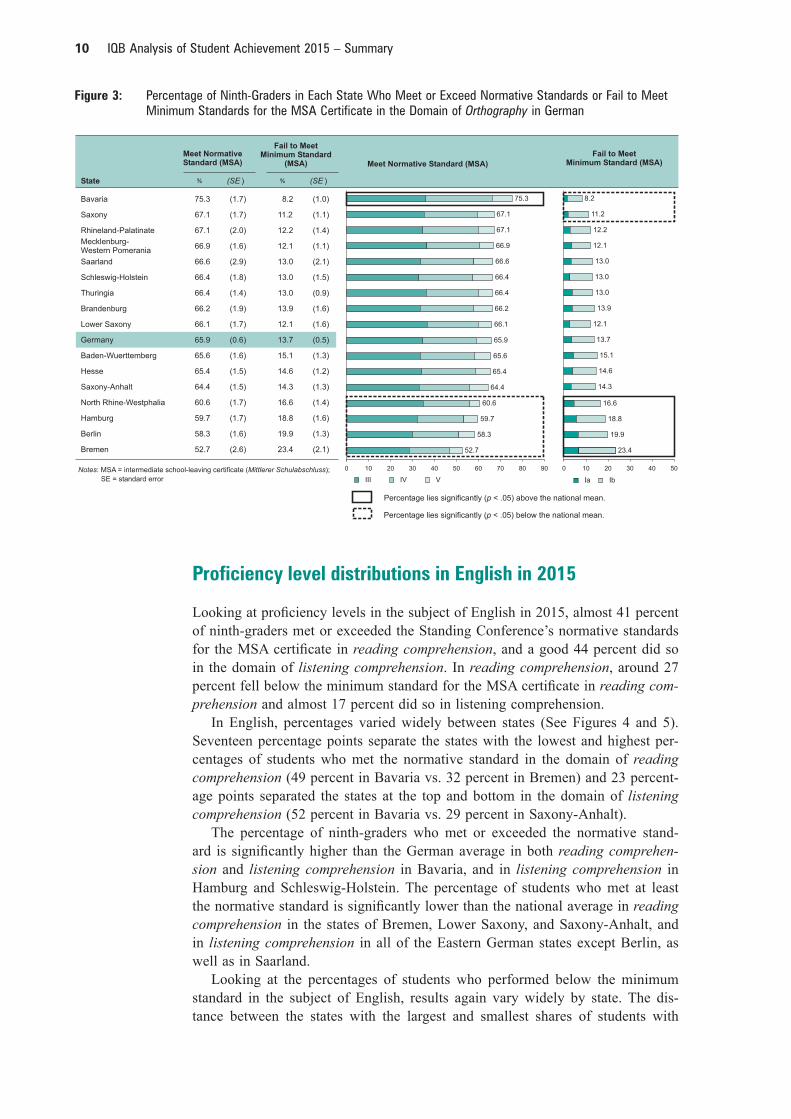
In the subject of German, a good 48 percent of ninth-graders across Germany met or exceeded normative standards for the MSA certifi cate in the domain of reading in 2015. This was true of 62 percent of students in the domain of listen-ing and around 66 percent in the domain of orthography. The percentage of stu-dents who failed to meet the minimum standard for the MSA certifi cate in these profi ciency domains was around 23 percent in reading, almost 19 percent in lis-tening, and around 14 percent in orthography across Germany as a whole. Yet as Figures 1-3 show, the percentages vary widely between states.
In the domain of reading, approximately 24 percentage points separate the states with the highest and lowest percentages of students achieving at least the normative standard (59 percent in Saxony vs. 35 percent in Bremen). The top and bottom-scoring states were separated by almost 19 percentage points in the domain of listening (70 percent in Schleswig-Holstein vs. 51 percent in Bremen) and by around 22 percentage points in the domain of orthography (75 percent in Bavaria vs. 53 percent in Bremen).
The states of Bavaria, Saxony, and Schleswig-Holstein had signifi cantly high-er percentages of students who achieved at least the normative standard, both in reading and in listening, compared to the national average. Moreover, Bavaria was the only state in which the percentage of ninth-graders who achieved or ex-ceeded the normative standard in the domain of orthography was signifi cantly higher than the national average. Other states with particularly strong achieve-ment with respect to the normative standards were, in reading, Brandenburg and Thuringia, and in listening, Lower Saxony. The percentage of students who achieved at least the normative standard was signifi cantly lower than the national average in all three domains in Berlin and Bremen, in the domain of listening in Baden-Wuerttemberg, and in the domain of orthography in Hamburg and North Rhine-Westphalia.
With respect to the percentages of students who failed to achieve the min-imum standards in German, results also vary widely by state. States with the highest and lowest percentages were separated by almost 23 percentage points in reading (37 percent in Bremen vs. 14 percent in Saxony), around 15 percentage points in listening (27 percent in Berlin vs. 12 percent in Schleswig-Holstein), and approximately 15 percentage points in orthography (23 percent in Bremen vs. 8 percent in Bavaria).
When comparing the state data to the national averages, the results for the minimum standards present a similar picture to those for the normative stand-ards. Again, Bavaria and Saxony had a smaller percentage of students who performed below the minimum standard compared to Germany as a whole. The same was true in the domain of reading in Saxony-Anhalt, Schleswig-Holstein, and Thuringia, and in the domain of listening in Lower Saxony and Schleswig-Holstein. Outcomes were particularly poor relative to the national av-erage in Berlin and Bremen across the board, and in specifi c domains in Baden-Wuerttemberg (listening), Hamburg, and North Rhine-Westphalia (orthography).
9IQB Analysis of Student Achievement 2015 – Summary
State % (SE ) % (SE )
Saxony 58.5 (1.6) 14.1 (1.3)
Schleswig-Holstein 54.0 (1.8) 17.7 (1.4)
Bavaria 53.9 (1.9) 19.8 (1.7)
Thuringia 53.4 (1.7) 19.4 (1.5)
Brandenburg 52.7 (1.8) 20.1 (1.9)
Mecklenburg-Western Pomerania
51.1 (1.8) 21.6 (1.5)
Saxony-Anhalt 50.5 (1.5) 20.2 (1.3)
Hamburg 48.7 (1.5) 25.8 (1.7)
Germany 48.4 (0.7) 23.4 (0.6)
Saarland 47.0 (2.8) 24.5 (3.2)
Rhineland-Palatinate 46.7 (1.7) 24.3 (1.9)
Hesse 46.4 (1.9) 25.9 (1.6)
Baden-Wuerttemberg 46.0 (1.8) 25.7 (1.7)
North Rhine-Westphalia 45.5 (1.7) 25.8 (1.7)
Lower Saxony 45.4 (1.8) 23.3 (1.7)
Berlin 42.7 (1.9) 30.8 (2.3)
Bremen 34.6 (2.8) 36.9 (2.6)
Meet NormativeStandard (MSA)
Fail to MeetMinimum Standard
(MSA) Meet Normative Standard (MSA)
Fail to MeetMinimum Standard (MSA)
14.1
17.7
19.8
19.4
20.1
21.6
20.2
25.8
23.4
24.5
24.3
25.9
25.7
25.8
23.3
30.8
36.9
0 10 20 30 40 50
Ia Ib
58.5
54.0
53.9
53.4
52.7
51.1
50.5
48.7
48.4
47.0
46.7
46.4
46.0
45.5
45.4
42.7
34.6
0 10 20 30 40 50 60 70 80 90
III IV V
Notes Mittlerer Schulabschluss: MSA = intermediate school-leaving certificate ( );
SE = standard error
Percentage lies significantly ( < .05) above the national mean.p
Percentage lies significantly ( < .05) below the national mean.p
Figure 1: Percentage of Ninth-Graders in Each State Who Meet or Exceed Normative Standards or Fail to Meet Minimum Standards for the MSA Certificate in the Domain of Reading in German
State % (SE ) % (SE )
Schleswig-Holstein 69.6 (1.7) 11.9 (1.4)
Sachsen 67.6 (1.8) 13.2 (1.4)
Bavaria 67.4 (2.0) 14.4 (1.6)
Lower Saxony 66.4 (2.1) 13.8 (1.6)
Brandenburg 64.6 (1.6) 16.6 (1.7)
Thuringia 63.4 (1.6) 16.3 (1.3)
Germany 61.9 (0.7) 18.5 (0.6)
Mecklenburg-Western Pomerania
61.3 (1.8) 17.3 (1.4)
Hamburg 61.1 (2.0) 21.0 (1.9)
Rhineland-Palatinate 61.0 (2.0) 18.7 (1.9)
Hesse 59.6 (1.7) 20.9 (1.4)
Saxony-Anhalt 59.4 (1.6) 18.9 (1.5)
Saarland 58.9 (3.8) 20.9 (3.2)
North Rhine-Westphalia 58.7 (1.7) 20.3 (1.5)
Baden-Wuerttemberg 57.9 (1.6) 23.3 (1.6)
Berlin 53.4 (2.1) 27.2 (2.2)
Bremen 50.9 (2.5) 26.6 (2.2)
11.9
13.2
14.4
13.8
16.6
16.3
18.5
17.3
21.0
18.7
20.9
18.9
20.9
20.3
23.3
27.2
26.6
0 10 20 30 40 50
69.6
67.6
67.4
66.4
64.6
63.4
61.9
61.3
61.1
61.0
59.6
59.4
58.9
58.7
57.9
53.4
50.9
0 10 20 30 40 50 60 70 80 90
III IV V Ia Ib
Notes Mittlerer Schulabschluss: MSA = intermediate school-leaving certificate ( );
SE = standard error
Meet NormativeStandard (MSA)
Fail to MeetMinimum Standard
(MSA) Meet Normative Standard (MSA)
Fail to MeetMinimum Standard (MSA)
Percentage lies significantly ( < .05) above the national mean.p
Percentage lies significantly ( < .05) below the national mean.p
Figure 2: Percentage of Ninth-Graders in Each State Who Meet or Exceed Normative Standards or Fail to Meet Minimum Standards for the MSA Certificate in the Domain of Listening in German
10 IQB Analysis of Student Achievement 2015 – Summary
Figure 3: Percentage of Ninth-Graders in Each State Who Meet or Exceed Normative Standards or Fail to Meet Minimum Standards for the MSA Certificate in the Domain of Orthography in German
State % (SE ) % (SE )
Bavaria 75.3 (1.7) 8.2 (1.0)
Saxony 67.1 (1.7) 11.2 (1.1)
Rhineland-Palatinate 67.1 (2.0) 12.2 (1.4)
Mecklenburg-Western Pomerania
66.9 (1.6) 12.1 (1.1)
Saarland 66.6 (2.9) 13.0 (2.1)
Schleswig-Holstein 66.4 (1.8) 13.0 (1.5)
Thuringia 66.4 (1.4) 13.0 (0.9)
Brandenburg 66.2 (1.9) 13.9 (1.6)
Lower Saxony 66.1 (1.7) 12.1 (1.6)
Germany 65.9 (0.6) 13.7 (0.5)
Baden-Wuerttemberg 65.6 (1.6) 15.1 (1.3)
Hesse 65.4 (1.5) 14.6 (1.2)
Saxony-Anhalt 64.4 (1.5) 14.3 (1.3)
North Rhine-Westphalia 60.6 (1.7) 16.6 (1.4)
Hamburg 59.7 (1.7) 18.8 (1.6)
Berlin 58.3 (1.6) 19.9 (1.3)
Bremen 52.7 (2.6) 23.4 (2.1)
8.2
11.2
12.2
12.1
13.0
13.0
13.0
13.9
12.1
13.7
15.1
14.6
14.3
16.6
18.8
19.9
23.4
0 10 20 30 40 50
Ia Ib
75.3
67.1
67.1
66.9
66.6
66.4
66.4
66.2
66.1
65.9
65.6
65.4
64.4
60.6
59.7
58.3
52.7
0 10 20 30 40 50 60 70 80 90
III IV V
Notes Mittlerer Schulabschluss: MSA = intermediate school-leaving certificate ( );
SE = standard error
Meet NormativeStandard (MSA)
Fail to MeetMinimum Standard
(MSA) Meet Normative Standard (MSA)
Fail to MeetMinimum Standard (MSA)
Percentage lies significantly ( < .05) above the national mean.p
Percentage lies significantly ( < .05) below the national mean.p
Proficiency level distributions in English in 2015
Looking at profi ciency levels in the subject of English in 2015, almost 41 percent of ninth-graders met or exceeded the Standing Conference’s normative standards for the MSA certifi cate in reading comprehension, and a good 44 percent did so in the domain of listening comprehension. In reading comprehension, around 27 percent fell below the minimum standard for the MSA certifi cate in reading com-prehension and almost 17 percent did so in listening comprehension.
In English, percentages varied widely between states (See Figures 4 and 5). Seventeen percentage points separate the states with the lowest and highest per-centages of students who met the normative standard in the domain of reading comprehension (49 percent in Bavaria vs. 32 percent in Bremen) and 23 percent-age points separated the states at the top and bottom in the domain of listening comprehension (52 percent in Bavaria vs. 29 percent in Saxony-Anhalt).
The percentage of ninth-graders who met or exceeded the normative stand-ard is signifi cantly higher than the German average in both reading comprehen-sion and listening comprehension in Bavaria, and in listening comprehension in Hamburg and Schleswig-Holstein. The percentage of students who met at least the normative standard is signifi cantly lower than the national average in reading comprehension in the states of Bremen, Lower Saxony, and Saxony-Anhalt, and in listening comprehension in all of the Eastern German states except Berlin, as well as in Saarland.
Looking at the percentages of students who performed below the minimum standard in the subject of English, results again vary widely by state. The dis-tance between the states with the largest and smallest shares of students with

11IQB Analysis of Student Achievement 2015 – Summary
Figure 4: Percentage of Ninth-Graders in Each State Who Meet or Exceed Normative Standards or Fail to Meet Minimum Standards for the MSA Certificate in the Domain of Reading Comprehension in English
State % (SE ) % (SE )
Bavaria 49.3 (1.8) 22.0 (1.6)
Hamburg 43.6 (1.5) 28.4 (1.5)
Schleswig-Holstein 43.5 (1.8) 22.3 (1.9)
Germany 40.9 (0.5) 26.7 (0.5)
Hesse 40.7 (1.7) 26.0 (1.5)
North Rhine-Westphalia 40.4 (1.5) 27.7 (1.3)
Saxony 39.3 (1.7) 25.0 (1.6)
Baden-Wuerttemberg 39.2 (1.5) 27.4 (1.4)
Rhineland-Palatinate 39.2 (2.0) 26.6 (2.2)
Mecklenburg-Western Pomerania
39.0 (1.6) 26.8 (1.5)
Thuringia 38.5 (1.4) 27.4 (1.4)
Brandenburg 38.3 (1.8) 29.3 (1.8)
Berlin 37.3 (1.8) 33.7 (2.6)
Lower Saxony 36.7 (1.5) 27.7 (1.9)
Saxony-Anhalt 35.0 (1.4) 32.5 (1.3)
Saarland 34.9 (3.1) 33.9 (3.6)
Bremen 32.3 (2.8) 37.6 (3.1)
49.3
43.6
43.5
40.9
40.7
40.4
39.3
39.2
39.2
39.0
38.5
38.3
37.3
36.7
35.0
34.9
32.3
0 10 20 30 40 50 60 70
22.0
28.4
22.3
26.7
26.0
27.7
25.0
27.4
26.6
26.8
27.4
29.3
33.7
27.7
32.5
33.9
37.6
0 10 20 30 40 50
B1.2 B2.1 B2.2 and higher A1.1 A1.2 A2.1Notes Mittlerer Schulabschluss: MSA = intermediate school-leaving certificate ( );
SE = standard error
Meet NormativeStandard (MSA)
Fail to MeetMinimum Standard
(MSA) Meet Normative Standard (MSA)
Fail to MeetMinimum Standard (MSA)
Percentage lies significantly ( < .05) above the national mean.p
Percentage lies significantly ( < .05) below the national mean.p
Figure 5: Percentage of Ninth-Graders in Each State Who Meet or Exceed Normative Standards or Fail to Meet Minimum Standards for the MSA Certificate in the Domain of Listening Comprehension in English
State % (SE ) % (SE )
Bavaria 52.4 (2.0) 15.5 (1.7)
Hamburg 51.9 (1.9) 17.1 (2.1)
Schleswig-Holstein 50.9 (2.0) 9.9 (1.4)
Hesse 46.0 (1.7) 15.6 (1.5)
Germany 44.1 (0.6) 16.9 (0.5)
North Rhine-Westphalia 44.0 (1.7) 14.9 (1.1)
Lower Saxony 43.2 (2.0) 17.2 (1.7)
Rhineland-Palatinate 43.1 (2.6) 16.3 (1.8)
Baden-Wuerttemberg 42.8 (1.5) 16.7 (1.3)
Berlin 40.2 (1.9) 24.1 (2.4)
Bremen 38.9 (3.1) 22.3 (2.8)
Mecklenburg-Western Pomerania
37.0 (2.1) 22.3 (1.7)
Saarland 36.2 (2.8) 21.8 (3.8)
Brandenburg 36.2 (1.8) 22.0 (2.0)
Thuringia 34.0 (1.6) 23.7 (1.8)
Saxony 34.0 (1.6) 19.2 (1.6)
Saxony-Anhalt 29.4 (1.6) 28.4 (1.3)
52.4
51.9
50.9
46.0
44.1
44.0
43.2
43.1
42.8
40.2
38.9
37.0
36.2
36.2
34.0
34.0
29.4
0 10 20 30 40 50 60 70
B1.2 B2.1 B2.2 and higher
15.5
17.1
9.9
15.6
16.9
14.9
17.2
16.3
16.7
24.1
22.3
22.3
21.8
22.0
23.7
19.2
28.4
0 10 20 30 40 50
A1.1 A1.2 A2.1Notes Mittlerer Schulabschluss: MSA = intermediate school-leaving certificate ( );
SE = standard error
Meet NormativeStandard (MSA)
Fail to MeetMinimum Standard
(MSA) Meet Normative Standard (MSA)
Fail to MeetMinimum Standard (MSA)
Percentage lies significantly ( < .05) above the national mean.p
Percentage lies significantly ( < .05) below the national mean.p
12 IQB Analysis of Student Achievement 2015 – Summary
below-minimum profi ciency scores was 16 percentage points in the domain of reading comprehension (38 percent in Bremen vs. 22 percent in Bavaria) and 18 percentage points in the domain of listening comprehension (28 percent in Saxony-Anhalt vs. 10 percent in Schleswig-Holstein). The results show that stu-dents in Schleswig-Holstein are particularly successful in meeting the minimum standards in both domains, and that the percentage of students in Bavaria who fall below the minimum standard in the domain of reading comprehension is sig-nifi cantly below the national average. In contrast, high percentages of students in Berlin performed below the minimum standard in both domains. The same was true of students in Bremen, Saarland, and Saxony-Anhalt in the domain of read-ing comprehension and in the Eastern German states except Saxony in listening comprehension.
Comparing proficiency level distributions in German and English between 2009 and 2015
Comparing the profi ciency level distributions from 2015 with those from the fi rst IQB National Assessment Study 2009 presents a differentiated picture of student profi ciency in the subjects of German and English across Germany’s 16 states.
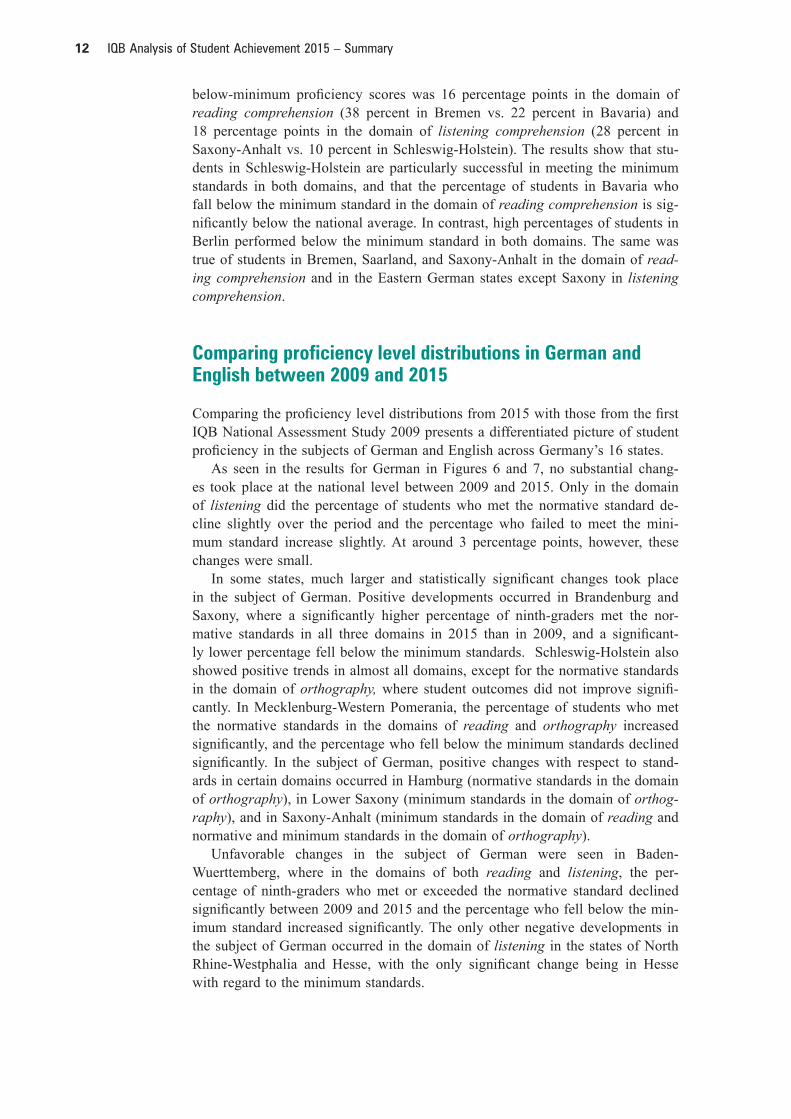
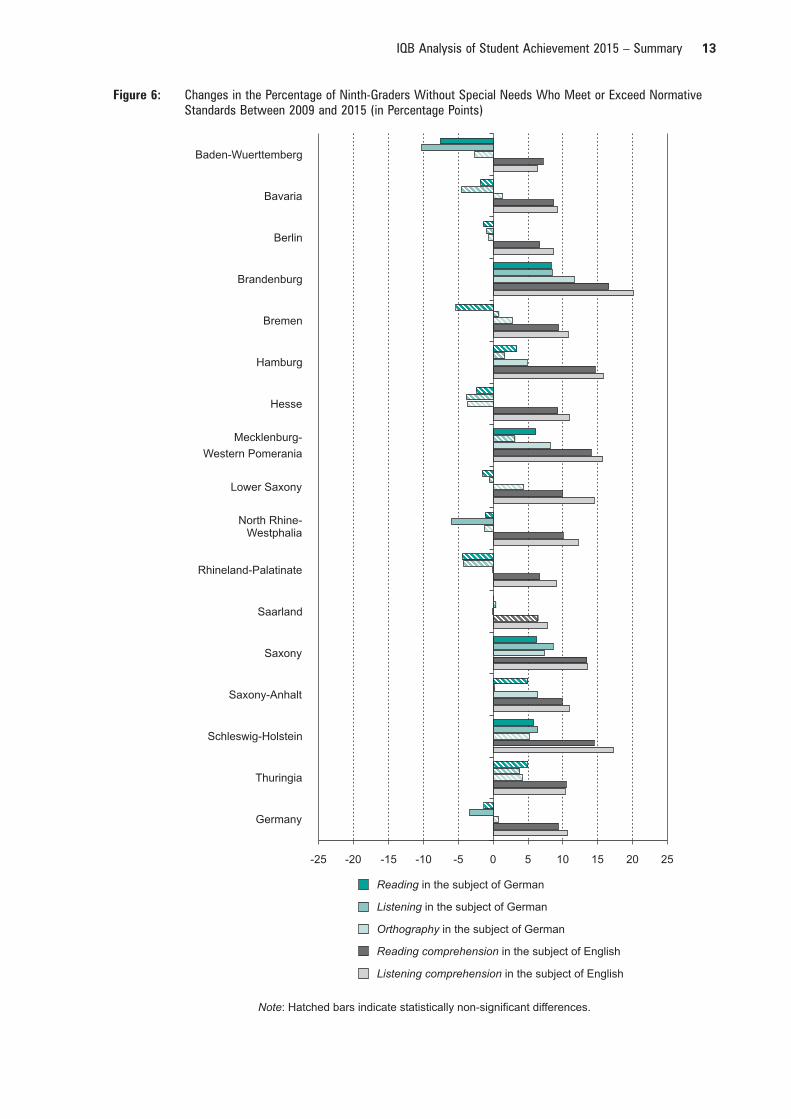
As seen in the results for German in Figures 6 and 7, no substantial chang-es took place at the national level between 2009 and 2015. Only in the domain of listening did the percentage of students who met the normative standard de-cline slightly over the period and the percentage who failed to meet the mini-mum standard increase slightly. At around 3 percentage points, however, these changes were small.
In some states, much larger and statistically signifi cant changes took place in the subject of German. Positive developments occurred in Brandenburg and Saxony, where a signifi cantly higher percentage of ninth-graders met the nor-mative standards in all three domains in 2015 than in 2009, and a signifi cant-ly lower percentage fell below the minimum standards. Schleswig-Holstein also showed positive trends in almost all domains, except for the normative standards in the domain of orthography, where student outcomes did not improve signifi -cantly. In Mecklenburg-Western Pomerania, the percentage of students who met the normative standards in the domains of reading and orthography increased signifi cantly, and the percentage who fell below the minimum standards declined signifi cantly. In the subject of German, positive changes with respect to stand-ards in certain domains occurred in Hamburg (normative standards in the domain of orthography), in Lower Saxony (minimum standards in the domain of orthog-raphy), and in Saxony-Anhalt (minimum standards in the domain of reading and normative and minimum standards in the domain of orthography).
Unfavorable changes in the subject of German were seen in Baden-Wuerttemberg, where in the domains of both reading and listening, the per-centage of ninth-graders who met or exceeded the normative standard declined signifi cantly between 2009 and 2015 and the percentage who fell below the min-imum standard increased signifi cantly. The only other negative developments in the subject of German occurred in the domain of listening in the states of North Rhine-Westphalia and Hesse, with the only signifi cant change being in Hesse with regard to the minimum standards.
13IQB Analysis of Student Achievement 2015 – Summary
Figure 6: Changes in the Percentage of Ninth-Graders Without Special Needs Who Meet or Exceed Normative Standards Between 2009 and 2015 (in Percentage Points)
-25 -15 -10 -5 0 5 10 15 20 25
Baden-Wuerttemberg
Bavaria
Berlin
Brandenburg
Bremen
Hamburg
Hesse
Mecklenburg-
Western Pomerania
Lower Saxony
North Rhine-Westphalia
Rhineland-Palatinate
Saarland
Saxony
Saxony-Anhalt
Schleswig-Holstein
Thuringia
Germany
Reading in the subject of German
Listening in the subject of German
Orthography in the subject of German
Reading comprehension in the subject of English
Listening comprehension in the subject of English
Note: Hatched bars indicate statistically non-significant differences.
-20
14 IQB Analysis of Student Achievement 2015 – Summary
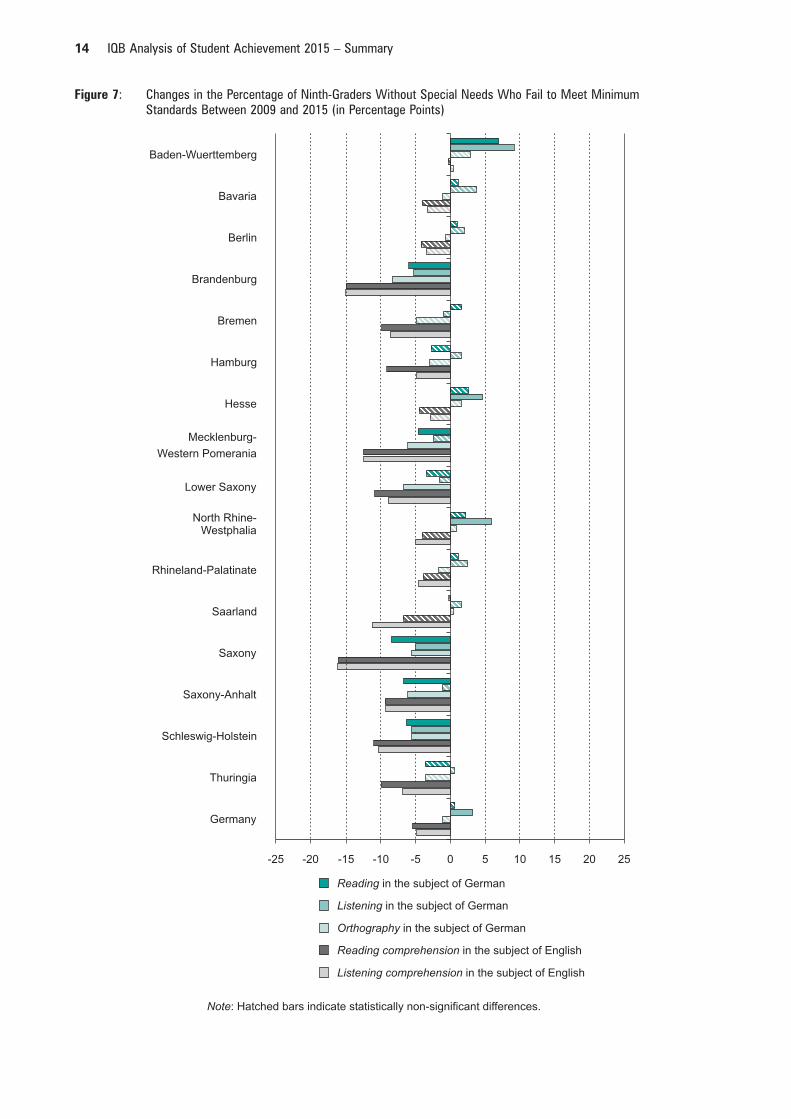
Figure 7: Changes in the Percentage of Ninth-Graders Without Special Needs Who Fail to Meet Minimum Standards Between 2009 and 2015 (in Percentage Points)
-25 -20 -10 -5 0 5 10 15 20 25
Baden-Wuerttemberg
Bavaria
Berlin
Brandenburg
Bremen
Hamburg
Hesse
Mecklenburg-
Western Pomerania
Lower Saxony
Rhineland-Palatinate
Saarland
Saxony
Saxony-Anhalt
Schleswig-Holstein
Thuringia
Germany
Reading in the subject of German
Listening in the subject of German
Orthography in the subject of German
Reading comprehension in the subject of English
Listening comprehension in the subject of English
Note: Hatched bars indicate statistically non-significant differences.
-15
North Rhine-Westphalia
15IQB Analysis of Student Achievement 2015 – Summary
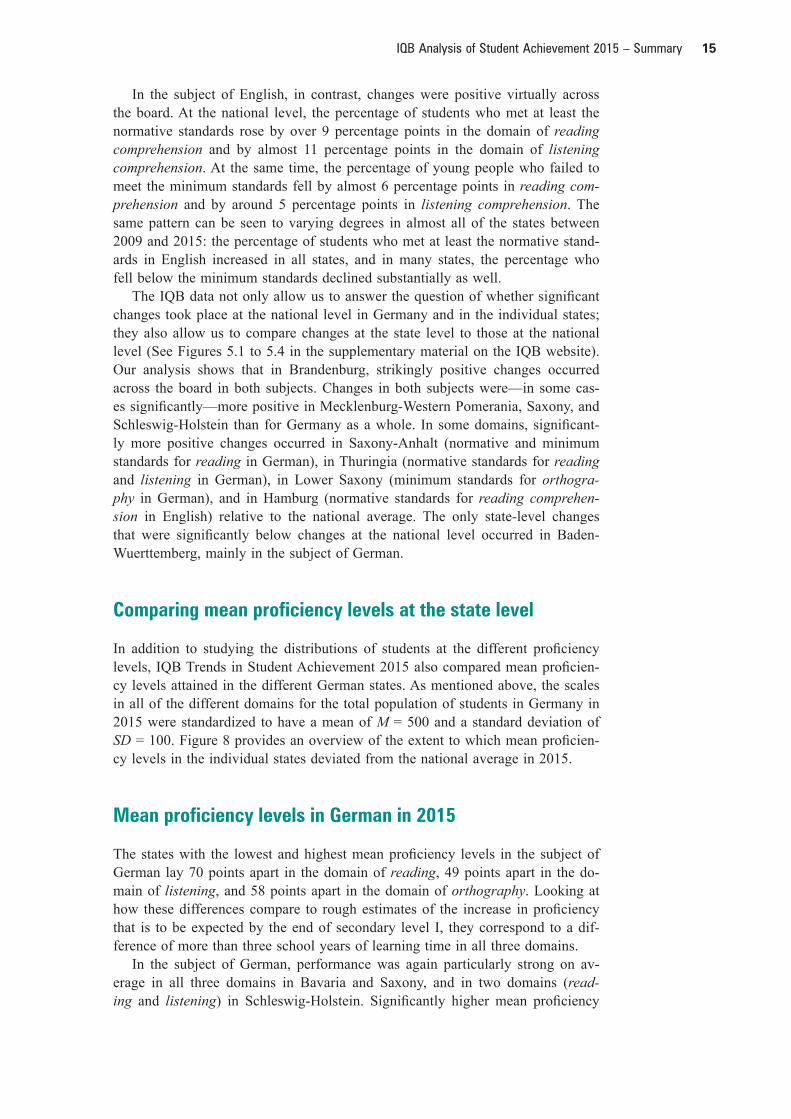
In the subject of English, in contrast, changes were positive virtually across the board. At the national level, the percentage of students who met at least the normative standards rose by over 9 percentage points in the domain of reading comprehension and by almost 11 percentage points in the domain of listening comprehension. At the same time, the percentage of young people who failed to meet the minimum standards fell by almost 6 percentage points in reading com-prehension and by around 5 percentage points in listening comprehension. The same pattern can be seen to varying degrees in almost all of the states between 2009 and 2015: the percentage of students who met at least the normative stand-ards in English increased in all states, and in many states, the percentage who fell below the minimum standards declined substantially as well.
The IQB data not only allow us to answer the question of whether signifi cant changes took place at the national level in Germany and in the individual states; they also allow us to compare changes at the state level to those at the national level (See Figures 5.1 to 5.4 in the supplementary material on the IQB website). Our analysis shows that in Brandenburg, strikingly positive changes occurred across the board in both subjects. Changes in both subjects were—in some cas-es signifi cantly—more positive in Mecklenburg-Western Pomerania, Saxony, and Schleswig-Holstein than for Germany as a whole. In some domains, signifi cant-ly more positive changes occurred in Saxony-Anhalt (normative and minimum standards for reading in German), in Thuringia (normative standards for reading and listening in German), in Lower Saxony (minimum standards for orthogra-phy in German), and in Hamburg (normative standards for reading comprehen-sion in English) relative to the national average. The only state-level changes that were signifi cantly below changes at the national level occurred in Baden-Wuerttemberg, mainly in the subject of German.
Comparing mean proficiency levels at the state level
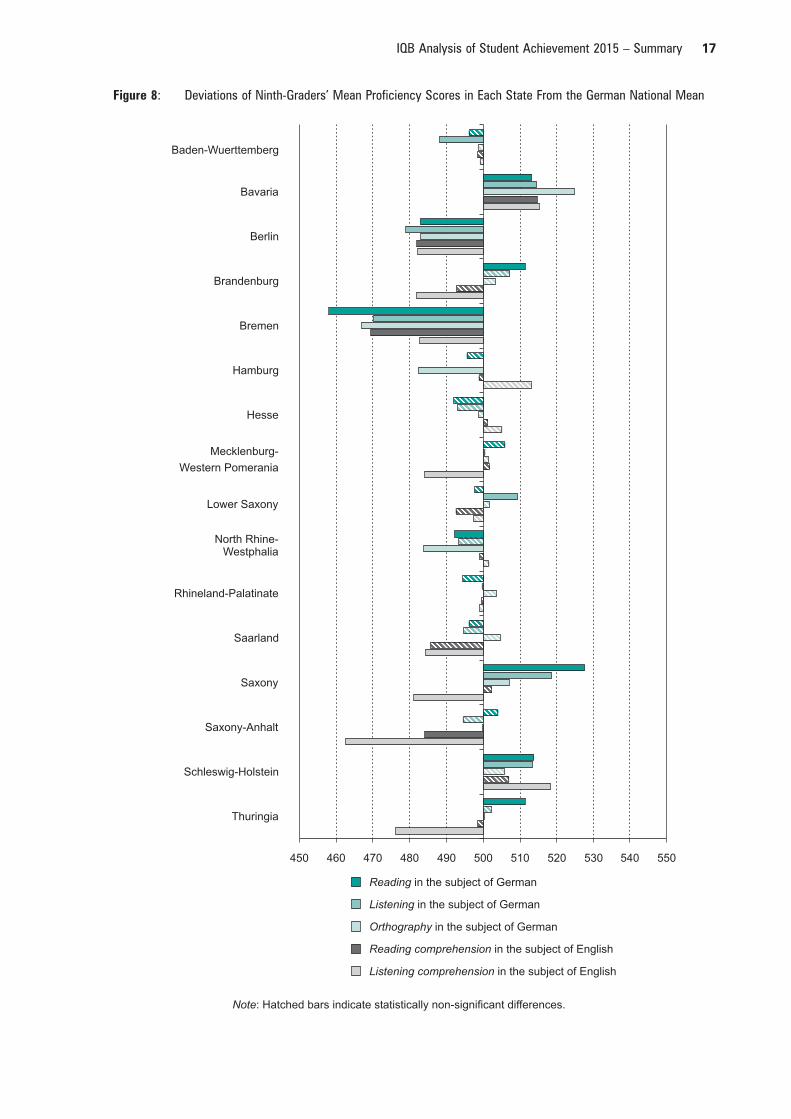
In addition to studying the distributions of students at the different profi ciency levels, IQB Trends in Student Achievement 2015 also compared mean profi cien-cy levels attained in the different German states. As mentioned above, the scales in all of the different domains for the total population of students in Germany in 2015 were standardized to have a mean of M = 500 and a standard deviation of SD = 100. Figure 8 provides an overview of the extent to which mean profi cien-cy levels in the individual states deviated from the national average in 2015.
Mean proficiency levels in German in 2015
The states with the lowest and highest mean profi ciency levels in the subject of German lay 70 points apart in the domain of reading, 49 points apart in the do-main of listening, and 58 points apart in the domain of orthography. Looking at how these differences compare to rough estimates of the increase in profi ciency that is to be expected by the end of secondary level I, they correspond to a dif-ference of more than three school years of learning time in all three domains.
In the subject of German, performance was again particularly strong on av-erage in all three domains in Bavaria and Saxony, and in two domains (read-ing and listening) in Schleswig-Holstein. Signifi cantly higher mean profi ciency
16 IQB Analysis of Student Achievement 2015 – Summary
levels than for Germany as a whole were found in the domain of reading in Brandenburg and Thuringia and in the domain of listening in Lower Saxony. At the other end of the spectrum, state-level profi ciency scores in German in all three domains were signifi cantly lower than the national mean in Berlin and Bremen. Students in several states also scored below the national mean in some domains: North Rhine-Westphalia (reading and orthography), Baden-Wuerttemberg (listening), and Hamburg (orthography).
Mean proficiency levels in English in 2015
In the subject of English, the states with the lowest and highest mean scores were separated by 46 points in the domain of reading comprehension and by 55 points in the domain of listening comprehension. The expected profi ciency in-crease by the end of secondary level I is greater in the subject of English than in the subject of German; therefore the differences in English correspond to around one school year of learning time.4
In the subject of English, only two states have mean profi ciency levels signif-icantly above the national average: Bavaria in both reading comprehension and listening comprehension and Schleswig-Holstein in listening comprehension. The number of states with signifi cant deviations below the national average is much greater, particularly in the domain of listening comprehension. Ninth-graders in Berlin and Bremen as well as Saxony-Anhalt achieve signifi cantly lower mean profi ciency levels in English in both domains than the national average. In the four Eastern German states of Brandenburg, Mecklenburg-Western Pomerania, Saxony, and Thuringia, only listening comprehension in English appeared to pose a challenge, whereas profi ciency scores in reading comprehension were on par with the national average. In Saarland, profi ciency scores in English in the do-main of listening comprehension were signifi cantly below the national average.
Comparing mean proficiency levels in German and English in 2009 and 2015
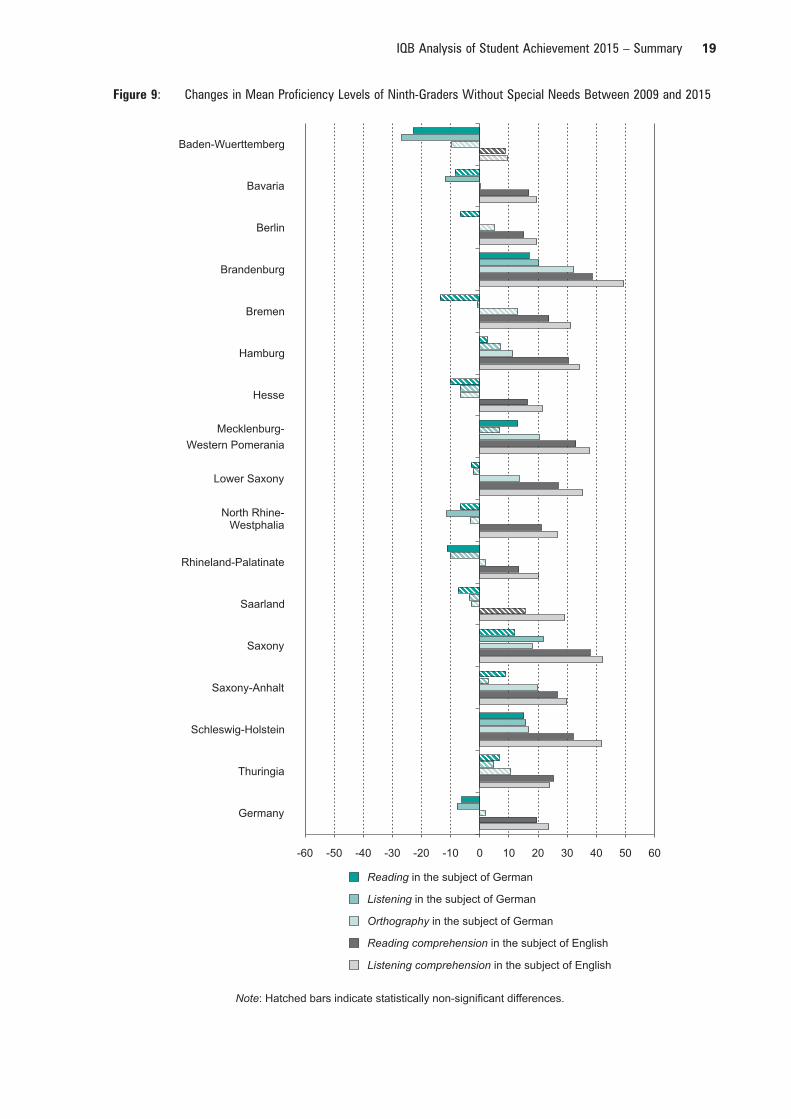
Our estimation of changes in mean profi ciency levels at the state level between 2009 and 2015 (see Fig. 9) largely replicate our trend estimates of changes in the achievement of educational standards. In the subject of German, mean profi cien-cy levels for Germany as a whole in the domain of reading were 6 points lower in 2015 than in 2009, and 8 points lower in the domain of listening. In the do-main of orthography, no signifi cant change occurred over time.
At the state level, signifi cantly positive changes were found in all three do-mains in Brandenburg and Schleswig-Holstein, in two domains in Mecklenburg-Western Pomerania (reading and orthography) and Saxony (listening and orthography), and in one domain (orthography) in Hamburg, Lower Saxony, and Saxony-Anhalt. Signifi cant changes in the opposite direction occurred in two do-mains (reading and listening) in Baden-Wuerttemberg, in the domain of read-
4 The estimates of the expected increases in profi ciency levels in the subject of En-glish are based on an IQB norming study from the year 2008. Since foreign language education now begins much earlier in many states, the data at hand could lead to underestimation of learning gains expected by the end of secondary level I.
17IQB Analysis of Student Achievement 2015 – Summary
Figure 8: Deviations of Ninth-Graders’ Mean Proficiency Scores in Each State From the German National Mean
450 460 470 480 490 500 510 520 530
Bavaria
Berlin
Brandenburg
Bremen
Hamburg
Hesse
Mecklenburg-
Western Pomerania
Lower Saxony
Rhineland-Palatinate
Saarland
Saxony
Saxony-Anhalt
Schleswig-Holstein
Thuringia
Baden-Wuerttemberg
Reading in the subject of German
Listening in the subject of German
Orthography in the subject of German
Reading comprehension in the subject of English
Listening comprehension in the subject of English
Note: Hatched bars indicate statistically non-significant differences.
540 550
North Rhine-Westphalia
18 IQB Analysis of Student Achievement 2015 – Summary
ing in Rhineland-Palatinate, and in the domain of listening in Bavaria and North Rhine-Westphalia.
In the subject of English, positive changes were found virtually across the board when comparing mean values for 2009 and 2015, again refl ecting the fi nd-ings reported above for the profi ciency levels. For Germany as a whole, mean profi ciency levels in English increased by 20 points in reading comprehen-sion and by 24 points in listening comprehension. In most states, students also reached higher mean profi ciency levels in English in 2015 than in 2009. The only states without signifi cant positive changes in English were Baden-Wuerttemberg in both domains and Saarland in the domain of reading comprehension.
Mean proficiency levels of students in upper secondary school (Gymnasium) and the percentage of students in this school track
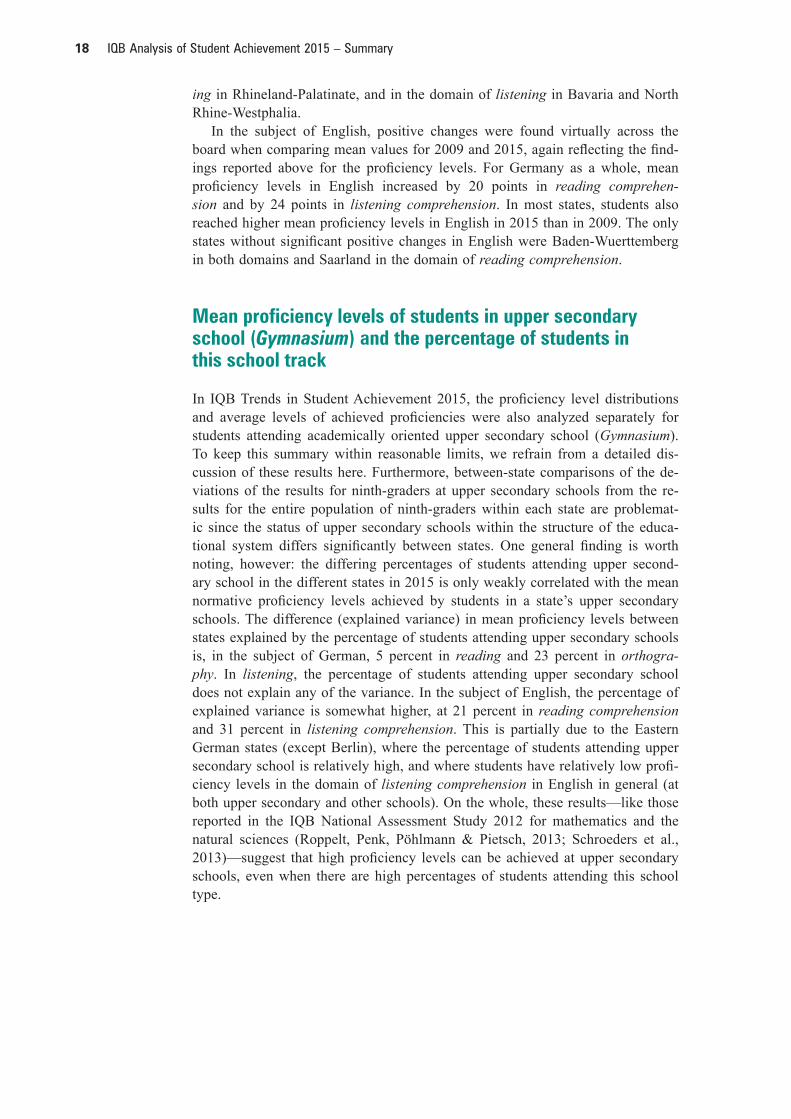
In IQB Trends in Student Achievement 2015, the profi ciency level distributions and average levels of achieved profi ciencies were also analyzed separately for students attending academically oriented upper secondary school (Gymnasium). To keep this summary within reasonable limits, we refrain from a detailed dis-cussion of these results here. Furthermore, between-state comparisons of the de-viations of the results for ninth-graders at upper secondary schools from the re-sults for the entire population of ninth-graders within each state are problemat-ic since the status of upper secondary schools within the structure of the educa-tional system differs signifi cantly between states. One general fi nding is worth noting, however: the differing percentages of students attending upper second-ary school in the different states in 2015 is only weakly correlated with the mean normative profi ciency levels achieved by students in a state’s upper secondary schools. The difference (explained variance) in mean profi ciency levels between states explained by the percentage of students attending upper secondary schools is, in the subject of German, 5 percent in reading and 23 percent in orthogra-phy. In listening, the percentage of students attending upper secondary school does not explain any of the variance. In the subject of English, the percentage of explained variance is somewhat higher, at 21 percent in reading comprehension and 31 percent in listening comprehension. This is partially due to the Eastern German states (except Berlin), where the percentage of students attending upper secondary school is relatively high, and where students have relatively low profi -ciency levels in the domain of listening comprehension in English in general (at both upper secondary and other schools). On the whole, these results—like those reported in the IQB National Assessment Study 2012 for mathematics and the natural sciences (Roppelt, Penk, Pöhlmann & Pietsch, 2013; Schroeders et al., 2013)—suggest that high profi ciency levels can be achieved at upper secondary schools, even when there are high percentages of students attending this school type.
19IQB Analysis of Student Achievement 2015 – Summary
Figure 9: Changes in Mean Proficiency Levels of Ninth-Graders Without Special Needs Between 2009 and 2015
-60 -50 -20 -10 0 10 20 30 40 50 60
Bavaria
Berlin
Brandenburg
Bremen
Hamburg
Hesse
Mecklenburg-
Western Pomerania
Lower Saxony
Rhineland-Palatinate
Saarland
Saxony
Saxony-Anhalt
Schleswig-Holstein
Thuringia
Germany
Baden-Wuerttemberg
Reading in the subject of German
Listening in the subject of German
Orthography in the subject of German
Reading comprehension in the subject of English
Listening comprehension in the subject of English
Note: Hatched bars indicate statistically non-significant differences.
-40 -30
North Rhine-Westphalia
20 IQB Analysis of Student Achievement 2015 – Summary
Gender disparities
Large national and international school achievement studies over the last 15 years have consistently found higher language profi ciency among girls than among boys. Findings along this line have been reported in the subjects of both German and English at both the primary level and at secondary level I. Results also indicate that the gender disparity in favor of girls is greater in productive than in receptive written language skills.
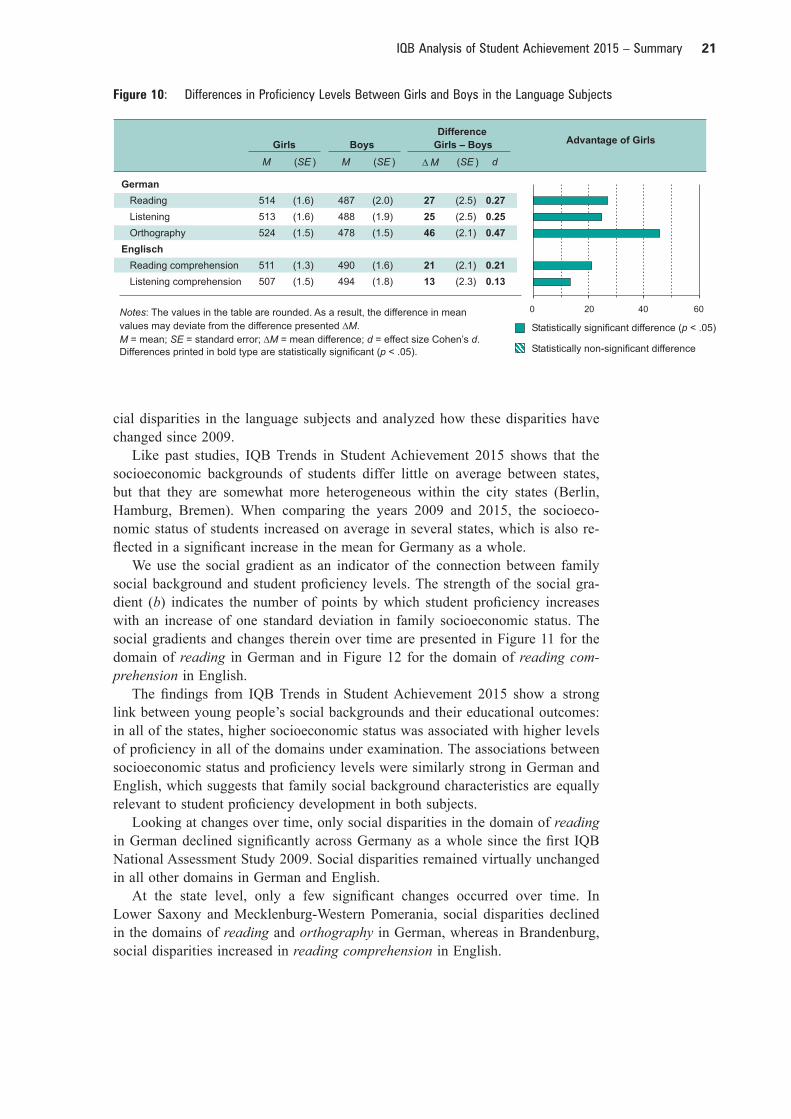
In IQB Trends in Student Achievement 2015, we also found gender disparities favoring girls in the language domains under examination, with somewhat great-er disparities in German than in English. The differences in language profi ciency between girls and boys are presented in Figure 10.
In 2015, girls across Germany had a 27-point advantage over boys in the sub-ject of German in reading, a 25-point advantage in listening, and a 46-point ad-vantage in orthography. In the subject of English, girls scored 21 points higher than boys in reading comprehension and 13 points higher in listening compre-hension. Thus, boys appeared to have a particularly acute need for additional support in the domain of orthography in German.
Along with gender disparities in language competencies, we also studied gen-der disparities in subject interest and subject-specifi c self-concept in IQB Trends in Student Achievement 2015. The gender disparities in these motivational char-acteristics run largely parallel to those in achieved profi ciency levels. In the subject of German, both subject-specifi c self-concept and subject interest were higher among girls than among boys; in the subject of English, the only sub-stantial gender disparity appeared in subject interest. Despite the fact that girls showed higher levels of profi ciency in English than boys, they did not report higher perceptions of their own skills in this subject than boys did.
The profi ciency level distributions show that in 2015, the percentage of girls and boys in the group of young people who achieved at least the normative standards for the MSA certifi cate was close to equal in both subjects and in all of the domains under examination. The group of ninth-graders who did not achieve the minimum standards for the MSA contained a larger percentage of boys, at around 60 percent. A particularly wide gender disparity to the disadvantage of boys was found in German in the domain orthography, at 70 percent.
Also within states, girls performed better than boys in German and English in all of the domains covered in IQB Trends in Student Achievement 2015. In lis-tening comprehension in English, however, the gender disparities were not signif-icant in several states. In North Rhine-Westphalia, the differences in profi ciency between girls and boys in both German and English were consistently the low-est among all German states in all of the domains under examination. It appears that schools in this state are particularly successful in fostering language learning equally in girls and boys.
Social Disparities
Since the publication of the fi rst PISA study, there has been intense public dis-cussion on the question of how profi ciency development is linked to students’ social backgrounds, and how well educational systems are succeeding in reduc-ing this link. IQB Trends in Student Achievement 2015 therefore examined so-
21IQB Analysis of Student Achievement 2015 – Summary
cial disparities in the language subjects and analyzed how these disparities have changed since 2009.
Like past studies, IQB Trends in Student Achievement 2015 shows that the socioeconomic backgrounds of students differ little on average between states, but that they are somewhat more heterogeneous within the city states (Berlin, Hamburg, Bremen). When comparing the years 2009 and 2015, the socioeco-nomic status of students increased on average in several states, which is also re-fl ected in a signifi cant increase in the mean for Germany as a whole.
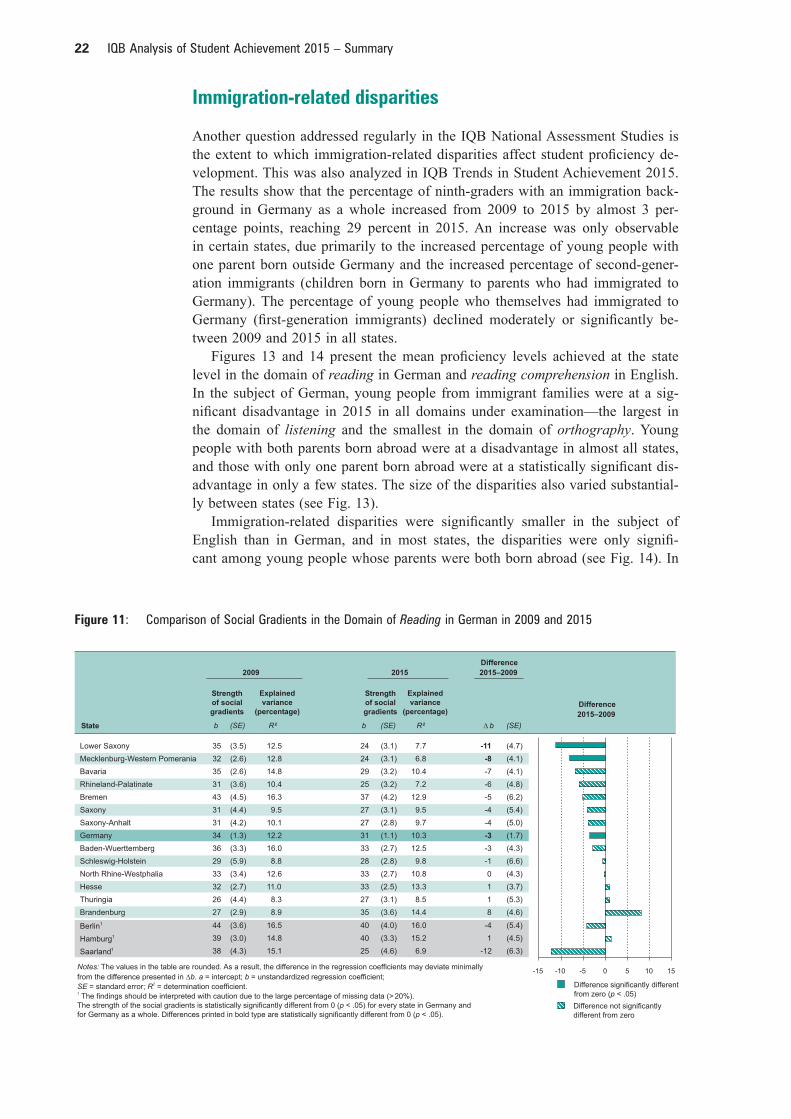
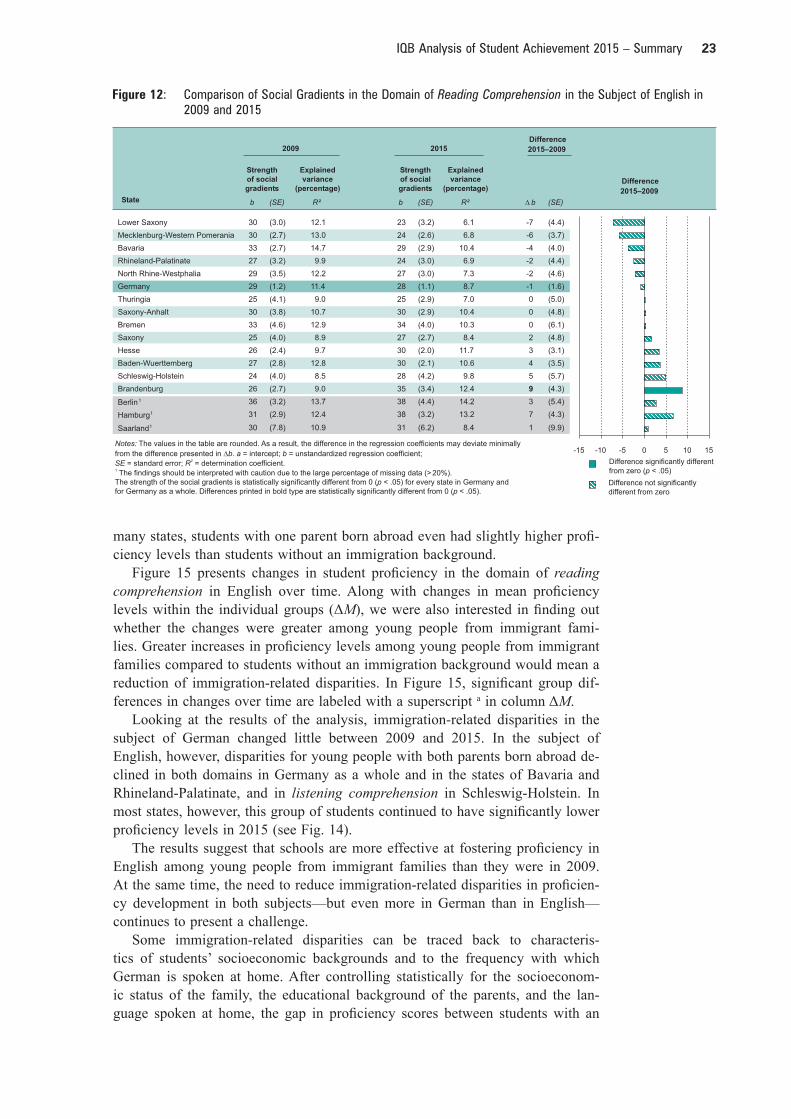
We use the social gradient as an indicator of the connection between family social background and student profi ciency levels. The strength of the social gra-dient (b) indicates the number of points by which student profi ciency increases with an increase of one standard deviation in family socioeconomic status. The social gradients and changes therein over time are presented in Figure 11 for the domain of reading in German and in Figure 12 for the domain of reading com-prehension in English.
The fi ndings from IQB Trends in Student Achievement 2015 show a strong link between young people’s social backgrounds and their educational outcomes: in all of the states, higher socioeconomic status was associated with higher levels of profi ciency in all of the domains under examination. The associations between socioeconomic status and profi ciency levels were similarly strong in German and English, which suggests that family social background characteristics are equally relevant to student profi ciency development in both subjects.
Looking at changes over time, only social disparities in the domain of reading in German declined signifi cantly across Germany as a whole since the fi rst IQB National Assessment Study 2009. Social disparities remained virtually unchanged in all other domains in German and English.
At the state level, only a few signifi cant changes occurred over time. In Lower Saxony and Mecklenburg-Western Pomerania, social disparities declined in the domains of reading and orthography in German, whereas in Brandenburg, social disparities increased in reading comprehension in English.
Figure 10: Differences in Proficiency Levels Between Girls and Boys in the Language Subjects
M (SE ) M (SE ) � M (SE ) d
German
Reading 514 (1.6) 487 (2.0) 27 (2.5) 0.27
Listening 513 (1.6) 488 (1.9) 25 (2.5) 0.25
Orthography 524 (1.5) 478 (1.5) 46 (2.1) 0.47
Englisch
Reading comprehension 511 (1.3) 490 (1.6) 21 (2.1) 0.21
Listening comprehension 507 (1.5) 494 (1.8) 13 (2.3) 0.13
Girls Boys
Difference
Girls – Boys Advantage of Girls
0 20 40 60
Statistically significant difference ( < .05)p
Statistically non-significant difference
Notes
M
M SE M d d
p
: The values in the table are rounded. As a result, the difference in mean
values may deviate from the difference presented .
= mean; = standard error; = mean difference; = effect size Cohen’s .
Differences printed in bold type are statistically significant ( .05).
�
�
<
22 IQB Analysis of Student Achievement 2015 – Summary
Immigration-related disparities
Another question addressed regularly in the IQB National Assessment Studies is the extent to which immigration-related disparities affect student profi ciency de-velopment. This was also analyzed in IQB Trends in Student Achievement 2015. The results show that the percentage of ninth-graders with an immigration back-ground in Germany as a whole increased from 2009 to 2015 by almost 3 per-centage points, reaching 29 percent in 2015. An increase was only observable in certain states, due primarily to the increased percentage of young people with one parent born outside Germany and the increased percentage of second-gener-ation immigrants (children born in Germany to parents who had immigrated to Germany). The percentage of young people who themselves had immigrated to Germany (fi rst-generation immigrants) declined moderately or signifi cantly be-tween 2009 and 2015 in all states.
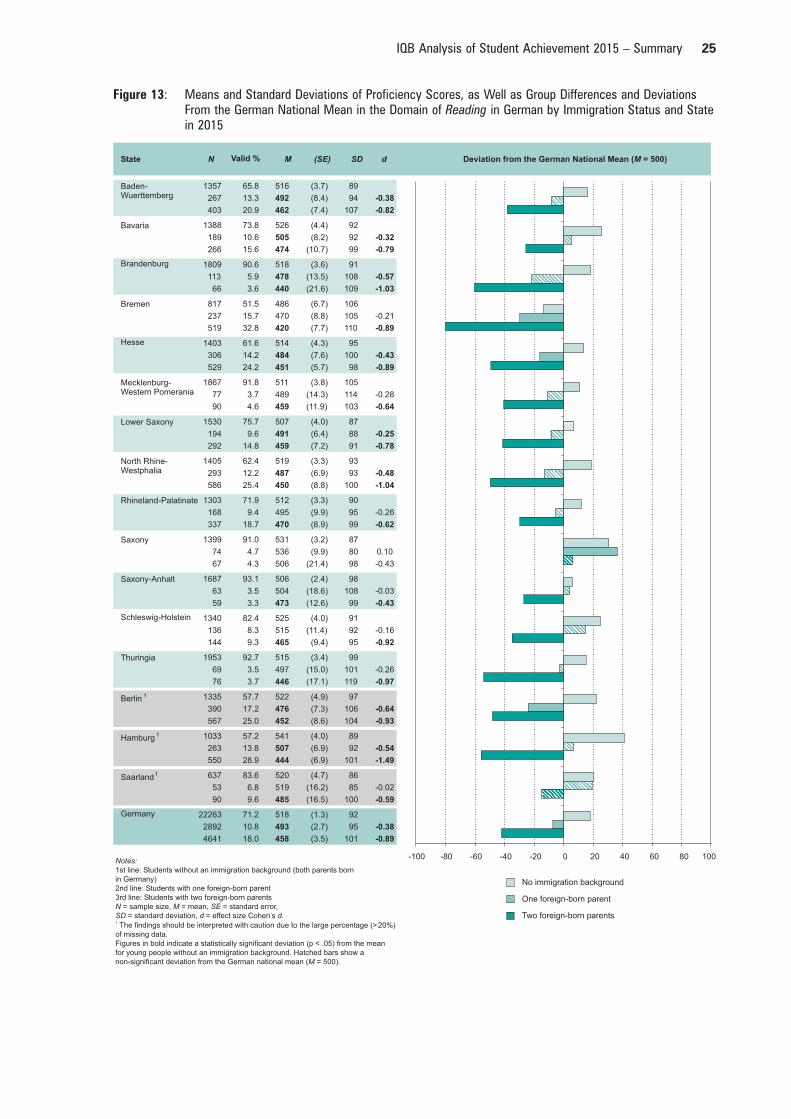
Figures 13 and 14 present the mean profi ciency levels achieved at the state level in the domain of reading in German and reading comprehension in English. In the subject of German, young people from immigrant families were at a sig-nifi cant disadvantage in 2015 in all domains under examination—the largest in the domain of listening and the smallest in the domain of orthography. Young people with both parents born abroad were at a disadvantage in almost all states, and those with only one parent born abroad were at a statistically signifi cant dis-advantage in only a few states. The size of the disparities also varied substantial-ly between states (see Fig. 13).
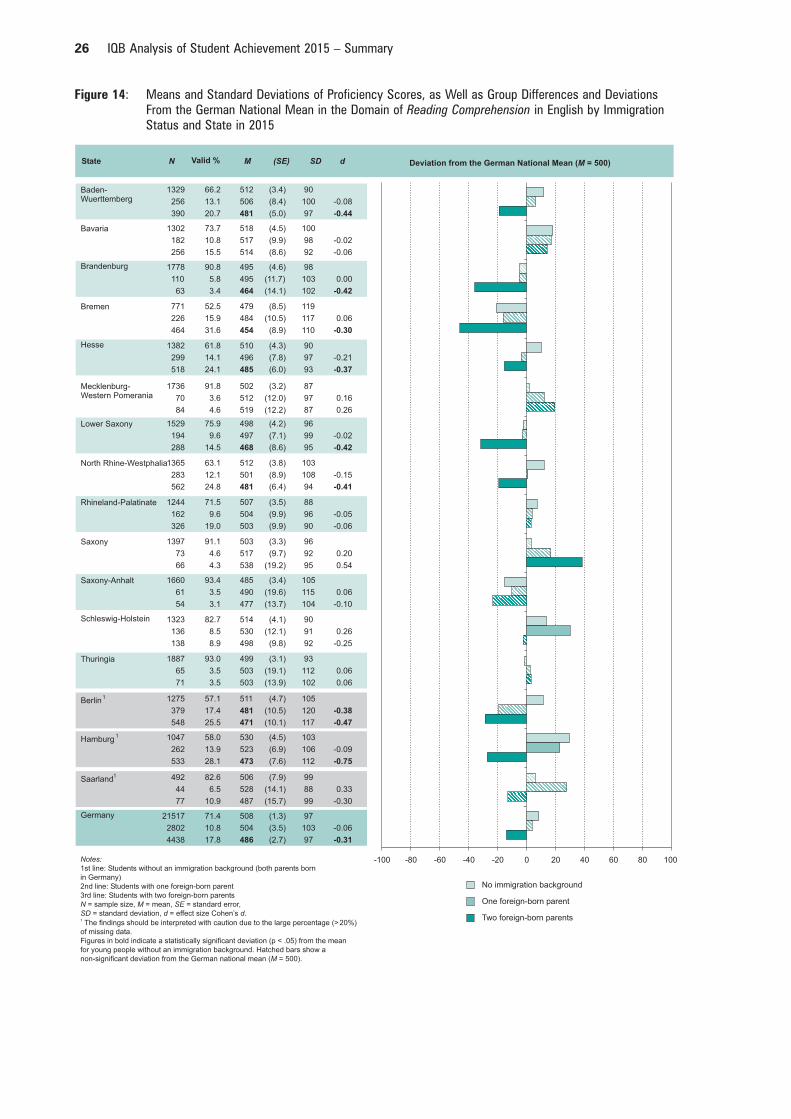
Immigration-related disparities were signifi cantly smaller in the subject of English than in German, and in most states, the disparities were only signifi -cant among young people whose parents were both born abroad (see Fig. 14). In
Figure 11: Comparison of Social Gradients in the Domain of Reading in German in 2009 and 2015
Explained
variance
(percentage)
Explained
variance
(percentage)
b (SE) R² b (SE) R² � b (SE)
Lower Saxony 35 (3.5) 12.5 24 (3.1) 7.7 -11 (4.7)
Mecklenburg-Western Pomerania 32 (2.6) 12.8 24 (3.1) 6.8 -8 (4.1)
Bavaria 35 (2.6) 14.8 29 (3.2) 10.4 -7 (4.1)
Rhineland-Palatinate 31 (3.6) 10.4 25 (3.2) 7.2 -6 (4.8)
Bremen 43 (4.5) 16.3 37 (4.2) 12.9 -5 (6.2)
Saxony 31 (4.4) 9.5 27 (3.1) 9.5 -4 (5.4)
Saxony-Anhalt 31 (4.2) 10.1 27 (2.8) 9.7 -4 (5.0)
Germany 34 (1.3) 12.2 31 (1.1) 10.3 -3 (1.7)
Baden-Wuerttemberg 36 (3.3) 16.0 33 (2.7) 12.5 -3 (4.3)
Schleswig-Holstein 29 (5.9) 8.8 28 (2.8) 9.8 -1 (6.6)
North Rhine-Westphalia 33 (3.4) 12.6 33 (2.7) 10.8 0 (4.3)
Hesse 32 (2.7) 11.0 33 (2.5) 13.3 1 (3.7)
Thuringia 26 (4.4) 8.3 27 (3.1) 8.5 1 (5.3)
Brandenburg 27 (2.9) 8.9 35 (3.6) 14.4 8 (4.6)
Berlin1 44 (3.6) 16.5 40 (4.0) 16.0 -4 (5.4)
Hamburg1 39 (3.0) 14.8 40 (3.3) 15.2 1 (4.5)
Saarland1 38 (4.3) 15.1 25 (4.6) 6.9 -12 (6.3)
Difference
2015–2009
2009 2015
Difference
2015–2009
Strength
of social
gradients
Strength
of social
gradients
-15 -10 -5 0 5 10 15
Difference significantly different
from zero ( < .05)p
Difference not significantly
different from zero
State
Notes:
b a b
SE R
p
p
The values in the table are rounded. As a result, the difference in the regression coefficients may deviate minimally
from the difference presented in . = intercept; = unstandardized regression coefficient;
= standard error; = determination coefficient.
The findings should be interpreted with caution due to the large percentage of missing data (>20%).
The strength of the social gradients is statistically significantly different from 0 ( < .05) for every state in Germany and
for Germany as a whole. Differences printed in bold type are statistically significantly different from 0 ( < .05).
�2
1
23IQB Analysis of Student Achievement 2015 – Summary
Figure 12: Comparison of Social Gradients in the Domain of Reading Comprehension in the Subject of English in 2009 and 2015
b (SE) R² b (SE) R² � b (SE)
Lower Saxony 30 (3.0) 12.1 23 (3.2) 6.1 -7 (4.4)
Mecklenburg-Western Pomerania 30 (2.7) 13.0 24 (2.6) 6.8 -6 (3.7)
Bavaria 33 (2.7) 14.7 29 (2.9) 10.4 -4 (4.0)
Rhineland-Palatinate 27 (3.2) 9.9 24 (3.0) 6.9 -2 (4.4)
North Rhine-Westphalia 29 (3.5) 12.2 27 (3.0) 7.3 -2 (4.6)
Germany 29 (1.2) 11.4 28 (1.1) 8.7 -1 (1.6)
Thuringia 25 (4.1) 9.0 25 (2.9) 7.0 0 (5.0)
Saxony-Anhalt 30 (3.8) 10.7 30 (2.9) 10.4 0 (4.8)
Bremen 33 (4.6) 12.9 34 (4.0) 10.3 0 (6.1)
Saxony 25 (4.0) 8.9 27 (2.7) 8.4 2 (4.8)
Hesse 26 (2.4) 9.7 30 (2.0) 11.7 3 (3.1)
Baden-Wuerttemberg 27 (2.8) 12.8 30 (2.1) 10.6 4 (3.5)
Schleswig-Holstein 24 (4.0) 8.5 28 (4.2) 9.8 5 (5.7)
Brandenburg 26 (2.7) 9.0 35 (3.4) 12.4 9 (4.3)
Berlin1 36 (3.2) 13.7 38 (4.4) 14.2 3 (5.4)
Hamburg1 31 (2.9) 12.4 38 (3.2) 13.2 7 (4.3)
Saarland1 30 (7.8) 10.9 31 (6.2) 8.4 1 (9.9)
2009 2015
-15 -10 -5 0 5 10 15
Explained
variance
(percentage)
Explained
variance
(percentage)Difference
2015–2009
Difference
2015–2009
Strength
of social
gradients
Strength
of social
gradients
Difference significantly different
from zero ( < .05)p
Difference not significantly
different from zero
Notes:
b a b
SE R
p
p
The values in the table are rounded. As a result, the difference in the regression coefficients may deviate minimally
from the difference presented in . = intercept; = unstandardized regression coefficient;
= standard error; = determination coefficient.
The findings should be interpreted with caution due to the large percentage of missing data ( 20%).
The strength of the social gradients is statistically significantly different from 0 ( < .05) for every state in Germany and
for Germany as a whole. Differences printed in bold type are statistically significantly different from 0 ( < .05).
�2
1>
State
many states, students with one parent born abroad even had slightly higher profi -ciency levels than students without an immigration background.
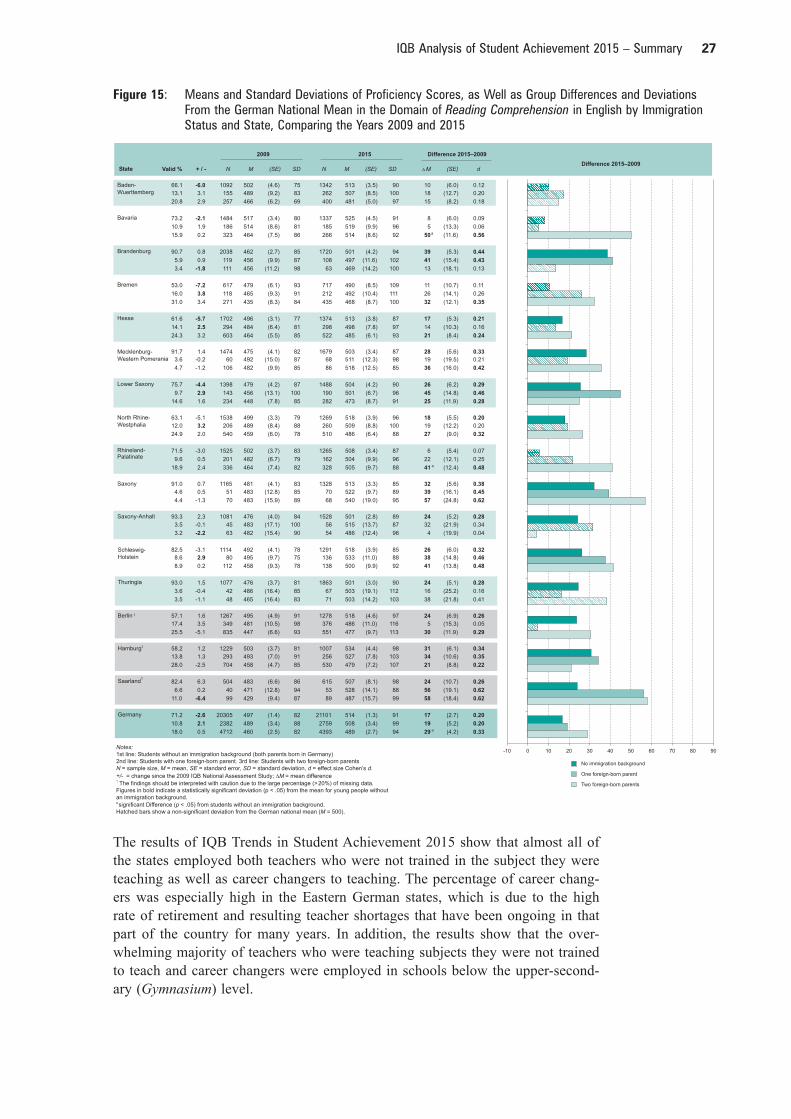
Figure 15 presents changes in student profi ciency in the domain of reading comprehension in English over time. Along with changes in mean profi ciency levels within the individual groups (ΔM), we were also interested in fi nding out whether the changes were greater among young people from immigrant fami-lies. Greater increases in profi ciency levels among young people from immigrant families compared to students without an immigration background would mean a reduction of immigration-related disparities. In Figure 15, signifi cant group dif-ferences in changes over time are labeled with a superscript a in column ΔM.
Looking at the results of the analysis, immigration-related disparities in the subject of German changed little between 2009 and 2015. In the subject of English, however, disparities for young people with both parents born abroad de-clined in both domains in Germany as a whole and in the states of Bavaria and Rhineland-Palatinate, and in listening comprehension in Schleswig-Holstein. In most states, however, this group of students continued to have signifi cantly lower profi ciency levels in 2015 (see Fig. 14).
The results suggest that schools are more effective at fostering profi ciency in English among young people from immigrant families than they were in 2009. At the same time, the need to reduce immigration-related disparities in profi cien-cy development in both subjects—but even more in German than in English—continues to present a challenge.
Some immigration-related disparities can be traced back to characteris-tics of students’ socioeconomic backgrounds and to the frequency with which German is spoken at home. After controlling statistically for the socioeconom-ic status of the family, the educational background of the parents, and the lan-guage spoken at home, the gap in profi ciency scores between students with an
24 IQB Analysis of Student Achievement 2015 – Summary
immigration background and those without is reduced substantially, but for some subgroups, substantial disparities remain. The fi nding that the language spoken at home is associated with students’ profi ciency levels confi rms the results of past studies: students who never speak German at home achieve on average low-er profi ciency scores than students who always or almost always speak German at home. Signifi cantly lower profi ciency levels among the much larger group of young people from immigrant families who sometimes speak German at home were only identifi ed for the subject of German, but not for the subject of English. Thus, schools appear to have more success in fostering the learning potential of students from immigrant families in English than in German.
In addition to analyzing disparities in profi ciency levels, IQB Trends in Student Achievement 2015 also investigated—for the fi rst time in an IQB study—the extent to which young people from immigrant families have a sim-ilar sense of belonging at school to young people without an immigration back-ground. The aim of this was to gain indications of students’ social integration. The results show a strong sense of belonging among students in all groups ex-amined in the study. Young people with an immigration background differ little in this respect from those without an immigration background. Both in Germany as a whole and in some individual states, students with both parents born abroad have a signifi cantly lower sense of belonging than students without an immi-gration background, but the differences are very small. Nevertheless, educational monitoring studies should continue to examine this aspect of social integration of young people from immigrant families.
Education and Further Professional Development of Teachers as a Prerequisite for Teaching and Learning Processes
The IQB’s studies on educational monitoring contain additional chapters devoted to the key prerequisites for teaching and learning processes. Due to the increased complexity resulting from the analysis of trends over time, this fi rst IQB trend report contains just one additional chapter. This chapter deals with the charac-teristics of teachers in the languages of German and English and rounds out the series of corresponding analyses in the IQB National Assessment Study 2011 on teachers of German and mathematics at the primary level and the IQB National Assessment Study 2012 on teachers of mathematics, biology, chemistry, and physics at secondary level I.
In IQB Trends in Student Achievement 2015, teachers of the students test-ed were asked about their instructional practices, their education, and their fur-ther professional development as teachers. A total of 2,988 teachers of German and English from 16 states took part in the survey. Based on their responses, we were able to conduct a detailed examination of the association between teach-er characteristics and student profi ciency levels in each state. Like previous IQB National Assessment Studies, IQB Trends in Student Achievement 2015 analyzed the subject-specifi c teaching qualifi cations of teachers as well as their participa-tion in further professional training. For the fi rst time in an IQB study, we also studied the percentage of teachers who had made a career change to the teaching profession.
25IQB Analysis of Student Achievement 2015 – Summary
Figure 13: Means and Standard Deviations of Proficiency Scores, as Well as Group Differences and Deviations From the German National Mean in the Domain of Reading in German by Immigration Status and State in 2015
State N Valid % M (SE) SD d
1357 65.8 516 (3.7) 89
267 13.3 492 (8.4) 94 -0.38
403 20.9 462 (7.4) 107 -0.82
Bavaria 1388 73.8 526 (4.4) 92
189 10.6 505 (8.2) 92 -0.32
266 15.6 474 (10.7) 99 -0.79
Brandenburg 1809 90.6 518 (3.6) 91
113 5.9 478 (13.5) 108 -0.57
66 3.6 440 (21.6) 109 -1.03
Bremen 817 51.5 486 (6.7) 106
237 15.7 470 (8.8) 105 -0.21
519 32.8 420 (7.7) 110 -0.89
Hesse 1403 61.6 514 (4.3) 95
306 14.2 484 (7.6) 100 -0.43
529 24.2 451 (5.7) 98 -0.89
1867 91.8 511 (3.8) 105
77 3.7 489 (14.3) 114 -0.28
90 4.6 459 (11.9) 103 -0.64
Lower Saxony 1530 75.7 507 (4.0) 87
194 9.6 491 (6.4) 88 -0.25
292 14.8 459 (7.2) 91 -0.78
1405 62.4 519 (3.3) 93
293 12.2 487 (6.9) 93 -0.48
586 25.4 450 (8.8) 100 -1.04
Rhineland-Palatinate 1303 71.9 512 (3.3) 90
168 9.4 495 (9.9) 95 -0.26
337 18.7 470 (8.9) 99 -0.62
Saxony 1399 91.0 531 (3.2) 87
74 4.7 536 (9.9) 80 0.10
67 4.3 506 (21.4) 98 -0.43
Saxony-Anhalt 1687 93.1 506 (2.4) 98
63 3.5 504 (18.6) 108 -0.03
59 3.3 473 (12.6) 99 -0.43
Schleswig-Holstein 1340 82.4 525 (4.0) 91
136 8.3 515 (11.4) 92 -0.16
144 9.3 465 (9.4) 95 -0.92
Thuringia 1953 92.7 515 (3.4) 99
69 3.5 497 (15.0) 101 -0.26
76 3.7 446 (17.1) 119 -0.97
Berlin 1 1335 57.7 522 (4.9) 97
390 17.2 476 (7.3) 106 -0.64
567 25.0 452 (8.6) 104 -0.93
Hamburg 1 1033 57.2 541 (4.0) 89
263 13.8 507 (6.9) 92 -0.54
550 28.9 444 (6.9) 101 -1.49
Saarland1 637 83.6 520 (4.7) 86
53 6.8 519 (16.2) 85 -0.02
90 9.6 485 (16.5) 100 -0.59
Germany 22263 71.2 518 (1.3) 92
2892 10.8 493 (2.7) 95 -0.38
4641 18.0 458 (3.5) 101 -0.89
Deviation from the German National Mean ( = 500)M
Baden-Wuerttemberg
Mecklenburg-Western Pomerania
North Rhine-Westphalia
-100 -80 -60 -40 -20 0 20 40 60
No immigration background
One foreign-born parent
Two foreign-born parents
80 100Notes:
N M SE
SD d d
M
1st line: Students without an immigration background (both parents born
in Germany)
2nd line: Students with one foreign-born parent
3rd line: Students with two foreign-born parents
= sample size, = mean, = standard error,
= standard deviation, = effect size Cohen’s .
The findings should be interpreted with caution due to the large percentage (>20%)
of missing data.
Figures in bold indicate a statistically significant deviation (p < .05) from the mean
for young people without an immigration background. Hatched bars show a
non-significant deviation from the German national mean ( = 500).
1
26 IQB Analysis of Student Achievement 2015 – Summary
Figure 14: Means and Standard Deviations of Proficiency Scores, as Well as Group Differences and Deviations From the German National Mean in the Domain of Reading Comprehension in English by Immigration Status and State in 2015
Baden-Wuerttemberg
1329 66.2 512 (3.4) 90
256 13.1 506 (8.4) 100 -0.08
390 20.7 481 (5.0) 97 -0.44
Bavaria 1302 73.7 518 (4.5) 100
182 10.8 517 (9.9) 98 -0.02
256 15.5 514 (8.6) 92 -0.06
Brandenburg 1778 90.8 495 (4.6) 98
110 5.8 495 (11.7) 103 0.00
63 3.4 464 (14.1) 102 -0.42
Bremen 771 52.5 479 (8.5) 119
226 15.9 484 (10.5) 117 0.06
464 31.6 454 (8.9) 110 -0.30
Hesse 1382 61.8 510 (4.3) 90
299 14.1 496 (7.8) 97 -0.21
518 24.1 485 (6.0) 93 -0.37
Mecklenburg-Western Pomerania
1736 91.8 502 (3.2) 87
70 3.6 512 (12.0) 97 0.16
84 4.6 519 (12.2) 87 0.26
Lower Saxony 1529 75.9 498 (4.2) 96
194 9.6 497 (7.1) 99 -0.02
288 14.5 468 (8.6) 95 -0.42
North Rhine-Westphalia1365 63.1 512 (3.8) 103
283 12.1 501 (8.9) 108 -0.15
562 24.8 481 (6.4) 94 -0.41
Rhineland-Palatinate 1244 71.5 507 (3.5) 88
162 9.6 504 (9.9) 96 -0.05
326 19.0 503 (9.9) 90 -0.06
Saxony 1397 91.1 503 (3.3) 96
73 4.6 517 (9.7) 92 0.20
66 4.3 538 (19.2) 95 0.54
Saxony-Anhalt 1660 93.4 485 (3.4) 105
61 3.5 490 (19.6) 115 0.06
54 3.1 477 (13.7) 104 -0.10
Schleswig-Holstein 1323 82.7 514 (4.1) 90
136 8.5 530 (12.1) 91 0.26
138 8.9 498 (9.8) 92 -0.25
Thuringia 1887 93.0 499 (3.1) 93
65 3.5 503 (19.1) 112 0.06
71 3.5 503 (13.9) 102 0.06
Berlin1 1275 57.1 511 (4.7) 105
379 17.4 481 (10.5) 120 -0.38
548 25.5 471 (10.1) 117 -0.47
Hamburg1 1047 58.0 530 (4.5) 103
262 13.9 523 (6.9) 106 -0.09
533 28.1 473 (7.6) 112 -0.75
Saarland1 492 82.6 506 (7.9) 99
44 6.5 528 (14.1) 88 0.33
77 10.9 487 (15.7) 99 -0.30
Germany 21517 71.4 508 (1.3) 97
2802 10.8 504 (3.5) 103 -0.06
4438 17.8 486 (2.7) 97 -0.31
-100 -80 -60 -40 -20 0 20 40 100
State N Valid % M (SE) SD d
No immigration background
One foreign-born parent
Two foreign-born parents
Deviation from the German National Mean ( = 500)M
60 80Notes:
N M SE
SD d d
M
1st line: Students without an immigration background (both parents born
in Germany)
2nd line: Students with one foreign-born parent
3rd line: Students with two foreign-born parents
= sample size, = mean, = standard error,
= standard deviation, = effect size Cohen’s .
The findings should be interpreted with caution due to the large percentage (>20%)
of missing data.
Figures in bold indicate a statistically significant deviation (p < .05) from the mean
for young people without an immigration background. Hatched bars show a
non-significant deviation from the German national mean ( = 500).
1
27IQB Analysis of Student Achievement 2015 – Summary
Baden-
Wuerttemberg
66.1 -6.0 1092 502 (4.6) 75 1342 513 (3.5) 90 10 (6.0) 0.12
13.1 3.1 155 489 (9.2) 83 262 507 (8.5) 100 18 (12.7) 0.20
20.8 2.9 257 466 (6.2) 69 400 481 (5.0) 97 15 (8.2) 0.18
Bavaria 73.2 -2.1 1484 517 (3.4) 80 1337 525 (4.5) 91 8 (6.0) 0.09
10.9 1.9 186 514 (8.6) 81 185 519 (9.9) 96 5 (13.3) 0.06
15.9 0.2 323 464 (7.5) 86 266 514 (8.6) 92 50a (11.6) 0.56
Brandenburg 90.7 0.8 2038 462 (2.7) 85 1720 501 (4.2) 94 39 (5.3) 0.44
5.9 0.9 119 456 (9.9) 87 108 497 (11.6) 102 41 (15.4) 0.43
3.4 -1.8 111 456 (11.2) 98 63 469 (14.2) 100 13 (18.1) 0.13
Bremen 53.0 -7.2 617 479 (6.1) 93 717 490 (8.5) 109 11 (10.7) 0.11
16.0 3.8 118 465 (9.3) 91 212 492 (10.4) 111 26 (14.1) 0.26
31.0 3.4 271 435 (8.3) 84 435 468 (8.7) 100 32 (12.1) 0.35
Hesse 61.6 -5.7 1702 496 (3.1) 77 1374 513 (3.8) 87 17 (5.3) 0.21
14.1 2.5 294 484 (6.4) 81 298 498 (7.8) 97 14 (10.3) 0.16
24.3 3.2 603 464 (5.5) 85 522 485 (6.1) 93 21 (8.4) 0.24
Mecklenburg-
Western Pomerania
91.7 1.4 1474 475 (4.1) 82 1679 503 (3.4) 87 28 (5.6) 0.33
3.6 -0.2 60 492 (15.0) 87 68 511 (12.3) 98 19 (19.5) 0.21
4.7 -1.2 106 482 (9.9) 85 86 518 (12.5) 85 36 (16.0) 0.42
Lower Saxony 75.7 -4.4 1398 479 (4.2) 87 1488 504 (4.2) 90 26 (6.2) 0.29
9.7 2.9 143 456 (13.1) 100 190 501 (6.7) 96 45 (14.8) 0.46
14.6 1.6 234 448 (7.8) 85 282 473 (8.7) 91 25 (11.9) 0.28
North Rhine-
Westphalia
63.1 -5.1 1538 499 (3.3) 79 1269 518 (3.9) 96 18 (5.5) 0.20
12.0 3.2 206 489 (8.4) 88 260 509 (8.8) 100 19 (12.2) 0.20
24.9 2.0 540 459 (6.0) 78 510 486 (6.4) 88 27 (9.0) 0.32
Rhineland-Palatinate
71.5 -3.0 1525 502 (3.7) 83 1265 508 (3.4) 87 6 (5.4) 0.07
9.6 0.5 201 482 (6.7) 79 162 504 (9.9) 96 22 (12.1) 0.25
18.9 2.4 336 464 (7.4) 82 328 505 (9.7) 88 41 a (12.4) 0.48
Saxony 91.0 0.7 1165 481 (4.1) 83 1328 513 (3.3) 85 32 (5.6) 0.38
4.6 0.5 51 483 (12.8) 85 70 522 (9.7) 89 39 (16.1) 0.45
4.4 -1.3 70 483 (15.9) 89 68 540 (19.0) 95 57 (24.8) 0.62
Saxony-Anhalt 93.3 2.3 1081 476 (4.0) 84 1528 501 (2.8) 89 24 (5.2) 0.28
3.5 -0.1 45 483 (17.1) 100 56 515 (13.7) 87 32 (21.9) 0.34
3.2 -2.2 63 482 (15.4) 90 54 486 (12.4) 96 4 (19.9) 0.04
Schleswig-
Holstein
82.5 -3.1 1114 492 (4.1) 78 1291 518 (3.9) 85 26 (6.0) 0.32
8.6 2.9 80 495 (9.7) 75 136 533 (11.0) 88 38 (14.8) 0.46
8.9 0.2 112 458 (9.3) 78 138 500 (9.9) 92 41 (13.8) 0.48
Thuringia 93.0 1.5 1077 476 (3.7) 81 1863 501 (3.0) 90 24 (5.1) 0.28
3.6 -0.4 42 486 (16.4) 85 67 503 (19.1) 112 16 (25.2) 0.16
3.5 -1.1 48 465 (16.4) 83 71 503 (14.2) 103 38 (21.8) 0.41
Berlin 57.1 1.6 1267 495 (4.9) 91 1278 518 (4.6) 97 24 (6.9) 0.26
17.4 3.5 349 481 (10.5) 98 376 486 (11.0) 116 5 (15.3) 0.05
25.5 -5.1 835 447 (6.6) 93 551 477 (9.7) 113 30 (11.9) 0.29
Hamburg 58.2 1.2 1229 503 (3.7) 81 1007 534 (4.4) 98 31 (6.1) 0.34
13.8 1.3 293 493 (7.0) 91 256 527 (7.8) 103 34 (10.6) 0.35
28.0 -2.5 704 458 (4.7) 85 530 479 (7.2) 107 21 (8.8) 0.22
Saarland 82.4 6.3 504 483 (6.6) 86 615 507 (8.1) 98 24 (10.7) 0.26
6.6 0.2 40 471 (12.8) 94 53 528 (14.1) 88 56 (19.1) 0.62
11.0 -6.4 99 429 (9.4) 87 89 487 (15.7) 99 58 (18.4) 0.62
Germany 71.2 -2.6 20305 497 (1.4) 82 21101 514 (1.3) 91 17 (2.7) 0.20
10.8 2.1 2382 489 (3.4) 88 2759 508 (3.4) 99 19 (5.2) 0.20
18.0 0.5 4712 460 (2.5) 82 4393 489 (2.7) 94 29 a (4.2) 0.33
1
1
1
Valid % + / - N M (SE) SD N M (SE) SD (SE) d� MDifference 2015–2009
-10 0 10 20 30 40 50 60 70 80 90
No immigration background
One foreign-born parent
Two foreign-born parents
State
2009 2015 Difference 2015–2009
Notes:
N M SE SD d d
M
1st line: Students without an immigration background (both parents born in Germany)
2nd line: Students with one foreign-born parent. 3rd line: Students with two foreign-born parents
= sample size, = mean, = standard error, = standard deviation, = effect size Cohen’s .
The findings should be interpreted with caution due to the large percentage (>20%) of missing data.
Figures in bold indicate a statistically significant deviation (p < .05) from the mean for young people without
an immigration background.
Hatched bars show a non-significant deviation from the German national mean ( = 500).
+/-
p
= ; = mean difference
significant Difference ( < .05) .
�M1
a
change since the 2009 IQB National Assessment Study
from students without an immigration background
Figure 15: Means and Standard Deviations of Proficiency Scores, as Well as Group Differences and Deviations From the German National Mean in the Domain of Reading Comprehension in English by Immigration Status and State, Comparing the Years 2009 and 2015
The results of IQB Trends in Student Achievement 2015 show that almost all of the states employed both teachers who were not trained in the subject they were teaching as well as career changers to teaching. The percentage of career chang-ers was especially high in the Eastern German states, which is due to the high rate of retirement and resulting teacher shortages that have been ongoing in that part of the country for many years. In addition, the results show that the over-whelming majority of teachers who were teaching subjects they were not trained to teach and career changers were employed in schools below the upper-second-ary (Gymnasium) level.
28 IQB Analysis of Student Achievement 2015 – Summary
With regard to teachers’ participation in further professional development, the analysis shows that three out of four teachers had taken part in at least one train-ing program within the previous two years. Participation in professional develop-ment varied signifi cantly, however, between states. Breaking down the training programs attended further by the content of training, we see that teachers pri-marily attended programs focused on specifi c subjects or programs providing didactic training in specifi c subjects. Teachers attended programs dealing with pedagogical themes, school administration, and self-management much less fre-quently.
In addition to teachers’ participation in further professional development, IQB Trends in Student Achievement 2015 also surveyed teachers on the subjective-ly perceived need for further professional development. The results show that teachers are mainly interested in training programs dealing with the challenges of diverse student achievement levels in the classroom, issues of inclusion, and methods of providing support to weaker students.
Moreover, IQB Trends in Student Achievement 2015 also studied wheth-er teachers’ qualifi cations and participation in further professional development show an association with the profi ciency levels of the students they teach. In ad-dition, we checked whether the pattern of fi ndings changes when taking class composition into account (that is, the mix of students in the class, for instance, students from different socioeconomic backgrounds). The results show that stu-dents of teachers who were not trained in the subject they were teaching achieve lower levels of profi ciency on average in both German and English even after statistical control for class composition. In some domains, the lag in profi ciency among students at non-upper secondary schools is particularly large.
Following the IQB National Assessment Study 2011, which identifi ed nega-tive associations between being taught by teachers who were not trained in the subject they were teaching and the profi ciency levels of students, and the IQB National Assessment Study 2012, which identifi ed similar negative associations at secondary level I in the subject of mathematics, fi ndings from the present re-port, IQB Trends in Student Achievement 2015, show that these associations also exist in the language subjects at secondary level I.
The pattern of fi ndings in IQB Trends in Student Achievement 2015 on career changers to teaching is less clear. Here, we can only identify a gap in profi ciency among students of career changers in the subject of English when class compo-sition is also taken into account. Future research should analyze the development of student profi ciency when taught by career changers in more detail.
29IQB Analysis of Student Achievement 2015 – Summary
Conclusions
IQB Trends in Student Achievement 2015 is intended to provide the states with important insights into the outcomes of educational processes in state school sys-tems in relation to the Standing Conference’s educational standards. By covering a variety of subjects and domains of profi ciency; offering a comprehensive analy-sis of current profi ciency level distributions, and social, gender-specifi c, and im-migration-specifi c disparities; and above all by describing changes in the various indicators over time, this study presents a differentiated picture for each German state that cannot be reduced to simple messages. To be able to draw robust con-clusions from the results of the IQB Trends in Student Achievement 2015 re-quires detailed analysis of the pattern of fi ndings in each state and an exami-nation of these results within the larger context of that state’s educational sys-tem. Together with the results of the IQB National Assessment Study 2011 in the subjects of German and mathematics at the primary level and the IQB National Assessment Study 2012 in the subjects of mathematics, biology, chemistry, and physics,5 the results of the present trend report can be used to identify strengths and weaknesses in each state and offer important points of orientation for im-provements that are still needed.
IQB Trends in Student Achievement 2015 marks the beginning of the sec-ond cycle of national educational monitoring based on the Standing Conference’s educational standards. Through the analysis of changes in student outcomes over time, the IQB trend reports are now capable of achieving the Standing Conference’s second key goal of monitoring developments in educational sys-tems at the state level on an ongoing basis. The analysis will continue with IQB Trends in Student Achievement 2016, which will again study student profi cien-cy at the primary level in the subjects of German and mathematics, fi ve years af-ter the IQB National Assessment Study 2011. The publication of that report, IQB Trends in Student Achievement 2016, is planned for fall 2017. The third IQB Trends in Student Achievement 2018 will analyze ninth-graders’ profi ciency in mathematics and the natural sciences for the second time since the IQB National Assessment Study 2012, and will conclude the second cycle of national educa-tional monitoring.
5 Figures comparing state mean profi ciency levels from past National Assessment Studies with the results of the fi rst IQB National Assessment of Educational Trends can be found as supplementary material on the IQB website (see Fig. 12.1web to Fig. 12.7web).
30 IQB Analysis of Student Achievement 2015 – Summary
References
Böhme, K., Leucht, M., Schipolowski, S., Porsch, R., Knigge, M. & Köller, O. (2010). Anlage und Durchfü hrung des Ländervergleichs. In O. Köller, M. Knigge & B. Tesch (Eds), Sprachliche Kompetenzen im Ländervergleich (pp. 65–85). Mü nster: Waxmann.
Heine, J.-H., Sälzer, C., Borchert, L., Sibberns, H. & Mang, J. (2013). Technische Grundlagen des fü nften internationalen Vergleichs. In M. Prenzel, C. Sälzer, E. Klieme & O. Köller (Eds), PISA 2012. Fortschritte und Herausforderungen in Deutschland (pp. 309–346). Mü nster: Waxmann.
KMK (2004a) = Sekretariat der Ständigen Konferenz der Kultusminister der Länder der Bundesrepublik Deutschland. (2004a). Bildungsstandards fü r die erste Fremdsprache (Englisch/Französisch) fü r den Mittleren Schulabschluss. Beschluss vom 4.12.2003. Mü nchen: Luchterhand.
KMK (2004b) = Sekretariat der Ständigen Konferenz der Kultusminister der Länder in der Bundesrepublik Deutschland (2004b). Bildungsstandards im Fach Deutsch fü r den Mittleren Schulabschluss. Beschluss vom 4.12.2003. Mü nchen: Luchterhand.
KMK (2004c) = Sekretariat der Ständigen Konferenz der Kultusminister der Länder in der Bundesrepublik Deutschland. (2004c). Bildungsstandards im Fach Mathematik fü r den Mittleren Schulabschluss. Beschluss vom 4.12.2003. Mü nchen: Luchterhand.
KMK (2005a) = Sekretariat der Ständigen Konferenz der Kultusminister der Länder der Bundesrepublik Deutschland. (2005a). Bildungsstandards fü r die erste Fremdsprache (Englisch/Französisch) fü r den Hauptschulabschluss. Beschluss vom 15.10.2004. Mü nchen: Luchterhand.
KMK (2005b) = Sekretariat der Ständigen Konferenz der Kultusminister der Länder in der Bundesrepublik Deutschland. (2005b). Bildungsstandards im Fach Biologie fü r den Mittleren Schulabschluss. Beschluss vom 16.12.2004. Mü nchen: Luchterhand.
KMK (2005c) = Sekretariat der Ständigen Konferenz der Kultusminister der Länder in der Bundesrepublik Deutschland. (2005c). Bildungsstandards im Fach Chemie fü r den Mittleren Schulabschluss. Beschluss vom 16.12.2004. Mü nchen: Luchterhand.
KMK (2005d) = Sekretariat der Ständigen Konferenz der Kultusminister der Länder in der Bundesrepublik Deutschland. (2005d). Bildungsstandards im Fach Deutsch fü r den Primarbereich. Beschluss vom 15.10.2004. Mü nchen: Luchterhand.
KMK (2005e) = Sekretariat der Ständigen Konferenz der Kultusminister der Länder in der Bundesrepublik Deutschland (2005e). Bildungsstandards im Fach Deutsch fü r den Hauptschulabschluss. Beschluss vom 15.10.2004. Mü nchen: Luchterhand.
KMK (2005f) = Sekretariat der Ständigen Konferenz der Kultusminister der Länder in der Bundesrepublik Deutschland. (2005f). Bildungsstandards im Fach Mathematik fü r den Hauptschulabschluss. Beschluss vom 15.10.2004. Mü nchen: Luchterhand.
KMK (2005g) = Sekretariat der Ständigen Konferenz der Kultusminister der Länder in der Bundesrepublik Deutschland. (2005g). Bildungsstandards im Fach Mathematik fü r den Primarbereich. Beschluss vom 15.10.2004. Mü nchen: Luchterhand.
KMK (2005h) = Sekretariat der Ständigen Konferenz der Kultusminister der Länder in der Bundesrepublik Deutschland. (2005h). Bildungsstandards im Fach Physik fü r den Mittleren Schulabschluss. Beschluss vom 16.12.2004. Mü nchen: Luchterhand.
KMK (2006) = Sekretariat der Ständigen Konferenz der Kultusminister der Länder in der Bundesrepublik Deutschland. (2006). Gesamtstrategie der Kultusministerkonferenz zum Bildungsmonitoring. Beschluss der Kultusministerkonferenz vom 2.6.2006. Accessed on 15 August 2016 at http://www.kmk.org/fi leadmin/Dateien/veroeffentli-chungen_beschluesse/2006/2006_08_01-Gesamtstrategie-Bildungsmonitoring.pdf
KMK (2015) = Sekretariat der Ständigen Konferenz der Kultusminister der Länder in der Bundesrepublik Deutschland. (2015). Gesamtstrategie der Kultusministerkonferenz zum Bildungsmonitoring. Beschluss der 350. Kultusministerkonferenz vom 11.6.2015. Accessed on 15 August 2016 at https://www.kmk.org/fi leadmin/Dateien/veroeffentli-chungen_beschluesse/2015/2015_06_11-Gesamtstrategie-Bildungsmonitoring.pdf
Köller, O., Knigge, M. & Tesch, B. (Eds). (2010). Sprachliche Kompetenzen im Ländervergleich. Mü nster: Waxmann.
Pant, H. A., Stanat, P., Schroeders, U., Roppelt, A., Siegle, T. & Pöhlmann, C. (Eds). (2013). IQB-Ländervergleich 2012. Mathematische und naturwissenschaftliche Kompetenzen am Ende der Sekundarstufe I. Mü nster: Waxmann.
Roppelt, A., Penk, C., Pöhlmann, C. & Pietsch, E. (2013). Der Ländervergleich im Fach Mathematik. In H. A. Pant, P. Stanat, U. Schroeders, A. Roppelt, T. Siegle & C.
31IQB Analysis of Student Achievement 2015 – Summary
Pöhlmann (Eds), IQB-Ländervergleich 2012. Mathematische und naturwissenschaftli-che Kompetenzen am Ende der Sekundarstufe I (pp. 123–140). Mü nster: Waxmann.
Schroeders, U., Hecht, M., Heitmann, P., Jansen, M., Kampa, N., Klebba, N., Lenski, A. E. & Siegle, T. (2013). Der Ländervergleich in den naturwissenschaftlichen Fächern. In H. A. Pant, P. Stanat, U. Schroeders, A. Roppelt, T. Siegle & C. Pöhlmann (Eds), IQB-Ländervergleich 2012. Mathematische und naturwissenschaftliche Kompetenzen am Ende der Sekundarstufe I (pp. 141–158). Mü nster: Waxmann.
Stanat, P., Böhme, K., Schipolowski, S. & Haag, N. (Eds). (2016). IQB-Bildungstrend 2015. Sprachliche Kompetenzen am Ende der 9. Jahrgangsstufe im zweiten Ländervergleich. Mü nster: Waxmann.
Stanat, P., Pant, H. A., Böhme, K. & Richter, D. (Eds). (2012). Kompetenzen von Schü lerinnen und Schü lern am Ende der 4. Jahrgangsstufe in den Fächern Deutsch und Mathematik. Ergebnisse des IQB-Ländervergleichs 2011. Mü nster: Waxmann.
Petra Stanat, Katrin Böhme, Stefan Schipolowski,Nicole Haag (Hrsg.)
IQB-Bildungstrend 2015Sprachliche Kompetenzen am Ende der 9. Jahrgangsstufe im zweiten Ländervergleich
Münster: Waxmann2016, 544 Seiten, br., 44,90 €, ISBN 978-3-8309-3535-3
Further Information on the IQB Analysis of Student Achievement 2015:
and on the IQB Website:
http://www.iqb.hu-berlin.de/bt/BT2015/Bericht
W A X M A N N
Petra StanatKatrin Böhme
Stefan SchipolowskiNicole Haag
(Hrsg.)
IQB-Bildungstrend 2015Sprachliche Kompetenzenam Ende der 9. Jahrgangsstufeim zweiten Ländervergleich