
LR CbC Study
133
EuropE’s buildings undEr thE microscopE A country-by-country review of the energy performance of buildings
-
Upload
ionut-pascu -
Category
Documents
-
view
214 -
download
0
Transcript of LR CbC Study
7/29/2019 LR CbC Study
http://slidepdf.com/reader/full/lr-cbc-study 1/132
EuropE’s buildings undErthE microscopEA country-by-country review of the energyperformance of buildings

7/29/2019 LR CbC Study
http://slidepdf.com/reader/full/lr-cbc-study 2/132
Project lead
Marina Economidou
Editing team
Bogdan AtanasiuChantal DespretMarina EconomidouJoana MaioIngeborg NolteOliver Rap
Contributions
Jens LaustsenPaul Ruyssevelt
Dan Staniaszek David StrongSilvia Zinetti
Graphic Design
Lies Verheyen - Mazout.nu
Published in October 2011 by Buildings Perormance Institute Europe (BPIE)
Copyright 2011, Buildings Perormance Institute Europe (BPIE). Any reproduction in ull or in part o thispublication must mention the ull title and author and credit BPIE as the copyright owner. All rights reserved.
ISBN: 9789491143014
7/29/2019 LR CbC Study
http://slidepdf.com/reader/full/lr-cbc-study 3/132
ForEword
Buildings are at the pivotal centre o our lives. The characteristics o a building, its design, its look andeel, and its technical standards not only inuence our productivity, our well-being, our moods and ourinteractions with others, they also dene how much energy is consumed in and by a building, and howmuch heating, ventilation and cooling energy is needed to create a pleasant environment.
We know that buildings cause a signicant amount o greenhouse gas emissions, mainly CO2, altering
our planet’s climate. By renovating buildings to high standards o eciency we can demonstrate thatambitious climate change mitigation actions and improvements in living quality can go hand in hand.The European building stock with its unique mix o historical and modern architecture provides bothsignicant opportunities and challenges.
Efective policies and incentive schemes to reduce the climate change ootprint o buildings requirea solid understanding about the current building stock. The Buildings Perormance Institute Europeintends to contribute to an improved understanding with this report – gathering acts and gures aboutthe European building stock and aggregating the ndings to allow meaningul analysis.
BPIE recognizes that the availability o data is ar rom ideal, and that dynamic policy processes in theEU Member States will outdate very quickly some o the inormation on policies and nancial supportschemes. This is why we are committed to providing updates on certain issues at regular intervals, and Ihope that we can count on the collaboration o many experts in the eld.
Today, the challenge o climate change does not get the same political and media attention as it did
some years ago. However, that does not mean that the problem has gone away, quite the opposite. Butto limit the discussion about energy ecient buildings only to climate change considerations wouldignore the many additional benets which are created through the retrotting o the European buildingstock. The revitalisation o urban quarters, improved comort levels and quality o living and workingspaces, helping people out o uel poverty and creating long term employment are just some o the manypositive efects o a European renovation ‘wave’ which is modelled in the nal part o this report.
In this respect, this report wants to encourage a wider debate on how stakeholders in the buildingsector can collaborate to transorm the European building stock into a highly ecient living and workingenvironment which enables society to become more sustainable, in all aspects o the word’s meaning.BPIE proactively seeks dialogue with the many interested parties, and is looking orward to receiving your
reaction.
Oliver Rap
Executive Director
Buildings Perormance Institute Europe

7/29/2019 LR CbC Study
http://slidepdf.com/reader/full/lr-cbc-study 4/132
4 | Europe’s buildings under the microscope
7/29/2019 LR CbC Study
http://slidepdf.com/reader/full/lr-cbc-study 5/132
contEnts
ForEword
AcknowlEdgEmEnts
ExEcutivE summAry
introduction
mEthodology
pArt 1 EuropE’s buildings todAy
A. Building typology
Residential buildingsNon-residential buildings
B. CharacteristicsAgeSizeOwnership and tenureLocation
C. Energy perormanceResidential buildingsNon-residential buildings
pArt 2 policiEs And progrAmmEs For improving
EnErgy EFFiciEncy in buildings
A. Barriers & challengesBarriersChallenges
B. Regulatory and legislative ramework EPBD: Main provisions, implementation and recastBuilding codes
C. Financial programmes
Review o current nancial programmesImpact o selected nancial programmes
D. Other Programmes
pArt 3 rEnovAting with purposE – Finding A roAdmAp to 2050
A. Economic indicators
B. Overview o the renovation model
C. Setting the scene
FinAl rEmArks And policy rEcommEndAtionsdEFinitions
3
6
7
19
24
26
27
30323535
3937
41
434451
54
555561
637276
90
9094
95
98
100
106
113
123129

7/29/2019 LR CbC Study
http://slidepdf.com/reader/full/lr-cbc-study 6/132
AcknowlEdgEmEnts
This project was initiated by Tudor Constantinescu, rst BPIE executive director and continued by RodJanssen in his unction as Interim Executive Director o BPIE. Rod Janssen, board member o eceee, gaveimportant drive in a critical stage o the project. We would like to thank both o them or their inspirationand guidance.
BPIE would like to express its gratitude towards the steering committee o the project or providing on-going direction and support.
This report was developed by BPIE with the input o various people. We would like to thank the ollowingteam o country experts or sharing their valuable knowledge with us and helping us develop an
understanding o the situation in their respective country:
Randall Bowie, RockwoolCéline Carré, EurimaSusanne Dyrbøl, EuroACEPascal Eveillard, Eurima
Michaela Holl, DG Energy, ECAdrian Joyce, EuroACE
Jens Laustsen, Independent ConsultantOliver Loebel, PU EuropeYamina Saheb, International Energy AgencyConstant Van Aerschot, Laarge/WBCSD
Rick Wilberorce, Glass or Europe
BPIE is thankul to the advisory committee o the project or being a sounding board and or providing chal-lenging eedback in a constructive and enthusiastic manner. The advisory committee was represented by:
AEA, Austrian EnergyAgency
3E Consulting
BSERC, Black Sea EnergyResearch Centre
IENE, Institute o Energy orSouth East Europe
SEVEn
SBi, Danish BuildingResearch Institute
EKVU
MOTIVA
Hubert Despretz,
Expert at ADEME
Wuppertal Institute
IENE, Institute o Energy orSouth East Europe
CEU 3csep
SEAI, Sustainable EnergyAuthority Ireland
Marco Caponigro, IndividualExpert and ENEA (ENEA
Energy Eciency Unit)
PAIC, Centre o processes,analysis and research
Rimantas Sevastijančiukas,Individual expert
Mario Fsadni, Individualexpert
Ministry o housing,
Spatial Planning &Environment
FEWE, Polish Foundationor Energy Eciency
ADENE, Portuguese EnergyAgency
VITAstal and Horia Petran,URBAN-INCERC
TSUS, Building Testing and
Research Institute
Building and CivilEngineering Institute
ETRES Consulting
BOVERKET, Lund University
EST, Energy Saving Trust
INFRAS
SINTEF
6 | Europe’s buildings under the microscope
7/29/2019 LR CbC Study
http://slidepdf.com/reader/full/lr-cbc-study 7/132
Europe’s buildings under the microscope | 7
ExEcutivE summAry
From the emotional to the architectural value, buildings occupy a key place in our livesand society as a whole. Yet, the energy perormance o our buildings is generally sopoor that the levels o energy consumed in buildings place the sector among the mostsignicant CO
2emissions sources in Europe. While new buildings can be constructed
with high perormance levels, it is the older buildings, representing the vast majorityo the building stock, which are predominantly o low energy perormance andsubsequently in need o renovation work. With their potential to deliver high energyand CO
2savings as well as many societal benets, energy ecient buildings can have a
pivotal role in a sustainable uture.
Achieving the energy savings in buildings is a complex process. Policy making in this eld requires ameaningul understanding o several characteristics o the building stock. Reducing the energy demandrequires the deployment o efective policies which in turn makes it necessary to understand what afectspeople’s decision making processes, the key characteristics o the building stock, the impact o currentpolicies etc.
Amid the current political discussions at EU level, BPIE has undertaken an extensive survey across allEU Member States, Switzerland and Norway reviewing the situation in terms o the building stock characteristics and policies in place. This survey provides an EU-wide picture o the energy perormanceo the building stock and how existing policies inuence the situation. The data collected was also used
to develop scenarios that show pathways to making the building stock much more energy ecient, inline with the EU 2050 roadmap.
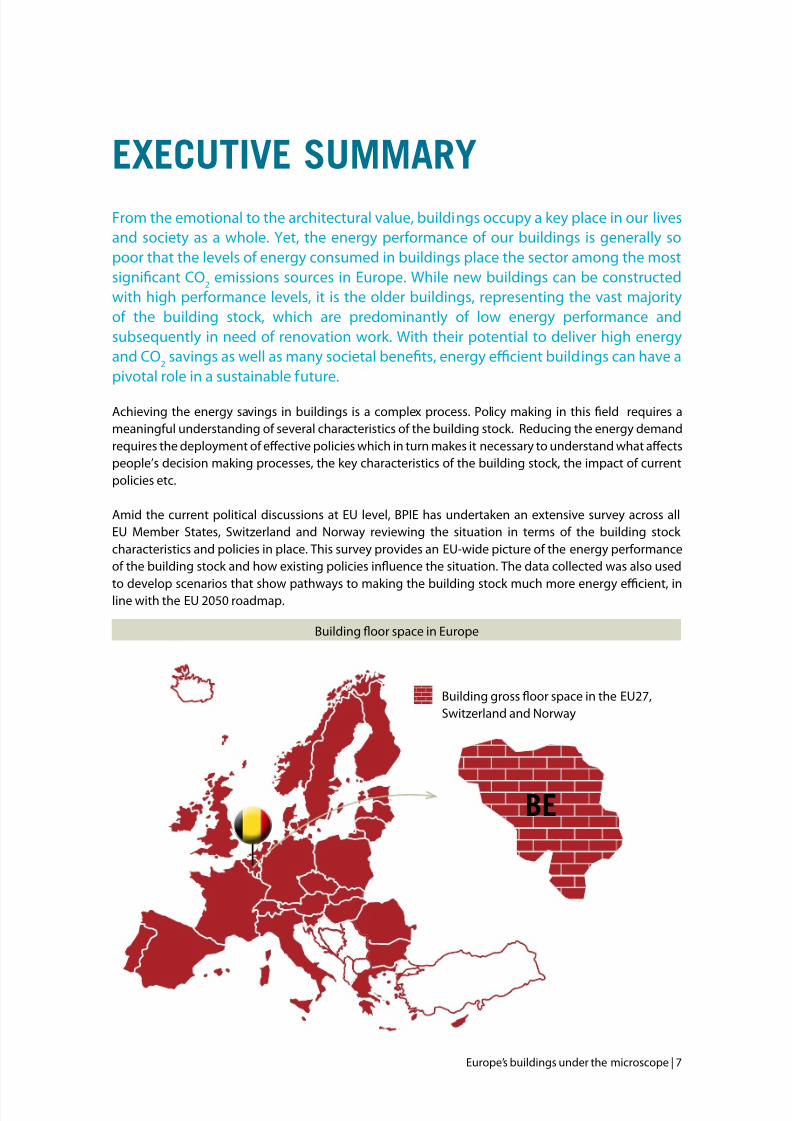
bE
Building oor space in Europe
Building gross oor space in the EU27,Switzerland and Norway
7/29/2019 LR CbC Study
http://slidepdf.com/reader/full/lr-cbc-study 8/132
8 | Europe’s buildings under the microscope
A vitAl picture of the europeAn stock
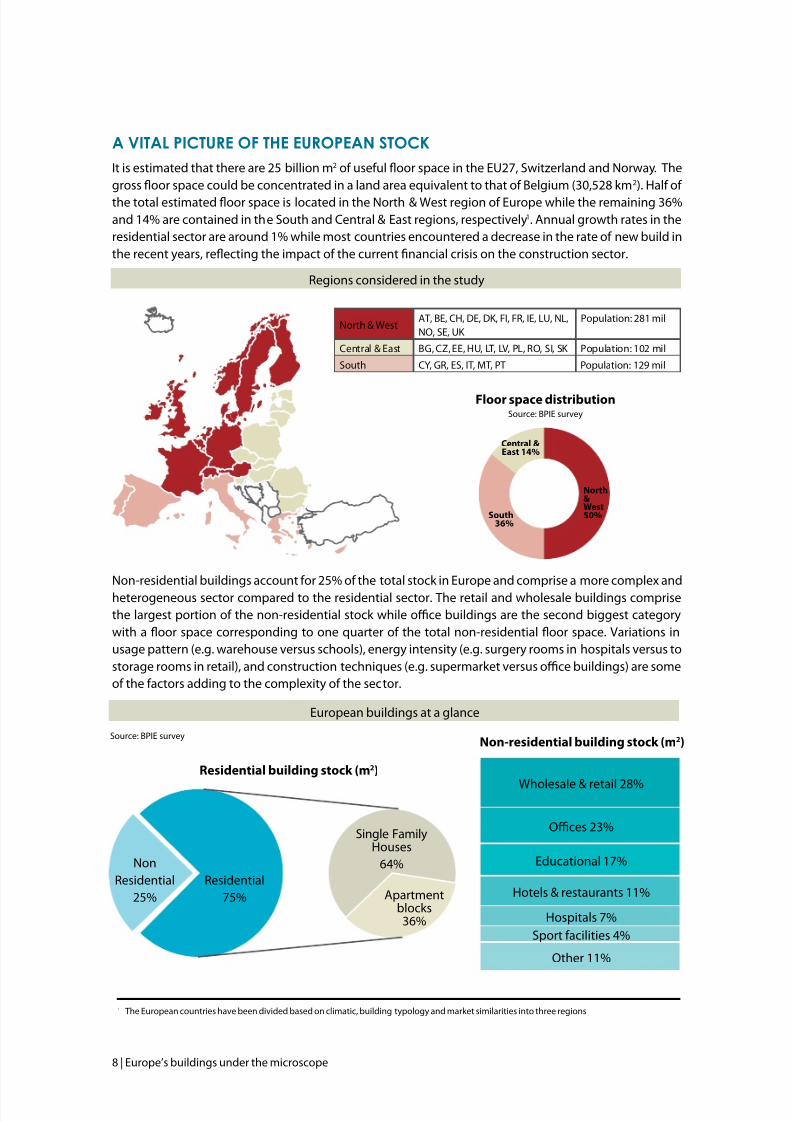
It is estimated that there are 25 billion m2 o useul oor space in the EU27, Switzerland and Norway. Thegross oor space could be concentrated in a land area equivalent to that o Belgium (30,528 km2). Hal o the total estimated oor space is located in the North & West region o Europe while the remaining 36%and 14% are contained in the South and Central & East regions, respectively1. Annual growth rates in theresidential sector are around 1% while most countries encountered a decrease in the rate o new build inthe recent years, reecting the impact o the current nancial crisis on the construction sector.
Non-residential buildings account or 25% o the total stock in Europe and comprise a more complex andheterogeneous sector compared to the residential sector. The retail and wholesale buildings comprisethe largest portion o the non-residential stock while oce buildings are the second biggest categorywith a oor space corresponding to one quarter o the total non-residential oor space. Variations inusage pattern (e.g. warehouse versus schools), energy intensity (e.g. surgery rooms in hospitals versus tostorage rooms in retail), and construction techniques (e.g. supermarket versus oce buildings) are someo the actors adding to the complexity o the sector.
Floor space distributionSource: BPIE survey
South36%
Central &East 14%
North&West50%
NonResidential
25%Residential
75%
Single FamilyHouses
64%
Apartmentblocks
36%
Non-residential building stock (m2)
Residential building stock (m2)
Wholesale & retail 28%
Oces 23%
Educational 17%
Hotels & restaurants 11%
Hospitals 7%Sport acilities 4%
Other 11%
1 The European countries have been divided based on climatic, building typology and market similarities into three regions
North & WestAT, BE, CH, DE, DK, FI, FR, IE, LU, NL,NO, SE, UK
Population: 281 mil
Central & East BG, CZ, EE, HU, LT, LV, PL, RO, SI, SK Population: 102 mil
South CY, GR, ES, IT, MT, PT Population: 129 mil
European buildings at a glance
Regions considered in the study
Source: BPIE survey
7/29/2019 LR CbC Study
http://slidepdf.com/reader/full/lr-cbc-study 9/132
Europe’s buildings under the microscope | 9
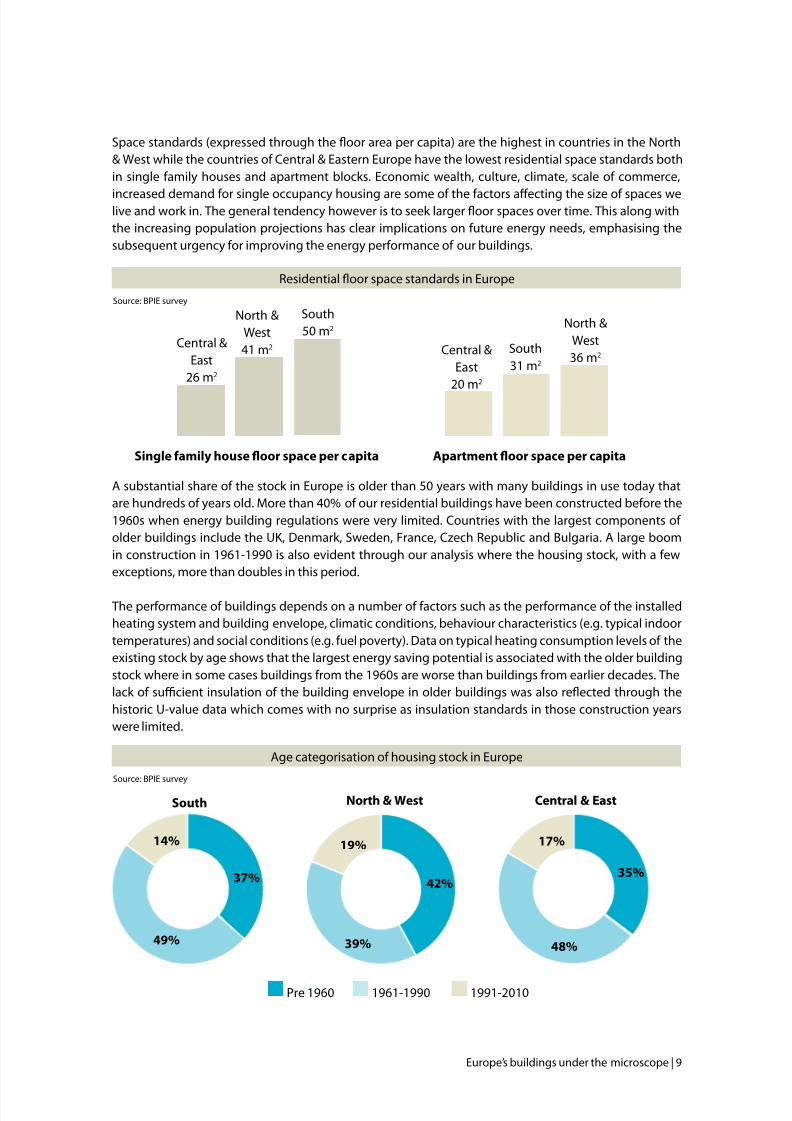
Space standards (expressed through the oor area per capita) are the highest in countries in the North& West while the countries o Central & Eastern Europe have the lowest residential space standards bothin single amily houses and apartment blocks. Economic wealth, culture, climate, scale o commerce,
increased demand or single occupancy housing are some o the actors afecting the size o spaces welive and work in. The general tendency however is to seek larger oor spaces over time. This along withthe increasing population projections has clear implications on uture energy needs, emphasising thesubsequent urgency or improving the energy perormance o our buildings.
A substantial share o the stock in Europe is older than 50 years with many buildings in use today thatare hundreds o years old. More than 40% o our residential buildings have been constructed beore the1960s when energy building regulations were very limited. Countries with the largest components o older buildings include the UK, Denmark, Sweden, France, Czech Republic and Bulgaria. A large boomin construction in 1961-1990 is also evident through our analysis where the housing stock, with a ewexceptions, more than doubles in this period.
The perormance o buildings depends on a number o actors such as the perormance o the installedheating system and building envelope, climatic conditions, behaviour characteristics (e.g. typical indoortemperatures) and social conditions (e.g. uel poverty). Data on typical heating consumption levels o theexisting stock by age shows that the largest energy saving potential is associated with the older buildingstock where in some cases buildings rom the 1960s are worse than buildings rom earlier decades. Thelack o sucient insulation o the building envelope in older buildings was also reected through thehistoric U-value data which comes with no surprise as insulation standards in those construction yearswere limited.
Residential oor space standards in Europe
Single amily house oor space per capita
Central &East
26 m2
North &West41 m2
South50 m2
Apartment oor space per capita
Central &East
20 m2
North &West36 m2
South31 m2
Age categorisation o housing stock in Europe
37%
14%
49%
South North & West
42%
19%
39%
Central & East
17%
35%
48%
Pre 1960 1961-1990 1991-2010
Source: BPIE survey
Source: BPIE survey
7/29/2019 LR CbC Study
http://slidepdf.com/reader/full/lr-cbc-study 10/132
10 | Europe’s buildings under the microscope
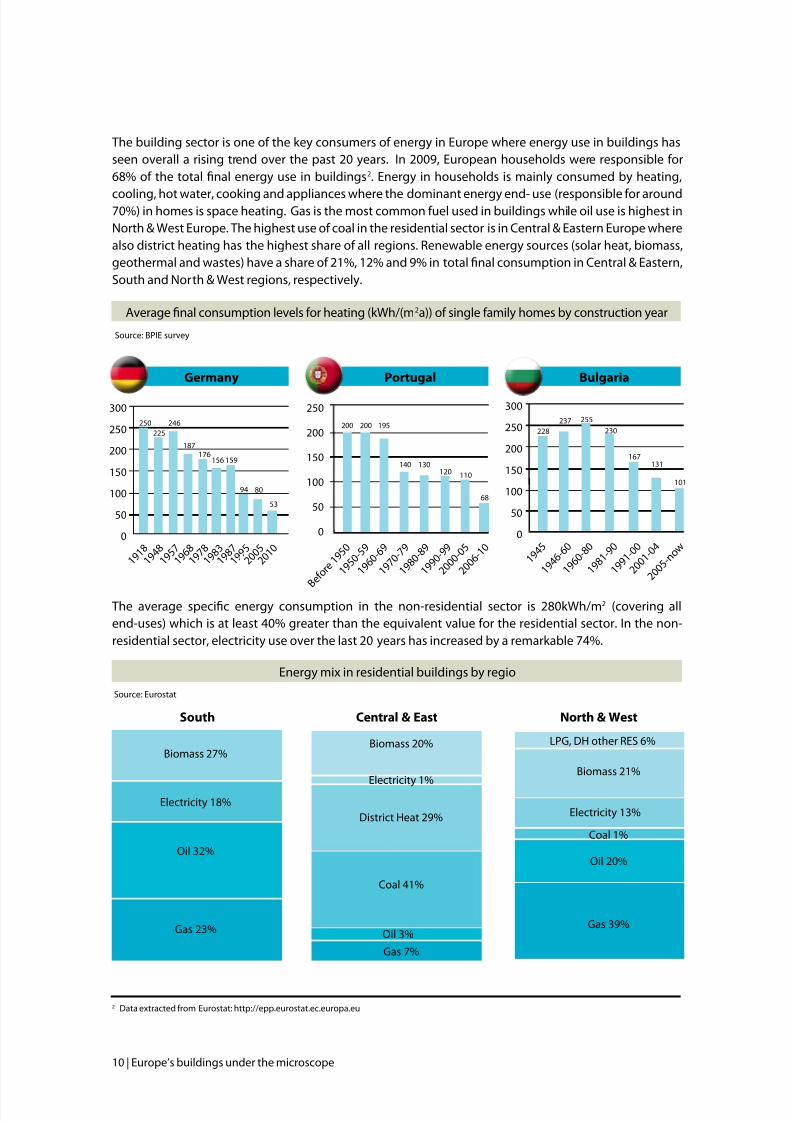
The building sector is one o the key consumers o energy in Europe where energy use in buildings hasseen overall a rising trend over the past 20 years. In 2009, European households were responsible or68% o the total nal energy use in buildings2. Energy in households is mainly consumed by heating,
cooling, hot water, cooking and appliances where the dominant energy end- use (responsible or around70%) in homes is space heating. Gas is the most common uel used in buildings while oil use is highest inNorth & West Europe. The highest use o coal in the residential sector is in Central & Eastern Europe wherealso district heating has the highest share o all regions. Renewable energy sources (solar heat, biomass,geothermal and wastes) have a share o 21%, 12% and 9% in total nal consumption in Central & Eastern,South and North & West regions, respectively.
The average specic energy consumption in the non-residential sector is 280kWh/m2 (covering allend-uses) which is at least 40% greater than the equivalent value or the residential sector. In the non-residential sector, electricity use over the last 20 years has increased by a remarkable 74%.
Energy mix in residential buildings by regio
Average nal consumption levels or heating (kWh/(m2a)) o single amily homes by construction year
Germany
300
250
200
150
100
50
0
1 9 1 8
1 9 4 8 1 9
5 7 1 9
6 8 1 9
7 8 1 9
8 3 1 9
8 7 1 9
9 5 2 0
0 5 2 0
1 0
225246250
187
159156176
8094
53
Portugal
B e o r e
1 9 5 0
1 9 5 0
- 5 9
1 9 6 0
- 6 9
1 9 7 0
- 7 9
1 9 8 0
- 8 9
2 0 0 0
- 0 5
2 0 0 6
- 1 0
1 9 9 0
- 9 9
200 200 195
140 130120 110
68
250
200
150
100
50
0
Bulgaria
300
250
200
150
100
50
0
1 9 4 5
1 9 4 6
- 6 0
1 9 6 0
- 8 0
1 9 8 1
- 9 0
1 9 9 1
- 0 0
2 0 0 5
- n o w
2 0 0 1
- 0 4
228237 255
230
167131
101
South
Biomass 27%
Electricity 18%
Oil 32%
Gas 23%
Central & East
Biomass 20%
District Heat 29%
Coal 41%
Gas 7%
Oil 3%
Electricity 1%
North & West
Gas 39%
Oil 20%
Electricity 13%
Biomass 21%
LPG, DH other RES 6%
Coal 1%
2 Data extracted rom Eurostat: http://epp.eurostat.ec.europa.eu
Source: BPIE survey
Source: Eurostat
7/29/2019 LR CbC Study
http://slidepdf.com/reader/full/lr-cbc-study 11/132
Europe’s buildings under the microscope | 11
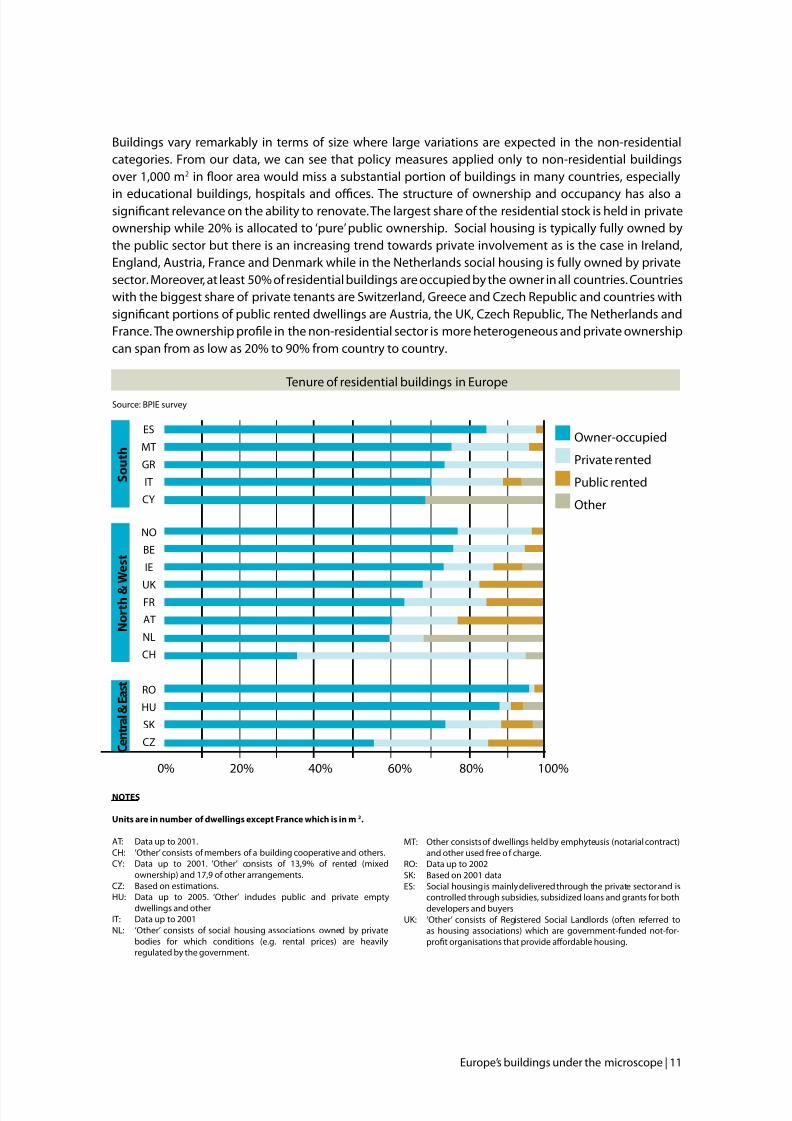
Buildings vary remarkably in terms o size where large variations are expected in the non-residentialcategories. From our data, we can see that policy measures applied only to non-residential buildingsover 1,000 m2 in oor area would miss a substantial portion o buildings in many countries, especially
in educational buildings, hospitals and oces. The structure o ownership and occupancy has also asignicant relevance on the ability to renovate. The largest share o the residential stock is held in privateownership while 20% is allocated to ‘pure’ public ownership. Social housing is typically ully owned bythe public sector but there is an increasing trend towards private involvement as is the case in Ireland,England, Austria, France and Denmark while in the Netherlands social housing is ully owned by privatesector. Moreover, at least 50% o residential buildings are occupied by the owner in all countries. Countrieswith the biggest share o private tenants are Switzerland, Greece and Czech Republic and countries withsignicant portions o public rented dwellings are Austria, the UK, Czech Republic, The Netherlands andFrance. The ownership prole in the non-residential sector is more heterogeneous and private ownershipcan span rom as low as 20% to 90% rom country to country.
Tenure o residential buildings in Europe
NOTES
Units are in number o dwellings except France which is in m2.
AT: Data up to 2001.CH: ‘Other’ consists o members o a building cooperative and others.CY: Data up to 2001. ‘Other’ consists o 13,9% o rented (mixed
ownership) and 17,9 o other arrangements.CZ: Based on estimations.HU: Data up to 2005. ‘Other’ includes public and private empty
dwellings and otherIT: Data up to 2001NL: ‘Other’ consists o social housing associations owned by private
bodies or which conditions (e.g. rental prices) are heavilyregulated by the government.
MT: Other consists o dwellings held by emphyteusis (notarial contract)and other used ree o charge.
RO: Data up to 2002SK: Based on 2001 dataES: Social housing is mainly delivered through the private sector and is
controlled through subsidies, subsidized loans and grants or bothdevelopers and buyers
UK: ‘Other’ consists o Registered Social Landlords (oten reerred toas housing associations) which are government-unded not-or-prot organisations that provide afordable housing.
Source: BPIE survey
Owner-occupied
Private rented
Public rented
Other
0% 20% 40% 60% 80% 100%
S o u t h
N o r t h &
W e s t
C e n t r a l & E a s t
ES
MT
GR
IT
CY
NO
BE
IE
UK FR
AT
NL
CH
RO
HU
SK
CZ
7/29/2019 LR CbC Study
http://slidepdf.com/reader/full/lr-cbc-study 12/132
12 | Europe’s buildings under the microscope
the europeAn policy scene
There are many reasons why investments in energy saving measures in buildings are oten overlooked,
rejected or only partially realised. Experience over several decades has identied numerous barriers thathinder energy saving investments. Financial, institutional and administrative, awareness/inormation andsplit incentives are the main categories o barriers identied by the BPIE survey which have a particularimpact on existing buildings. Although nancial barriers were one o the highest ranking barriercategory among the country responses, alternative investments are in many cases preerred to energysaving measures due to the lack o awareness, interest or in act, ‘attractiveness’ o energy eciency asan investment option. For the market to work well, correct and appropriate inormation is essential.Ambitious renovations comprise a major decision and can only work i the right advice is available orthe consumer. In addition, energy eciency service industries should be ully capable o delivering thosemeasures; and ultimately sucient satisaction levels should be guaranteed or the consumer. The splitincentive is probably the most long-lasting barrier, particularly due to the complex structure o occupancyboth in terms o the residential and non-residential sector.
At the European level, the main policy driver related to the energy use in buildings is the EnergyPerormance o Buildings Directive (EPBD, 2002/91/EC). Implemented in 2002, the Directive has beenrecast in 2010 (EPBD recast, 2010/31/EU) with more ambitious provisions. Through the EPBD introduction,requirements or certication, inspections, training or renovation are now imposed in Member Statesprior to which there were very ew.
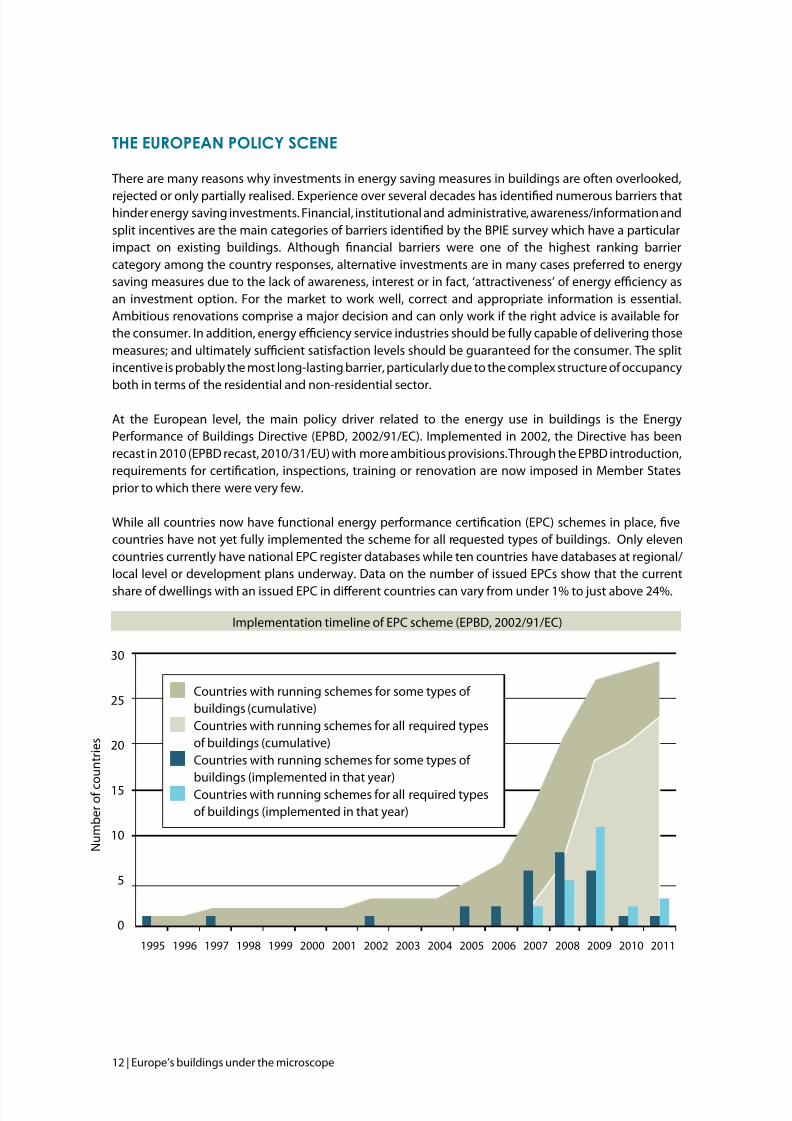
While all countries now have unctional energy perormance certication (EPC) schemes in place, vecountries have not yet ully implemented the scheme or all requested types o buildings. Only elevencountries currently have national EPC register databases while ten countries have databases at regional/local level or development plans underway. Data on the number o issued EPCs show that the current
share o dwellings with an issued EPC in diferent countries can vary rom under 1% to just above 24%.
Implementation timeline o EPC scheme (EPBD, 2002/91/EC)
30
25
20
15
10
5
0
1995 1996 1997 1998 1999 2000 2001 2002 2003 2004 2005 2006 2007 2008 2009 2010 2011
N u m b e r o c o u n t r i e s
Countries with running schemes or some types o buildings (cumulative)
Countries with running schemes or all required typeso buildings (cumulative)
Countries with running schemes or some types o buildings (implemented in that year)
Countries with running schemes or all required typeso buildings (implemented in that year)
7/29/2019 LR CbC Study
http://slidepdf.com/reader/full/lr-cbc-study 13/132
Europe’s buildings under the microscope | 13
The absence o previous requirements in most Member States meant that entirely new legislative vehicleswere required and consequently that the rst EPBD was typically implemented in stages over a number o years, rom around 2006 to 2010. Despite the act that signicant developments happened over the last
years, current EU legislation only partially covers the eld o buildings renovation. The EPBD stipulates theimplementation o energy saving measures only in case o deep renovation o the building without speciyingthe depth o renovation measures. It is clear that more targeted measures are required or ostering the deeprenovation o the existing building stock.
A key driver or implementing energy eciency measures are the building energy codes, through whichenergy-related requirements are incorporated during the design or retrot phase o a building. While severalMember States had some orm o minimum requirements or thermal perormance o building envelopesin the 1970s, the EPBD was the rst major attempt requiring all Member States to introduce a generalramework or setting building energy code requirements based on a “whole building” approach. Examiningthe requirements set by each Member State, it is clear that large variations exist in terms o the approach eachcountry has taken in applying building energy codes. In some countries two approaches exist in parallel, onebased on the whole building approach and the other one on the perormance o single elements. In others, thesingle element requirements act as supplementary demands to the whole building approach. In some casesthe requirements or renovating buildings can be as ambitious as the new build requirements. Major changesare expected through the application o the cost-optimality concept in energy perormance requirementsas introduced by the recast EPBD which should also gradually converge to nearly zero energy standards, arequirement or new buildings rom 2020 onwards. An appropriate level o enorcement compliance withbuilding energy codes should also be o concern and a point o attention or policy makers as it is necessary toensure that enough rigour and attention to detail are undertaken when applying energy eciency measures.
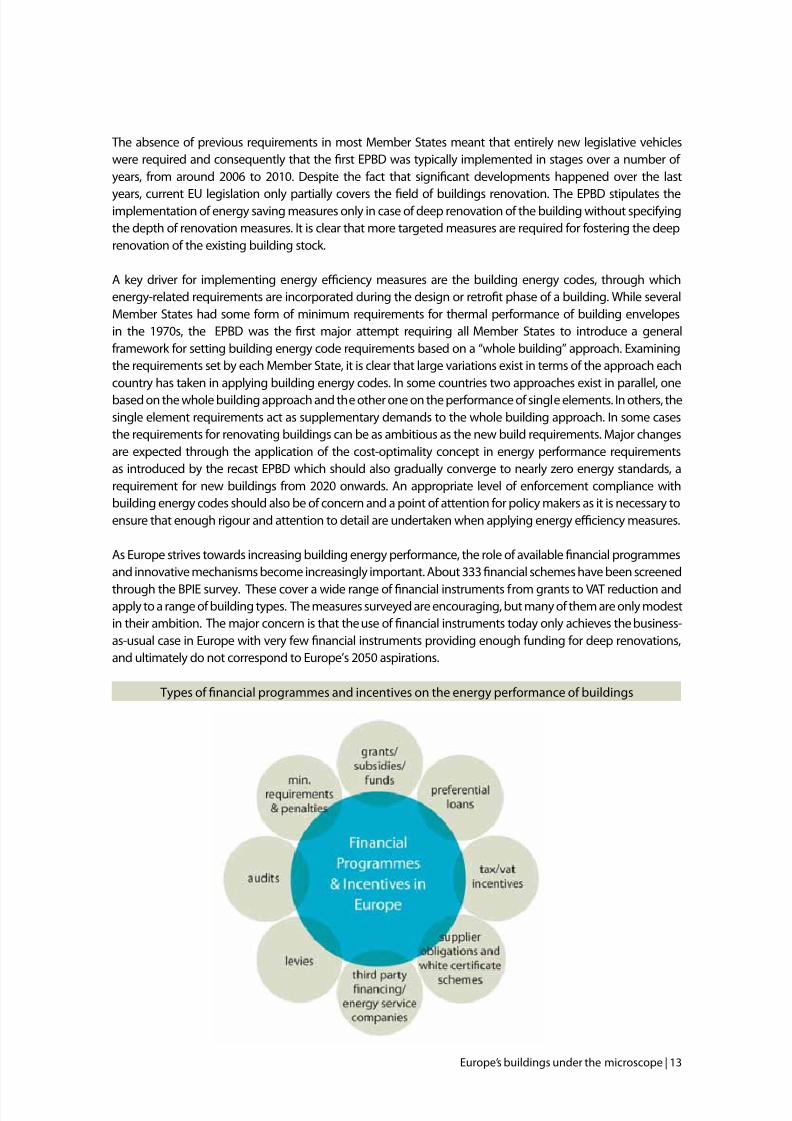
As Europe strives towards increasing building energy perormance, the role o available nancial programmesand innovative mechanisms become increasingly important. About 333 nancial schemes have been screened
through the BPIE survey. These cover a wide range o nancial instruments rom grants to VAT reduction andapply to a range o building types. The measures surveyed are encouraging, but many o them are only modestin their ambition. The major concern is that the use o nancial instruments today only achieves the business-as-usual case in Europe with very ew nancial instruments providing enough unding or deep renovations,and ultimately do not correspond to Europe’s 2050 aspirations.
Types o nancial programmes and incentives on the energy perormance o buildings
7/29/2019 LR CbC Study
http://slidepdf.com/reader/full/lr-cbc-study 14/132
14 | Europe’s buildings under the microscope
There are steps underway to improve the availability o new nancing instruments. Innovative approachesinclude Energy Supplier Obligations, energy service companies, the use o EU Structural Funds more efectivelyand possible targets to renovate specic building sub-sectors (e.g. the proposal in the drat Energy Eciency
Directive to Member States to renovate a certain percentage o public buildings annually) which will requireMember States to “unlock” unding or such renovations.
the wAys forwArd
Building energy perormance needs to be signicantly improved in order to reduce overall energydemand and, importantly, reduce carbon dioxide emissions in line with the cost-efective potential andEurope’s GHG emissions objectives. The question or policymakers is how to proceed.
To help policy makers determine the appropriate way orward, a renovation model has been specicallydeveloped or this project. The scenarios illustrate the impact on energy use and CO
2
emissions at diferentrates (percentage o buildings renovated each year) and depths o renovation (extent o measuresapplied and size o resulting energy and emissions reduction) rom now up to 2050. The model hasassessed energy saved, CO
2saved, total investment required, energy cost savings, employment impact
and a range o cost-efectiveness indicators. These assessments allow policy makers the opportunityto ocus on what they consider the highest priorities. The model considers eatures such as the age o buildings and quality o building energy perormance. When considering the share o buildings that canundergo low energy renovation, a practical limit is applied in the residential and non-residential buildingsectors in the 2011 to 2050 timerame. This practical limit is afected by a number o considerations suchas demolitions, heritage buildings, recent renovations and new buildings. The model applies diferentdiscount rates, learning curves and uture energy prices (based on Eurostat and Primes orecasts) in orderto derive how costs will evolve rom now until 2050. Two decarbonisation pathways are considered, a
slow pathway based on what has been witnessed since 1990 and a ast pathway based on what is neededto achieve the levels o carbon reduction assumed in the EU 2050 Roadmap. The model was used to create scenarios with various speeds (slow, medium and ast) and depths o renovation (minor, moderate, deep and nearly zero energy). All but one scenario assume that a buildingwill be renovated once between 2010 and 2050. The so-called two-stage scenario allows or a secondrenovation during the 2010-2050 period. Individual scenarios combine diferent speeds and depths,and are compared to a business-as-usual scenario, which assesses what would happen i there were nochanges rom the approach taken today.
The results vary considerably as can be expected. Considering the results or 2020, the annual energysavings range rom 94 TWh in the business-as-usual case to 527 TWh or the most ambitious deepscenario (and 283 TWh or both the medium and two-stage scenarios). In 2050, the corresponding annualenergy savings o the deep and two-stage scenarios are 2795 TWh and 2896 TWh respectively while only365 TWh annual savings are achieved in the business-as-usual case.
The results look signicantly diferent or CO2
savings where the deep and two-stage scenarios are muchcloser in impact. Under the assumption o ast decarbonisation o electricity and ossil uels, the 2050savings o the deep and two-stage scenarios correspond to the 90% which are in line with the EuropeanCO
2reduction targets3. These levels o savings can only be achieved given that both renovation and
power sector decarbonisation strategies are adopted. Yet, there is a signicant diference in investmentcosts (on a present value basis). For the deep scenario the investment is €937 billion, while a signicantlylower €584 billion or the two-stage scenarios is needed.
3 as described by the European Commission in its Roadmap 2050 paper
7/29/2019 LR CbC Study
http://slidepdf.com/reader/full/lr-cbc-study 15/132
Europe’s buildings under the microscope | 15
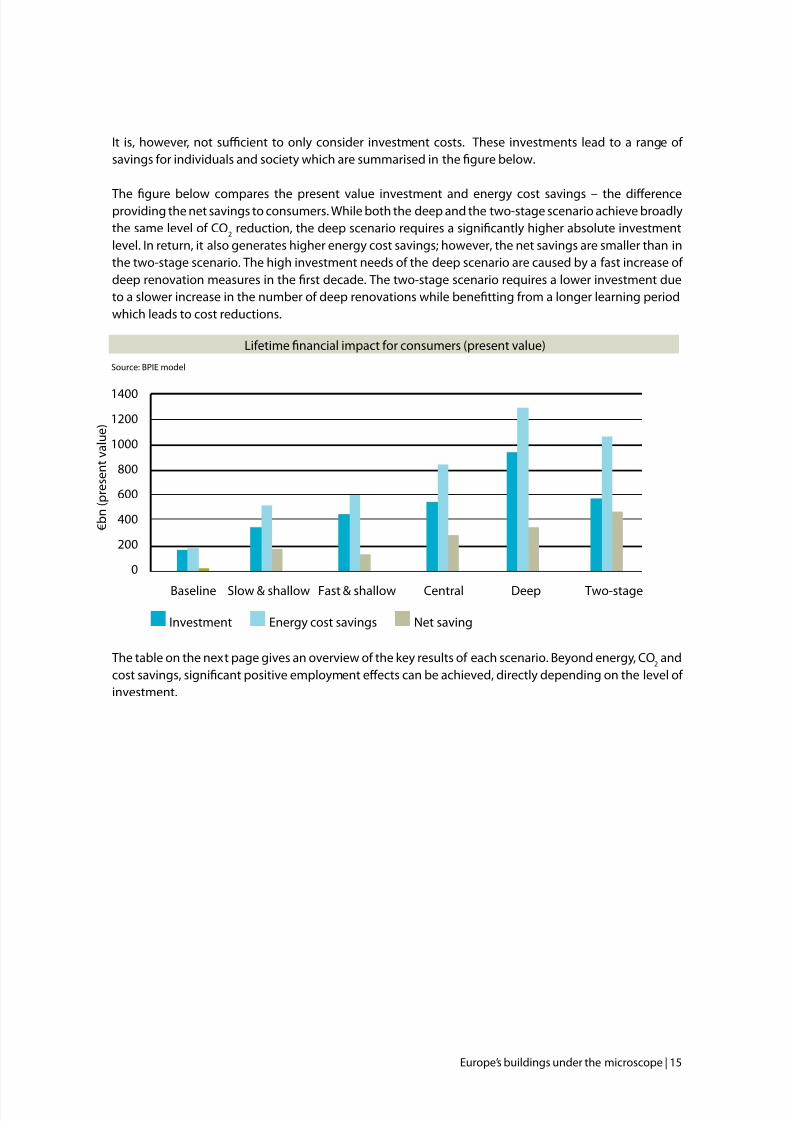
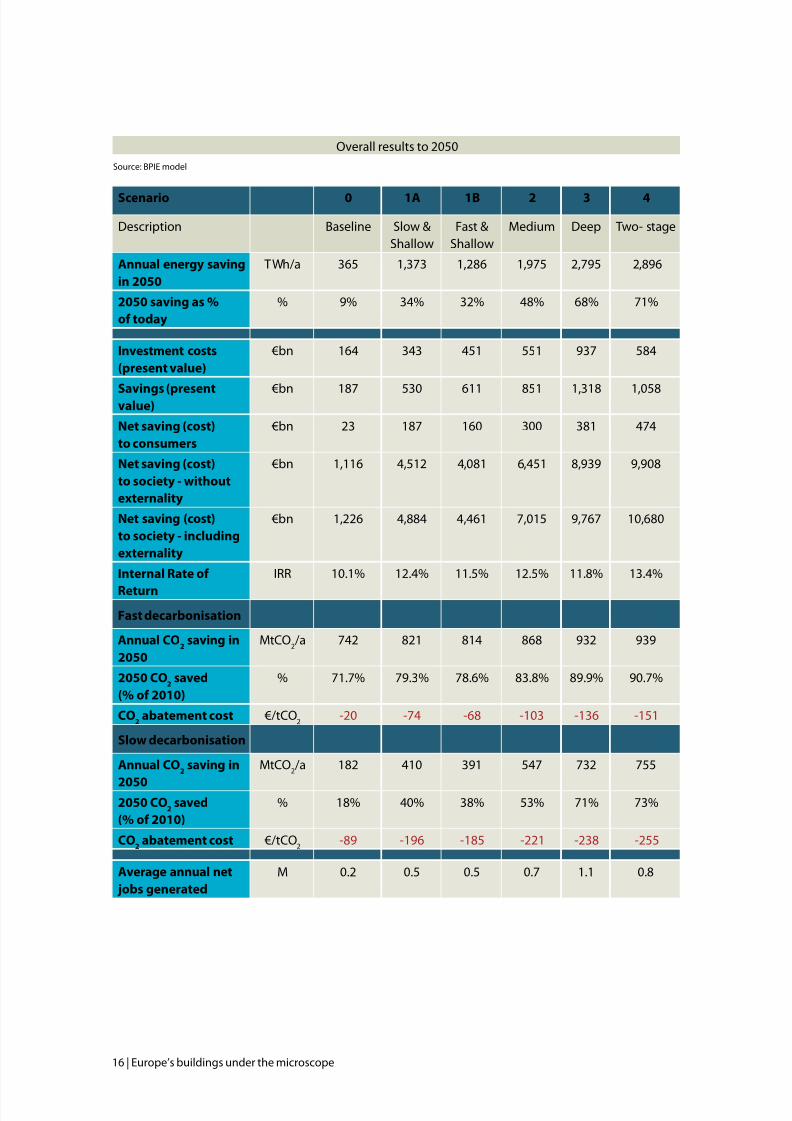
It is, however, not sucient to only consider investment costs. These investments lead to a range o savings or individuals and society which are summarised in the gure below.
The gure below compares the present value investment and energy cost savings – the diferenceproviding the net savings to consumers. While both the deep and the two-stage scenario achieve broadlythe same level o CO
2reduction, the deep scenario requires a signicantly higher absolute investment
level. In return, it also generates higher energy cost savings; however, the net savings are smaller than inthe two-stage scenario. The high investment needs o the deep scenario are caused by a ast increase o deep renovation measures in the rst decade. The two-stage scenario requires a lower investment dueto a slower increase in the number o deep renovations while benetting rom a longer learning periodwhich leads to cost reductions.
The table on the next page gives an overview o the key results o each scenario. Beyond energy, CO2
andcost savings, signicant positive employment efects can be achieved, directly depending on the level o investment.
Lietime nancial impact or consumers (present value)
1400
1200
1000
800
600
400
200
0
Baseline Slow & shallow Fast & shallow Central Deep Two-stage
€ b n ( p r e s e n t v a l u e )
Investment Energy cost savings Net saving
Source: BPIE model
7/29/2019 LR CbC Study
http://slidepdf.com/reader/full/lr-cbc-study 16/132
16 | Europe’s buildings under the microscope
Scenario 0 1A 1B 2 3 4
Description Baseline Slow &Shallow
Fast &Shallow
Medium Deep Two- stage
Annual energy saving
in 2050
TWh/a 365 1,373 1,286 1,975 2,795 2,896
2050 saving as %
o today
% 9% 34% 32% 48% 68% 71%
Investment costs
(present value)
€bn 164 343 451 551 937 584
Savings (presentvalue) €bn 187 530 611 851 1,318 1,058
Net saving (cost)
to consumers
€bn 23 187 160 300 381 474
Net saving (cost)
to society - without
externality
€bn 1,116 4,512 4,081 6,451 8,939 9,908
Net saving (cost)
to society - including
externality
€bn 1,226 4,884 4,461 7,015 9,767 10,680
Internal Rate o
Return
IRR 10.1% 12.4% 11.5% 12.5% 11.8% 13.4%
Fast decarbonisation
Annual CO2
saving in
2050
MtCO2/a 742 821 814 868 932 939
2050 CO2
saved
(% o 2010)
% 71.7% 79.3% 78.6% 83.8% 89.9% 90.7%
CO2
abatement cost €/tCO2
-20 -74 -68 -103 -136 -151
Slow decarbonisation
Annual CO2
saving in
2050
MtCO2/a 182 410 391 547 732 755
2050 CO2
saved
(% o 2010)
% 18% 40% 38% 53% 71% 73%
CO2
abatement cost €/tCO2
-89 -196 -185 -221 -238 -255
Average annual net
jobs generated
M 0.2 0.5 0.5 0.7 1.1 0.8
Overall results to 2050
Source: BPIE model
7/29/2019 LR CbC Study
http://slidepdf.com/reader/full/lr-cbc-study 17/132
Europe’s buildings under the microscope | 17
In all the scenarios, the estimated CO2
emission reduction by 2050 is determined by the energy savings butalso by the decarbonisation o the energy supply sector. It is interesting to note that in the deep and two-stage scenarios there is a 71-73% CO
2emission reduction even under the slow decarbonisation assumption,
a gure which is close to the CO2 emission reduction or the slow and shallow scenario under the astdecarbonisation assumption. This highlights the role o renovation measures in the decarbonisation strategy.The decarbonisation o the energy supply sector is signicantly eased by decreasing the energy demand o buildings and is importantly more sustainable. Moreover, the costs or decarbonising the energy generationsystem will be signicantly less i the consumption patterns o the building sector will dramatically reduce.
Each o the scenarios 1-4 represent a signicant ramping up in renovation activity compared to the currentsituation (i.e. the baseline scenario 0). When looked at purely in terms o the investment required, theserange rom around double the baseline level or scenario 1a, through to over 5 times the baseline level orthe deep scenario 3. These are signicant increases, but certainly achievable i governments across the EUwere to agree and implement respective policies and market stimulation mechanisms. The current practice isclearly not sucient to trigger a renovation wave across Europe which would deliver the societal, economicand environmental benets possible. At a time o rising unemployment and increased energy dependency,the employment and energy saving benets to consumers rom an accelerated renovation programme wouldprovide a welcome boost to many countries continuing to sufer economic diculties ollowing the creditcrunch.
The modelling exercise gives a clear indication that an ambitious renovation strategy or Europe’s buildings iseasible. Taking into consideration the three most relevant actors, i.e. achievement o CO
2reduction targets,
investment considerations and positive employment efects, it seems that the results o the two-stage scenarioprovide the best balance o these actors, comparing all scenarios. The two-stage scenario thereore illustratesa pathway which should inuence policy choices to stimulate the renovation o the European building stock.
For policy makers the challenge only begins at this point. The question now is how to break the policy inertiaand set the necessary policies in motion to achieve this. The complex nature o the buildings sector with itsmany actors in the value chain requires efective policy actions at both EU level and Member State level.
At EU level, the recast o the EPBD will have to be implemented in a way which secures large energy savingsand it will have to be monitored or revision at the earliest possible date. Other Directives, rom Ecodesign tothe Energy Eciency Directive proposed in June 2011, will have to be aligned to maximise ambition. At thesame time, Member States need to make signicant eforts to transpose EU regulation and to implement it ina way that stimulates deep renovation o the building stock.
Beyond policy regulation, nancing rameworks need to be efective and adequate. Innovative approaches areneeded since the initial up-ront investment costs or ambitious renovations can be a real barrier. Supportingmeasures at all levels o the building value chain, rom a well-trained workorce (rom designers to tradesmen),to a continuing and growing range o energy-ecient products and to efective awareness and inormationprogrammes are essential. These strategies are inter-connected and need to be careully designed to stimulatethe necessary growth o the European deep renovation market. The ollowing recommendations provide astrategic ramework and starting point or decision makers at both the EU and national level.
7/29/2019 LR CbC Study
http://slidepdf.com/reader/full/lr-cbc-study 18/132
18 | Europe’s buildings under the microscope
ma eea
• Datacollection:harmonise national data collection systems relating to the energy perormance o buildings and ensure sucient data availability. A reliable and continuous data collection process is anecessary prerequisite or reliable policy making.
• Renoation roadmap: strengthen the existing legislation at EU level through binding measuresand establish a roadmap or the renovation o the building stock with interim and long term bindingtargets as well as monitoring and reporting plans. At Member State level, it is necessary to detail deeprenovation plans comprising regulatory, nancial, inormation and training measures, with renovationtargets based on the national nancial and technical potential and tailor-made roadmaps with diferentphases moving rom voluntary to binding measures.
• Financin: establish an EU Deep Renovation Fund (possibly via the European Investment Bank anddesigned or diferent building types) which can complement the national nancing schemes andshare the risks, ofering more nancial exibility and additional condence to the private investors.
EU expenditure or the renovation o the building stock (i.e. by Structural and Regional DevelopmentFunds) should introduce the minimum requirement or implementing measures at cost-optimal levels.The development o innovative nancial instruments at Member State level can trigger increasedprivate investment by providing guidelines or nancing, promoting best practice and stimulatingMember State cooperation;
• MemberStatepolicies:eliminate market barriers and administrative bottlenecks or the renovationo the building stock and to develop long-term comprehensive regulatory, nancial, educational andpromotional packages addressing all the macro-economic benets.
• Monitorin/compliance/enforcement: establish proper monitoring systems o compliance,enorcement and quality control processes through a qualied workorce or all policy packagesostering deep renovation.
• EneryPerformanceCerticates:strengthen the implementation o the buildings energy certicationand audit schemes which can increase the value o ecient buildings and can stimulate the real-estatemarket towards green investments.
• Public sector: ensure that the public sector takes a leading role in the renovation revolution asenvisaged by the drat Energy Eciency Directive, which should kick start the market or renovationand help bring costs down or private households and businesses.
• ESCOsandsainsuarantee:remove market barriers or the ESCOs and acilitate a aster and betterdevelopment o deep renovation programmes through regulatory rameworks, encouraging the setup and development o a well-unctioning energy services market which is not limited to commercialbuildings. An innovative guarantee system should be developed or the perormance o eciency
measures in order to provide condence or the quality level o renovation measures to consumers andinvestors.
• Trainin and education: increase the skills in the construction industry by ensuring appropriateramework conditions or the Internal Market o construction products and services, improvingresource eciency and environmental perormances o construction enterprises, and promoting skills,innovation and technological development.
7/29/2019 LR CbC Study
http://slidepdf.com/reader/full/lr-cbc-study 19/132
Europe’s buildings under the microscope | 19
introductionA vitAl picture of the europeAn building stock
“If you cannot measure it, you cannot improve it”Sir William Thomson, Lord Kelvin
Buildings are at the centre o our social and economic activity. Not only do we spendmost o our lives in buildings, we also spend most o our money on buildings. The builtenvironment is not only the largest industrial sector in economic terms, it is also the
largest in terms o resource ow1
. Buildings are intrinsically linked to Europe’s societies,Europe’s economies, and their uture evolution.
Energy security and climate change are driving a uture that must show a dramatic improvement in theenergy perormance in Europe’s buildings. The 27 Member States have set an energy savings target o 20% by 2020, mainly through energy eciency measures. The European Union has also committed to80-95 % GHG reduction by 2050 as part o its roadmap or moving to a competitive low-carbon economyin 20502. Buildings currently represent almost 40% o total nal energy consumption and, thereore, canmake a crucial contribution to these targets.
In the Energy Eciency Plan 20113, the European Commission states that the greatest energy savingpotential lies in buildings. The minimum energy savings in buildings can generate a reduction o 60-80
Mtoe/a4 in nal energy consumption by 2020, and make a considerable contribution to the reductiono GHG emissions. This will be achievable only i buildings are transormed through a comprehensive,rigorous and sustainable approach.
The European policy ramework or buildings has been evolving since the early 1990s. A wide array o measures has been adopted across individual Member States to actively promote the better energyperormance o buildings. Ater 2002, the issue gained strong momentum when the Directive on EnergyPerormance o Buildings (EPBD) [Directive 2002/91/EC] was adopted. The EPBD was recast in 2010 tomake the goals more ambitious and to reinorce the implementation.5
As the Commission stated in its Communication proposing the 2010 revision: “The sector has signicant
untapped potential or cost efective energy savings.”6. Realising this potential will depend crucially onthe commitment o Member States, and the involvement o stakeholders rom government, industry andcivil society.
The European Union stretches over many diferent climate zones, landscapes and cultures. Some 501million inhabitants spread over 27 countries7 reside in a wide array o building types with an equally wide
1 Paul Hawken - The HOK Guidebook to Sustainable Design.2 Directive 2010/31 o the European Parliament and o the Council o 17 May 2010 on the energy perormance o buildings and its amendments (the
recast Directive entered into orce in July 2010, but the repeal o the current Directive will only take place on 1/02/2012).3 Energy Eciency Plan 2011, Communication rom the commission to the European Parliament, the council, the European economic and social
Committee and the committee o the regions, European Commission, 2011.4 Summary o the impact assessment accompanying document to the proposal or a recast o the energy perormance o buildings directive
(2002/91/EC).5 Directive 2010/31 o the European Parliament and o the Council o 17 May 2010 on the energy perormance o buildings and its amendments (therecast Directive entered into orce in July 2010, but the repeal o the current Directive will only take place on 1/02/2012).
6 COM(2008) 780 nal.7 The data collection and analysis also include Norway and Switzerland, two countries that work closely with the EU and implement much o its
legislation.
7/29/2019 LR CbC Study
http://slidepdf.com/reader/full/lr-cbc-study 20/132
20 | Europe’s buildings under the microscope
range o thermal qualities, in a constantly expanding building stock. From styles o living – single-amilydwellings or multi-amily dwellings, or example – to policies or the construction o buildings, there aresignicant diferences between countries.
National approaches to monitoring the building stock have also evolved separately. Inormation is notonly needed to track the progress o policy implementation, better inormation and data are required tohelp develop a European pathway and roadmaps to more energy ecient buildings. In order to denethe energy and CO
2reduction potential, we need to study and evaluate the technical and economic
opportunities, easibilities and limits.
Indeed, it is a major obstacle to strong policy making at EU level that there is a lack o data on the buildingsector or Europe as a whole.
There has been signicant Europe-wide legislation on buildings and there are several orthcominginitiatives underway to improve the energy perormance o new and existing buildings. Yet, much o this is done with only a minimum o act-based knowledge, analysis and evidence. As strategies or theenergy perormance o buildings evolve and become more complex, policy makers need more concreteand precise acts to be able to make cross-country comparisons and to put in place the monitoringsystems that permit measurement o the progress o the various policy instruments.
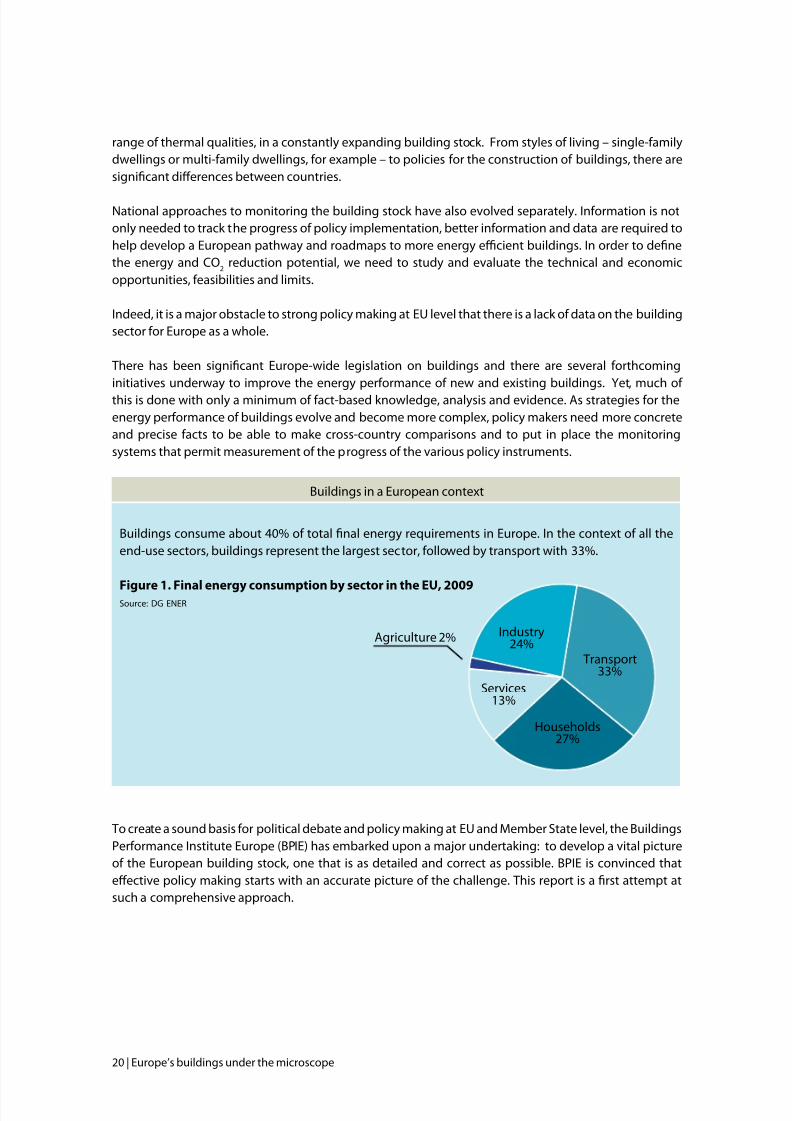
Buildings in a European context
Buildings consume about 40% o total nal energy requirements in Europe. In the context o all theend-use sectors, buildings represent the largest sector, ollowed by transport with 33%.
Figure 1. Final energy consumption by sector in the EU, 2009Source: DG ENER
To create a sound basis or political debate and policy making at EU and Member State level, the BuildingsPerormance Institute Europe (BPIE) has embarked upon a major undertaking: to develop a vital pictureo the European building stock, one that is as detailed and correct as possible. BPIE is convinced thatefective policy making starts with an accurate picture o the challenge. This report is a rst attempt atsuch a comprehensive approach.
Agriculture 2% Industry24%
Transport33%
Services13%
Households27%
7/29/2019 LR CbC Study
http://slidepdf.com/reader/full/lr-cbc-study 21/132
Europe’s buildings under the microscope | 21
the chAllenge
Many experts agree that the most cost-efective way o meeting climate change targets is through improvedenergy eciency. At this point, there is growing acceptance o this principle, but there is still an imbalancebetween the resources devoted to energy supply options and energy demand-reduction options. The scenariosusually developed are designed to highlight the potential or improved energy eciency in buildings makinga cost-efective contribution to achieving climate targets.
Typically, energy eciency initiatives are crowded out by other more immediate priorities, in part becauseimproving energy eciency is a long-term policy commitment. In the buildings sector, policies are efectivenot over two or three years, but two or three decades. That is not easy to sustain. Today’s headlines includenancial crises in several EU Member States, wars in several countries and budget debates at national andEuropean levels. While they all seem like competing priorities, in act, improved energy eciency could makea positive contribution to solutions in many policy areas while actually increasing rather than decreasingavailable resources.
Why improve energy eciency in buildings?
The high level o energy consumption and GHG emissions in buildings in Europe makes this is anobvious sector to target in order to determine the potential and improve energy perormance. Whilethere has already been signicant efort to improve energy perormance in buildings, considerablepotential still remains, as was noted by the European Commission’s Communication on the proposalor the recast o the EPBD.
The justication or ocusing on the energy eciency in buildings can be summarised in the ollowingarguments that relate to both the individual’s point o view and the perspective o society as a whole:
• Securityofenergysupply;[Societal]• LowerGHGemissions,whichmeansamajorcontributiontoclimatechangestrategies;[Societal]
• Reducedenergycostsforconsumers,whichcanbeimportantinavoiding“fuelpoverty”(where
energy costs represent a disproportionate and unsustainable share o disposable income); [Private]• Cheaperthaninvestinginincreasedenergycapacity;[Societal]
• Improvedcomfort;[Private]
• ContributiontotherehabilitationofcertainbuildingtypesinthenewMemberStatesofCentral
and Eastern Europe; [Both]• Amajorcontributiontotheobjectiveofsustainabledevelopment,whichisaformalcommitment
o European countries; [Societal] and• Improvingenergyeciencyinbuildingsisimportanttothebuildingsenergyserviceindustries
that are important employers in Europe. [Both]
Any assessment o the costs and benets o building energy perormance must account or the ullrange o benets at both individual and societal level – which is oten dicult to estimate.
One major challenge is changing the mind-set concerning buildings. I the building sector is tosignicantly contribute to the 80-95% GHG reduction target or 2050, each building, on average, willhave to demonstrate very low carbon emission levels and consume very low energy in the context o adecarbonised power sector. For most o Europe’s buildings, that probably means improving the currentaverage energy consumption by a actor our or ve and the installation o renewables. For some it couldeven mean a actor 10 improvement. This may be hard to imagine but is denitely doable.8
8 The IEA analytical work related to polic y recommendations show this could be both possible and economically rational. This has been presented,or instance at Climate Change: Global Risks, Challenges and Decisions, IOP Con. Series: Earth and Environmental Science 6 (2009) in the paper“Global policy or dramatic reduction o energy consumption in bui ldings – Factor 3 is both possible and economic rational”, by Jens Laustsen,International Energy Agency IEA.
7/29/2019 LR CbC Study
http://slidepdf.com/reader/full/lr-cbc-study 22/132
22 | Europe’s buildings under the microscope
Supporters o energy eciency need better arguments which will encourage both the private and publicsectors to take more interest in improving energy eciency and to explain how this paradigm shit canoccur. The main objectives o this study are to give policy-makers the acts and ofer the arguments to
make the case persuasively, and to provide useul data input to researchers who should base any politicaldiscussion upon science-based insights.
structure
This report has three parts.
Part 1 surveys 27 Member States, together with Norway and Switzerland, examining the oor space areao residential and non-residential buildings, building typologies, characteristics and energy perormanceo current stock. The inormation is drawn rom the statistical oces o national administrations and willbe presented in a orm that permits European comparisons and analysis. There are inevitably gaps, as
certain administrations have not made a priority o this kind o data collection (c.. Methodology chapter).
Part 2 provides detailed inormation and analysis relating to current barriers, the EPBD implementation,the European building codes and major programmes that are designed to improve energy perormancein buildings.
In Part 3 the available data were used to develop and assess the energy perormance scenarios orthe buildings sector in Europe with the aim o illustrating potential energy savings and CO
2reduction
pathways, reecting the EU’s 20% energy saving target or 2020, as well as the EU’s long term 80-95%GHG emission reduction target or 2050.
The scenarios describe the impact o building retrot strategies to achieve the 2020 and 2050 targets.The scenarios are built on diferent renovation rates and depths and illustrate the impact o diferentambition levels regarding the European environment and economy.

7/29/2019 LR CbC Study
http://slidepdf.com/reader/full/lr-cbc-study 23/132
Europe’s buildings under the microscope | 23
7/29/2019 LR CbC Study
http://slidepdf.com/reader/full/lr-cbc-study 24/132
24 | Europe’s buildings under the microscope
mEthodology
BPIE has recently screened all EU27 countries together with Switzerland and Norwaywith the aim o collecting existing data related to buildings and building policies. Theexercise has been undertaken using a team o experts in each Member State plus Norwayand Switzerland. The data collected were mainly extracted rom ocial statistics andstudies at Member State level supported by expert estimations wherever ocial datawere unavailable. The inormation was gathered in the orm o a questionnaire whosestructure comprised ve principal levels:
Background
LegalFinancialTechnicalMonitor
The data have been used to give a resh and up-to-date picture o where we stand in terms o the energyperormance o our buildings and orm the basis upon which our scenarios are built. Through the surveycarried out by BPIE, inormation on the typology, characteristics (such as age, size, and ownership prole)and energy perormance o the building stock have been collected or the EU27 countries together withNorway and Switzerland. The dataset represents one o the most comprehensive assembled in Europeto date and ranges rom residential to non-residential buildings where the ollowing categories wereconsidered:
(a) Single amily houses(b) Apartment blocks(c) Oces(d) Educational buildings(e) Hospitals() Hotels and restaurants(g) Sports acilities(h) Wholesale and retail trade services buildings(i) Other types o energy-consuming buildings
Data have been gathered on the oor area o the building stock where 25 countries reported residentialand 19 reported non-residential oor area data in ull. A urther our countries reported partial data orthe oor area o non-residential buildings. The reported totals represented 92% o the total oor area inthe countries looked at and the nal 8% have been estimated. For the latter, estimates have been madeby taking the prevailing average across the dataset or oor area per person or the missing buildingcategory and multiplying this by the population o the country in question.
Care has been taken in the compilation o the data required to make additional estimations. For example,oor area data were reported at times in net oor area and other times in gross, net, useul or heated.Conversion actors were applied to aggregate all data in useul oor areas considering typical wallthickness levels as well as percentage oor space o buildings, which are non-heated and non-habitable
7/29/2019 LR CbC Study
http://slidepdf.com/reader/full/lr-cbc-study 25/132
Europe’s buildings under the microscope | 25
areas. These actors were dened or diferent types o buildings. Comparisons were urther complicatedby inconsistent denitions o many building typologies where assumptions had to be made in order tobroadly divide the reported data in the above unction types. In some cases, appropriate division was not
possible. For example, some countries reported industrial buildings in “other types o energy consumingbuildings” while others did not. In those cases, it was not possible to extract or estimate the portion o industrial buildings in order to provide consistent inormation or this unction type across all countries.
Data have also been gathered in terms o the age, size, ownership (private/public), tenure (owneroccupied, private or social tenant) location (rural/urban) and typical energy perormance levels o thebuilding stock. Good responses have generally been obtained by several countries in residential stock while gaps in responses were more prominent in the characteristics o the non-residential stock.
the chAllenges for the future
As this is probably the rst attempt to draw together a comprehensive and detailed picture o theresidential and non-residential building stock throughout Europe, a number o issues have beenidentied, among which the two key issues are:
Commondenitionofoorarea:Countries oten have diferent approaches to the measurement o oor area which can includeexternal gross, internal gross, net, heated and treated parts o a building. The same term may nothave the same meaning or denition in diferent countries. Moreover, assuming that two countriesadopt the same denition, the diferent approaches or taking measurements (e.g. measuring theattic space) imply that comparing the resulting oor areas is dicult. For these reasons, it would behelpul to have agreement on a common measurement principle which should probably correspondto the concept o ‘treated’ oor area, reerring to the portion o the building treated with some ormo heating and/or cooling (but excluding areas such as plant rooms, car parks and other non-treatedspaces). Some have proposed that building volume is a better metric when dealing with treatedspace because it is the volume o air that is heated or cooled. A small number o countries collectdata on building volume and in any case it can be even more dicult to dene, especially in the non-residential sector with suspended ceilings and raised oors complicating the measurement.
Commonbuildincateories:Data were collected or this report using the above set o categories (a-i) or residential and non-residential buildings. Most countries were able to present data in the required ormat but severalwere only able to provide data broken down into nationally dened sets o categories. Agreementaround a common set o building categories with a clear set o denitions o what should be included
and excluded would make or more reliable and comparable data in the uture, especially or non-residential types.
Addressing the above issues would require in many cases changes to the databases that countries areusing and hence the underlying legislation. Although this would require considerable efort, monitoringand evaluating current policies related to buildings signiy the urgent need or more data on the buildingstock. I the above issues are addressed in an appropriate way without overcomplicating the additionalwork, the case would be urther reinorced or buildings being a driving sector or achieving the overallclimate targets set or the EU. Without a solid oundation o data, it is dicult to monitor the impact andultimately design efective policies.
7/29/2019 LR CbC Study
http://slidepdf.com/reader/full/lr-cbc-study 26/132
26 | Europe’s buildings under the microscope
pArt 1 EuropE’s buildings todAy
“For strong policy making at EU and Member State levelit is key to establish an efcient monitoring system of theEuropean building stock assuring good data availabilityand data quality.”
7/29/2019 LR CbC Study
http://slidepdf.com/reader/full/lr-cbc-study 27/132
Europe’s buildings under the microscope | 27
A. building typology
From large commercial oces to terraced single amily houses, buildings in Europe vary remarkably in termso their unction type. They can be broadly divided into residential and non-residential sectors where eachsector alone consists o multiple types – e.g. in Germany there are 44 reported types7 within the residentialsector alone.
For the countries covered by this study8, it is estimated that there are 25 billion m2 o useul oor space, agure that, it has been reported, is increasing at a rate o around 1% per year. To illustrate what this guremeans in comparative terms, all EU buildings in terms o their gross oor space can be currently concentratedin a land area equivalent to that o Belgium (30,528 km2). In comparison to China and the US, Europe has thehighest ‘building density’ (building oor space over land area) ollowed by China and then US. Floor spacetrends can be linked to a number o actors such as wealth conditions, culture and land availability. Theseactors can explain the signicant diferences between Europe, US and China where oor space per capitaare around 48, 81 and 26 m2, respectively. Within Europe, diferences also exist rom country to country.
The general tendency is to seek larger oor spaces over time, especially under avourable economicconditions. With increasing trends in oor space, the energy demand associated with our buildings is alsoincreasing, which in turn highlights the need or improving the energy eciency o our current stock,especially that o older stock.
Improving the energy eciency o our buildings not only reduces energy consumption and subsequentlyenergy bills but also improves the aesthetics o a building, increases the value o the asset and provideshealthier conditions or the occupants.
Figure 1A1 – Building gross oor space in the EU27, Switzerland and Norway
Sources: Population gures: World Bank, Eurostat. Floor spaces: EU27 - BPIE survey 2011, US - Annual Energy Outlook 2011 with projections to 2035 (USEnergy Inormation Administration), China - Energy Eciency in Buildings, Facts & Trends ( WBCSD)
7 Based on extensive database or the German residential stock classied by construction year and building size published by IWU (Institut Wohnenund Umwelt - Institute o Housing and Environment).
8 Focus countries are: EU27, Norway and Switzerland. Based on estimations through the BPIE survey or which 9 2% o oor area was reported.The EU27 useul oor area is 24 billion m2.
bE
Population (2010) Land area (km2) Building Floor Space
EU27 501 million 4,324,782 24 billion m2
US 309 million 9,826,675 25 billion m2
China 1338 million 9,598,080 35 billion m2
Building gross oor space in the EU27,Switzerland and Norway
7/29/2019 LR CbC Study
http://slidepdf.com/reader/full/lr-cbc-study 28/132
28 | Europe’s buildings under the microscope
For the analytical purposes o this study, European countries have been divided up based upon climatic,
building typology and market similarities into three regions:• North&West
• South
• Central&East
Each region consists o the countries shown in the Table and map o Figure 1A2. It should be noted thathal o the total estimated oor space is located in the North & West region while the remaining 36% and14% are contained in the South and Central & East regions, respectively.
Figure 1A2 – Countries and regions considered herein with equivalent population and oor space
ures
Source: BPIE survey
North & West AT, BE, CH, DE, DK, FI, FR, IE, LU, NL, NO, SE, UK Population: 281 mil.
Central & East BG, CZ, EE, HU, LT, LV, PL, RO, SI, SK Population: 102 mil.
South CY, GR, ES, IT, MT, PT Population: 129 mil.
Floor space distribution
South36%
Central &East 14%
North& West50%
7/29/2019 LR CbC Study
http://slidepdf.com/reader/full/lr-cbc-study 29/132
Europe’s buildings under the microscope | 29
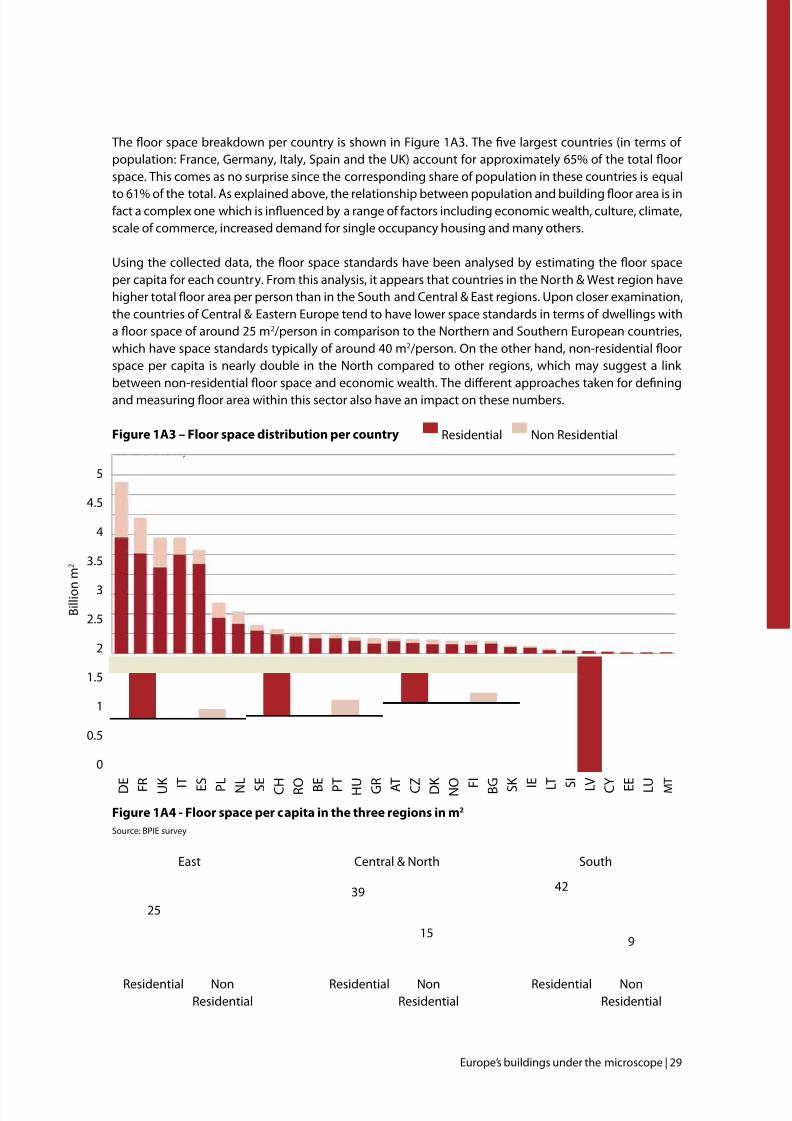
The oor space breakdown per country is shown in Figure 1A3. The ve largest countries (in terms o population: France, Germany, Italy, Spain and the UK) account or approximately 65% o the total oorspace. This comes as no surprise since the corresponding share o population in these countries is equal
to 61% o the total. As explained above, the relationship between population and building oor area is inact a complex one which is inuenced by a range o actors including economic wealth, culture, climate,scale o commerce, increased demand or single occupancy housing and many others.
Using the collected data, the oor space standards have been analysed by estimating the oor spaceper capita or each country. From this analysis, it appears that countries in the North & West region havehigher total oor area per person than in the South and Central & East regions. Upon closer examination,the countries o Central & Eastern Europe tend to have lower space standards in terms o dwellings witha oor space o around 25 m2/person in comparison to the Northern and Southern European countries,which have space standards typically o around 40 m2/person. On the other hand, non-residential oorspace per capita is nearly double in the North compared to other regions, which may suggest a link between non-residential oor space and economic wealth. The diferent approaches taken or deningand measuring oor area within this sector also have an impact on these numbers.
Figure 1A3 – Floor space distribution per country
Source: BPIE survey
Figure 1A4 - Floor space per capita in the three regions in m2
Source: BPIE survey
Residential
25
8
East
NonResidential
East
15
39
North & Central
Residential NonResidential
Central & North
9
42
South
Residential NonResidential
South
B i l l i o n
m 2
D E
F R U K I T
E S
P L
N L
S E
C H R O B E
P T
H U G R A T
C Z D K N O F
I
B G S K I E
L T
S
I
L V C Y E E
L U M T
Residential Non Residential
5
4.5
4
3.5
3
2.5
2
1.5
1
0.5
0
7/29/2019 LR CbC Study
http://slidepdf.com/reader/full/lr-cbc-study 30/132
30 | Europe’s buildings under the microscope
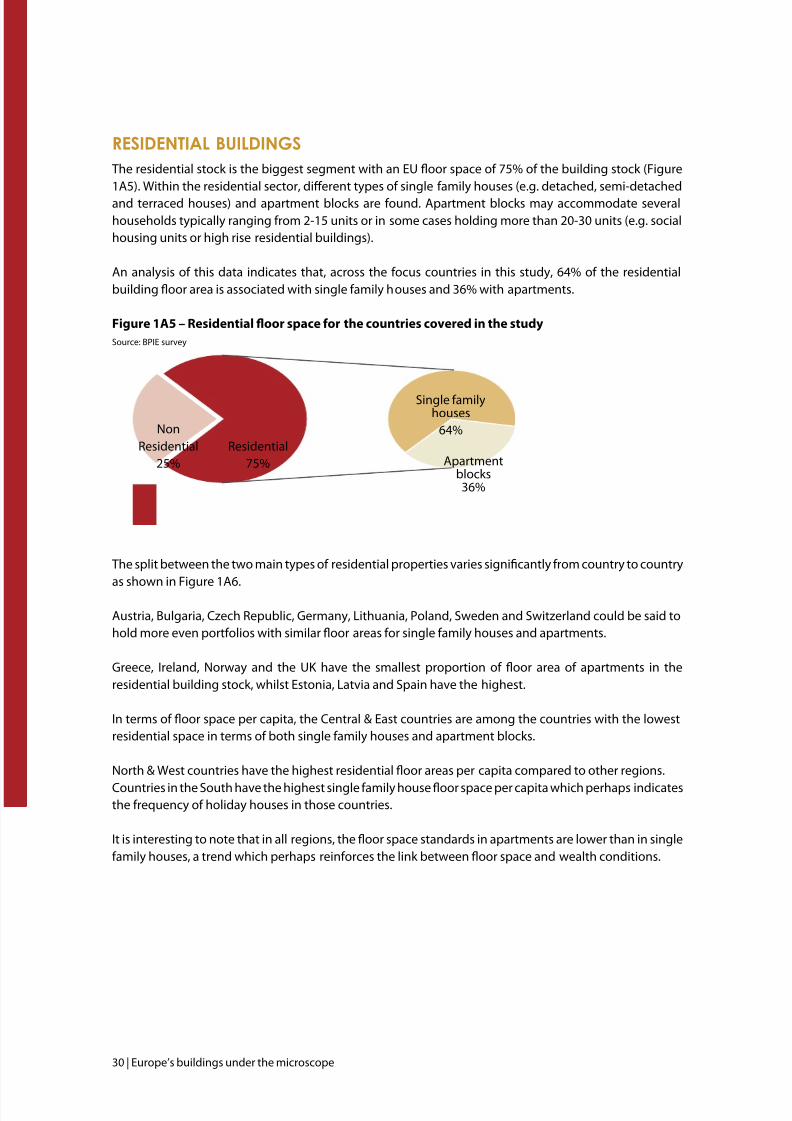
residentiAl buildings
The residential stock is the biggest segment with an EU oor space o 75% o the building stock (Figure1A5). Within the residential sector, diferent types o single amily houses (e.g. detached, semi-detachedand terraced houses) and apartment blocks are ound. Apartment blocks may accommodate severalhouseholds typically ranging rom 2-15 units or in some cases holding more than 20-30 units (e.g. socialhousing units or high rise residential buildings).
An analysis o this data indicates that, across the ocus countries in this study, 64% o the residentialbuilding oor area is associated with single amily houses and 36% with apartments.
Figure 1A5 – Residential oor space or the countries covered in the study
Source: BPIE survey
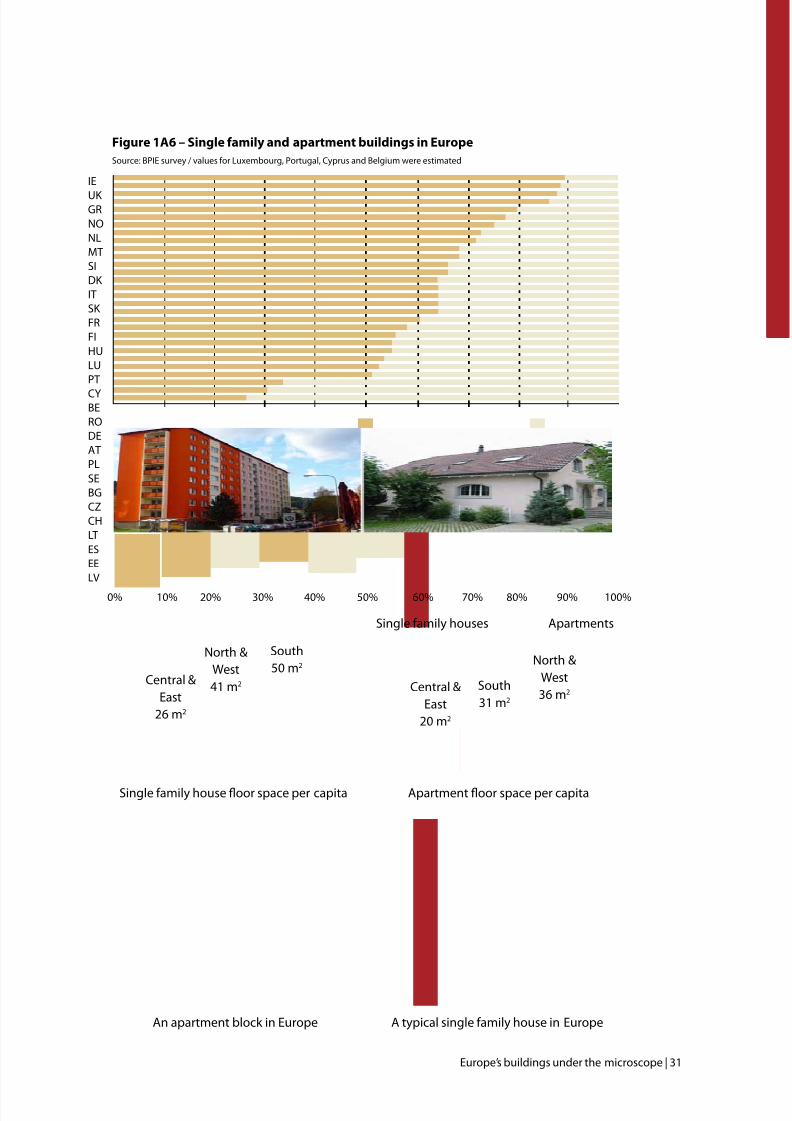
The split between the two main types o residential properties varies signicantly rom country to countryas shown in Figure 1A6.
Austria, Bulgaria, Czech Republic, Germany, Lithuania, Poland, Sweden and Switzerland could be said tohold more even portolios with similar oor areas or single amily houses and apartments.
Greece, Ireland, Norway and the UK have the smallest proportion o oor area o apartments in theresidential building stock, whilst Estonia, Latvia and Spain have the highest.
In terms o oor space per capita, the Central & East countries are among the countries with the lowestresidential space in terms o both single amily houses and apartment blocks.
North & West countries have the highest residential oor areas per capita compared to other regions.
Countries in the South have the highest single amily house oor space per capita which perhaps indicatesthe requency o holiday houses in those countries.
It is interesting to note that in all regions, the oor space standards in apartments are lower than in singleamily houses, a trend which perhaps reinorces the link between oor space and wealth conditions.
NonResidential
25%Residential
75%
Single amilyhouses
64%
Apartmentblocks
36%
7/29/2019 LR CbC Study
http://slidepdf.com/reader/full/lr-cbc-study 31/132
Europe’s buildings under the microscope | 31
Single amily houses Apartments
Single amily house oor space per capita
Central &East
26 m2
North &West41 m2
South50 m2
Apartment oor space per capita
Central &East
20 m2
North &West36 m2
South31 m2
A typical single amily house in EuropeAn apartment block in Europe
Figure 1A6 – Single amily and apartment buildings in Europe
Source: BPIE survey / values or Luxembourg, Portugal, Cyprus and Belgium were estimated
0% 10% 20% 30% 40% 50% 60% 70% 80% 90% 100%
IE
UK GRNONLMTSIDK ITSK FRFIHULUPT
CYBERODEATPLSEBGCZCHLTESEELV

7/29/2019 LR CbC Study
http://slidepdf.com/reader/full/lr-cbc-study 32/132
32 | Europe’s buildings under the microscope
Fiure1A7–Raneofnewbuildratesintheresidentialsector(2005-2010)whereSFandMFdenote single amily and multi-amily houses, respectively.
Source: BPIE survey
In terms o growth, annual rates in the residential sector are around 1% as depicted in Figure 1A7 whichshows the range o new build rates in the residential countries or a range o countries over the periodbetween 2005 and 2010.
Except The Netherlands (in the case o multi-amily houses), all other countries experienced a decrease inthe rate o new build in recent years, reecting the impact o the current nancial crisis in the constructionsector. Notably, this impact seems to be more pronounced in countries in Central & Eastern Europe as isthe case in Latvia, Romania and Poland.
non-residentiAl buildings
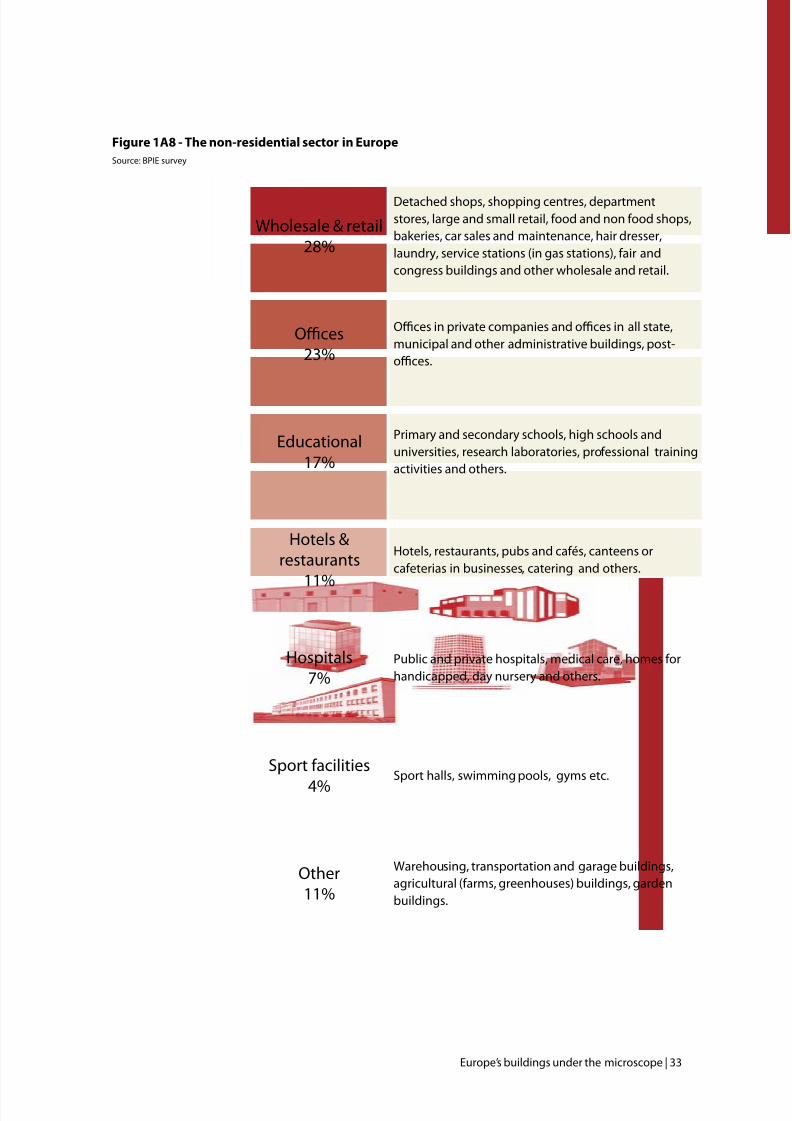
The diversity in terms o typology within the non-residential sector is vast. Compared to the residential sector,this sector is more complex and heterogeneous. It includes types such as oces, shops, hospitals, hotels,restaurants, supermarkets, schools, universities and sports centres while in some cases multiple unctions existin the same building. Moreover, diferences rom country to country are more pronounced, which in turn,makes the cross-country comparison o the denitions o various building categories more challenging.
In our survey, we have considered the ollowing broad categories: educational buildings, oces, hospitals,hotels and restaurants, sports acilities, wholesale and retail trade services buildings and other types o energy-consuming buildings. In each o these categories, a broad division between various subcategories has beenconsidered based on the list o Figure 1A8.
Figure 1A8 reveals the split between these categories at the European level. The retail and wholesale buildings
comprise the largest portion o the non-residential stock. These buildings are somewhat diferent romothers as heating and cooling conditions may difer substantially rom other categories due to large areas o wholesale buildings oten being used only or storage purposes.
In addition to this, diferences are also pronounced within this sector where there is no homogeneity in termso size, usage pattern (use hours) and construction style. This requires special attention when looking at theretail and wholesale sub-sectors.
Oce buildings are the second biggest category with a oor space corresponding to ¼ o the total non-residential oor space. Oces have similar heating and cooling conditions to residential buildings althoughthey are o shorter use. Similar usage pattern as oces are ound with educational buildings which count orless than 20% o the entire non-residential oor space.
Hospitals (7% o total non-residential oor space) have continuous usage patterns, where energy demand canvary substantially depending on the services provided (rom consultation rooms to surgery rooms).
2,5%
2,0%
1,5%
1,0%
0,5%
0,0%LT LVSF NLMF SI FR LVMF PL UK SEMF RO BG SESF BE
7/29/2019 LR CbC Study
http://slidepdf.com/reader/full/lr-cbc-study 33/132
Europe’s buildings under the microscope | 33
Figure 1A8 - The non-residential sector in Europe
Source: BPIE survey
Wholesale & retail28%
Detached shops, shopping centres, departmentstores, large and small retail, ood and non ood shops,bakeries, car sales and maintenance, hair dresser,laundry, service stations (in gas stations), air andcongress buildings and other wholesale and retail.
Oces23%
Oces in private companies and oces in all state,municipal and other administrative buildings, post-oces.
Educational17%
Primary and secondary schools, high schools anduniversities, research laboratories, proessional trainingactivities and others.
Hotels &restaurants
11%
Hotels, restaurants, pubs and caés, canteens orcaeterias in businesses, catering and others.
Hospitals7%
Public and private hospitals, medical care, homes orhandicapped, day nursery and others.
Sport acilities
4%Sport halls, swimming pools, gyms etc.
Other11%
Warehousing, transportation and garage buildings,agricultural (arms, greenhouses) buildings, gardenbuildings.
7/29/2019 LR CbC Study
http://slidepdf.com/reader/full/lr-cbc-study 34/132
34 | Europe’s buildings under the microscope
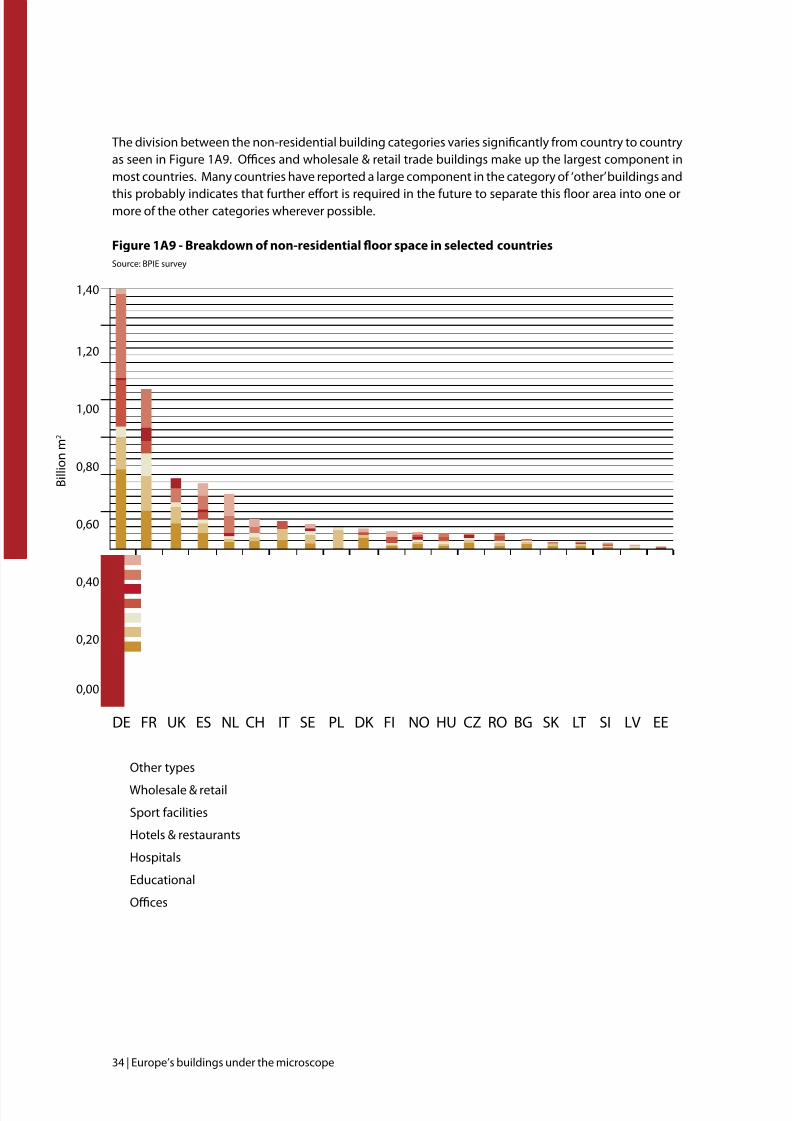
The division between the non-residential building categories varies signicantly rom country to countryas seen in Figure 1A9. Oces and wholesale & retail trade buildings make up the largest component inmost countries. Many countries have reported a large component in the category o ‘other’ buildings and
this probably indicates that urther efort is required in the uture to separate this oor area into one ormore o the other categories wherever possible.
Figure 1A9 - Breakdown o non-residential oor space in selected countries
Source: BPIE survey
Other types
Wholesale & retail
Sport acilities
Hotels & restaurants
Hospitals
Educational
Oces
DE FR UK ES NL CH IT SE PL DK FI NO HU CZ RO BG SK LT SI LV EE
1,40
1,20
1,00
0,80
0,60
0,40
0,20
0,00
B i l l i o n m 2
7/29/2019 LR CbC Study
http://slidepdf.com/reader/full/lr-cbc-study 35/132
Europe’s buildings under the microscope | 35
While the dataset o residential buildings is airly comprehensive, the non-residential stock is ar lesscovered, as the sector is associated with higher uncertainty levels due to the diculties in tracking theexisting stock o all diferent non-residential types and developing an appropriate statistical database.
Public buildings are in the limelight at the moment due to the policies requiring the public sector to leadby example where all new constructions in the sector are required to be o nearly zero energy standardsby end o 20189 while a sectoral renovation rate o at least 3% is recommended10.
The exercise carried out by BPIE has reinorced the need or collecting better data and urge a call or theestablishment o guidelines and requirements under which Member States should gather more extensiveand consistent data on the typology o their non-residential stock.
b. chArActeristics
In addition to typology, buildings vary greatly in terms o age, size and location. The data collected through oursurvey has allowed us to draw up a picture o these characteristics. These are discussed in more detail below.
Age
Buildings across Europe are associated with diferent time periods dating even beore the 1900s. Historicalbuildings certainly have a signicant heritage value while construction techniques and building regulationssuch as building codes imposed at the design phase have a great inuence on the energy perormance o abuilding built in a specic period.
In the residential sector, the age o a building is likely to be strongly linked to the level o energy use or themajority o buildings that have not undergone renovation to improve energy perormance.
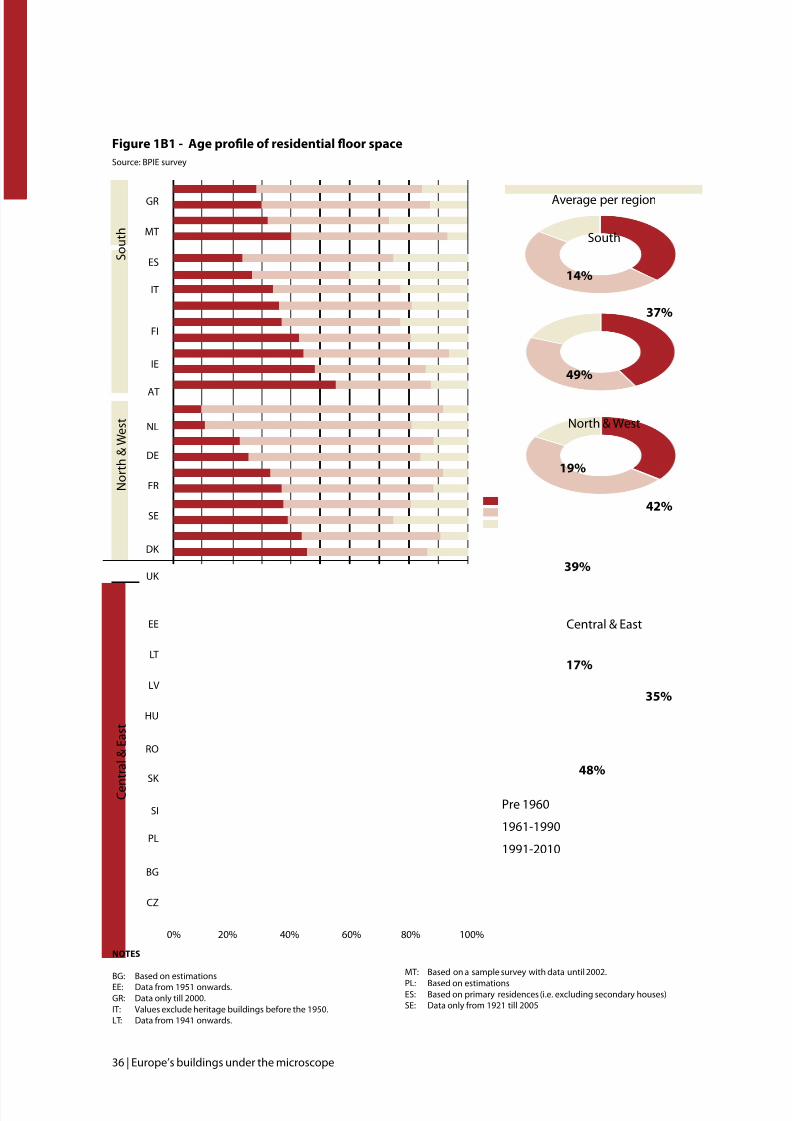
The BPIE survey has classied buildings in diferent age bands (specic chronological periods) or each country.In order to allow some comparison between the age proles o the residential building stock o diferentcountries, the oor area data or each country has been consolidated into three representative age bands 11:
Old: typically representing buildings up to 1960 Modern: typically representing buildings rom 1961 to 1990 Recent: typically representing buildings rom 1991 to 2010
Figure 1B1 shows the share o residential oor space by age band. The specic energy use within these agebands is likely to difer between countries in diferent regions o Europe due to a number o political, economicand social actors. The average composition or each region has been estimated by summing the oor area
by age band or all countries in the respective region where detailed data have been made available. Thevariations in the age prole between the three regions appear to be small where older buildings (beore 1960)have the biggest share in the North & West region. In particular, the countries with the largest componentso older buildings are the UK, Denmark, Sweden, France, Czech Republic and Bulgaria. It is also evident thatall countries experienced a large boom in construction in the ‘modern’ period (1961-1990) and with a ewexceptions, the housing stock more than doubled in this period.
Signicant country-by-country variations are also evident. The countries with the most recentlyconstructed buildings (1990-2010) appear to be Ireland, Spain, Poland and Finland, while countries withthe highest rate o construction in the ‘modern’ period (1961-1990) seem to be Estonia, Hungary, Latviaand Finland.
9 Based on the EPBD recast10 Based on the ‘Energy Eciency Plan’ 201111 A more detailed age breakdown was available in individual countries. When sorted at the regional level, it was possible to deduce the breakdown
in the three age groups identied herein.
7/29/2019 LR CbC Study
http://slidepdf.com/reader/full/lr-cbc-study 36/132
36 | Europe’s buildings under the microscope
Pre 1960
1961-1990
1991-2010
North & West
Central & East
42%
19%
39%
17%
35%
48%
Average per region
NOTES
BG: Based on estimationsEE: Data rom 1951 onwards.GR: Data only till 2000.IT: Values exclude heritage buildings beore the 1950.LT: Data rom 1941 onwards.
MT: Based on a sample survey with data until 2002.
PL: Based on estimationsES: Based on primary residences (i.e. excluding secondary houses)SE: Data only rom 1921 till 2005
Fiure1B1-AeproleofresidentialoorspaceSource: BPIE survey
FI
IE
AT
NL
DE
FR
SE
DK
UK
EE
0% 20% 40% 60% 80% 100%
LT
LV
HU
RO
SK
SI
PL
BG
CZ
N o r t h & W e s t
C e n
t r a l & E a s t
GR
MT
ES
IT
S o u t h
37%
14%
49%
South
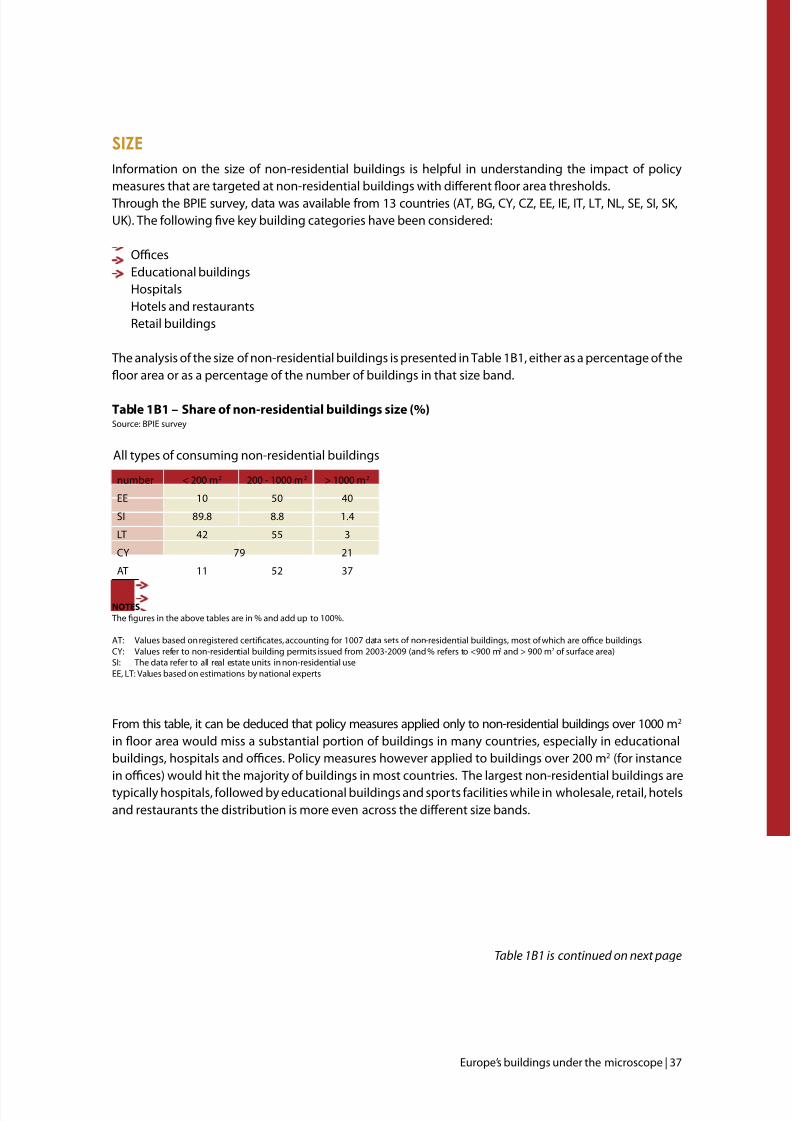
7/29/2019 LR CbC Study
http://slidepdf.com/reader/full/lr-cbc-study 37/132
Europe’s buildings under the microscope | 37
number < 200 m2 200 - 1000 m2 > 1000 m2
EE 10 50 40
SI 89.8 8.8 1.4
LT 42 55 3
CY 79 21
AT 11 52 37
All types o consuming non-residential buildings
size
Inormation on the size o non-residential buildings is helpul in understanding the impact o policymeasures that are targeted at non-residential buildings with diferent oor area thresholds.Through the BPIE survey, data was available rom 13 countries (AT, BG, CY, CZ, EE, IE, IT, LT, NL, SE, SI, SK,UK). The ollowing ve key building categories have been considered:
Oces Educational buildings Hospitals Hotels and restaurants Retail buildings
The analysis o the size o non-residential buildings is presented in Table 1B1, either as a percentage o theoor area or as a percentage o the number o buildings in that size band.
Table 1B1 – Share o non-residential buildings size (%)Source: BPIE survey
NOTES
The gures in the above tables are in % and add up to 100%.
AT: Values based on registered certicates, accounting or 1007 data sets o non-residential buildings, most o which are oce buildings.CY: Values reer to non-residential building permits issued rom 2003-2009 (and % reers to <900 m2 and > 900 m2 o surace area)SI: The data reer to all real estate units in non-residential useEE, LT: Values based on estimations by national experts
From this table, it can be deduced that policy measures applied only to non-residential buildings over 1000 m2 in oor area would miss a substantial portion o buildings in many countries, especially in educationalbuildings, hospitals and oces. Policy measures however applied to buildings over 200 m2 (or instancein oces) would hit the majority o buildings in most countries. The largest non-residential buildings aretypically hospitals, ollowed by educational buildings and sports acilities while in wholesale, retail, hotelsand restaurants the distribution is more even across the diferent size bands.
Table 1B1 is continued on next page
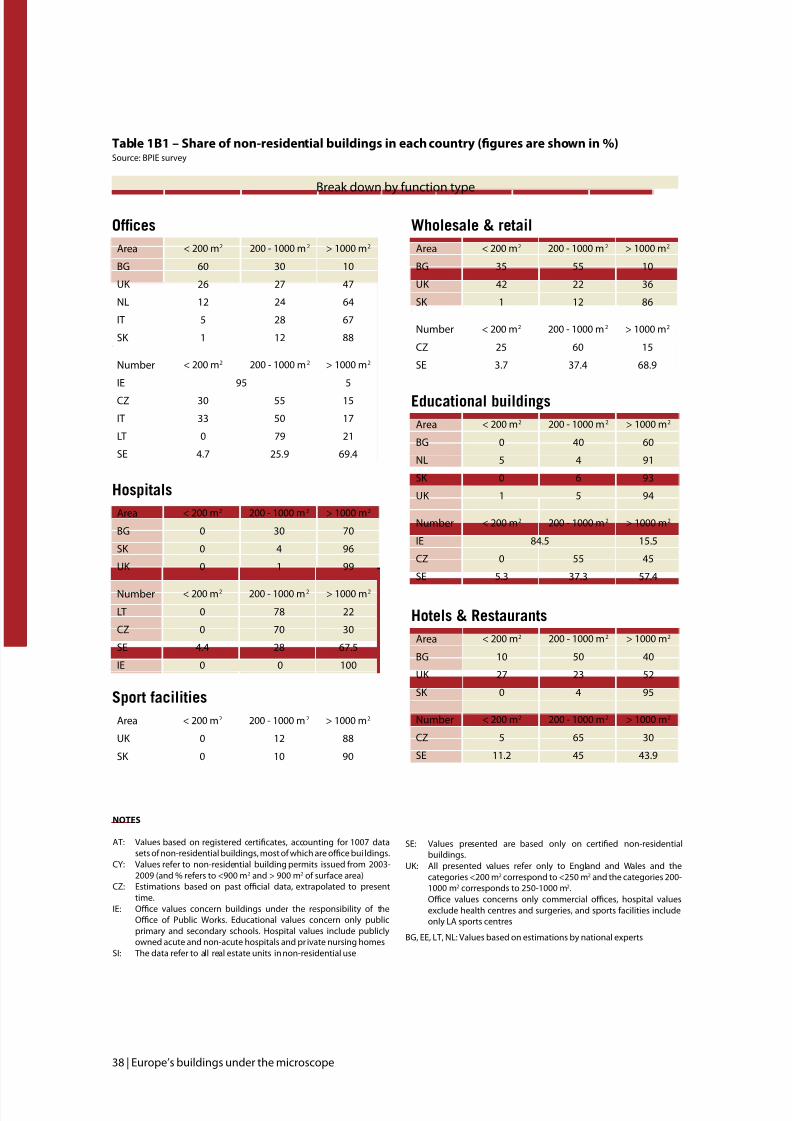
7/29/2019 LR CbC Study
http://slidepdf.com/reader/full/lr-cbc-study 38/132
38 | Europe’s buildings under the microscope
NOTES
AT: Values based on registered certicates, accounting or 1007 datasets o non-residential buildings, most o which are oce bui ldings.
CY: Values reer to non-residential building permits issued rom 2003-2009 (and % reers to <900 m 2 and > 900 m2 o surace area)
CZ: Estimations based on past ocial data, extrapolated to presenttime.
IE: Oce values concern buildings under the responsibility o theOce o Public Works. Educational values concern only publicprimary and secondary schools. Hospital values include publiclyowned acute and non-acute hospitals and pr ivate nursing homes
SI: The data reer to all real estate units in non-residential use
SE: Values presented are based only on certied non-residentialbuildings.
UK: All presented values reer only to England and Wales and thecategories <200 m2 correspond to <250 m2 and the categories 200-1000 m2 corresponds to 250-1000 m2.Oce values concerns only commercial oces, hospital valuesexclude health centres and surgeries, and sports acilities includeonly LA sports centres
BG, EE, LT, NL: Values based on estimations by national experts
Break down by unction type
Area < 200 m2 200 - 1000 m2 > 1000 m2
BG 10 50 40
UK 27 23 52
SK 0 4 95x
Number < 200 m2 200 - 1000 m2 > 1000 m2
CZ 5 65 30
SE 11.2 45 43.9
Area < 200 m2 200 - 1000 m2 > 1000 m2
UK 0 12 88
SK 0 10 90
Area < 200 m2 200 - 1000 m2 > 1000 m2
BG 0 30 70
SK 0 4 96
UK 0 1 99x
Number < 200 m2 200 - 1000 m2 > 1000 m2
LT 0 78 22
CZ 0 70 30
SE 4.4 28 67.5
IE 0 0 100
Area < 200 m2 200 - 1000 m2 > 1000 m2
BG 0 40 60
NL 5 4 91
SK 0 6 93
UK 1 5 94x
Number < 200 m2 200 - 1000 m2 > 1000 m2
IE 84.5 15.5
CZ 0 55 45
SE 5.3 37.3 57.4
he & reaa
s ae
ha
Eaa
Area < 200 m2 200 - 1000 m2 > 1000 m2
BG 60 30 10
UK 26 27 47
NL 12 24 64
IT 5 28 67
SK 1 12 88x
Number < 200 m2 200 - 1000 m2 > 1000 m2
IE 95 5
CZ 30 55 15
IT 33 50 17
LT 0 79 21
SE 4.7 25.9 69.4
Area < 200 m2 200 - 1000 m2 > 1000 m2
BG 35 55 10
UK 42 22 36
SK 1 12 86x
Number < 200 m2 200 - 1000 m2 > 1000 m2
CZ 25 60 15
SE 3.7 37.4 68.9
ofe weae & ea
Table1B1–Shareofnon-residentialbuildinsineachcountry(uresareshownin%)Source: BPIE survey
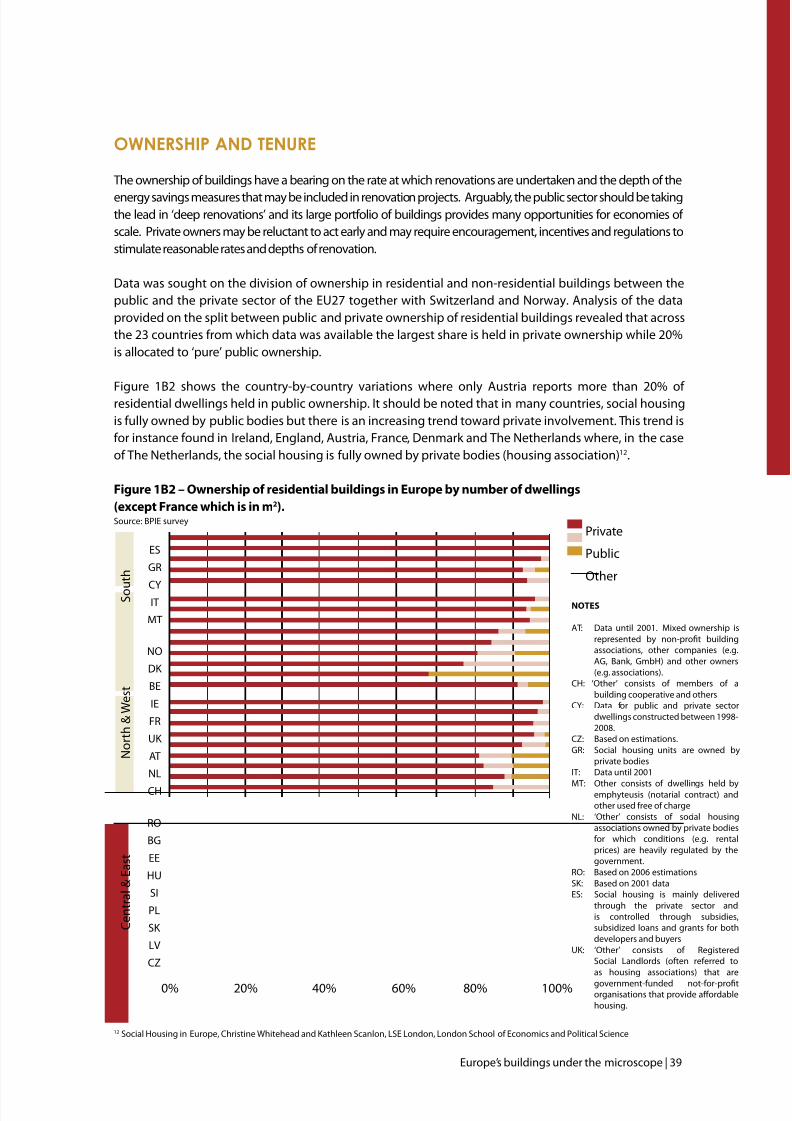
7/29/2019 LR CbC Study
http://slidepdf.com/reader/full/lr-cbc-study 39/132
Europe’s buildings under the microscope | 39
ownership And tenure
The ownership o buildings have a bearing on the rate at which renovations are undertaken and the depth o the
energy savings measures that may be included in renovation projects. Arguably, the public sector should be takingthe lead in ‘deep renovations’ and its large portolio o buildings provides many opportunities or economies o scale. Private owners may be reluctant to act early and may require encouragement, incentives and regulations tostimulate reasonable rates and depths o renovation.
Data was sought on the division o ownership in residential and non-residential buildings between thepublic and the private sector o the EU27 together with Switzerland and Norway. Analysis o the dataprovided on the split between public and private ownership o residential buildings revealed that acrossthe 23 countries rom which data was available the largest share is held in private ownership while 20%is allocated to ‘pure’ public ownership.
Figure 1B2 shows the country-by-country variations where only Austria reports more than 20% o residential dwellings held in public ownership. It should be noted that in many countries, social housingis ully owned by public bodies but there is an increasing trend toward private involvement. This trend isor instance ound in Ireland, England, Austria, France, Denmark and The Netherlands where, in the caseo The Netherlands, the social housing is ully owned by private bodies (housing association)12.
Figure 1B2 – Ownership o residential buildings in Europe by number o dwellings
(except France which is in m2).Source: BPIE survey
12 Social Housing in Europe, Christine Whitehead and Kathleen Scanlon, LSE London, London School o Economics and Political Science
NOTES
AT: Data until 2001. Mixed ownership isrepresented by non-prot buildingassociations, other companies (e.g.AG, Bank, GmbH) and other owners(e.g. associations).
CH: ‘Other’ consists o members o abuilding cooperative and others
CY: Data or public and private sectordwellings constructed between 1998-2008.
CZ: Based on estimations.GR: Social housing units are owned by
private bodiesIT: Data until 2001
MT: Other consists o dwellings held byemphyteusis (notarial contract) andother used ree o charge
NL: ‘Other’ consists o social housingassociations owned by private bodiesor which conditions (e.g. rentalprices) are heavily regulated by thegovernment.
RO: Based on 2006 estimationsSK: Based on 2001 dataES: Social housing is mainly delivered
through the private sector andis controlled through subsidies,subsidized loans and grants or bothdevelopers and buyers
UK: ‘Other’ consists o RegisteredSocial Landlords (oten reerred toas housing associations) that are
government-unded not-or-protorganisations that provide afordablehousing.
Private
Public
Other
ES
GR
CYIT
MT
NO
DK
BE
IE
FR
UK
AT
NL
CH
RO
BG
EE
HU
SI
PL
SK
LV
CZ
0% 20% 40% 60% 80% 100%
S o u t h
N o r t h & W e s t
C e n t r a l & E a s t
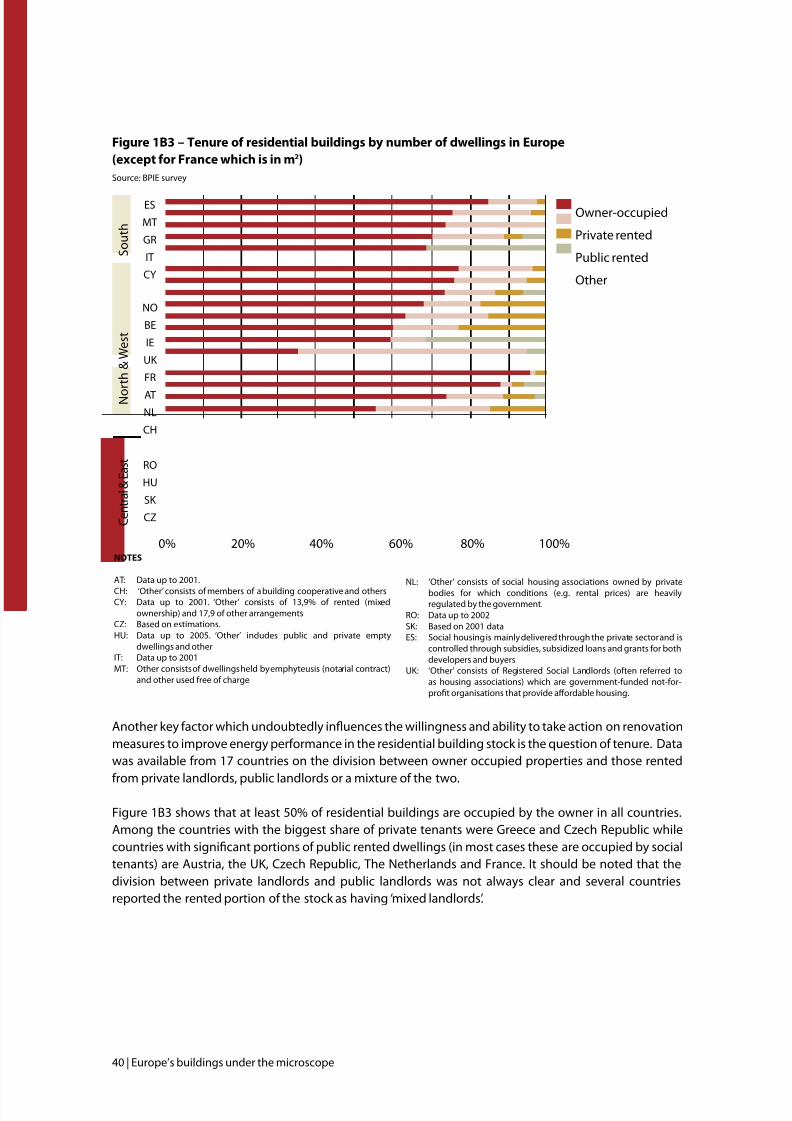
7/29/2019 LR CbC Study
http://slidepdf.com/reader/full/lr-cbc-study 40/132
40 | Europe’s buildings under the microscope
Figure 1B3 – Tenure o residential buildings by number o dwellings in Europe
(except or France which is in m2)
Source: BPIE survey
Another key actor which undoubtedly inuences the willingness and ability to take action on renovationmeasures to improve energy perormance in the residential building stock is the question o tenure. Datawas available rom 17 countries on the division between owner occupied properties and those rentedrom private landlords, public landlords or a mixture o the two.
Figure 1B3 shows that at least 50% o residential buildings are occupied by the owner in all countries.Among the countries with the biggest share o private tenants were Greece and Czech Republic whilecountries with signicant portions o public rented dwellings (in most cases these are occupied by socialtenants) are Austria, the UK, Czech Republic, The Netherlands and France. It should be noted that thedivision between private landlords and public landlords was not always clear and several countriesreported the rented portion o the stock as having ‘mixed landlords’.
NOTES
AT: Data up to 2001.
CH: ‘Other’ consists o members o a building cooperative and othersCY: Data up to 2001. ‘Other’ consists o 13,9% o rented (mixed
ownership) and 17,9 o other arrangementsCZ: Based on estimations.HU: Data up to 2005. ‘Other’ includes public and private empty
dwellings and otherIT: Data up to 2001MT: Other consists o dwellings held by emphyteusis (notarial contract)
and other used ree o charge
NL: ‘Other’ consists o social housing associations owned by privatebodies or which conditions (e.g. rental prices) are heavilyregulated by the government.
RO: Data up to 2002SK: Based on 2001 dataES: Social housing is mainly delivered through the private sector and is
controlled through subsidies, subsidized loans and grants or bothdevelopers and buyers
UK: ‘Other’ consists o Registered Social Landlords (oten reerred toas housing associations) which are government-unded not-or-prot organisations that provide afordable housing.
Owner-occupied
Private rented
Public rented
Other
0% 20% 40% 60% 80% 100%
S o u t h
N o
r t h & W e s t
C e n t r a l & E a s t
ES
MT
GR
IT
CY
NO
BE
IE
UK
FR
ATNL
CH
RO
HU
SK
CZ
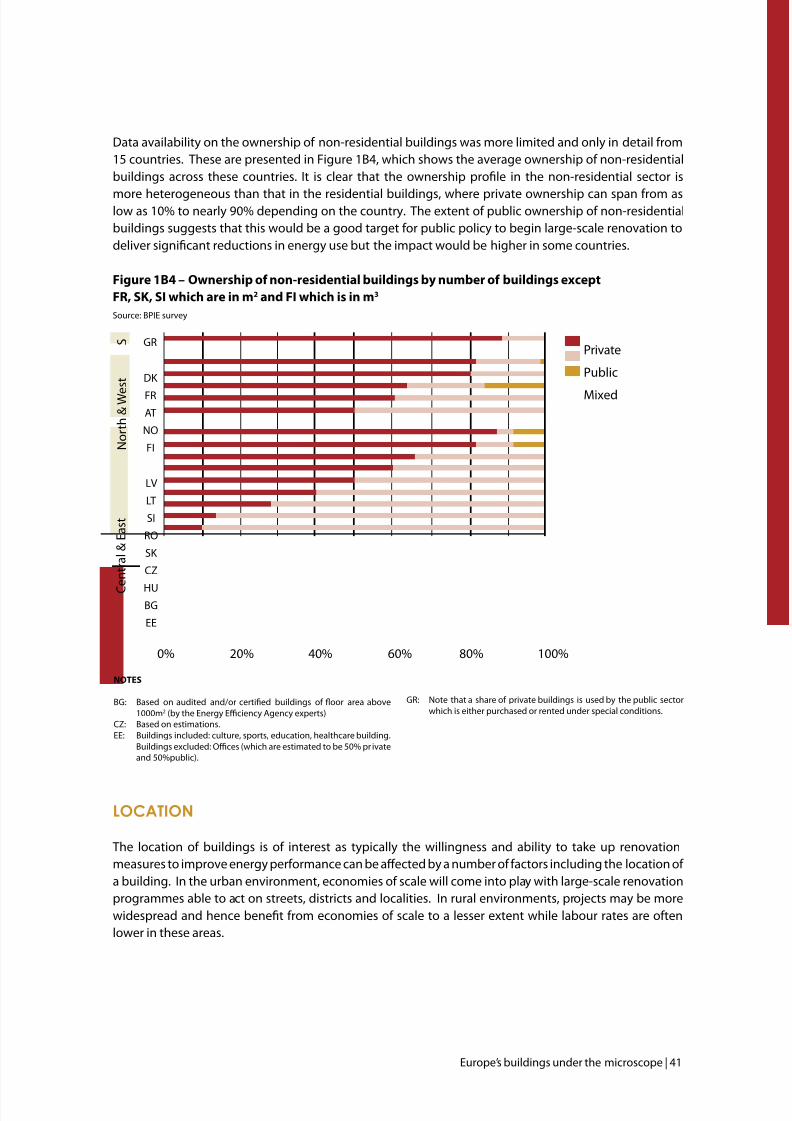
7/29/2019 LR CbC Study
http://slidepdf.com/reader/full/lr-cbc-study 41/132
Europe’s buildings under the microscope | 41
Data availability on the ownership o non-residential buildings was more limited and only in detail rom15 countries. These are presented in Figure 1B4, which shows the average ownership o non-residentialbuildings across these countries. It is clear that the ownership prole in the non-residential sector is
more heterogeneous than that in the residential buildings, where private ownership can span rom aslow as 10% to nearly 90% depending on the country. The extent o public ownership o non-residentialbuildings suggests that this would be a good target or public policy to begin large-scale renovation todeliver signicant reductions in energy use but the impact would be higher in some countries.
Figure 1B4 – Ownership o non-residential buildings by number o buildings except
FR, SK, SI which are in m2 and FI which is in m3
Source: BPIE survey
locAtion
The location o buildings is o interest as typically the willingness and ability to take up renovationmeasures to improve energy perormance can be afected by a number o actors including the location o a building. In the urban environment, economies o scale will come into play with large-scale renovationprogrammes able to act on streets, districts and localities. In rural environments, projects may be morewidespread and hence benet rom economies o scale to a lesser extent while labour rates are otenlower in these areas.
NOTES
BG: Based on audited and/or certied buildings o oor area above1000m2 (by the Energy Eciency Agency experts)
CZ: Based on estimations.EE: Buildings included: culture, sports, education, healthcare building.
Buildings excluded: Oces (which are estimated to be 50% pr ivateand 50%public).
GR: Note that a share o private buildings is used by the public sectorwhich is either purchased or rented under special conditions.
LV
LT
SI
RO
SK
CZ
HUBG
EE
DK
FRAT
NO
FI
GR
0% 20% 40% 60% 80% 100%
N o r t h & W e
s t
S
C e n t r a l & E a s t
Private
Public
Mixed
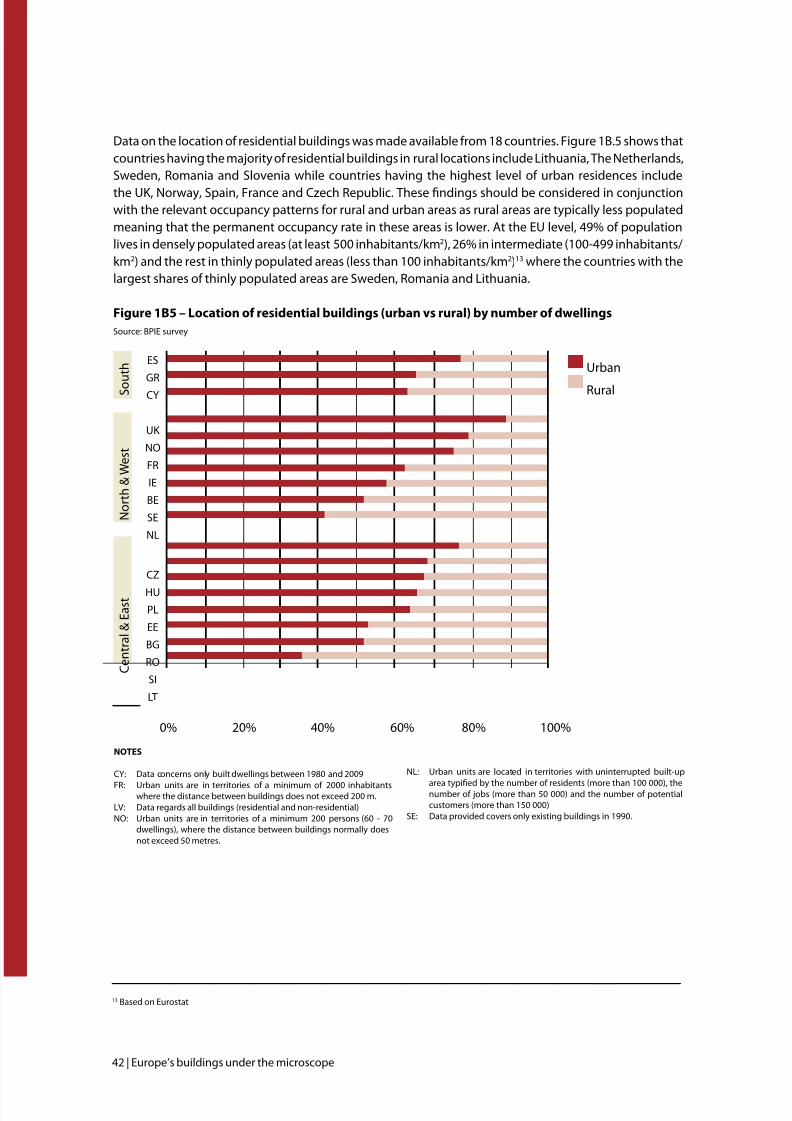
7/29/2019 LR CbC Study
http://slidepdf.com/reader/full/lr-cbc-study 42/132
42 | Europe’s buildings under the microscope
NOTES
CY: Data concerns only built dwellings between 1980 and 2009
FR: Urban units are in territories o a minimum o 2000 inhabitantswhere the distance between buildings does not exceed 200 m.
LV: Data regards all buildings (residential and non-residential)NO: Urban units are in territories o a minimum 200 persons (60 - 70
dwellings), where the distance between buildings normally doesnot exceed 50 metres.
NL: Urban units are located in territories with uninterrupted built-up
area typied by the number o residents (more than 100 000), thenumber o jobs (more than 50 000) and the number o potentialcustomers (more than 150 000)
SE: Data provided covers only existing buildings in 1990.
Urban
Rural
CZ
HUPL
EE
BG
RO
SI
LT
UK
NO
FR
IE
BE
SE
NL
ES
GR
CY
0% 20% 40% 60% 80% 100%
N o r t h & W e s t
C e n t r a l & E a s t
S
o u t h
Data on the location o residential buildings was made available rom 18 countries. Figure 1B.5 shows thatcountries having the majority o residential buildings in rural locations include Lithuania, The Netherlands,Sweden, Romania and Slovenia while countries having the highest level o urban residences include
the UK, Norway, Spain, France and Czech Republic. These ndings should be considered in conjunctionwith the relevant occupancy patterns or rural and urban areas as rural areas are typically less populatedmeaning that the permanent occupancy rate in these areas is lower. At the EU level, 49% o populationlives in densely populated areas (at least 500 inhabitants/km2), 26% in intermediate (100-499 inhabitants/km2) and the rest in thinly populated areas (less than 100 inhabitants/km2)13 where the countries with thelargest shares o thinly populated areas are Sweden, Romania and Lithuania.
Figure 1B5 – Location o residential buildings (urban vs rural) by number o dwellings
Source: BPIE survey
13 Based on Eurostat
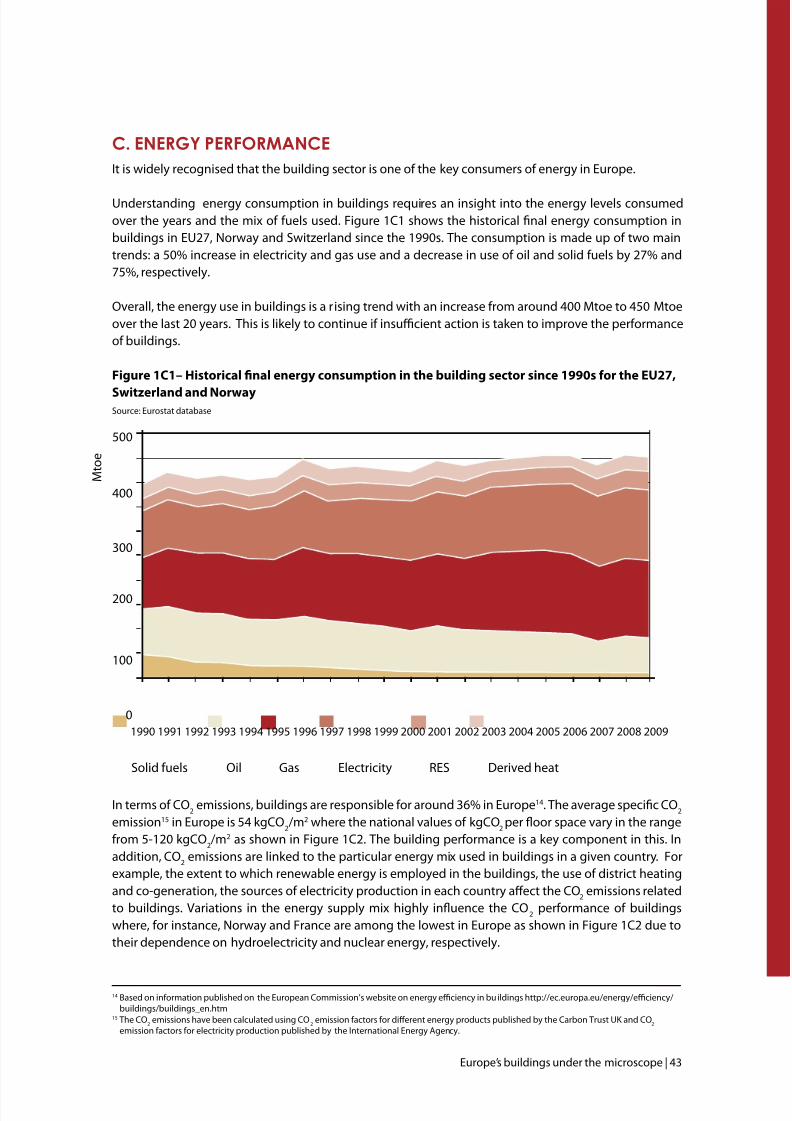
7/29/2019 LR CbC Study
http://slidepdf.com/reader/full/lr-cbc-study 43/132
Europe’s buildings under the microscope | 43
c. energy performAnce
It is widely recognised that the building sector is one o the key consumers o energy in Europe.
Understanding energy consumption in buildings requires an insight into the energy levels consumedover the years and the mix o uels used. Figure 1C1 shows the historical nal energy consumption inbuildings in EU27, Norway and Switzerland since the 1990s. The consumption is made up o two maintrends: a 50% increase in electricity and gas use and a decrease in use o oil and solid uels by 27% and75%, respectively.
Overall, the energy use in buildings is a rising trend with an increase rom around 400 Mtoe to 450 Mtoeover the last 20 years. This is likely to continue i insucient action is taken to improve the perormanceo buildings.
Fiure1C1–Historicalnaleneryconsumptioninthebuildinsectorsince1990sfortheEU27,
Switzerland and NorwaySource: Eurostat database
In terms o CO2
emissions, buildings are responsible or around 36% in Europe14. The average specic CO2
emission15 in Europe is 54 kgCO2/m2 where the national values o kgCO
2per oor space vary in the range
rom 5-120 kgCO2/m2 as shown in Figure 1C2. The building perormance is a key component in this. In
addition, CO2
emissions are linked to the particular energy mix used in buildings in a given country. Forexample, the extent to which renewable energy is employed in the buildings, the use o district heatingand co-generation, the sources o electricity production in each country afect the CO
2emissions related
to buildings. Variations in the energy supply mix highly inuence the CO2
perormance o buildingswhere, or instance, Norway and France are among the lowest in Europe as shown in Figure 1C2 due totheir dependence on hydroelectricity and nuclear energy, respectively.
Solid uels Oil Gas Electricity RES Derived heat
1990 1991 1992 1993 1994 1995 1996 1997 1998 1999 2000 2001 2002 2003 2004 2005 2006 2007 2008 2009
500
400
300
200
100
0
M t o e
14 Based on inormation published on the European Commission’s website on energy eciency in bu ildings http://ec.europa.eu/energy/eciency/buildings/buildings_en.htm
15 The CO2
emissions have been calculated using CO2
emission actors or diferent energy products published by the Carbon Trust UK and CO2
emission actors or electricity production published by the International Energy Agency.
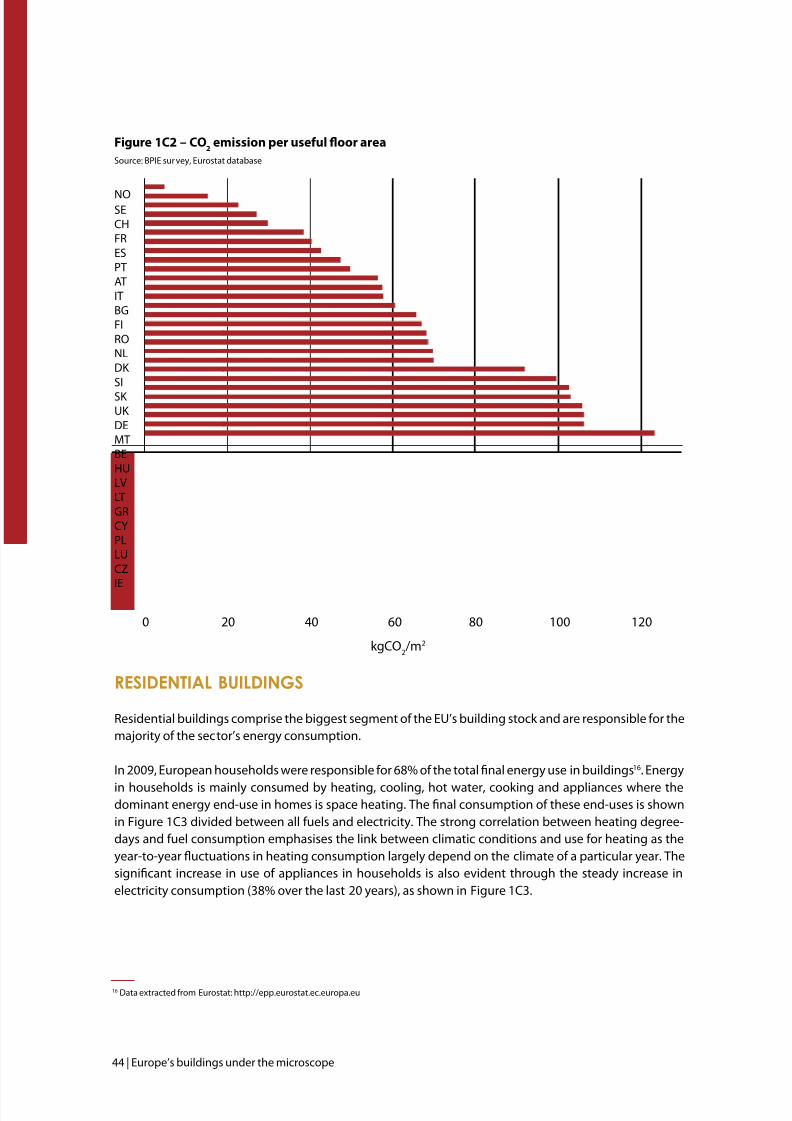
7/29/2019 LR CbC Study
http://slidepdf.com/reader/full/lr-cbc-study 44/132
44 | Europe’s buildings under the microscope
16 Data extracted rom Eurostat: http://epp.eurostat.ec.europa.eu
Figure 1C2 – CO2
emission per useul oor area
Source: BPIE survey, Eurostat database
residentiAl buildings
Residential buildings comprise the biggest segment o the EU’s building stock and are responsible or themajority o the sector’s energy consumption.
In 2009, European households were responsible or 68% o the total nal energy use in buildings16. Energy
in households is mainly consumed by heating, cooling, hot water, cooking and appliances where thedominant energy end-use in homes is space heating. The nal consumption o these end-uses is shownin Figure 1C3 divided between all uels and electricity. The strong correlation between heating degree-days and uel consumption emphasises the link between climatic conditions and use or heating as theyear-to-year uctuations in heating consumption largely depend on the climate o a particular year. Thesignicant increase in use o appliances in households is also evident through the steady increase inelectricity consumption (38% over the last 20 years), as shown in Figure 1C3.
NOSECHFRESPTATITBGFIRONLDK SI
SK UK DEMTBEHULVLTGRCYPLLUCZ
IE
0 20 40 60 80 100 120
kgCO2/m2
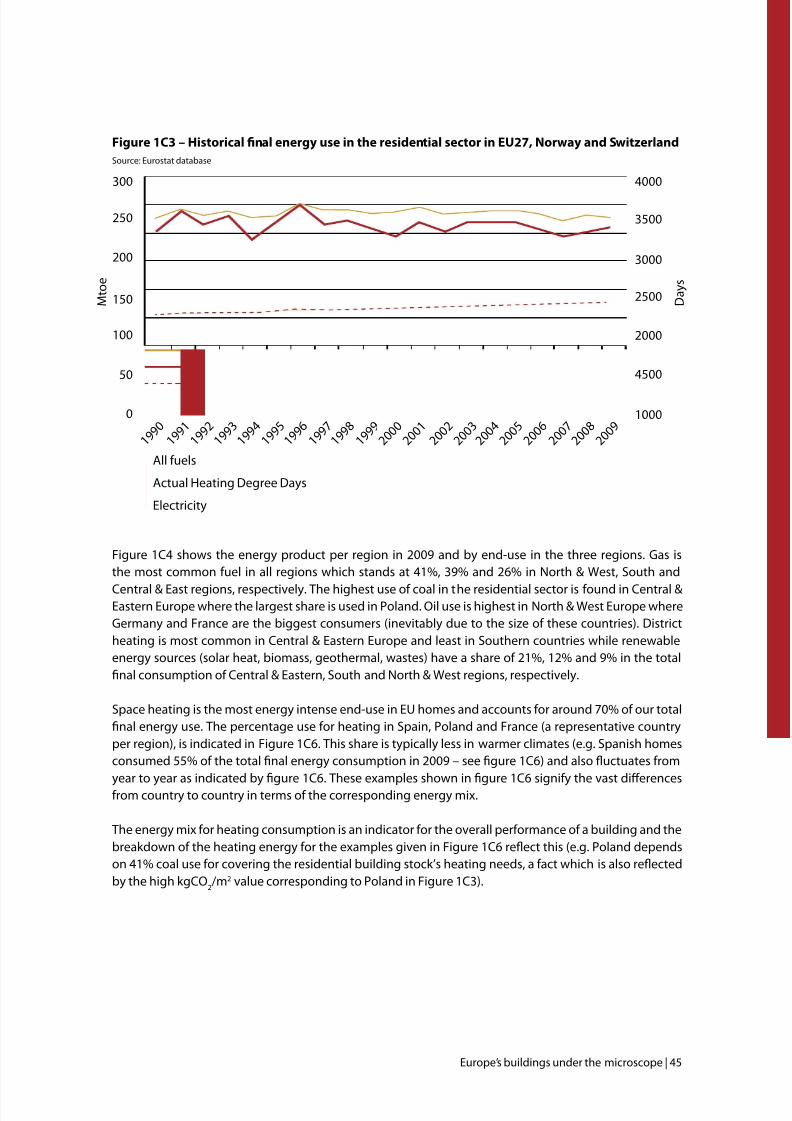
7/29/2019 LR CbC Study
http://slidepdf.com/reader/full/lr-cbc-study 45/132
Europe’s buildings under the microscope | 45
Fiure1C3–HistoricalnaleneryuseintheresidentialsectorinEU27,NorwayandSwitzerlandSource: Eurostat database
Figure 1C4 shows the energy product per region in 2009 and by end-use in the three regions. Gas isthe most common uel in all regions which stands at 41%, 39% and 26% in North & West, South and
Central & East regions, respectively. The highest use o coal in the residential sector is ound in Central &Eastern Europe where the largest share is used in Poland. Oil use is highest in North & West Europe whereGermany and France are the biggest consumers (inevitably due to the size o these countries). Districtheating is most common in Central & Eastern Europe and least in Southern countries while renewableenergy sources (solar heat, biomass, geothermal, wastes) have a share o 21%, 12% and 9% in the totalnal consumption o Central & Eastern, South and North & West regions, respectively.
Space heating is the most energy intense end-use in EU homes and accounts or around 70% o our totalnal energy use. The percentage use or heating in Spain, Poland and France (a representative countryper region), is indicated in Figure 1C6. This share is typically less in warmer climates (e.g. Spanish homesconsumed 55% o the total nal energy consumption in 2009 – see gure 1C6) and also uctuates romyear to year as indicated by gure 1C6. These examples shown in gure 1C6 signiy the vast diferencesrom country to country in terms o the corresponding energy mix.
The energy mix or heating consumption is an indicator or the overall perormance o a building and thebreakdown o the heating energy or the examples given in Figure 1C6 reect this (e.g. Poland dependson 41% coal use or covering the residential building stock’s heating needs, a act which is also reectedby the high kgCO
2/m2 value corresponding to Poland in Figure 1C3).
All uels
Actual Heating Degree Days
Electricity
4000300
250
200
150
100
50
0
3500
3000
2500
2000
4500
1000
1 9 9 0
1 9 9 1
1 9 9 2
1 9 9 3
1 9 9 4
1 9 9 5
1 9 9 6
1 9 9 7
1 9 9 8
1 9 9 9
2 0 0 0
2 0 0 1
2 0 0 2
2 0 0 3
2 0 0 4
2 0 0 5
2 0 0 6
2 0 0 7
2 0 0 8
2 0 0 9
M t o e
D a y s
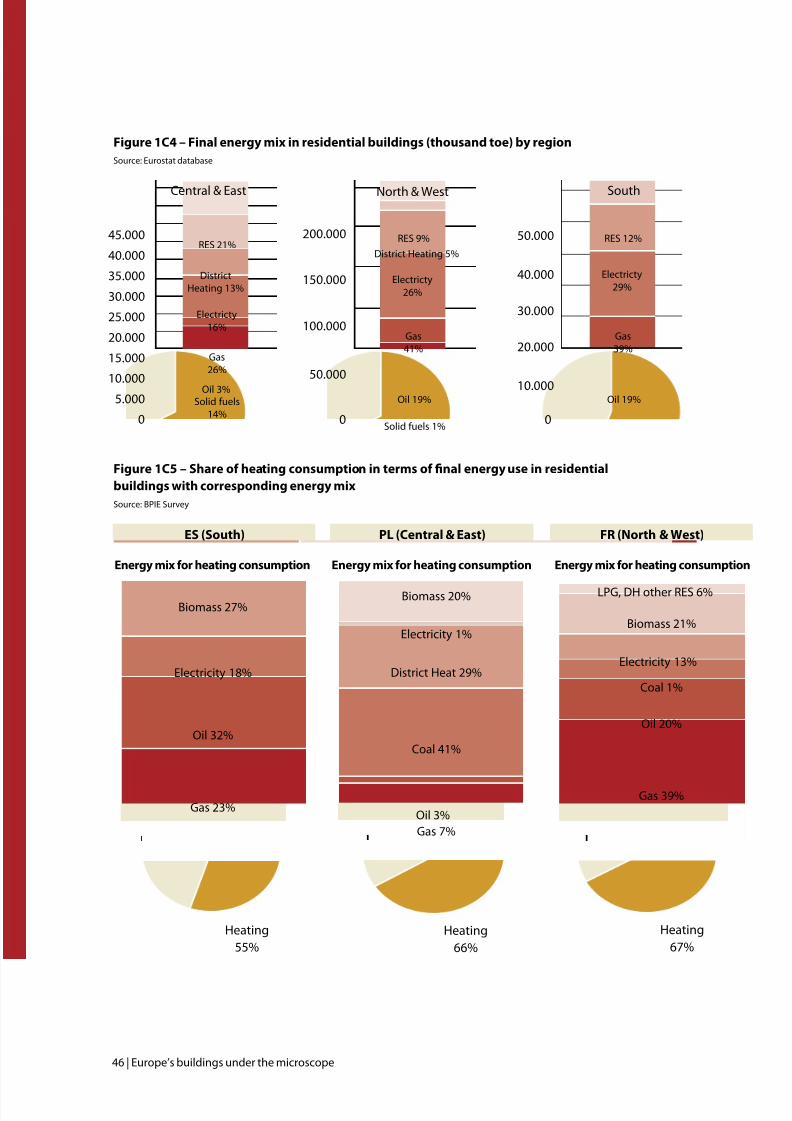
7/29/2019 LR CbC Study
http://slidepdf.com/reader/full/lr-cbc-study 46/132
46 | Europe’s buildings under the microscope
Central & East
45.000
40.000
35.000
30.000
25.000
20.000
15.000
10.000
5.000
0
RES 21%
Electricty16%
Solid uels14%
Gas26%
Oil 3%
DistrictHeating 13%
South
50.000
40.000
30.000
20.000
10.000
0
North & West
200.000
150.000
100.000
50.000
0
Energy mix or heating consumption
ES (South)
Biomass 27%
Electricity 18%
Heating55%
Oil 32%
Gas 23%
Energy mix or heating consumption
PL (Central & East)
Biomass 20%
District Heat 29%
Coal 41%
Gas 7%Oil 3%
Electricity 1%
Heating66%
Figure 1C4 – Final energy mix in residential buildings (thousand toe) by region
Source: Eurostat database
Fiure1C5–Shareofheatinconsumptionintermsofnaleneryuseinresidentialbuildings with corresponding energy mix
Source: BPIE Survey
RES 9% RES 12%
Electricty26%
Electricty29%
Solid uels 1%
Gas41%
Gas39%
Oil 19% Oil 19%
District Heating 5%
Energy mix or heating consumption
FR (North & West)
Gas 39%
Oil 20%
Electricity 13%
Biomass 21%
LPG, DH other RES 6%
Heating67%
Coal 1%
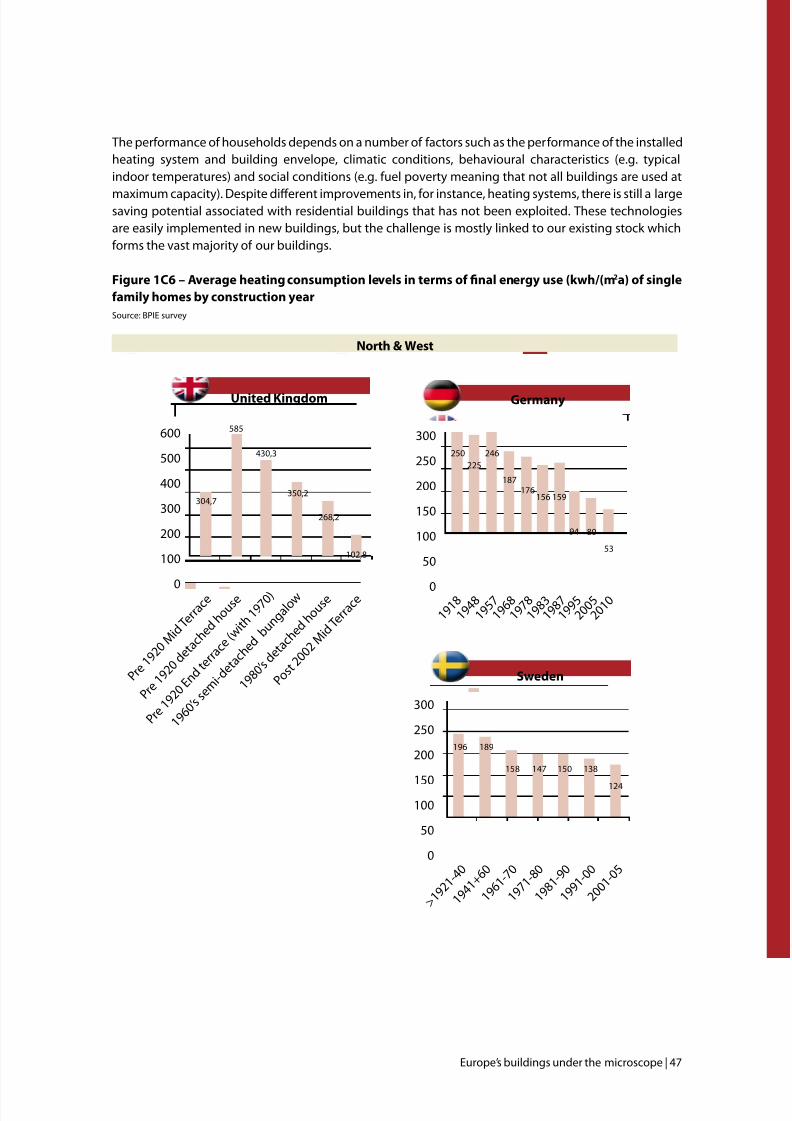
7/29/2019 LR CbC Study
http://slidepdf.com/reader/full/lr-cbc-study 47/132
Europe’s buildings under the microscope | 47
North & West
The perormance o households depends on a number o actors such as the perormance o the installedheating system and building envelope, climatic conditions, behavioural characteristics (e.g. typicalindoor temperatures) and social conditions (e.g. uel poverty meaning that not all buildings are used at
maximum capacity). Despite diferent improvements in, or instance, heating systems, there is still a largesaving potential associated with residential buildings that has not been exploited. These technologiesare easily implemented in new buildings, but the challenge is mostly linked to our existing stock whichorms the vast majority o our buildings.
Fiure1C6–Aeraeheatinconsumptionleelsintermsofnaleneryuse(kwh/(m2a) o single
amily homes by construction year
Source: BPIE survey
Sweden
300
250
200
150100
50
0
> 1 9 2
1 - 4 0
1 9 4 1
+ 6 0
1 9 6 1
- 7 0
1 9 7 1
- 8 0
1 9 8 1
- 9 0
1 9 9 1
- 0 0
2 0 0 1
- 0 5
196 189
158 147 150 138
124
Germany
300
250
200
150
100
50
0
1 9 1 8
1 9 4 8 1 9
5 7 1 9
6 8 1 9
7 8 1 9
8 3 1 9
8 7 1 9
9 5 2 0
0 5 2 0
1 0
225246250
187
159156176
8094
53
600
500
400
300
200
100
0
United Kingdom
P r e 1
9 2 0 M
i d T e r r a
c e
P r e 1
9 2 0 d
e t a c h e
d h o u
s e
P r e 1
9 2 0 E
n d t e r r a
c e ( w i t h
1 9 7 0 )
1 9 6 0
’ s s e m
i - d e t a c h e
d b u
n g a l o
w
1 9 8 0
’ s d e t a c h e
d h o u
s e
P o s t 2 0
0 2 M i d
T e r r a
c e
304,7
585
430,3
350,2
268,2
102,8
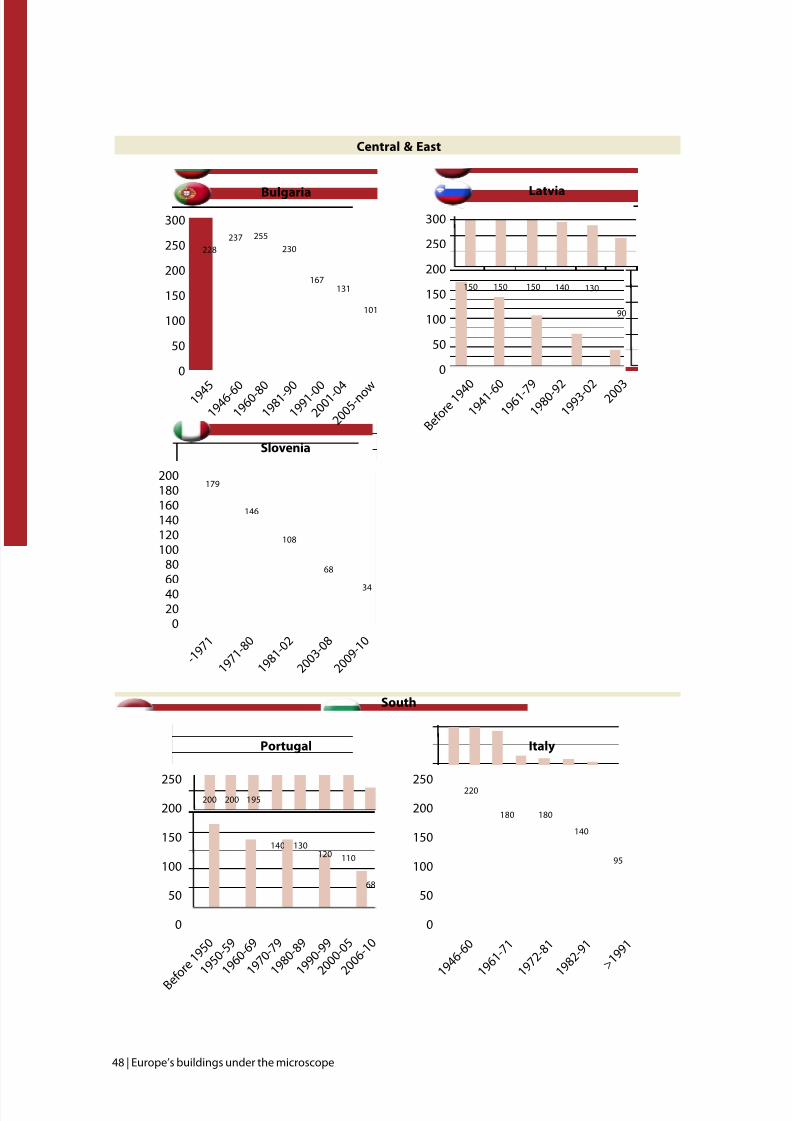
7/29/2019 LR CbC Study
http://slidepdf.com/reader/full/lr-cbc-study 48/132
48 | Europe’s buildings under the microscope
Central & East
South
Bulgaria
300
250
200
150
100
50
0
1 9 4 5
1 9 4 6 - 6
0
1 9 6 0 - 8
0
1 9 8 1 - 9
0
1 9 9 1 - 0
0
2 0 0 5
- n o w 2 0
0 1 - 0 4
228237 255
230
167131
101
Latvia
300
250
200
150
100
50
0
B e o r e 1 9 4
0
1 9 4 1 - 6
0
1 9 6 1 - 7
9
1 9 8 0 - 9
2
1 9 9 3 - 0
2 2 0 0
3
150 150150 140 130
90
Slovenia
200180160140120100
80604020
0
- 1 9 7
1
1 9 7 1
- 8 0
1 9 8 1
- 0 2
2 0 0 3
- 0 8
2 0 0 9
- 1 0
179
146
108
68
34
Portugal
B e o r e
1 9 5 0
1 9 5 0
- 5 9
1 9 6 0
- 6 9
1 9 7 0
- 7 9
1 9 8 0
- 8 9
2 0 0 0
- 0 5
2 0 0 6
- 1 0
1 9 9 0
- 9 9
200 200 195
140 130120 110
68
Italy
250200
150
100
50
0
250200
150
100
50
0
1 9 6 1
- 7 1
1 9 4 6
- 6 0
1 9 7 2
- 8 1
> 1 9 9
1
1 9 8 2
- 9 1
220
180 180
140
95
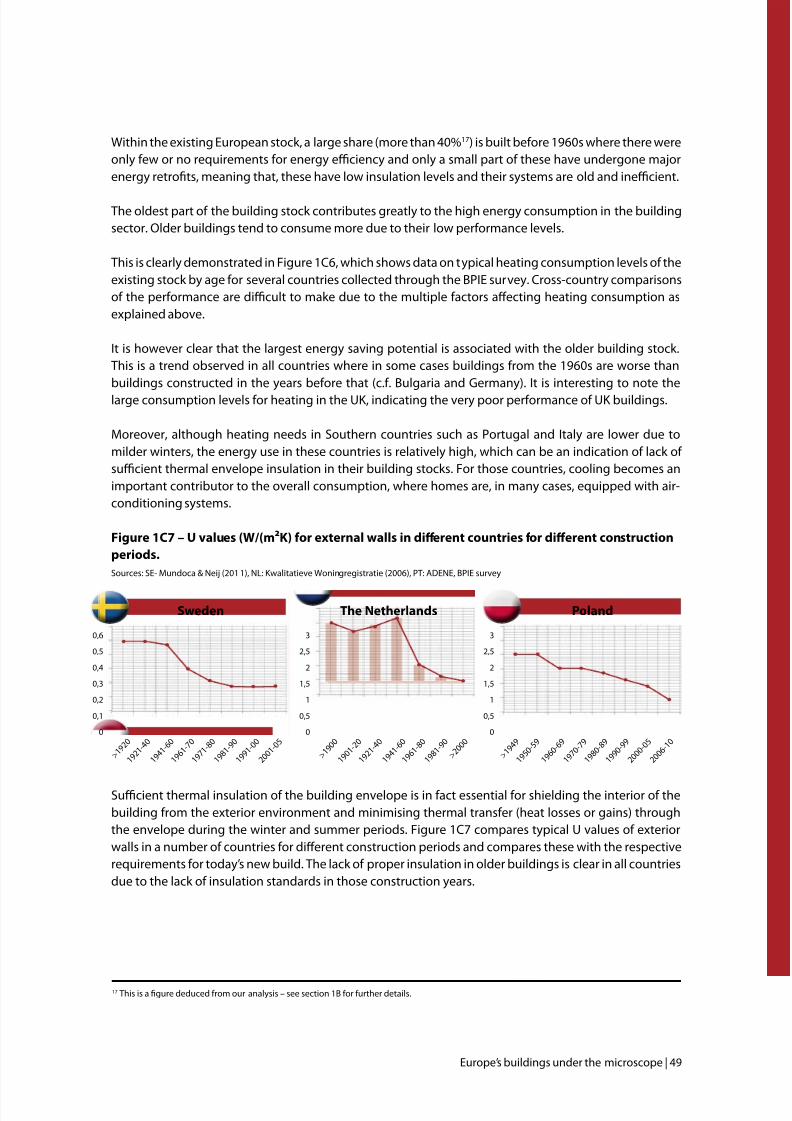
7/29/2019 LR CbC Study
http://slidepdf.com/reader/full/lr-cbc-study 49/132
Europe’s buildings under the microscope | 49
Sweden The Netherlands Poland
0,6
0,5
0,4
0,3
0,2
0,1
0
> 1 9 2
0
1 9 2 1
- 4 0
1 9 4 1
- 6 0
1 9 6 1
- 7 0
1 9 7 1
- 8 0
1 9 9 1
- 0 0
2 0 0 1
- 0 5
1 9 8 1
- 9 0
> 1 9 0
0
1 9 0 1
- 2 0
1 9 2 1
- 4 0
1 9 4 1
- 6 0
1 9 6 1
- 8 0
> 2 0 0
0
1 9 8 1
- 9 0
3
2,5
2
1,5
1
0,5
0
> 1 9 4
9
1 9 5 0
- 5 9
1 9 6 0
- 6 9
1 9 7 0
- 7 9
1 9 8 0
- 8 9
2 0 0 0
- 0 5
2 0 0 6
- 1 0
1 9 9 0
- 9 9
3
2,5
2
1,5
1
0,5
0
Within the existing European stock, a large share (more than 40%17) is built beore 1960s where there wereonly ew or no requirements or energy eciency and only a small part o these have undergone majorenergy retrots, meaning that, these have low insulation levels and their systems are old and inecient.
The oldest part o the building stock contributes greatly to the high energy consumption in the buildingsector. Older buildings tend to consume more due to their low perormance levels.
This is clearly demonstrated in Figure 1C6, which shows data on typical heating consumption levels o theexisting stock by age or several countries collected through the BPIE survey. Cross-country comparisonso the perormance are dicult to make due to the multiple actors afecting heating consumption asexplained above.
It is however clear that the largest energy saving potential is associated with the older building stock.This is a trend observed in all countries where in some cases buildings rom the 1960s are worse thanbuildings constructed in the years beore that (c.. Bulgaria and Germany). It is interesting to note thelarge consumption levels or heating in the UK, indicating the very poor perormance o UK buildings.
Moreover, although heating needs in Southern countries such as Portugal and Italy are lower due tomilder winters, the energy use in these countries is relatively high, which can be an indication o lack o sucient thermal envelope insulation in their building stocks. For those countries, cooling becomes animportant contributor to the overall consumption, where homes are, in many cases, equipped with air-conditioning systems.
Fiure1C7–Ualues(W/(m²K)forexternalwallsindierentcountriesfordierentconstructionperiods.
Sources: SE- Mundoca & Neij (201 1), NL: Kwalitatieve Woningregistratie (2006), PT: ADENE, BPIE survey
Sucient thermal insulation o the building envelope is in act essential or shielding the interior o thebuilding rom the exterior environment and minimising thermal transer (heat losses or gains) throughthe envelope during the winter and summer periods. Figure 1C7 compares typical U values o exteriorwalls in a number o countries or diferent construction periods and compares these with the respectiverequirements or today’s new build. The lack o proper insulation in older buildings is clear in all countriesdue to the lack o insulation standards in those construction years.
17 This is a gure deduced rom our analysis – see section 1B or urther details.
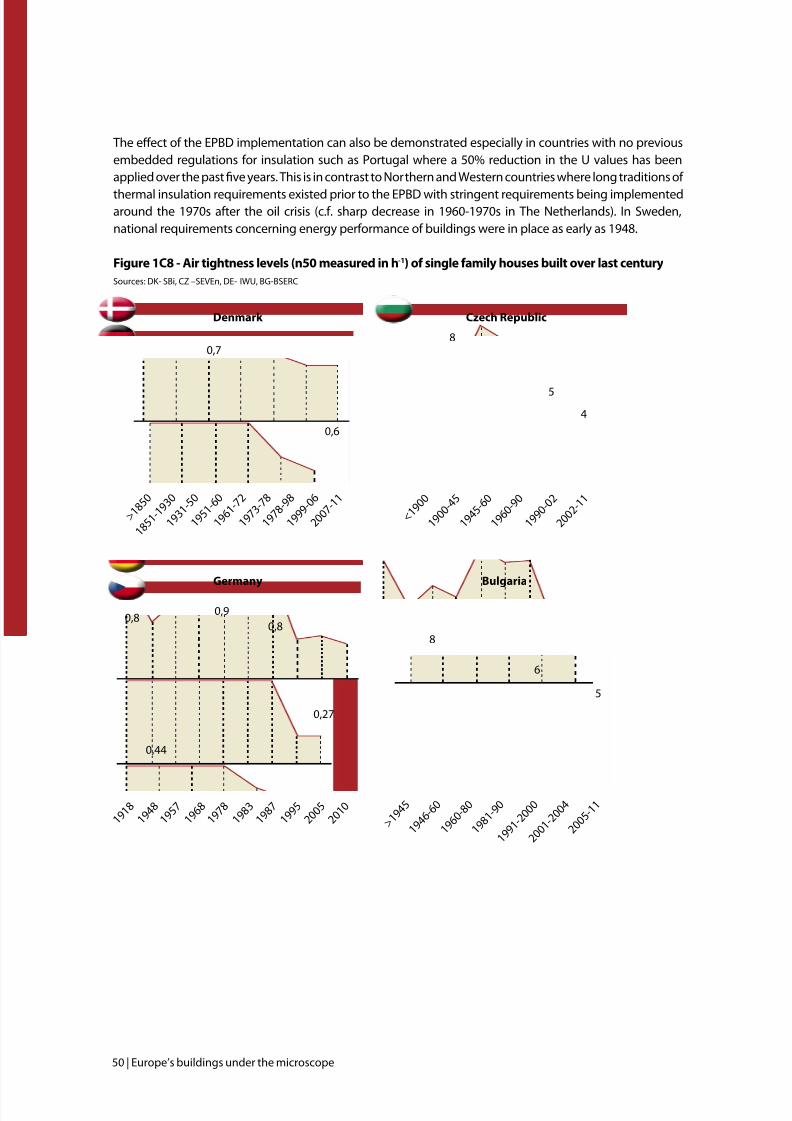
7/29/2019 LR CbC Study
http://slidepdf.com/reader/full/lr-cbc-study 50/132
50 | Europe’s buildings under the microscope
The efect o the EPBD implementation can also be demonstrated especially in countries with no previousembedded regulations or insulation such as Portugal where a 50% reduction in the U values has beenapplied over the past ve years. This is in contrast to Northern and Western countries where long traditions o
thermal insulation requirements existed prior to the EPBD with stringent requirements being implementedaround the 1970s ater the oil crisis (c.. sharp decrease in 1960-1970s in The Netherlands). In Sweden,national requirements concerning energy perormance o buildings were in place as early as 1948.
Figure 1C8 - Air tightness levels (n50 measured in h-1) o single amily houses built over last century
Sources: DK- SBi, CZ –SEVEn, DE- IWU, BG-BSERC
Denmark
Germany
Czech Republic
Bulgaria
1 9 1 8
> 1 9 4
5 1 9
4 8
1 9 4 6
- 6 0
1 9 5 7
1 9 6 8
1 9 6 0
- 8 0
1 9 7 8
1 9 8 3
1 9 8 1
- 9 0
1 9 8 7
1 9 9 5
1 9 9 1
- 2 0 0
0
2 0 0 1
- 2 0 0
4
2 0 0 5
- 1 1
2 0 0 5
2 0 1 0
8
6
5
0,80,9
0,8
0,27
> 1 8 5
0
< 1 9 0
0
1 8 5 1
- 1 9 3
0
1 9 0 0
- 4 5
1 9 3 1
- 5 0
1 9 5 1
- 6 0
1 9 4 5
- 6 0
1 9 6 1
- 7 2
1 9 7 3
- 7 8
1 9 6 0
- 9 0
1 9 7 8
- 9 8
1 9 9 9
- 0 6
1 9 9 0
- 0 2
2 0 0 2
- 1 1
2 0 0 7
- 1 1
80,7
0,6
54
0,44
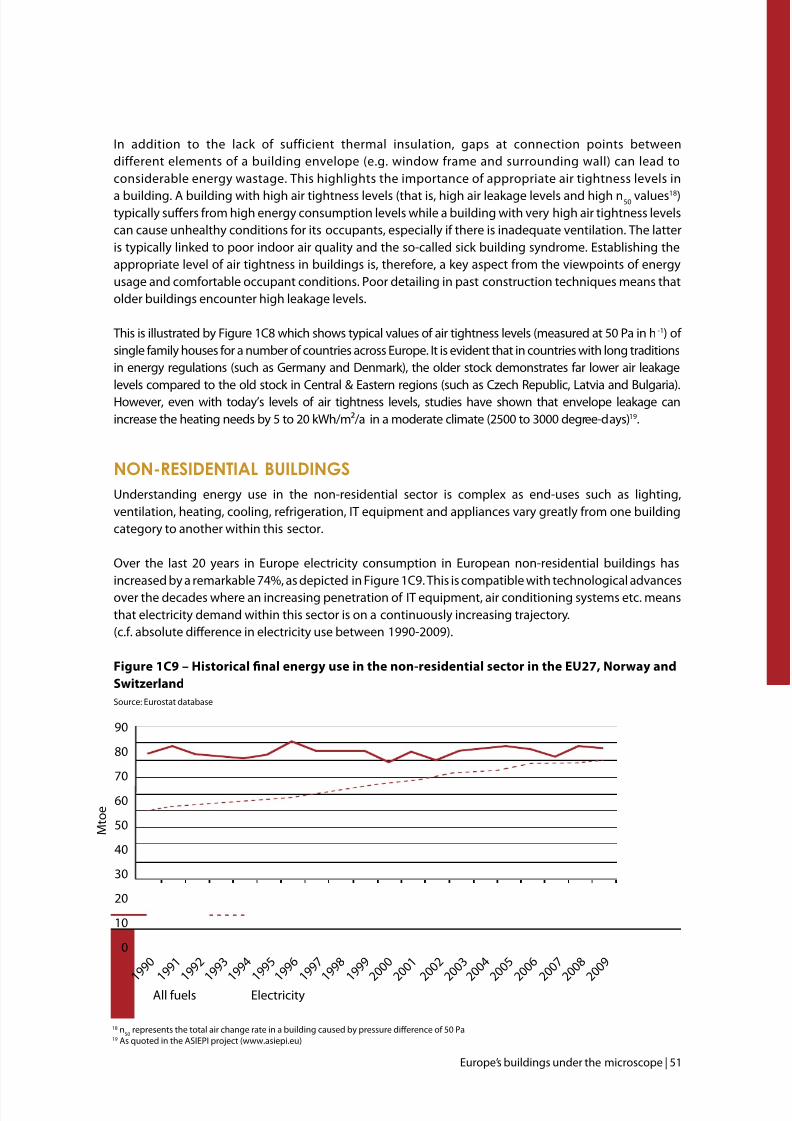
7/29/2019 LR CbC Study
http://slidepdf.com/reader/full/lr-cbc-study 51/132
Europe’s buildings under the microscope | 51
In addition to the lack o suicient thermal insulation, gaps at connection points betweendierent elements o a building envelope (e.g. window rame and surrounding wall) can lead toconsiderable energy wastage. This highlights the importance o appropriate air tightness levels in
a building. A building with high air tightness levels (that is, high air leakage levels and high n50 values18)typically sufers rom high energy consumption levels while a building with very high air tightness levelscan cause unhealthy conditions or its occupants, especially i there is inadequate ventilation. The latteris typically linked to poor indoor air quality and the so-called sick building syndrome. Establishing theappropriate level o air tightness in buildings is, thereore, a key aspect rom the viewpoints o energyusage and comortable occupant conditions. Poor detailing in past construction techniques means thatolder buildings encounter high leakage levels.
This is illustrated by Figure 1C8 which shows typical values o air tightness levels (measured at 50 Pa in h -1) o single amily houses or a number o countries across Europe. It is evident that in countries with long traditionsin energy regulations (such as Germany and Denmark), the older stock demonstrates ar lower air leakagelevels compared to the old stock in Central & Eastern regions (such as Czech Republic, Latvia and Bulgaria).However, even with today’s levels o air tightness levels, studies have shown that envelope leakage canincrease the heating needs by 5 to 20 kWh/m²/a in a moderate climate (2500 to 3000 degree-days)19.
non-residentiAl buildings
Understanding energy use in the non-residential sector is complex as end-uses such as lighting,ventilation, heating, cooling, rerigeration, IT equipment and appliances vary greatly rom one buildingcategory to another within this sector.
Over the last 20 years in Europe electricity consumption in European non-residential buildings hasincreased by a remarkable 74%, as depicted in Figure 1C9. This is compatible with technological advancesover the decades where an increasing penetration o IT equipment, air conditioning systems etc. meansthat electricity demand within this sector is on a continuously increasing trajectory.(c.. absolute diference in electricity use between 1990-2009).
Fiure1C9–Historicalnaleneryuseinthenon-residentialsectorintheEU27,NorwayandSwitzerland
Source: Eurostat database
18 n50
represents the total air change rate in a building caused by pressure diference o 50 Pa19 As quoted in the ASIEPI project (www.asiepi.eu)
All uels Electricity 1
9 9 0
1
9 9 1
1
9 9 2
1
9 9 3
1
9 9 4
1
9 9 5
1
9 9 6
1
9 9 7
1
9 9 8
1
9 9 9
2
0 0 0
2
0 0 1
2
0 0 2
2
0 0 3
2
0 0 4
2
0 0 5
2
0 0 6
2
0 0 7
2
0 0 8
2
0 0 9
90
80
70
60
50
40
30
20
10
0
M t o e
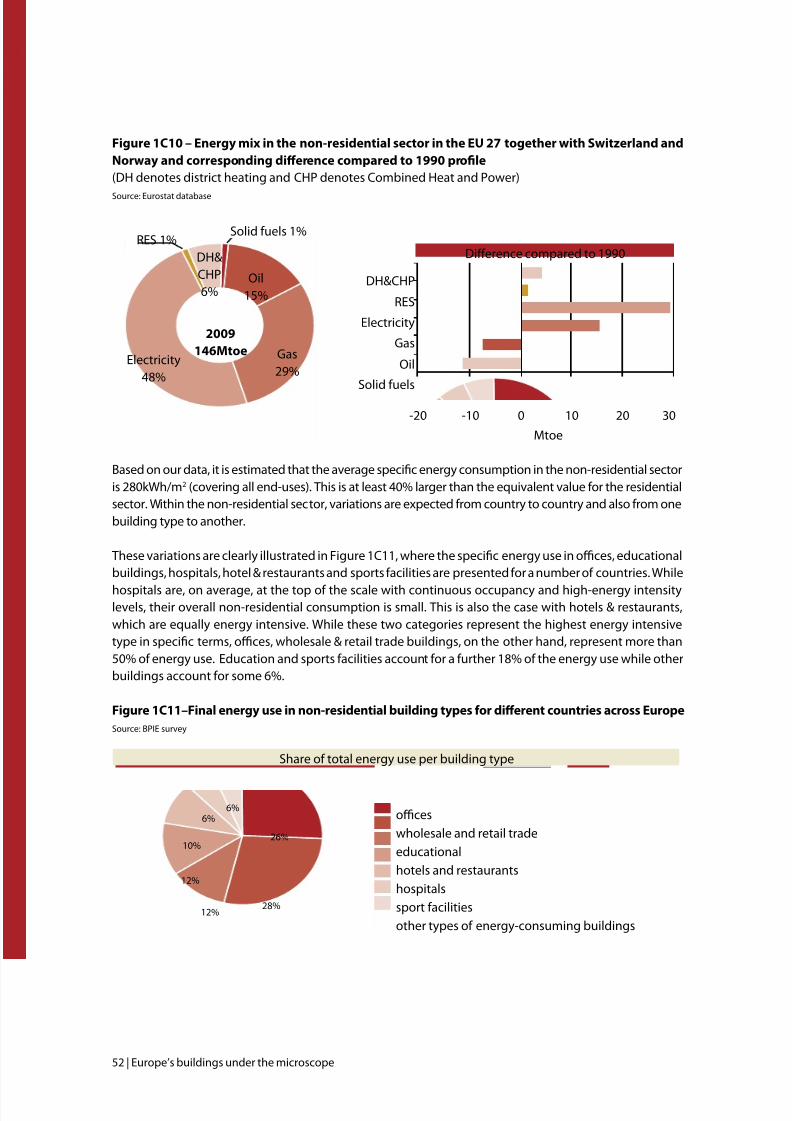
7/29/2019 LR CbC Study
http://slidepdf.com/reader/full/lr-cbc-study 52/132
52 | Europe’s buildings under the microscope
-20 -10 0 10 20 30
Gas29%
Oil15%
Electricity48%
DH&CHP6%
2009
146Mtoe
RES 1%Solid uels 1%
DH&CHP
RES
Electricity
Gas
Oil
Solid uels
Diference compared to 1990
Mtoe
Share o total energy use per building type
oces
wholesale and retail trade
educational
hotels and restaurants
hospitals
sport acilities
other types o energy-consuming buildings
26%
28%12%
12%
10%
6%6%
Figure 1C10 – Energy mix in the non-residential sector in the EU 27 together with Switzerland and
Norwayandcorrespondindierencecomparedto1990prole(DH denotes district heating and CHP denotes Combined Heat and Power)
Source: Eurostat database
Based on our data, it is estimated that the average specic energy consumption in the non-residential sectoris 280kWh/m2 (covering all end-uses). This is at least 40% larger than the equivalent value or the residentialsector. Within the non-residential sector, variations are expected rom country to country and also rom onebuilding type to another.
These variations are clearly illustrated in Figure 1C11, where the specic energy use in oces, educationalbuildings, hospitals, hotel & restaurants and sports acilities are presented or a number o countries. While
hospitals are, on average, at the top o the scale with continuous occupancy and high-energy intensitylevels, their overall non-residential consumption is small. This is also the case with hotels & restaurants,which are equally energy intensive. While these two categories represent the highest energy intensivetype in specic terms, oces, wholesale & retail trade buildings, on the other hand, represent more than50% o energy use. Education and sports acilities account or a urther 18% o the energy use while otherbuildings account or some 6%.
Fiure1C11–Finaleneryuseinnon-residentialbuildintypesfordierentcountriesacrossEuropeSource: BPIE survey
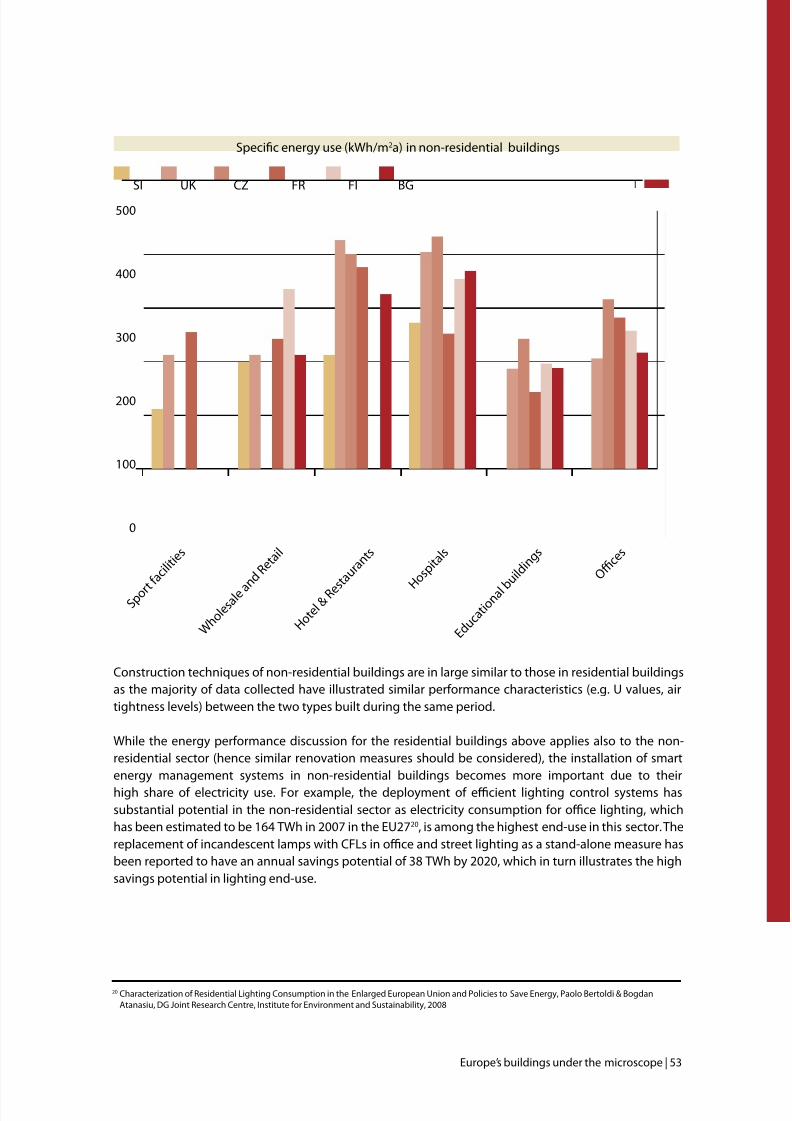
7/29/2019 LR CbC Study
http://slidepdf.com/reader/full/lr-cbc-study 53/132
Europe’s buildings under the microscope | 53
Specic energy use (kWh/m2a) in non-residential buildings
Construction techniques o non-residential buildings are in large similar to those in residential buildingsas the majority o data collected have illustrated similar perormance characteristics (e.g. U values, airtightness levels) between the two types built during the same period.
While the energy perormance discussion or the residential buildings above applies also to the non-residential sector (hence similar renovation measures should be considered), the installation o smartenergy management systems in non-residential buildings becomes more important due to theirhigh share o electricity use. For example, the deployment o ecient lighting control systems hassubstantial potential in the non-residential sector as electricity consumption or oce lighting, whichhas been estimated to be 164 TWh in 2007 in the EU2720, is among the highest end-use in this sector. Thereplacement o incandescent lamps with CFLs in oce and street lighting as a stand-alone measure hasbeen reported to have an annual savings potential o 38 TWh by 2020, which in turn illustrates the highsavings potential in lighting end-use.
500
400
300
200
100
0
S p o r t a c i l i t i e
s
W h o
l e s a l e a
n d R e t a i l
H o t e l &
R e s t a u r
a n t s
H
o s p i t
a l s
E d u c
a t i o n
a l b u i l
d i n g
s
O f c e
s
SI UK CZ FR FI BG
20 Characterization o Residential Lighting Consumption in the Enlarged European Union and Policies to Save Energy, Paolo Bertoldi & BogdanAtanasiu, DG Joint Research Centre, Institute or Environment and Sustainability, 2008
7/29/2019 LR CbC Study
http://slidepdf.com/reader/full/lr-cbc-study 54/132
54 | Europe’s buildings under the microscope
pArt 2policiEs And progrAmmEsFor improving EnErgyEFFiciEncy in buildings
“ EU legislation has set out an ambitious legal framework for greening European buildings.The challenge will be for Member States to make thishappen with the necessary drive, through efcient building
policies, codes and attractive programmes addressing themany barriers existing today.”
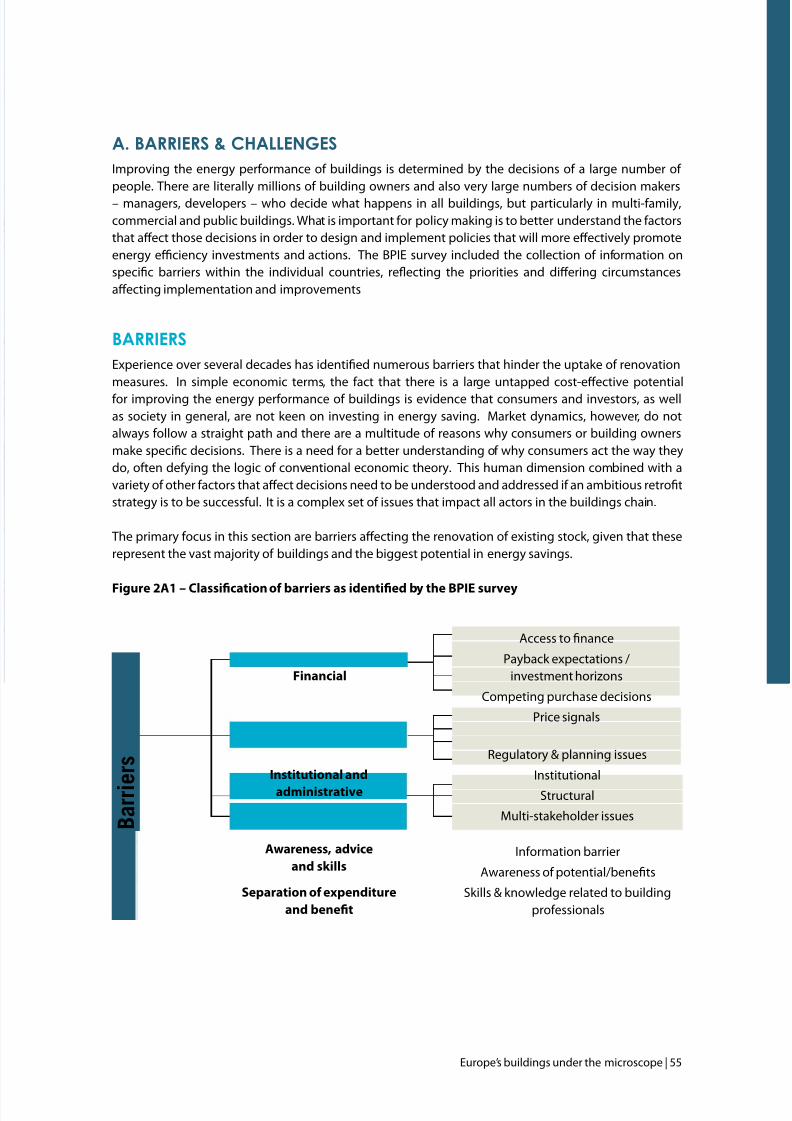
7/29/2019 LR CbC Study
http://slidepdf.com/reader/full/lr-cbc-study 55/132
Europe’s buildings under the microscope | 55
A. bArriers & chAllenges
Improving the energy perormance o buildings is determined by the decisions o a large number o people. There are literally millions o building owners and also very large numbers o decision makers– managers, developers – who decide what happens in all buildings, but particularly in multi-amily,commercial and public buildings. What is important or policy making is to better understand the actorsthat afect those decisions in order to design and implement policies that will more efectively promoteenergy eciency investments and actions. The BPIE survey included the collection o inormation onspecic barriers within the individual countries, reecting the priorities and difering circumstancesafecting implementation and improvements
bArriers
Experience over several decades has identied numerous barriers that hinder the uptake o renovationmeasures. In simple economic terms, the act that there is a large untapped cost-efective potentialor improving the energy perormance o buildings is evidence that consumers and investors, as wellas society in general, are not keen on investing in energy saving. Market dynamics, however, do notalways ollow a straight path and there are a multitude o reasons why consumers or building ownersmake specic decisions. There is a need or a better understanding o why consumers act the way theydo, oten deying the logic o conventional economic theory. This human dimension combined with avariety o other actors that afect decisions need to be understood and addressed i an ambitious retrotstrategy is to be successul. It is a complex set o issues that impact all actors in the buildings chain.
The primary ocus in this section are barriers afecting the renovation o existing stock, given that theserepresent the vast majority o buildings and the biggest potential in energy savings.
Fiure2A1–ClassicationofbarriersasidentiedbytheBPIEsurey
Regulatory & planning issues
Institutional
Structural
Multi-stakeholder issues
Inormation barrier
Awareness o potential/benets
Skills & knowledge related to buildingproessionals
Access to nance
Payback expectations /investment horizons
Competing purchase decisions
Price signals
Financial
Institutional and
administrative
Awareness, advice
and skills
Separation o expenditure
andbenet
b a r r i e r s
7/29/2019 LR CbC Study
http://slidepdf.com/reader/full/lr-cbc-study 56/132
56 | Europe’s buildings under the microscope
In this study, individual experts and several organisations throughout Europe reported barriers o particular relevance to their countries as part o the in-depth BPIE survey undertaken. This inormationgathering has been supplemented by literature developed over the past decades. Despite some excellent
initiatives to improve the energy perormance o Europe’s building stock, it is clear that a multiplicity o barriers is severely limiting the achievement o the ull potential.
A combination o barriers is responsible or this underperormance. There are many ways to classiybarriers and over the years they have been described in many diferent ways. The BPIE survey identiedthe ollowing our main categories o barriers that have a particular impact on existing buildings:21
I. FinancialII. Institutional and administrativeIII. Awareness, advice and skillsIV. Separation o expenditure and benet.
i. Faa bae
Financial barriers were one o the highest ranking barrier category in the majority o countries, with 21 givingit a high priority (amongst the top three). Undoubtedly, any investment in renovation requires money.This priority or nancing barriers is consistent with the ndings o a report and roundtable discussion thatBPIE realised in 2010.22 As shown in Part 3 o this study, ambitious renovations take considerable capitaland this has implications or policy making. Understanding the underlying issues related to nancing isundamental or developing good policy solutions.
LackoffundsoraccesstonanceLack o unds and/or inability to secure nance on acceptable terms is generally one o the most citedbarriers to investing in energy eciency measures. This applies at the level o the individual householder,
businesses (large or small), social housing providers and the public sector, particularly in the atermath o the credit crunch. In many cases it is more due to the lack o awareness or lack o interest rather than thelack o unds. Whilst the demand or a new kitchen or appliances rom the consumer’s perspective is high,there is no similar demand or energy eciency. Even though they will in most cases be cost-efective overthe long run (with a positive NPV), the initial investment costs can be high and this is seen as an obstacle toconsumer investment decisions. The most ambitious retrots will undoubtedly require considerable uprontunding. This upront unding will have a positive impact on the asset value, especially or older buildingswhere energy eciency retrots not only improve signicantly their energy consumption but also theiraesthetics. Investing in energy eciency now also ofers some protection against increasing energy pricesin the uture. Some o the ‘access to nancing’ issues have also been identied as administrative issues, asdescribed below.
The current nancial crisis is hitting all European countries, some more than others, while the lendingmarkets have also been badly afected. Consumers and nancial institutions are less willing to take risks.Compared to many alternative orms o investment, however, investing in energy eciency measures hasproven to be a prudent route.
Paybackexpectations/InestmenthorizonsEven though many energy savings measures are nancially rational in that they have a positive Net PresentValue (NPV) or a high Internal Rate o Return (IRR), the time taken or the initial outlay to be recouped isa major barrier. For most households, energy bills or the home account or 3-4% o disposable income,hence they are not a major concern. Householders will be mindul that they may move home in the next ew
21 There were also several specic barriers not alling into the main categories that were identied as well. Sometimes specic barriers also t intomore than one category.
22 For more inormation, go to http://www.bpie.eu/nancing_energy_eciency.html
7/29/2019 LR CbC Study
http://slidepdf.com/reader/full/lr-cbc-study 57/132
Europe’s buildings under the microscope | 57
years, while many businesses will not consider non-core investments that do not pay or themselves within3-5 years. Alternative nancing mechanisms which try to ensure that the benet rom energy eciencyimprovements are paid by those that benet rom them (e.g. recovering initial capital over 25 years through
the energy bill) may have a role to play here. As noted by the answers received rom Poland in the BPIEsurvey, there is insucient common awareness about protability o renovation in terms o lie cycle costs.
Competing purchase decisions
Business will prioritise what are perceived as core investments in staf and equipment over energy costs,which (with the exception o energy intensive businesses) typically make up only a small raction o businesscosts. For householders, investments in energy saving measures will struggle to compete with the latestelectronic gadgets or a new kitchen or bathroom, which are not particularly cost-efective investments butyield a much higher perceived ‘social benet’. Some see this obstacle as an issue related to awareness;others deal with it separately as a nancial issue. Moreover, many energy eciency measures are not visible(unlike, say, photovoltaic systems) which makes them less ‘attractive’ as an investment option. The lack o attractiveness is sometimes reinorced by more generous subsidies which are more readily available or PVscompared to energy eciency measures. Undoubtedly, consumers have a lot o choice and the case orreducing costs or improving other benets (such as comort) has to be seen in that context.
Price signals
Many o the nancial barriers identied concern consumer price signals. I the nancial incentiveassociated with investing in energy savings measures was suciently large, households, businesses andthe public sector would have a higher propensity to undertake such investments. Put simply, energycosts oten represent a small share o household expenditure resulting in lack o motivation or the vastmajority o consumers to take meaningul action to reduce consumption levels.23 Furthermore, energy-pricing structures do not reect the ull environmental costs o producing energy, in particular the costsassociated with climate change, and hence there is a sub-optimal level o investment which was raised by
the responses or Switzerland and the UK. One o the concerns reported or Hungary was the high degreeo uncertainty about uture prices, which seriously hampered consumer decisions.
ii. ia a aae ae
There is a wide range o barriers related to institutional and administrative issues that can have an efecton the rate and ambition o renovation. This category was considered the third most important barriercategory in the survey, although second in terms o the highest priority.
Regulatory & planning regimes
A variety o regulatory and planning obstacles have been identied. These range rom various degrees
and speeds at which EU Directives, including the EPBD, have been implemented by autonomous regionswithin a Member State, through to energy market barriers, such as the approvals process or buildingintegrated renewable technologies. Evidence rom Italy indicates that ragmentation, delay and gaps inthe regulatory action o public planning have not allowed the public sector to be the driver or improvedenergy eciency in buildings that it should be.24
Institutional
There is a bias among institutional investors more amiliar with (and hence more comortable with)supply- side investments and large-scale nancing, rather than generally smaller (and “more risky”)projects on the demand side. This was singled out by Hungary.
23 This is denitely not the case or those in uel poverty, where energy costs represent at least 10% o their household expenditures.24 BPIE database
7/29/2019 LR CbC Study
http://slidepdf.com/reader/full/lr-cbc-study 58/132
58 | Europe’s buildings under the microscope
With respect to the demand side, Latvia highlighted the complex estate administration o privatisedapartment buildings. It noted that there was an unequal ability o owners to pay or renovations andsome groups (e.g. pensioners) showed no interest in investment. Latvia also noted that the European
standards or building energy eciency have been adopted more slowly than planned and that thosestandards were not adapted to national needs. Because o the delays, no common sotware or buildingenergy eciency calculations or designers and engineers was available. Slovenia pointed out thatscattered ownership in apartment buildings (with privatisation only taking place in the 1990s) raisedmany organisational barriers where there must be a 75% consensus in multi-owned buildings orundertaking technical improvements. This leads to complex protocols and the lack o consensus. Therecan also be institutional barriers in the public sector using energy service companies. This was raised bySlovenia but is a problem in several other countries.
Structural
Evidence rom Belgium illustrates a dilemma that is probably ound in several other Member States. Themain barrier identied by our analysis o the Belgian responses is the age o the building stock becauseo a low demolition rate. As the average age o Belgium’s building stock is orecast to increase urtherthan that o European counterparts in the next 25 years, the relative energy eciency o the buildingstock is also likely to decrease. The analysis goes on to state that the high upront cost and the annual capon most incentives have the consequence that the reurbishments are spread over a long time period,which is a barrier to improving energy eciency. Because o the age o buildings, the landlord-tenantdilemma makes it dicult to ameliorate the existing building stock. Many o the new Member Statesrom Eastern Europe have a legacy o poor quality “panel” buildings rom the 1960s and 1970s that needserious upgrading.
Multi-stakeholderissuesVarious barriers exist where there are multiple owners and/or occupiers o buildings. Ownership and
responsibility can be opaque, while it can be very dicult to agree on energy saving investments inmulti-amily residential buildings i many diferent property owners have to either approve a decision ormake a nancial contribution.
iii. Aaee, ae a ae
There are many barriers relating to awareness, inormation and technical expertise. This was the secondmost identied barrier category, with 15 o 26 countries giving this a high priority (amongst the top three).Undoubtedly, or the market to work well, correct and appropriate inormation is essential. Ambitiousrenovations comprise a major decision which can only work i the right energy advice to take action isavailable and that the energy eciency service industries are capable o delivering those measures and
ultimately that sucient satisaction levels can be guaranteed or the consumer. Current ESCO companiesare not designed to deliver deep renovations where the complex process, small project size and multi-stakeholder involvement discourage ESCOs rom having a real interest in deep renovation projects.Without the right combination o necessary conditions, the consumer may only choose to undertakerenovation measures when it is absolutely necessary, as is the case or the replacement o equipmentwhen it breaks down. There were many observations in the survey about consumers not taking actionand not being interested. Not being interested is a complex issue and generally takes more investigationto ully understand the consumer’s motivation (or lack o motivation).
7/29/2019 LR CbC Study
http://slidepdf.com/reader/full/lr-cbc-study 59/132
Europe’s buildings under the microscope | 59
Lackofadice/informationEven with all the years o experience and the campaigns undertaken by government, industry and civilsociety, awareness o cost-efective energy saving opportunities is still low. The issue is exacerbated in this
period o rapidly advancing technological development, where it can be dicult even or proessionals tokeep abreast o prevailing best practice. Dissemination techniques need to keep pace with the evolutiono consumer needs and media. The market place is complex, and energy eciency investments haveto compete efectively. Due to miscommunication issues, in some cases consumers are not aware o ordo not ully comprehend the efectiveness o specic technologies. This may lead to scepticism overimplementing a technology especially i two or more proessionals give supposedly conicting adviceas to the best way to renovate. This can be overcome, as noted by the Slovenian response, throughdemonstrations and inormation campaigns. Denmark raises an important point that all too oten theocus is on individual products and not on entire end-to-end, holistic solutions.
Awareness o energy savings potential
While there is a general appreciation that energy saving is a “good thing”, there remains a lack o understanding o the energy, cost and carbon savings rom diferent measures. Householders may, orexample eel they are helping the planet by installing CFLs, without realising that ar greater savingscould be achieved rom abric insulation or boiler upgrades. The notion (at the household level) thattting CFLs helps save the planet may also have been perpetuated by energy supply companies whichhave in the past provided ree or low cost CFLs – perhaps ocusing less on prioritising the more efectivebut also more costly measures like tting thermal insulation.
Skills & knowledge related to building proessionals
Skill shortages exist in both the contractor market responsible or efective installation o energy savingmeasures, as well as in proessional services, with ew architects and designers amiliar with how tospeciy a low energy renovation. Evidence rom Norway indicates that, while there is a lack o knowledge
and competence, there is also lack o ocus on energy eciency among building proessionals.25 Estonia,France and Ireland, amongst others, noted that the limited know-how o contractors regarding energyeciency led to unsatisactory retrots.
25 BPIE database
7/29/2019 LR CbC Study
http://slidepdf.com/reader/full/lr-cbc-study 60/132
60 | Europe’s buildings under the microscope
iv. seaa eee a eef
This is probably the most complex and long-standing barrier relating to existing buildings, particularly incountries where there is a high share o rental accommodation in the residential sector, but also becauseo the structure o occupancy in the non-residential sector. This barrier has been known under variousnames throughout the years. Most recently it is known as the ‘split incentives barrier’ or the ‘landlord/tenant barrier’, the ‘investor/user barrier’ and the ‘principal/agent barrier ’, to name the main ones.
This barrier was identied as the ourth most important barrier in the BPIE survey, although there were norst place positions amongst the countries. This barrier is sometimes considered a nancial barrier and,understandably, there are nancial implications. It is also sometimes considered to be an institutionalbarrier. This is presented separately herein due to its importance in retrot strategies.
The problem originates rom the act that one person or organisation owns a building and someone elseuses it. For the owner, any investment has to bring a benet which is not necessarily through energy
savings, unless it is a situation where the landlord pays the energy bills (this may sometimes be the case).Since the tenant does not own the acility, any investment in lowering energy bills has to be seen asnancially advantageous or both actors. This oten leads to a stalemate with nothing happening.
There are many examples where the party investing in a building may not be the party reaping thenancial returns (in ull or in part). Examples include:
• Landlordsinvestinginapropertywheretenantspaytheenergybill;
• Landlords’ inability (throughlegislative restrictionsorotherreasons)to raise rents after abuilding
renovation; and• Developersconstructinganewbuildingor renovatinganexistingone,wheremarketpricesdonot
reect the energy perormance o the building.
As evidence rom Germany26 has shown, this is one o the most relevant barriers needing increasedattention, particularly since many leases include heating charges and so the actual consumer has a lack o understanding o actual energy consumption. A comprehensive analysis on split incentives undertakenby the International Energy Agency in 2007 showed that this barrier accounts or about 30% o sectorialenergy use, which is highly signicant. It stated, however, that no single policy instrument can addressit. The IEA stated27:
“Neither regulatory mechanisms, (e.g. minimum energy perormance standards, or regulated contractdesign), nor inormation-based instruments (i.e. awareness campaigns) alone will resolve them. Instead,governments should help design well-targeted policy packages to address PA problems in their specicnational contexts, and within the particular constraints o a given sector. These packages should includemeasures to: a) address contract design to ensure end-users ace energy prices, b) regulate the level o energy eciency in appliances and buildings, c) improve access to inormation about energy eciencyperormance.”
This is an important point to remember in designing renovation policy pages, as will be seen in Part 3.
26 BPIE database27 IEA, Mind the Gap, IEA/OECD, Paris, 2007, p. 12.
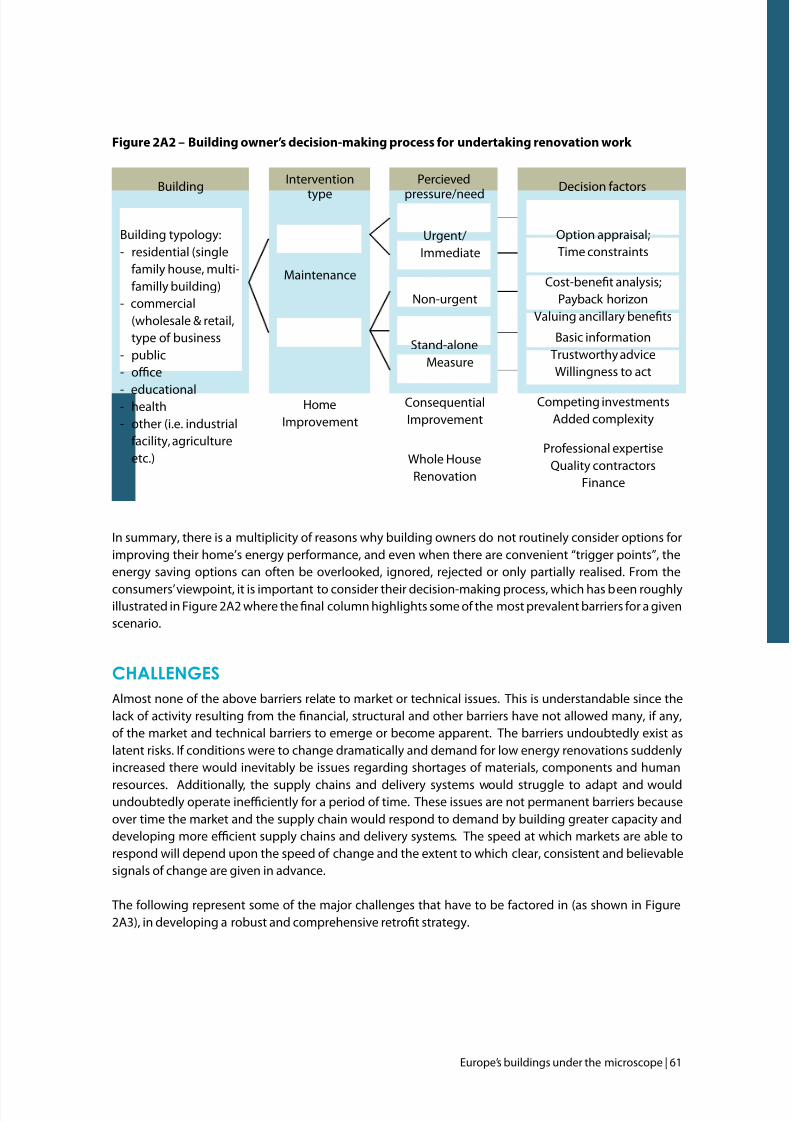
7/29/2019 LR CbC Study
http://slidepdf.com/reader/full/lr-cbc-study 61/132
Europe’s buildings under the microscope | 61
Figure 2A2 – Building owner’s decision-making process or undertaking renovation work
In summary, there is a multiplicity o reasons why building owners do not routinely consider options orimproving their home’s energy perormance, and even when there are convenient “trigger points”, theenergy saving options can oten be overlooked, ignored, rejected or only partially realised. From the
consumers’ viewpoint, it is important to consider their decision-making process, which has been roughlyillustrated in Figure 2A2 where the nal column highlights some o the most prevalent barriers or a givenscenario.
chAllenges
Almost none o the above barriers relate to market or technical issues. This is understandable since thelack o activity resulting rom the nancial, structural and other barriers have not allowed many, i any,o the market and technical barriers to emerge or become apparent. The barriers undoubtedly exist aslatent risks. I conditions were to change dramatically and demand or low energy renovations suddenlyincreased there would inevitably be issues regarding shortages o materials, components and human
resources. Additionally, the supply chains and delivery systems would struggle to adapt and wouldundoubtedly operate ineciently or a period o time. These issues are not permanent barriers becauseover time the market and the supply chain would respond to demand by building greater capacity anddeveloping more ecient supply chains and delivery systems. The speed at which markets are able torespond will depend upon the speed o change and the extent to which clear, consistent and believablesignals o change are given in advance.
The ollowing represent some o the major challenges that have to be actored in (as shown in Figure2A3), in developing a robust and comprehensive retrot strategy.
Building typology:- residential (single
amily house, multi-amilly building)
- commercial(wholesale & retail,type o business
- public- oce
- educational- health- other (i.e. industrial
acility, agricultureetc.)
Maintenance
Urgent/Immediate
Option appraisal;Time constraints
Cost-benet analysis;Payback horizon
Valuing ancillary benets
Basic inormationTrustworthy adviceWillingness to act
Competing investmentsAdded complexity
Proessional expertiseQuality contractors
Finance
Non-urgent
Stand-aloneMeasure
ConsequentialImprovement
Whole HouseRenovation
HomeImprovement
BuildingIntervention
type
Percieved
pressure/needDecision actors
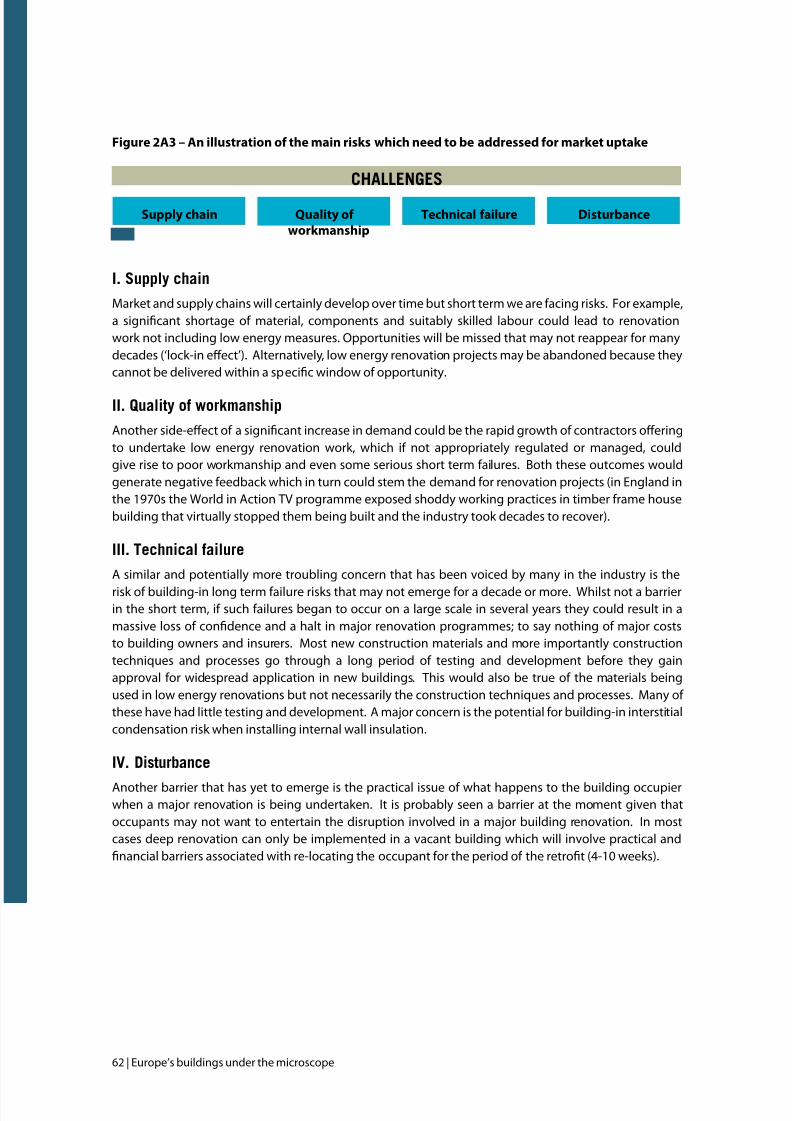
7/29/2019 LR CbC Study
http://slidepdf.com/reader/full/lr-cbc-study 62/132
62 | Europe’s buildings under the microscope
Figure 2A3 – An illustration o the main risks which need to be addressed or market uptake
i. s a
Market and supply chains will certainly develop over time but short term we are acing risks. For example,a signicant shortage o material, components and suitably skilled labour could lead to renovationwork not including low energy measures. Opportunities will be missed that may not reappear or manydecades (‘lock-in efect’). Alternatively, low energy renovation projects may be abandoned because theycannot be delivered within a specic window o opportunity.
ii. Qa a
Another side-efect o a signicant increase in demand could be the rapid growth o contractors oferingto undertake low energy renovation work, which i not appropriately regulated or managed, couldgive rise to poor workmanship and even some serious short term ailures. Both these outcomes wouldgenerate negative eedback which in turn could stem the demand or renovation projects (in England inthe 1970s the World in Action TV programme exposed shoddy working practices in timber rame housebuilding that virtually stopped them being built and the industry took decades to recover).
iii. tea ae
A similar and potentially more troubling concern that has been voiced by many in the industry is the
risk o building-in long term ailure risks that may not emerge or a decade or more. Whilst not a barrierin the short term, i such ailures began to occur on a large scale in several years they could result in amassive loss o condence and a halt in major renovation programmes; to say nothing o major coststo building owners and insurers. Most new construction materials and more importantly constructiontechniques and processes go through a long period o testing and development beore they gainapproval or widespread application in new buildings. This would also be true o the materials beingused in low energy renovations but not necessarily the construction techniques and processes. Many o these have had little testing and development. A major concern is the potential or building-in interstitialcondensation risk when installing internal wall insulation.
iv. dae
Another barrier that has yet to emerge is the practical issue o what happens to the building occupierwhen a major renovation is being undertaken. It is probably seen a barrier at the moment given thatoccupants may not want to entertain the disruption involved in a major building renovation. In mostcases deep renovation can only be implemented in a vacant building which will involve practical andnancial barriers associated with re-locating the occupant or the period o the retrot (4-10 weeks).
chAllEngEs
Supply chain DisturbanceQuality o
workmanship
Technical ailure
7/29/2019 LR CbC Study
http://slidepdf.com/reader/full/lr-cbc-study 63/132
Europe’s buildings under the microscope | 63
b. regulAtory And legislAtive frAmework
Improving the energy perormance o buildings is a key actor in securing the transition to a ‘green’resource ecient economy and to achieving the EU Climate & Energy objectives, namely a 20% reductionin the GHG emissions by 2020 and a 20% energy savings by 2020. By reducing the energy consumptiono the buildings, a direct reduction o the associated GHG emissions will be obtained and a aster andcheaper implementation o renewable energy sources will be triggered. The 2006 Energy EciencyAction Plan28 identied residential and commercial buildings as being the sector with the largest cost-efective savings potential by 2020, estimated at around 27% (91Mtoe) and 30% (63Mtoe) o energy use,respectively. In addition, the Action Plan indicates that, in residential buildings, retrotting walls androos insulation ofer the greatest saving opportunities, while in commercial buildings, improving energymanagement systems is more important. The Eco-design o the Energy-Related Products Framework Directive 09/125/EC (recast o Energy-Using Directive 32/2005/EC), the End-use Energy Eciency andEnergy Services Directive 32/2006/EC (ESD), the Energy Perormance o Buildings Directive 2010/31/EU(EPBD, recast o 2002/91/EC) as well as the Labelling Framework Directive 2010/30/EU (recast o 75/1992/
EC) aim to contribute signicantly to realising the energy-saving potential o the European Union’sbuildings sector. The main legislative instrument in Europe is the 2002 Energy Perormance in BuildingsDirective (EPBD) and its 2010 recast. This section is divided into two parts. First there is a review o theoverall state o implementation o the EPBD. This is ollowed by a review o the main components o thebuilding code requirements.
epbd: mAin provisions, implementAtion And recAst
ma
The 2002/91/EC Energy Perormance o Buildings Directive (EPBD) is, at European level, the main policy
driver afecting energy use in buildings. As originally ormulated in 2002, the EPBD sets out the ollowingkey requirements or Member States:
• minimum standards on the energy performance of new buildings and large (>1000 m2) existingbuildings undergoing ‘major renovation’;
• ageneralframework;foramethodologyforcalculatingtheintegratedenergyperformanceofbuildings;
• energycerticationforbothnewandexistingbuildingswhenevertheyareconstructed,soldorrented
out;• implement an inspection and assessment regime for air conditioning andmedium and largesize
heating systems or, in the case o the latter, develop inormation campaigns on the subject.
While no ull assessment o the EPBD impact has been done, it is estimated that, i ully and properly
implemented, the energy savings could be as much as 96 Mtoe nal energy in 2020, this being 6.5% o EU nal energy demand29.
28 COM(2006) 545. Communication rom the Commission - Action Plan or Energy Eciency : Realising the Potential29 Impact assessment document accompanying the Proposal or a Recast o the EPBD
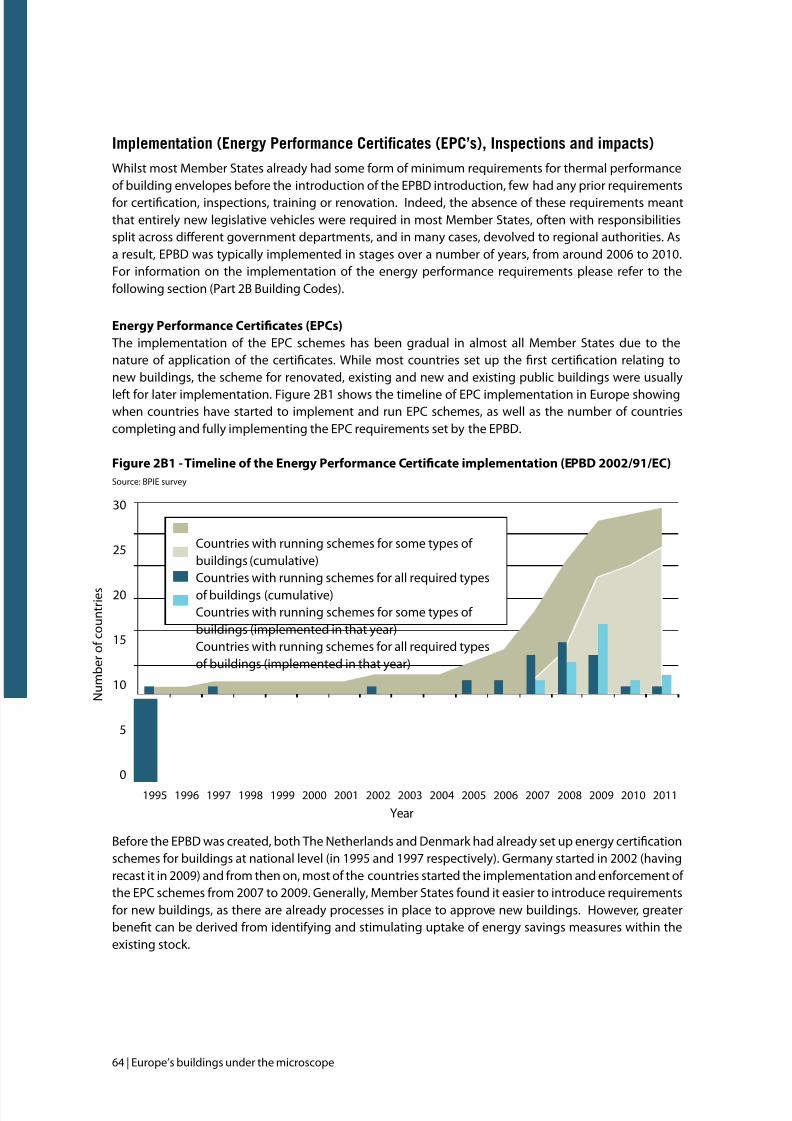
7/29/2019 LR CbC Study
http://slidepdf.com/reader/full/lr-cbc-study 64/132
64 | Europe’s buildings under the microscope
ieea (Ee peae cefae (Epc’), ie a a)
Whilst most Member States already had some orm o minimum requirements or thermal perormanceo building envelopes beore the introduction o the EPBD introduction, ew had any prior requirementsor certication, inspections, training or renovation. Indeed, the absence o these requirements meantthat entirely new legislative vehicles were required in most Member States, oten with responsibilitiessplit across diferent government departments, and in many cases, devolved to regional authorities. Asa result, EPBD was typically implemented in stages over a number o years, rom around 2006 to 2010.For inormation on the implementation o the energy perormance requirements please reer to theollowing section (Part 2B Building Codes).
EneryPerformanceCerticates(EPCs)The implementation o the EPC schemes has been gradual in almost all Member States due to thenature o application o the certicates. While most countries set up the rst certication relating tonew buildings, the scheme or renovated, existing and new and existing public buildings were usually
let or later implementation. Figure 2B1 shows the timeline o EPC implementation in Europe showingwhen countries have started to implement and run EPC schemes, as well as the number o countriescompleting and ully implementing the EPC requirements set by the EPBD. Fiure2B1-TimelineoftheEneryPerformanceCerticateimplementation(EPBD2002/91/EC)Source: BPIE survey
Beore the EPBD was created, both The Netherlands and Denmark had already set up energy certicationschemes or buildings at national level (in 1995 and 1997 respectively). Germany started in 2002 (havingrecast it in 2009) and rom then on, most o the countries started the implementation and enorcement o the EPC schemes rom 2007 to 2009. Generally, Member States ound it easier to introduce requirementsor new buildings, as there are already processes in place to approve new buildings. However, greaterbenet can be derived rom identiying and stimulating uptake o energy savings measures within theexisting stock.
30
25
20
15
10
5
0
1995 1996 1997 1998 1999 2000 2001 2002 2003 2004 2005 2006 2007 2008 2009 2010 2011
N u m b e r o c o u n t r i e s
Countries with running schemes or some types o buildings (cumulative)Countries with running schemes or all required types
o buildings (cumulative)Countries with running schemes or some types o buildings (implemented in that year)Countries with running schemes or all required typeso buildings (implemented in that year)
Year
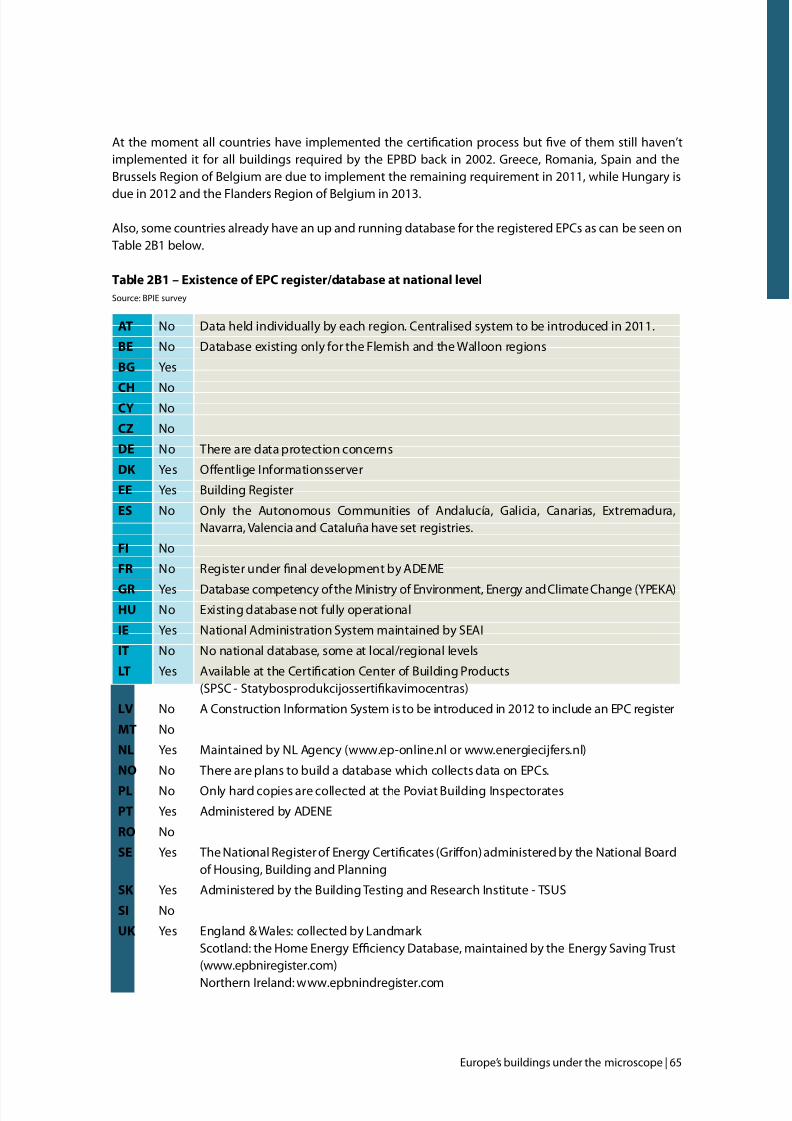
7/29/2019 LR CbC Study
http://slidepdf.com/reader/full/lr-cbc-study 65/132
Europe’s buildings under the microscope | 65
At the moment all countries have implemented the certication process but ve o them still haven’timplemented it or all buildings required by the EPBD back in 2002. Greece, Romania, Spain and theBrussels Region o Belgium are due to implement the remaining requirement in 2011, while Hungary is
due in 2012 and the Flanders Region o Belgium in 2013.
Also, some countries already have an up and running database or the registered EPCs as can be seen onTable 2B1 below.
Table2B1–ExistenceofEPCreister/databaseatnationalleelSource: BPIE survey
AT No Data held individually by each region. Centralised system to be introduced in 2011.
BE No Database existing only or the Flemish and the Walloon regions
BG Yes
CH NoCY No
CZ No
DE No There are data protection concerns
DK Yes Ofentlige Inormationsserver
EE Yes Building Register
ES No Only the Autonomous Communities o Andalucía, Galicia, Canarias, Extremadura,Navarra, Valencia and Cataluña have set registries.
FI No
FR No Register under nal development by ADEME
GR Yes Database competency o the Ministry o Environment, Energy and Climate Change (YPEKA)HU No Existing database not ully operational
IE Yes National Administration System maintained by SEAI
IT No No national database, some at local/regional levels
LT Yes Available at the Certication Center o Building Products(SPSC - Statybosprodukcijossertikavimocentras)
LV No A Construction Inormation System is to be introduced in 2012 to include an EPC register
MT No
NL Yes Maintained by NL Agency (www.ep-online.nl or www.energiecijers.nl)
NO No There are plans to build a database which collects data on EPCs.
PL No Only hard copies are collected at the Poviat Building Inspectorates
PT Yes Administered by ADENE
RO No
SE Yes The National Register o Energy Certicates (Grifon) administered by the National Boardo Housing, Building and Planning
SK Yes Administered by the Building Testing and Research Institute - TSUS
SI No
UK Yes England & Wales: collected by Landmark Scotland: the Home Energy Eciency Database, maintained by the Energy Saving Trust(www.epbniregister.com)
Northern Ireland: www.epbnindregister.com
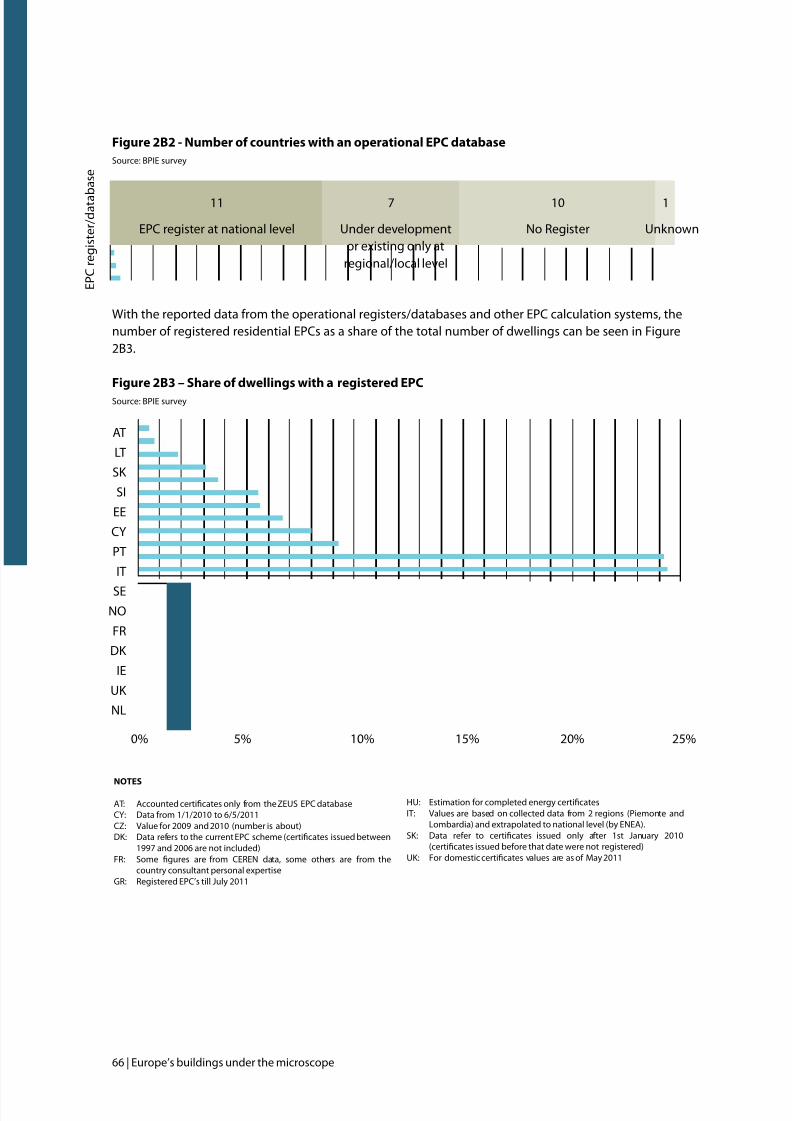
7/29/2019 LR CbC Study
http://slidepdf.com/reader/full/lr-cbc-study 66/132
66 | Europe’s buildings under the microscope
Figure 2B2 - Number o countries with an operational EPC database
Source: BPIE survey
With the reported data rom the operational registers/databases and other EPC calculation systems, thenumber o registered residential EPCs as a share o the total number o dwellings can be seen in Figure2B3. Figure 2B3 – Share o dwellings with a registered EPC
Source: BPIE survey
E P C r e g i s t e r / d a t a b a s e
11 7 10 1
AT
LT
SK
SI
EE
CY
PT
IT
SENO
FR
DK
IE
UK
NL
0% 5% 10% 15% 20% 25%
NOTES
AT: Accounted certicates only rom the ZEUS EPC databaseCY: Data rom 1/1/2010 to 6/5/2011CZ: Value or 2009 and 2010 (number is about)DK: Data reers to the current EPC scheme (certicates issued between
1997 and 2006 are not included)FR: Some gures are rom CEREN data, some others are rom the
country consultant personal expertiseGR: Registered EPC’s till July 2011
HU: Estimation or completed energy certicatesIT: Values are based on collected data rom 2 regions (Piemonte and
Lombardia) and extrapolated to national level (by ENEA).SK: Data reer to certicates issued only ater 1st January 2010
(certicates issued beore that date were not registered)UK: For domestic certicates values are as o May 2011
EPC register at national level Under developmentor existing only at
regional/local level
No Register Unknown
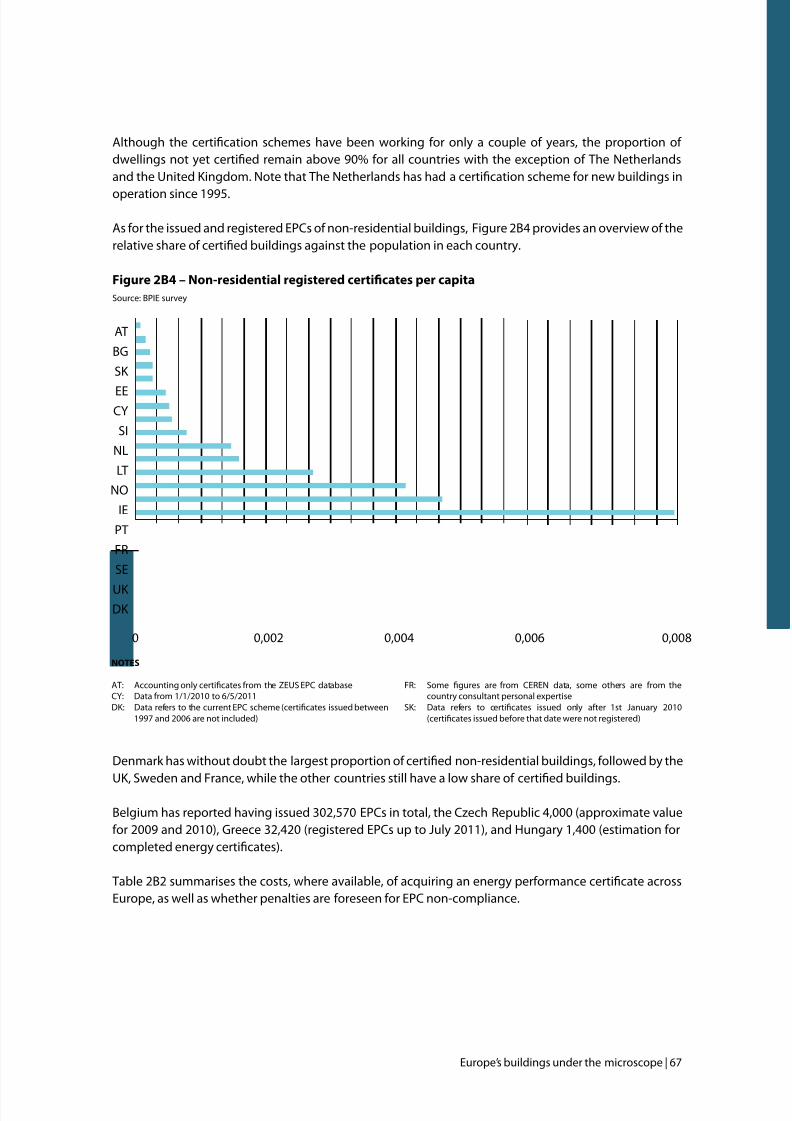
7/29/2019 LR CbC Study
http://slidepdf.com/reader/full/lr-cbc-study 67/132
Europe’s buildings under the microscope | 67
Although the certication schemes have been working or only a couple o years, the proportion o dwellings not yet certied remain above 90% or all countries with the exception o The Netherlandsand the United Kingdom. Note that The Netherlands has had a certication scheme or new buildings in
operation since 1995.
As or the issued and registered EPCs o non-residential buildings, Figure 2B4 provides an overview o therelative share o certied buildings against the population in each country.
Fiure2B4–Non-residentialreisteredcerticatespercapitaSource: BPIE survey
Denmark has without doubt the largest proportion o certied non-residential buildings, ollowed by theUK, Sweden and France, while the other countries still have a low share o certied buildings.
Belgium has reported having issued 302,570 EPCs in total, the Czech Republic 4,000 (approximate valueor 2009 and 2010), Greece 32,420 (registered EPCs up to July 2011), and Hungary 1,400 (estimation orcompleted energy certicates).
Table 2B2 summarises the costs, where available, o acquiring an energy perormance certicate acrossEurope, as well as whether penalties are oreseen or EPC non-compliance.
NOTES
AT: Accounting only certicates rom the ZEUS EPC databaseCY: Data rom 1/1/2010 to 6/5/2011DK: Data reers to the current EPC scheme (certicates issued between
1997 and 2006 are not included)
FR: Some gures are rom CEREN data, some others are rom thecountry consultant personal expertise
SK: Data reers to certicates issued only ater 1st January 2010(certicates issued beore that date were not registered)
AT
BG
SK
EECY
SI
NL
LT
NO
IE
PT
FR
SE
UK DK
0 0,002 0,004 0,006 0,008
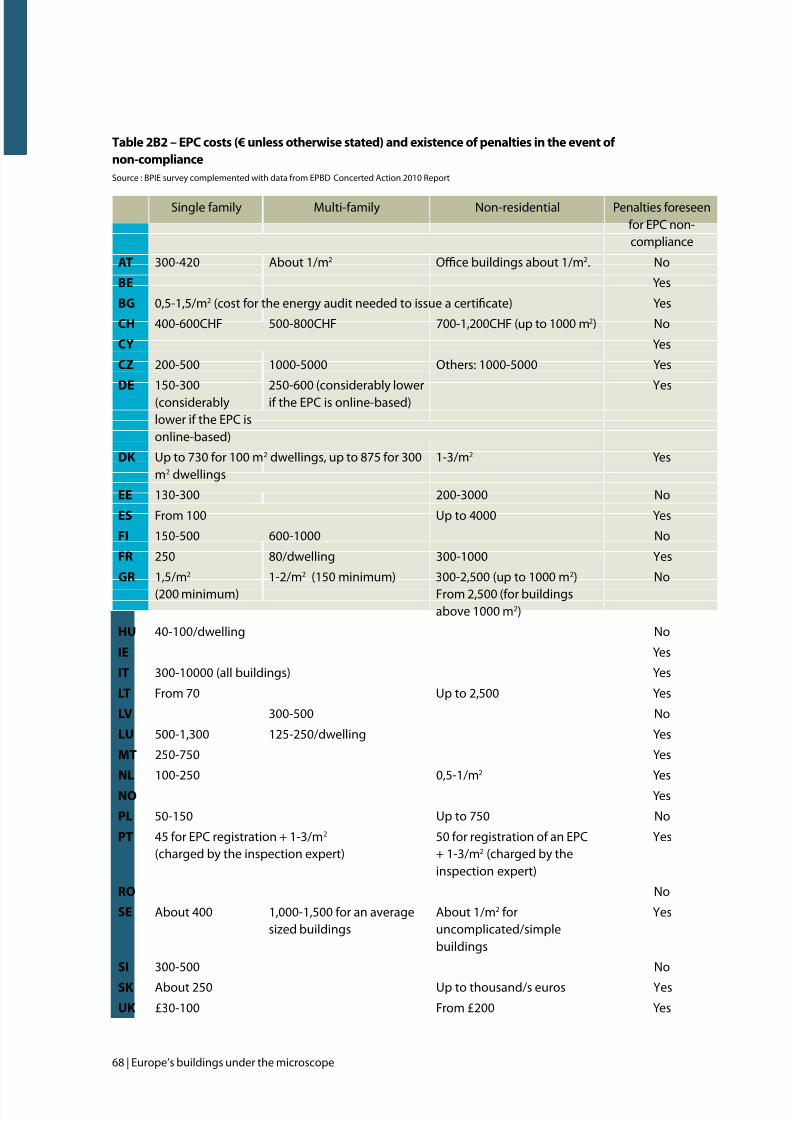
7/29/2019 LR CbC Study
http://slidepdf.com/reader/full/lr-cbc-study 68/132
68 | Europe’s buildings under the microscope
Table 2B2 – EPC costs (€ unless otherwise stated) and existence o penalties in the event o
non-compliance
Source : BPIE survey complemented with data rom EPBD Concerted Action 2010 Report
Single amily Multi-amily Non-residential Penalties oreseenor EPC non-compliance
AT 300-420 About 1/m2 Oce buildings about 1/m2. No
BE Yes
BG 0,5-1,5/m2 (cost or the energy audit needed to issue a certicate) Yes
CH 400-600CHF 500-800CHF 700-1,200CHF (up to 1000 m2) No
CY Yes
CZ 200-500 1000-5000 Others: 1000-5000 Yes
DE 150-300(considerablylower i the EPC isonline-based)
250-600 (considerably loweri the EPC is online-based)
Yes
DK Up to 730 or 100 m2 dwellings, up to 875 or 300m2 dwellings
1-3/m2 Yes
EE 130-300 200-3000 No
ES From 100 Up to 4000 Yes
FI 150-500 600-1000 No
FR 250 80/dwelling 300-1000 Yes
GR 1,5/m2
(200 minimum)
1-2/m2 (150 minimum) 300-2,500 (up to 1000 m2)
From 2,500 (or buildingsabove 1000 m2)
No
HU 40-100/dwelling No
IE Yes
IT 300-10000 (all buildings) Yes
LT From 70 Up to 2,500 Yes
LV 300-500 No
LU 500-1,300 125-250/dwelling Yes
MT 250-750 Yes
NL 100-250 0,5-1/m2 Yes
NO Yes
PL 50-150 Up to 750 No
PT 45 or EPC registration + 1-3/m2 (charged by the inspection expert)
50 or registration o an EPC+ 1-3/m2 (charged by theinspection expert)
Yes
RO No
SE About 400 1,000-1,500 or an averagesized buildings
About 1/m2 oruncomplicated/simplebuildings
Yes
SI 300-500 No
SK About 250 Up to thousand/s euros Yes
UK £30-100 From £200 Yes
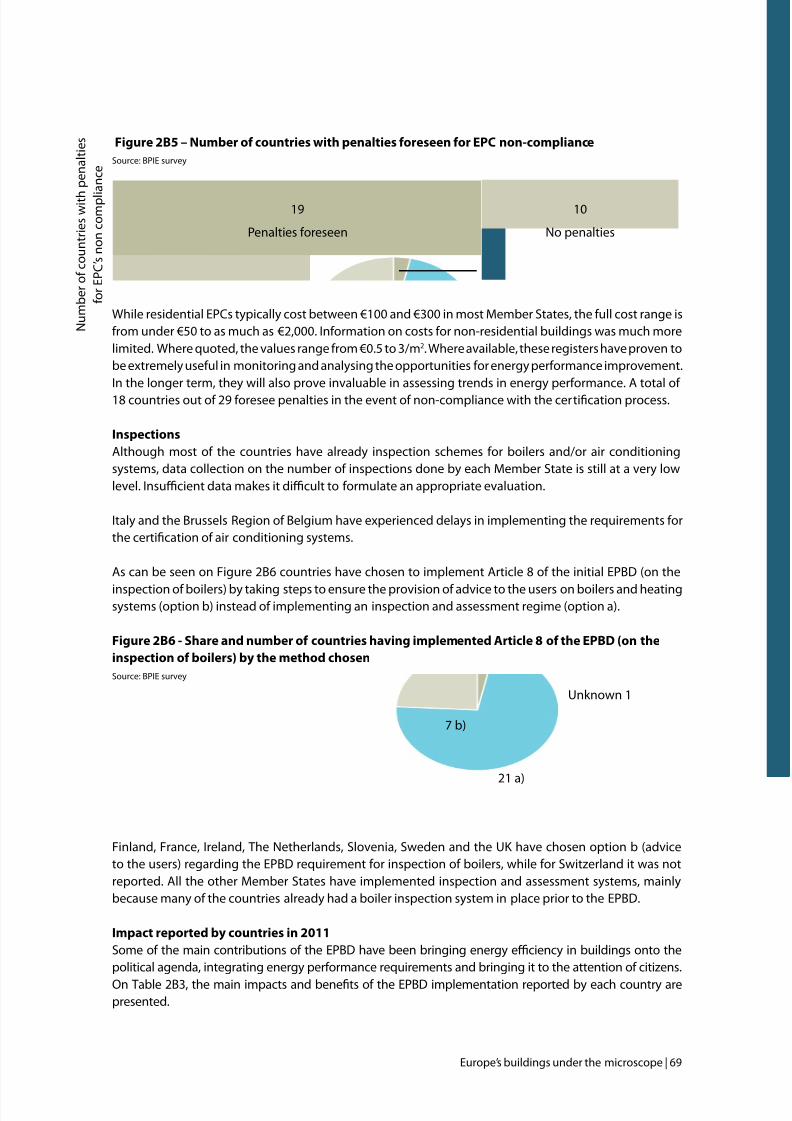
7/29/2019 LR CbC Study
http://slidepdf.com/reader/full/lr-cbc-study 69/132
Europe’s buildings under the microscope | 69
Figure 2B5 – Number o countries with penalties oreseen or EPC non-compliance
Source: BPIE survey
While residential EPCs typically cost between €100 and €300 in most Member States, the ull cost range isrom under €50 to as much as €2,000. Inormation on costs or non-residential buildings was much morelimited. Where quoted, the values range rom €0.5 to 3/m2. Where available, these registers have proven tobe extremely useul in monitoring and analysing the opportunities or energy perormance improvement.In the longer term, they will also prove invaluable in assessing trends in energy perormance. A total o 18 countries out o 29 oresee penalties in the event o non-compliance with the certication process.
Inspections
Although most o the countries have already inspection schemes or boilers and/or air conditioningsystems, data collection on the number o inspections done by each Member State is still at a very lowlevel. Insucient data makes it dicult to ormulate an appropriate evaluation.
Italy and the Brussels Region o Belgium have experienced delays in implementing the requirements orthe certication o air conditioning systems.
As can be seen on Figure 2B6 countries have chosen to implement Article 8 o the initial EPBD (on the
inspection o boilers) by taking steps to ensure the provision o advice to the users on boilers and heatingsystems (option b) instead o implementing an inspection and assessment regime (option a).
Figure 2B6 - Share and number o countries having implemented Article 8 o the EPBD (on the
inspection o boilers) by the method chosen
Source: BPIE survey
Finland, France, Ireland, The Netherlands, Slovenia, Sweden and the UK have chosen option b (adviceto the users) regarding the EPBD requirement or inspection o boilers, while or Switzerland it was notreported. All the other Member States have implemented inspection and assessment systems, mainlybecause many o the countries already had a boiler inspection system in place prior to the EPBD.
Impact reported by countries in 2011
Some o the main contributions o the EPBD have been bringing energy eciency in buildings onto thepolitical agenda, integrating energy perormance requirements and bringing it to the attention o citizens.
On Table 2B3, the main impacts and benets o the EPBD implementation reported by each country arepresented.
N u m b e r o c o u n t r i e s w i t h
p e n a l t i e s
o r E P C ’ s n o n c o m p l i a n c e
19 10
21 a)
7 b)
Unknown 1
Penalties oreseen No penalties
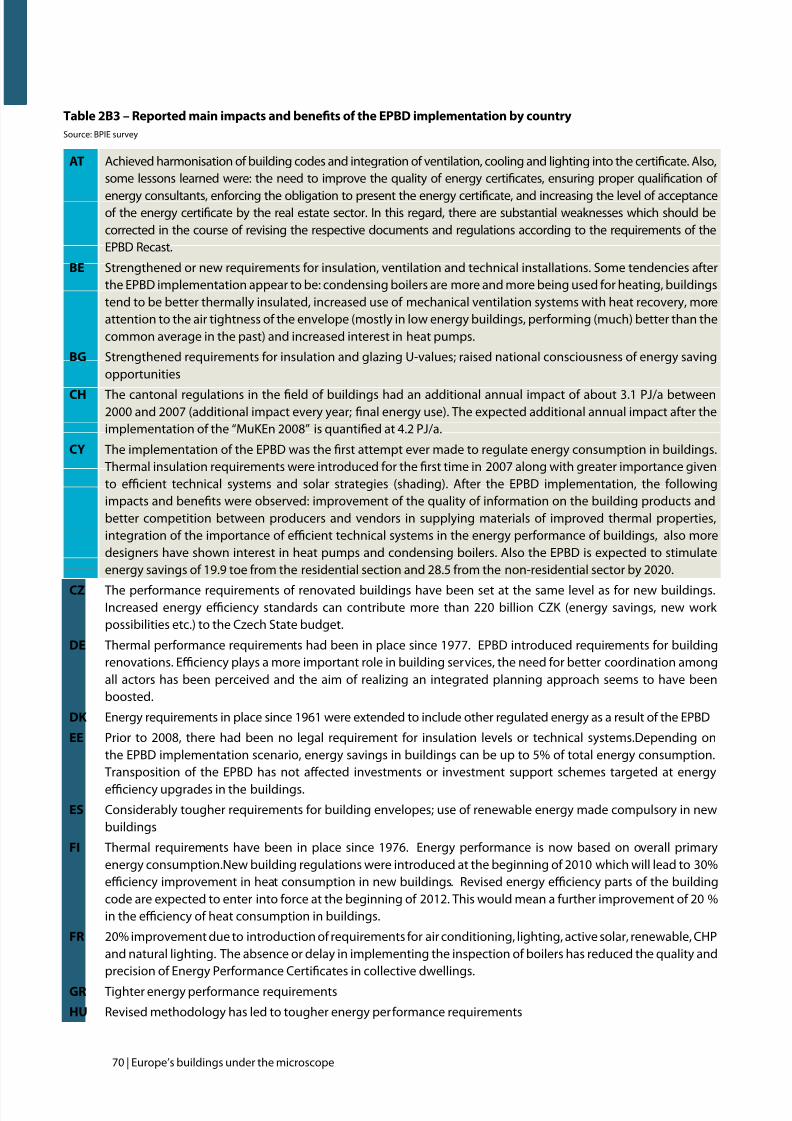
7/29/2019 LR CbC Study
http://slidepdf.com/reader/full/lr-cbc-study 70/132
70 | Europe’s buildings under the microscope
Table2B3–ReportedmainimpactsandbenetsoftheEPBDimplementationbycountrySource: BPIE survey
AT Achieved harmonisation o building codes and integration o ventilation, cooling and lighting into the certicate. Also,some lessons learned were: the need to improve the quality o energy certicates, ensuring proper qualication o
energy consultants, enorcing the obligation to present the energy certicate, and increasing the level o acceptanceo the energy certicate by the real estate sector. In this regard, there are substantial weaknesses which should becorrected in the course o revising the respective documents and regulations according to the requirements o theEPBD Recast.
BE Strengthened or new requirements or insulation, ventilation and technical installations. Some tendencies aterthe EPBD implementation appear to be: condensing boilers are more and more being used or heating, buildingstend to be better thermally insulated, increased use o mechanical ventilation systems with heat recovery, moreattention to the air tightness o the envelope (mostly in low energy buildings, perorming (much) better than thecommon average in the past) and increased interest in heat pumps.
BG Strengthened requirements or insulation and glazing U-values; raised national consciousness o energy savingopportunities
CH The cantonal regulations in the eld o buildings had an additional annual impact o about 3.1 PJ/a between2000 and 2007 (additional impact every year; nal energy use). The expected additional annual impact ater theimplementation o the “MuKEn 2008” is quantied at 4.2 PJ/a.
CY The implementation o the EPBD was the rst attempt ever made to regulate energy consumption in buildings.Thermal insulation requirements were introduced or the rst time in 2007 along with greater importance givento ecient technical systems and solar strategies (shading). Ater the EPBD implementation, the ollowingimpacts and benets were observed: improvement o the quality o inormation on the building products andbetter competition between producers and vendors in supplying materials o improved thermal properties,integration o the importance o ecient technical systems in the energy perormance o buildings, also moredesigners have shown interest in heat pumps and condensing boilers. Also the EPBD is expected to stimulateenergy savings o 19.9 toe rom the residential section and 28.5 rom the non-residential sector by 2020.
CZ The perormance requirements o renovated buildings have been set at the same level as or new buildings.Increased energy eciency standards can contribute more than 220 billion CZK (energy savings, new work possibilities etc.) to the Czech State budget.
DE Thermal perormance requirements had been in place since 1977. EPBD introduced requirements or buildingrenovations. Eciency plays a more important role in building services, the need or better coordination amongall actors has been perceived and the aim o realizing an integrated planning approach seems to have beenboosted.
DK Energy requirements in place since 1961 were extended to include other regulated energy as a result o the EPBD
EE Prior to 2008, there had been no legal requirement or insulation levels or technical systems.Depending onthe EPBD implementation scenario, energy savings in buildings can be up to 5% o total energy consumption.Transposition o the EPBD has not afected investments or investment support schemes targeted at energy
eciency upgrades in the buildings.ES Considerably tougher requirements or building envelopes; use o renewable energy made compulsory in new
buildings
FI Thermal requirements have been in place since 1976. Energy perormance is now based on overall primaryenergy consumption.New building regulations were introduced at the beginning o 2010 which will lead to 30%eciency improvement in heat consumption in new buildings. Revised energy eciency parts o the buildingcode are expected to enter into orce at the beginning o 2012. This would mean a urther improvement o 20 %in the eciency o heat consumption in buildings.
FR 20% improvement due to introduction o requirements or air conditioning, lighting, active solar, renewable, CHPand natural lighting. The absence or delay in implementing the inspection o boilers has reduced the quality andprecision o Energy Perormance Certicates in collective dwellings.
GR Tighter energy perormance requirements
HU Revised methodology has led to tougher energy perormance requirements
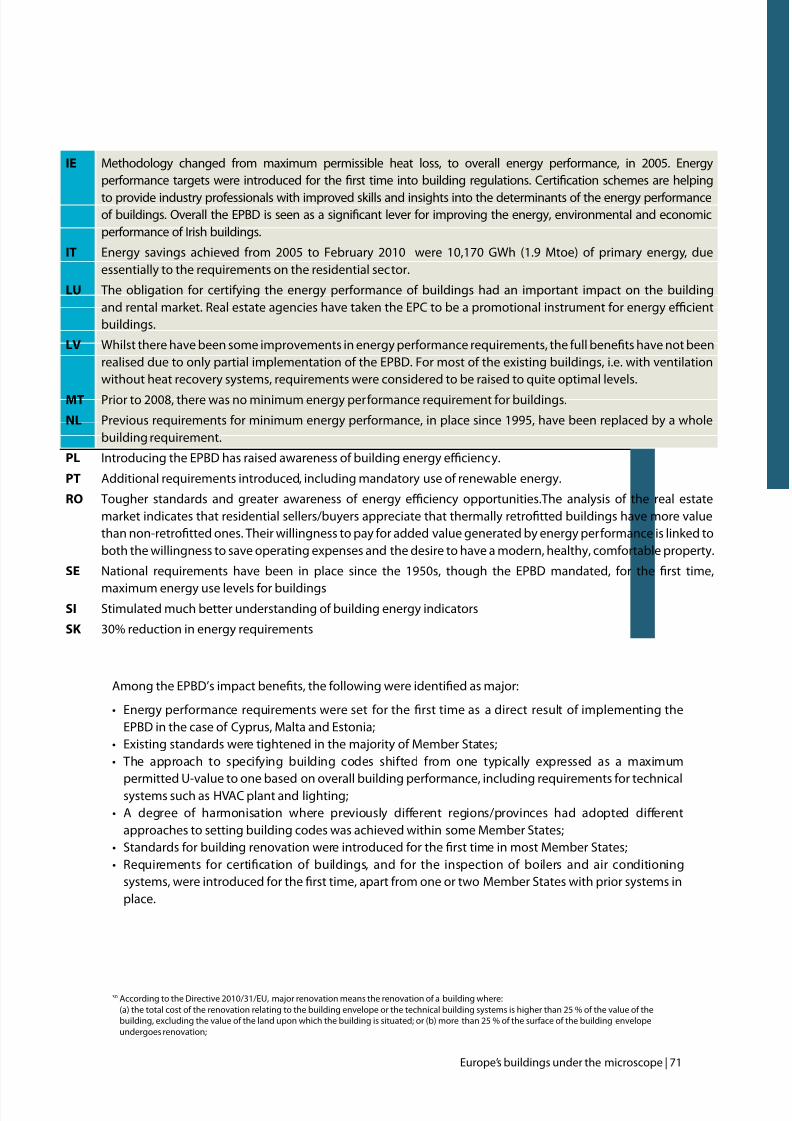
7/29/2019 LR CbC Study
http://slidepdf.com/reader/full/lr-cbc-study 71/132
Europe’s buildings under the microscope | 71
Among the EPBD’s impact benets, the ollowing were identied as major:
• Energyperformancerequirementswereset forthersttimeas adirectresultofimplementingthe
EPBD in the case o Cyprus, Malta and Estonia;• ExistingstandardsweretightenedinthemajorityofMemberStates;
• The approach to specifying building codes shifted from one typically expressed as a maximum
permitted U-value to one based on overall building perormance, including requirements or technicalsystems such as HVAC plant and lighting;• A degree of harmonisation where previously dierent regions/provinces had adopted dierent
approaches to setting building codes was achieved within some Member States;• StandardsforbuildingrenovationwereintroducedforthersttimeinmostMemberStates;
• Requirements for certicationofbuildings, and for the inspection ofboilers and air conditioning
systems, were introduced or the rst time, apart rom one or two Member States with prior systems inplace.
30 According to the Directive 2010/31/EU, major renovation means the renovation o a building where:(a) the total cost o the renovation relating to the building envelope or the technical building systems is higher than 25 % o the value o thebuilding, excluding the value o the land upon which the building is situated; or (b) more than 25 % o the surace o the building envelopeundergoes renovation;
IE Methodology changed rom maximum permissible heat loss, to overall energy perormance, in 2005. Energyperormance targets were introduced or the rst time into building regulations. Certication schemes are helping
to provide industry proessionals with improved skills and insights into the determinants o the energy perormanceo buildings. Overall the EPBD is seen as a signicant lever or improving the energy, environmental and economicperormance o Irish buildings.
IT Energy savings achieved rom 2005 to February 2010 were 10,170 GWh (1.9 Mtoe) o primary energy, dueessentially to the requirements on the residential sector.
LU The obligation or certiying the energy perormance o buildings had an important impact on the buildingand rental market. Real estate agencies have taken the EPC to be a promotional instrument or energy ecientbuildings.
LV Whilst there have been some improvements in energy perormance requirements, the ull benets have not beenrealised due to only partial implementation o the EPBD. For most o the existing buildings, i.e. with ventilationwithout heat recovery systems, requirements were considered to be raised to quite optimal levels.
MT Prior to 2008, there was no minimum energy perormance requirement or buildings.
NL Previous requirements or minimum energy perormance, in place since 1995, have been replaced by a wholebuilding requirement.
PL Introducing the EPBD has raised awareness o building energy eciency.
PT Additional requirements introduced, including mandatory use o renewable energy.
RO Tougher standards and greater awareness o energy eciency opportunities.The analysis o the real estatemarket indicates that residential sellers/buyers appreciate that thermally retrotted buildings have more valuethan non-retrotted ones. Their willingness to pay or added value generated by energy perormance is linked toboth the willingness to save operating expenses and the desire to have a modern, healthy, comortable property.
SE National requirements have been in place since the 1950s, though the EPBD mandated, or the rst time,
maximum energy use levels or buildingsSI Stimulated much better understanding o building energy indicators
SK 30% reduction in energy requirements
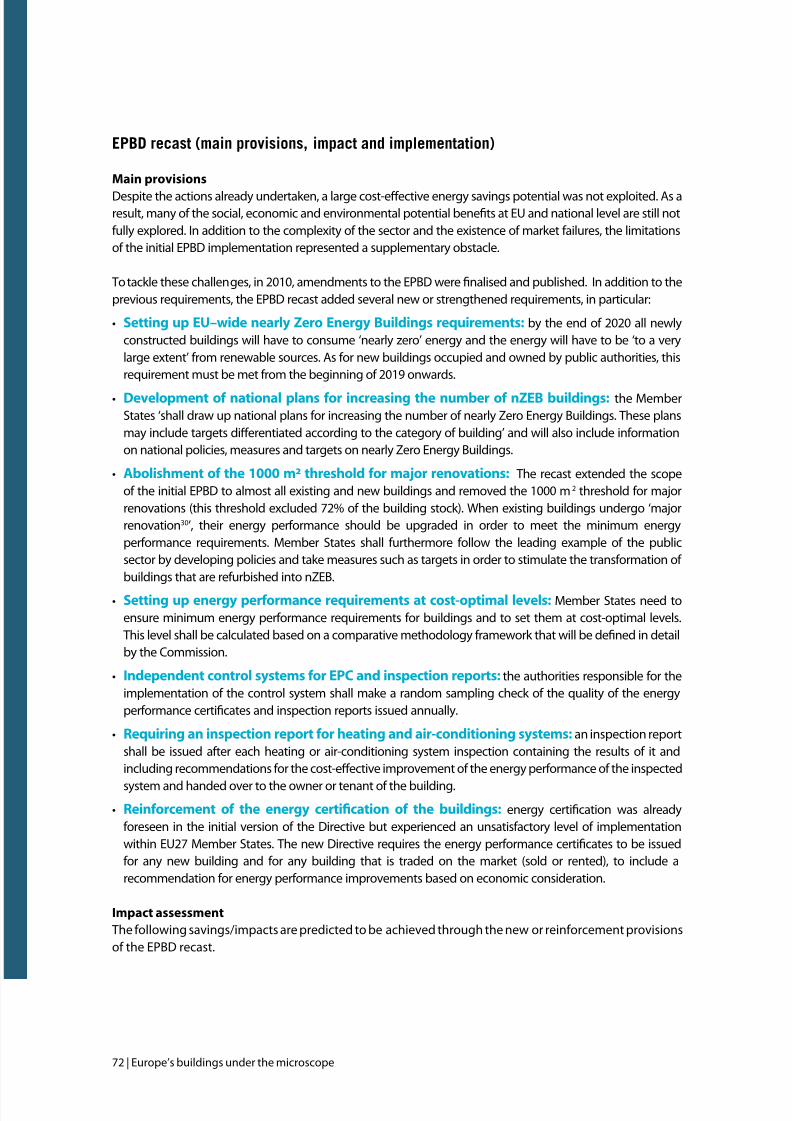
7/29/2019 LR CbC Study
http://slidepdf.com/reader/full/lr-cbc-study 72/132
72 | Europe’s buildings under the microscope
Epbd ea (a , a a eea)
Mainproisions
Despite the actions already undertaken, a large cost-efective energy savings potential was not exploited. As aresult, many o the social, economic and environmental potential benets at EU and national level are still notully explored. In addition to the complexity o the sector and the existence o market ailures, the limitationso the initial EPBD implementation represented a supplementary obstacle.
To tackle these challenges, in 2010, amendments to the EPBD were nalised and published. In addition to theprevious requirements, the EPBD recast added several new or strengthened requirements, in particular:
• Setting up EU–wide nearly Zero Energy Buildings requirements: by the end o 2020 all newlyconstructed buildings will have to consume ‘nearly zero’ energy and the energy will have to be ‘to a verylarge extent’ rom renewable sources. As or new buildings occupied and owned by public authorities, thisrequirement must be met rom the beginning o 2019 onwards.
• Development o national plans or increasing the number o nZEB buildings: the MemberStates ‘shall draw up national plans or increasing the number o nearly Zero Energy Buildings. These plansmay include targets diferentiated according to the category o building’ and will also include inormationon national policies, measures and targets on nearly Zero Energy Buildings.
• Abolishment o the 1000 m² threshold or major renovations: The recast extended the scopeo the initial EPBD to almost all existing and new buildings and removed the 1000 m 2 threshold or majorrenovations (this threshold excluded 72% o the building stock). When existing buildings undergo ‘majorrenovation30’, their energy perormance should be upgraded in order to meet the minimum energyperormance requirements. Member States shall urthermore ollow the leading example o the publicsector by developing policies and take measures such as targets in order to stimulate the transormation o buildings that are reurbished into nZEB.
• Setting up energy perormance requirements at cost-optimal levels: Member States need toensure minimum energy perormance requirements or buildings and to set them at cost-optimal levels.This level shall be calculated based on a comparative methodology ramework that will be dened in detailby the Commission.
• Independent control systems or EPC and inspection reports: the authorities responsible or theimplementation o the control system shall make a random sampling check o the quality o the energyperormance certicates and inspection reports issued annually.
• Requiring an inspection report or heating and air-conditioning systems: an inspection reportshall be issued ater each heating or air-conditioning system inspection containing the results o it andincluding recommendations or the cost-efective improvement o the energy perormance o the inspected
system and handed over to the owner or tenant o the building.• Reinorcement o the energy certifcation o the buildings: energy certication was already
oreseen in the initial version o the Directive but experienced an unsatisactory level o implementationwithin EU27 Member States. The new Directive requires the energy perormance certicates to be issuedor any new building and or any building that is traded on the market (sold or rented), to include arecommendation or energy perormance improvements based on economic consideration.
Impact assessment
The ollowing savings/impacts are predicted to be achieved through the new or reinorcement provisionso the EPBD recast.
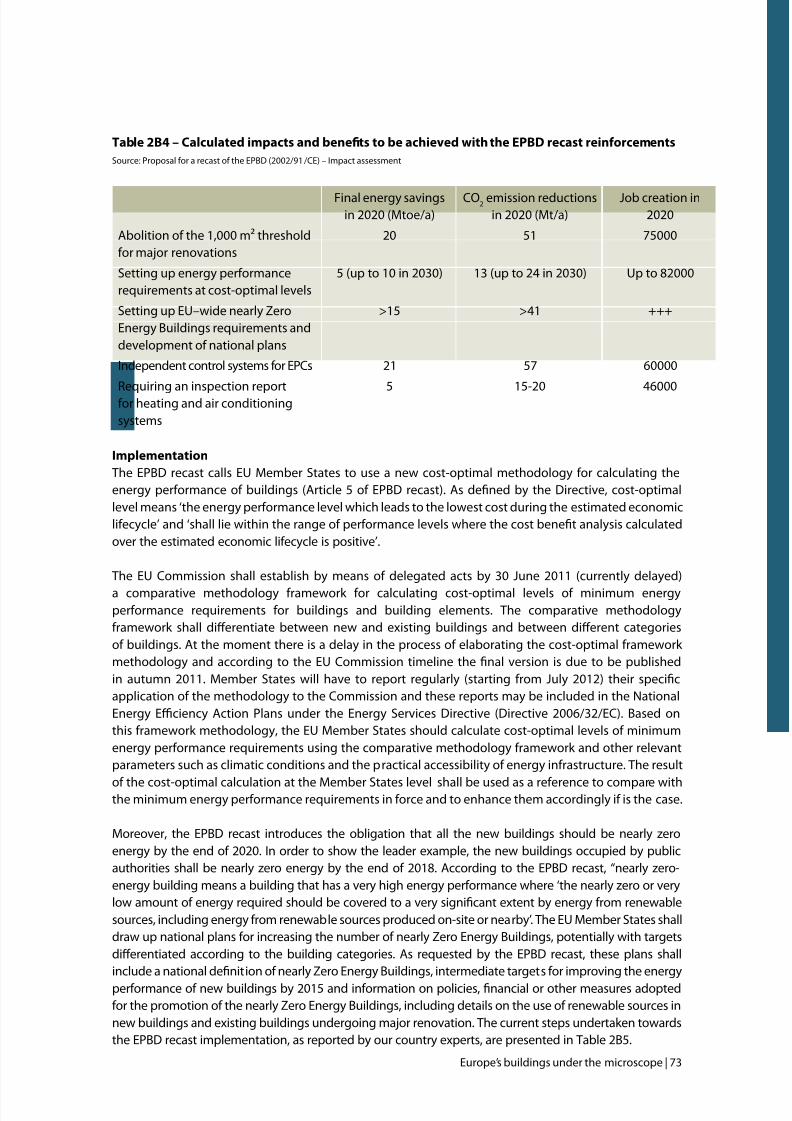
7/29/2019 LR CbC Study
http://slidepdf.com/reader/full/lr-cbc-study 73/132
Europe’s buildings under the microscope | 73
Table2B4–CalculatedimpactsandbenetstobeachieedwiththeEPBDrecastreinforcementsSource: Proposal or a recast o the EPBD (2002/91 /CE) – Impact assessment
Final energy savingsin 2020 (Mtoe/a)
CO2 emission reductionsin 2020 (Mt/a)
Job creation in2020
Abolition o the 1,000 m² thresholdor major renovations
20 51 75000
Setting up energy perormancerequirements at cost-optimal levels
5 (up to 10 in 2030) 13 (up to 24 in 2030) Up to 82000
Setting up EU–wide nearly ZeroEnergy Buildings requirements anddevelopment o national plans
>15 >41 +++
Independent control systems or EPCs 21 57 60000
Requiring an inspection reportor heating and air conditioningsystems
5 15-20 46000
Implementation
The EPBD recast calls EU Member States to use a new cost-optimal methodology or calculating theenergy perormance o buildings (Article 5 o EPBD recast). As dened by the Directive, cost-optimallevel means ‘the energy perormance level which leads to the lowest cost during the estimated economicliecycle’ and ‘shall lie within the range o perormance levels where the cost benet analysis calculatedover the estimated economic liecycle is positive’.
The EU Commission shall establish by means o delegated acts by 30 June 2011 (currently delayed)
a comparative methodology ramework or calculating cost-optimal levels o minimum energyperormance requirements or buildings and building elements. The comparative methodologyramework shall diferentiate between new and existing buildings and between diferent categorieso buildings. At the moment there is a delay in the process o elaborating the cost-optimal ramework methodology and according to the EU Commission timeline the nal version is due to be publishedin autumn 2011. Member States will have to report regularly (starting rom July 2012) their specicapplication o the methodology to the Commission and these reports may be included in the NationalEnergy Eciency Action Plans under the Energy Services Directive (Directive 2006/32/EC). Based onthis ramework methodology, the EU Member States should calculate cost-optimal levels o minimumenergy perormance requirements using the comparative methodology ramework and other relevantparameters such as climatic conditions and the practical accessibility o energy inrastructure. The result
o the cost-optimal calculation at the Member States level shall be used as a reerence to compare withthe minimum energy perormance requirements in orce and to enhance them accordingly i is the case.
Moreover, the EPBD recast introduces the obligation that all the new buildings should be nearly zeroenergy by the end o 2020. In order to show the leader example, the new buildings occupied by publicauthorities shall be nearly zero energy by the end o 2018. According to the EPBD recast, “nearly zero-energy building means a building that has a very high energy perormance where ‘the nearly zero or verylow amount o energy required should be covered to a very signicant extent by energy rom renewablesources, including energy rom renewable sources produced on-site or nearby’. The EU Member States shalldraw up national plans or increasing the number o nearly Zero Energy Buildings, potentially with targetsdiferentiated according to the building categories. As requested by the EPBD recast, these plans shallinclude a national denition o nearly Zero Energy Buildings, intermediate targets or improving the energyperormance o new buildings by 2015 and inormation on policies, nancial or other measures adoptedor the promotion o the nearly Zero Energy Buildings, including details on the use o renewable sources innew buildings and existing buildings undergoing major renovation. The current steps undertaken towardsthe EPBD recast implementation, as reported by our country experts, are presented in Table 2B5.
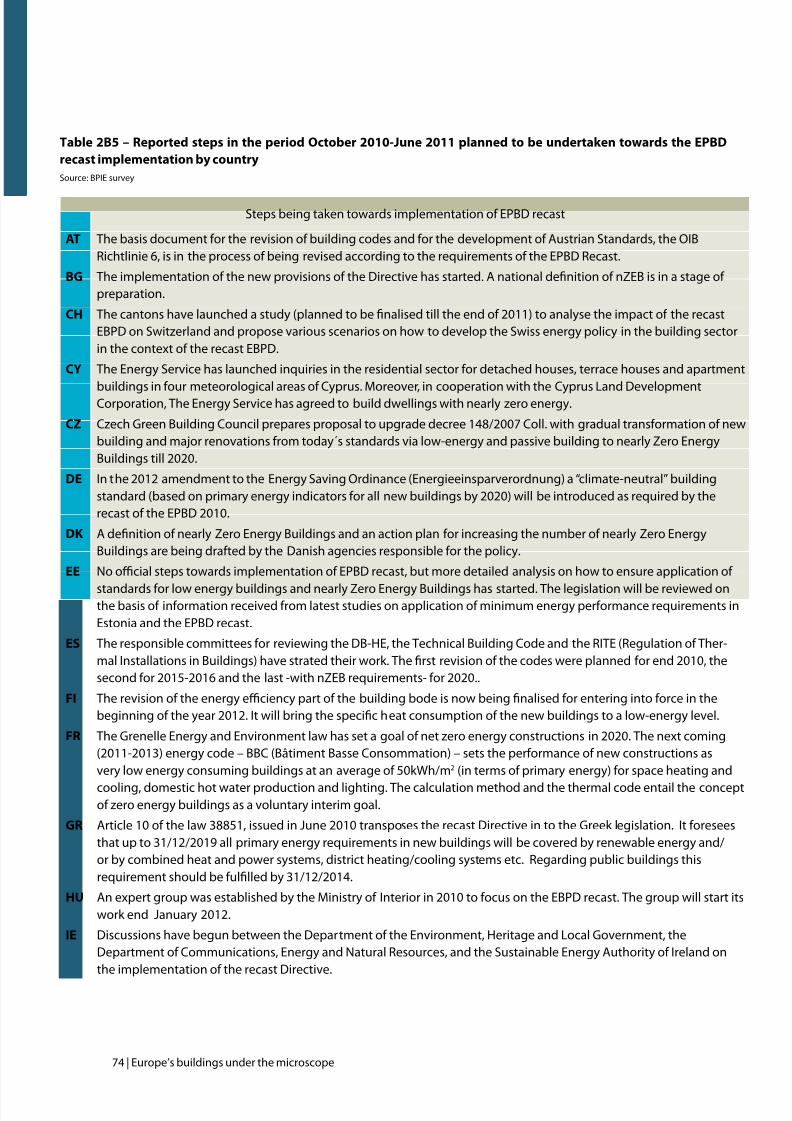
7/29/2019 LR CbC Study
http://slidepdf.com/reader/full/lr-cbc-study 74/132
74 | Europe’s buildings under the microscope
Steps being taken towards implementation o EPBD recast
AT The basis document or the revision o building codes and or the development o Austrian Standards, the OIBRichtlinie 6, is in the process o being revised according to the requirements o the EPBD Recast.
BG The implementation o the new provisions o the Directive has started. A national denition o nZEB is in a stage o preparation.
CH The cantons have launched a study (planned to be nalised till the end o 2011) to analyse the impact o the recastEBPD on Switzerland and propose various scenarios on how to develop the Swiss energy policy in the building sectorin the context o the recast EBPD.
CY The Energy Service has launched inquiries in the residential sector or detached houses, terrace houses and apartment
buildings in our meteorological areas o Cyprus. Moreover, in cooperation with the Cyprus Land DevelopmentCorporation, The Energy Service has agreed to build dwellings with nearly zero energy.
CZ Czech Green Building Council prepares proposal to upgrade decree 148/2007 Coll. with gradual transormation o newbuilding and major renovations rom today´s standards via low-energy and passive building to nearly Zero EnergyBuildings till 2020.
DE In the 2012 amendment to the Energy Saving Ordinance (Energieeinsparverordnung) a “climate-neutral” buildingstandard (based on primary energy indicators or all new buildings by 2020) will be introduced as required by therecast o the EPBD 2010.
DK A denition o nearly Zero Energy Buildings and an action plan or increasing the number o nearly Zero EnergyBuildings are being drated by the Danish agencies responsible or the policy.
EE No ocial steps towards implementation o EPBD recast, but more detailed analysis on how to ensure application o
standards or low energy buildings and nearly Zero Energy Buildings has started. The legislation will be reviewed onthe basis o inormation received rom latest studies on application o minimum energy perormance requirements inEstonia and the EPBD recast.
ES The responsible committees or reviewing the DB-HE, the Technical Building Code and the RITE (Regulation o Ther-mal Installations in Buildings) have strated their work. The rst revision o the codes were planned or end 2010, thesecond or 2015-2016 and the last -with nZEB requirements- or 2020..
FI The revision o the energy eciency part o the building bode is now being nalised or entering into orce in thebeginning o the year 2012. It will bring the specic heat consumption o the new buildings to a low-energy level.
FR The Grenelle Energy and Environment law has set a goal o net zero energy constructions in 2020. The next coming(2011-2013) energy code – BBC (Bâtiment Basse Consommation) – sets the perormance o new constructions asvery low energy consuming buildings at an average o 50kWh/m2 (in terms o primary energy) or space heating and
cooling, domestic hot water production and lighting. The calculation method and the thermal code entail the concepto zero energy buildings as a voluntary interim goal.
GR Article 10 o the law 38851, issued in June 2010 transposes the recast Directive in to the Greek legislation. It oreseesthat up to 31/12/2019 all primary energy requirements in new buildings will be covered by renewable energy and/or by combined heat and power systems, district heating/cooling systems etc. Regarding public buildings thisrequirement should be ullled by 31/12/2014.
HU An expert group was established by the Ministry o Interior in 2010 to ocus on the EBPD recast. The group will start itswork end January 2012.
IE Discussions have begun between the Department o the Environment, Heritage and Local Government, theDepartment o Communications, Energy and Natural Resources, and the Sustainable Energy Authority o Ireland onthe implementation o the recast Directive.
Table 2B5 – Reported steps in the period October 2010-June 2011 planned to be undertaken towards the EPBD
recast implementation by country
Source: BPIE survey
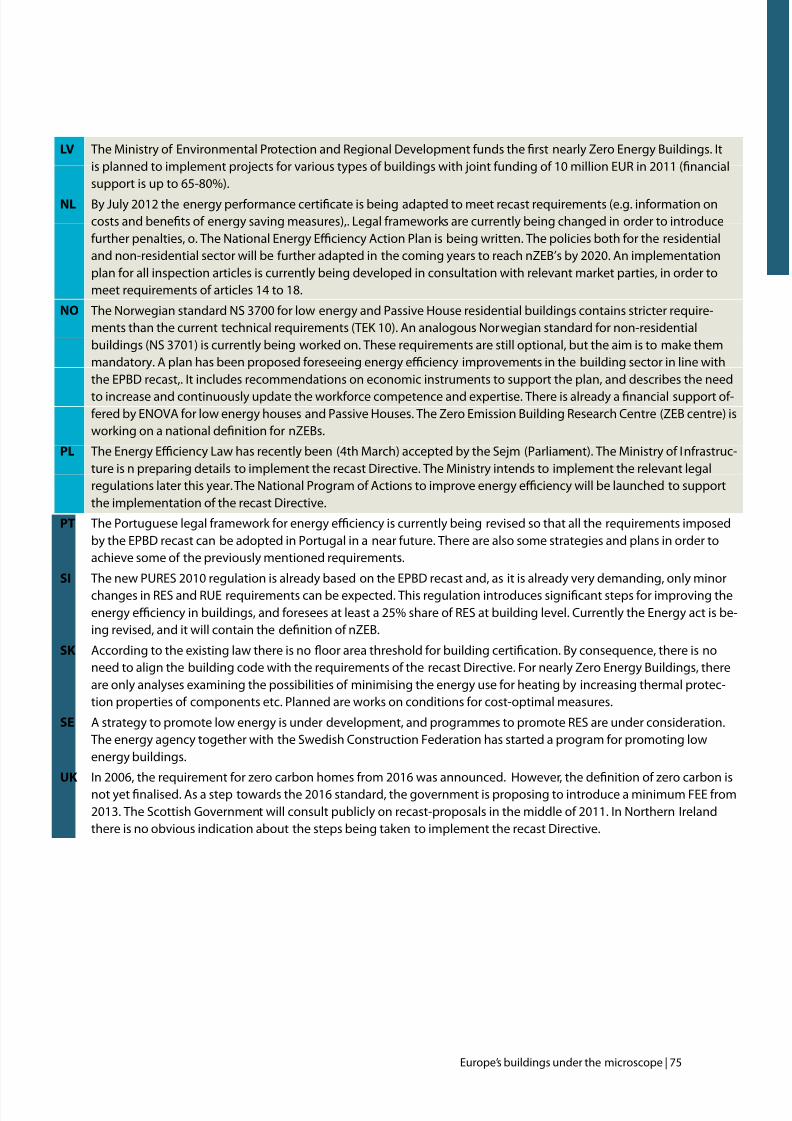
7/29/2019 LR CbC Study
http://slidepdf.com/reader/full/lr-cbc-study 75/132
Europe’s buildings under the microscope | 75
LV The Ministry o Environmental Protection and Regional Development unds the rst nearly Zero Energy Buildings. Itis planned to implement projects or various types o buildings with joint unding o 10 million EUR in 2011 (nancialsupport is up to 65-80%).
NL By July 2012 the energy perormance certicate is being adapted to meet recast requirements (e.g. inormation oncosts and benets o energy saving measures),. Legal rameworks are currently being changed in order to introduceurther penalties, o. The National Energy Eciency Action Plan is being written. The policies both or the residentialand non-residential sector will be urther adapted in the coming years to reach nZEB’s by 2020. An implementationplan or all inspection articles is currently being developed in consultation with relevant market parties, in order tomeet requirements o articles 14 to 18.
NO The Norwegian standard NS 3700 or low energy and Passive House residential buildings contains stricter require-ments than the current technical requirements (TEK 10). An analogous Norwegian standard or non-residentialbuildings (NS 3701) is currently being worked on. These requirements are still optional, but the aim is to make themmandatory. A plan has been proposed oreseeing energy eciency improvements in the building sector in line withthe EPBD recast,. It includes recommendations on economic instruments to support the plan, and describes the need
to increase and continuously update the workorce competence and expertise. There is already a nancial support o-ered by ENOVA or low energy houses and Passive Houses. The Zero Emission Building Research Centre (ZEB centre) isworking on a national denition or nZEBs.
PL The Energy Eciency Law has recently been (4th March) accepted by the Sejm (Parliament). The Ministry o Inrastruc-ture is n preparing details to implement the recast Directive. The Ministry intends to implement the relevant legalregulations later this year. The National Program o Actions to improve energy eciency will be launched to supportthe implementation o the recast Directive.
PT The Portuguese legal ramework or energy eciency is currently being revised so that all the requirements imposedby the EPBD recast can be adopted in Portugal in a near uture. There are also some strategies and plans in order toachieve some o the previously mentioned requirements.
SI The new PURES 2010 regulation is already based on the EPBD recast and, as it is already very demanding, only minorchanges in RES and RUE requirements can be expected. This regulation introduces signicant steps or improving theenergy eciency in buildings, and oresees at least a 25% share o RES at building level. Currently the Energy act is be-ing revised, and it will contain the denition o nZEB.
SK According to the existing law there is no oor area threshold or building certication. By consequence, there is noneed to align the building code with the requirements o the recast Directive. For nearly Zero Energy Buildings, thereare only analyses examining the possibilities o minimising the energy use or heating by increasing thermal protec-tion properties o components etc. Planned are works on conditions or cost-optimal measures.
SE A strategy to promote low energy is under development, and programmes to promote RES are under consideration.The energy agency together with the Swedish Construction Federation has started a program or promoting lowenergy buildings.
UK In 2006, the requirement or zero carbon homes rom 2016 was announced. However, the denition o zero carbon isnot yet nalised. As a step towards the 2016 standard, the government is proposing to introduce a minimum FEE rom2013. The Scottish Government will consult publicly on recast-proposals in the middle o 2011. In Northern Irelandthere is no obvious indication about the steps being taken to implement the recast Directive.
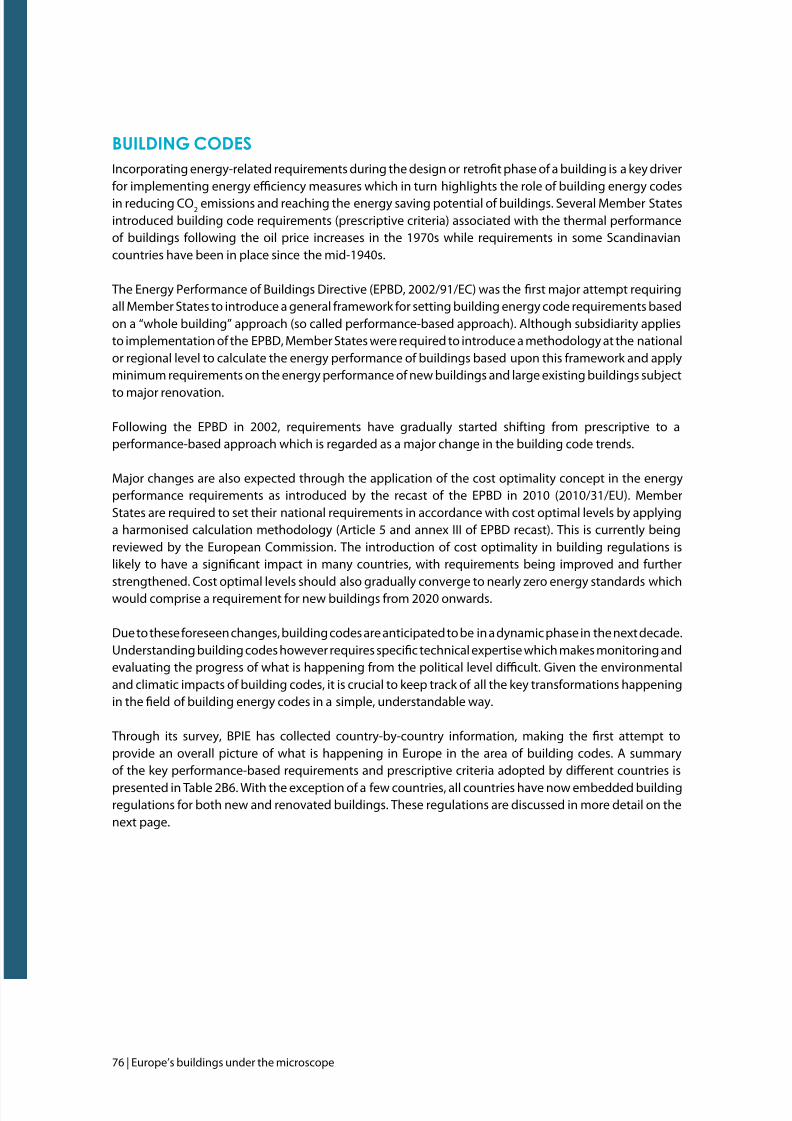
7/29/2019 LR CbC Study
http://slidepdf.com/reader/full/lr-cbc-study 76/132
76 | Europe’s buildings under the microscope
building codes
Incorporating energy-related requirements during the design or retrot phase o a building is a key driveror implementing energy eciency measures which in turn highlights the role o building energy codesin reducing CO
2emissions and reaching the energy saving potential o buildings. Several Member States
introduced building code requirements (prescriptive criteria) associated with the thermal perormanceo buildings ollowing the oil price increases in the 1970s while requirements in some Scandinaviancountries have been in place since the mid-1940s.
The Energy Perormance o Buildings Directive (EPBD, 2002/91/EC) was the rst major attempt requiringall Member States to introduce a general ramework or setting building energy code requirements basedon a “whole building” approach (so called perormance-based approach). Although subsidiarity appliesto implementation o the EPBD, Member States were required to introduce a methodology at the nationalor regional level to calculate the energy perormance o buildings based upon this ramework and applyminimum requirements on the energy perormance o new buildings and large existing buildings subject
to major renovation.
Following the EPBD in 2002, requirements have gradually started shiting rom prescriptive to aperormance-based approach which is regarded as a major change in the building code trends.
Major changes are also expected through the application o the cost optimality concept in the energyperormance requirements as introduced by the recast o the EPBD in 2010 (2010/31/EU). MemberStates are required to set their national requirements in accordance with cost optimal levels by applyinga harmonised calculation methodology (Article 5 and annex III o EPBD recast). This is currently beingreviewed by the European Commission. The introduction o cost optimality in building regulations islikely to have a signicant impact in many countries, with requirements being improved and urtherstrengthened. Cost optimal levels should also gradually converge to nearly zero energy standards whichwould comprise a requirement or new buildings rom 2020 onwards.
Due to these oreseen changes, building codes are anticipated to be in a dynamic phase in the next decade.Understanding building codes however requires specic technical expertise which makes monitoring andevaluating the progress o what is happening rom the political level dicult. Given the environmentaland climatic impacts o building codes, it is crucial to keep track o all the key transormations happeningin the eld o building energy codes in a simple, understandable way.
Through its survey, BPIE has collected country-by-country inormation, making the rst attempt toprovide an overall picture o what is happening in Europe in the area o building codes. A summaryo the key perormance-based requirements and prescriptive criteria adopted by diferent countries is
presented in Table 2B6. With the exception o a ew countries, all countries have now embedded buildingregulations or both new and renovated buildings. These regulations are discussed in more detail on thenext page.
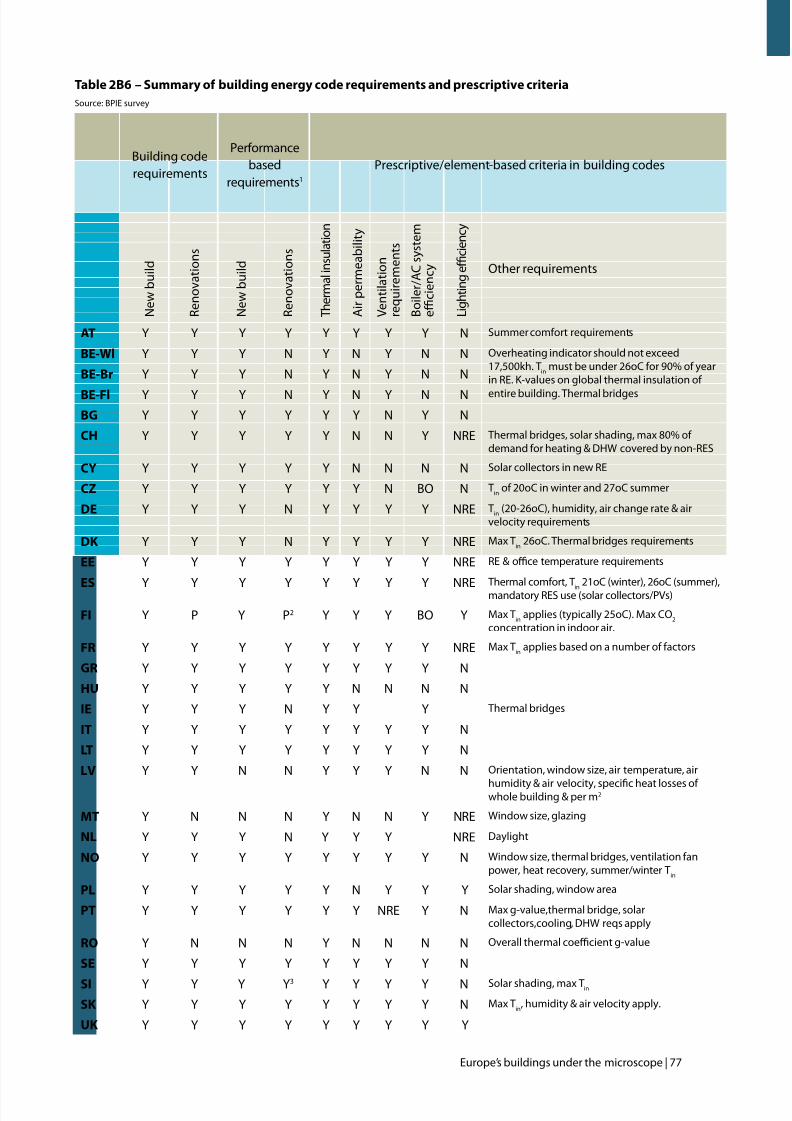
7/29/2019 LR CbC Study
http://slidepdf.com/reader/full/lr-cbc-study 77/132
Europe’s buildings under the microscope | 77
Table 2B6 – Summary o building energy code requirements and prescriptive criteria
Source: BPIE survey
Building coderequirements
Perormancebased
requirements1
Prescriptive/element-based criteria in building codes
Other requirements
AT Y Y Y Y Y Y Y Y N Summer comort requirements
BE-Wl Y Y Y N Y N Y N N Overheating indicator should not exceed17,500kh. T
inmust be under 26oC or 90% o year
in RE. K-values on global thermal insulation o
entire building. Thermal bridges
BE-Br Y Y Y N Y N Y N N
BE-Fl Y Y Y N Y N Y N NBG Y Y Y Y Y Y N Y N
CH Y Y Y Y Y N N Y NRE Thermal bridges, solar shading, max 80% o demand or heating & DHW covered by non-RES
CY Y Y Y Y Y N N N N Solar collectors in new RE
CZ Y Y Y Y Y Y N BO N Tin
o 20oC in winter and 27oC summer
DE Y Y Y N Y Y Y Y NRE Tin
(20-26oC), humidity, air change rate & airvelocity requirements
DK Y Y Y N Y Y Y Y NRE Max Tin
26oC. Thermal bridges requirements
EE Y Y Y Y Y Y Y Y NRE RE & oce temperature requirements
ES Y Y Y Y Y Y Y Y NREThermal comort, T
in
21oC (winter), 26oC (summer),mandatory RES use (solar collectors/PVs)
FI Y P Y P2 Y Y Y BO Y Max Tin
applies (typically 25oC). Max CO2
concentration in indoor air.
FR Y Y Y Y Y Y Y Y NRE Max Tin
applies based on a number o actors
GR Y Y Y Y Y Y Y Y N
HU Y Y Y Y Y N N N N
IE Y Y Y N Y Y Y Thermal bridges
IT Y Y Y Y Y Y Y Y N
LT Y Y Y Y Y Y Y Y N
LV Y Y N N Y Y Y N N Orientation, window size, air temperature, air
humidity & air velocity, specic heat losses o whole building & per m2
MT Y N N N Y N N Y NRE Window size, glazing
NL Y Y Y N Y Y Y NRE Daylight
NO Y Y Y Y Y Y Y Y N Window size, thermal bridges, ventilation anpower, heat recovery, summer/winter T
in
PL Y Y Y Y Y N Y Y Y Solar shading, window area
PT Y Y Y Y Y Y NRE Y N Max g-value,thermal bridge, solarcollectors,cooling, DHW reqs apply
RO Y N N N Y N N N N Overall thermal coecient g-value
SE Y Y Y Y Y Y Y Y N
SI Y Y Y Y3 Y Y Y Y N Solar shading, max Tin
SK Y Y Y Y Y Y Y Y N Max Tin
, humidity & air velocity apply.
UK Y Y Y Y Y Y Y Y Y
N e w b u i l d
B o i l e r / A C s y s t e m
e f c i e n c y
L i g h t i n g e f c i e n c y
R e n o v a t i o n s
N e w b u i l d
R e n o v a t i o n s
T h e r m a l i n s u l a t i o n
A i r p e r m e a b i l i t y
V e n t i l a t i o n
r e q u i r e m e n t s
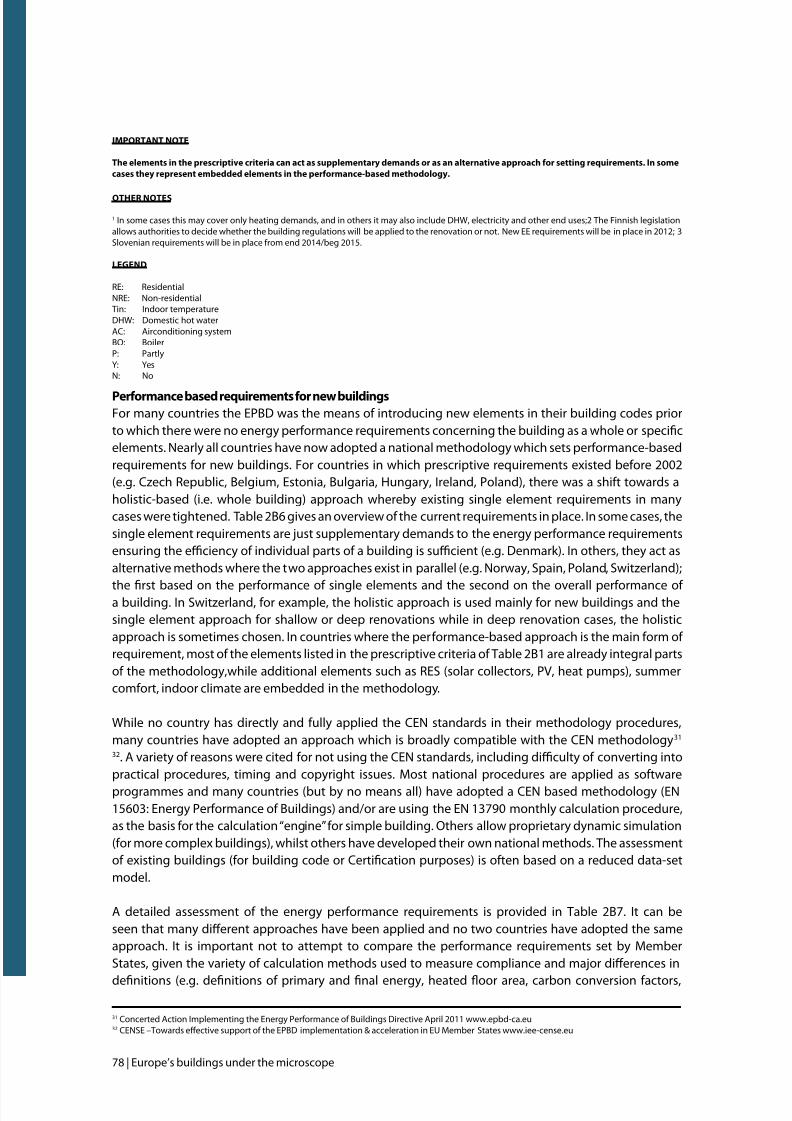
7/29/2019 LR CbC Study
http://slidepdf.com/reader/full/lr-cbc-study 78/132
78 | Europe’s buildings under the microscope
Perormance based requirements or new buildingsFor many countries the EPBD was the means o introducing new elements in their building codes priorto which there were no energy perormance requirements concerning the building as a whole or specicelements. Nearly all countries have now adopted a national methodology which sets perormance-basedrequirements or new buildings. For countries in which prescriptive requirements existed beore 2002(e.g. Czech Republic, Belgium, Estonia, Bulgaria, Hungary, Ireland, Poland), there was a shit towards aholistic-based (i.e. whole building) approach whereby existing single element requirements in manycases were tightened. Table 2B6 gives an overview o the current requirements in place. In some cases, thesingle element requirements are just supplementary demands to the energy perormance requirementsensuring the eciency o individual parts o a building is sucient (e.g. Denmark). In others, they act asalternative methods where the two approaches exist in parallel (e.g. Norway, Spain, Poland, Switzerland);
the rst based on the perormance o single elements and the second on the overall perormance o a building. In Switzerland, or example, the holistic approach is used mainly or new buildings and thesingle element approach or shallow or deep renovations while in deep renovation cases, the holisticapproach is sometimes chosen. In countries where the perormance-based approach is the main orm o requirement, most o the elements listed in the prescriptive criteria o Table 2B1 are already integral partso the methodology,while additional elements such as RES (solar collectors, PV, heat pumps), summercomort, indoor climate are embedded in the methodology.
While no country has directly and ully applied the CEN standards in their methodology procedures,many countries have adopted an approach which is broadly compatible with the CEN methodology31
32. A variety o reasons were cited or not using the CEN standards, including diculty o converting intopractical procedures, timing and copyright issues. Most national procedures are applied as sotware
programmes and many countries (but by no means all) have adopted a CEN based methodology (EN15603: Energy Perormance o Buildings) and/or are using the EN 13790 monthly calculation procedure,as the basis or the calculation “engine” or simple building. Others allow proprietary dynamic simulation(or more complex buildings), whilst others have developed their own national methods. The assessmento existing buildings (or building code or Certication purposes) is oten based on a reduced data-setmodel.
A detailed assessment o the energy perormance requirements is provided in Table 2B7. It can beseen that many diferent approaches have been applied and no two countries have adopted the sameapproach. It is important not to attempt to compare the perormance requirements set by MemberStates, given the variety o calculation methods used to measure compliance and major diferences in
denitions (e.g. denitions o primary and nal energy, heated oor area, carbon conversion actors,
31 Concerted Action Implementing the Energy Perormance o Buildings Directive April 2011 www.epbd-ca.eu32 CENSE –Towards efective support o the EPBD implementation & acceleration in EU Member States www.iee-cense.eu
IMPORTANTNOTE
The elements in the prescriptive criteria can act as supplementary demands or as an alternative approach or setting requirements. In some
cases they represent embedded elements in the perormance-based methodology.
OTHER NOTES
1 In some cases this may cover only heating demands, and in others it may also include DHW, electricity and other end uses;2 The Finnish legislationallows authorities to decide whether the building regulations will be applied to the renovation or not. New EE requirements will be in place in 2012; 3Slovenian requirements will be in place rom end 2014/beg 2015.
LEGEND
RE: ResidentialNRE: Non-residentialTin: Indoor temperatureDHW: Domestic hot waterAC: Airconditioning systemBO: BoilerP: PartlyY: YesN: No

7/29/2019 LR CbC Study
http://slidepdf.com/reader/full/lr-cbc-study 79/132
Europe’s buildings under the microscope | 79
regulated energy and total energy requirement etc.). The setting o building code requirements withlegally binding perormance targets, is normally based on either an absolute (i.e. not to exceed) value,generally expressed in kWh/m2a, or on a percentage improvement requirement based on a reerence
building o the same type, size, shape and orientation. Some countries (e.g. Belgium) express theperormance requirement as having to meet a dened “E value” on a 0 to 100 scale, or on an A+ to G scale(e.g. Italy and Cyprus).
Most methodology procedures are applied as sotware programmes. Sotware quality assuranceaccreditation is undertaken in only about hal o the countries, a nding which has been drawn bythe Concerted Action 2010 Report. About 50% o Member States have already introduced changes totheir methodology procedures to either to tighten requirements, achieve greater conormity with CENstandards, and include additional technologies and/or to correct weaknesses/gaps in earlier EPBDmethodology procedures.
There is a growing interest in the harmonisation o methodology procedures. This is likely to become anincreasingly important issue in the context o the EPBD RECAST Article 2.2 and Article 9 requirementsassociated with nearly Zero Energy Buildings (nZEB) and cost optimality (EPBD RECAST Article 5) sincethe Commission will need to demonstrate that all Member States are delivering equivalent outcomes. Aharmonised approach to setting and measuring nZEB targets and cost-optimality implies that a broadlyequivalent methodology will be required. Table 2B8 provides a summary o the certication methodused or new buildings.
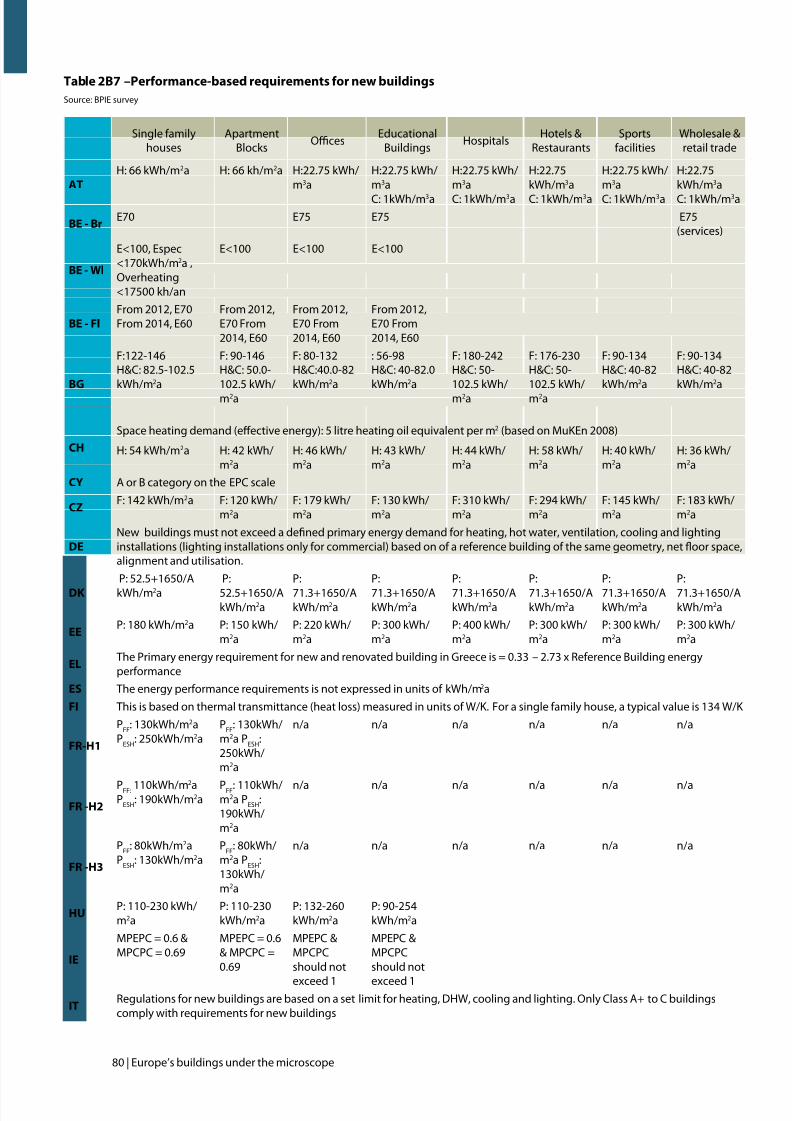
7/29/2019 LR CbC Study
http://slidepdf.com/reader/full/lr-cbc-study 80/132
80 | Europe’s buildings under the microscope
Single amilyhouses
ApartmentBlocks
OcesEducational
BuildingsHospitals
Hotels &Restaurants
Sportsacilities
Wholesale &retail trade
AT
H: 66 kWh/m2a H: 66 kh/m2a H:22.75 kWh/m3a
H:22.75 kWh/m3a
C: 1kWh/m3a
H:22.75 kWh/m3a
C: 1kWh/m3a
H:22.75kWh/m3a
C: 1kWh/m3a
H:22.75 kWh/m3a
C: 1kWh/m3a
H:22.75kWh/m3a
C: 1kWh/m3a
BE - BrE70 E75 E75 E75
(services)
BE - Wl
E<100, Espec<170kWh/m2a ,Overheating<17500 kh/an
E<100 E<100 E<100
BE - Fl
From 2012, E70From 2014, E60
From 2012,E70 From2014, E60
From 2012,E70 From2014, E60
From 2012,E70 From2014, E60
BG
F:122-146H&C: 82.5-102.5kWh/m2a
F: 90-146H&C: 50.0-102.5 kWh/m2a
F: 80-132H&C:40.0-82kWh/m2a
: 56-98H&C: 40-82.0kWh/m2a
F: 180-242H&C: 50-102.5 kWh/m2a
F: 176-230H&C: 50-102.5 kWh/m2a
F: 90-134H&C: 40-82kWh/m2a
F: 90-134H&C: 40-82kWh/m2a
CH
Space heating demand (efective energy): 5 litre heating oil equivalent per m2 (based on MuKEn 2008)
H: 54 kWh/m2a H: 42 kWh/m2a
H: 46 kWh/m2a
H: 43 kWh/m2a
H: 44 kWh/m2a
H: 58 kWh/m2a
H: 40 kWh/m2a
H: 36 kWh/m2a
CY A or B category on the EPC scale
CZF: 142 kWh/m2a F: 120 kWh/
m2aF: 179 kWh/m2a
F: 130 kWh/m2a
F: 310 kWh/m2a
F: 294 kWh/m2a
F: 145 kWh/m2a
F: 183 kWh/m2a
DE
New buildings must not exceed a dened primary energy demand or heating, hot water, ventilation, cooling and lightinginstallations (lighting installations only or commercial) based on o a reerence building o the same geometry, net oor space,alignment and utilisation.
DK
P: 52.5+1650/A
kWh/m2a
P:
52.5+1650/AkWh/m2a
P:
71.3+1650/AkWh/m2a
P:
71.3+1650/AkWh/m2a
P:
71.3+1650/AkWh/m2a
P:
71.3+1650/AkWh/m2a
P:
71.3+1650/AkWh/m2a
P:
71.3+1650/AkWh/m2a
EEP: 180 kWh/m2a P: 150 kWh/
m2aP: 220 kWh/m2a
P: 300 kWh/m2a
P: 400 kWh/m2a
P: 300 kWh/m2a
P: 300 kWh/m2a
P: 300 kWh/m2a
ELThe Primary energy requirement or new and renovated building in Greece is = 0.33 – 2.73 x Reerence Building energyperormance
ES The energy perormance requirements is not expressed in units o kWh/m2a
FI This is based on thermal transmittance (heat loss) measured in units o W/K. For a single amily house, a typical value is 134 W/K
FR-H1
PFF
: 130kWh/m2aP
ESH: 250kWh/m2a
PFF
: 130kWh/m2a P
ESH:
250kWh/m2a
n/a n/a n/a n/a n/a n/a
FR -H2
PFF: 110kWh/m2aP
ESH: 190kWh/m2a
PFF: 110kWh/m2a P
ESH:
190kWh/m2a
n/a n/a n/a n/a n/a n/a
FR -H3
PFF
: 80kWh/m2aP
ESH: 130kWh/m2a
PFF
: 80kWh/m2a P
ESH:
130kWh/m2a
n/a n/a n/a n/a n/a n/a
HUP: 110-230 kWh/m2a
P: 110-230kWh/m2a
P: 132-260kWh/m2a
P: 90-254kWh/m2a
IE
MPEPC = 0.6 &MPCPC = 0.69
MPEPC = 0.6& MPCPC =0.69
MPEPC &MPCPCshould not
exceed 1
MPEPC &MPCPCshould not
exceed 1
ITRegulations or new buildings are based on a set limit or heating, DHW, cooling and lighting. Only Class A+ to C buildingscomply with requirements or new buildings
Table 2B7 –Perormance-based requirements or new buildings
Source: BPIE survey
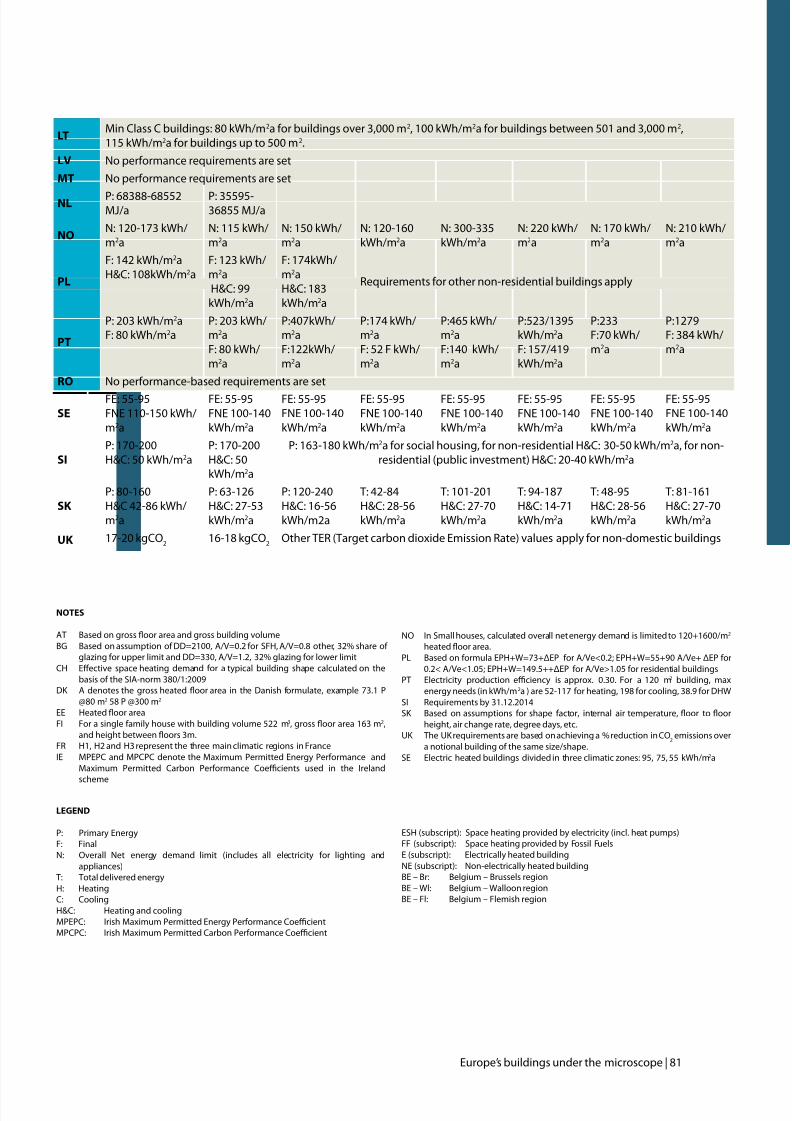
7/29/2019 LR CbC Study
http://slidepdf.com/reader/full/lr-cbc-study 81/132
Europe’s buildings under the microscope | 81
NOTES
AT Based on gross oor area and gross building volumeBG Based on assumption o DD=2100, A/V=0.2 or SFH, A/V=0.8 other, 32% share o
glazing or upper limit and DD=330, A/V=1.2, 32% glazing or lower limitCH Efective space heating demand or a typical building shape calculated on the
basis o the SIA-norm 380/1:2009DK A denotes the gross heated oor area in the Danish ormulate, example 73.1 P
@80 m2 58 P @300 m2
EE Heated oor areaFI For a single amily house with building volume 522 m3, gross oor area 163 m2,
and height between oors 3m.FR H1, H2 and H3 represent the three main climatic regions in FranceIE MPEPC and MPCPC denote the Maximum Permitted Energy Perormance and
Maximum Permitted Carbon Perormance Coecients used in the Irelandscheme
NO In Small houses, calculated overall net energy demand is limited to 120+1600/m2 heated oor area.
PL Based on ormula EPH+W=73+ΔEP or A/Ve<0.2; EPH+W=55+90 A/Ve+ ΔEP or0.2< A/Ve<1.05; EPH+W=149.5++ΔEP or A/Ve>1.05 or residential buildings
PT Electricity production eciency is approx. 0.30. For a 120 m2 building, maxenergy needs (in kWh/m2a ) are 52-117 or heating, 198 or cooling, 38.9 or DHW
SI Requirements by 31.12.2014SK Based on assumptions or shape actor, internal air temperature, oor to oor
height, air change rate, degree days, etc.UK The UK requirements are based on achieving a % reduction in CO
2emissions over
a notional building o the same size/shape.SE Electric heated buildings divided in three climatic zones: 95, 75, 55 kWh/m2a
LEGEND
P: Primary EnergyF: FinalN: Overall Net energy demand limit (includes all electricity or lighting and
appliances)T: Total delivered energyH: HeatingC: CoolingH&C: Heating and coolingMPEPC: Irish Maximum Permitted Energy Perormance CoecientMPCPC: Irish Maximum Permitted Carbon Perormance Coecient
ESH (subscript): Space heating provided by electricity (incl. heat pumps)FF (subscript): Space heating provided by Fossil FuelsE (subscript): Electrically heated buildingNE (subscript): Non-electrically heated buildingBE – Br: Belgium – Brussels regionBE – Wl: Belgium – Walloon regionBE – Fl: Belgium – Flemish region
LTMin Class C buildings: 80 kWh/m2a or buildings over 3,000 m2, 100 kWh/m2a or buildings between 501 and 3,000 m2,115 kWh/m2a or buildings up to 500 m2.
LV No perormance requirements are set
MT No perormance requirements are set
NL P: 68388-68552MJ/a
P: 35595-36855 MJ/a
NON: 120-173 kWh/m2a
N: 115 kWh/m2a
N: 150 kWh/m2a
N: 120-160kWh/m2a
N: 300-335kWh/m2a
N: 220 kWh/m2a
N: 170 kWh/m2a
N: 210 kWh/m2a
PL
F: 142 kWh/m2aH&C: 108kWh/m2a
F: 123 kWh/m2aH&C: 99kWh/m2a
F: 174kWh/m2aH&C: 183kWh/m2a
Requirements or other non-residential buildings apply
PT
P: 203 kWh/m2aF: 80 kWh/m2a
P: 203 kWh/m2aF: 80 kWh/m2a
P:407kWh/m2aF:122kWh/m2a
P:174 kWh/m2aF: 52 F kWh/m2a
P:465 kWh/m2aF:140 kWh/m2a
P:523/1395kWh/m2aF: 157/419kWh/m2a
P:233F:70 kWh/m2a
P:1279F: 384 kWh/m2a
RO No perormance-based requirements are set
SE
FE: 55-95FNE 110-150 kWh/m2a
FE: 55-95FNE 100-140kWh/m2a
FE: 55-95FNE 100-140kWh/m2a
FE: 55-95FNE 100-140kWh/m2a
FE: 55-95FNE 100-140kWh/m2a
FE: 55-95FNE 100-140kWh/m2a
FE: 55-95FNE 100-140kWh/m2a
FE: 55-95FNE 100-140kWh/m2a
SI
P: 170-200H&C: 50 kWh/m2a
P: 170-200H&C: 50kWh/m2a
P: 163-180 kWh/m2a or social housing, or non-residential H&C: 30-50 kWh/m2a, or non-residential (public investment) H&C: 20-40 kWh/m2a
SK
P: 80-160H&C 42-86 kWh/m2a
P: 63-126H&C: 27-53kWh/m2a
P: 120-240H&C: 16-56kWh/m2a
T: 42-84H&C: 28-56kWh/m2a
T: 101-201H&C: 27-70kWh/m2a
T: 94-187H&C: 14-71kWh/m2a
T: 48-95H&C: 28-56kWh/m2a
T: 81-161H&C: 27-70kWh/m2a
UK 17-20 kgCO2
16-18 kgCO2
Other TER (Target carbon dioxide Emission Rate) values apply or non-domestic buildings
7/29/2019 LR CbC Study
http://slidepdf.com/reader/full/lr-cbc-study 82/132
82 | Europe’s buildings under the microscope
Table2B8–KeyElementsconsideredinthecerticationmethodoloyadoptedbyMemberStatesSource: BPIE survey
AT Y Y Y Y Y Y Y Y Y Y
BE Y Y Y Y Y Y Y Y Y P
BG Y Y Y Y Y Y Y Y Y Y
CH Y Y Y Y Y Y Y Y Y Y
CY Y Y Y Y Y Y Y Y Y Y
CZ Y Y Y Y Y Y Y Y Y Y
DE Y Y Y P Y N N Y Y Y
DK Y Y Y Y Y Y Y Y Y Y
EE Y Y Y Y Y P Y Y P Y
EL Y Y Y Y Y Y Y Y Y Y
ES Y Y Y Y Y Y Y Y Y Y
FI Y Y Y Y Y Y Y Y Y YFR Y Y Y Y Y P Y Y P Y
HU Y Y Y N P N N N Y Y
IE Y Y Y Y Y Y Y Y Y Y
IT Y Y Y Y N Y Y Y N Y
LI Y Y Y Y Y Y Y Y Y Y
LV Y N N Y N Y N Y Y Y
MT Y Y Y Y Y Y Y Y Y Y
NL Y Y P P P Y Y Y Y Y
NO Y Y Y Y Y Y Y Y Y Y
PL Y Y Y Y P Y Y Y Y YPT Y Y Y Y Y Y Y Y Y Y
SE Y Y Y Y Y Y Y Y Y Y
SI Y Y Y Y Y Y Y Y Y Y
SK Y Y Y Y Y Y Y Y Y Y
UK Y Y Y Y Y Y Y Y Y Y
T h e r m a l c h a r a c t e r i s t i c s
H e a t i n g i n s t a l l a t i o n a n d
h o t w a t e r s u p p l y
A i r - c o n d i t i o n i n g
i n s t a l l a t i o n s
N a t u r a l a n d m e c h a n i c a l
v e n t i l a t i o n
B u i l t - i n l i g h t i n g
i n s t a l l a t i o n
D e s i g n , p o s i t i o n &
o r i e n t a t i o n o b u i l d i n g
P a s s i v e s o l a r s y s t e m s
a n d s o l a r p r o t e c t i o n
I n d o o r & o u t d o o r
c l i m a t i c c o n d i t i o n s
A i r - t i g h t n e s s
T h e r m a l b r i d g i n g
LEGEND
Y: YesN: NoP: Partly
7/29/2019 LR CbC Study
http://slidepdf.com/reader/full/lr-cbc-study 83/132
Europe’s buildings under the microscope | 83
Prescriptive-based requirements or new buildings
Member States have diferent prescriptive, element-based requirements associated with building energycodes such as maximum U values, minimum/maximum indoor temperatures, requirements or minimum
ventilation rates and boiler and/or air conditioning plant eciency. Some o the prescriptive criteriaassociated with the key requirements presented in Table 2B6 are urther analysed below. i. Insulation
Limiting the thermal conductivity o major construction elements is the most common thermalperormance requirement or buildings. These are based upon U value requirements (expressed inW/m2K) or the main building envelope construction elements. These U values are worst acceptablestandards which as a stand-alone measure would not necessarily mean that a building meets the overallperormance-based requirements in the respective country.
Country by country data on “maximum” U value requirements or roo, wall, oor, window and doorscollected through the BPIE survey are shown in Figure 2B7. These are presented against the relevantheating degree days per country or region. Given the diversity in climatic conditions, maximum U valuerequirements vary widely across diferent countries where Spain, France, Greece, Italy and Portugal havemultiple maximum U values due to the considerable variation in climatic conditions within each country.In some countries, variations also apply or diferent types o buildings (e.g. Latvia) and type o heating(e.g. Sweden). A comparison between the collected data and the cost optimal U values published byEURIMA/Ecoys33 in 2007 (see Figure 2B7, blue line) conrm that Member State maximum U values are stillhigher than the cost-optimal requirements, suggesting that U value requirements in most Member Statesshould be made more demanding. This was also one o the key ndings o the IEA inormation paper onbuilding codes34 where it was shown that existing U value requirements or building components didnot reect the economic optimum. From Figure 2B7, it can be deducted that this is especially true orcountries o mild or warm climates reecting the equivalent magnitude o efort that is required in those
countries. This comes as no surprise as countries in cold climatic zones have had longer traditions inthermal building regulations and thereore stricter requirements.
ii.Airtihtness/permeabilityandentilationrequirementsMost countries have introduced requirements to ensure minimum levels o ventilation within buildings.These are generally based upon metabolic rates and activity within the building. The requirementsassociated with ventilation relate principally to health, comort and productivity; however they dohave direct impact on energy requirements. The thermal perormance o buildings is directly relatedto airtightness and the requirements or ventilation. Excessive ventilation as a consequence o poorconstruction detailing, can lead to considerable energy wastage and or this reason a number o countries have introduced requirements to limit the air permeability o buildings. Air permeability is
normally measured using a pressure test, typically at 50Pa (4Pa in France and 10Pa in The Netherlands)to determine the air leakage rate. The requirement is typically expressed in m 3/h.m2 (where m2 is theexternal envelope area) or in the case o Denmark in l/s.m2 (where m2 is the oor area). Table 2B9 providesa summary o key requirements or Member States which have adopted airtightness requirements.
33 U –Values or better energy perormance o buildings EURIMA 2007 w ww.eurima.org/uploads/ModuleXtender/Documents/88/documents/EURIMA-ECOFYS_VII_report_p1-65.pd
34 Energy eciency requirements in bu ilding codes, energy eciency policies or new buildings, Jens Laustsen, International Energy Agency, March2008
7/29/2019 LR CbC Study
http://slidepdf.com/reader/full/lr-cbc-study 84/132
84 | Europe’s buildings under the microscope
Figure 2B7 – Building envelope insulation requirements
Source : BPIE survey. Cost optimality line is based on the analysis undertaken by Ecoys in the study on U-Values or Better Energy Perormance o Buildings, 2007
NOTES
(1) Depending on type o building (residential, public, industrial etc.)where κ is a temperature actor, κ = 19/(Tin-Tout), Tin and Toutdenote indoor and outdoor temperatures, respectively.
(2) Depending on evidence o thermal bridges(3) For England & Wales(4) Depending on type o building (residential and non residential) &
type o heating (electric and non electric). These represent overallU values(5) Mean HDD values or period 1980-2004 based on Eurostat data
LEGEND
HDD: Heating degree days.
MT CY PT EL ES IT LV (1) FR BG BE NL IE HU SI
HDD(5) 560 782 1282 1663 1842 1907 1970 2483 2686 2872 2902 2906 2922 3053
Roo 0.59 0.85 0.9-1.25 0.35-0.5 0.45-0.65
0.32-0.65
0.2κ-0.35κ 0.2-0.25 0.3 0.3 0.4 0.25 0.25 0.2
Walls 1.57 0.85 1.45-1.8 0.4-0.6 0.57-0.94
0.33-0.62
0.25κ-0.5κ 0.36-0.40 0.35 0.4 0.4 0.37 0.45 0.28
Floor 1.57 2 0.45-0.5 0.62-0.69
0.29-0.38
0.2κ-0.35κ 0.37-0.40 0.5 0.6 0.4 0.37 0.45 0.9
Window/Door5.8 3.8 2.6-3.2 3.1-5.7 1.3-3.7 1.8κ-2.4κ 1.7-1.9 1.8 2.5 4.2 2.2 1.6 1.1 -1.6
UK (3) RO DE SK CH(2) DK CZ AT PL LT EE SE(4) NO FI
HDD 3115 3129 3239 3453 3482 3503 3571 3573 3616 4094 4444 5444 5646 5850
Roo 0.2 0.2 0.24 0.19 0.17 or0.2 0.2 0.24 0.2 0.25 0.16 0.15-0.2
0.4-0.6
0.18 0.09
Walls 0.3 0.56 0.24 0.32 0.17 or0.2 0.3 0.3 0.35 0.3 0.2 0.2-0.25 0.22 0.17
Floor 0.25 0.35 0.3 0.17 or0.2 0.2 0.45 0.4 0.45 0.25 0.15-0.2 0.18 0.16
Window/Door
2 1.3 1.7 1.3 1.8 1.7 1.4 1.7 1.6 0.7-1.4 1.6 1.0
2
1,5
1
0,5
0
0 2000 4000 6000 8000
HDD
U V a l u e s [ W / m 2 K ) ]
Floor
2
1,5
1
0,5
0
0 2000 4000 6000 8000
HDD
U V a l u e s [ W / m 2 K ) ]
Walls
7
6
5
4
3
2
1
0
0 2000 4000 6000 8000
HDD
U V a l u e s [ W / m 2 K ) ]
Window/door
2
1,5
1
0,5
0
0 2000 4000 6000 8000
HDD
U V a l u e s [ W / m 2 K ) ]
Roo
Maximum U Value requirement Ecoys 2007 cost optimality line
7/29/2019 LR CbC Study
http://slidepdf.com/reader/full/lr-cbc-study 85/132
Europe’s buildings under the microscope | 85
iii. Other requirements
A number o countries (e.g. Austria, Denmark, France, Estonia and Poland) have introduced minimumrequirements or specic an power (generally expressed in W/l.s or kW/m3.s.). Given the increasing
use o mechanical ventilation system, the an power requirement in low energy buildings is becomingan important issue. Additionally most countries have requirements associated with the minimumperormance o boilers and airconditioning systems. Most building codes require minimum levels o daylight to be achieved within buildings, whilst ensuring that solar gains do not result in signicantoverheating and/or the requirement or air conditioning. Building requirements associated with limitingsolar gains vary rom simple approaches (e.g. limiting window areas on building aspects exposed to solargains) through to requirements or complex modelling and simulation to demonstrate that efectivemeasures have been adopted to provide solar protection. The Concerted Action report 1 recommendedthat much greater attention should be given to the issue o estimating the impact o summertimeoverheating in the methodology in order to reduce the rapid increase in demand or air conditioning.
In addition to speciying maximum U values, several countries have also set limits or maximumpermissible thermal bridging. This is generally expressed in W/mK. Thermal bridges can signicantlyincrease the building energy demand or heating and cooling and in nearly Zero Energy Buildingsthermal bridging can account or a signicant proportion o the total heat loss or gain. Thermal bridgingis specic to the design and specication and can be complex and time consuming to calculate. For thisreason, some countries allow a deault thermal bridging value to be used, based upon a percentage(typically 15%) o the overall heat loss calculation. However, i a detailed thermal bridging calculation hasbeen undertaken, which demonstrates that thermal bridges have been reduced or eliminated, this valuecan be used instead o the deault. ASIEPI estimate that “a third o EU Member States have no real ‘good-practice’ guidance on thermal bridges in the ramework o their building energy regulations. The qualityo guidance in the remaining States is very varied” 35.
35 ASIEPI Inormation Papers P188 and P189 http://www.asiepi.eu/wp-4-thermal-bridges/inormation-papers.html
7/29/2019 LR CbC Study
http://slidepdf.com/reader/full/lr-cbc-study 86/132
86 | Europe’s buildings under the microscope
Table 2B9 – Airtightness levels in building codes
Source: BPIE survey
AT In naturally ventilated buildings, maximum n50 is 3.0. In mechanically ventilated buildings,maximum n50
is 1.5.
BE Deault value o 12 m3/hm2 is used in methodology i no pressure test is available. Actual testresult is used in the calculation i available.
BG In apartments with high airtightness, n50
<2.0 h-1, with medium airtightness n50
=2.0-5.0 h-1 andwith low n
50>5h-1. In SFH with high airtightness, n
50<4.0h-1, with medium airtightnessn
50=4.0-10.0
h-1 and low airtightnessn50
>10.0 h-1.
CY Not regulated in building codes.
CZ Recommended maximum or common buildings is 4.5 h-1, low energy buildings 1.5 h-1 andpassive houses 0.6 h-1.For mechanically ventilated buildings w/o heat recovery 1.5 h-1, with heatrecovery 1.0 h-1.
DE For naturally ventilated buildings, n50 is 3.0h-1 and or mechanically ventilated buildings, n50 is1.5h-1.
DK Airtightness must be better than 1.5 l/sm2, tested @ 50 Pa.
ES Air permeability o windows and doors depend on the climatic zone. For zones A and B (Class1, 2, 3 and 4), maximum air permeability is 50 m3/hm2. For zones C, D and E (class 2, 3 and 4),maximum air permeability is 27 m3/hm2.
EL Air penetration or the reerence building, is taken equal to 5.5 m3/hm2 rame.
EE For small buildings, maximum airtightness is 6 m3/hm2 (or new buildings) and 9 m3/hm2 (orexisting buildings). For large buildings, maximum airtightness is 3 m3/hm2 (or new buildings)and 6 m3/hm2 (or existing buildings).
FI n50 equal to 2.0 is used or reerence building heat loss in Finnish Building Code. For EPC, n50 o 4is considered unless the measured value is diferent. Air change rate in new apartments shouldbe at least 0.5 h-1.
FR Airtightness under 4Pa o building envelope is limited to 0.8 m3/hm2or SFH, 1.2 m3/hm2or otherresidential buildings, oces, hotels educational and health care buildings and 2.5 m 3/hm2 orother buildings.
HU Not regulated in building codes.
LT For naturally ventilated building, maximum n50
=3 h-1, or mechanically ventilated buildings,maximum n
50=1.5 h-1.
LV Maximum n50
in dwellings is 3 m3/hm2, 4 m3/hm2 in public buildings, 6 m3/hm2 or industrialbuildings. For ventilated buildings, maximum n
50is 3 m3/hm2.
MT Not regulated in building codes.
NL For residential buildings, 200 dm3/s @10 Pa and or non-residential buildings 200 dm3/s per 500m3 @10 Pa.
NO Maximum n50
is 3.
PT For residential buildings, the requirement is 0.6h -1. Requirements or non residential buildingswith mechanical ventilation exist depending on type o use.
SI For naturally ventilated buildings, maximum n50
is 3.0, or mechanically ventilated buildings,maximum n
50is 2.0.
SK For SFH with high quality windows, maximum n50
is 4 h-1 and or all other buildings is 2 h-1. Othervalues apply or buildings with double glazed windows with seals or single glazed windows
without seals.UK Maximum n
50=10 m3/hm2
7/29/2019 LR CbC Study
http://slidepdf.com/reader/full/lr-cbc-study 87/132
Europe’s buildings under the microscope | 87
Building code requirements or existing buildings
Despite being an EPBD requirement, not all countries have reported specic mandatory building codesassociated with improving the energy perormance o existing buildings. It is important to recognise
that EPBD (Article 5) only applies to buildings over 1,000 m2
and most Member States have introducedrequirements or consequential improvements associated with buildings over 1,000 m2. It shouldbe noted that these requirements may not be applied when they are not deemed to be “technically,unctionally and economically easible”.
Table 2B10 provides a summary o diferent approaches adopted by a number o Member Stateswhen a building undergoes major renovation. Switzerland has adopted a very progressive approachto improving the perormance o existing buildings, where the thermal perormance o renovatedbuildings must not exceed 125% o the new building limit. A number o Member States have introducedminimum component perormance standards when building elements (e.g. windows, doors etc.) orenergy using plant (boilers, a/c equipment etc.) are being replaced. Good examples include countrieswhich have a perormance-based requirement as well as requirements or any component that isreplaced or reurbished.
7/29/2019 LR CbC Study
http://slidepdf.com/reader/full/lr-cbc-study 88/132
88 | Europe’s buildings under the microscope
Table 2B10 – Building code requirements or existing buildings
Source: BPIE survey
AT Specic maximum heating energy demand targets or major renovation o residential and non-residentialbuildings. Values or renovated buildings are around 25-38% higher than new build requirements. Heat recoverymust be added to ventilation systems when renewed. Maximum permitted U values or diferent elements in
case o single measure or major renovations. Prescriptive requirements to limit summer over-heating.BE Maximum U values and ventilation requirements apply depending on the region.
BG Regulations requiring perormance-based standards o existing housing and other buildings ater renovation.Requirements or new and renovated buildings are the same.
CH Renovated buildings are required to use no more than 125% o the space heating demand o an equivalentnew building. A single element approach may also be applicable or renovations.
CY Minimum energy perormance requirements (class A or B) or buildings over 1,000 m2 undergoing major renovation.
CZ Perormance-based requirements when a building over 1,000 m2 is renovated. Requirements or new andrenovated buildings are the same.
DE Conditional requirements apply in the case o renovation o components whereby requirements extend
exclusively to those parts o the building surace and parts o the installation that are the subject o themeasures. Alternatively, a holistic assessment can also be made where values or renovated buildings shouldnot exceed new build requirements by more than 40%.
DK Component level requirements when existing buildings are reurbished or all improvements or extensionsregardless o building size.
EE Perormance-based requirements or all building types when buildings are major renovated. Values orrenovated buildings are around 25-38% higher than new build requirements.
ES Existing buildings over 1,000 m2 must comply with the same minimum perormance requirements as newbuildings i more than 25% o the envelope is renovated.
FI Reerence transmittance/heat loss (in W/K) requirements apply. New energy perormance regulations will belaunched in 2012.
FR Perormance-based requirements or buildings undergoing renovation apply or residential buildings and valuesdepend on the climate and type o heating (ossil uel/electricity). Requirements or components also apply duringbuilding renovation. New renovation requirements or all buildings rom 2013.
HU Perormance-based requirements (in terms o primary energy) apply or residential buildings, oces andeducational buildings. Requirements or new and renovated buildings are the same.
LT Buildings over 1,000 m2 undergoing major renovation must achieve the energy perormance standard o aClass D building where D corresponds to 110 kWh/m2a or buildings > 3,000 m2; 130 kWh/m2a or buildingsrom 501 to 3,000 m2; 145 kWh/m2a or buildings up to 500 m2.
LV Requirements on diferent elements are applicable.
MT U value requirements or existing renovated buildings.
NL The Energy Perormance Standard (EPN) sets requirements or the energy perormance o major renovationso existing buildings (expressed as an energy perormance coecient).
NO Building regulation requirements only apply when the purpose or use o the building is changed at renovationor i considered so extensive as to be equivalent to a new building.
PT Special requirements or buildings over 1,000 m2 and over a specied threshold energy cost. A mandatoryenergy eciency plan must be prepared and all energy eciency improvement measures with a payback o less than 8 years must (by law) be implemented. The threshold is based upon 40% o the worst perormingbuildings by typology.
SI Minimum requirements apply to major renovations (i.e. i at least 25 % o the envelope is renovated). Therequirements apply to buildings o all size (NB the 1,000 m2 limit is not used). Min. requirements apply or therenovation o heating systems.
SK Requirements or improving the thermal perormance o apartment by at least 20% when being renovated.
UK Specic requirements when replacing “controlled elements” such as windows, boilers and thermal elements inresidential buildings. Consequential improvement requirements or buildings over 1,000 m2 undergoing majorrenovation in so ar as they are “technically, unctionally and economically easible”.
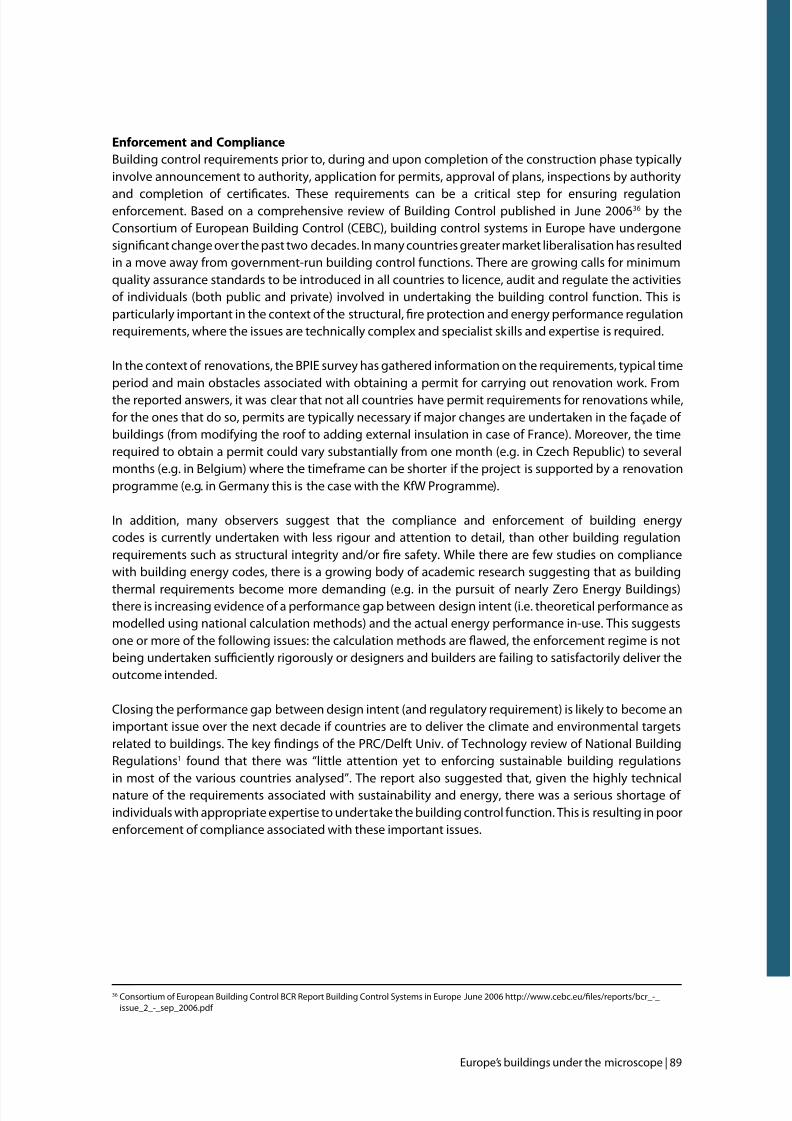
7/29/2019 LR CbC Study
http://slidepdf.com/reader/full/lr-cbc-study 89/132
Europe’s buildings under the microscope | 89
Enorcement and Compliance
Building control requirements prior to, during and upon completion o the construction phase typicallyinvolve announcement to authority, application or permits, approval o plans, inspections by authority
and completion o certicates. These requirements can be a critical step or ensuring regulationenorcement. Based on a comprehensive review o Building Control published in June 2006 36 by theConsortium o European Building Control (CEBC), building control systems in Europe have undergonesignicant change over the past two decades. In many countries greater market liberalisation has resultedin a move away rom government-run building control unctions. There are growing calls or minimumquality assurance standards to be introduced in all countries to licence, audit and regulate the activitieso individuals (both public and private) involved in undertaking the building control unction. This isparticularly important in the context o the structural, re protection and energy perormance regulationrequirements, where the issues are technically complex and specialist skills and expertise is required.
In the context o renovations, the BPIE survey has gathered inormation on the requirements, typical timeperiod and main obstacles associated with obtaining a permit or carrying out renovation work. Fromthe reported answers, it was clear that not all countries have permit requirements or renovations while,or the ones that do so, permits are typically necessary i major changes are undertaken in the açade o buildings (rom modiying the roo to adding external insulation in case o France). Moreover, the timerequired to obtain a permit could vary substantially rom one month (e.g. in Czech Republic) to severalmonths (e.g. in Belgium) where the timerame can be shorter i the project is supported by a renovationprogramme (e.g. in Germany this is the case with the KW Programme).
In addition, many observers suggest that the compliance and enorcement o building energycodes is currently undertaken with less rigour and attention to detail, than other building regulationrequirements such as structural integrity and/or re saety. While there are ew studies on compliancewith building energy codes, there is a growing body o academic research suggesting that as building
thermal requirements become more demanding (e.g. in the pursuit o nearly Zero Energy Buildings)there is increasing evidence o a perormance gap between design intent (i.e. theoretical perormance asmodelled using national calculation methods) and the actual energy perormance in-use. This suggestsone or more o the ollowing issues: the calculation methods are awed, the enorcement regime is notbeing undertaken suciently rigorously or designers and builders are ailing to satisactorily deliver theoutcome intended.
Closing the perormance gap between design intent (and regulatory requirement) is likely to become animportant issue over the next decade i countries are to deliver the climate and environmental targetsrelated to buildings. The key ndings o the PRC/Delt Univ. o Technology review o National BuildingRegulations1 ound that there was “little attention yet to enorcing sustainable building regulationsin most o the various countries analysed”. The report also suggested that, given the highly technicalnature o the requirements associated with sustainability and energy, there was a serious shortage o individuals with appropriate expertise to undertake the building control unction. This is resulting in poorenorcement o compliance associated with these important issues.
36 Consortium o European Building Control BCR Report Building Control Systems in Europe June 2006 http://www.cebc.eu/les/reports/bcr_-_issue_2_-_sep_2006.pd

7/29/2019 LR CbC Study
http://slidepdf.com/reader/full/lr-cbc-study 90/132
90 | Europe’s buildings under the microscope
c. finAnciAl progrAmmes
The regulatory ramework described in section 2B provides an increasingly demanding set o requirementsaimed at new buildings in particular, and to a lesser extent or improving the energy perormance o the existing stock. However, many potential areas o improvement to existing buildings remain outsideormal legislative or regulatory requirements. To address these shortcomings, a variety o nancialprogrammes have been introduced. Member States have used many nancial instruments in variousorms since the rst oil crisis in the 1970s. However, nancial issues are now more important as Europestrives towards increasing building energy perormance. This is highlighted by Article 10 in the recast o the EPBD on nancial incentives and market barriers. Article 10, paragraph 1 states:
“In view o the importance o providing appropriate nancing and other instruments to catalyse theenergy perormance o buildings and the transition to nearly zero- energy buildings, Member Statesshall take appropriate steps to consider the most relevant such instruments in the light o nationalcircumstances.”
The Article goes on to state that Member States were to have drawn up by June 30th a list o “existingand, i appropriate, proposed measures and instruments including those o a nancial nature, other thanthose required by this Directive, which promote the objectives o this Directive.” This list is to be updatedevery three years and the Commission is to “examine the efectiveness o the listed existing and proposedmeasures...”
As shown throughout this report, any ambitious retrot strategy will have to address nancing in a major way.
REvIEWOFCURRENTFINANCIALPROgRAMMES
In its survey or this study, BPIE requested inormation on the range o nancial instruments that are beingimplemented in Member States. For completeness, BPIE cross checked with inormation available in recentstudies and on-line databases (see below). Because o the wealth o material, BPIE will create a separatereport available or download on its website documenting all nancial instruments in Member States. Fiure2C1–Typesofnancialprorammesandincentiesontheeneryperformanceofbuildins

7/29/2019 LR CbC Study
http://slidepdf.com/reader/full/lr-cbc-study 91/132
Europe’s buildings under the microscope | 91
Financial programmes all into the main categories illustrated in Figure 2C1. For the most part, schemesare unded by public authorities. These could be at the national/ederal level, or regionally/locally. EUstructural unds and resources rom other EU and international sources are also available or renovation
works, particularly in the Central and East region countries. Many o these schemes are targeted atpoor quality apartment blocks constructed prior to 1990. By contrast, white certicate schemes placean obligation on third parties, typically energy companies, with the costs ultimately borne by energyconsumers through an increase in energy tarifs.
A summary o the nancial programmes currently operating in individual EU Member States, togetherwith Norway and Switzerland is provided in Table 2C1.37 This table shows how the wide range o nancial instruments is used throughout Europe. BPIE has identied 333 separate schemes. It can beseen that direct nancial support in the orm o grants or subsidies is prevalent throughout Europe.Many countries support residential as well as non-residential buildings, both new build and existing(though not necessarily in the same programme), while others ocus on renovating the existing buildingstock. A number only support residential buildings. There are also many schemes that target specictechnologies, such as insulation, boiler scrappage, renewables, or specic building categories, such associal housing, the public sector, panel buildings. There are several schemes that provide support ornew passive buildings.
Various orms o loans and tax incentives are used in many countries. These are usually available orindividuals as well as businesses, thereby covering most o the building stock outside the public sector.Somewhat less popular are energy supplier obligations/white certicate schemes, audits and thirdparty nancing, used in only a handul o countries, though the use o energy supplier obligations couldbecome mandatory across all EU Member States i the current proposal in the drat Energy EciencyDirective is approved.
In terms o programme size, whilst it is dicult to make direct comparisons due to diferent undingregimes and timescales, the nancial support varies considerably rom around €1M/a to in excess o €1bn/a. Larger programmes tend to be support or improvements to social housing stock. These havetraditionally been unded at large scale through nancial transers rom central governments to local/regional authorities or public housing bodies. While the original purpose o these schemes has beento meet basic housing requirements, unds are increasingly directed towards improving the energyperormance o social or public housing.
Programmes oten take 3-5 years, though individual initiatives can last anything rom one year to over adecade. This is a concern i a retrot strategy is to be or the long term. The Energy Audit Programme inFinland has operated since 1992, while energy suppliers in the UK have been under some orm o energy
saving target obligation since 1994. It is noteworthy that a number o schemes have been terminatedrecently as a result o the credit crunch and consequent measures to rein in public expenditure. Table2C2 summarises some o the identied programmes operating in diferent countries across Europeillustrating theirwide range and nature.
37 It should be added that there are two on-line databases that provide updated inormation on nancial instruments. The rst is MURE which is a
joint project under the Intelligent Energy or Europe Programme o the European Commission/DG Energy o all energy eciency agencies in theEU 27, Croatia and Norway. MURE is an inormation platorm on energy eciency policies in Europe. See http://www.mure2.com/. The second isthe International Energy Agency that has the Policies and Measures Databases ofer access to inormation on energy-related policies and measurestaken or planned to reduce GHG emissions, improve energy eciency and sup port renewable energy development and deployment. See http://www.iea.org/textbase/pm/index.html.
7/29/2019 LR CbC Study
http://slidepdf.com/reader/full/lr-cbc-study 92/132
92 | Europe’s buildings under the microscope
Table2C1–AsummaryofthecurrentnancialprorammesintheEU Source: BPIE survey
Grants, Subsidies,Funds
Loans Tax Incentives,Levies Etc
Obligations,white certicates
Audits 3rd Party nace,ESCOs
Other
AT All Households Existing bldgs
BE All Households &Business
Flanders region
BG Existing bldgs Residentialand Publicbldgs
Class A or Bnew build
CZ All Public bldgs Existingresidential bldgs
CY All
DK Existing bldgsES Residential Residential Residential
FI All Households Existingnon-residential
FR All All Households &Business
Existingbuildings
Privatesector
Feed-in tarif;training scheme
DE All Residential Public buildings Feed-in tarif
GR Existing bldgs Private sector
HU Existing bldgs Planned
IE Residential Business Imminent
IT Existing bldgs Existing bldgs Households &Business
All Yes Feed-in tarif
LT Existing bldgs householdrenewablegrants
LI All
LU All New homes
MT All
NL Residential New privatenon-residential
Private sector All
NO All All
PL Public sector Existing bldgs Planned
PT All All
RO Residential bldgs
SK Existing bldgs Existing bldgs
SL Private residentialand Public non-residential
Private homes Public residential
ES All All Households Public sector
SE All Households &Business
Technologyprocurement
CH All Households &Business
UK Existing bldgs Residential Households &Business
Residential Public sector Feed-in tarif
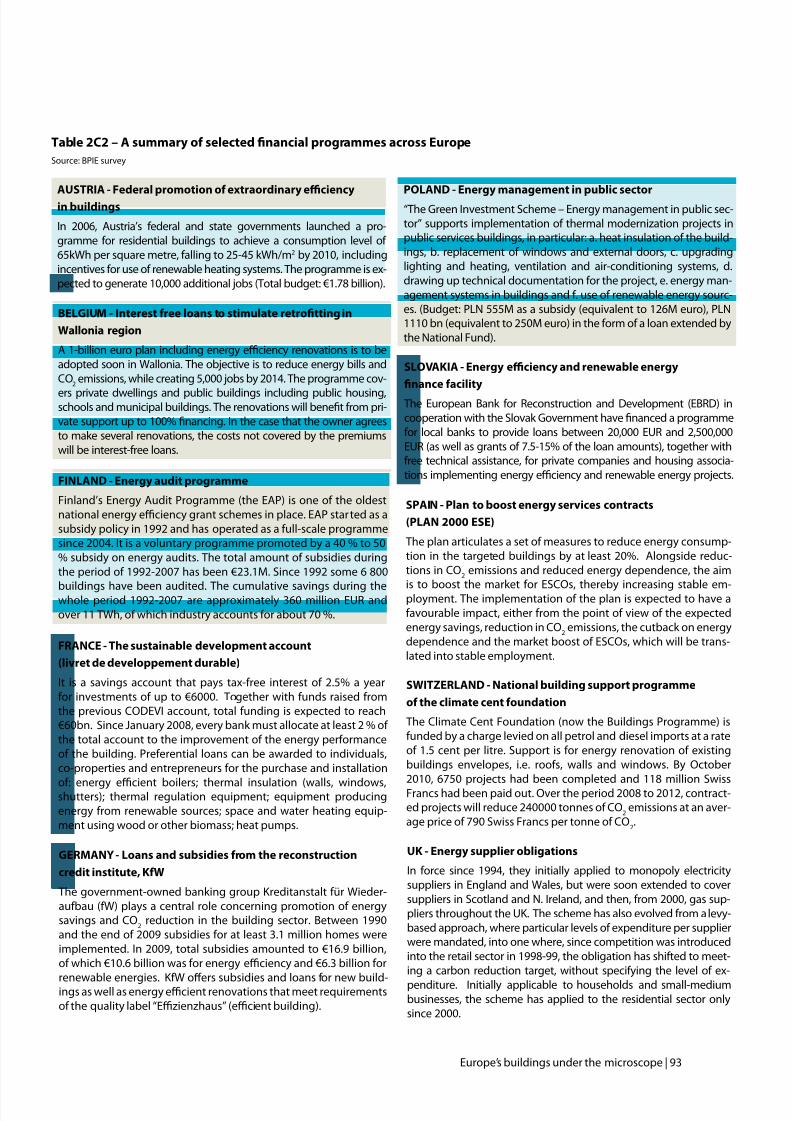
7/29/2019 LR CbC Study
http://slidepdf.com/reader/full/lr-cbc-study 93/132
Europe’s buildings under the microscope | 93
Table2C2–AsummaryofselectednancialprorammesacrossEuropeSource: BPIE survey
AUSTRIA - Federal promotion o extraordinary efciency
in buildings
In 2006, Austria’s ederal and state governments launched a pro-gramme or residential buildings to achieve a consumption level o 65kWh per square metre, alling to 25-45 kWh/m2 by 2010, includingincentives or use o renewable heating systems. The programme is ex-pected to generate 10,000 additional jobs (Total budget: €1.78 billion).
FRANCE - The sustainable development account
(livret de developpement durable)
It is a savings account that pays tax-ree interest o 2.5% a yearor investments o up to €6000. Together with unds raised romthe previous CODEVI account, total unding is expected to reach€60bn. Since January 2008, every bank must allocate at least 2 % o the total account to the improvement o the energy perormanceo the building. Preerential loans can be awarded to individuals,co-properties and entrepreneurs or the purchase and installation
o: energy ecient boilers; thermal insulation (walls, windows,shutters); thermal regulation equipment; equipment producingenergy rom renewable sources; space and water heating equip-ment using wood or other biomass; heat pumps.
SLOVAKIA - Energy efciency and renewable energy
nancefacility
The European Bank or Reconstruction and Development (EBRD) incooperation with the Slovak Government have nanced a programmeor local banks to provide loans between 20,000 EUR and 2,500,000EUR (as well as grants o 7.5-15% o the loan amounts), together withree technical assistance, or private companies and housing associa-tions implementing energy eciency and renewable energy projects.
BELgIUM-Interestfreeloanstostimulateretrottinin
Wallonia region
A 1-billion euro plan including energy eciency renovations is to beadopted soon in Wallonia. The objective is to reduce energy bills andCO
2emissions, while creating 5,000 jobs by 2014. The programme cov-
ers private dwellings and public buildings including public housing,schools and municipal buildings. The renovations will benet rom pri-vate support up to 100% nancing. In the case that the owner agreesto make several renovations, the costs not covered by the premiumswill be interest-ree loans.
POLAND - Energy management in public sector
“The Green Investment Scheme – Energy management in public sec-tor” supports implementation o thermal modernization projects inpublic services buildings, in particular: a. heat insulation o the build-ings, b. replacement o windows and external doors, c. upgradinglighting and heating, ventilation and air-conditioning systems, d.drawing up technical documentation or the project, e. energy man-agement systems in buildings and . use o renewable energy sourc-es. (Budget: PLN 555M as a subsidy (equivalent to 126M euro), PLN1110 bn (equivalent to 250M euro) in the orm o a loan extended bythe National Fund).
SWITZERLAND - National building support programme
o the climate cent oundation
The Climate Cent Foundation (now the Buildings Programme) isunded by a charge levied on all petrol and diesel imports at a rateo 1.5 cent per litre. Support is or energy renovation o existingbuildings envelopes, i.e. roos, walls and windows. By October2010, 6750 projects had been completed and 118 million SwissFrancs had been paid out. Over the period 2008 to 2012, contract-ed projects will reduce 240000 tonnes o CO
2emissions at an aver-
age price o 790 Swiss Francs per tonne o CO2.
SPAIN - Plan to boost energy services contracts
(PLAN 2000 ESE)
The plan articulates a set o measures to reduce energy consump-tion in the targeted buildings by at least 20%. Alongside reduc-tions in CO
2emissions and reduced energy dependence, the aim
is to boost the market or ESCOs, thereby increasing stable em-ployment. The implementation o the plan is expected to have aavourable impact, either rom the point o view o the expectedenergy savings, reduction in CO
2emissions, the cutback on energy
dependence and the market boost o ESCOs, which will be trans-lated into stable employment.
UK - Energy supplier obligations
In orce since 1994, they initially applied to monopoly electricitysuppliers in England and Wales, but were soon extended to coversuppliers in Scotland and N. Ireland, and then, rom 2000, gas sup-pliers throughout the UK. The scheme has also evolved rom a levy-based approach, where particular levels o expenditure per supplierwere mandated, into one where, since competition was introducedinto the retail sector in 1998-99, the obligation has shited to meet-ing a carbon reduction target, without speciying the level o ex-
penditure. Initially applicable to households and small-mediumbusinesses, the scheme has applied to the residential sector onlysince 2000.
gERMANY-Loansandsubsidiesfromthereconstruction
credit institute, KW
The government-owned banking group Kreditanstalt ür Wieder-aubau (W) plays a central role concerning promotion o energysavings and CO
2reduction in the building sector. Between 1990
and the end o 2009 subsidies or at least 3.1 million homes wereimplemented. In 2009, total subsidies amounted to €16.9 billion,o which €10.6 billion was or energy eciency and €6.3 billion or
renewable energies. KW ofers subsidies and loans or new build-ings as well as energy ecient renovations that meet requirementso the quality label “Ezienzhaus” (ecient building).
FINLAND - Energy audit programme
Finland’s Energy Audit Programme (the EAP) is one o the oldestnational energy eciency grant schemes in place. EAP started as asubsidy policy in 1992 and has operated as a ull-scale programmesince 2004. It is a voluntary programme promoted by a 40 % to 50% subsidy on energy audits. The total amount o subsidies duringthe period o 1992-2007 has been €23.1M. Since 1992 some 6 800
buildings have been audited. The cumulative savings during thewhole period 1992-2007 are approximately 360 million EUR andover 11 TWh, o which industry accounts or about 70 %.
7/29/2019 LR CbC Study
http://slidepdf.com/reader/full/lr-cbc-study 94/132
94 | Europe’s buildings under the microscope
IMPACTOFFINANCIALPROgRAMMES
The key concern is the level o ambition that can be attained rom nancial programmes to motivateconsumers to invest in deep renovation. Some o the schemes identied with the most ambitious objectivesin terms o potential energy savings achieved were:
1. In Austria, under the ‘Federal Promotion o Very High Eciency Buildings’, an initial standard o 65 kWh/m2 in 2007, going to 25 kWh/m2 in 2010 was required in order to qualiy or state unding.
2. In the Flemish region o Belgium, under the energy savings investments in dwellings rented by social rentingcompanies, 100% o the costs are reimbursed or roo insulation, high eciency windows and condensingboilers.
3. The Czech Republic’s PANEL programme provides or total retrotting (insulating buildings, improvingheating systems, distribution pipes and sources o heat and hot water and use o renewable energy).
4. In Estonia, the Green Investment Scheme requires at least 20% energy savings. The Renovation Loan orapartment buildings also requires at least 20% energy savings.
5. In France subsidies are available or low consumption buildings and retrots (AAP PREBAT).
6. In Germany, in its ‘Housing Modernisation Scheme’, investors receive a long-term low-interest loan o upto €100,000 with a xed interest rate or 5 to 10 years and redemption-ree grace years. While there is notarget, the amount available should lead to very ambitious improvements.
7. In Romania, the ‘Multiannual National Programme’ or increasing the energy perormance o apartmentblocks/houses requires a decrease in energy consumption rom 180-240 kWh/m2 to below 100 kWh/m2.
8. In Spain, the ‘Support or Energy Eciency in Buildings’, encourages buildings to attain a high energy ratingo A or B. Separately, PLAN 2000 ESE, which promotes energy service contracts, requires energy savings o at least 20%. The Activation Plan, using ESCOs, also requires a reduction o 20% or state buildings.
The results o the selected measures described above are encouraging, but many o them are only modest in theirambition. Achieving a 20% reduction may sound impressive, but much more is needed and possible.A studypublished by EuroACE in 2010 illustrated the cost efectiveness38 o such programmes to governments which hasbeen estimated to be around €20-25/tonne o mitigated carbon emissions, a gure which is lower than virtuallyall alternative non-traded carbon abatement measures. However, being cost efective does not reect the levelo ambition. The schemes identied above show a reasonable level o ambition to save energy but a 20% energysavings is not enough i Europe is to achieve an 80-95 % reduction in GHG emissions reductions by 2050.
One major concern is that the use o nancial instruments today is only achieving the business-as-usualcase in Europe with very ew nancial instruments providing enough unding or deep renovations. I thegoal is to signicantly increase the number o deep renovations to meet 2050 aspirations, it will require
more innovative approaches than what is seen today. There are steps underway to improve the availabilityo new nancing instruments. Innovative approaches include Energy Supplier Obligations, energy servicecompanies, the use o EU structural unds more efectively and possible targets to renovate specic buildingsub-sectors (e.g. the proposal in the drat Energy Eciency Directive to Member States to renovate a certainpercentage o public buildings annually) which will require Member States to “unlock” unding or suchrenovations.
The recast o the EPBD requires Member States to outline the current and proposed nancial instrumentsor the buildings sector. Most Member States are doing this through their submission o National EnergyEciency Action Plans due June 2011.39 That provides an opportunity or Member States to reect on hownancial instruments can be used more ambitiously and an opportunity or the European Commission tomonitor whether Member States are taking ambitious enough steps.
38 Klinckenberg Consultants, Making Money Work or Buildings, Financial and Fiscal Instruments or Energy Eciency in Buildings, EuroACE, September2010. Cost-efectiveness was calculated on the basis o the cost o the programme (typically to government) per ton o CO
2emission avoided,
over an impact period o up to 30 years (and shorter or investments with a shorter liespan) For more inormation, go to: http://www.euroace.org/MediaPublications/PublicationsReports.aspx
39 Updates o the national submissions are available at: http://ec.europa.eu/energy/eciency/end-use_en.htm. As o August 26, 19 Member Stateshad submitted their plans.
7/29/2019 LR CbC Study
http://slidepdf.com/reader/full/lr-cbc-study 95/132
Europe’s buildings under the microscope | 95
d. other progrAmmes
The BPIE 2011 survey did not directly survey other policy instruments beyond the regulatory buildingcodes and nancial programmes. Primarily, the measures concern various aspects o inormation:awareness programmes, training, specialised publications, networks and inormation exchange. Thereare also research and development programmes at both the national, EU and international levels.
ia
Appropriate inormation to consumers, decision makers, the energy service sector, architects, distributorsand others in the energy eciency eld ensures that more o the cost-efective potential is achieved.There is a wide range o inormation programmes throughout the region and the number o programmeshas expanded signicantly in recent years. Inormation programmes cover a large spectrum rom massmedia campaigns, inormation centres, training, technical manuals and brochures, labelling and energyaudits. They can be used or awareness creation or or providing detailed inormation to various actors:consumers, equipment operators/technicians, managers o building complexes, engineers, architectsand decision makers.
Awareness creation is oten considered key because many consumers have little understanding o the cost-efective potential or improvements or energy eciency or o the techniques to make suchimprovements. Awareness creation is also important or service providers (e.g. auditors) to show themarket potential available. All Member States are active in awareness creation.
One rather recent addition to help in inormation sharing is the European portal or energy eciencyin buildings, BUILD UP (www.buildup.eu) unded by the European Commission. It is or buildingsproessionals, local authorities and citizens. The BUILD UP web portal brings together new practitionersand proessional associations while motivating them to exchange best working practices and knowledge
and to transer tools and resources.
ta
When rst introduced in 2002 the EPBD recognised that new approaches to buildings perormance weregoing to be needed. The recast o the EPBD, approved in 2010, increased the need or new approachesthat would require improving the capacity o a wide range o people. For new buildings, architects anddesigners would need to learn to integrate latest thinking to maximise perormance. This is particularlytrue or the nearly Zero Energy Buildings that will be required by December 31, 2018 or public buildingsand December 31, 2020 or all buildings – residential and non-residential. Strategies need to be developedby Member States and these have to be submitted to the Commission in early 2012.
The recast Directive makes several reerences to the importance o training. Furthermore, the EnergyEciency Plan published by the Commission in March 2011 states:
There is a clear lack o appropriate training (e.g. or architects, engineers, auditors, cratsmen, techniciansand installers). Energy ecient building solutions are oten technically demanding and put highknowledge requirements on the parties involved. Today, about 1.1 million qualied workers are available,while 2.5 million will be needed by 2015 in order to improve the energy eciency o buildings andbetter integrate renewable energy technologies. The lack o a qualied workorce leads to sub-optimalrenovation or installation o appliances – hence it is essential that the right skills are available; majortraining and qualication eforts will be required.
The European Commission, through its Intelligent Energy Europe programme, is providing support ortraining programmes.
7/29/2019 LR CbC Study
http://slidepdf.com/reader/full/lr-cbc-study 96/132
96 | Europe’s buildings under the microscope
r&d
The European Union supports R&D through Framework Programme 7. This includes unding or energyecient buildings. Currently, much o the ocus is on public-private partnerships or energy-ecientbuildings and the demonstration o zero carbon building renovations or cities and regions.
The European Commission and many Member States also participate in technology programmeso the International Energy Agency, based in Paris. Participation is through the use o ImplementingAgreements o the IEA that allow participating countries to share research eforts. For buildings there areseparate implementing agreements on buildings and community systems, district heating and cooling,energy storage, heat pumping technologies and ecient electrical end-use equipment. The IEA recentlypublished a report outlining the efectiveness o their implementing agreements and the strategies orthe uture.40 EU countries are very active. For example, or the agreement on buildings and communitysystems, 15 Member States participate as well as Norway and Switzerland. Many o these implementingagreements have been operating since the 1980s.
40 IEA, Energy Technology Initiatives, Implementation Through Multi-lateral Co-operation, IEA/OECD, 2010.
For more inormation on the b uildings-related implementing agreements go to http://www.iea.org/techno/technologies/enduse.asp.

7/29/2019 LR CbC Study
http://slidepdf.com/reader/full/lr-cbc-study 97/132
Europe’s buildings under the microscope | 97

7/29/2019 LR CbC Study
http://slidepdf.com/reader/full/lr-cbc-study 98/132
98 | Europe’s buildings under the microscope
pArt 3rEnovAting with purposE –Finding A roAdmAptowArds 2050
“Designing a roadmap for the systematic renovation of the European building stock is not only key to reach theEuropean climate targets, but would also leverage urgentlyneeded economic and social benets.”
7/29/2019 LR CbC Study
http://slidepdf.com/reader/full/lr-cbc-study 99/132
Europe’s buildings under the microscope | 99
The previous chapters so ar have given a detailed overview o the buildings sector, rom the physicalqualities o the sector to the policies that are driving improvements in energy savings. Our assessmentreveals a very heterogeneous European building stock and varied and unbalanced policies which are not
properly addressing the cost-efective potential. Consequently, the energy perormance o the Europeanbuilding stock should be signicantly improved in order to realise the ambitious targets or improvingenergy eciency by 2020 and the even more ambitious targets or GHG emissions reductions by 2050.
However the energy savings targets are not binding and this afects the efectiveness o the implementingmeasures. Recent policy pronouncements rom the EU show that Europe is not going to achieve the2020 energy savings target without new policies and without better implementation o current policies.One o the major weaknesses o the 2010 recast o the Energy Perormance in Buildings Directive hasbeen on existing buildings. While a cost-optimality calculation is being developed and while there is adenition or major renovations, there are no efective instruments to drive the market to increase therate o renovation (or more energy savings) and to increase the rate o “deep” renovations.
One o the aims o this report is to identiy the measures, policies, actions and solutions to barriers thatneed to be taken in order to put Europe onto a path that can achieve the complete renovation o theexisting building stock by 2050. The Commission’s analysis rom the low carbon road map shows thatemissions in the building sector must be reduced by as much as 90% by 2050 i the climate changegoals are to be met. As this report argues, the most efective way o achieving that target is througha combination o cutting energy demand in buildings through increased energy eciency and widerdeployment o renewable technologies on and in buildings together with decarbonising energy supplies.Reducing energy consumption has another particular importance in improving security o supply andreducing import dependency. The EU 27 dependency on energy imports increased rom less than 40% o gross energy consumption in the 1980s to 54.8% by 2008, with the highest dependency rates or crudeoil (84.2%) and or natural gas (62.3%)41.
In order to dene the necessary efort or ostering the improvement o the actual building stock andto reach the overall aims o energy and emissions reduction, BPIE has developed a number o possiblescenarios or the renovation o the EU building stock by 2050, including a “business-as-usual” case,assuming that the current rate and ambition o renovation continues. The other scenarios give plausibleand easible options or signicantly ramping up renovation activity, depending in large part on thepolicy ramework that can be developed. Ater giving an overview o the model, this section will describeand compare the scenarios and provide some conclusions on the uture way orward or Europe.
41 Eurostat: http://epp.eurostat.ec.europa.eu/statistics_explained/index.php/Energy_production_and_imports
7/29/2019 LR CbC Study
http://slidepdf.com/reader/full/lr-cbc-study 100/132
100 | Europe’s buildings under the microscope
A. economic perspectives
It is generally recognised that energy eciency is the cheapest way o reducing carbon emissions. The
EPBD Impact Assessment42 concluded that the potential or cost-efective energy savings in the EUbuilding stock is about 30% in the period to 2020. Opportunities to improve the energy perormance o buildings include:
• Improvingthethermalperformanceofthebuildingfabricthroughinsulationofwalls,oorsandroofs,
and replacement and tightening o windows and doors.
• Improving the energy performance of heating, ventilation, air conditioning (HVAC) and lighting
systems.
• Installationofrenewabletechnologiessuchasphotovoltaicpanels,solarthermalcollectors,biomass
boilers, or heat pumps.
• Installationofbuildingelementstomanagesolarheatgains.
Each individual improvement measure has a cost and a saving associated with it that are specic to aparticular building, as well as ancillary benets:
• Costscanvarydependingonwhethermeasuresareinstalledindividuallyoras apackage,andalso
whether improvements are being undertaken at the same time as maintenance, repair or buildingupgrade/modernisation. For example, i HVAC equipment is at the end o its useul lie, the cost o theenergy ecient option would be the marginal extra cost over a standard eciency replacement.
• Savingswilldependonthepreviouslevelofenergyconsumption,energysourcesused,thepriceof
energy, the lietime o the measure and also uture movements in energy prices. Some o the savingsmay be ofset mainly when energy eciency measures address uel poverty, but overall this reboundefect may be partially compensated by other above mentioned actors (e.g. by the increase o energyprices or even by behavioural measures).
• New windows and ecient HVAC systems are known to increase the value ofa property. The
value o high levels o insulation and buildings integrated renewable technologies have yet to beully appreciated by consumers, though this will change over time as the benets o low energyconsumption, a good energy rating (A-B) and a low carbon ootprint become more recognised andaccepted across society.
• Additionaluserbenetsincludelowernoiselevelsandimprovedcomfortfrominsulationandglazing,
better indoor air quality and temperature control rom new HVAC equipment, less operationalmaintenance or increased energy security and protection against price uctuations throughdeployment o renewable energy resources that are not dependent on conventional distribution
systems.• SocietalbenetsrangefromreducedGHGemissions,improvedenergysecurityandalleviationoffuel
poverty.
• Socio-economic benets through development of new green businesses and employment
opportunities.
While the ancillary benets are o real value and can oten be the main actor in determining whether aparticular investment is made (or example to increase comort or reduce draughts), the case or investingin improved energy perormance is oten made purely on economic grounds. This is unlike the caseor other comparable investments in a property. For example, in a residential context, consumers willoten spend large sums o money on renovating kitchens and bathrooms or aesthetic reasons, without
undertaking a cost-benet analysis.
42 Impact assessment, accompanying document to the proposal or a recast o the energy perormance o buildings directive (2002/91/ec), 2008.http://ec.europa.eu/energy/strategies/2008/doc/2008_11_ser2/buildings_impact_assesment.pd
7/29/2019 LR CbC Study
http://slidepdf.com/reader/full/lr-cbc-study 101/132
Europe’s buildings under the microscope | 101
Even when viewed purely in economic terms, investments in energy saving typically need to meet ahigher hurdle rate than other investments. For example, an energy saving measure costing €10,000 thatsaves €2,000 each year has a simple payback o 5 years. Many consumers or businesses would be reluctant
to make this kind o investment seeing it as not being suciently attractive. Yet i the lie o the measureis as little as ten years, the investment would generate an internal rate o return (IRR) o 15%, assumingno change in energy prices (with a measure lie o over 20 years, the IRR is nearly 20%). This is a highlyattractive return on investment and such an energy saving project is clearly protable.
Notwithstanding the above, the case or a renovation roadmap argued within this report is made largelyon its economic merits.
There are 25 billion m2 o buildings in the EU27 together with Switzerland and Norway ranging romhomes, oces and retail premises to hospitals and leisure centres. As highlighted in Part 1 o this report,this building stock exhibits a multiplicity o diferent shapes, sizes, styles, ages, uels used, occupancy andlocation. Each o these actors has an impact on the energy and cost savings achievable.
An added dimension to the issue o building renovation is the decision-making process. Each buildinghas an owner and an occupier – in some cases this will be the same person or organisation, while inothers they will be diferent. Indeed, large and complex commercial buildings are oten characterised bymultiple levels o ownership. Decisions on whether to renovate a building could be taken by either theowner or the occupier, or indeed jointly, making it dicult to identiy the responsible party. Likewise, thecosts will be afected i multiple parties are involved in the process. This is a classical barrier or decidingon the renovation o a building, also known in literature as the tenant-landlord dilemma (or the so calledsplit incentive barrier).
It is clear rom the above that there is a very wide range o possible costs and savings or an almost
endless permutation o improvement measures across the European building stock. In some cases, animprovement might be the result o a single measure like an upgrade o the HVAC equipment, while inothers it could comprise a holistic solution to an entire complex o buildings, with a package o measures.In order to rationalise these variables, it is necessary to develop a standard metric or determining andreporting the costs o measures. The simplest approach is to relate the total cost o a renovation (whetherit be or a single measure or an entire building) to the building oor area, i.e. €/m2.
To date, there has been no systematic attempt to garner comprehensive data on energy saving renovationcosts at European level. Moreover, the renovation costs vary greatly among EU regions and countries,being inuenced by many actors such as market development, prices o materials, nancing cost,labour market costs and the existence o specic support programmes and policies. While the dicultyo collating such data is recognised, this is a major shortcoming that needs to be addressed, given theimportance o energy savings measures in the existing building stock to the EU’s climate and energysecurity targets.
That said, a number o national or regional studies have quantied the costs o achieving diferent levelso energy perormance improvement across a range o building types. Most typically, these relate toresidential properties, or which the improvements can more readily be analysed and indeed replicatedover a number o similar dwellings.
In what is perhaps the most comprehensive analysis o renovation measures or residential properties,ARGE43 calculated the costs and savings or achieving six diferent levels o energy perormance acrossthree typical German dwelling types, assuming three starting positions – modernised, part-modernised
43 http://www.bdb-bh.de/bdb/downloads/ARGE_Kiel_-_Wohnungsbau_in_Deutschland_2011.pd
7/29/2019 LR CbC Study
http://slidepdf.com/reader/full/lr-cbc-study 102/132
102 | Europe’s buildings under the microscope
and un-modernised. Compared to the original energy consumption, energy savings varied rom around20% to over 90% or the highest level o perormance, with corresponding costs in the range €100-800/m2. Another study44 based on Hungarian buildings derived much lower costs or a similar range o
savings: rom €50/m2
to €300/m2
.
These gures should also be seen in the context o current and evolving practice in renovation acrossEurope. While there is a great deal o experience on implementing single measures (e.g. window/boilerreplacement, or insulation o walls/roos), the experience o holistic “whole building” solutions is muchmore limited. Achievement o very high levels o energy saving, such that the building approachesnearly zero energy levels, requires deployment o buildings-integrated renewable technologies, andvarious energy eciency measures which have a high cost improvement potential. This suggests thatthe cost o achieving high levels o energy saving will come down more rapidly over time than or themore established measures which deliver more modest savings. It is also important to note that diferentnational priorities will dictate to a signicant extent the costs o diferent types o renovation.
For example, a programme ofering incentives or particular technologies would typically help to stimulatedemand and over time, reduce the cost o the technology compared to another country without theprogramme or with a diferent energy price structure. In addition, long term renovation programmesgenerate consistent benets in both construction and supply chain industries, with a signicant jobcreation potential and a constant improvement o workers’ qualication and skills.
Renovation databases have been established in the UK 45 and France46. At present, these hold limitedamounts o data, but provide a good example o the kind o knowledge base that needs to be built up inorder to provide a more complete picture o the range o renovation activities, including building types,costs, savings and lessons learnt.
These studies and data sources, together with inormation provided by experts located in 29 countriesacross Europe and an extensive literature search, have provided the rst attempt to quantiy renovationinvestment costs at European level. Ater allowing or diferences in costs between higher cost and lowercost countries47, average costs or diferent levels o renovation have been derived in Table 3C1.
def ea ee a aae
The term “renovation”48 has been used by diferent commentators to describe a wide variety o improvements to an existing building or group o buildings. In the context o this report, “renovation” istaken to mean an upgrade to the energy perormance, unless otherwise specied.
Qualitatively, it can be seen that a renovation to a building acade (i.e. walls and windows) will provide adiferent level o energy saving than one addressing all o the building envelope and its energy systems(HVAC, lighting etc.) as well as the installation o renewable technologies. There is thereore a need tocategorise diferent levels o renovation.
At its most basic, the energy perormance o a building can be improved by the implementation o asingle measure, such as a new boiler plant or the insulation o the roo space. Normally, these typeso measures might be termed “energy eciency retrot”, though or the purposes o this report, theterm “minor renovation” is proposed. Typically, energy savings o up to 30% might be expected by theapplication o one to three low cost/easy to implement measures.
44 “Employment Impacts o a Large-Scale Deep Building E nergy Renovate Programme in Hungary” - Ürge-Vorsatz et al, Central European University
45 http://www.rethinkingreurbishment.com/portal/46 http://www.energie.org/site/Energie/70-ProjetsRealisations47 Eurostat purchasing power data were used to normalise costs48 “Retrot” and “reurbishment” are oten also used to describe essentially the same process.
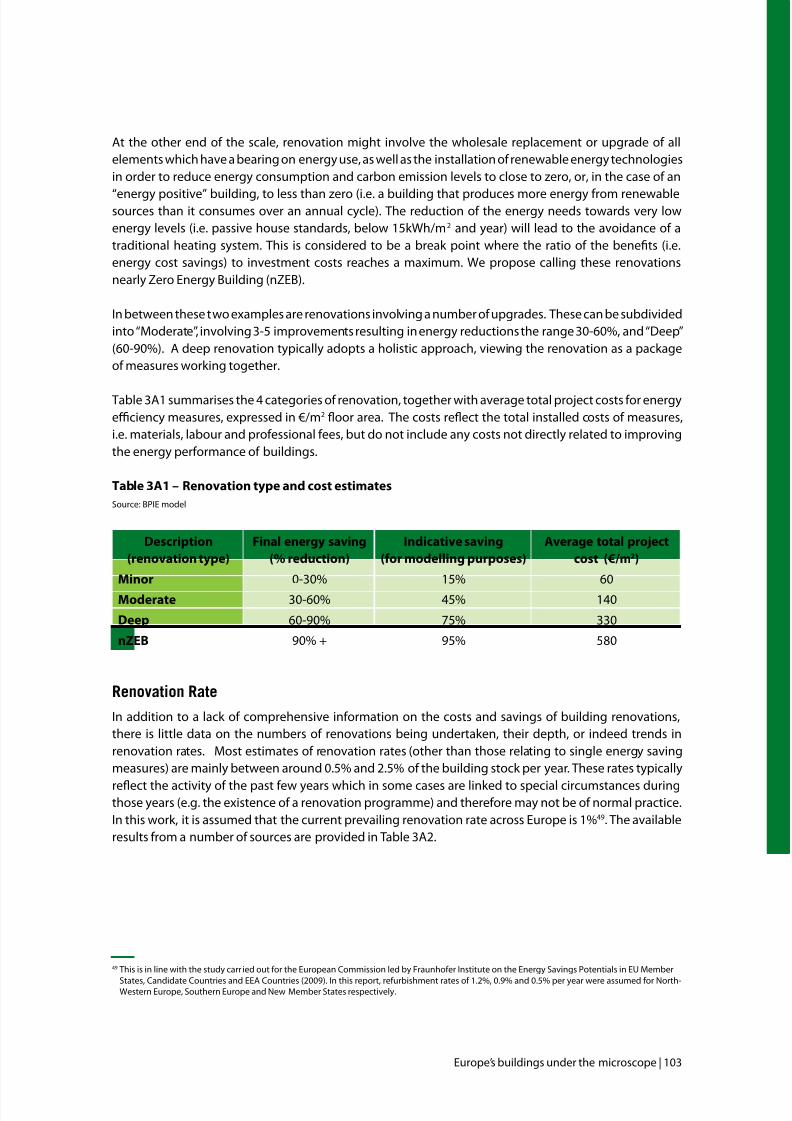
7/29/2019 LR CbC Study
http://slidepdf.com/reader/full/lr-cbc-study 103/132
Europe’s buildings under the microscope | 103
At the other end o the scale, renovation might involve the wholesale replacement or upgrade o allelements which have a bearing on energy use, as well as the installation o renewable energy technologiesin order to reduce energy consumption and carbon emission levels to close to zero, or, in the case o an
“energy positive” building, to less than zero (i.e. a building that produces more energy rom renewablesources than it consumes over an annual cycle). The reduction o the energy needs towards very lowenergy levels (i.e. passive house standards, below 15kWh/m2 and year) will lead to the avoidance o atraditional heating system. This is considered to be a break point where the ratio o the benets (i.e.energy cost savings) to investment costs reaches a maximum. We propose calling these renovationsnearly Zero Energy Building (nZEB).
In between these two examples are renovations involving a number o upgrades. These can be subdividedinto “Moderate”, involving 3-5 improvements resulting in energy reductions the range 30-60%, and “Deep”(60-90%). A deep renovation typically adopts a holistic approach, viewing the renovation as a packageo measures working together.
Table 3A1 summarises the 4 categories o renovation, together with average total project costs or energyeciency measures, expressed in €/m2 oor area. The costs reect the total installed costs o measures,i.e. materials, labour and proessional ees, but do not include any costs not directly related to improvingthe energy perormance o buildings.
Table 3A1 – Renovation type and cost estimates
Source: BPIE model
Description
(renovation type)
Final energy saving
(% reduction)
Indicative saving
(or modelling purposes)
Average total project
cost(€/m2)
Minor 0-30% 15% 60
Moderate 30-60% 45% 140
Deep 60-90% 75% 330
nZEB 90% + 95% 580
rea rae
In addition to a lack o comprehensive inormation on the costs and savings o building renovations,there is little data on the numbers o renovations being undertaken, their depth, or indeed trends inrenovation rates. Most estimates o renovation rates (other than those relating to single energy savingmeasures) are mainly between around 0.5% and 2.5% o the building stock per year. These rates typically
reect the activity o the past ew years which in some cases are linked to special circumstances duringthose years (e.g. the existence o a renovation programme) and thereore may not be o normal practice.In this work, it is assumed that the current prevailing renovation rate across Europe is 1%49. The availableresults rom a number o sources are provided in Table 3A2.
49 This is in line with the study carr ied out or the European Commission led by Fraunhoer Institute on the Energy Savings Potentials in EU Member
States, Candidate Countries and EEA Countries (2009). In this report, reurbishment rates o 1.2%, 0.9% and 0.5% per year were assumed or North-Western Europe, Southern Europe and New Member States respectively.
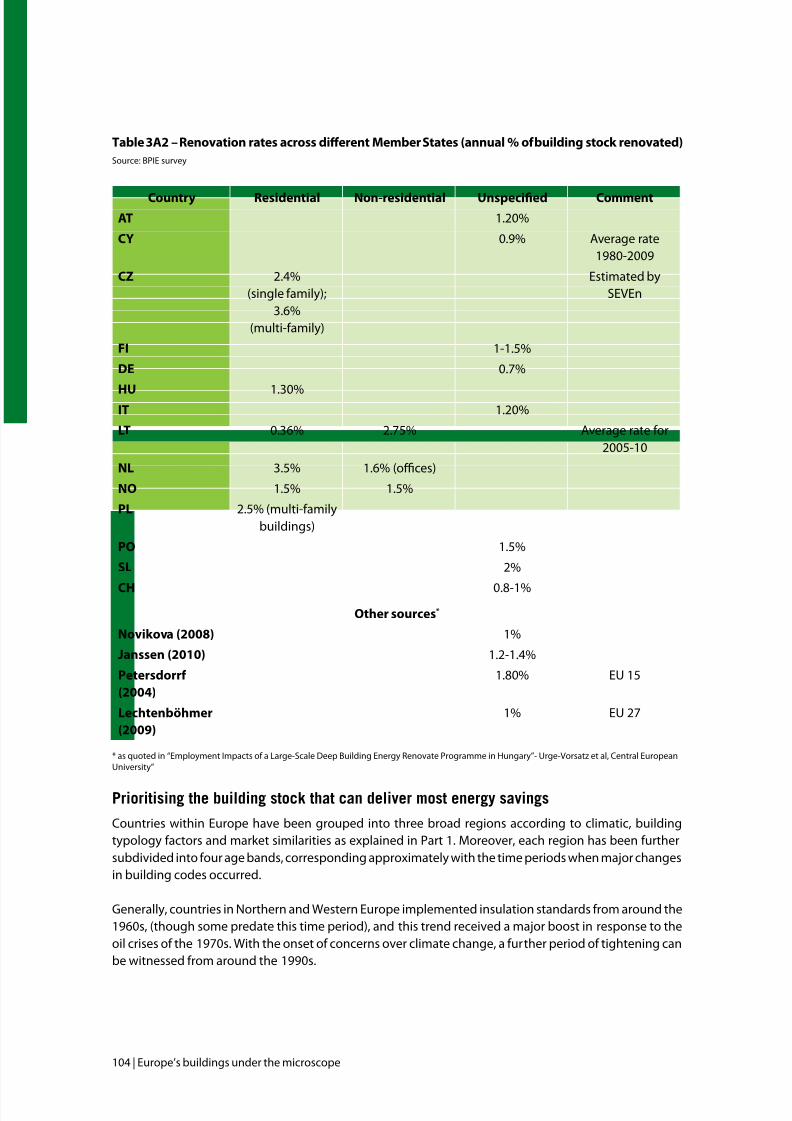
7/29/2019 LR CbC Study
http://slidepdf.com/reader/full/lr-cbc-study 104/132
104 | Europe’s buildings under the microscope
Table3A2–RenoationratesacrossdierentMemberStates(annual%ofbuildinstockrenoated)Source: BPIE survey
Country Residential Non-residential Unspecied Comment
AT 1.20%
CY 0.9% Average rate1980-2009
CZ 2.4%(single amily);
3.6%(multi-amily)
Estimated bySEVEn
FI 1-1.5%
DE 0.7%
HU 1.30%IT 1.20%
LT 0.36% 2.75% Average rate or2005-10
NL 3.5% 1.6% (oces)
NO 1.5% 1.5%
PL 2.5% (multi-amilybuildings)
PO 1.5%
SL 2%
CH 0.8-1%Other sources*
Novikova (2008) 1%
Janssen (2010) 1.2-1.4%
Petersdorr
(2004)
1.80% EU 15
Lechtenböhmer
(2009)
1% EU 27
p e a a ee ee a
Countries within Europe have been grouped into three broad regions according to climatic, buildingtypology actors and market similarities as explained in Part 1. Moreover, each region has been urthersubdivided into our age bands, corresponding approximately with the time periods when major changesin building codes occurred.
Generally, countries in Northern and Western Europe implemented insulation standards rom around the1960s, (though some predate this time period), and this trend received a major boost in response to theoil crises o the 1970s. With the onset o concerns over climate change, a urther period o tightening canbe witnessed rom around the 1990s.
* as quoted in “Employment Impacts o a Large-Scale Deep Building Energy Renovate Programme in Hungary”- Urge-Vorsatz et al, Central EuropeanUniversity”
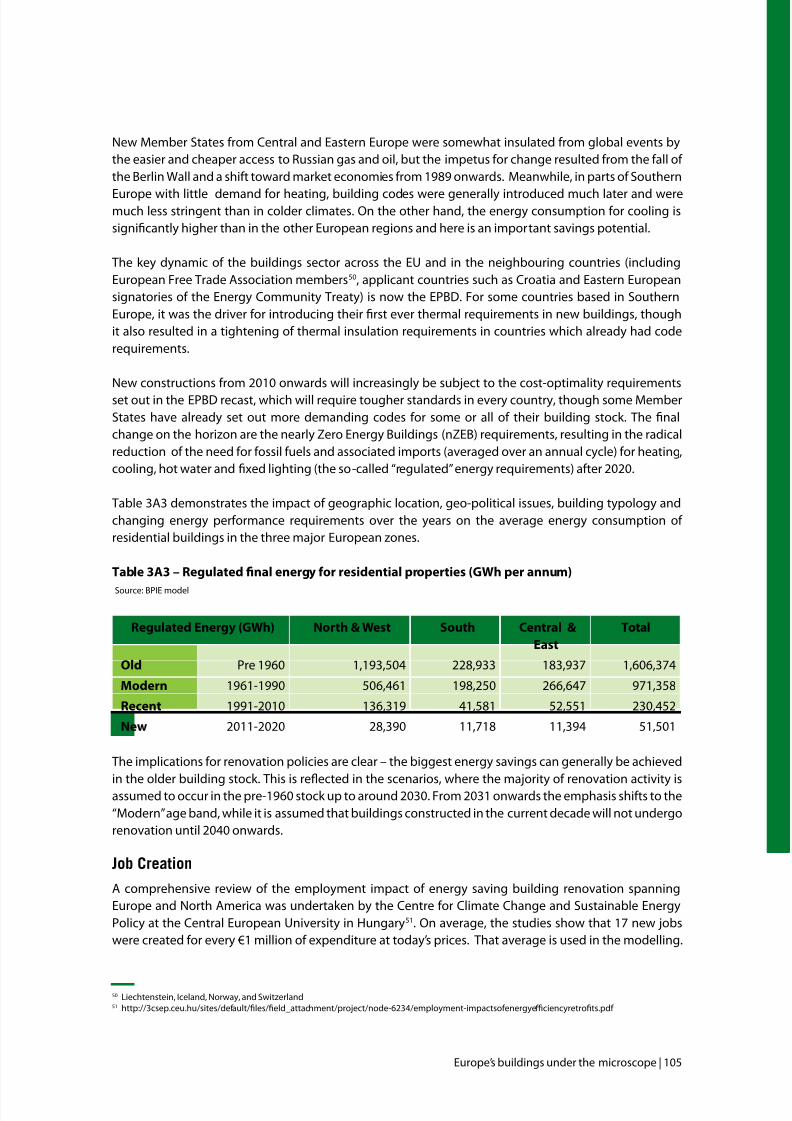
7/29/2019 LR CbC Study
http://slidepdf.com/reader/full/lr-cbc-study 105/132
Europe’s buildings under the microscope | 105
New Member States rom Central and Eastern Europe were somewhat insulated rom global events bythe easier and cheaper access to Russian gas and oil, but the impetus or change resulted rom the all o the Berlin Wall and a shit toward market economies rom 1989 onwards. Meanwhile, in parts o Southern
Europe with little demand or heating, building codes were generally introduced much later and weremuch less stringent than in colder climates. On the other hand, the energy consumption or cooling issignicantly higher than in the other European regions and here is an important savings potential.
The key dynamic o the buildings sector across the EU and in the neighbouring countries (includingEuropean Free Trade Association members50, applicant countries such as Croatia and Eastern Europeansignatories o the Energy Community Treaty) is now the EPBD. For some countries based in SouthernEurope, it was the driver or introducing their rst ever thermal requirements in new buildings, thoughit also resulted in a tightening o thermal insulation requirements in countries which already had coderequirements.
New constructions rom 2010 onwards will increasingly be subject to the cost-optimality requirementsset out in the EPBD recast, which will require tougher standards in every country, though some MemberStates have already set out more demanding codes or some or all o their building stock. The nalchange on the horizon are the nearly Zero Energy Buildings (nZEB) requirements, resulting in the radicalreduction o the need or ossil uels and associated imports (averaged over an annual cycle) or heating,cooling, hot water and xed lighting (the so-called “regulated” energy requirements) ater 2020.
Table 3A3 demonstrates the impact o geographic location, geo-political issues, building typology andchanging energy perormance requirements over the years on the average energy consumption o residential buildings in the three major European zones.
Table3A3–Reulatednaleneryforresidentialproperties(gWhperannum)
Source: BPIE model
Regulated Energy (GWh) North & West South Central &
East
Total
Old Pre 1960 1,193,504 228,933 183,937 1,606,374
Modern 1961-1990 506,461 198,250 266,647 971,358
Recent 1991-2010 136,319 41,581 52,551 230,452
New 2011-2020 28,390 11,718 11,394 51,501
The implications or renovation policies are clear – the biggest energy savings can generally be achieved
in the older building stock. This is reected in the scenarios, where the majority o renovation activity isassumed to occur in the pre-1960 stock up to around 2030. From 2031 onwards the emphasis shits to the“Modern” age band, while it is assumed that buildings constructed in the current decade will not undergorenovation until 2040 onwards.
J cea
A comprehensive review o the employment impact o energy saving building renovation spanningEurope and North America was undertaken by the Centre or Climate Change and Sustainable EnergyPolicy at the Central European University in Hungary51. On average, the studies show that 17 new jobswere created or every €1 million o expenditure at today’s prices. That average is used in the modelling.
50 Liechtenstein, Iceland, Norway, and Switzerland51 http://3csep.ceu.hu/sites/deault/les/eld_attachment/project/node-6234/employment-impactsoenergyeciencyretrots.pd

7/29/2019 LR CbC Study
http://slidepdf.com/reader/full/lr-cbc-study 106/132
106 | Europe’s buildings under the microscope
b. overview of the renovAtion model
A renovation model has been developed which allows scenarios to be examined that illustrate the impacton energy use and CO
2
emissions o diferent rates (percentage o buildings renovated each year) anddepths o renovation (extent o measures applied and size o resulting energy and emissions reduction)in the residential and non-residential building sectors up to 2050.
A number o scenarios have been modelled to illustrate the nancial, economic, environmental,employment and energy use impacts o diferent rates o uptake and depth o building renovation. Inparticular, the scenarios assess the ollowing outcomes, both annually and in total:
• Energysaved–thetotalenergysavingsoverthelifetimeofthemeasuresinstalled
• CO2
saved – the total CO2
savings over the lietime o the measures installed. The CO2
savings in a givenyear are calculated by multiplying the energy saved by the weighted average CO
2emission actor or
that year
• Totalinvestmentrequired -the totalcostoftheinstalledrenovationmeasures,includingmaterials,labour and proessional costs
• Energycostsavings–thecumulativevalueofthelifetimeenergysaving.Savingsinagivenyearare
calculated by multiplying that year’s energy saving by the weighted average energy price
• Employmentimpact–thenumberoffulltimeequivalentjobscreatedoverthe40-yearperiod(2011-
2050), based on employment actor (no. o jobs per €1 million investment) times the average annualinvestment
• Cost-eectivenessindicators:
> The internal rate o return (IRR) - based on the net saving each year (i.e. cost saving less investmentrequired in a given year)
> Net saving to consumers - the diference between the lietime energy cost savings and the lietimeinvestment. Both gures are discounted by the weighted average consumer discount rate.A negative gure indicates a net COST to consumers
> Net saving to society, including the value o externalities - the sum o the lietime energy costsavings and value o externalities, less the lietime investment. Both gures are discounted by thesocietal discount rate.A negative gure indicates a net COST to society
> Carbon abatement cost – net lietime societal savings divided by the lietime carbon savings.A negative gure indicates a net benet per tonne o CO
2saved
The development o the model is thereore split into two parts:
(I) Assessing the practical limit (o oor area to be renovated and the energy use associated with thisbuilding oor area); and
(II) Examining scenarios.

7/29/2019 LR CbC Study
http://slidepdf.com/reader/full/lr-cbc-study 107/132
Europe’s buildings under the microscope | 107
dee e aa e ea e Eu
The rst step in the modelling process was to assess the practical limit o buildings that can undergo lowenergy renovation in the residential and non-residential building sectors in the 2011 to 2050 timerame.
The practical limit to renovation up to 2050 will be afected by a number o considerations:
• Demolitions: Some buildings will be demolished and thereore leave the stock. These buildings arelikely to sufer rom structural problems or be in areas where supply exceeds demand, and thereore areunlikely candidates or renovation to improve their energy perormance.
• Heritage Buildings: Many buildings have historical, aesthetic and/or cultural value. As a consequence,planning authorities and other bodies may restrict the extent and type o renovation that can beundertaken. In practice, these buildings are not excluded because there will always be some energyeciency measures that can be applied, even i it is not a total renovation. Minor and moderate measuresmay oten be easible in the case o heritage buildings.
• Recent Renovations: Some buildings may have undergone renovation in the recent past and thismay make uture renovation economically less attractive. It is contended that the number o buildingsrenovated to a level that would prevent the application o urther energy savings measures is verysmall, o the order o 1% o the existing stock.
• New Buildings: New buildings constructed between 2011 and 2020 will probably be subject torenovation in the period up to 2050, even i only to replace HVAC equipment. Also, as energy standardsor renovation are tightened and new technologies become more widely available and afordable,these will increasingly be deployed on buildings constructed this decade. This will add to the volumeo the building stock that comprises the practical limit.
Beyond 2020 it is assumed that nZEB requirements under the recast o the EPBD will result in buildings
achieving a level o energy perormance that will not require urther renovation (other than equipmentreplacement) to 2050.
The building stock oor area has thereore been adjusted to arrive at the 2050 practical limit by applyingthe percentage reductions and increases shown in Table 3B1 to the current oor area or residential andnon-residential buildings in the EU27, Norway and Switzerland.
Table 3B1 – Adjustments to current building stock to determine the 2050 practical limit
Source: BPIE model
Adjustment Calculation Percentage increase or
reductionDemolitions rom 2011
to 2050
40 years at 0.2% o the buildingstock each year
-8%
Heritage buildings Assumed not to preventrenovation at some level
0%
Recent Renovations Assumed to be very ew thatwould prevent the additiono urther energy eciencymeasures
-1%
New Buildings rom
2011-2020
10 years at 0.5% o the buildingstock each year
+5%
Total Adjustment (note simple rather thancompound addition)
-4%
7/29/2019 LR CbC Study
http://slidepdf.com/reader/full/lr-cbc-study 108/132
108 | Europe’s buildings under the microscope
i aa
For modelling purposes, the ollowing inormation derived rom section 1 o this report has been used,together with a number o assumptions:
• Themain target buildingstock for renovationis the practicallimit,basedon the existingstock of
buildings, less an allowance or demolitions and buildings already renovated. From 2040 onwards,there will also be a small contribution rom renovation o buildings constructed in the current decade(2011-2020)
• Currentratesofactivitywillbetakenasabaselinegurefortheyear2010:
> Prevailing renovation rates are 1% as the EU average; and> Prevailing renovation depths are predominantly minor.
• EnergypricesaretakenfromEurostat52 and include all taxes, as these orm part o the savings consumersmake when reducing their energy imports.
• EnergypriceforecastsarederivedfromEUEnergyTrendsto203053
.• Whenvaluingsocietalbenets,externalitiesassociatedwithenergyuseareincluded54.
• Two ratesofdecarbonisationof energy suppliesaremodelled.Theslow rateof decarbonisationis
based on that witnessed since 1990 – approx. 0.5% p.a. and reects a continuation o current activity,i.e. no change to the recent underlying level o decarbonisation.
• Thefastonetakesthedecarbonisationrateneededtoachievethelevelsofcarbonreductionassumed
in the EU 2050 Roadmap, i.e. approx. 5% p.a. or electricity and 2% or other uels, where the latterreects uel switching rom higher to lower carbon sources (including renewables).
• Thefollowingdiscountrateshavebeenbeapplied:
> Households 10%> Business 10%> Public Sector 5%> Societal 3%
• Cost reduction factors are applied, reecting the impact of increasing renovation activity over
the period to 2050. Higher actors are applied to the deeper renovation proles, given that thereis a steeper learning curve as the volume o activity increases, and the cost o buildings-integratedrenewable technologies in particular come down with increasing market maturity. The impact isillustrated in Figure 3B1, with cost reductions ranging rom 1% p.a. or minor renovations to 4% p.a. ornZEB renovations.
52 http://epp.eurostat.ec.europa.eu/portal/page/portal/energy/data/database53 http://ec.europa.eu/energy/observatory/trends_2030/doc/trends_to_2030_update_2009.pd 54 Externalities, or external costs, reect the environmental and human health damages arising rom energy use. These negative impacts include
climate change damage costs associated with emissions o CO2 and other GHGs, as well as impacts on health, agriculture etc. caused by otherair pollutants such as NOx, SO2, and particulates associated with energy production and consumption. The damage caused, by and large, is notincluded in the price we pay or energy and so represents an external cost. For this study, an external cost o €00.4/kWh o electricity production hasbeen used – this is the average o the high and low gures used by the European Environment Agency.
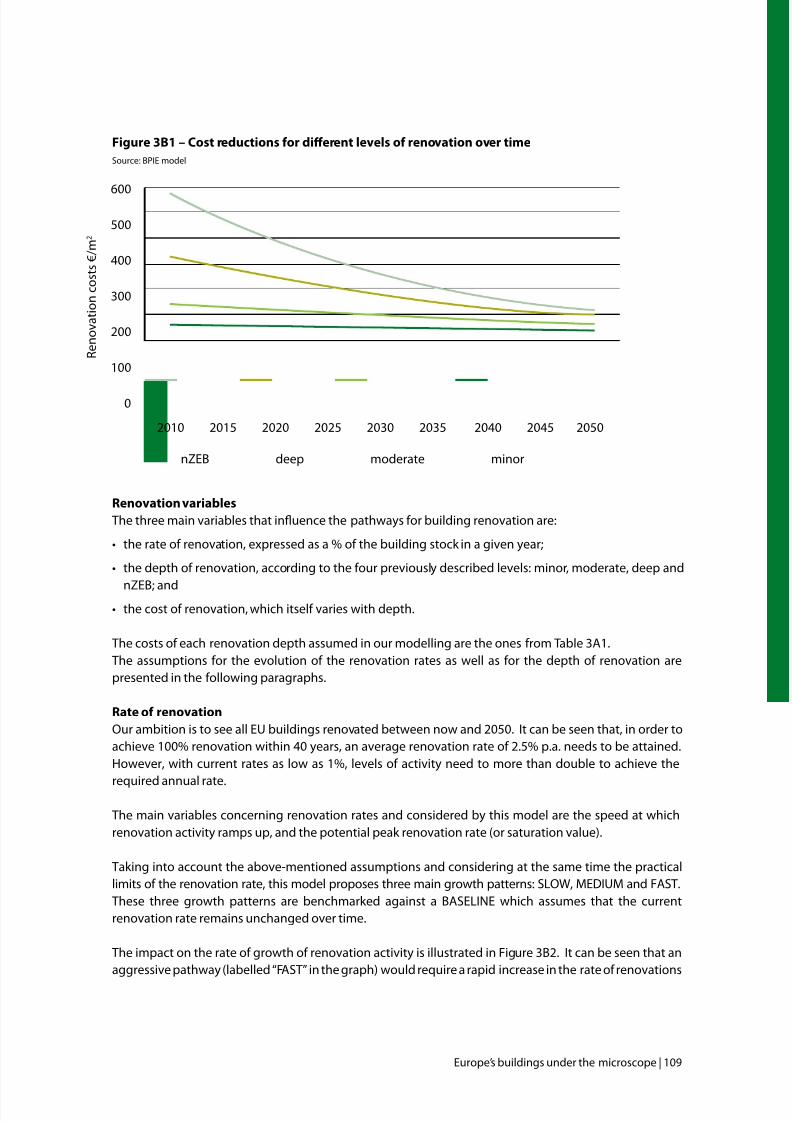
7/29/2019 LR CbC Study
http://slidepdf.com/reader/full/lr-cbc-study 109/132
Europe’s buildings under the microscope | 109
Fiure3B1–CostreductionsfordierentleelsofrenoationoertimeSource: BPIE model
Renovation variables
The three main variables that inuence the pathways or building renovation are:
• therateofrenovation,expressedasa%ofthebuildingstockinagivenyear;
• thedepthofrenovation,accordingtothefourpreviouslydescribedlevels:minor,moderate,deepand
nZEB; and• thecostofrenovation,whichitselfvarieswithdepth.
The costs o each renovation depth assumed in our modelling are the ones rom Table 3A1.The assumptions or the evolution o the renovation rates as well as or the depth o renovation arepresented in the ollowing paragraphs.
Rate o renovation
Our ambition is to see all EU buildings renovated between now and 2050. It can be seen that, in order toachieve 100% renovation within 40 years, an average renovation rate o 2.5% p.a. needs to be attained.However, with current rates as low as 1%, levels o activity need to more than double to achieve the
required annual rate.
The main variables concerning renovation rates and considered by this model are the speed at whichrenovation activity ramps up, and the potential peak renovation rate (or saturation value).
Taking into account the above-mentioned assumptions and considering at the same time the practicallimits o the renovation rate, this model proposes three main growth patterns: SLOW, MEDIUM and FAST.These three growth patterns are benchmarked against a BASELINE which assumes that the currentrenovation rate remains unchanged over time.
The impact on the rate o growth o renovation activity is illustrated in Figure 3B2. It can be seen that anaggressive pathway (labelled “FAST” in the graph) would require a rapid increase in the rate o renovations
600
500
400
300
200
100
0
2010 2015 2020 2025 2030 2035 2040 2045 2050
R e n o v a t i o n c o s t s € / m 2
nZEB deep moderate minor
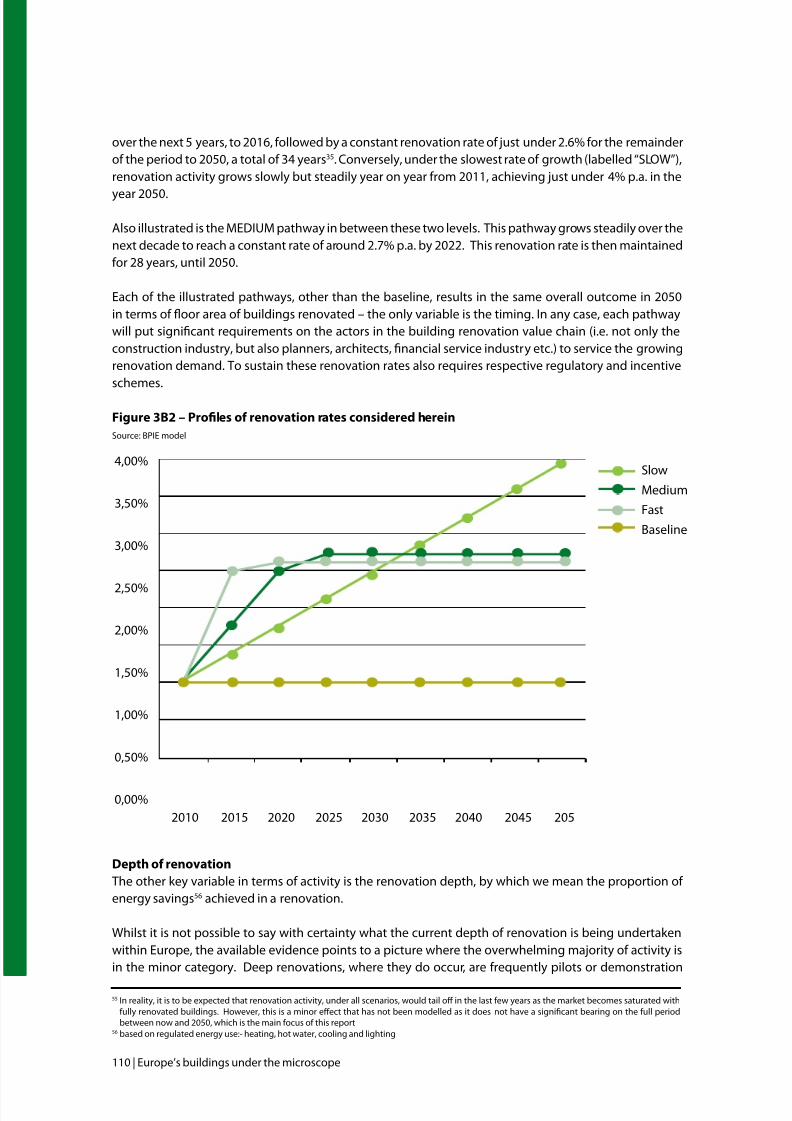
7/29/2019 LR CbC Study
http://slidepdf.com/reader/full/lr-cbc-study 110/132
110 | Europe’s buildings under the microscope
over the next 5 years, to 2016, ollowed by a constant renovation rate o just under 2.6% or the remaindero the period to 2050, a total o 34 years35. Conversely, under the slowest rate o growth (labelled “SLOW”),renovation activity grows slowly but steadily year on year rom 2011, achieving just under 4% p.a. in the
year 2050.
Also illustrated is the MEDIUM pathway in between these two levels. This pathway grows steadily over thenext decade to reach a constant rate o around 2.7% p.a. by 2022. This renovation rate is then maintainedor 28 years, until 2050.
Each o the illustrated pathways, other than the baseline, results in the same overall outcome in 2050in terms o oor area o buildings renovated – the only variable is the timing. In any case, each pathwaywill put signicant requirements on the actors in the building renovation value chain (i.e. not only theconstruction industry, but also planners, architects, nancial service industry etc.) to service the growingrenovation demand. To sustain these renovation rates also requires respective regulatory and incentiveschemes. Fiure3B2–ProlesofrenoationratesconsideredhereinSource: BPIE model
Depth o renovation
The other key variable in terms o activity is the renovation depth, by which we mean the proportion o energy savings56 achieved in a renovation.
Whilst it is not possible to say with certainty what the current depth o renovation is being undertakenwithin Europe, the available evidence points to a picture where the overwhelming majority o activity isin the minor category. Deep renovations, where they do occur, are requently pilots or demonstration
55 In reality, it is to be expected that renovation activity, under all scenarios, would tail of in the last ew years as the market becomes saturated withully renovated buildings. However, this is a minor efect that has not been modelled as it does not have a signicant bearing on the ull periodbetween now and 2050, which is the main ocus o this report
56 based on regulated energy use:- heating, hot water, cooling and lighting
Slow
Medium
Fast
Baseline
4,00%
3,50%
3,00%
2,50%
2,00%
1,50%
1,00%
0,50%
0,00%2010 2015 2020 2025 2030 2035 2040 2045 205
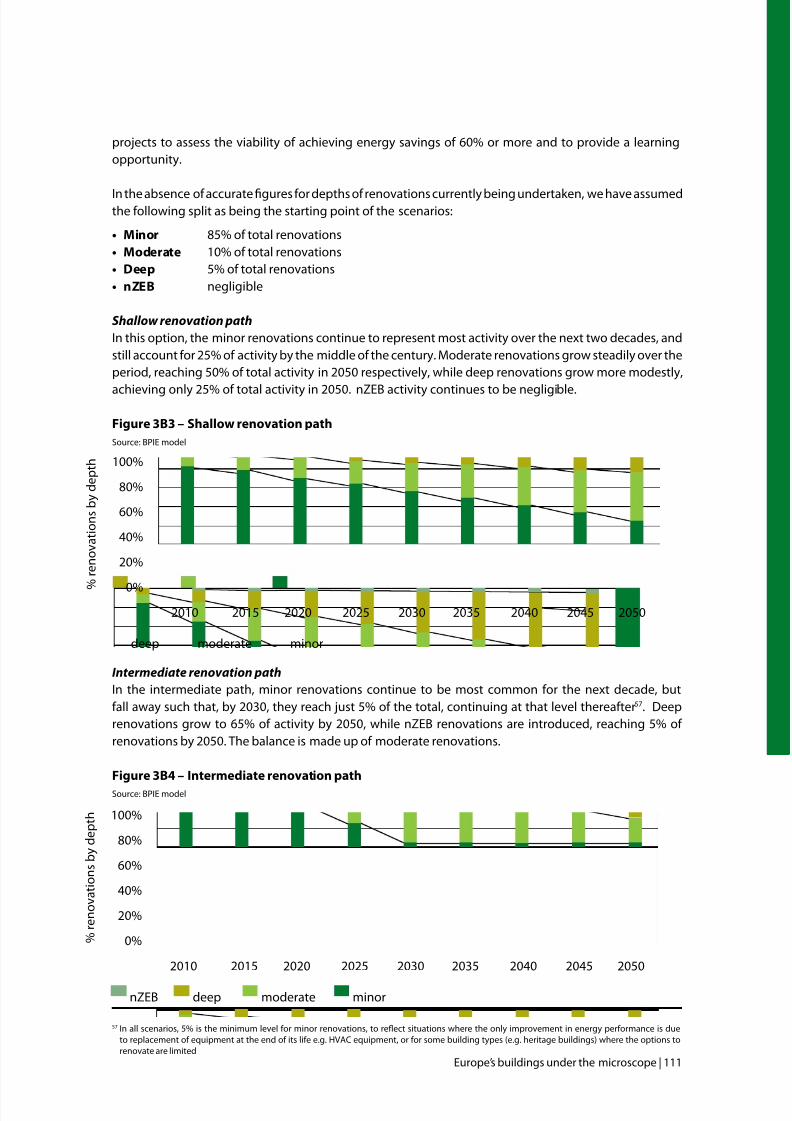
7/29/2019 LR CbC Study
http://slidepdf.com/reader/full/lr-cbc-study 111/132
Europe’s buildings under the microscope | 111
projects to assess the viability o achieving energy savings o 60% or more and to provide a learningopportunity.
In the absence o accurate gures or depths o renovations currently being undertaken, we have assumedthe ollowing split as being the starting point o the scenarios:
• Minor 85% o total renovations• Moderate 10% o total renovations• Deep 5% o total renovations• nZEB negligible
Shallow renovation path
In this option, the minor renovations continue to represent most activity over the next two decades, andstill account or 25% o activity by the middle o the century. Moderate renovations grow steadily over theperiod, reaching 50% o total activity in 2050 respectively, while deep renovations grow more modestly,
achieving only 25% o total activity in 2050. nZEB activity continues to be negligible. Figure 3B3 – Shallow renovation path
Source: BPIE model
Intermediate renovation path
In the intermediate path, minor renovations continue to be most common or the next decade, butall away such that, by 2030, they reach just 5% o the total, continuing at that level thereater57. Deeprenovations grow to 65% o activity by 2050, while nZEB renovations are introduced, reaching 5% o renovations by 2050. The balance is made up o moderate renovations.
Figure 3B4 – Intermediate renovation path
Source: BPIE model
57 In all scenarios, 5% is the minimum level or minor renovations, to reect situations where the only improvement in energy perormance is dueto replacement o equipment at the end o its lie e.g. HVAC equipment, or or some building types (e.g. heritage buildings) where the options torenovate are limited
100%
80%
60%
40%
20%
0%2010 2015 2020 2025 2030 2035 2040 2045 2050
%
r e n o v a t i o n s b y d e p t h
deep moderate minor
100%
80%
60%
40%
20%
0%
2010 2015 2020 2025 2030 2035 2040 2045 2050
% r e n o v a t i o n s b y d e p t h
nZEB deep moderate minor
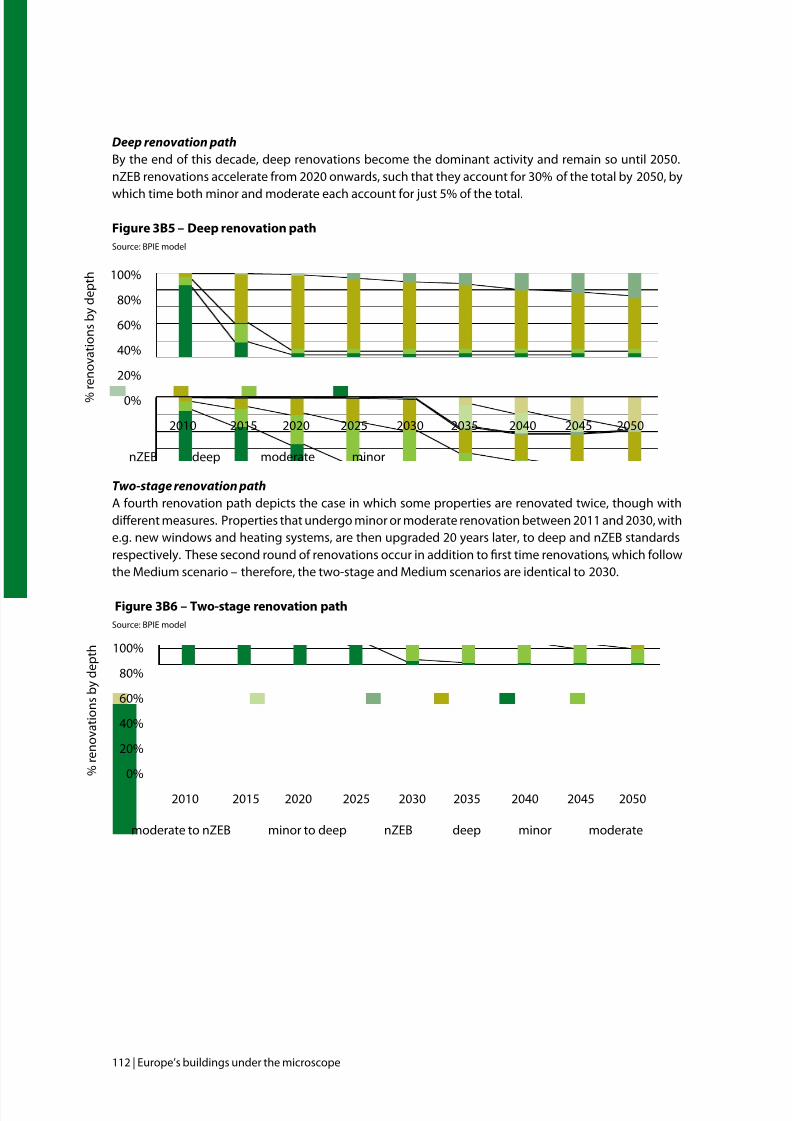
7/29/2019 LR CbC Study
http://slidepdf.com/reader/full/lr-cbc-study 112/132
112 | Europe’s buildings under the microscope
Deep renovation path
By the end o this decade, deep renovations become the dominant activity and remain so until 2050.nZEB renovations accelerate rom 2020 onwards, such that they account or 30% o the total by 2050, by
which time both minor and moderate each account or just 5% o the total. Figure 3B5 – Deep renovation path
Source: BPIE model
Two-stage renovation path
A ourth renovation path depicts the case in which some properties are renovated twice, though withdiferent measures. Properties that undergo minor or moderate renovation between 2011 and 2030, withe.g. new windows and heating systems, are then upgraded 20 years later, to deep and nZEB standardsrespectively. These second round o renovations occur in addition to rst time renovations, which ollowthe Medium scenario – thereore, the two-stage and Medium scenarios are identical to 2030.
Figure 3B6 – Two-stage renovation path
Source: BPIE model
100%
80%
60%
40%
20%
0%
2010 2015 2020 2025 2030 2035 2040 2045 2050
% r e n o v a t i o n s b y d e p t h
moderate to nZEB minor to deep nZEB deep minor moderate
100%
80%
60%
40%
20%
0%
2010 2015 2020 2025 2030 2035 2040 2045 2050
% r e n o v a t i o n s b y d e p t h
nZEB deep moderate minor
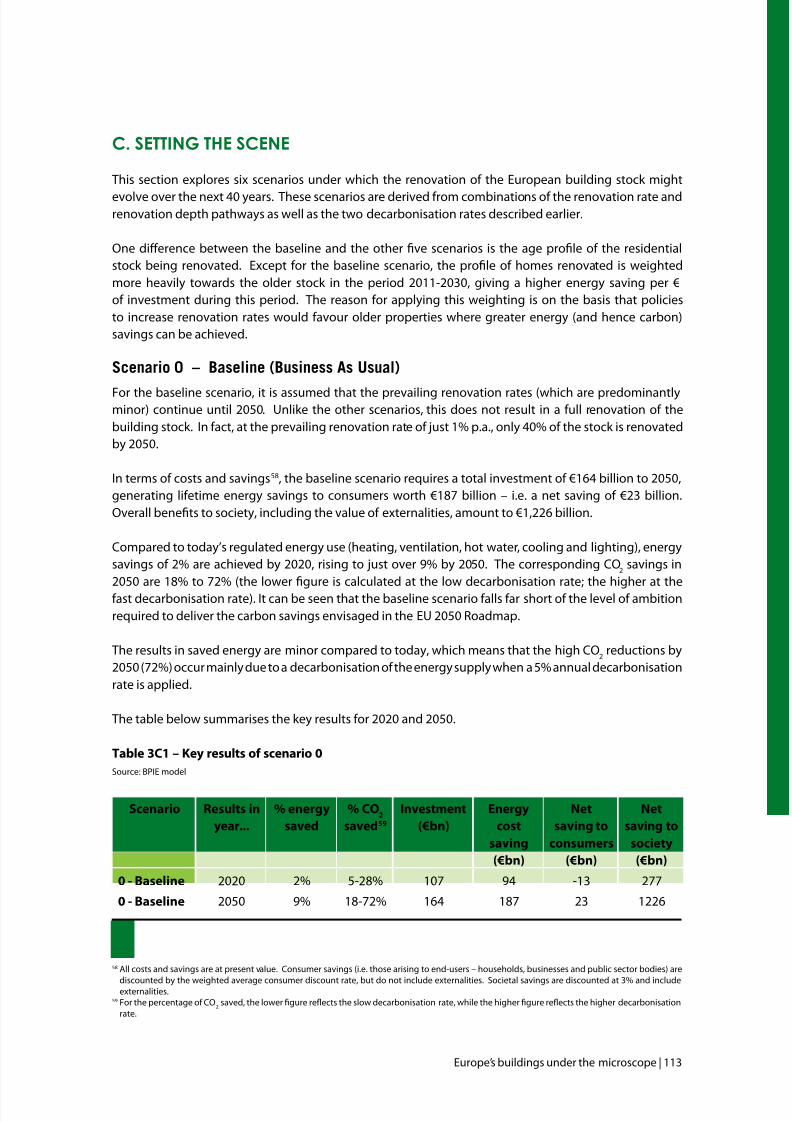
7/29/2019 LR CbC Study
http://slidepdf.com/reader/full/lr-cbc-study 113/132
Europe’s buildings under the microscope | 113
c. setting the scene
This section explores six scenarios under which the renovation o the European building stock might
evolve over the next 40 years. These scenarios are derived rom combinations o the renovation rate andrenovation depth pathways as well as the two decarbonisation rates described earlier.
One diference between the baseline and the other ve scenarios is the age prole o the residentialstock being renovated. Except or the baseline scenario, the prole o homes renovated is weightedmore heavily towards the older stock in the period 2011-2030, giving a higher energy saving per €o investment during this period. The reason or applying this weighting is on the basis that policiesto increase renovation rates would avour older properties where greater energy (and hence carbon)savings can be achieved.
sea 0 – baee (be A ua)
For the baseline scenario, it is assumed that the prevailing renovation rates (which are predominantlyminor) continue until 2050. Unlike the other scenarios, this does not result in a ull renovation o thebuilding stock. In act, at the prevailing renovation rate o just 1% p.a., only 40% o the stock is renovatedby 2050.
In terms o costs and savings58, the baseline scenario requires a total investment o €164 billion to 2050,generating lietime energy savings to consumers worth €187 billion – i.e. a net saving o €23 billion.Overall benets to society, including the value o externalities, amount to €1,226 billion.
Compared to today’s regulated energy use (heating, ventilation, hot water, cooling and lighting), energysavings o 2% are achieved by 2020, rising to just over 9% by 2050. The corresponding CO
2savings in
2050 are 18% to 72% (the lower gure is calculated at the low decarbonisation rate; the higher at theast decarbonisation rate). It can be seen that the baseline scenario alls ar short o the level o ambitionrequired to deliver the carbon savings envisaged in the EU 2050 Roadmap.
The results in saved energy are minor compared to today, which means that the high CO2
reductions by2050 (72%) occur mainly due to a decarbonisation o the energy supply when a 5% annual decarbonisationrate is applied.
The table below summarises the key results or 2020 and 2050.
Table 3C1 – Key results o scenario 0
Source: BPIE model
Scenario Results in
year...
% energy
saved
% CO2
saved59
Investment
(€bn)
Energy
cost
saving
(€bn)
Net
saving to
consumers
(€bn)
Net
saving to
society
(€bn)
0 - Baseline 2020 2% 5-28% 107 94 -13 277
0 - Baseline 2050 9% 18-72% 164 187 23 1226
58 All costs and savings are at present value. Consumer savings (i.e. those arising to end-users – households, businesses and public sector bodies) are
discounted by the weighted average consumer discount rate, but do not include externalities. Societal savings are discounted at 3% and includeexternalities.59 For the percentage o CO
2saved, the lower gure reects the slow decarbonisation rate, while the higher gure reects the higher decarbonisation
rate.
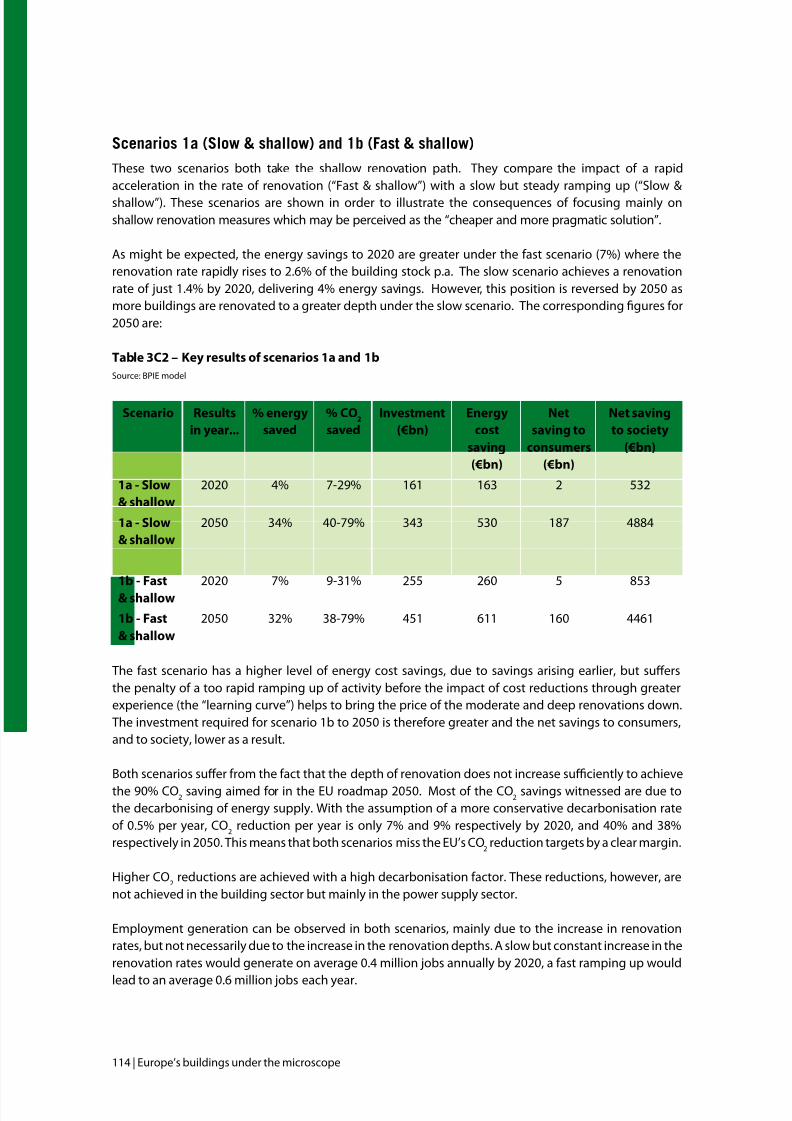
7/29/2019 LR CbC Study
http://slidepdf.com/reader/full/lr-cbc-study 114/132
114 | Europe’s buildings under the microscope
sea 1a (s & a) a 1 (Fa & a)
These two scenarios both take the shallow renovation path. They compare the impact o a rapidacceleration in the rate o renovation (“Fast & shallow”) with a slow but steady ramping up (“Slow &shallow”). These scenarios are shown in order to illustrate the consequences o ocusing mainly onshallow renovation measures which may be perceived as the “cheaper and more pragmatic solution”.
As might be expected, the energy savings to 2020 are greater under the ast scenario (7%) where therenovation rate rapidly rises to 2.6% o the building stock p.a. The slow scenario achieves a renovationrate o just 1.4% by 2020, delivering 4% energy savings. However, this position is reversed by 2050 asmore buildings are renovated to a greater depth under the slow scenario. The corresponding gures or2050 are:
Table 3C2 – Key results o scenarios 1a and 1b
Source: BPIE model
Scenario Results
in year...
% energy
saved
% CO2
saved
Investment
(€bn)
Energy
cost
saving
(€bn)
Net
saving to
consumers
(€bn)
Net saving
to society
(€bn)
1a - Slow
& shallow
2020 4% 7-29% 161 163 2 532
1a - Slow
& shallow
2050 34% 40-79% 343 530 187 4884
1b - Fast
& shallow
2020 7% 9-31% 255 260 5 853
1b - Fast
& shallow
2050 32% 38-79% 451 611 160 4461
The ast scenario has a higher level o energy cost savings, due to savings arising earlier, but sufersthe penalty o a too rapid ramping up o activity beore the impact o cost reductions through greaterexperience (the “learning curve”) helps to bring the price o the moderate and deep renovations down.The investment required or scenario 1b to 2050 is thereore greater and the net savings to consumers,and to society, lower as a result.
Both scenarios sufer rom the act that the depth o renovation does not increase suciently to achieve
the 90% CO2 saving aimed or in the EU roadmap 2050. Most o the CO2 savings witnessed are due tothe decarbonising o energy supply. With the assumption o a more conservative decarbonisation rateo 0.5% per year, CO
2reduction per year is only 7% and 9% respectively by 2020, and 40% and 38%
respectively in 2050. This means that both scenarios miss the EU’s CO2
reduction targets by a clear margin.
Higher CO2
reductions are achieved with a high decarbonisation actor. These reductions, however, arenot achieved in the building sector but mainly in the power supply sector.
Employment generation can be observed in both scenarios, mainly due to the increase in renovationrates, but not necessarily due to the increase in the renovation depths. A slow but constant increase in therenovation rates would generate on average 0.4 million jobs annually by 2020, a ast ramping up would
lead to an average 0.6 million jobs each year.
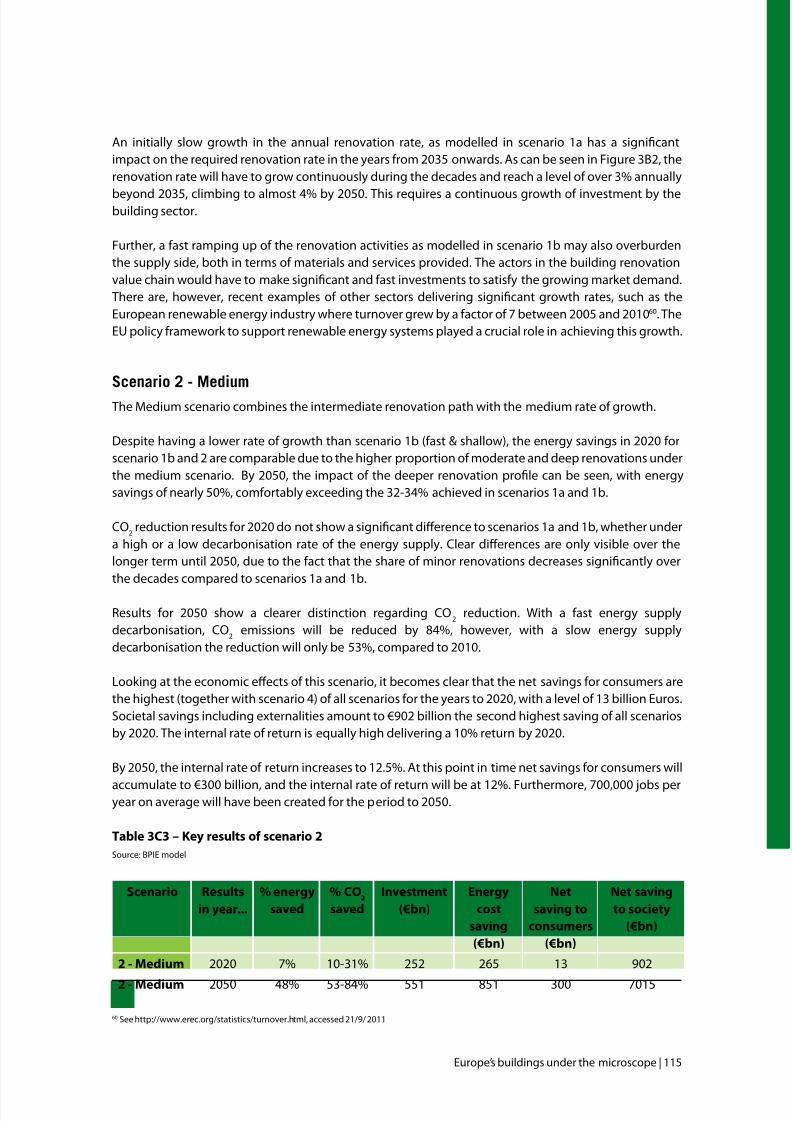
7/29/2019 LR CbC Study
http://slidepdf.com/reader/full/lr-cbc-study 115/132
Europe’s buildings under the microscope | 115
An initially slow growth in the annual renovation rate, as modelled in scenario 1a has a signicantimpact on the required renovation rate in the years rom 2035 onwards. As can be seen in Figure 3B2, therenovation rate will have to grow continuously during the decades and reach a level o over 3% annually
beyond 2035, climbing to almost 4% by 2050. This requires a continuous growth o investment by thebuilding sector.
Further, a ast ramping up o the renovation activities as modelled in scenario 1b may also overburdenthe supply side, both in terms o materials and services provided. The actors in the building renovationvalue chain would have to make signicant and ast investments to satisy the growing market demand.There are, however, recent examples o other sectors delivering signicant growth rates, such as theEuropean renewable energy industry where turnover grew by a actor o 7 between 2005 and 201060. TheEU policy ramework to support renewable energy systems played a crucial role in achieving this growth.
sea 2 - me
The Medium scenario combines the intermediate renovation path with the medium rate o growth.
Despite having a lower rate o growth than scenario 1b (ast & shallow), the energy savings in 2020 orscenario 1b and 2 are comparable due to the higher proportion o moderate and deep renovations underthe medium scenario. By 2050, the impact o the deeper renovation prole can be seen, with energysavings o nearly 50%, comortably exceeding the 32-34% achieved in scenarios 1a and 1b.
CO2
reduction results or 2020 do not show a signicant diference to scenarios 1a and 1b, whether undera high or a low decarbonisation rate o the energy supply. Clear diferences are only visible over thelonger term until 2050, due to the act that the share o minor renovations decreases signicantly overthe decades compared to scenarios 1a and 1b.
Results or 2050 show a clearer distinction regarding CO2
reduction. With a ast energy supplydecarbonisation, CO
2emissions will be reduced by 84%, however, with a slow energy supply
decarbonisation the reduction will only be 53%, compared to 2010.
Looking at the economic efects o this scenario, it becomes clear that the net savings or consumers arethe highest (together with scenario 4) o all scenarios or the years to 2020, with a level o 13 billion Euros.Societal savings including externalities amount to €902 billion the second highest saving o all scenariosby 2020. The internal rate o return is equally high delivering a 10% return by 2020.
By 2050, the internal rate o return increases to 12.5%. At this point in time net savings or consumers will
accumulate to €300 billion, and the internal rate o return will be at 12%. Furthermore, 700,000 jobs peryear on average will have been created or the period to 2050.
Table 3C3 – Key results o scenario 2
Source: BPIE model
Scenario Results
in year...
% energy
saved
% CO2
saved
Investment
(€bn)
Energy
cost
saving
(€bn)
Net
saving to
consumers
(€bn)
Net saving
to society
(€bn)
2-Medium 2020 7% 10-31% 252 265 13 902
2-Medium 2050 48% 53-84% 551 851 300 7015
60 See http://www.erec.org/statistics/turnover.html, accessed 21/9/ 2011
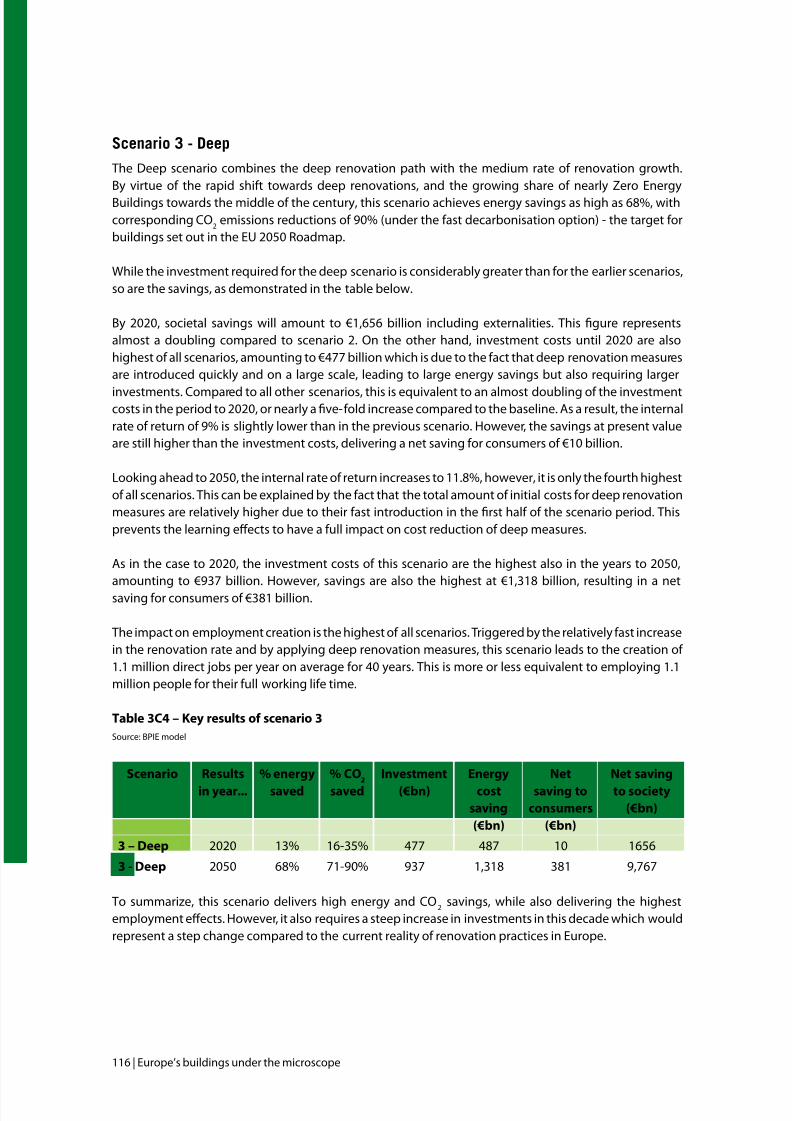
7/29/2019 LR CbC Study
http://slidepdf.com/reader/full/lr-cbc-study 116/132
116 | Europe’s buildings under the microscope
sea 3 - dee
The Deep scenario combines the deep renovation path with the medium rate o renovation growth.By virtue o the rapid shit towards deep renovations, and the growing share o nearly Zero EnergyBuildings towards the middle o the century, this scenario achieves energy savings as high as 68%, withcorresponding CO
2emissions reductions o 90% (under the ast decarbonisation option) - the target or
buildings set out in the EU 2050 Roadmap.
While the investment required or the deep scenario is considerably greater than or the earlier scenarios,so are the savings, as demonstrated in the table below.
By 2020, societal savings will amount to €1,656 billion including externalities. This gure representsalmost a doubling compared to scenario 2. On the other hand, investment costs until 2020 are alsohighest o all scenarios, amounting to €477 billion which is due to the act that deep renovation measuresare introduced quickly and on a large scale, leading to large energy savings but also requiring larger
investments. Compared to all other scenarios, this is equivalent to an almost doubling o the investmentcosts in the period to 2020, or nearly a ve-old increase compared to the baseline. As a result, the internalrate o return o 9% is slightly lower than in the previous scenario. However, the savings at present valueare still higher than the investment costs, delivering a net saving or consumers o €10 billion.
Looking ahead to 2050, the internal rate o return increases to 11.8%, however, it is only the ourth highesto all scenarios. This can be explained by the act that the total amount o initial costs or deep renovationmeasures are relatively higher due to their ast introduction in the rst hal o the scenario period. Thisprevents the learning efects to have a ull impact on cost reduction o deep measures.
As in the case to 2020, the investment costs o this scenario are the highest also in the years to 2050,amounting to €937 billion. However, savings are also the highest at €1,318 billion, resulting in a netsaving or consumers o €381 billion.
The impact on employment creation is the highest o all scenarios. Triggered by the relatively ast increasein the renovation rate and by applying deep renovation measures, this scenario leads to the creation o 1.1 million direct jobs per year on average or 40 years. This is more or less equivalent to employing 1.1million people or their ull working lie time.
Table 3C4 – Key results o scenario 3
Source: BPIE model
Scenario Results
in year...
% energy
saved
% CO2
saved
Investment
(€bn)
Energy
cost
saving
(€bn)
Net
saving to
consumers
(€bn)
Net saving
to society
(€bn)
3 – Deep 2020 13% 16-35% 477 487 10 1656
3 - Deep 2050 68% 71-90% 937 1,318 381 9,767
To summarize, this scenario delivers high energy and CO2
savings, while also delivering the highestemployment efects. However, it also requires a steep increase in investments in this decade which wouldrepresent a step change compared to the current reality o renovation practices in Europe.
7/29/2019 LR CbC Study
http://slidepdf.com/reader/full/lr-cbc-study 117/132
Europe’s buildings under the microscope | 117
sea 4 – t-ae ea
The ourth scenario deviates rom the assumption in the previous scenarios that buildings will berenovated once between 2010 and 2050. In this scenario, rom 2031 onwards the “second stage”renovations commence, occurring in addition to the rst time renovations.
As a result o the learning curve cost reductions, particularly or the deeper renovations, the cost o achieving a deep or nZEB renovation is now substantially less than i it had been undertaken 20 yearsearlier. The overall investment is thereore considerably lower than or the Deep scenario. In presentvalue terms, a cost reduction o nearly 40% is achieved, despite achieving slightly higher levels o energyand CO
2savings in 2050. Correspondingly, the net savings, both to consumers and to society at large, are
signicantly greater than or the Deep scenario.
The achieved energy saving is the highest o all scenarios, leading to a 71% saving in 2050. CO2
emissionsdecrease by 73% to 91%, depending on the decarbonisation rate as described earlier.
The renovation rate o this scenario ollows the same path as the medium scenario until 2030, requiringan intermediate growth rate during the rst two decades. However, renovation activities will have tosignicantly increase ater 2030 to deliver on the second stage o renovation which comes on top o the now continuous renovation rate o scenario 2 (c.. Table 3C5). This requires strategic planning aheadby the supply chain, which in turn needs to be enabled and supported by a reliable and clear policyramework.
Table 3C5 – Key results o scenario 4
Source: BPIE model
Scenario Resultsin year...
% energysaved
% CO2 saved
Investment(€bn)
Energycost
saving
(€bn)
Netsaving to
consumers
(€bn)
Net savingto society
(€bn)
4 - 2 stage 2020 7% 10-31% 252 265 13 902
4 - 2 stage 2050 71% 73-91% 584 1,058 474 10,680
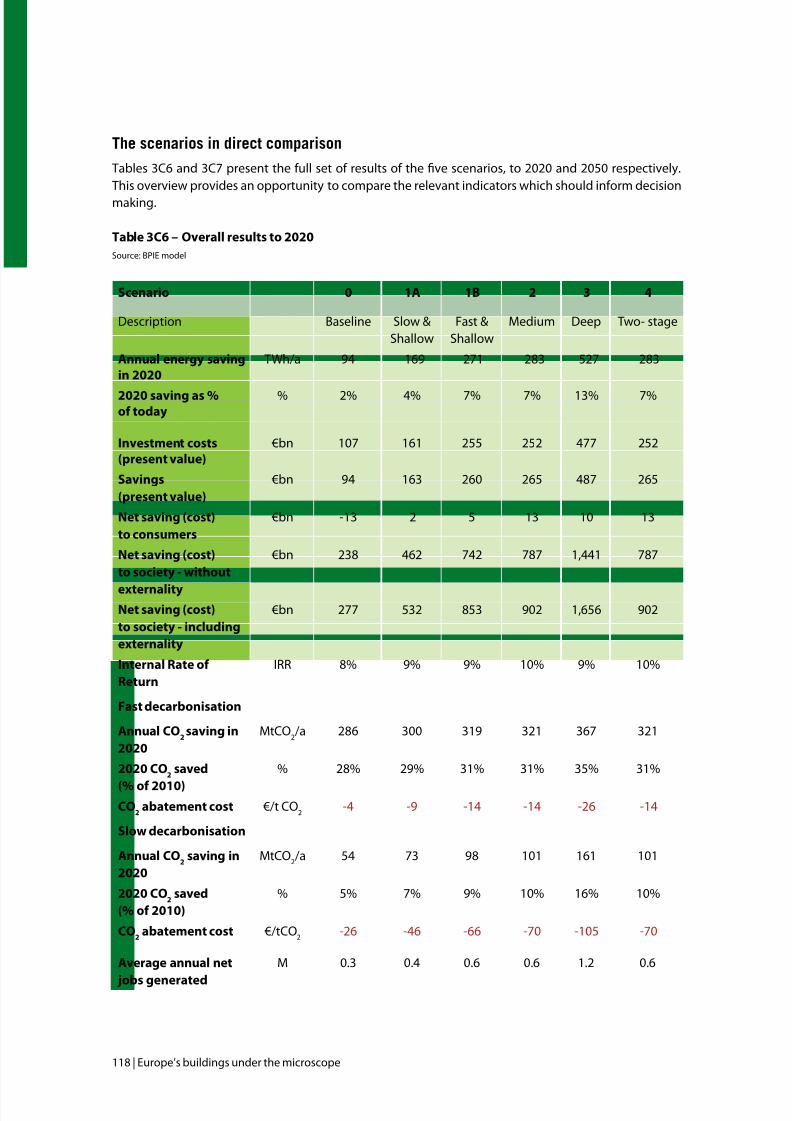
7/29/2019 LR CbC Study
http://slidepdf.com/reader/full/lr-cbc-study 118/132
118 | Europe’s buildings under the microscope
te ea e a
Tables 3C6 and 3C7 present the ull set o results o the ve scenarios, to 2020 and 2050 respectively.This overview provides an opportunity to compare the relevant indicators which should inorm decisionmaking.
Table 3C6 – Overall results to 2020
Source: BPIE model
Scenario 0 1A 1B 2 3 4
Description Baseline Slow &Shallow
Fast &Shallow
Medium Deep Two- stage
Annual energy saving
in 2020
TWh/a 94 169 271 283 527 283
2020 saving as %o today
% 2% 4% 7% 7% 13% 7%
Investment costs
(present value)
€bn 107 161 255 252 477 252
Savings
(present value)
€bn 94 163 260 265 487 265
Net saving (cost)
to consumers
€bn -13 2 5 13 10 13
Net saving (cost)
to society - without
externality
€bn 238 462 742 787 1,441 787
Net saving (cost)
to society - including
externality
€bn 277 532 853 902 1,656 902
Internal Rate o
Return
IRR 8% 9% 9% 10% 9% 10%
Fast decarbonisation
Annual CO2
saving in
2020
MtCO2/a 286 300 319 321 367 321
2020 CO2
saved
(% o 2010)
% 28% 29% 31% 31% 35% 31%
CO2
abatement cost €/t CO2
-4 -9 -14 -14 -26 -14
Slow decarbonisation
Annual CO2
saving in
2020
MtCO2/a 54 73 98 101 161 101
2020 CO2
saved
(% o 2010)
% 5% 7% 9% 10% 16% 10%
CO2
abatement cost €/tCO2
-26 -46 -66 -70 -105 -70
Average annual net
jobs generated
M 0.3 0.4 0.6 0.6 1.2 0.6
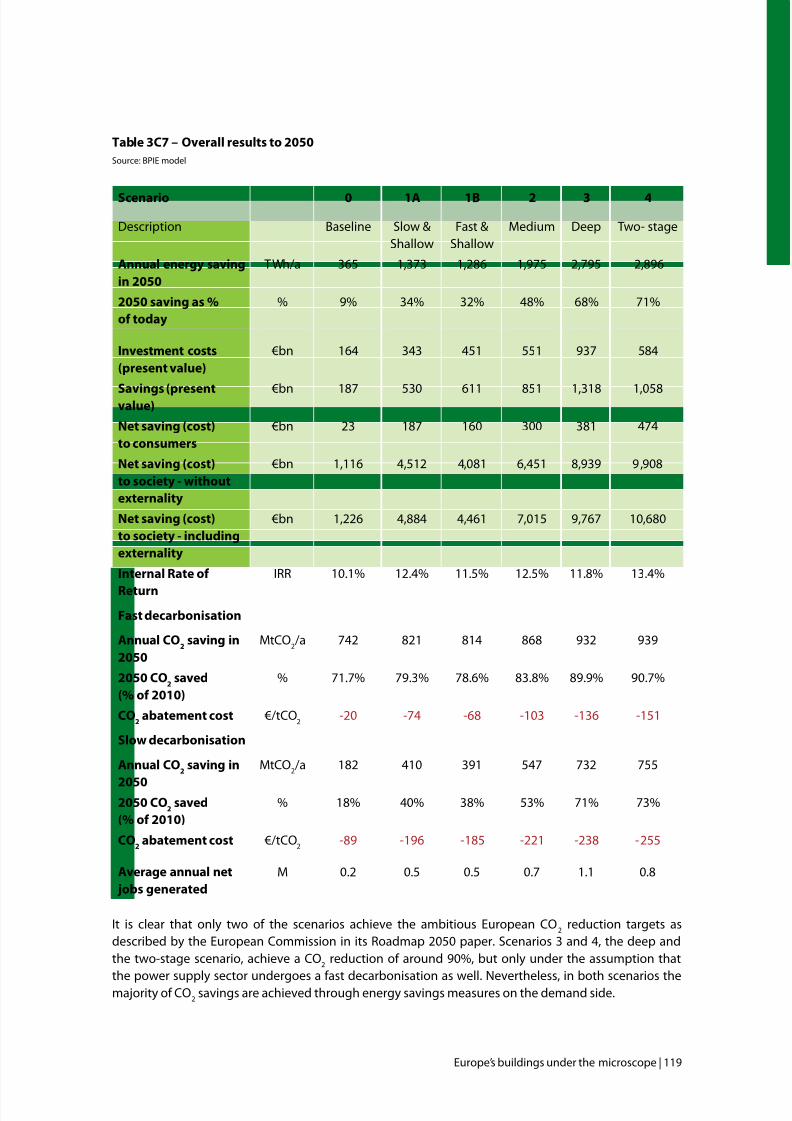
7/29/2019 LR CbC Study
http://slidepdf.com/reader/full/lr-cbc-study 119/132
Europe’s buildings under the microscope | 119
Table 3C7 – Overall results to 2050
Source: BPIE model
Scenario 0 1A 1B 2 3 4
Description Baseline Slow &Shallow
Fast &Shallow
Medium Deep Two- stage
Annual energy saving
in 2050
TWh/a 365 1,373 1,286 1,975 2,795 2,896
2050 saving as %
o today
% 9% 34% 32% 48% 68% 71%
Investment costs
(present value)
€bn 164 343 451 551 937 584
Savings (presentvalue) €bn 187 530 611 851 1,318 1,058
Net saving (cost)
to consumers
€bn 23 187 160 300 381 474
Net saving (cost)
to society - without
externality
€bn 1,116 4,512 4,081 6,451 8,939 9,908
Net saving (cost)
to society - including
externality
€bn 1,226 4,884 4,461 7,015 9,767 10,680
Internal Rate o
Return
IRR 10.1% 12.4% 11.5% 12.5% 11.8% 13.4%
Fast decarbonisation
Annual CO2
saving in
2050
MtCO2/a 742 821 814 868 932 939
2050 CO2
saved
(% o 2010)
% 71.7% 79.3% 78.6% 83.8% 89.9% 90.7%
CO2
abatement cost €/tCO2
-20 -74 -68 -103 -136 -151
Slow decarbonisation
Annual CO2
saving in
2050
MtCO2/a 182 410 391 547 732 755
2050 CO2
saved
(% o 2010)
% 18% 40% 38% 53% 71% 73%
CO2
abatement cost €/tCO2
-89 -196 -185 -221 -238 -255
Average annual net
jobs generated
M 0.2 0.5 0.5 0.7 1.1 0.8
It is clear that only two o the scenarios achieve the ambitious European CO2
reduction targets asdescribed by the European Commission in its Roadmap 2050 paper. Scenarios 3 and 4, the deep andthe two-stage scenario, achieve a CO
2reduction o around 90%, but only under the assumption that
the power supply sector undergoes a ast decarbonisation as well. Nevertheless, in both scenarios themajority o CO2
savings are achieved through energy savings measures on the demand side.
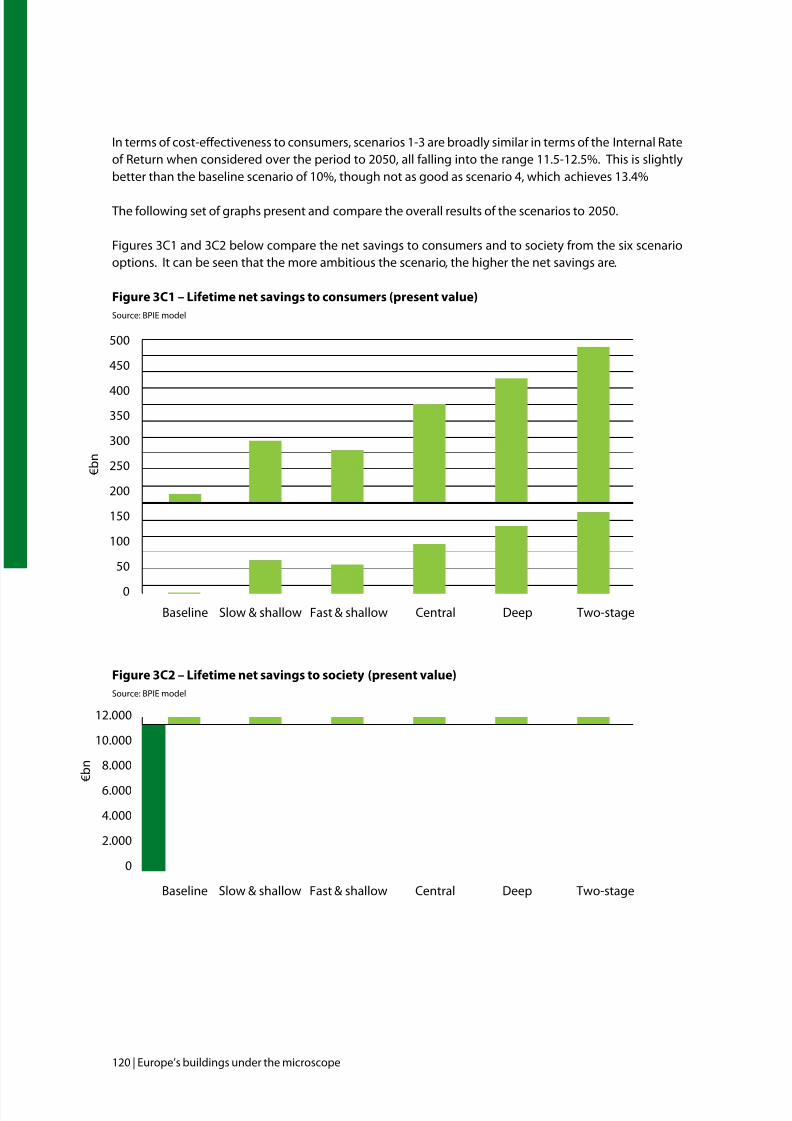
7/29/2019 LR CbC Study
http://slidepdf.com/reader/full/lr-cbc-study 120/132
120 | Europe’s buildings under the microscope
In terms o cost-efectiveness to consumers, scenarios 1-3 are broadly similar in terms o the Internal Rateo Return when considered over the period to 2050, all alling into the range 11.5-12.5%. This is slightlybetter than the baseline scenario o 10%, though not as good as scenario 4, which achieves 13.4%
The ollowing set o graphs present and compare the overall results o the scenarios to 2050.
Figures 3C1 and 3C2 below compare the net savings to consumers and to society rom the six scenariooptions. It can be seen that the more ambitious the scenario, the higher the net savings are.
Figure 3C1 – Lietime net savings to consumers (present value)
Source: BPIE model
Figure 3C2 – Lietime net savings to society (present value)
Source: BPIE model
500
450
400350
300
250
200
150
100
50
0Baseline Slow & shallow Fast & shallow Central Deep Two-stage
€ b n
12.000
10.000
8.000
6.000
4.000
2.000
0
Baseline Slow & shallow Fast & shallow Central Deep Two-stage
€ b n
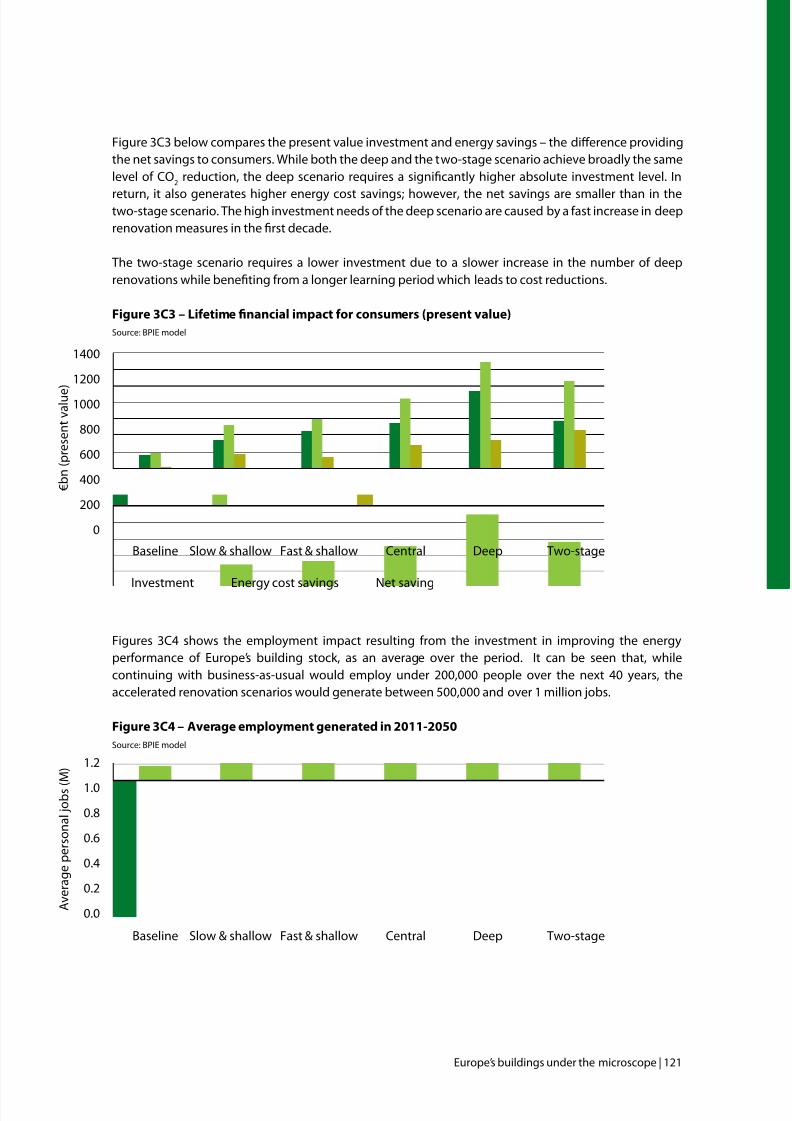
7/29/2019 LR CbC Study
http://slidepdf.com/reader/full/lr-cbc-study 121/132
Europe’s buildings under the microscope | 121
Figure 3C3 below compares the present value investment and energy savings – the diference providingthe net savings to consumers. While both the deep and the two-stage scenario achieve broadly the samelevel o CO
2reduction, the deep scenario requires a signicantly higher absolute investment level. In
return, it also generates higher energy cost savings; however, the net savings are smaller than in thetwo-stage scenario. The high investment needs o the deep scenario are caused by a ast increase in deeprenovation measures in the rst decade.
The two-stage scenario requires a lower investment due to a slower increase in the number o deeprenovations while beneting rom a longer learning period which leads to cost reductions.
Fiure3C3–Lifetimenancialimpactforconsumers(presentalue)Source: BPIE model
Figures 3C4 shows the employment impact resulting rom the investment in improving the energyperormance o Europe’s building stock, as an average over the period. It can be seen that, whilecontinuing with business-as-usual would employ under 200,000 people over the next 40 years, theaccelerated renovation scenarios would generate between 500,000 and over 1 million jobs.
Figure 3C4 – Average employment generated in 2011-2050
Source: BPIE model
1.2
1.0
0.8
0.6
0.4
0.2
0.0
Baseline Slow & shallow Fast & shallow Central Deep Two-stage
A v e r a g e p e r s o n a l j o b s (
M )
1400
1200
1000
800
600
400
200
0
Baseline Slow & shallow Fast & shallow Central Deep Two-stage
€ b n ( p r e s e n t v a l u e
)
Investment Energy cost savings Net saving
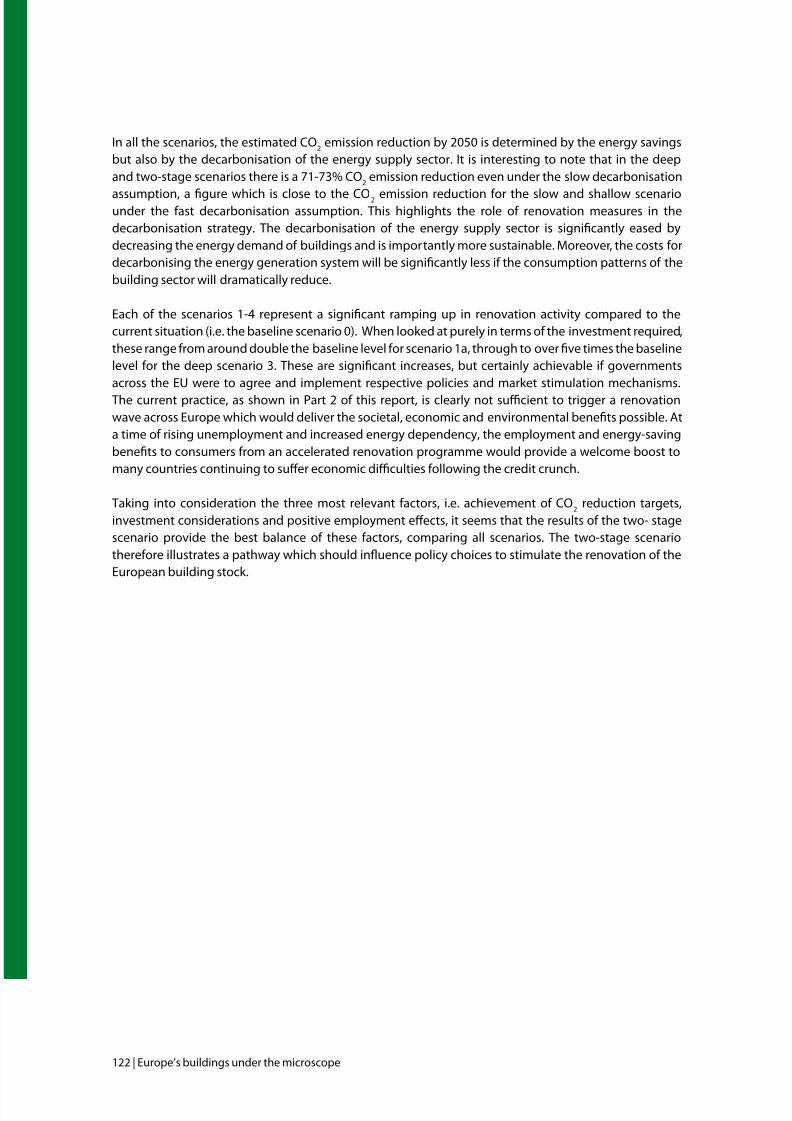
7/29/2019 LR CbC Study
http://slidepdf.com/reader/full/lr-cbc-study 122/132
122 | Europe’s buildings under the microscope
In all the scenarios, the estimated CO2
emission reduction by 2050 is determined by the energy savingsbut also by the decarbonisation o the energy supply sector. It is interesting to note that in the deepand two-stage scenarios there is a 71-73% CO
2emission reduction even under the slow decarbonisation
assumption, a gure which is close to the CO 2 emission reduction or the slow and shallow scenariounder the ast decarbonisation assumption. This highlights the role o renovation measures in thedecarbonisation strategy. The decarbonisation o the energy supply sector is signicantly eased bydecreasing the energy demand o buildings and is importantly more sustainable. Moreover, the costs ordecarbonising the energy generation system will be signicantly less i the consumption patterns o thebuilding sector will dramatically reduce.
Each o the scenarios 1-4 represent a signicant ramping up in renovation activity compared to thecurrent situation (i.e. the baseline scenario 0). When looked at purely in terms o the investment required,these range rom around double the baseline level or scenario 1a, through to over ve times the baselinelevel or the deep scenario 3. These are signicant increases, but certainly achievable i governmentsacross the EU were to agree and implement respective policies and market stimulation mechanisms.The current practice, as shown in Part 2 o this report, is clearly not sucient to trigger a renovationwave across Europe which would deliver the societal, economic and environmental benets possible. Ata time o rising unemployment and increased energy dependency, the employment and energy-savingbenets to consumers rom an accelerated renovation programme would provide a welcome boost tomany countries continuing to sufer economic diculties ollowing the credit crunch.
Taking into consideration the three most relevant actors, i.e. achievement o CO2
reduction targets,investment considerations and positive employment efects, it seems that the results o the two- stagescenario provide the best balance o these actors, comparing all scenarios. The two-stage scenariothereore illustrates a pathway which should inuence policy choices to stimulate the renovation o theEuropean building stock.
7/29/2019 LR CbC Study
http://slidepdf.com/reader/full/lr-cbc-study 123/132
Europe’s buildings under the microscope | 123
61 COM(2010) 2020 . EUROPE 2020 A strategy or smart, sustainable and inclusive growth. Brussels, 3.3.2010.
FinAl rEmArks And
policy rEcommEndAtionsImproving energy eciency o buildings has important macro-economic benets and can substantiallycontribute to all three priorities o the Europe 2020 Strategy61, as well as to the EU 2050 roadmap targets.Society as a whole will be better of as a result o investments in energy savings measures or buildings,even beore the climate benets are taken into account. Energy saving renovation programmes developedin countries such as Germany, the UK and Austria have already proved the positive impact in terms o employment and private capital triggered. There are varied estimations about the positive employmentefects o energy saving renovation measures, stimulating direct employment in the construction andrelated industries rom the materials supply chain. Energy saving activities in buildings have a great
potential or catalysing the creation o indirect and induced jobs in education, research & innovation,energy services companies, waste management etc.
The political decision is the key actor in creating a avourable ramework or private investors. Strongcommitments with clear targets and ofering long term predictability are necessary to trigger a stepchange in renovation practices. EU Member States show signicant diferences in terms o commitments,nancial potential and market conditions.
Furthermore, there are signicant market rictions at Member State level: the landlord-tenant dilemma,multiple stakeholders and decision makers, conditionality in renovation o certain buildings (i.e. historicalbuildings etc.), diculties to access nancing or unattractive interest rates, harmul subsidies or energy
production and heating energy prices in some countries are just some o the barriers.
Energy savings and eciency in buildings represents an evolving market and despite the cost-efectivenesso most measures, the transaction costs can be high and pay-back periods are not always attractive orthe private residential sector. This may also raise issues o equity, as certain measures will arguably notbe afordable by poorer households. Immediate measures are necessary to eliminate these barriers bothat the EU level, by creating an appropriate ramework, and Member States level, by implementing bestpractice policies that can overcome the barriers on all relevant ronts.
The substantial renovation o the EU27 building stock is insuciently covered by the existing legislationand hence the sectorial potential or creating cost-efective energy savings, jobs, welare and economicgrowth is not properly exploited. To attract more private capital it is necessary to develop long-termrenovation programmes with clear targets and monitoring, providing appropriate nancial instrumentsand public nancial leverage. This is critical or the establishment o a long term market. Thereore, to havelong term programmes and associated nancing is a must or transorming deep renovation strategiesinto common practice.
It is necessary to create a stable, clear and simple legal ramework in order to ease the administrativeburdens or both private investors and house owners.
Despite the act that signicant developments have happened in recent years, current EU legislation onlypartially covers the eld o buildings renovation. More targeted measures are required or ostering the
7/29/2019 LR CbC Study
http://slidepdf.com/reader/full/lr-cbc-study 124/132
124 | Europe’s buildings under the microscope
62 Com(2011)370 nal. Proposal or a Directive on energy eciency repealing Directives 2006/32/EC and 2004/8/EC.
deep renovation o the existing building stock. The Energy Perormance o Buildings Directive stipulatesthe implementation o energy saving measures only in case o deep renovation o the building andwithout asking or a certain depth o renovation measures. Establishing cost-optimal levels or buildings
renovation should represent an important step orward in establishing minimum requirements or therenovation depths. The EPBD recast also asked EU Member States to draw up by the end o June 2011(and to update it every three years) a list o existing and proposed measures and instruments, includingnancial ones, which promote the EPBD’s objectives. However this requirement reers to the objectives o the EPBD recast which are not clearly speciying the need or a certain renovation speed or depth o theexisting building stock. It is thereore a strategic prerequisite that EU Member States implement the EPBDrecast in a way that stimulates deep renovation o the existing building stock.
As discussed in a previous chapter, at Member States level there are several ongoing programmes thatdirectly address the energy saving renovation o the building stock with more or less ambitious aims,comprising a large range o nancial instruments. None o them are demanding enough or deliveringthe cost-optimal potential and a lot o additional eforts are required.
Consequently, in order to address the challenge o renovating the existing building stock and to keep pacewith the ambitious aims o the European Union or reducing and decarbonising the energy consumptionand production, urther improvements o the EU and national rameworks are needed. Some suggestionsare presented on the next page.
ke eea a Eu ee
Policymeasures:• AtEUlevel,itisnecessarytostrengthentheexistinglegislationwithbindingmeasuresandtoestablish
a roadmap or the renovation o the EU27 building stock. The renovation roadmap has to be built on along term basis with binding targets or energy ecient retrot o the EU27 building stock by 2050. Arenovation roadmap must have a clear monitoring and reporting plan with interim targets indicatingthe renovation rates and the renovation depths to be reached gradually by 2020 and by 2030. Therenovation targets may be integrated in the National Energy Eciency Action Plans (NEEAPs) under theEnd-use Energy Eciency and Energy Services Directive (ESD, Directive (2006/32/EC), currently underrecast into an Energy Eciency Directive (EED)62.
• The EU legislation should call upon Member States to prepare detailed deep renovation plans
comprising regulatory, nancial, inormational and training measures. Having a predictable long-termdeep renovation roadmap will provide condence to the business sector and will avoid the risk o alling short ater 2020 and creating unwanted economic problems (such as employment distortions,additional costs etc.). To increase the cost-efectiveness o the renovation roadmap, renovation targets
can be built according to the nancial and technical national potential and support potential cooperationmechanisms between Member States. The holistic renovation approach must be encouraged in orderto increase the cost-efectiveness o the measures and to be in line with the provision o the EnergyPerormance o Buildings Directive. Tailor-made roadmaps can dene diferent phases which moverom voluntary to binding measures. The measures should be continuously evaluated and improvedwhereby the renovation requirements should be eventually tightened to meet nZEB standards.
• Theprocessof adoptingminimumenergysavingregulationsandenergy labellingforheatingand
cooling equipment and construction materials under the Energy Labelling and Eco-design o theenergy related products Framework Directives has to be strengthened and supported.
7/29/2019 LR CbC Study
http://slidepdf.com/reader/full/lr-cbc-study 125/132
Europe’s buildings under the microscope | 125
• Finally,theEUshouldsupporttheharmonisationofnationaldatacollectionsystemsconcerningthe
energy perormance o buildings, ensuring sucient high quality data availability and closing the gapin existing systems which were shown through this study (c.. Part 1). These data are needed to design
and implement properly working policies and incentive schemes that drive the necessary change inthe building sector.
Financin:• Ambitious renovationstrategiesarecost-eectivewhenconsideringthe fulllifecyclebuttheyalso
require signicant up ront investments. For boosting the deep renovation o the EU building stock the establishment o specic nancing instruments, i.e. an EU Deep Renovation Fund (possibly viathe European Investment Bank and designed or diferent building types) could be considered whichcomplements the national nancing schemes and shares the risks. The nancing should be given onlyor deep level renovations leading to very low energy standards. Such a und will ofer more nancialexibility and additional condence to private investors.
• EUexpenditurefortherenovationofthebuildingstock(i.e.byStructuralandRegionalDevelopmentFunds) should introduce the minimum requirement or implementing measures at cost-optimal levels(as will be dened under the EPBD recast). This would be in line with the requirement to “climate-proo the uture EU multi-annual nancial ramework 2014-2020” (a budget or Europe 2020) and to deliveron the principle that “through its operational programmes throughout the EU, cohesion policy has acrucial role to play in stepping up eforts to reach the 20% energy eciency target63”.
• In addition, the European Commission could facilitate the development of innovative nancial
instruments at Member State level by elaborating guidelines or nancing, by promoting bestpractice and by stimulating the cooperation between Member States or sharing experience andor implementing common measures and harmonised regulatory measures or deep renovation.Innovative nancing schemes should be designed to trigger increased private investment.
Traininandeducation:There is a strong need to increase the skills in the construction industry in Europe to ensure appropriateramework conditions or the Internal Market o construction products and services, improve resourceeciency and environmental perormances o construction enterprises, and promote skills, innovationand technological development to meet new societal needs and to mitigate climate risks. Hence theupcoming strategy or the sustainable competitiveness o the construction sector, which was planned tobe realised this year by the European Commission64, may provide a strong oundation or improving theknowledge level and the practice in renovation activities.
ke eea a e naa ee
Policymeasures:• National Governments should eliminate market barriers and administrative bottlenecks for the
renovation o the housing stock. Improving the energy eciency o buildings will generate signicanteconomic benets or society, including an important impact in terms o employment in the constructionindustry, the sector most afected by the economic downturn. Improving the energy perormance o buildings should be seen as a positive orce or economic recovery.
• Inordertofosterthedeeprenovationofthebuildingstock,MemberStatesshoulddeveloplong-term
comprehensive regulatory, nancial, educational and promotional packages addressing all the macro-
63 http://ec.europa.eu/budget/library/biblio/documents/n_wk1420/MFF_COM-2011-500_Part_II_en.pd .64 COM(2010) 614, An Integrated Industrial Policy or the Globalisation Era Putting Competitiveness and Sustainability at Centre Stage.
7/29/2019 LR CbC Study
http://slidepdf.com/reader/full/lr-cbc-study 126/132
126 | Europe’s buildings under the microscope
65 http://www.decc.gov.uk/assets/decc/legislation/energybill/1001-energy-bill-2011-brie-private-rented-sector.pd
economic benets. Important components o these programmes should be the aster identication andadoption o ambitious and yet cost-efective renovation levels, the gradual strengthening/introductiono related building code requirements and efective quality control and verication systems.
• Enforcingcompliancewithbuildingcodesandstandardswillbekeytocounteringtheperceptionthat
energy saving renovation measures come with a price premium. Proper monitoring o compliance,enorcement and quality control the process through a qualied workorce should be part o any policypackage to oster deep renovation. The relatively low compliance level in almost all the EU MemberStates is a signicant barrier in reaching the estimated energy savings potential.
• Thecondenceofconsumersandinvestorsintothequalitylevelofrenovationmeasuresmustbe(re-)
established, so that the readiness to make the necessary investment increases. Guarantee systems orthe perormance o eciency measures should be developed.
• Abetterimplementationofthebuildingsenergycerticationandauditschemesisneededasthese
schemes are important inormation and awareness tools which can increase the value o ecient
buildings and can stimulate the real estate market towards green investments.• Thepublicsectorhastotakealeadingroleintherenovationrevolution.Indeed,thisisenvisagedas
a requirement within the drat Energy Eciency Directive, where, rom 1 January 2014, public bodieswould be required to renovate at least 3% o their oor area each year to achieve at least the MemberState’s prevailing minimum energy perormance requirements. Such a measure would kick start themarket or renovation and help to bring down costs or private households and businesses.
• Energyservicescompanies(ESCOs)canplayanimportantroleinfosteringdeeprenovationprogrammes
by providing the necessary technical and nancial expertise and by triggering third party nancing.Hence, removing the market barriers acing ESCOs may acilitate a aster and better development o the renovation programmes. Regulatory rameworks should encourage the set-up and development o a well-unctioning energy services market, not limited to commercial buildings.
• Energysupply(anddistribution)companiesinanumberofEuropeancountrieshavespecicobligations
or delivering energy savings through their customers’ eciency, the so called Energy SavingsObligations or White certicates. The proposed Energy Eciency Directive (EED), i adopted, intendsto oblige all Member States to develop energy savings obligations or the energy companies. Theseschemes are expected to also include building renovation measures. However, it will be necessary toestablish minimum perormance requirements or the renovation measures to be implemented underenergy saving obligation schemes. Otherwise there is a risk o increasing the renovation speed but atshallow levels mainly and to endangering the sustainability o the savings.
• National regulation should beperiodicallydiscussedandreinforced andall themain stakeholders
should be involved in this process in the ramework o a national consultation platorm.
• Topersuadeconsumerstomakethenecessaryinvestments–bothagreaternumberthancurrentlywitnessed, but also a progressively deeper level o renovation, additional measures should beconsidered. Initiatives such as requiring the least ecient stock to be brought up to a higher energyperormance level beore a property can be sold would certainly begin to stimulate the market, butwould need to be coupled with easy orms o nancing. In the UK, the Energy Bill 2011 proposes thatrom April 2018 all private rented properties must be brought up to a minimum energy eciency ratingo ‘E’. This provision will make it unlawul to rent out a home or business premise that does not reachthis minimum standard – efectively banning the least ecient ‘F’ and ‘G’ properties65.
7/29/2019 LR CbC Study
http://slidepdf.com/reader/full/lr-cbc-study 127/132
Europe’s buildings under the microscope | 127
• A reliableandcontinuousdatacollection processofthemaincharacteristics ofthebuildingstock
is a necessary prerequisite or reliable policy making. As this survey has shown the levels o dataavailability and quality show drastic diferences between the EU Member States. In order to improve
the knowledge level and to be able to take efective measures to improve the energy perormanceo buildings, Member States should collaborate to implement a harmonised standard or collectingrelevant data about the European building stock.
Financing:• Thesuccessof deeprenovationprogrammeswill dependonthecreationof appropriatenancing
schemes, addressing all the categories o private and commercial real estate owners as well asintroducing measures using appropriate subsidies, low-interest and longer term loan schemes andother nancial incentive schemes.
• Financingpackagesshouldproposeappropriatemarketinstrumentstailoredtodierentneedsand
able to overcome the main market barriers. In addition, the renovation programmes should be based
on a preliminary macro-economic analysis in order to ensure the sustainability and durability o themeasure by integrating all the benets, by minimizing the costs, by securing the programme budgetand by proposing the most suitable market instruments. Moreover, the incentives should be oferedonly or a low-energy standard o the renovation, preerably based on ex-ante and ex-post evaluationo the energy perormance o the building.
• Aproperpublicnancingapproachmayleverageconsiderableprivatecapitalashasbeenprovenby
several successul programmes developed in some European countries. Attracting private capital toinvest in building renovation is a key issue o any nancing programme that aims to stimulate theeconomy and to transorm energy eciency measures into a sustainable business activity. Governmentsshould draw up a balance sheet which calculates the costs o efective deep renovation incentiveschemes against the increased tax revenue rom a signicant growth o the construction industry
(e.g. through VAT, income tax, corporate tax, etc.).• Relevantnational stakeholderneedto improvetheirknowledgeabout theuseoftheEUStructural
and Regional Funds and the EIB nancing lines or improving the energy perormance o the buildingsstock. Investing in buildings means investing in the development o society.
Traininandpromotionalactiities:• Forimplementingeectiveandgoodqualitydeeprenovationitisnecessarytoimprovetheskillsofthe
building proessionals at the level o both basic proessional education and long-lie learning activities.Thereore, training and educational activities should be developed both in the construction sector andin the supply chain industries.
• Promotionalanddisseminationactivitiesmustbeanimportantpartofthedeepbuildingrenovation
programmes. The German KW experience indicates that an important success actor is the creation o an energy eciency brand66, well known and perceived by the market.
• Awareness raisingandpromotionalactivities should addressthe psychologicalbarrierswhichexist
concerning deep renovation. A discussion about societal values needs to address behaviour changeto support investment decisions in avour o sustainability rather than investment decisions driven bysocial status actors, or by short term return considerations. Sot measures need to support a shit invalues which can speed up progress towards a more sustainable behaviour by all actors in the buildingsvalue chain.
66 G. Gumb. Suppor ting the energy ecient rehabilitation o the building stock – The German experience. Presentation at the BPIE’s European Round-table on nancing buildings retrot, Nov. 2010
7/29/2019 LR CbC Study
http://slidepdf.com/reader/full/lr-cbc-study 128/132
128 | Europe’s buildings under the microscope
c
As this report shows, the building sector can contribute signicantly to mitigating climate change whiledelivering many other societal benets. Political courage and will, innovative investment tools and societalawareness are key actors or transorming the sector. Existing EU policies have to be implemented ina best practice manner to achieve the intended energy savings, while new instruments are needed tostimulate a deep renovation wave across Europe and its Member States.
Good policy making requires good knowledge about the status quo o building perormance. BPIE’ssurvey has shown that data gaps exist which make it dicult to develop targeted programmes, to monitorpolicy implementation and to evaluate progress. The EU and its Member States should make signicanteforts to close these data gaps and to harmonize monitoring, reporting and evaluation.
All actors in the European value chain o buildings should grab the renovation opportunity to innovateproducts and services, to build a well-unctioning energy saving renovation market, to ofer attractive
solutions to private and commercial customers and to use their respective ingenuity to make highlyecient buildings a common standard o the European building stock.
Essentially, what is needed is nothing less than a European energy saving renovation revolution.
7/29/2019 LR CbC Study
http://slidepdf.com/reader/full/lr-cbc-study 129/132
Europe’s buildings under the microscope | 129
dEFinitions
Air-conditioninsystem: a combination o all components required to provide a orm o air treatmentin which temperature is controlled or can be lowered, possibly in combination with the control o ventilation, humidity and air cleanliness [EPBD, 2002/91/EC]
Boiler: the combined boiler body and burner-unit designed to transmit to water the heat released romcombustion [EPBD, 2002/91/EC]
Buildinenelope: integrated elements o a building which separate its interior rom the outdoorenvironment [IUPAC International Union o Pure and Applied Chemistry - Compendium o ChemicalTerminology 2nd Edition (1997)];
Combinedheatandpower(CHP): the simultaneous conversion o primary uels into mechanical or
electrical and thermal energy, meeting certain quality criteria o energy eciency [EPBD, 2002/91/EC]Commercialbuildin: A commercial building is a building that is used or commercial use. Types caninclude oce buildings, warehouses, or retail (i.e. convenience stores, ‘big box’ stores, shopping malls, etc.)
Cost-optimalleel: Cost-optimal level means the energy perormance level which leads to the lowestcost during the estimated economic liecycle [EPBD, recast, 2010/31/EC]
Deriedheat:Derived heat covers the total heat production in heating plants and in combined heat andpower plants. It includes the heat used by the auxiliaries o the installation which use hot uid (spaceheating, liquid uel heating, etc.) and losses in the installation/network heat exchanges. For autoproducingentities (= entities generating electricity and/or heat wholly or partially or their own use as an activitywhich supports their primary activity) the heat used by the undertaking or its own processes is not
included. [Eurostat denition]Districtheatin/coolin: means the distribution o thermal energy in the orm o steam, hot water orchilled liquids, rom a central source o production through a network to multiple buildings or sites, orthe use o space or process heating or cooling [EPBD, 2010/31/EC]
Eneryaudit: a systematic procedure to obtain adequate knowledge o the existing energy consumptionprole o a building or group o buildings, o an industrial operation and/or installation or o a private orpublic service, identiy and quantiy cost-efective energy savings opportunities, and report the ndings[ESD, 2006/32/EC]
Eneryconsumption:The amount o energy consumed in the orm in which it is acquired by the user.The term excludes electrical generation and distribution losses.
Enery performance certicate: a certicate recognised by the Member State or a legal persondesignated by it, which includes the energy perormance o a building calculated according to amethodology based on the general ramework set out in the Annex o Directive 2002/91/EC [EPBD,2002/91/EC]
Eneryperformanceofabuildin: the amount o energy actually consumed or estimated to meet thediferent needs associated with a standardised use o the building, which may include, inter alia, heating,hot water heating, cooling, ventilation and lighting. This amount shall be reected in one or morenumeric indicators which have been calculated, taking into account insulation, technical and installationcharacteristics, design and positioning in relation to climatic aspects, solar exposure and inuence o neighbouring structures, own-energy generation and other actors, including indoor climate, thatinuence the energy demand [EPBD, 2002/91/EC]
7/29/2019 LR CbC Study
http://slidepdf.com/reader/full/lr-cbc-study 130/132
130 | Europe’s buildings under the microscope
Eneryperformancerequirement:minimum level o energy perormance that is to be achieved toobtain a right or an advantage: e.g. right to build, lower interest rate, quality label [CEN standard - En15217 “Energy perormance o buildings – “methods or expressing energy perormance and or the
energy certication o buildings”]Enerysericecompany(ESCO): a natural or legal person that delivers energy services and/or otherenergy eciency improvement measures in a user’s acility or premises, and accepts some degree o nancial risk in so doing. The payment or the services delivered is based (either wholly or in part) on theachievement o energy eciency improvements and on the meeting o the other agreed perormancecriteria [ESD, 2006/32/EC]
Finalenery: Energy supplied that is available to the consumer to be converted into useul energy (e.g.electricity at the wall outlet). (Intergovernmental Panel on Climate Change, IPCC)
grossoorarea:The total area o all the oors o a building, including intermediately oored tiers,mezzanine, basements, etc., as measured rom the exterior suraces o the outside walls o the building
Heatpump:a device or installation that extracts heat at low temperature rom air, water or earth andsupplies the heat to the building [EPBD, 2002/91/EC]
Internalrossarea: A term used in the United Kingdom, dened in the RICS Standard, or the area o abuilding measured to the internal ace o perimeter walls at each oor level
Internalrateofreturn(IRR): A rate at which the accounting value o a security is equal to the presentvalue o the uture cash ow. [European Central Bank]
Liinoorspace/area: total area o rooms alling under the concept o rooms [OECD Glossary o statistical terms]
Nearly zero enerybuildin:a building that has very high energy perormance, as determined inaccordance with Annex I o the EPBD recast. The nearly zero or very low amount o energy required
should be covered to a very signicant extent by energy rom renewable sources, including energy romrenewable sources produced on-site or nearby [EPBD recast, 2010/31/EC]
Netoorarea:A term used in the ISO standard to express the Interior Gross Area less the areas o allinterior walls
Netpresentalue: The net present value (NPV) is a standard method or the nancial assessment o long-term projects. It measures the excess or shortall o cash ows, calculated at their present value atthe start o the project
Paybacktime: the length o time required to recover the cost o an investment
Primaryenery: Energy rom renewable and non-renewable sources which has not undergone anyconversion or transormation process
Publicbuildin:building owned or occupied by any public body
Reulatedenery:energy used in the home or heating, cooling, hot water and lighting
Residentialbuildin: A structure used primarily as a dwelling or one or more households. Residentialbuildings include single-amily houses (detached houses, semi-detached houses, terraced houses (oralternatively row houses) and multi-amily houses (or apartment blocks) which includes apartments/ats
Third-partynancin:a contractual arrangement involving a third party — in addition to the energysupplier and the beneciary o the energy eciency improvement measure — that provides the capitalor that measure and charges the beneciary a ee equivalent to a part o the energy savings achievedas a result o the energy eciency improvement measure. That third party may or may not be an ESCO[ESD, 2006/32/EC]
7/29/2019 LR CbC Study
http://slidepdf.com/reader/full/lr-cbc-study 131/132
Europe’s buildings under the microscope | 131
U-value: is the measure o the rate o heat loss through a material. Thus in all aspects o home designone should strive or the lowest U-Values possible because the lower the U-value – the less heat that isneedlessly escaping. The calculation o U-values can be rather complex - it is measured as the amount o
heat lost through a one square meter o the material or every degree diference in temperature eitherside o the material. It is indicated in units o Watts per meter Squared per Degree Kelvin or W/m2 [IrishEnergy Centre - Funded by the Government under the national Development Plan with programmespartly nanced by the European Union.]
Usefuloorspace/area:oor space o dwellings measured inside the outer walls, excluding cellars, non-habitable attics and, in multi-dwelling houses, common areas [OECD Glossary o statistical terms];
Whitecerticates:certicates issued by independent certiying bodies conrming the energy savingsclaims o market actors as a consequence o energy eciency improvement measures [ESD, 2006/32/EC]

7/29/2019 LR CbC Study
http://slidepdf.com/reader/full/lr-cbc-study 132/132