INSURANCE AUSTRALIA GROUP LIMITED ABN 60 090 … · Insurance Australia Group Limited - ABN 60 090...
49
Insurance Australia Group Limited - ABN 60 090 739 923 1 INSURANCE AUSTRALIA GROUP LIMITED ABN 60 090 739 923 Directory Stock Exchange Listings Australian Stock Exchange Limited ASX code for ordinary shares: IAG ASX codes for reset preference shares: IAGPA (Listed June 2002) and IAGPB (Listed June 2003) ASX code for Reset Exchangeable Securities: IANG (Listed January 2005) Investor Information/Administration Computershare Investor Services Pty Limited 452 Johnston Street, Abbotsford VIC 3067 Or by mail to GPO Box 4709 Melbourne VIC 3001 Telephone: 1300 360 688 Email: [email protected] Facsimile: (03) 9473 2470 Website: www.iag.com.au Investor Relations Email: [email protected] Ms Anne O’Driscoll Group Company Secretary & Head of Investor Relations Telephone: (02) 9292 3169 Facsimile: (02) 9292 3109 Email: anne.o’[email protected] Registered Office Insurance Australia Group Limited Level 26, 388 George Street SYDNEY NSW 2000 Telephone: (02) 9292 9222 Key dates for shareholders - proposed Interim dividend – ordinary shares - Ex-dividend date 10 March 2005 - Record date 16 March 2005 - Payment date 18 April 2005 Half-yearly reset preference shares dividends due 15 June 2005 Announcement of annual results to 30 June 2005 19 August 2005 Final dividend – ordinary shares - Ex-dividend date - Record date - Payment date Annual General Meeting Half-yearly reset preference shares dividends due Announcement of half year results - 31 December 2005 8 September 2005 14 September 2005 17 October 2005 9 November 2005 15 December 2005 23 February 2006
Transcript of INSURANCE AUSTRALIA GROUP LIMITED ABN 60 090 … · Insurance Australia Group Limited - ABN 60 090...
Insurance Australia Group Limited - ABN 60 090 739 923 1
IINNSSUURRAANNCCEE AAUUSSTTRRAALLIIAA GGRROOUUPP LLIIMMIITTEEDD
AABBNN 6600 009900 773399 992233
DDiirreeccttoorryy
Stock Exchange Listings Australian Stock Exchange Limited ASX code for ordinary shares: IAG ASX codes for reset preference shares: IAGPA (Listed June 2002) and IAGPB (Listed June 2003) ASX code for Reset Exchangeable Securities: IANG (Listed January 2005) Investor Information/Administration Computershare Investor Services Pty Limited 452 Johnston Street, Abbotsford VIC 3067 Or by mail to GPO Box 4709 Melbourne VIC 3001 Telephone: 1300 360 688 Email: [email protected] Facsimile: (03) 9473 2470 Website: www.iag.com.au Investor Relations Email: [email protected] Ms Anne O’Driscoll Group Company Secretary & Head of Investor Relations Telephone: (02) 9292 3169 Facsimile: (02) 9292 3109 Email: anne.o’[email protected] Registered Office Insurance Australia Group Limited Level 26, 388 George Street SYDNEY NSW 2000 Telephone: (02) 9292 9222 KKeeyy ddaatteess ffoorr sshhaarreehhoollddeerrss -- pprrooppoosseedd Interim dividend – ordinary shares - Ex-dividend date 10 March 2005 - Record date 16 March 2005 - Payment date 18 April 2005 Half-yearly reset preference shares dividends due 15 June 2005 Announcement of annual results to 30 June 2005 19 August 2005 Final dividend – ordinary shares - Ex-dividend date - Record date - Payment date Annual General Meeting Half-yearly reset preference shares dividends due Announcement of half year results - 31 December 2005
8 September 2005 14 September 2005 17 October 2005 9 November 2005 15 December 2005 23 February 2006
Insurance Australia Group Limited - ABN 60 090 739 923 2
CONTENTS
Introduction........................................................................................................................................ 4
Half Year Results ............................................................................................................................. 5
A. Key Elements of Results ......................................................................................................... 6
B. Group Insurance Ratios .......................................................................................................... 8
C. Results by Business Area ..................................................................................................... 10
Australian Personal Lines............................................................................................................... 11
A. Operational Results ............................................................................................................... 11
B. Short-tail Personal Lines ....................................................................................................... 12
B.1 Premiums and Market Share............................................................................................... 12
B.2 Customer focus ................................................................................................................... 13
B.3 Operating improvements including claims ........................................................................... 14
C. Long-tail Personal Lines .......................................................................................................... 15
C.1 Compulsory Third Party....................................................................................................... 15
C.1.1 CTP – New South Wales.......................................................................................... 16 C.1.2 CTP – Australian Capital Territory ............................................................................. 17 C.1.3 CTP - Queensland ................................................................................................. 17
Australian Commercial Lines ......................................................................................................... 18
A. Operational Results .................................................................................................................. 18
B. Operations and Customers ................................................................................................... 20
B.1 Process improvements........................................................................................................ 20
B.2 Product and distribution development ................................................................................. 20
B.3 Outlook................................................................................................................................ 20
C. Fee based businesses/managed schemes.............................................................................. 21
D. Inwards Reinsurance run-off.................................................................................................... 21
International General Insurance ..................................................................................................... 22
A. International – New Zealand and Captive ................................................................................. 23
B. International – Asian Operations............................................................................................... 25
Financial Services ........................................................................................................................... 25
Investments...................................................................................................................................... 26
A. Investment Performance........................................................................................................... 26
B. Asset Class Exposure............................................................................................................... 27
C. Strategic Asset Allocation ........................................................................................................ 27
C.1 Shareholders’ funds.......................................................................................................... 27
C.2 Technical reserves funds.................................................................................................. 28
D. Group Assets Under Management ........................................................................................... 28
D.1 Credit quality of assets under management ........................................................................ 29
Insurance Australia Group Limited - ABN 60 090 739 923 3
Corporate ......................................................................................................................................... 30
A. Corporate.................................................................................................................................. 30
B. Changes In Financial Legislative Requirements ....................................................................... 30
B.1 International accounting standards...................................................................................... 30
B.2 Tax consolidation ................................................................................................................ 30
B.3 Licence consolidation .......................................................................................................... 30
C. Information Systems................................................................................................................. 31
C.1 Integration ........................................................................................................................... 31
C.2 Technology infrastructure upgrade...................................................................................... 31
C.3 New technology for CGU brokers........................................................................................ 32
C.4 New technology for NZ personal lines................................................................................. 32
Financial Position, Dividends and Capital ..................................................................................... 33
A. Statement of Financial Position................................................................................................. 33
B. Capital Management................................................................................................................. 34
B.1 Capital adequacy/MCR ....................................................................................................... 34
B.2 Target capital mix ............................................................................................................... 35
B.3 Total capitalisation and debt as at 31 December 2004 ........................................................ 36
B.4 Reset Exchangeable Securities (RES) .............................................................................. 37
B.5 Reinsurance ...................................................................................................................... 38
C. Dividends................................................................................................................................ 38
C.1 Dividend policy and distributable earnings ......................................................................... 38
C.2 Dividend on ordinary shares............................................................................................... 38
D. Return on equity ....................................................................................................................... 39
E. Sensitivity analysis.................................................................................................................. 40
E.1 Investment market sensitivities........................................................................................... 40
E.2 Operational sensitivities..................................................................................................... 40
Appendix A – Strategy..................................................................................................................... 41
A.1 Top quartile shareholder return .......................................................................................... 41
A.2 ROE of at least 1.5 times WACC........................................................................................ 41
A.3 Establish an Asian foothold ................................................................................................ 41
A.4 Maintain an 80:20 mix of short-tail:long-tail premiums........................................................ 42
A.5 Maintain a 'AA' category rating ........................................................................................... 42
Appendix B - Key ASX Releases .................................................................................................... 43
A. Performance of IAG ordinary share price relative to benchmark indices ............................... 47
B. Spread to Swap performance of Reset Preference shares ................................................... 47
& Subordinated Debt...................................................................................................................... 47
C. Ordinary Shareholders (IAG) as at 31 December 2004......................................................... 48
D. Reset Preference (IAGPA) Shareholders as at 31 December 2004...................................... 48
E. Reset Preference (IAGPB) Shareholders as at 31 December 2004...................................... 49
Insurance Australia Group Limited - ABN 60 090 739 923 4
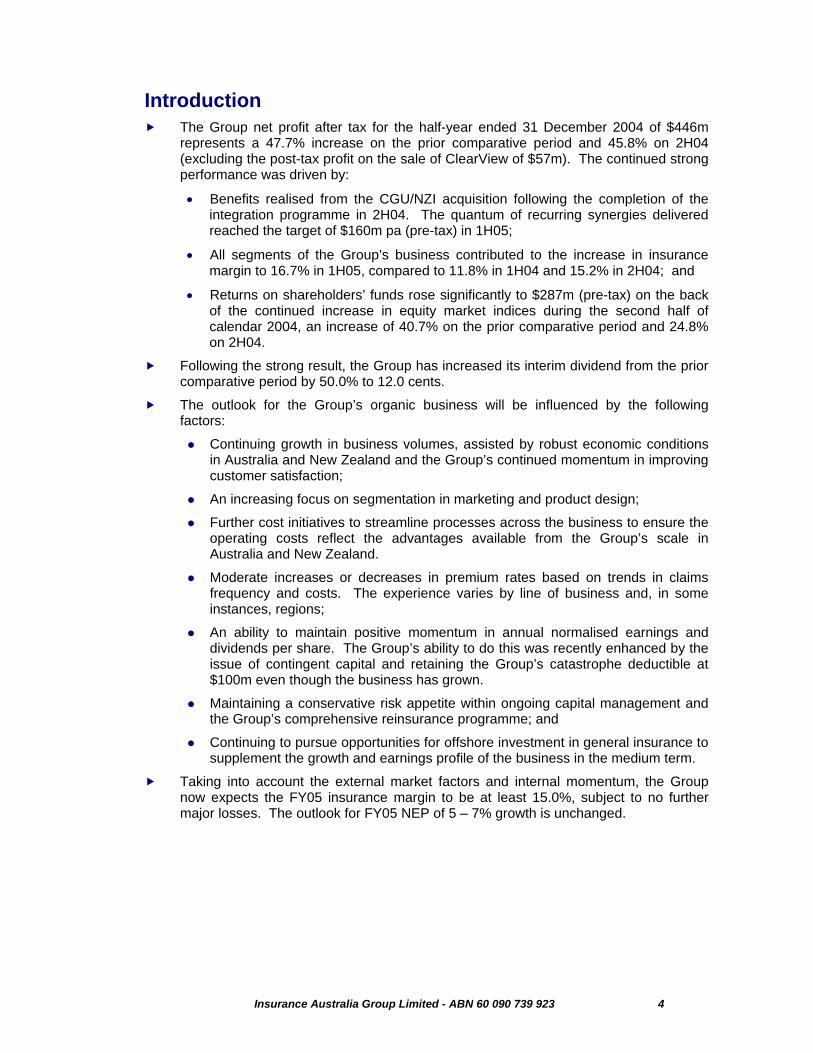
Introduction The Group net profit after tax for the half-year ended 31 December 2004 of $446m
represents a 47.7% increase on the prior comparative period and 45.8% on 2H04 (excluding the post-tax profit on the sale of ClearView of $57m). The continued strong performance was driven by:
• Benefits realised from the CGU/NZI acquisition following the completion of the integration programme in 2H04. The quantum of recurring synergies delivered reached the target of $160m pa (pre-tax) in 1H05;
• All segments of the Group’s business contributed to the increase in insurance margin to 16.7% in 1H05, compared to 11.8% in 1H04 and 15.2% in 2H04; and
• Returns on shareholders’ funds rose significantly to $287m (pre-tax) on the back of the continued increase in equity market indices during the second half of calendar 2004, an increase of 40.7% on the prior comparative period and 24.8% on 2H04.
Following the strong result, the Group has increased its interim dividend from the prior comparative period by 50.0% to 12.0 cents.
The outlook for the Group’s organic business will be influenced by the following factors:
Continuing growth in business volumes, assisted by robust economic conditions in Australia and New Zealand and the Group’s continued momentum in improving customer satisfaction;
An increasing focus on segmentation in marketing and product design;
Further cost initiatives to streamline processes across the business to ensure the operating costs reflect the advantages available from the Group’s scale in Australia and New Zealand.
Moderate increases or decreases in premium rates based on trends in claims frequency and costs. The experience varies by line of business and, in some instances, regions;
An ability to maintain positive momentum in annual normalised earnings and dividends per share. The Group’s ability to do this was recently enhanced by the issue of contingent capital and retaining the Group’s catastrophe deductible at $100m even though the business has grown.
Maintaining a conservative risk appetite within ongoing capital management and the Group’s comprehensive reinsurance programme; and
Continuing to pursue opportunities for offshore investment in general insurance to supplement the growth and earnings profile of the business in the medium term.
Taking into account the external market factors and internal momentum, the Group now expects the FY05 insurance margin to be at least 15.0%, subject to no further major losses. The outlook for FY05 NEP of 5 – 7% growth is unchanged.
Insurance Australia Group Limited - ABN 60 090 739 923 5
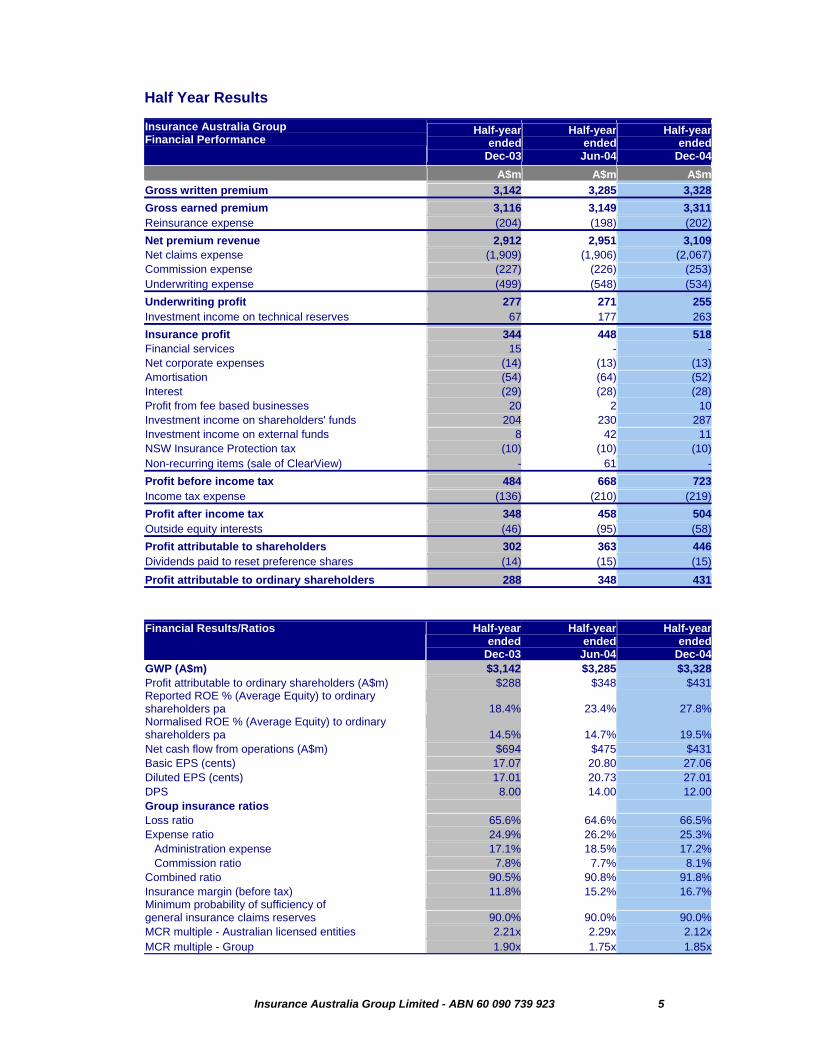
Half Year Results
Insurance Australia Group Financial Performance
Half-yearended
Dec-03
Half-year ended Jun-04
Half-yearended
Dec-04 A$m A$m A$m
Gross written premium 3,142 3,285 3,328 Gross earned premium 3,116 3,149 3,311 Reinsurance expense (204) (198) (202)Net premium revenue 2,912 2,951 3,109 Net claims expense (1,909) (1,906) (2,067)Commission expense (227) (226) (253)Underwriting expense (499) (548) (534)Underwriting profit 277 271 255 Investment income on technical reserves 67 177 263 Insurance profit 344 448 518 Financial services 15 - -Net corporate expenses (14) (13) (13)Amortisation (54) (64) (52)Interest (29) (28) (28)Profit from fee based businesses 20 2 10 Investment income on shareholders' funds 204 230 287 Investment income on external funds 8 42 11 NSW Insurance Protection tax (10) (10) (10)Non-recurring items (sale of ClearView) - 61 -Profit before income tax 484 668 723 Income tax expense (136) (210) (219)Profit after income tax 348 458 504 Outside equity interests (46) (95) (58)Profit attributable to shareholders 302 363 446 Dividends paid to reset preference shares (14) (15) (15)Profit attributable to ordinary shareholders 288 348 431 Financial Results/Ratios Half-year
endedDec-03
Half-year ended Jun-04
Half-yearended
Dec-04GWP (A$m) $3,142 $3,285 $3,328Profit attributable to ordinary shareholders (A$m) $288 $348 $431Reported ROE % (Average Equity) to ordinary shareholders pa 18.4% 23.4% 27.8%Normalised ROE % (Average Equity) to ordinary shareholders pa 14.5% 14.7% 19.5%Net cash flow from operations (A$m) $694 $475 $431Basic EPS (cents) 17.07 20.80 27.06Diluted EPS (cents) 17.01 20.73 27.01DPS 8.00 14.00 12.00Group insurance ratios Loss ratio 65.6% 64.6% 66.5%Expense ratio 24.9% 26.2% 25.3% Administration expense 17.1% 18.5% 17.2% Commission ratio 7.8% 7.7% 8.1%Combined ratio 90.5% 90.8% 91.8%Insurance margin (before tax) 11.8% 15.2% 16.7%Minimum probability of sufficiency of general insurance claims reserves 90.0% 90.0% 90.0%MCR multiple - Australian licensed entities 2.21x 2.29x 2.12xMCR multiple - Group 1.90x 1.75x 1.85x
Insurance Australia Group Limited - ABN 60 090 739 923 6
A. Key Elements of Results
The Group delivered a net profit after tax attributable to ordinary shareholders of $431m, representing an increase of 49.7% on the prior comparative period (1H04) and 23.5% on 2H04, or 47.6% excluding the post-tax profit from sale of ClearView business of $57m in 2H04.
The Group achieved organic growth in gross written premium (GWP) in 1H05 of 5.9% to $3,328m relative to 1H04, and 1.3% compared to 2H04. The lower growth compared to 2H04 includes the effect of the seasonality within the Commercial business (representing around 25% of the Group’s GWP) where renewals are skewed to the second half of the financial year.
Net earned premium (NEP) grew by 6.8% on 1H04 and 5.4% on 2H04. This level of growth is consistent with the Group’s guidance of 5 – 7% for FY05. Growth in NEP was exhibited in all business units within the Group:
• Australian personal lines business grew by 5.4% on 1H04 and 3.4% on 2H04;
• Australian commercial business grew by 9.8% on 2H04 and 6.1% compared to 1H04; and
• The reported growth of the international business includes benefits from exchange rate movements in the New Zealand business. NEP in the New Zealand business grew by 10.5% (4.7% in NZD) on 1H04 and 6.9% (1.3% in NZD) on 2H04.
Whilst the decrease in bond yields during 1H05 had a positive impact on investment income on technical reserves returns, this effect was immunised by the negative impact on claims reserves of $65m or 2.1% on the combined ratio. Excluding the impact of these interest rate adjustments, which in 2H04 had a positive impact of $25m (or 0.8%) and in 1H04 of $98m (or 3.3%), the combined ratio for 1H05 of 89.7% reflects an underlying improvement in the Group’s underwriting business over the past two half-year periods.
The improvement in the combined ratio was largely driven by the loss ratio, which benefited from:
• Synergies derived from the integration of CGU/NZI in claims management and processes; and
• Reserve releases from key long-tail portfolios as a result of continued stability in the NSW CTP scheme and to reflect better than anticipated loss experience in the current liability business. These beneficial adjustments were partly offset by reserve increases for workers’ compensation and product liability claims, largely in respect of prior periods.
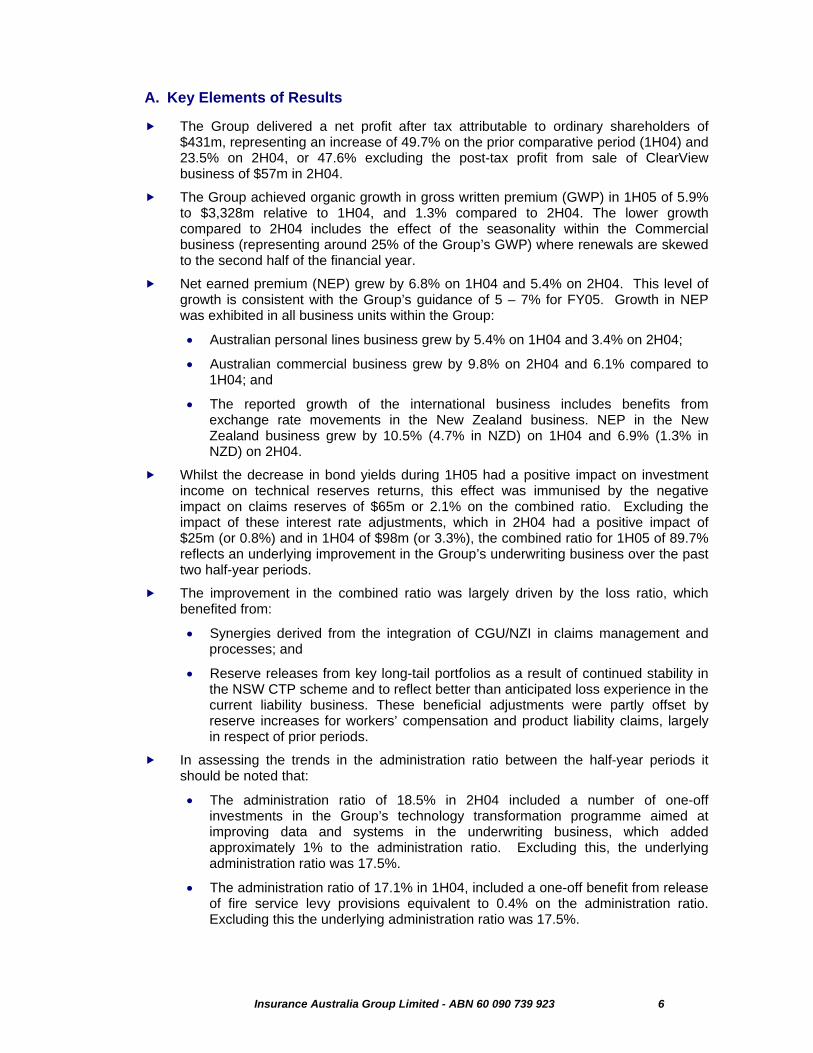
In assessing the trends in the administration ratio between the half-year periods it should be noted that:
• The administration ratio of 18.5% in 2H04 included a number of one-off investments in the Group’s technology transformation programme aimed at improving data and systems in the underwriting business, which added approximately 1% to the administration ratio. Excluding this, the underlying administration ratio was 17.5%.
• The administration ratio of 17.1% in 1H04, included a one-off benefit from release of fire service levy provisions equivalent to 0.4% on the administration ratio. Excluding this the underlying administration ratio was 17.5%.
Insurance Australia Group Limited - ABN 60 090 739 923 7
Considering the above, the administration ratio of 17.2% for 1H05 is largely in-line with prior periods. Excluding the fire service levy component of the administration ratio, the underlying expense ratio for the period was 14.8% compared with 15.5% in 1H04 and 15.7% in 2H04.
The strong momentum of the business following the integration of CGU/NZI business continues to produce improvements in the insurance margin. The 1H05 margin of 16.7% includes a full six months of the $160m annual recurring synergy benefits, compared to $8m and $10m of net benefits in 1H04 and 2H04, respectively.
The Australian personal lines business continues to be the largest contributor to the Group’s insurance result with an insurance margin of 18.1% in 1H05. The sustained improvement in the personal lines business continues to be supported by the Group’s focus on customer service to support ongoing high retention rates and continuous improvement in, and utilisation of, its claim management models to drive competitive supply chain costs.
The Australian commercial lines margin was 11.4% compared to 9.6% in both 1H04 and 2H04. This reflected good operating conditions and limited impact to date of market rate reductions on earned income. The improvement in margins for this business was achieved even after absorbing a net reserve increase of $37m.
The international business produced a significant improvement in margins, with no major losses in 1H05. The insurance margin in 1H05 of 19.0% was a substantial improvement on 3.0% in 1H04 and 11.8% in 2H04.
The equity market performance in 1H05 underpinned the investment returns on shareholders’ funds of $287m, representing a 23.4% annualised return and the highest returns achieved by the Group since listing.
The fee-based business result of $10m is not comparable on a half-year basis due to the timing of some payments within this business. The major component of fee-based business is the management of the non-risk workers’ compensation schemes (underwritten by various State governments) where the timing of the assessment and notification of performance fees drives volatility in the results between the halves. Performance fees received during 1H05 were less than the prior year.
Prior to 1H05, the results from the China Automobile Association (CAA) business were negligible and were recognised within investment returns. Given the Group’s intention to expand this business, the Group will now include the results from its CAA business on the Group’s profit and loss. The 1H05 loss of $2m reflects the Group’s investment in expanding this business and was in accordance with expectations.
The effective tax rate for 1H05 of 30.3% compares with 28.1% in 1H04 and 31.4% in 2H04. The varying tax rates between the half-years resulted from a number of one-off impacts in the prior two halves including:
• Favourable adjustment of $22m arising from adoption of tax consolidation in 1H04, of which $9m was reversed in 2H04 following further review;
• Unfavourable prior year adjustments in 2H04 of $17m to tax provisions and deferred tax assets relating to legacy issues in CGU; and
On a ‘cash’ basis, i.e. excluding amortisation and one-off impacts, the tax rate is 28.3% in 1H05, and compares with 25.2% in 2H04 and 29.4% in 1H04.
Insurance Australia Group Limited - ABN 60 090 739 923 8
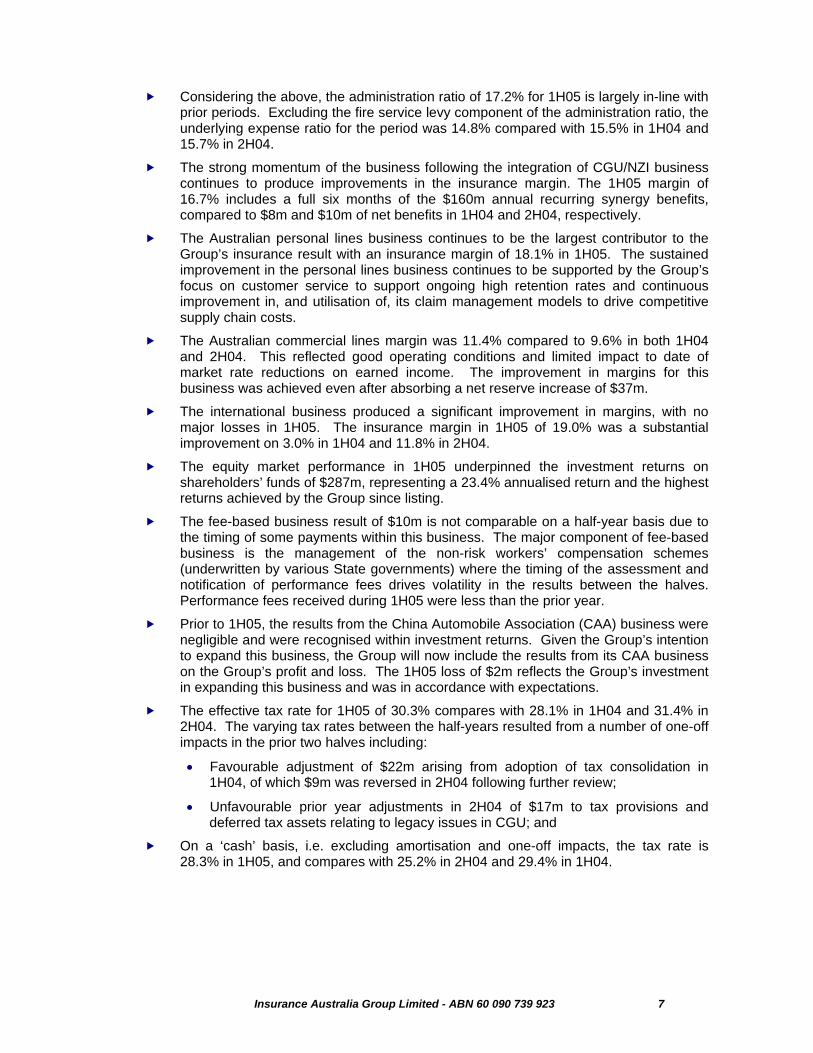
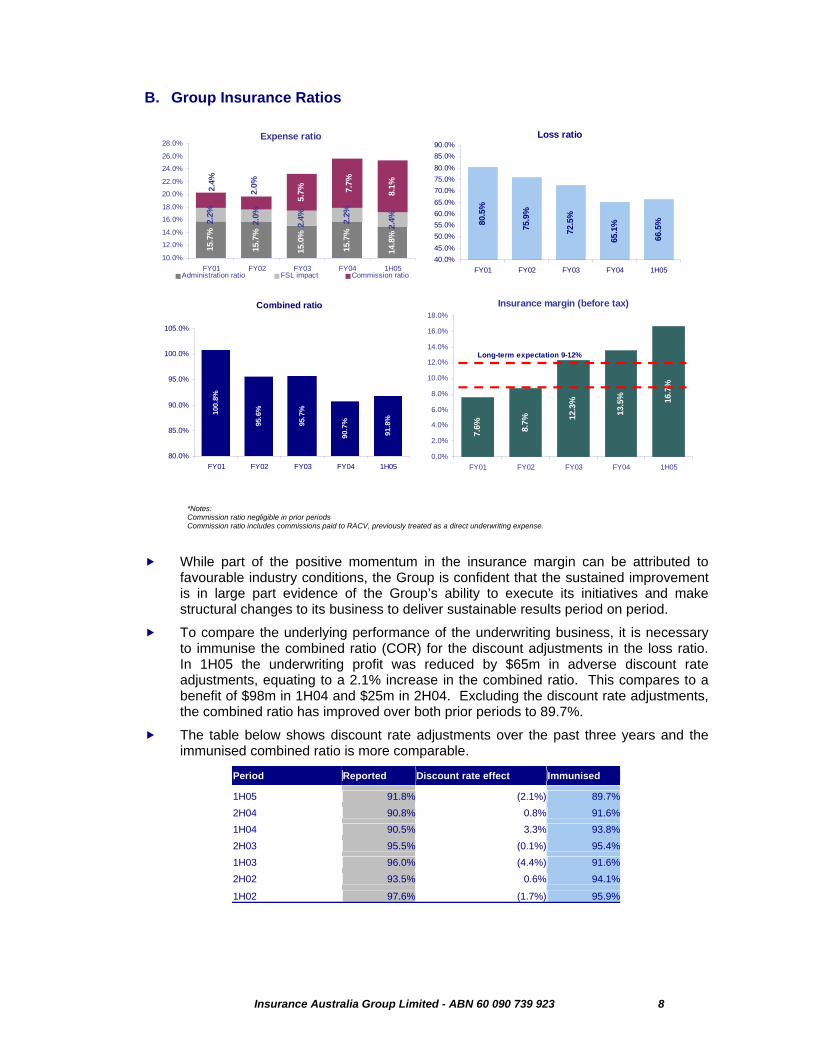
B. Group Insurance Ratios
*Notes: Commission ratio negligible in prior periods Commission ratio includes commissions paid to RACV, previously treated as a direct underwriting expense.
While part of the positive momentum in the insurance margin can be attributed to favourable industry conditions, the Group is confident that the sustained improvement is in large part evidence of the Group’s ability to execute its initiatives and make structural changes to its business to deliver sustainable results period on period.
To compare the underlying performance of the underwriting business, it is necessary to immunise the combined ratio (COR) for the discount adjustments in the loss ratio. In 1H05 the underwriting profit was reduced by $65m in adverse discount rate adjustments, equating to a 2.1% increase in the combined ratio. This compares to a benefit of $98m in 1H04 and $25m in 2H04. Excluding the discount rate adjustments, the combined ratio has improved over both prior periods to 89.7%.
The table below shows discount rate adjustments over the past three years and the immunised combined ratio is more comparable.
Period Reported Discount rate effect Immunised
1H05 91.8% (2.1%) 89.7%2H04 90.8% 0.8% 91.6%1H04 90.5% 3.3% 93.8%2H03 95.5% (0.1%) 95.4%1H03 96.0% (4.4%) 91.6%2H02 93.5% 0.6% 94.1%
1H02 97.6% (1.7%) 95.9%
Expense ratio
15.7
%
15.0
%
15.7
%
14.8
%
2.2%
2.4%
15.7
%
2.2%
2.0%
2.4%
8.1%7.7%
5.7%2.
0%2.4%
10.0%
12.0%
14.0%
16.0%
18.0%
20.0%
22.0%
24.0%
26.0%
28.0%
FY01 FY02 FY03 FY04 1H05Administration ratio FSL impact Commission ratio
Loss ratio
80.5
%
75.9
%
72.5
%
65.1
%
66.5
%
40.0%45.0%50.0%55.0%60.0%65.0%70.0%75.0%80.0%85.0%90.0%
FY01 FY02 FY03 FY04 1H05
Combined ratio
100.
8%
95.6
%
95.7
%
90.7
%
91.8
%
80.0%
85.0%
90.0%
95.0%
100.0%
105.0%
FY01 FY02 FY03 FY04 1H057.
6%
12.3
% 16.7
%
8.7%
13.5
%
0.0%
2.0%
4.0%
6.0%
8.0%
10.0%
12.0%
14.0%
16.0%
18.0%
FY01 FY02 FY03 FY04 1H05
Insurance margin (before tax)
Long-term expectation 9-12%
Insurance Australia Group Limited - ABN 60 090 739 923 9
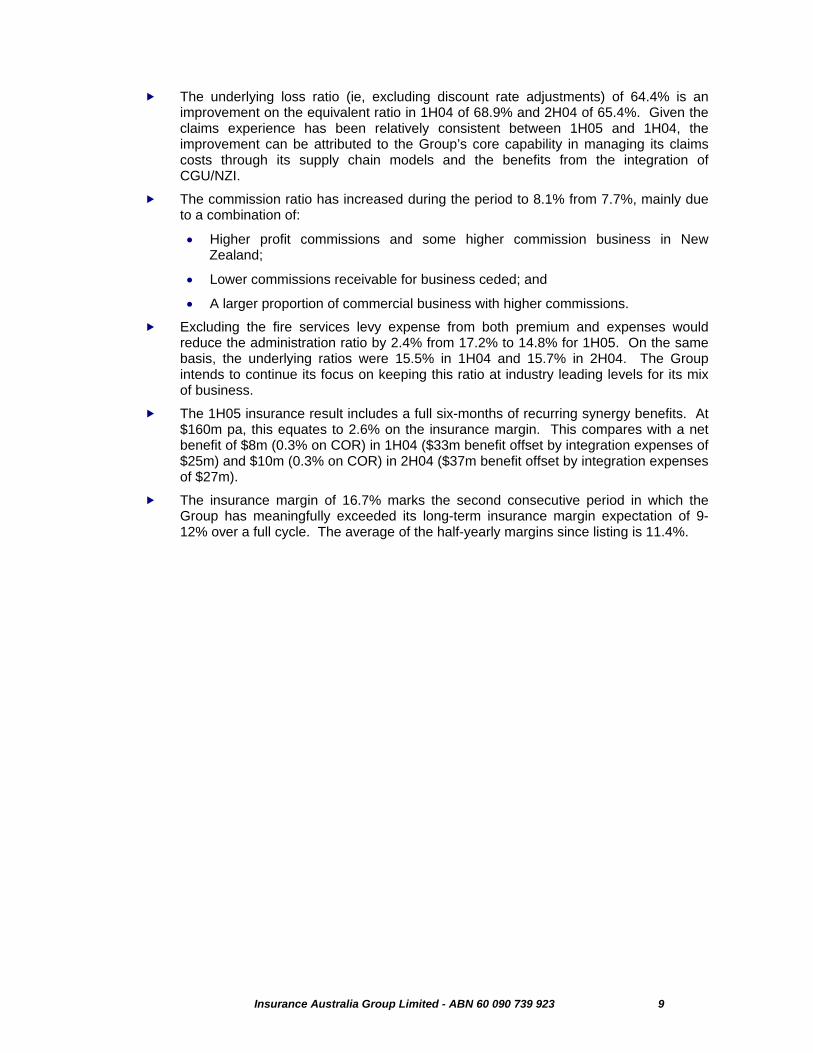
The underlying loss ratio (ie, excluding discount rate adjustments) of 64.4% is an improvement on the equivalent ratio in 1H04 of 68.9% and 2H04 of 65.4%. Given the claims experience has been relatively consistent between 1H05 and 1H04, the improvement can be attributed to the Group’s core capability in managing its claims costs through its supply chain models and the benefits from the integration of CGU/NZI.
The commission ratio has increased during the period to 8.1% from 7.7%, mainly due to a combination of:
• Higher profit commissions and some higher commission business in New Zealand;
• Lower commissions receivable for business ceded; and
• A larger proportion of commercial business with higher commissions.
Excluding the fire services levy expense from both premium and expenses would reduce the administration ratio by 2.4% from 17.2% to 14.8% for 1H05. On the same basis, the underlying ratios were 15.5% in 1H04 and 15.7% in 2H04. The Group intends to continue its focus on keeping this ratio at industry leading levels for its mix of business.
The 1H05 insurance result includes a full six-months of recurring synergy benefits. At $160m pa, this equates to 2.6% on the insurance margin. This compares with a net benefit of $8m (0.3% on COR) in 1H04 ($33m benefit offset by integration expenses of $25m) and $10m (0.3% on COR) in 2H04 ($37m benefit offset by integration expenses of $27m).
The insurance margin of 16.7% marks the second consecutive period in which the Group has meaningfully exceeded its long-term insurance margin expectation of 9-12% over a full cycle. The average of the half-yearly margins since listing is 11.4%.
Insurance Australia Group Limited - ABN 60 090 739 923 10
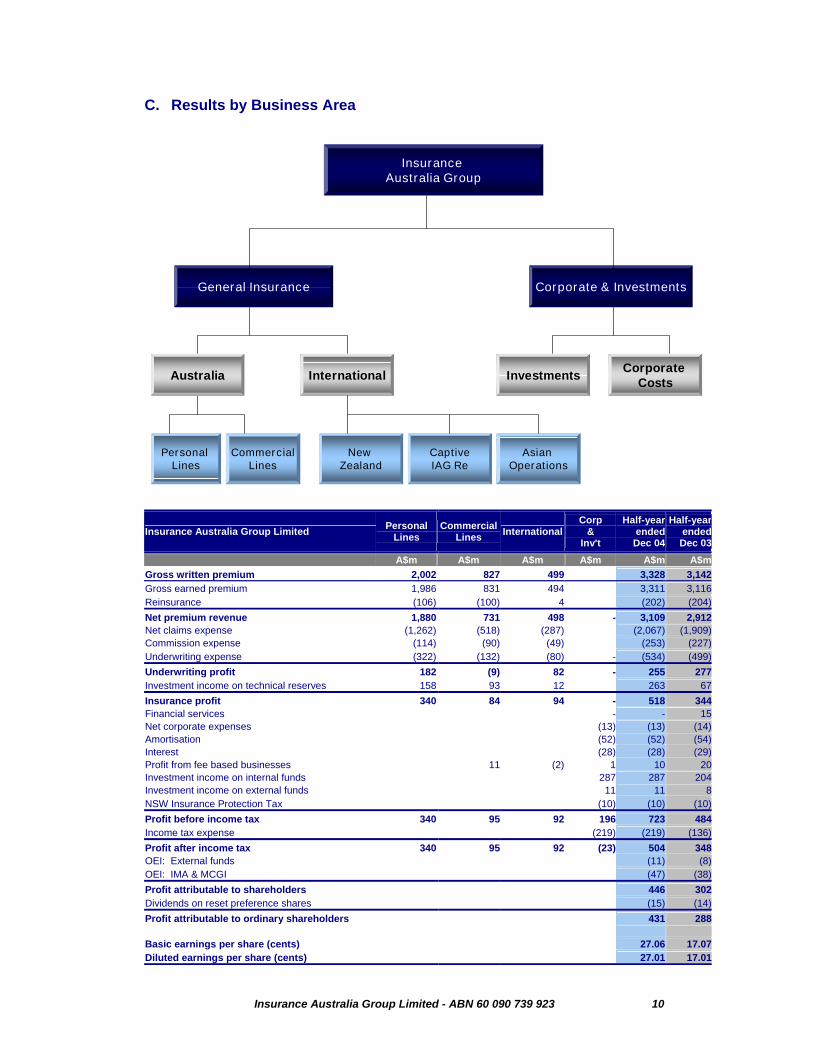
C. Results by Business Area
Insurance Australia Group
Corporate & InvestmentsGeneral Insurance
Personal Lines
CommercialLines
New Zealand
CaptiveIAG Re
Asian Operations
International Investments Corporate CostsAustralia
Insurance Australia Group Limited Personal Lines
Commercial Lines International
Corp &
Inv't
Half-year ended
Dec 04
Half-year ended
Dec 03 A$m A$m A$m A$m A$m A$mGross written premium 2,002 827 499 3,328 3,142Gross earned premium 1,986 831 494 3,311 3,116Reinsurance (106) (100) 4 (202) (204)Net premium revenue 1,880 731 498 - 3,109 2,912Net claims expense (1,262) (518) (287) (2,067) (1,909)Commission expense (114) (90) (49) (253) (227)Underwriting expense (322) (132) (80) - (534) (499)Underwriting profit 182 (9) 82 - 255 277Investment income on technical reserves 158 93 12 263 67Insurance profit 340 84 94 - 518 344Financial services - - 15Net corporate expenses (13) (13) (14)Amortisation (52) (52) (54)Interest (28) (28) (29)Profit from fee based businesses 11 (2) 1 10 20Investment income on internal funds 287 287 204Investment income on external funds 11 11 8NSW Insurance Protection Tax (10) (10) (10)Profit before income tax 340 95 92 196 723 484Income tax expense (219) (219) (136)Profit after income tax 340 95 92 (23) 504 348OEI: External funds (11) (8)OEI: IMA & MCGI (47) (38)Profit attributable to shareholders 446 302Dividends on reset preference shares (15) (14)Profit attributable to ordinary shareholders 431 288 Basic earnings per share (cents) 27.06 17.07Diluted earnings per share (cents) 27.01 17.01
Insurance Australia Group Limited - ABN 60 090 739 923 11
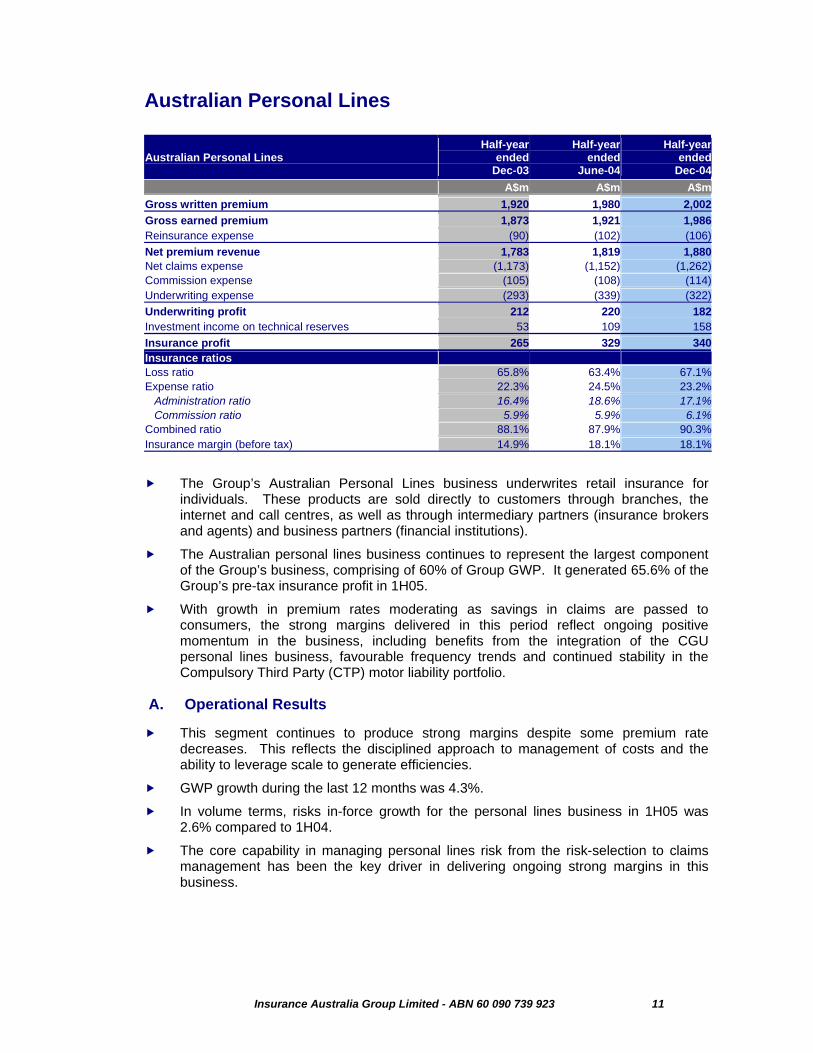
Australian Personal Lines
Australian Personal Lines Half-year
endedDec-03
Half-year ended
June-04
Half-yearended
Dec-04 A$m A$m A$mGross written premium 1,920 1,980 2,002Gross earned premium 1,873 1,921 1,986Reinsurance expense (90) (102) (106)Net premium revenue 1,783 1,819 1,880Net claims expense (1,173) (1,152) (1,262)Commission expense (105) (108) (114)Underwriting expense (293) (339) (322)Underwriting profit 212 220 182Investment income on technical reserves 53 109 158Insurance profit 265 329 340Insurance ratios Loss ratio 65.8% 63.4% 67.1%Expense ratio 22.3% 24.5% 23.2% Administration ratio 16.4% 18.6% 17.1% Commission ratio 5.9% 5.9% 6.1%Combined ratio 88.1% 87.9% 90.3%Insurance margin (before tax) 14.9% 18.1% 18.1%
The Group’s Australian Personal Lines business underwrites retail insurance for individuals. These products are sold directly to customers through branches, the internet and call centres, as well as through intermediary partners (insurance brokers and agents) and business partners (financial institutions).
The Australian personal lines business continues to represent the largest component of the Group’s business, comprising of 60% of Group GWP. It generated 65.6% of the Group’s pre-tax insurance profit in 1H05.
With growth in premium rates moderating as savings in claims are passed to consumers, the strong margins delivered in this period reflect ongoing positive momentum in the business, including benefits from the integration of the CGU personal lines business, favourable frequency trends and continued stability in the Compulsory Third Party (CTP) motor liability portfolio.
A. Operational Results
This segment continues to produce strong margins despite some premium rate decreases. This reflects the disciplined approach to management of costs and the ability to leverage scale to generate efficiencies.
GWP growth during the last 12 months was 4.3%.
In volume terms, risks in-force growth for the personal lines business in 1H05 was 2.6% compared to 1H04.
The core capability in managing personal lines risk from the risk-selection to claims management has been the key driver in delivering ongoing strong margins in this business.
Insurance Australia Group Limited - ABN 60 090 739 923 12
The loss ratio of 1H05 of 67.1% includes a negative discount rate adjustment of 1.5%, whilst the two previous periods had benefits from discount rate movements, including 2.9% in 1H04. Excluding this, the loss ratio in 1H05 shows improvement from the same period last year reflecting lower claims frequency and the effect of key claims initiatives that have been implemented throughout this period.
From a claims management perspective, the concept of partnering with key suppliers to deliver quality service to policyholders through efficient and cost-effective claims management began in November 2001 with the Preferred Smash Repair model (PSR). The success of this initiative has evolved and been further enhanced through the introduction of web-based capability to virtually manage claims processes nationally and across the key short-tail personal lines products.
The success of the supply chain model within the motor class has more recently been applied to home insurance. This was implemented in 2003 and following integration has been operational in the CGU business for almost a year. This has delivered substantial savings in the average cost per claim for similar damage.
The weather during 1H05 indicated a return to more normal weather patterns. For example, 66 rain days were recorded in Sydney, compared with 58 days in 1H04 (historical average 136 days per calendar year). There were also a number of major storms in 1H05 with an aggregate cost of approximately $90m, mainly affecting the home portfolio. This is similar to the experience in 1H04, but considerably more than 2H04.
The administration ratio for 1H05 was 17.1%. 1H05 and 1H04 both benefited from a fire service levy adjustment of 0.3% and 0.7% respectively. After taking this into account the 1H05 administration ratio is in line with 1H04.
With the national personal lines business is operating as one, including the CGU portfolios, the business has begun a review to ensure that the operations are optimised and to further improve customer service. Utilising the skills and experience of the people in the business, process improvements are being identified. These range from choosing 'best of breed' where disparate processes operate for similar activities around the business and designing improved processes where inefficiencies are identified. Implementation of these changes will assist in sustaining strong margins in this business.
B. Short-tail Personal Lines
B.1 Premiums and Market Share
GWP growth in the short-tail personal lines business during the last 12 months has been achieved in a market, which is very competitive. Insurers are targeting segments perceived as attractive and pricing keenly in these.
This business continues to sustain excellent retention, with renewal rates of over 90% in the key direct portfolios.
The national market share for the short-tail personal lines portfolios is broadly in line with previous periods.*Source: Roy Morgan
New business volumes have been steady during the period. The growth in the home portfolio has been well in excess of system growth (as measured by CPI and AWE growth). Average premiums for home insurance rose, in single digits, due to the increased frequency and severity of claims, moderated by sharing of the savings achieved in claims costs.
Insurance Australia Group Limited - ABN 60 090 739 923 13
To accelerate new business growth, a number of new initiatives have been developed to leverage market share and the extensive customer database to target specific market and customer segments. In particular Home@50 was launched in 2H04 and performed well in 1H05.
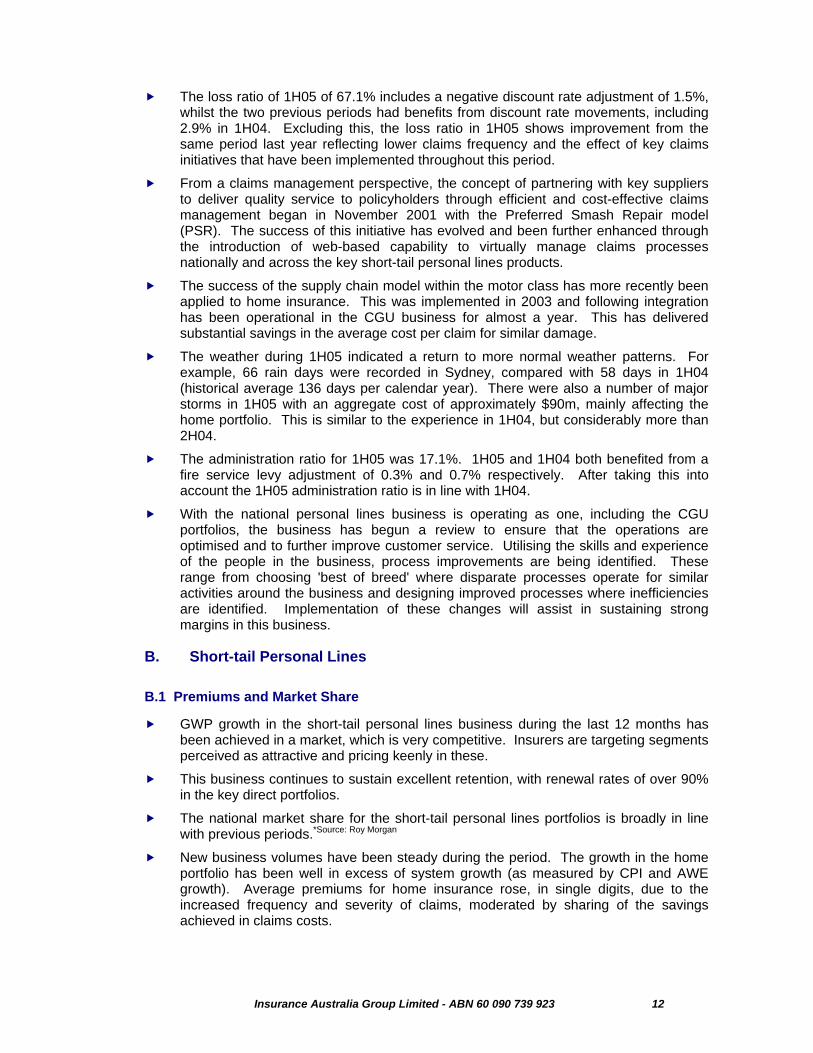
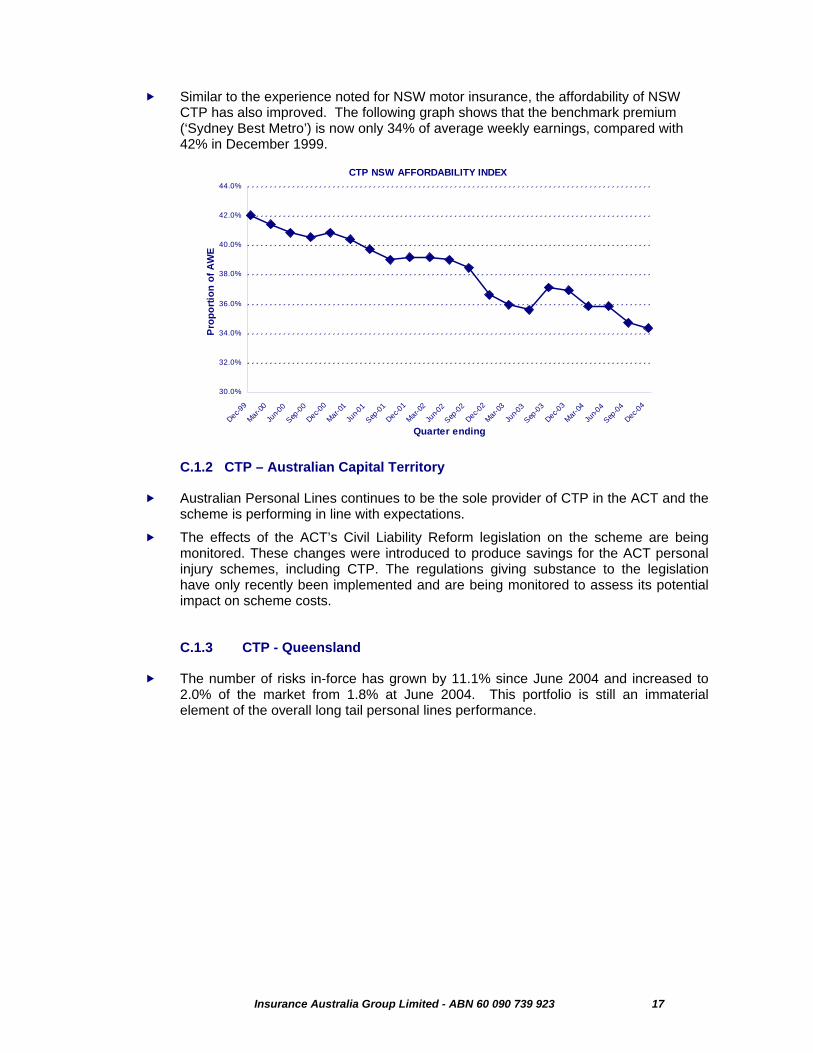
Average premiums in motor continue to rise at less than inflation as savings achieved are shared with customers. The graph below tracks affordability of motor premiums compared to average weekly earnings since December 1998.
Note: On average, 61% of the average weekly earnings covers the average 12-month insurance policy. At October 2004 it was 58%.
B.2 Customer focus
The two fundamentals that need to be addressed to achieve growth in the personal lines market are product and customer service differentiation. Initiatives implemented during 1H05 include:
Rolling out of several enhancements to operating models in the telephone business networks and branches to simplify processes for customers.
New motor policy booklets launched in September 2004 delivered nationally consistent (previously there were some state differences) policy terms and conditions that are at least equal to, or (in most cases) exceed, the cover provided by competitors. This follows the launch of the new home policy booklet in 2H04.
As part of differentiating its products, Australian Personal Lines focuses on providing more flexibility in policy options to recognise the varying needs of its customers. Examples of this include the introduction of two new policy options:
– Windscreen Cover (customers can elect to pay an additional premium which allows them to claim for replacement windscreens without paying an excess);
Affordability of NRMA Car Insurance (NSW)
50%
55%
60%
65%
70%
75%
80%
Dec-99
Feb-00
Apr-00
Jun-0
0
Aug-00
Oct-00
Dec-00
Feb-0
1
Apr-01
Jun-0
1
Aug-01
Oct-01
Dec-01
Feb-02
Apr-02
Jun-0
2
Aug-02
Oct-02
Dec-02
Feb-03
Apr-03
Jun-0
3
Aug-03
Oct-03
Dec-03
Feb-04
Apr-04
Jun-0
4
Aug-04
Oct-04
Prem
ium
/AW
E
Full time adult ordinary time earnings - Gross pay before tax and overtime. Only full-time adult employee jobs.
Average 61%
(Annual Average Premium / Average Weekly Earnings)
Insurance Australia Group Limited - ABN 60 090 739 923 14
– Choice of Repairer Motor Policy - The introduction of this option was partially influenced by the 2003 issues paper on the relationship between insurers and smash repairers reported by the Australian Competition and Consumer Commission where “repairer groups have called for consideration of a two tier pricing system. This price system will offer consumers the choice of paying two separate prices for motor vehicle insurance”. The Group believes its motor insurance policy is now the most transparent in the market place with respect to the treatment of motor claims.
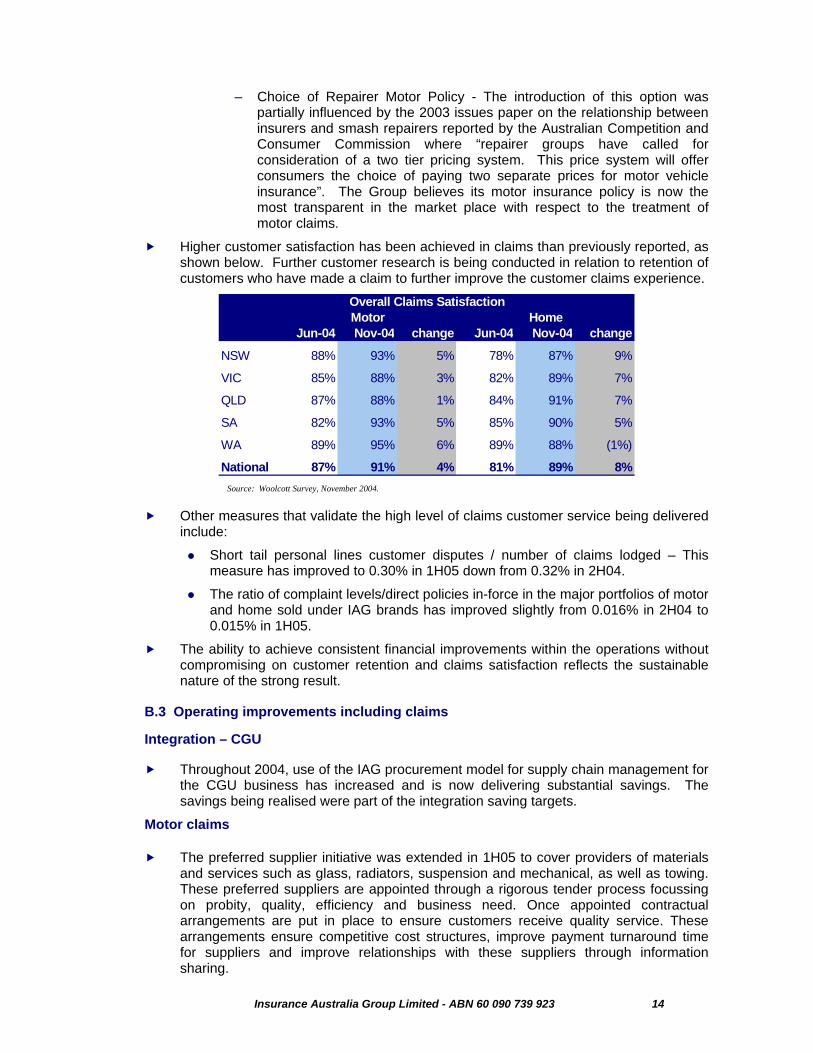
Higher customer satisfaction has been achieved in claims than previously reported, as shown below. Further customer research is being conducted in relation to retention of customers who have made a claim to further improve the customer claims experience.
Other measures that validate the high level of claims customer service being delivered include:
Short tail personal lines customer disputes / number of claims lodged – This measure has improved to 0.30% in 1H05 down from 0.32% in 2H04.
The ratio of complaint levels/direct policies in-force in the major portfolios of motor and home sold under IAG brands has improved slightly from 0.016% in 2H04 to 0.015% in 1H05.
The ability to achieve consistent financial improvements within the operations without compromising on customer retention and claims satisfaction reflects the sustainable nature of the strong result.
B.3 Operating improvements including claims
Integration – CGU Throughout 2004, use of the IAG procurement model for supply chain management for
the CGU business has increased and is now delivering substantial savings. The savings being realised were part of the integration saving targets.
Motor claims The preferred supplier initiative was extended in 1H05 to cover providers of materials
and services such as glass, radiators, suspension and mechanical, as well as towing. These preferred suppliers are appointed through a rigorous tender process focussing on probity, quality, efficiency and business need. Once appointed contractual arrangements are put in place to ensure customers receive quality service. These arrangements ensure competitive cost structures, improve payment turnaround time for suppliers and improve relationships with these suppliers through information sharing.
Jun-04 Nov-04 change Jun-04 Nov-04 change
NSW 88% 93% 5% 78% 87% 9%
VIC 85% 88% 3% 82% 89% 7%
QLD 87% 88% 1% 84% 91% 7%
SA 82% 93% 5% 85% 90% 5%
WA 89% 95% 6% 89% 88% (1%)
National 87% 91% 4% 81% 89% 8%
Motor HomeOverall Claims Satisfaction
Source: Woolcott Survey, November 2004.
Insurance Australia Group Limited - ABN 60 090 739 923 15
Particularly pleasing is the strong support received by the model in the independent submission to the Productivity Commission by the Australian Consumers Association (ACA). The ACA said, “…most consumers are happy, in fact prefer, to let their insurer manage the repair”.
Furthermore, the draft report by the Productivity Commission released in November 2004 said, “Preferred smash repairer (PSR) arrangements benefit insurers, consumers and many repairers. Further, PSR arrangements should not adversely affect the quality and safety of repair”.
The effectiveness of these supply chain initiatives is reflected in the claims satisfaction rates noted earlier and in the continued achievement of a sustained improvement in average repair costs.
Home claims The home contents procurement models manage the replacement of goods. These
procurement models involve business relationships with preferred suppliers resulting in significant savings to both the bottom line and the time taken to replace items and settle the claim for the customer.
Existing procurement models covering the replacement of electrical goods and jewellery have been enhanced during 1H05 to provide more reliable and efficient service. Further, additional models have been introduced to offer more flexibility in claim settlement.
72% penetration has been achieved in use of home claims procurement models nationally, representing almost double the penetration in 1H05 with some regions achieving above 90%. This has led to reduced costs for similar claims and improved customer satisfaction results.
C. Long-tail Personal Lines
C.1 Compulsory Third Party
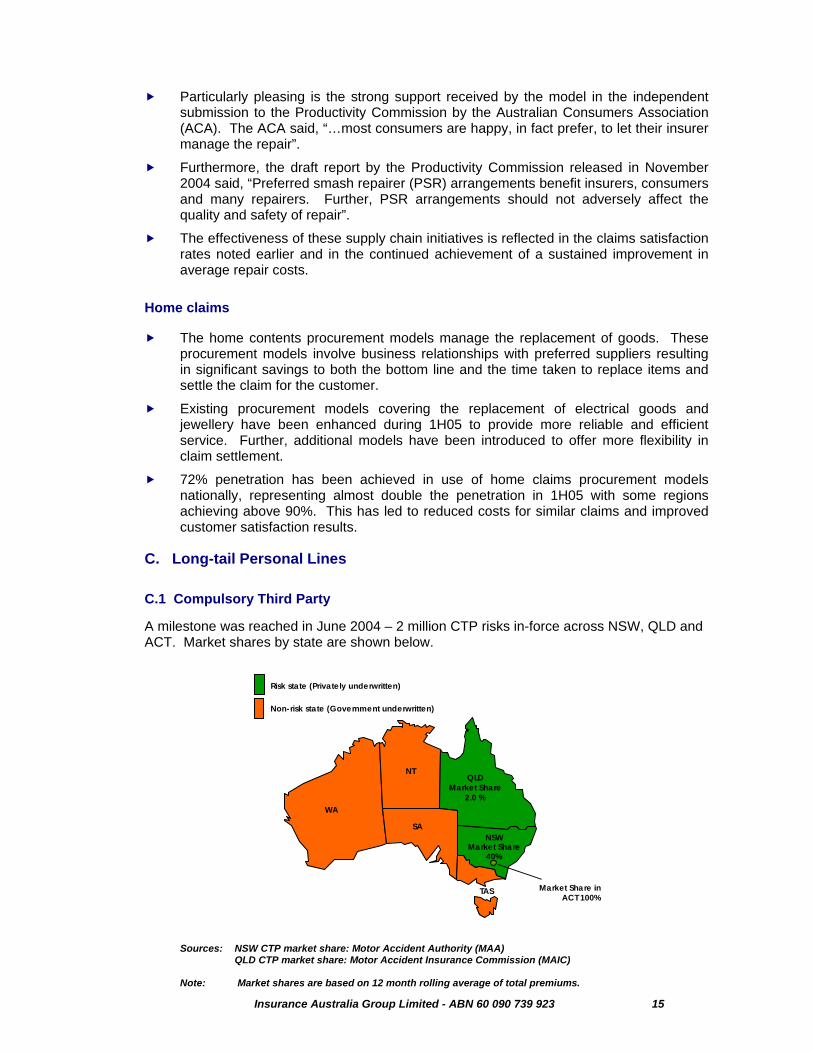
A milestone was reached in June 2004 – 2 million CTP risks in-force across NSW, QLD and ACT. Market shares by state are shown below.
Market Share in ACT 100%
NSWMarket Share
40%
QLDMarket Share
2.0 %
Risk state (Privately underwritten)
Non-risk state (Government underwritten)
NT
WA
SA
TAS
Sources: NSW CTP market share: Motor Accident Authority (MAA) QLD CTP market share: Motor Accident Insurance Commission (MAIC) Note: Market shares are based on 12 month rolling average of total premiums.
Insurance Australia Group Limited - ABN 60 090 739 923 16
C.1.1 CTP – New South Wales
The NSW CTP portfolio continues to generate strong operating margins. Apart from the stability of the scheme, resulting from the legislative reforms in October 1999, other factors influencing the lower claims frequency include, improved vehicle safety and safer driving behaviours.
There is a continual focus on ensuring that CTP is positioned to provide an appropriate return on capital into the future. To this end the Group has begun to engage the Motor Accidents Authority’s assistance in ensuring that pricing and related regulations recognise the capital intensity of CTP under the current APRA requirements.
Financial assistance and expertise has continued to be provided to a range of worthy community activities and research which are aligned to reducing risk, increasing the understanding of the drivers of risk or increasing the likelihood of better medical outcomes for those injured in motor vehicle accidents. Current activities include:
• Continued sponsorship of the Careflight helicopter;
• Funding research by Monash University Research Accident Centre into better understanding the key influences on changes in accident frequency over time;
• Crash testing to assess the relative effectiveness of various types of head restraints; and
• Funding the provision of an additional operating theatre at Westmead Childrens’ Hospital Burns Unit.
From the claims management perspective, as the leader in this market, the Group continues to leverage its scale and expertise to drive claims efficiencies contributing to improved margins. Over time it has consistently outperformed key industry benchmarks. This can be seen in the following measures last published by Trowbridge Deloitte in September 2004 as at June 2004:
• Reported claim frequency continues to be below the industry;
• Average incurred claim cost is below the industry average;
• Average finalised cost of claims remains below the industry average;
• Large claims experience is less than would be expected based on market share;
• Claims finalisation rate remains well ahead of the rest of the industry;
• Average finalised cost of Motor Accidents Compensation Act 1999 (‘MACA’) claims continues to track at approximately 20% less than the 1988 Act experience; and
• Exposure to the 1988 Act continues to fall, with more than 99% of the claims lodged under this Act now finalised.
Customers also continue to benefit from the stable and effective regulatory regime through real price decreases since December 1999. Since February 2004, Sydney Metro rates have fallen by 2%.
Insurance Australia Group Limited - ABN 60 090 739 923 17
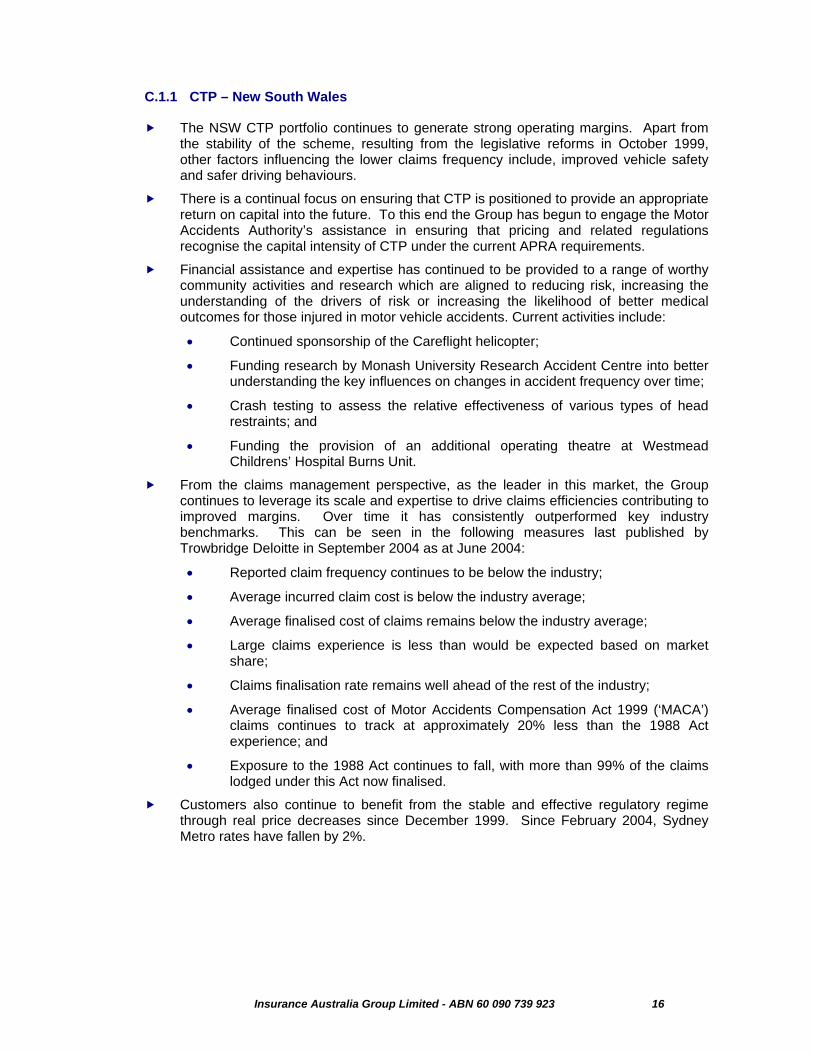
Similar to the experience noted for NSW motor insurance, the affordability of NSW CTP has also improved. The following graph shows that the benchmark premium (‘Sydney Best Metro’) is now only 34% of average weekly earnings, compared with 42% in December 1999.
C.1.2 CTP – Australian Capital Territory
Australian Personal Lines continues to be the sole provider of CTP in the ACT and the scheme is performing in line with expectations.
The effects of the ACT’s Civil Liability Reform legislation on the scheme are being monitored. These changes were introduced to produce savings for the ACT personal injury schemes, including CTP. The regulations giving substance to the legislation have only recently been implemented and are being monitored to assess its potential impact on scheme costs.
C.1.3 CTP - Queensland
The number of risks in-force has grown by 11.1% since June 2004 and increased to 2.0% of the market from 1.8% at June 2004. This portfolio is still an immaterial element of the overall long tail personal lines performance.
CTP NSW AFFORDABILITY INDEX
30.0%
32.0%
34.0%
36.0%
38.0%
40.0%
42.0%
44.0%
Dec-99
Mar-00
Jun-0
0
Sep-00
Dec-00
Mar-01
Jun-0
1
Sep-01
Dec-01
Mar-02
Jun-0
2
Sep-02
Dec-02
Mar-03
Jun-0
3
Sep-03
Dec-03
Mar-04
Jun-0
4
Sep-04
Dec-04
Quarter ending
Pro
porti
on o
f AW
E
Insurance Australia Group Limited - ABN 60 090 739 923 18
Australian Commercial Lines
Australian Commercial Lines Half-year
endedDec-03
Half-year ended
June-04
Half-yearended
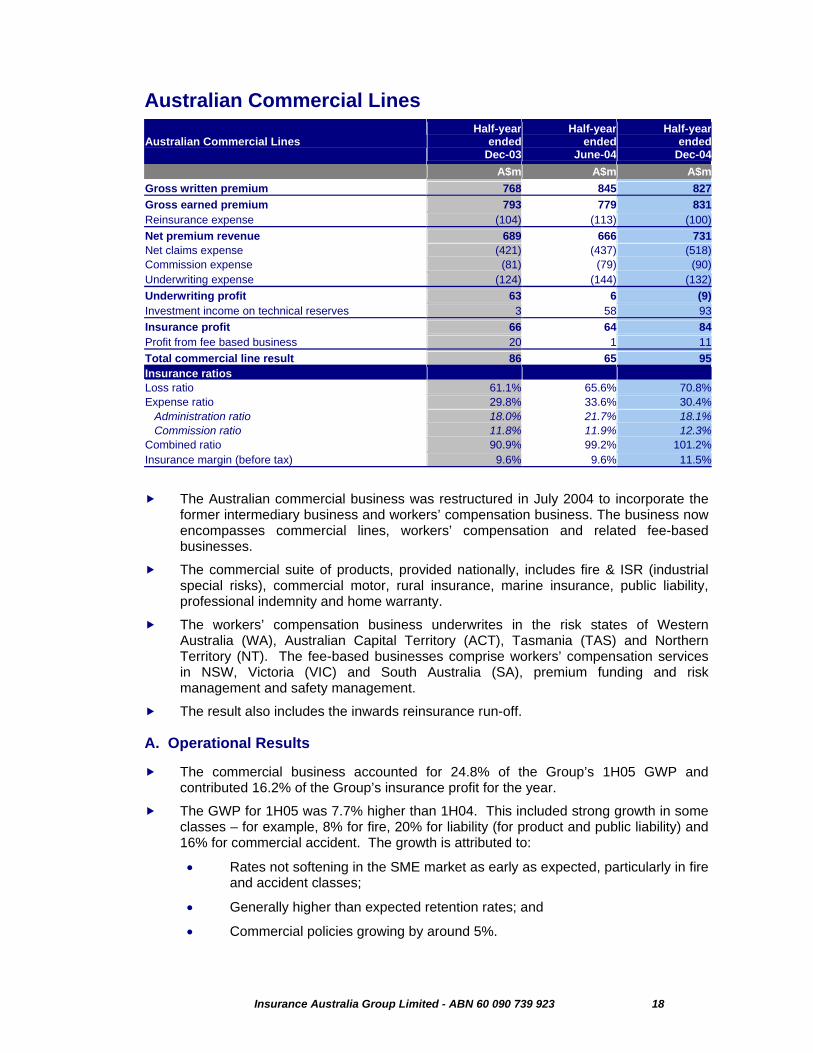
Dec-04 A$m A$m A$mGross written premium 768 845 827Gross earned premium 793 779 831Reinsurance expense (104) (113) (100)Net premium revenue 689 666 731Net claims expense (421) (437) (518)Commission expense (81) (79) (90)Underwriting expense (124) (144) (132)Underwriting profit 63 6 (9)Investment income on technical reserves 3 58 93Insurance profit 66 64 84Profit from fee based business 20 1 11Total commercial line result 86 65 95Insurance ratios Loss ratio 61.1% 65.6% 70.8%Expense ratio 29.8% 33.6% 30.4% Administration ratio 18.0% 21.7% 18.1% Commission ratio 11.8% 11.9% 12.3%Combined ratio 90.9% 99.2% 101.2%Insurance margin (before tax) 9.6% 9.6% 11.5%
The Australian commercial business was restructured in July 2004 to incorporate the former intermediary business and workers’ compensation business. The business now encompasses commercial lines, workers’ compensation and related fee-based businesses.
The commercial suite of products, provided nationally, includes fire & ISR (industrial special risks), commercial motor, rural insurance, marine insurance, public liability, professional indemnity and home warranty.
The workers’ compensation business underwrites in the risk states of Western Australia (WA), Australian Capital Territory (ACT), Tasmania (TAS) and Northern Territory (NT). The fee-based businesses comprise workers’ compensation services in NSW, Victoria (VIC) and South Australia (SA), premium funding and risk management and safety management.
The result also includes the inwards reinsurance run-off.
A. Operational Results
The commercial business accounted for 24.8% of the Group’s 1H05 GWP and contributed 16.2% of the Group’s insurance profit for the year.
The GWP for 1H05 was 7.7% higher than 1H04. This included strong growth in some classes – for example, 8% for fire, 20% for liability (for product and public liability) and 16% for commercial accident. The growth is attributed to:
• Rates not softening in the SME market as early as expected, particularly in fire and accident classes;
• Generally higher than expected retention rates; and
• Commercial policies growing by around 5%.
Insurance Australia Group Limited - ABN 60 090 739 923 19
Consistent with the seasonality of the commercial business, GWP for 1H05 was 2.1% lower than 2H04.
Workers’ compensation insurance premiums in the risk states remained relatively flat, principally due to the reductions in industry rates released in Western Australia by the Premium Rates Committee for the 12 months commencing 30 June 2004. Market share in the privately underwritten states has remained relatively stable at around 30% nationally.
The reinsurance expense for this business has reduced in both absolute and proportionate terms. This follows a restructure of the reinsurance arrangements whereby less facultative reinsurance is used and greater reliance is, instead, placed on the Group’s surplus reinsurance treaties.
The 1H05 combined ratio included an adverse discount rate adjustment of $37m (5.1% on COR), compared to a benefit in the last two half-year periods of $46m (6.7% on COR) in 1H04 and $15m (2.3% on COR) in 2H04. The underlying combined ratio was 96.1% in 1H05, a sustained improvement on 97.6% in 1H04 and 101.5% in 2H04.
On the same basis, the underlying loss ratio was 65.7% in 1H05, compared to 67.8% in 2H04. Included in the 1H05 loss ratio is a net increase of $37m in liability claims reserves, comprised of increases in workers’ compensation and product liability reserves, largely due to asbestos, and a reduction in reserves for current commercial liability business.
Throughout 2004 there has been an increased focus on asbestos issues in the community and the Group has seen an increase in the number of claims reported. Based on the latest available information, there is a potential for a higher number of more costly mesothelioma claims in the future. Accordingly, the Group increased its reserves in 1H05 to reflect the greater mix of these higher cost claims. This led to an increase in the survival ratio to 54 times the average of the last three year’s claims paid (‘survival ratio’), from 50 times at 30 June 2004. This ratio is provided as an indicator of the Group’s reserving for this liability class. However, it should be used with caution as research indicates that the underlying exposures and measurements used are not sufficiently comparable to make reliable comparisons. The Group is participating in research being conducted to get more consistent information for Australian experience, exposure type and treatment of estimates, prudential margins and recoveries. However, based on the information currently available, the Group understands its provisions to be at the conservative end of the local market range.
The releases in the reserves for the ongoing liability business reflects the Group’s growing confidence in the realisation of benefits from the tort reforms implemented in recent periods and underpinned the Group’s reductions in public liability rates.
The insurance margin of 11.5% for 1H05 is an improvement on the 9.6% reported both for 1H04 and 2H04. This result is particularly strong, when considering the margin in 1H05 absorbed the impact of a $37m net claims reserve increase.
The increase in the commission ratio in 1H05 to 12.3% from 11.8% and 11.9% in 1H04 and 2H04, respectively, was due to a combination of a lower proportion of reinsurance commission (on business ceded under surplus and facultative reinsurance) and a change in mix of the portfolio to higher commission commercial business.
The administration ratio of 18.1% in 1H05 is an improvement from 21.7% in 2H04, which included expenses relating to the launch of the home warranty and marine insurance business. The 1H04 ratio of 18.0% included a benefit from arising from a fire service levy credit notified in that period. Whilst the business derived synergy benefits during 1H05, there was continued reinvestment in the business to improve product offerings and processes, which will assist in sustaining margins during the next 12 months.
Insurance Australia Group Limited - ABN 60 090 739 923 20
B. Operations and Customers
B.1 Process improvements
The Group’s professional risk team was one of the first in the Australian market to launch a real-time internet quoting system for the Group’s products. CGU is also the only insurance provider to offer extensive training in professional risks to brokers and the feedback from them has been overwhelmingly positive.
The Group continues to develop its innovative e-learning tool to deliver training for staff and authorised representatives. The Group also introduced a web portal (“Replink”) to assist authorised representatives to provide necessary documentation, such as Statements of Advice, to customers as required by legislation. The database is also used for updating ASIC records as part of ongoing compliance.
Initiatives such as these, together with a long-track record of service and the Group’s very strong credit rating, contribute to the Group’s sustained retention of customers when premium rates in the market are volatile.
The workers’ compensation business in Victoria (non-risk operation) has completed a review that will result in improved alignment of the claims groups to ensure better accountability within teams for the end-to-end management of claims. The desired outcomes of the project are to improve customer service.
Following completion of integration, the business launched a review with the following objectives: to do things better today; to become more competitive; and to build a business that is more agile and able to take advantage of growth opportunities. The project will review the way business is done with a view to improve consistency and share ideas through various parts of the business.
The workers’ compensation risk states are progressing a systems conversion, which will result in one system being utilised for all of these states. This will result in systems maintenance and support savings (systems and training), driving down operating costs.
B.2 Product and distribution development
Key initiatives in this area include:
• Continuing to develop new products to broaden the product range on the e-business platform, providing intermediaries the ability to quote and issue cover with the end-to-end transaction completed by the single keying of information;
• Relaunch of CGU’s flagship business package policy revising the product to improve its marketability; and
• Development of a motor fleet offering, which encompasses insurance coverage and accident management and reporting service.
B.3 Outlook
The market is expected to continue its downward trend in rates, particularly at the corporate end. The business will continue to focus on risk selection and achieving required technical rates across the portfolio.
The eCommerce delivery systems will continue to drive efficiencies in the SME markets.
Workers’ compensation premiums in WA are expected to rise as a result of the introduction of regulatory changes, this increase being required to cover the increased cost of claims arising from the increased benefits payable to claimants.
Insurance Australia Group Limited - ABN 60 090 739 923 21
The business will continue to grow through focus on its established strategic initiatives of:
• Selectively targeting specific segments and accounts while retaining the positive features of the current portfolio mix;
• Increasing flexibility in pricing, risk acceptance and whole of account approach, while maintaining underwriting discipline and technical benchmarks at product level; and
• Using rating strength in selected products to grow market share, without allowing substantial deterioration of rating strength.
C. Fee based businesses/managed schemes
The fee-based profit for 1H05 of $11m is lower than the $20m reported for 1H04. This reflects lower performance fees received. These performance fees constitute a substantial portion of the profit from these businesses and can vary considerably.
Fee income from the Group’s risk management and safety offerings, whilst not of significant size at present, continues to grow.
D. Inwards Reinsurance run-off
The commutation strategy for the inwards reinsurance run-off continues to progress with four additional commutations in 1H05. This brings the calendar year total to 15 contracts and resulted in net savings to the Group.
As at December 2004, 65% of the remaining contracts are subject to discussions on possible commutations.
The net provision for the outstanding claims on this portfolio is now approximately $92m, a reduction of around 10% since June 2004.
Insurance Australia Group Limited - ABN 60 090 739 923 22
International General Insurance
International operations Half-year
endedDec-03
Half-year ended Jun-04
Half-year ended
Dec-04
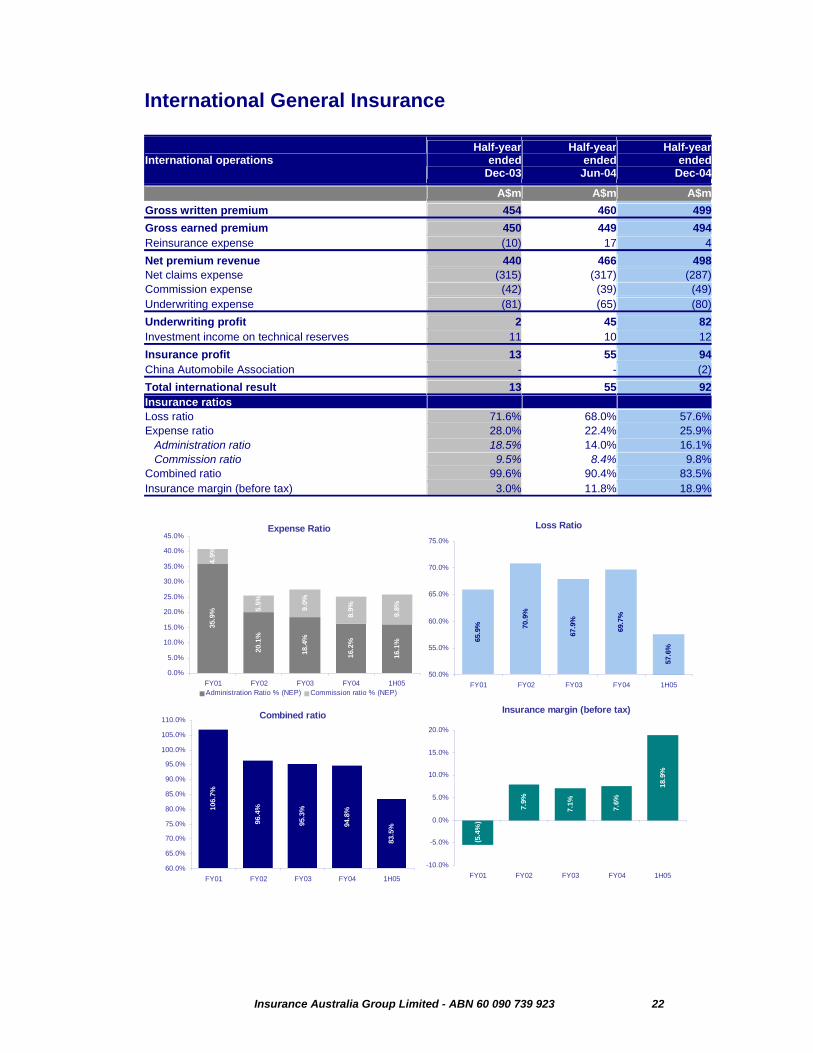
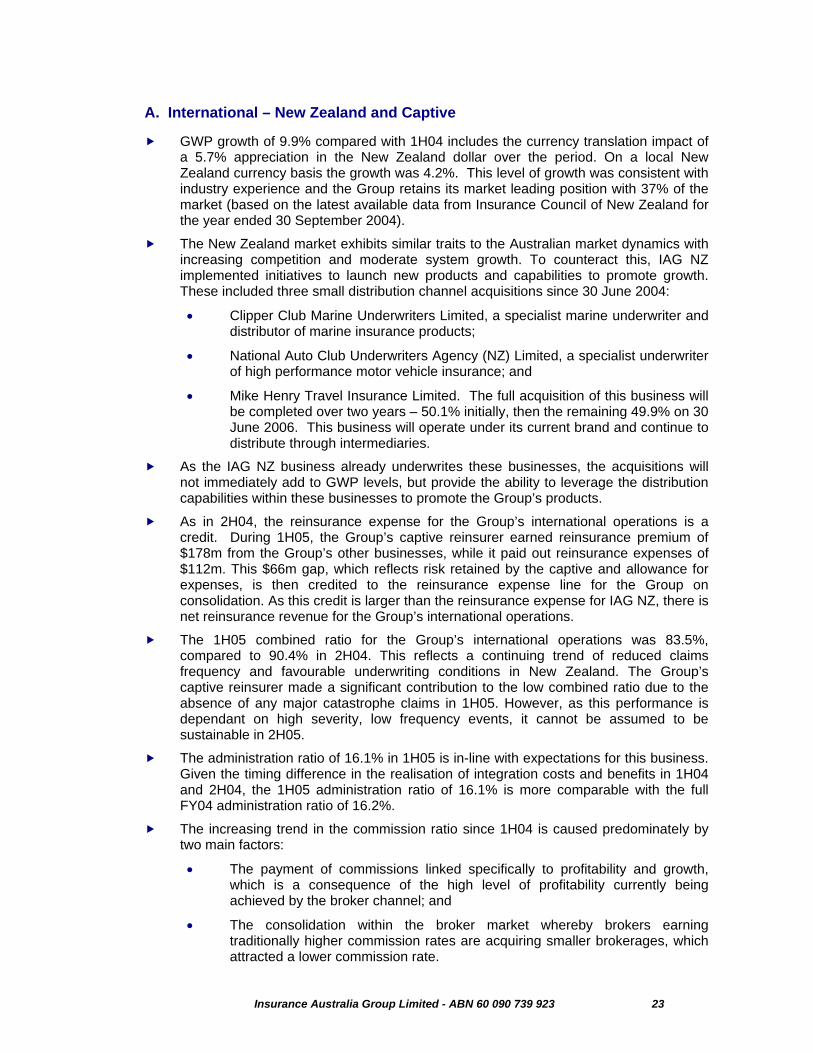
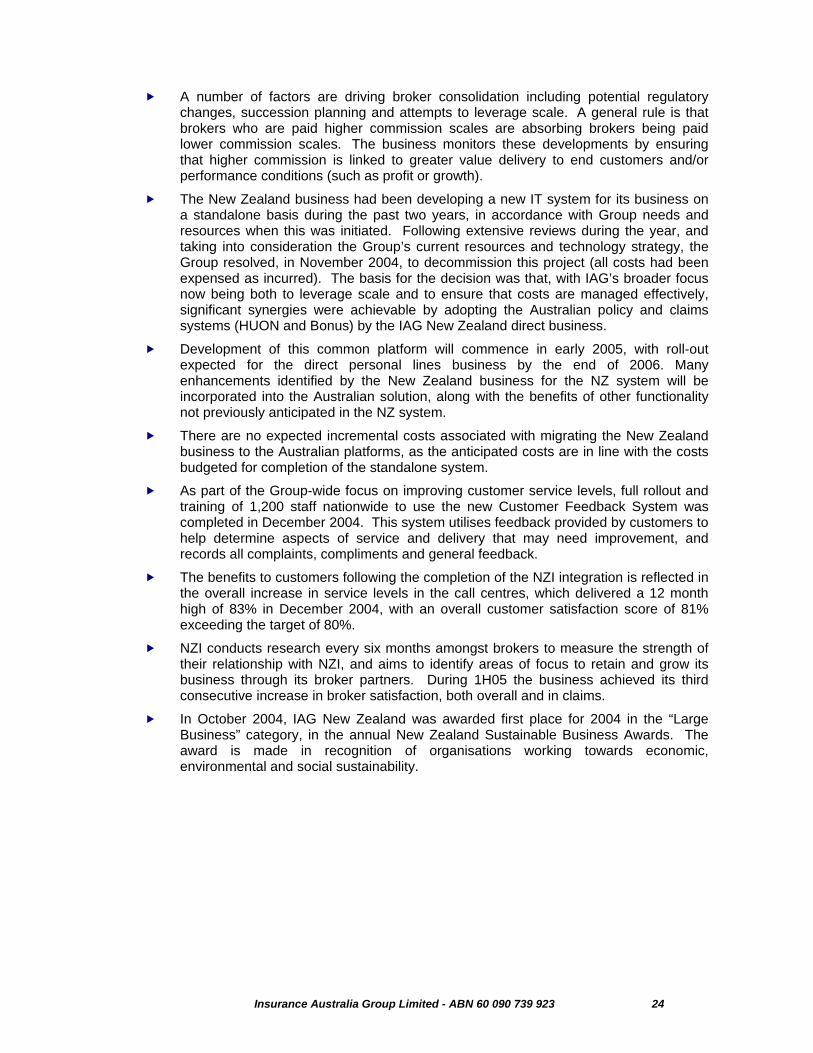
A$m A$m A$mGross written premium 454 460 499Gross earned premium 450 449 494Reinsurance expense (10) 17 4Net premium revenue 440 466 498Net claims expense (315) (317) (287)Commission expense (42) (39) (49)Underwriting expense (81) (65) (80)Underwriting profit 2 45 82Investment income on technical reserves 11 10 12Insurance profit 13 55 94China Automobile Association - - (2)Total international result 13 55 92Insurance ratios Loss ratio 71.6% 68.0% 57.6%Expense ratio 28.0% 22.4% 25.9% Administration ratio 18.5% 14.0% 16.1% Commission ratio 9.5% 8.4% 9.8%Combined ratio 99.6% 90.4% 83.5%Insurance margin (before tax) 3.0% 11.8% 18.9%
35.9
%
20.1
%
18.4
%
16.2
%
16.1
%
4.9%
5.5%
9.0%
8.9%
9.8%
0.0%
5.0%
10.0%
15.0%
20.0%
25.0%
30.0%
35.0%
40.0%
45.0%
FY01 FY02 FY03 FY04 1H05Administration Ratio % (NEP) Commission ratio % (NEP)
Expense Ratio
65.9
% 70.9
%
67.9
%
69.7
%
57.6
%50.0%
55.0%
60.0%
65.0%
70.0%
75.0%
FY01 FY02 FY03 FY04 1H05
Loss Ratio
106.
7%
96.4
%
95.3
%
94.8
%
83.5
%
60.0%
65.0%
70.0%
75.0%
80.0%
85.0%
90.0%
95.0%
100.0%
105.0%
110.0%
FY01 FY02 FY03 FY04 1H05
Combined ratio
(5.4
%)
7.9%
7.1% 7.6%
18.9
%
-10.0%
-5.0%
0.0%
5.0%
10.0%
15.0%
20.0%
FY01 FY02 FY03 FY04 1H05
Insurance margin (before tax)
Insurance Australia Group Limited - ABN 60 090 739 923 23
A. International – New Zealand and Captive
GWP growth of 9.9% compared with 1H04 includes the currency translation impact of a 5.7% appreciation in the New Zealand dollar over the period. On a local New Zealand currency basis the growth was 4.2%. This level of growth was consistent with industry experience and the Group retains its market leading position with 37% of the market (based on the latest available data from Insurance Council of New Zealand for the year ended 30 September 2004).
The New Zealand market exhibits similar traits to the Australian market dynamics with increasing competition and moderate system growth. To counteract this, IAG NZ implemented initiatives to launch new products and capabilities to promote growth. These included three small distribution channel acquisitions since 30 June 2004:
• Clipper Club Marine Underwriters Limited, a specialist marine underwriter and distributor of marine insurance products;
• National Auto Club Underwriters Agency (NZ) Limited, a specialist underwriter of high performance motor vehicle insurance; and
• Mike Henry Travel Insurance Limited. The full acquisition of this business will be completed over two years – 50.1% initially, then the remaining 49.9% on 30 June 2006. This business will operate under its current brand and continue to distribute through intermediaries.
As the IAG NZ business already underwrites these businesses, the acquisitions will not immediately add to GWP levels, but provide the ability to leverage the distribution capabilities within these businesses to promote the Group’s products.
As in 2H04, the reinsurance expense for the Group’s international operations is a credit. During 1H05, the Group’s captive reinsurer earned reinsurance premium of $178m from the Group’s other businesses, while it paid out reinsurance expenses of $112m. This $66m gap, which reflects risk retained by the captive and allowance for expenses, is then credited to the reinsurance expense line for the Group on consolidation. As this credit is larger than the reinsurance expense for IAG NZ, there is net reinsurance revenue for the Group’s international operations.
The 1H05 combined ratio for the Group’s international operations was 83.5%, compared to 90.4% in 2H04. This reflects a continuing trend of reduced claims frequency and favourable underwriting conditions in New Zealand. The Group’s captive reinsurer made a significant contribution to the low combined ratio due to the absence of any major catastrophe claims in 1H05. However, as this performance is dependant on high severity, low frequency events, it cannot be assumed to be sustainable in 2H05.
The administration ratio of 16.1% in 1H05 is in-line with expectations for this business. Given the timing difference in the realisation of integration costs and benefits in 1H04 and 2H04, the 1H05 administration ratio of 16.1% is more comparable with the full FY04 administration ratio of 16.2%.
The increasing trend in the commission ratio since 1H04 is caused predominately by two main factors:
• The payment of commissions linked specifically to profitability and growth, which is a consequence of the high level of profitability currently being achieved by the broker channel; and
• The consolidation within the broker market whereby brokers earning traditionally higher commission rates are acquiring smaller brokerages, which attracted a lower commission rate.
Insurance Australia Group Limited - ABN 60 090 739 923 24
A number of factors are driving broker consolidation including potential regulatory changes, succession planning and attempts to leverage scale. A general rule is that brokers who are paid higher commission scales are absorbing brokers being paid lower commission scales. The business monitors these developments by ensuring that higher commission is linked to greater value delivery to end customers and/or performance conditions (such as profit or growth).
The New Zealand business had been developing a new IT system for its business on a standalone basis during the past two years, in accordance with Group needs and resources when this was initiated. Following extensive reviews during the year, and taking into consideration the Group’s current resources and technology strategy, the Group resolved, in November 2004, to decommission this project (all costs had been expensed as incurred). The basis for the decision was that, with IAG’s broader focus now being both to leverage scale and to ensure that costs are managed effectively, significant synergies were achievable by adopting the Australian policy and claims systems (HUON and Bonus) by the IAG New Zealand direct business.
Development of this common platform will commence in early 2005, with roll-out expected for the direct personal lines business by the end of 2006. Many enhancements identified by the New Zealand business for the NZ system will be incorporated into the Australian solution, along with the benefits of other functionality not previously anticipated in the NZ system.
There are no expected incremental costs associated with migrating the New Zealand business to the Australian platforms, as the anticipated costs are in line with the costs budgeted for completion of the standalone system.
As part of the Group-wide focus on improving customer service levels, full rollout and training of 1,200 staff nationwide to use the new Customer Feedback System was completed in December 2004. This system utilises feedback provided by customers to help determine aspects of service and delivery that may need improvement, and records all complaints, compliments and general feedback.
The benefits to customers following the completion of the NZI integration is reflected in the overall increase in service levels in the call centres, which delivered a 12 month high of 83% in December 2004, with an overall customer satisfaction score of 81% exceeding the target of 80%.
NZI conducts research every six months amongst brokers to measure the strength of their relationship with NZI, and aims to identify areas of focus to retain and grow its business through its broker partners. During 1H05 the business achieved its third consecutive increase in broker satisfaction, both overall and in claims.
In October 2004, IAG New Zealand was awarded first place for 2004 in the “Large Business” category, in the annual New Zealand Sustainable Business Awards. The award is made in recognition of organisations working towards economic, environmental and social sustainability.
Insurance Australia Group Limited - ABN 60 090 739 923 25
B. International – Asian Operations
The Group has continuing interests in two operations in Asia, being a 20% ownership stake in Thailand’s Safety Insurance and 100% ownership of China Automobile Association, a company providing road service in Beijing.
The Asian Tsunami clearly affected the Thai operations. However, this has no material impact on the Group’s investment.
Since June 2004, six managers have relocated to China to lead the next phase of expansion of the Group’s Chinese operations by expanding the road service operations and related services, as well as providing a local base for investigation of other opportunities in the region. This investment of people and development generated the net expenditure for the period and was in-line with plan.
Financial Services The Group’s financial services operation, ClearView Retirement Solutions, was sold in
January 2004 for $218m plus an additional $50m earn-out, subject to business performance to June 2008.
The earn-out provision is based on increases in the embedded value of the business. There is no amount payable at this stage.
Insurance Australia Group Limited - ABN 60 090 739 923 26
Investments A. Investment Performance
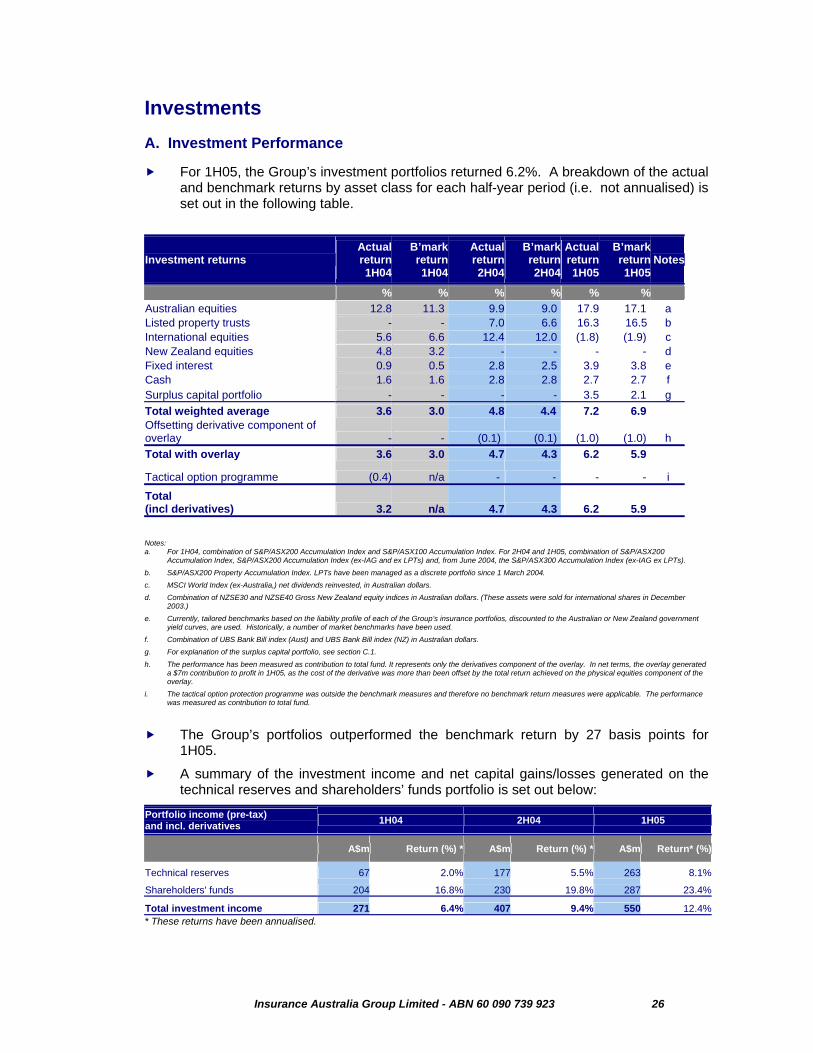
For 1H05, the Group’s investment portfolios returned 6.2%. A breakdown of the actual and benchmark returns by asset class for each half-year period (i.e. not annualised) is set out in the following table.
Investment returns Actual return1H04
B’mark return1H04
Actual return2H04
B’mark return2H04
Actual return1H05
B’mark return 1H05
Notes
% % % % % % Australian equities 12.8 11.3 9.9 9.0 17.9 17.1 a Listed property trusts - - 7.0 6.6 16.3 16.5 b International equities 5.6 6.6 12.4 12.0 (1.8) (1.9) c New Zealand equities 4.8 3.2 - - - - d Fixed interest 0.9 0.5 2.8 2.5 3.9 3.8 e Cash 1.6 1.6 2.8 2.8 2.7 2.7 f Surplus capital portfolio - - - - 3.5 2.1 g Total weighted average 3.6 3.0 4.8 4.4 7.2 6.9 Offsetting derivative component of overlay - - (0.1) (0.1) (1.0) (1.0) h Total with overlay 3.6 3.0 4.7 4.3 6.2 5.9
Tactical option programme (0.4) n/a - - - - i
Total (incl derivatives) 3.2 n/a 4.7 4.3 6.2 5.9
Notes: a. For 1H04, combination of S&P/ASX200 Accumulation Index and S&P/ASX100 Accumulation Index. For 2H04 and 1H05, combination of S&P/ASX200
Accumulation Index, S&P/ASX200 Accumulation Index (ex-IAG and ex LPTs) and, from June 2004, the S&P/ASX300 Accumulation Index (ex-IAG ex LPTs). b. S&P/ASX200 Property Accumulation Index. LPTs have been managed as a discrete portfolio since 1 March 2004. c. MSCI World Index (ex-Australia,) net dividends reinvested, in Australian dollars. d. Combination of NZSE30 and NZSE40 Gross New Zealand equity indices in Australian dollars. (These assets were sold for international shares in December
2003.) e. Currently, tailored benchmarks based on the liability profile of each of the Group’s insurance portfolios, discounted to the Australian or New Zealand government
yield curves, are used. Historically, a number of market benchmarks have been used. f. Combination of UBS Bank Bill index (Aust) and UBS Bank Bill index (NZ) in Australian dollars. g. For explanation of the surplus capital portfolio, see section C.1. h. The performance has been measured as contribution to total fund. It represents only the derivatives component of the overlay. In net terms, the overlay generated
a $7m contribution to profit in 1H05, as the cost of the derivative was more than been offset by the total return achieved on the physical equities component of the overlay.
i. The tactical option protection programme was outside the benchmark measures and therefore no benchmark return measures were applicable. The performance was measured as contribution to total fund.
The Group’s portfolios outperformed the benchmark return by 27 basis points for
1H05.
A summary of the investment income and net capital gains/losses generated on the technical reserves and shareholders’ funds portfolio is set out below:
Portfolio income (pre-tax) and incl. derivatives 1H04 2H04 1H05
A$m Return (%) * A$m Return (%) * A$m Return* (%)
Technical reserves 67 2.0% 177 5.5% 263 8.1%
Shareholders' funds 204 16.8% 230 19.8% 287 23.4%
Total investment income 271 6.4% 407 9.4% 550 12.4%* These returns have been annualised.
Insurance Australia Group Limited - ABN 60 090 739 923 27
The technical reserves portfolio remains predominantly exposed to the Australian and New Zealand fixed interest sectors in line with tailored benchmarks that reflect the underlying currency and duration of the liabilities of the various portfolios within the Group. The total return achieved on the technical reserves assets over this period was 4.05% (8.1% annualised), 26 basis points above the benchmark return for the period.
The Group’s shareholders’ funds continued to be predominantly invested in equities over 1H05 and contributed $287m to the Group’s 1H05 results.
The Australian sharemarket returned 17.1% for 1H05 (9.0% for 2H04). Strong domestic demand and corporate earnings plus high commodity prices drove the markets to a record high.
The return on the international equities sector was minus 1.9% in Australian dollar terms (i.e. unhedged) for 1H05. This compares with a positive return of 12.0% in Australian dollar terms for 2H04. The underlying international equity markets performed soundly over 1H05. However, the return in local currency terms was materially affected by the rise in the Australian dollar over the half year. (The A$ rose 12.5% against the US$ over 1H05.) The Group’s international equities exposure remained unhedged throughout the period.
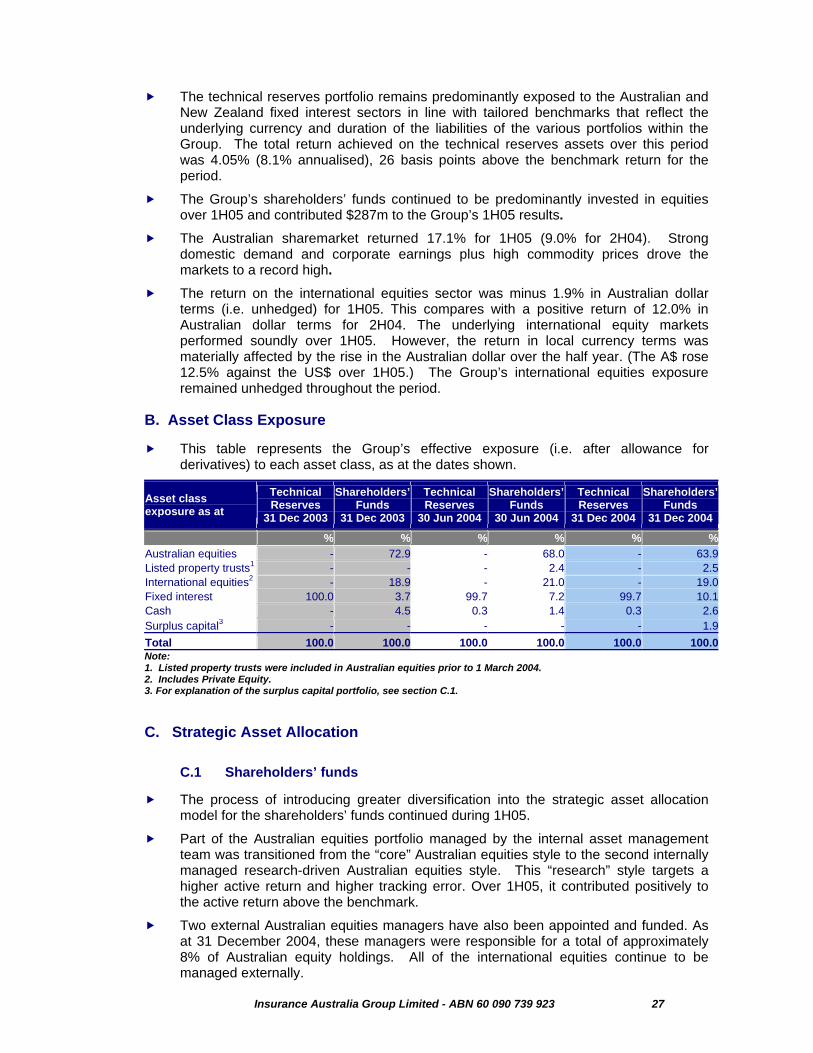
B. Asset Class Exposure
This table represents the Group’s effective exposure (i.e. after allowance for derivatives) to each asset class, as at the dates shown.
Asset class exposure as at
Technical Reserves
31 Dec 2003
Shareholders’ Funds
31 Dec 2003
Technical Reserves
30 Jun 2004
Shareholders’ Funds
30 Jun 2004
Technical Reserves
31 Dec 2004
Shareholders’ Funds
31 Dec 2004
% % % % % %Australian equities - 72.9 - 68.0 - 63.9Listed property trusts1 - - - 2.4 - 2.5International equities2 - 18.9 - 21.0 - 19.0Fixed interest 100.0 3.7 99.7 7.2 99.7 10.1Cash - 4.5 0.3 1.4 0.3 2.6Surplus capital3 - - - - - 1.9Total 100.0 100.0 100.0 100.0 100.0 100.0Note: 1. Listed property trusts were included in Australian equities prior to 1 March 2004. 2. Includes Private Equity. 3. For explanation of the surplus capital portfolio, see section C.1.
C. Strategic Asset Allocation
C.1 Shareholders’ funds
The process of introducing greater diversification into the strategic asset allocation model for the shareholders’ funds continued during 1H05.
Part of the Australian equities portfolio managed by the internal asset management team was transitioned from the “core” Australian equities style to the second internally managed research-driven Australian equities style. This “research” style targets a higher active return and higher tracking error. Over 1H05, it contributed positively to the active return above the benchmark.
Two external Australian equities managers have also been appointed and funded. As at 31 December 2004, these managers were responsible for a total of approximately 8% of Australian equity holdings. All of the international equities continue to be managed externally.
Insurance Australia Group Limited - ABN 60 090 739 923 28
A surplus capital portfolio (part of the shareholders’ funds) was established late in 1H05. This portfolio is intended to hold the Group’s capital above the benchmark MCR multiple. The assets will be a highly liquid mix with at least 80% in cash and fixed interest and the balance in Australian equities. As at 31 December 2004, an initial allocation of $50m had been made to the surplus capital portfolio. Given the Group’s surplus capital position at balance date (ie. 1.85x MCR), further funds were allocated to the surplus capital fund in early 2005. This increases the Group’s interest rate leverage and decreases its equity exposure.
C.2 Technical reserves funds
The return on the technical reserves portfolio has been generated from the physical fixed interest assets and from the overlay. The overlay consists of a combination of physical equities plus offsetting derivatives positions. It has been designed to capture active market return on the holdings of physical equities whilst maintaining full effective exposure to the fixed interest sector.
The funding of the derivative overlay strategy that commenced in June 2004 was completed, with more of the assets backing the technical reserves being switched out of fixed interest and invested in Australian equities and listed property trusts. At the same time, derivatives were acquired to neutralise the equity market risk associated with this investment in equities.
The active management of the additional assets invested in the sharemarket, after allowing for the fixed interest return foregone and the costs of the overlay generated a net contribution of $7m (pre-tax) in 1H05.
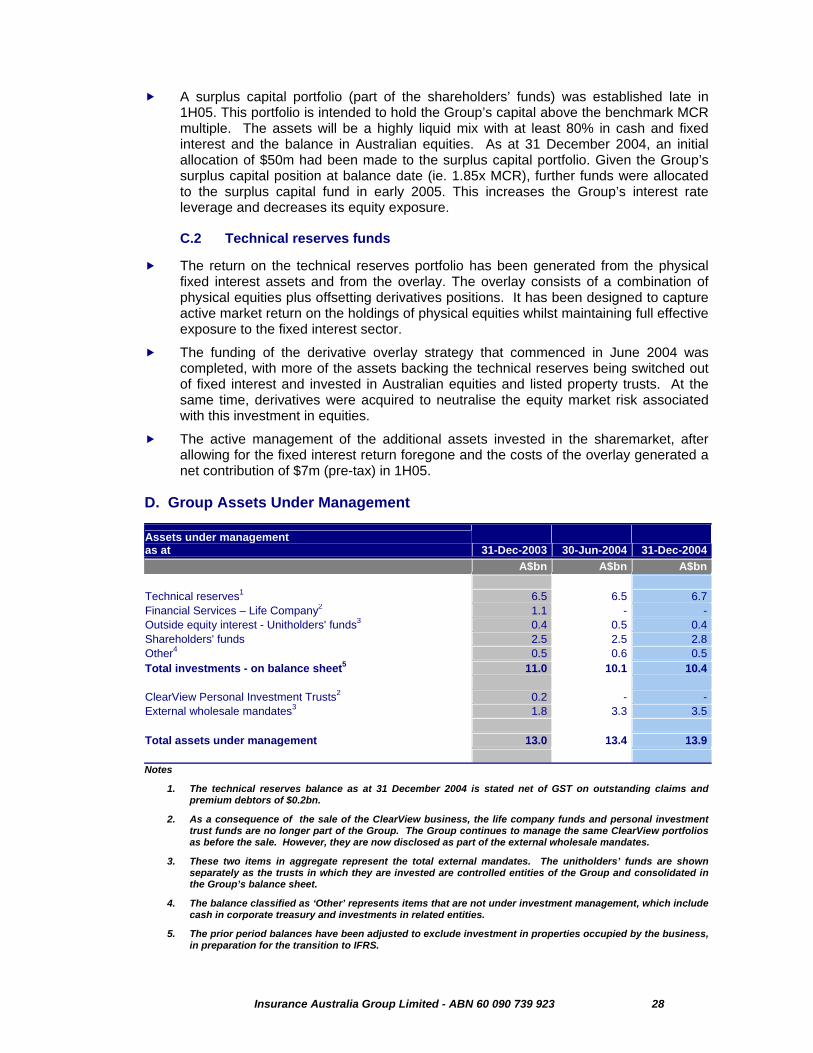
D. Group Assets Under Management
Assets under management as at 31-Dec-2003 30-Jun-2004 31-Dec-2004 A$bn A$bn A$bn Technical reserves1 6.5 6.5 6.7Financial Services – Life Company2 1.1 - -Outside equity interest - Unitholders' funds3 0.4 0.5 0.4Shareholders' funds 2.5 2.5 2.8Other4 0.5 0.6 0.5Total investments - on balance sheet5 11.0 10.1 10.4 ClearView Personal Investment Trusts2 0.2 - -External wholesale mandates3 1.8 3.3 3.5 Total assets under management 13.0 13.4 13.9 Notes
1. The technical reserves balance as at 31 December 2004 is stated net of GST on outstanding claims and premium debtors of $0.2bn.
2. As a consequence of the sale of the ClearView business, the life company funds and personal investment trust funds are no longer part of the Group. The Group continues to manage the same ClearView portfolios as before the sale. However, they are now disclosed as part of the external wholesale mandates.
3. These two items in aggregate represent the total external mandates. The unitholders’ funds are shown separately as the trusts in which they are invested are controlled entities of the Group and consolidated in the Group’s balance sheet.
4. The balance classified as ‘Other’ represents items that are not under investment management, which include cash in corporate treasury and investments in related entities.
5. The prior period balances have been adjusted to exclude investment in properties occupied by the business, in preparation for the transition to IFRS.
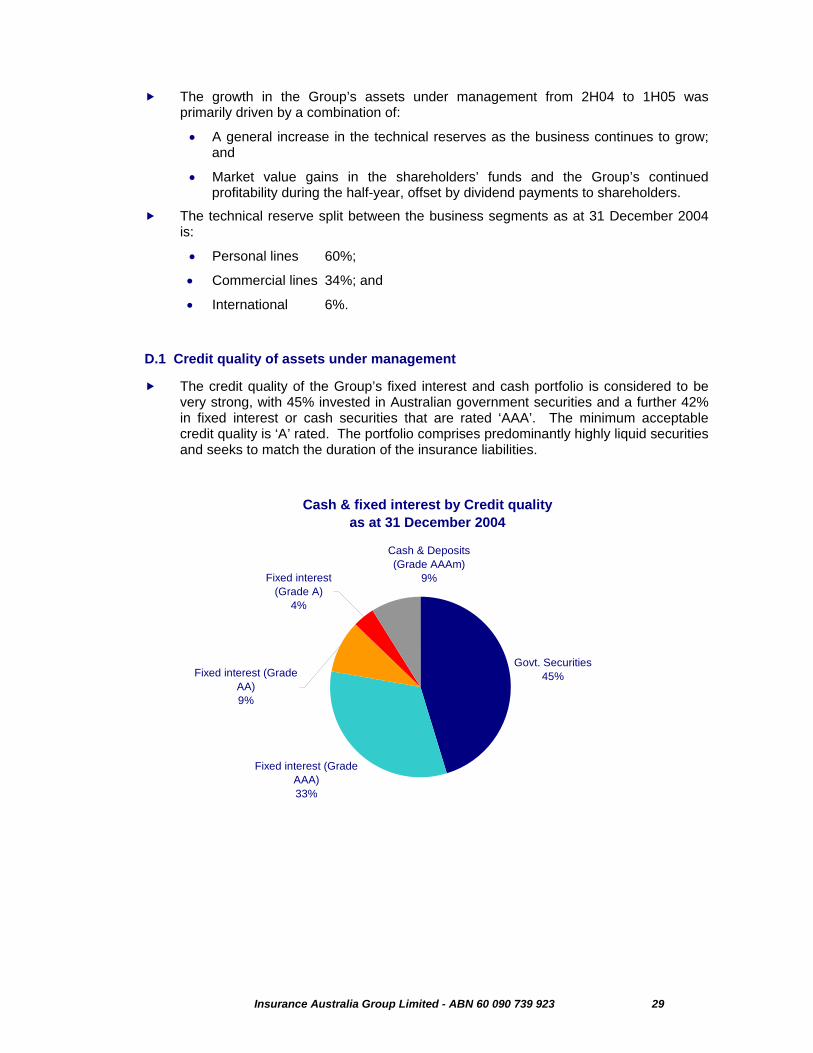
Insurance Australia Group Limited - ABN 60 090 739 923 29
The growth in the Group’s assets under management from 2H04 to 1H05 was primarily driven by a combination of:
• A general increase in the technical reserves as the business continues to grow; and
• Market value gains in the shareholders’ funds and the Group’s continued profitability during the half-year, offset by dividend payments to shareholders.
The technical reserve split between the business segments as at 31 December 2004 is:
• Personal lines 60%;
• Commercial lines 34%; and
• International 6%.
D.1 Credit quality of assets under management
The credit quality of the Group’s fixed interest and cash portfolio is considered to be very strong, with 45% invested in Australian government securities and a further 42% in fixed interest or cash securities that are rated ‘AAA’. The minimum acceptable credit quality is ‘A’ rated. The portfolio comprises predominantly highly liquid securities and seeks to match the duration of the insurance liabilities.
Cash & fixed interest by Credit qualityas at 31 December 2004
Govt. Securities45%
Fixed interest (Grade AAA)33%
Fixed interest (Grade AA)9%
Cash & Deposits (Grade AAAm)
9%Fixed interest (Grade A)
4%
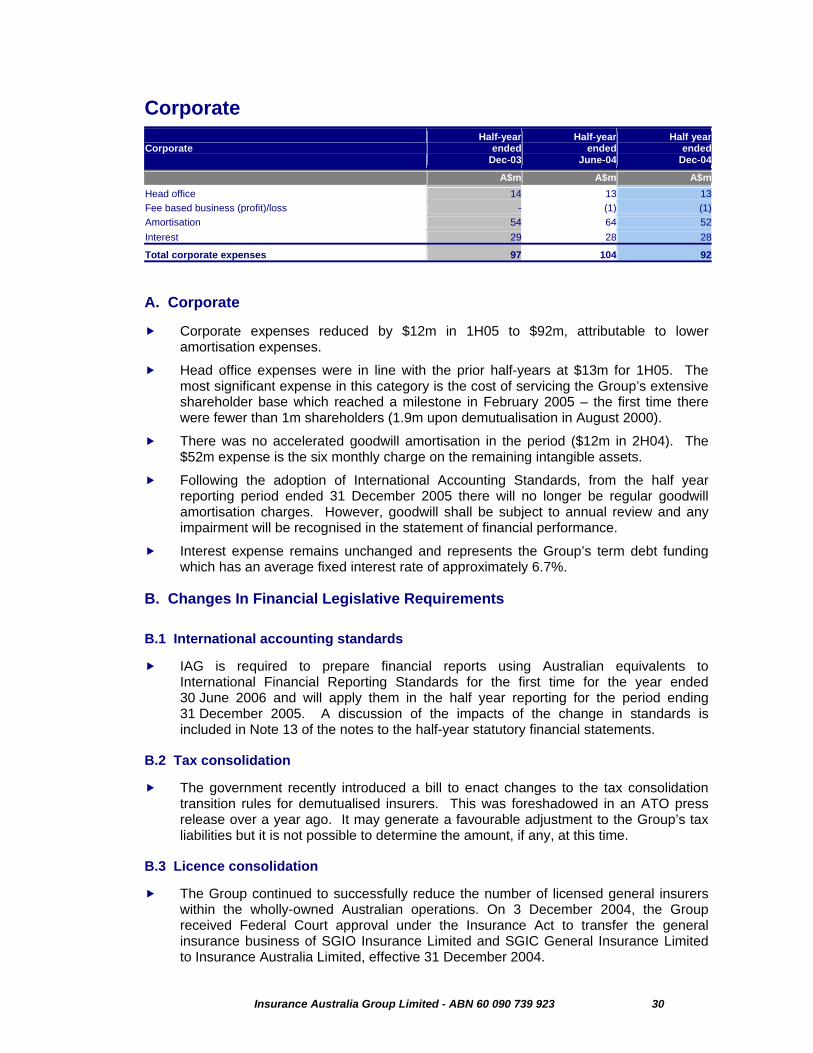
Insurance Australia Group Limited - ABN 60 090 739 923 30
Corporate
Corporate Half-year
endedDec-03
Half-year ended
June-04
Half yearended
Dec-04
A$m A$m A$mHead office 14 13 13Fee based business (profit)/loss - (1) (1)Amortisation 54 64 52Interest 29 28 28
Total corporate expenses 97 104 92
A. Corporate
Corporate expenses reduced by $12m in 1H05 to $92m, attributable to lower amortisation expenses.
Head office expenses were in line with the prior half-years at $13m for 1H05. The most significant expense in this category is the cost of servicing the Group’s extensive shareholder base which reached a milestone in February 2005 – the first time there were fewer than 1m shareholders (1.9m upon demutualisation in August 2000).
There was no accelerated goodwill amortisation in the period ($12m in 2H04). The $52m expense is the six monthly charge on the remaining intangible assets.
Following the adoption of International Accounting Standards, from the half year reporting period ended 31 December 2005 there will no longer be regular goodwill amortisation charges. However, goodwill shall be subject to annual review and any impairment will be recognised in the statement of financial performance.
Interest expense remains unchanged and represents the Group’s term debt funding which has an average fixed interest rate of approximately 6.7%.
B. Changes In Financial Legislative Requirements
B.1 International accounting standards
IAG is required to prepare financial reports using Australian equivalents to International Financial Reporting Standards for the first time for the year ended 30 June 2006 and will apply them in the half year reporting for the period ending 31 December 2005. A discussion of the impacts of the change in standards is included in Note 13 of the notes to the half-year statutory financial statements.
B.2 Tax consolidation
The government recently introduced a bill to enact changes to the tax consolidation transition rules for demutualised insurers. This was foreshadowed in an ATO press release over a year ago. It may generate a favourable adjustment to the Group’s tax liabilities but it is not possible to determine the amount, if any, at this time.
B.3 Licence consolidation
The Group continued to successfully reduce the number of licensed general insurers within the wholly-owned Australian operations. On 3 December 2004, the Group received Federal Court approval under the Insurance Act to transfer the general insurance business of SGIO Insurance Limited and SGIC General Insurance Limited to Insurance Australia Limited, effective 31 December 2004.
Insurance Australia Group Limited - ABN 60 090 739 923 31
Approval was also granted by the Federal Court to effect an interdependent scheme of arrangement under the Corporations Act, which eliminated six entities from the Group.
From 1 January 2005, Insurance Australia Limited is the insurer for the general insurance businesses that use the SGIC and SGIO brands.
C. Information Systems
During 1H05, the Group’s technology services efforts were focused on three key areas:
• Further integration of CGU;
• Upgrading the technology infrastructure to deliver increased service levels with respect to robustness, speed, flexibility and security; and
• The rollout of “CGU Connect” the new generation of web based systems for the broker market.
C.1 Integration
During December 2004, Technology Services completed the final projects that were key enablers for the realisation of the CGU integration benefits. These major achievements were:
• The decommissioning of an additional five workers’ compensation systems, completing the task of reducing the number of systems handling workers’ compensation business from 13 to 3;
• The CGU Data Centre in Latrobe Street Melbourne was migrated to the Group’s new Melbourne Data Centre (MDC). This completes the consolidation of the three Australian data centres into the one facility; and
• The consolidation of the CGU Sydney CBD staff into 388 George Street head office. This completed all staff relocations and brought the number of staff relocated in the consolidation of premises across Australia to well over 4,000.
Only the data centre integration and some of the staff relocations were considered in the original integration costs and benefits. The other elements were identified later and managed within the project framework.
C.2 Technology infrastructure upgrade
The transformation of the Australian technology infrastructure continued. During 1H05, the desktop refresh was completed with over 12,000 new desktops/laptops deployed throughout the organisation.
VOIP (Voice Over Internet Protocol) was rolled out to 2,500 staff, providing the benefits of a combined voice and data network. Benefits include:
• Staff mobility i.e. staff can be at home or at another office and have access to the same phone and customer systems as if they were in their workplace. This provides improved flexibility for people and additional business continuity protection; and
• Reduced telecommunication costs.
Completion of the VOIP rollout to the remaining staff is on track for completion by the end of FY06.
The New Zealand business has already implemented VOIP through its network.
Insurance Australia Group Limited - ABN 60 090 739 923 32
C.3 New technology for CGU brokers
CGU Connect is the Group’s name for its new generation of web-based systems for the CGU broker network. It has been developed in a modular architecture that will allow new products to be made available as they are developed. The Commercial Pack, Home and Landlords’ insurance products were all launched during 1H05.
C.4 New technology for NZ personal lines
The project to install the Australian personal lines systems into the New Zealand business has commenced. The target date for new business being on the New Zealand version is 1H07.
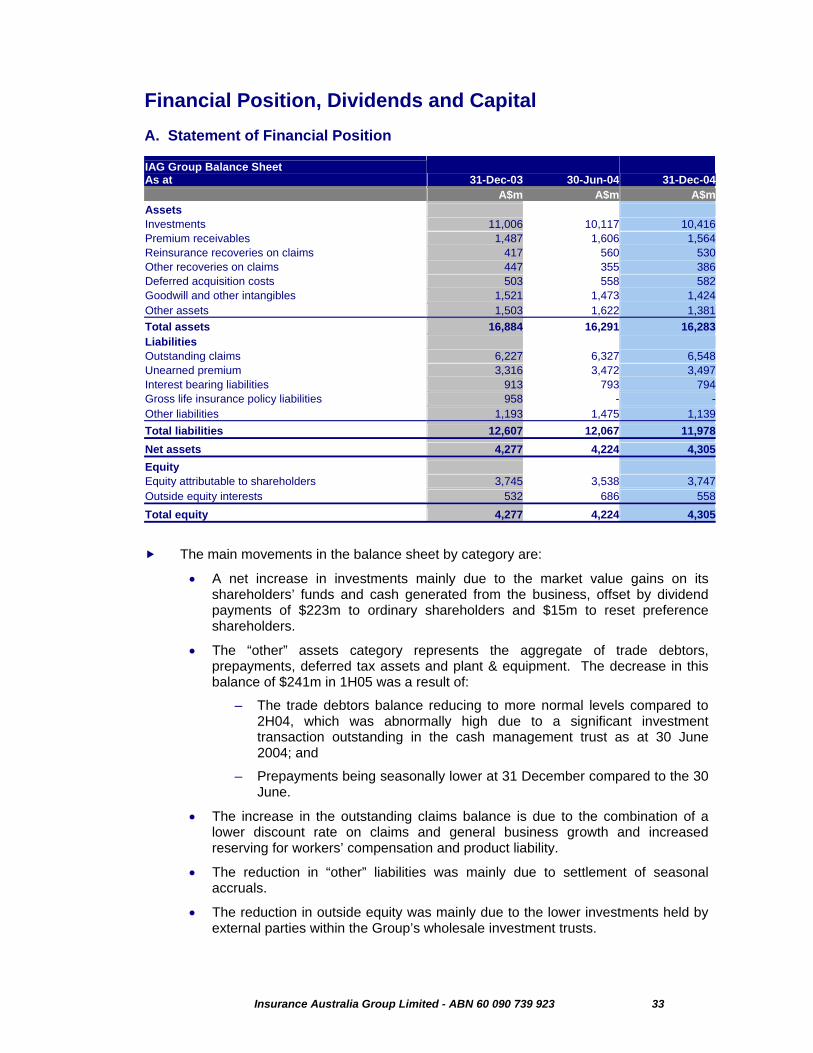
Insurance Australia Group Limited - ABN 60 090 739 923 33
Financial Position, Dividends and Capital A. Statement of Financial Position
IAG Group Balance Sheet As at 31-Dec-03 30-Jun-04 31-Dec-04 A$m A$m A$mAssets Investments 11,006 10,117 10,416Premium receivables 1,487 1,606 1,564Reinsurance recoveries on claims 417 560 530Other recoveries on claims 447 355 386Deferred acquisition costs 503 558 582Goodwill and other intangibles 1,521 1,473 1,424Other assets 1,503 1,622 1,381Total assets 16,884 16,291 16,283Liabilities Outstanding claims 6,227 6,327 6,548Unearned premium 3,316 3,472 3,497Interest bearing liabilities 913 793 794Gross life insurance policy liabilities 958 - -Other liabilities 1,193 1,475 1,139Total liabilities 12,607 12,067 11,978Net assets 4,277 4,224 4,305Equity Equity attributable to shareholders 3,745 3,538 3,747Outside equity interests 532 686 558Total equity 4,277 4,224 4,305
The main movements in the balance sheet by category are:
• A net increase in investments mainly due to the market value gains on its shareholders’ funds and cash generated from the business, offset by dividend payments of $223m to ordinary shareholders and $15m to reset preference shareholders.
• The “other” assets category represents the aggregate of trade debtors, prepayments, deferred tax assets and plant & equipment. The decrease in this balance of $241m in 1H05 was a result of:
– The trade debtors balance reducing to more normal levels compared to 2H04, which was abnormally high due to a significant investment transaction outstanding in the cash management trust as at 30 June 2004; and
– Prepayments being seasonally lower at 31 December compared to the 30 June.
• The increase in the outstanding claims balance is due to the combination of a lower discount rate on claims and general business growth and increased reserving for workers’ compensation and product liability.
• The reduction in “other” liabilities was mainly due to settlement of seasonal accruals.
• The reduction in outside equity was mainly due to the lower investments held by external parties within the Group’s wholesale investment trusts.
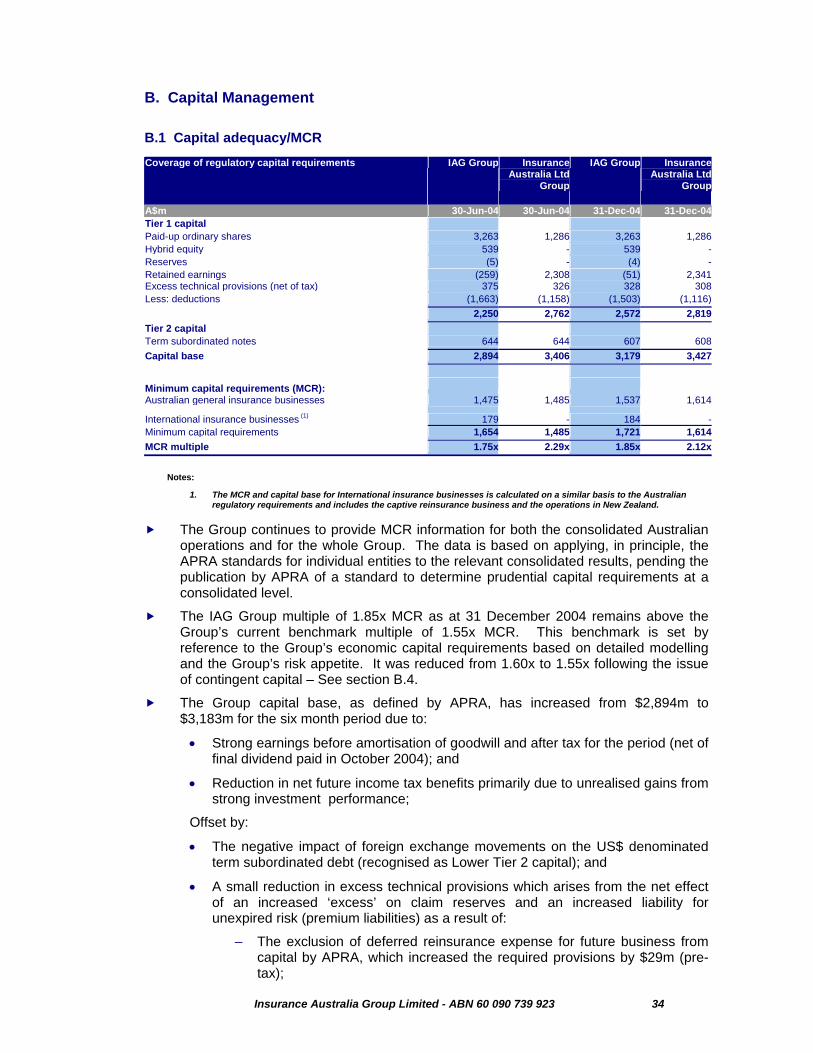
Insurance Australia Group Limited - ABN 60 090 739 923 34
B. Capital Management
B.1 Capital adequacy/MCR Coverage of regulatory capital requirements IAG Group Insurance
Australia Ltd Group
IAG Group Insurance Australia Ltd
Group
A$m 30-Jun-04 30-Jun-04 31-Dec-04 31-Dec-04Tier 1 capital Paid-up ordinary shares 3,263 1,286 3,263 1,286Hybrid equity 539 - 539 -Reserves (5) - (4) -Retained earnings (259) 2,308 (51) 2,341Excess technical provisions (net of tax) 375 326 328 308Less: deductions (1,663) (1,158) (1,503) (1,116) 2,250 2,762 2,572 2,819Tier 2 capital Term subordinated notes 644 644 607 608Capital base 2,894 3,406 3,179 3,427
Minimum capital requirements (MCR): Australian general insurance businesses 1,475 1,485 1,537 1,614
International insurance businesses (1) 179 - 184 -Minimum capital requirements 1,654 1,485 1,721 1,614MCR multiple 1.75x 2.29x 1.85x 2.12x
Notes:
1. The MCR and capital base for International insurance businesses is calculated on a similar basis to the Australian regulatory requirements and includes the captive reinsurance business and the operations in New Zealand.
The Group continues to provide MCR information for both the consolidated Australian
operations and for the whole Group. The data is based on applying, in principle, the APRA standards for individual entities to the relevant consolidated results, pending the publication by APRA of a standard to determine prudential capital requirements at a consolidated level.
The IAG Group multiple of 1.85x MCR as at 31 December 2004 remains above the Group’s current benchmark multiple of 1.55x MCR. This benchmark is set by reference to the Group’s economic capital requirements based on detailed modelling and the Group’s risk appetite. It was reduced from 1.60x to 1.55x following the issue of contingent capital – See section B.4.
The Group capital base, as defined by APRA, has increased from $2,894m to $3,183m for the six month period due to:
• Strong earnings before amortisation of goodwill and after tax for the period (net of final dividend paid in October 2004); and
• Reduction in net future income tax benefits primarily due to unrealised gains from strong investment performance;
Offset by:
• The negative impact of foreign exchange movements on the US$ denominated term subordinated debt (recognised as Lower Tier 2 capital); and
• A small reduction in excess technical provisions which arises from the net effect of an increased ‘excess’ on claim reserves and an increased liability for unexpired risk (premium liabilities) as a result of:
– The exclusion of deferred reinsurance expense for future business from capital by APRA, which increased the required provisions by $29m (pre-tax);
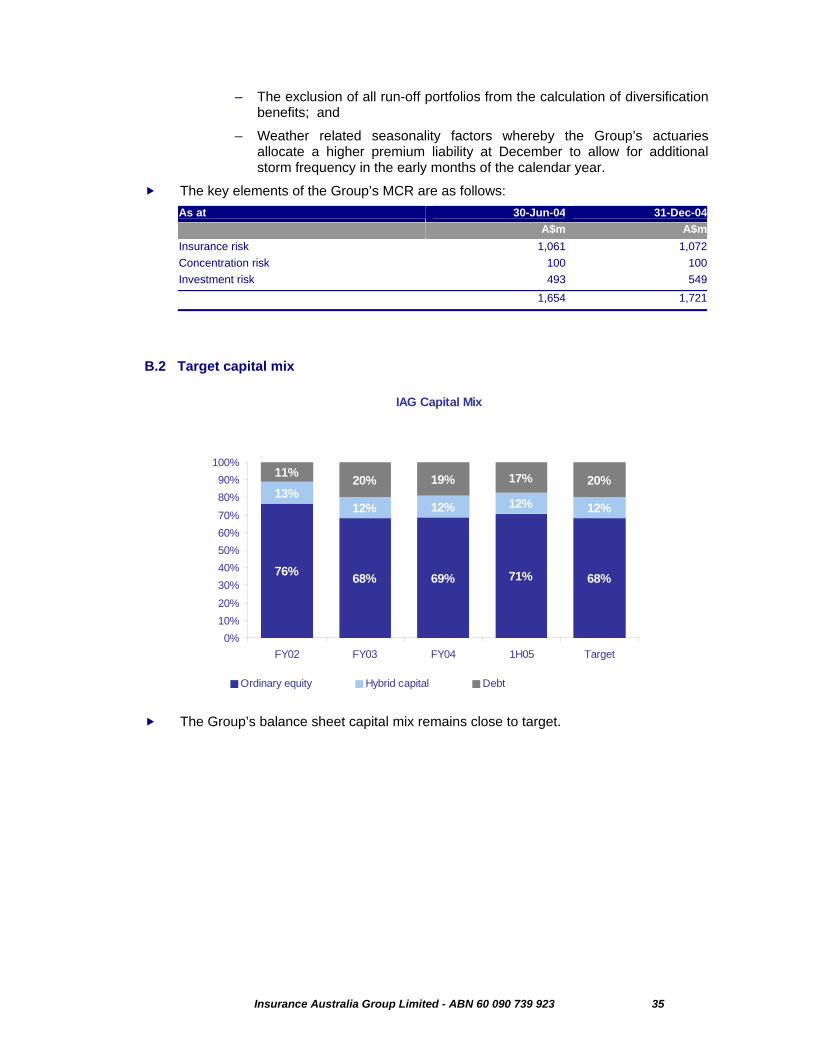
Insurance Australia Group Limited - ABN 60 090 739 923 35
– The exclusion of all run-off portfolios from the calculation of diversification benefits; and
– Weather related seasonality factors whereby the Group’s actuaries allocate a higher premium liability at December to allow for additional storm frequency in the early months of the calendar year.
The key elements of the Group’s MCR are as follows: As at 30-Jun-04 31-Dec-04 A$m A$mInsurance risk 1,061 1,072Concentration risk 100 100Investment risk 493 549
1,654 1,721
B.2 Target capital mix
IAG Capital Mix
68%
13%12%
20%
71%69%68%76%
12%12%12%
11% 19%20% 17%
0%10%20%30%40%50%60%70%80%90%
100%
FY02 FY03 FY04 1H05 Target
Ordinary equity Hybrid capital Debt
The Group’s balance sheet capital mix remains close to target.
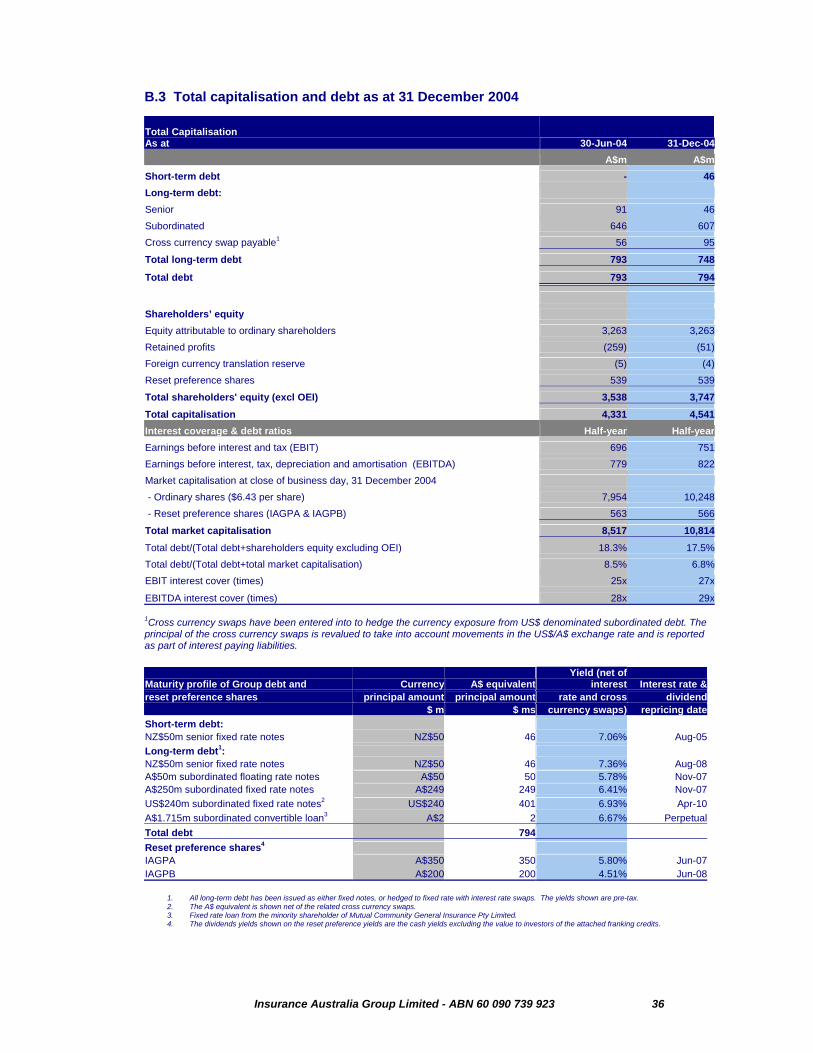
Insurance Australia Group Limited - ABN 60 090 739 923 36
B.3 Total capitalisation and debt as at 31 December 2004
Total Capitalisation As at 30-Jun-04 31-Dec-04 A$m A$mShort-term debt - 46Long-term debt: Senior 91 46Subordinated 646 607Cross currency swap payable1 56 95
Total long-term debt 793 748
Total debt 793 794
Shareholders’ equity Equity attributable to ordinary shareholders 3,263 3,263Retained profits (259) (51)Foreign currency translation reserve (5) (4)Reset preference shares 539 539
Total shareholders' equity (excl OEI) 3,538 3,747Total capitalisation 4,331 4,541Interest coverage & debt ratios Half-year Half-yearEarnings before interest and tax (EBIT) 696 751Earnings before interest, tax, depreciation and amortisation (EBITDA) 779 822Market capitalisation at close of business day, 31 December 2004 - Ordinary shares ($6.43 per share) 7,954 10,248 - Reset preference shares (IAGPA & IAGPB) 563 566
Total market capitalisation 8,517 10,814Total debt/(Total debt+shareholders equity excluding OEI) 18.3% 17.5%Total debt/(Total debt+total market capitalisation) 8.5% 6.8%EBIT interest cover (times) 25x 27x
EBITDA interest cover (times) 28x 29x
1Cross currency swaps have been entered into to hedge the currency exposure from US$ denominated subordinated debt. The principal of the cross currency swaps is revalued to take into account movements in the US$/A$ exchange rate and is reported as part of interest paying liabilities.
Maturity profile of Group debt and Currency A$ equivalentYield (net of
interest Interest rate &reset preference shares principal amount principal amount rate and cross dividend $ m $ ms currency swaps) repricing dateShort-term debt: NZ$50m senior fixed rate notes NZ$50 46 7.06% Aug-05Long-term debt1: NZ$50m senior fixed rate notes NZ$50 46 7.36% Aug-08A$50m subordinated floating rate notes A$50 50 5.78% Nov-07A$250m subordinated fixed rate notes A$249 249 6.41% Nov-07US$240m subordinated fixed rate notes2 US$240 401 6.93% Apr-10A$1.715m subordinated convertible loan3 A$2 2 6.67% PerpetualTotal debt 794 Reset preference shares4 IAGPA A$350 350 5.80% Jun-07IAGPB A$200 200 4.51% Jun-08
1. All long-term debt has been issued as either fixed notes, or hedged to fixed rate with interest rate swaps. The yields shown are pre-tax. 2. The A$ equivalent is shown net of the related cross currency swaps. 3. Fixed rate loan from the minority shareholder of Mutual Community General Insurance Pty Limited. 4. The dividends yields shown on the reset preference yields are the cash yields excluding the value to investors of the attached franking credits.
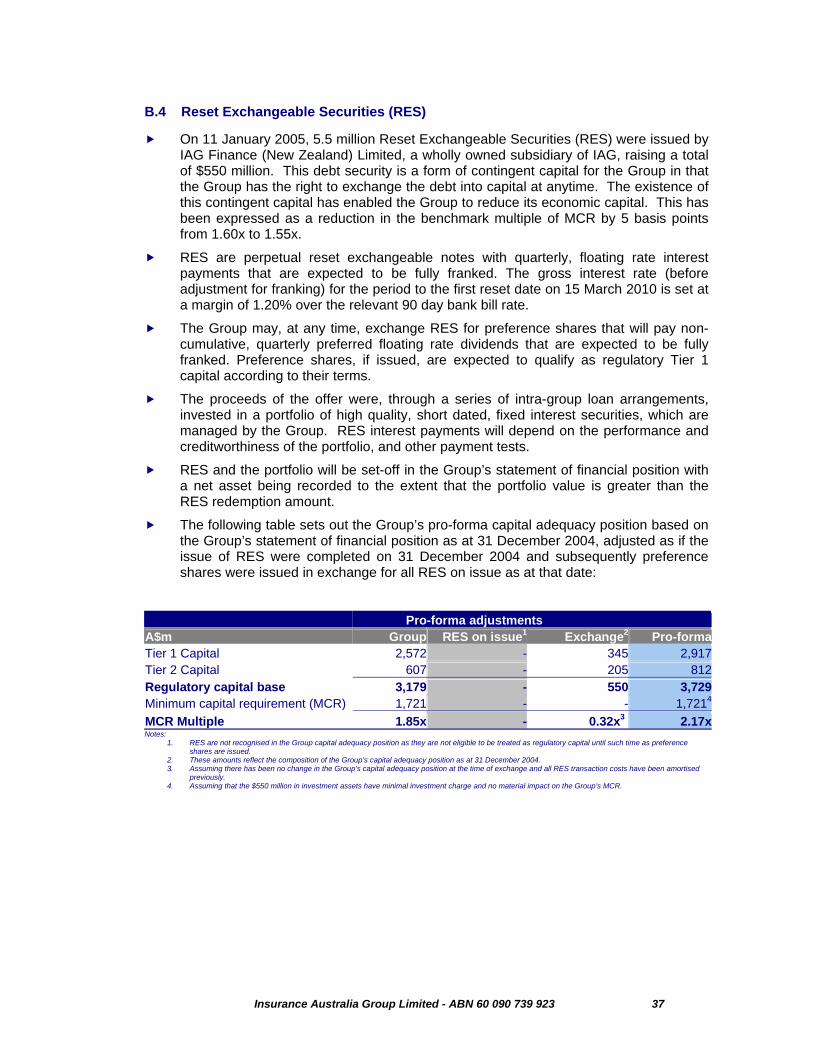
Insurance Australia Group Limited - ABN 60 090 739 923 37
B.4 Reset Exchangeable Securities (RES)
On 11 January 2005, 5.5 million Reset Exchangeable Securities (RES) were issued by IAG Finance (New Zealand) Limited, a wholly owned subsidiary of IAG, raising a total of $550 million. This debt security is a form of contingent capital for the Group in that the Group has the right to exchange the debt into capital at anytime. The existence of this contingent capital has enabled the Group to reduce its economic capital. This has been expressed as a reduction in the benchmark multiple of MCR by 5 basis points from 1.60x to 1.55x.
RES are perpetual reset exchangeable notes with quarterly, floating rate interest payments that are expected to be fully franked. The gross interest rate (before adjustment for franking) for the period to the first reset date on 15 March 2010 is set at a margin of 1.20% over the relevant 90 day bank bill rate.
The Group may, at any time, exchange RES for preference shares that will pay non-cumulative, quarterly preferred floating rate dividends that are expected to be fully franked. Preference shares, if issued, are expected to qualify as regulatory Tier 1 capital according to their terms.
The proceeds of the offer were, through a series of intra-group loan arrangements, invested in a portfolio of high quality, short dated, fixed interest securities, which are managed by the Group. RES interest payments will depend on the performance and creditworthiness of the portfolio, and other payment tests.
RES and the portfolio will be set-off in the Group’s statement of financial position with a net asset being recorded to the extent that the portfolio value is greater than the RES redemption amount.
The following table sets out the Group’s pro-forma capital adequacy position based on the Group’s statement of financial position as at 31 December 2004, adjusted as if the issue of RES were completed on 31 December 2004 and subsequently preference shares were issued in exchange for all RES on issue as at that date:
Pro-forma adjustments A$m Group RES on issue1 Exchange2 Pro-formaTier 1 Capital 2,572 - 345 2,917Tier 2 Capital 607 - 205 812Regulatory capital base 3,179 - 550 3,729Minimum capital requirement (MCR) 1,721 - - 1,7214
MCR Multiple 1.85x - 0.32x3 2.17xNotes:
1. RES are not recognised in the Group capital adequacy position as they are not eligible to be treated as regulatory capital until such time as preference shares are issued.
2. These amounts reflect the composition of the Group’s capital adequacy position as at 31 December 2004. 3. Assuming there has been no change in the Group’s capital adequacy position at the time of exchange and all RES transaction costs have been amortised
previously. 4. Assuming that the $550 million in investment assets have minimal investment charge and no material impact on the Group’s MCR.
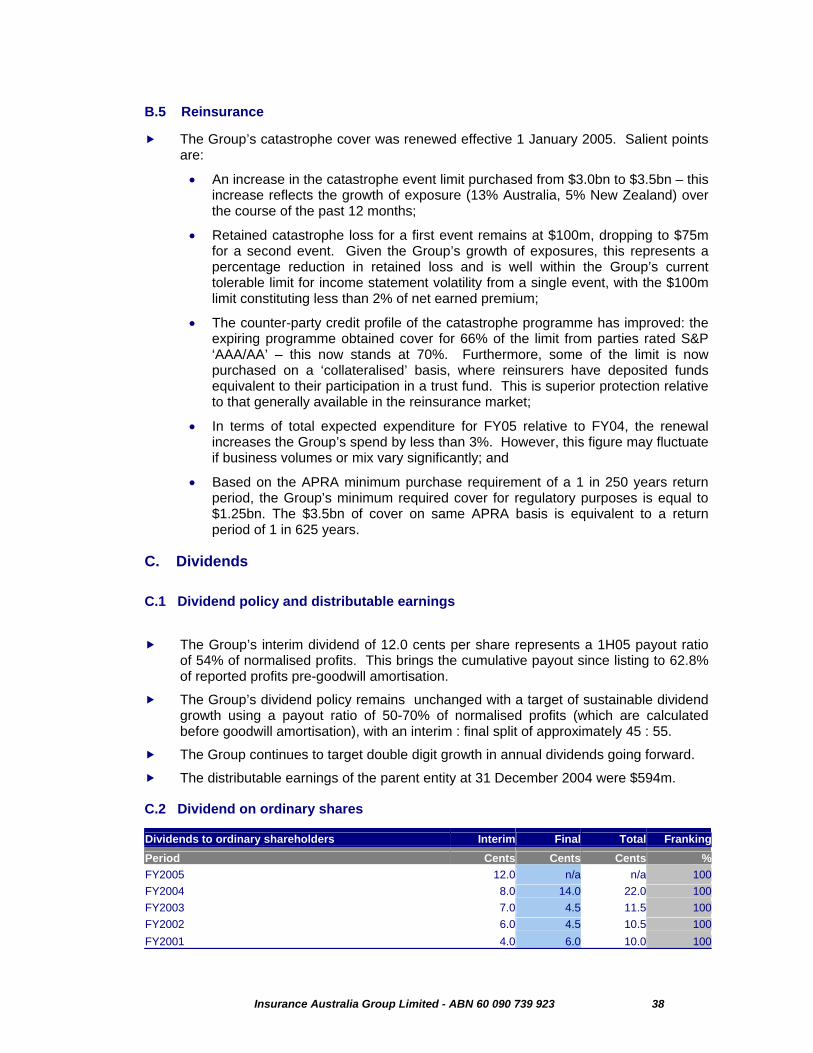
Insurance Australia Group Limited - ABN 60 090 739 923 38
B.5 Reinsurance
The Group’s catastrophe cover was renewed effective 1 January 2005. Salient points are:
• An increase in the catastrophe event limit purchased from $3.0bn to $3.5bn – this increase reflects the growth of exposure (13% Australia, 5% New Zealand) over the course of the past 12 months;
• Retained catastrophe loss for a first event remains at $100m, dropping to $75m for a second event. Given the Group’s growth of exposures, this represents a percentage reduction in retained loss and is well within the Group’s current tolerable limit for income statement volatility from a single event, with the $100m limit constituting less than 2% of net earned premium;
• The counter-party credit profile of the catastrophe programme has improved: the expiring programme obtained cover for 66% of the limit from parties rated S&P ‘AAA/AA’ – this now stands at 70%. Furthermore, some of the limit is now purchased on a ‘collateralised’ basis, where reinsurers have deposited funds equivalent to their participation in a trust fund. This is superior protection relative to that generally available in the reinsurance market;
• In terms of total expected expenditure for FY05 relative to FY04, the renewal increases the Group’s spend by less than 3%. However, this figure may fluctuate if business volumes or mix vary significantly; and
• Based on the APRA minimum purchase requirement of a 1 in 250 years return period, the Group’s minimum required cover for regulatory purposes is equal to $1.25bn. The $3.5bn of cover on same APRA basis is equivalent to a return period of 1 in 625 years.
C. Dividends
C.1 Dividend policy and distributable earnings
The Group’s interim dividend of 12.0 cents per share represents a 1H05 payout ratio
of 54% of normalised profits. This brings the cumulative payout since listing to 62.8% of reported profits pre-goodwill amortisation.
The Group’s dividend policy remains unchanged with a target of sustainable dividend growth using a payout ratio of 50-70% of normalised profits (which are calculated before goodwill amortisation), with an interim : final split of approximately 45 : 55.
The Group continues to target double digit growth in annual dividends going forward.
The distributable earnings of the parent entity at 31 December 2004 were $594m.
C.2 Dividend on ordinary shares
Dividends to ordinary shareholders Interim Final Total FrankingPeriod Cents Cents Cents %FY2005 12.0 n/a n/a 100FY2004 8.0 14.0 22.0 100FY2003 7.0 4.5 11.5 100FY2002 6.0 4.5 10.5 100FY2001 4.0 6.0 10.0 100
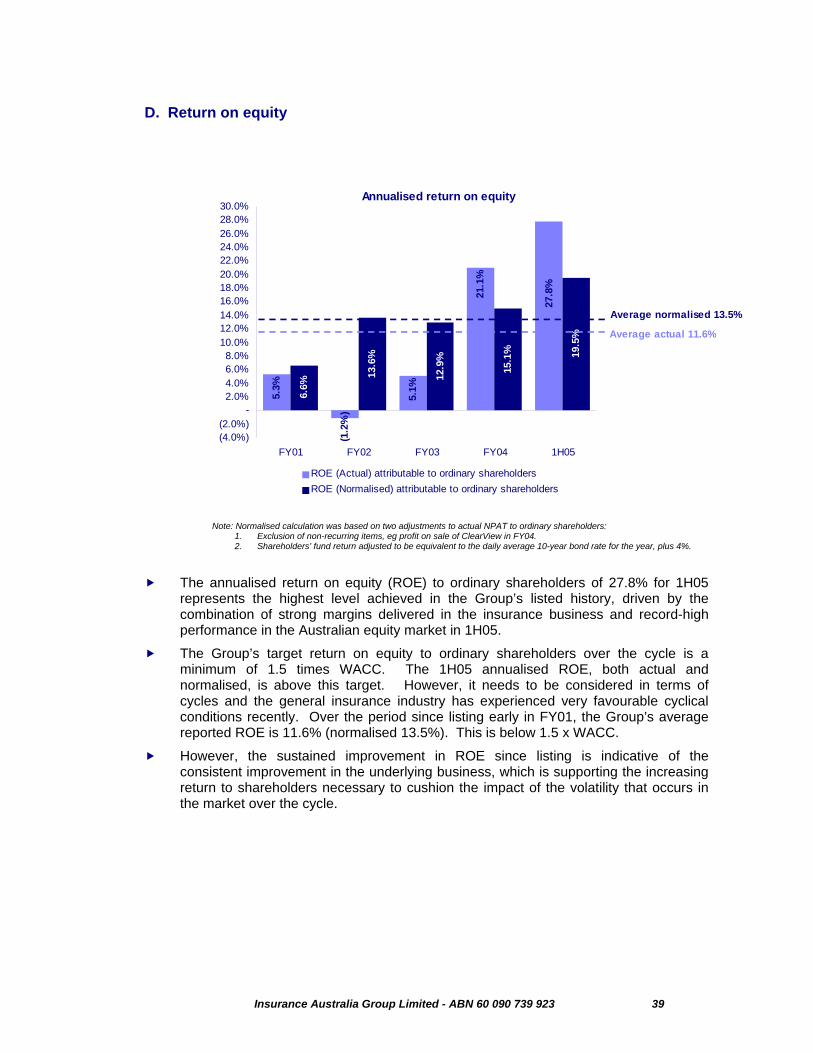
Insurance Australia Group Limited - ABN 60 090 739 923 39
D. Return on equity
Annualised return on equity
27.8
%
21.1
%
5.1%5.3%
(1.2
%)
19.5
%
15.1
%
12.9
%
6.6%
13.6
%
(4.0%)(2.0%)
-2.0%4.0%6.0%8.0%
10.0%12.0%14.0%16.0%18.0%20.0%22.0%24.0%26.0%28.0%30.0%
FY01 FY02 FY03 FY04 1H05
ROE (Actual) attributable to ordinary shareholdersROE (Normalised) attributable to ordinary shareholders
Average actual 11.6%
Average normalised 13.5%
Note: Normalised calculation was based on two adjustments to actual NPAT to ordinary shareholders:
1. Exclusion of non-recurring items, eg profit on sale of ClearView in FY04. 2. Shareholders’ fund return adjusted to be equivalent to the daily average 10-year bond rate for the year, plus 4%.
The annualised return on equity (ROE) to ordinary shareholders of 27.8% for 1H05 represents the highest level achieved in the Group’s listed history, driven by the combination of strong margins delivered in the insurance business and record-high performance in the Australian equity market in 1H05.
The Group’s target return on equity to ordinary shareholders over the cycle is a minimum of 1.5 times WACC. The 1H05 annualised ROE, both actual and normalised, is above this target. However, it needs to be considered in terms of cycles and the general insurance industry has experienced very favourable cyclical conditions recently. Over the period since listing early in FY01, the Group’s average reported ROE is 11.6% (normalised 13.5%). This is below 1.5 x WACC.
However, the sustained improvement in ROE since listing is indicative of the consistent improvement in the underlying business, which is supporting the increasing return to shareholders necessary to cushion the impact of the volatility that occurs in the market over the cycle.
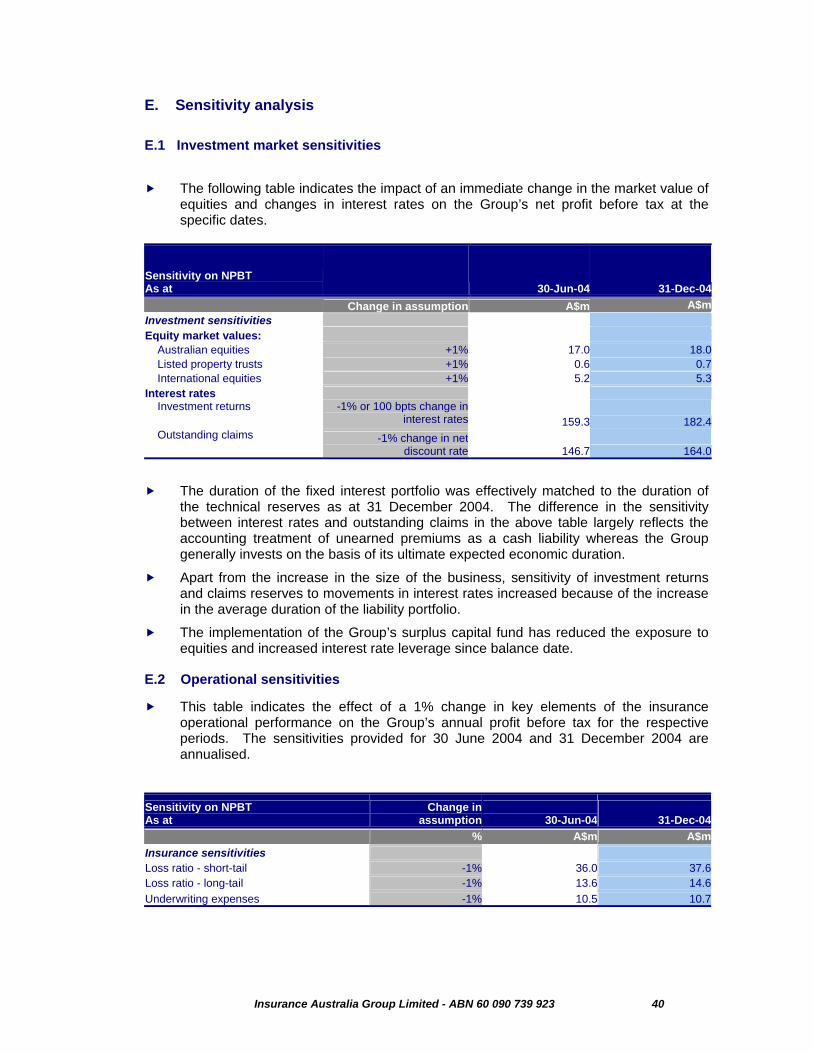
Insurance Australia Group Limited - ABN 60 090 739 923 40
E. Sensitivity analysis
E.1 Investment market sensitivities
The following table indicates the impact of an immediate change in the market value of
equities and changes in interest rates on the Group’s net profit before tax at the specific dates.
Sensitivity on NPBT As at 30-Jun-04 31-Dec-04 Change in assumption A$m A$mInvestment sensitivities Equity market values: Australian equities +1% 17.0 18.0 Listed property trusts +1% 0.6 0.7 International equities +1% 5.2 5.3Interest rates Investment returns -1% or 100 bpts change in
interest rates 159.3 182.4 Outstanding claims -1% change in net
discount rate 146.7 164.0
The duration of the fixed interest portfolio was effectively matched to the duration of the technical reserves as at 31 December 2004. The difference in the sensitivity between interest rates and outstanding claims in the above table largely reflects the accounting treatment of unearned premiums as a cash liability whereas the Group generally invests on the basis of its ultimate expected economic duration.
Apart from the increase in the size of the business, sensitivity of investment returns and claims reserves to movements in interest rates increased because of the increase in the average duration of the liability portfolio.
The implementation of the Group’s surplus capital fund has reduced the exposure to equities and increased interest rate leverage since balance date.
E.2 Operational sensitivities
This table indicates the effect of a 1% change in key elements of the insurance operational performance on the Group’s annual profit before tax for the respective periods. The sensitivities provided for 30 June 2004 and 31 December 2004 are annualised.
Sensitivity on NPBT As at
Change in assumption
30-Jun-04 31-Dec-04
% A$m A$mInsurance sensitivities Loss ratio - short-tail -1% 36.0 37.6Loss ratio - long-tail -1% 13.6 14.6Underwriting expenses -1% 10.5 10.7

Insurance Australia Group Limited - ABN 60 090 739 923 41
Appendix A – Strategy The Group’s strategic goals are as follows:
Top quartile total shareholder return;
Return on equity of at least 1.5 times weighted average cost of capital;
Establish an Asian foothold;
Maintain an 80:20 mix of short-tail:long-tail premiums; and
Maintain a ‘AA’ category rating.
The Group considers that these goals, when taken as a whole, are a fair representation of its strategic direction and risk appetite for the foreseeable future. The goals following top quartile total shareholder return (‘TSR’) should be regarded as inter-dependent components supporting the delivery of top quartile TSR.
A.1 Top quartile shareholder return
Top quartile TSR (within the S&P/ASX100) remains as the Group’s overall strategic goal. It is recognised that this is a tough goal, but is one the Group considers appropriate.
A.2 ROE of at least 1.5 times WACC
The Group targets a return for ordinary shareholders (‘ROE’) that is at least 1.5 times the Group weighted average cost of capital (‘WACC’). The return on the shareholders’ funds portfolio will continue to be normalised in measuring performance against this goal.
As at 30 June 2004, the WACC was assessed for this purpose as approximately 10%. The WACC is sensitive to the assumptions adopted for beta and equity risk premium and the treatment adopted for imputation credits. Therefore, in other contexts, a quite different WACC could emerge and it will, of course, fluctuate with movements in long-term interest rates.
The Group believes that a normalised return in excess of 1.6 times WACC is unlikely to be sustainable. This is consistent with the Group’s regularly publicised view that sustained returns, in excess of what is needed to ensure that shareholders receive an adequate return and continue to make capital available, are likely to result in increased competition and pricing pressure. Existing competitors, new entrants or consumer activism could drive this, as general insurance is a necessary community product and needs to remain available and affordable.
A.3 Establish an Asian foothold
In view of the Group’s leading market shares in the largest general insurance revenue streams in Australia and New Zealand, its acquisitive growth opportunities in these markets are very limited. Accordingly, the Group began investigating offshore growth prospects and, after extensive research, concluded that Asia currently provides the best fit for the Group to focus on for a range of acquisitive growth opportunities.
Other geographical areas will continue to be reviewed for potential on a periodic basis.
The Group is very conscious of the additional risks posed by significant international expansion beyond New Zealand. Extensive risk assessments are undertaken on each opportunity that is considered as having potential for the Group.
Insurance Australia Group Limited - ABN 60 090 739 923 42
A.4 Maintain an 80:20 mix of short-tail:long-tail premiums
The goal of maintaining an 80:20 mix of short-tail:long-tail premiums is indicative of the Group wishing to keep risks managed to a tolerable level.
Opportunities may arise at times that skew the mix of business away from this goal. If such an event were to occur, the Group would increase its focus on executing other opportunities to re-direct the mix back to the target within a reasonable timeframe.
The Group remains committed to delivering underwriting profits and achieving these is inherent in the delivery of returns of at least 1.5 times WACC.
A.5 Maintain a 'AA' category rating
The Group continues to consider that the conservative levels of capital dictated by targeting ‘AA’ category ratings are an appropriate reflection of the Group’s current risk appetite.
In determining the economic capital requirements of the Group, the modelling performed takes into account the financial metrics used for ‘AA’ insurer financial strength ratings as well as a risk of statutory insolvency of no more than 1-in-750 years and the metrics for determining prudential solvency under APRA standards.
The Group’s key wholly-owned insurance operations currently hold ‘AA’ insurer financial strength ratings (with ‘Stable’ outlook) from Standard & Poor’s. These are currently the highest ratings of any Australian-based financial institution.
Insurance Australia Group Limited - ABN 60 090 739 923 43
Appendix B - Key ASX Releases This schedule contains only a summary of the announcements made to the ASX since FY05 commenced. It does not include announcements of changes in Directors’ interests. Reference should be made to a copy of the ASX announcements should further information be required. These are available on www.iag.com.au
17 February 2005 Speculation re Asian expansion
Following media speculation, IAG confirmed it had no update to announce in respect of its Asian expansion plans.
27 January 2005 IAG issues shares on exercise of employee performance share rights IAG issued 923,000 ordinary shares on exercise of employee share rights.
11 January 2005 IAG issues 5.5m Reset Exchangeable Securities IAG announced that the offer of Reset Exchangeable Securities (RES) closed oversubscribed on 7 January 2005. Over-subscriptions of $50 million were accepted.
5.5m RES were issued by IAG Finance (New Zealand) Limited, a wholly owned subsidiary of IAG, raising a total of $550m.
It was advised that RES would begin trading on a deferred settlement basis on the ASX on 12 January 2005, with trading to commence on a normal basis on 19 January 2005. The interest rate for the first payment (to be made 15 March 2005) would be 4.69% per annum, fully franked.
24 December 2004 IAG issues shares on exercise of employee performance share rights IAG issued 63,800 ordinary shares on exercise of employee share rights.
10 December 2004 IAG issues replacement prospectus – Reset Exchangeable Securities Main update was to include the margin of 120 bpts over the 90 day BBSW.
29 November 2004 Initial Margin Confirmed for Reset Exchangeable Securities
IAG announced that the initial margin for the offer of Reset Exchangeable Securities (RES) was set at 1.20%, with the offer scheduled to open on 30 November 2004.
29 November 2004 IAG issues shares on exercise of employee performance share rights
IAG issued 212,500 ordinary shares on exercise of employee share rights.
Insurance Australia Group Limited - ABN 60 090 739 923 44
22 November 2004 IAG announced issue of Reset Exchangeable Securities (RES) IAG announced the proposed issue of A$500m (with capacity to accept an additional A$50m) Reset Exchangeable Securities (RES) as a part of the Group’s commitment to actively manage and enhance its capital structure. RES would deliver secure contingent access to Tier 1 capital and allow a release of capital into operations and/or to shareholders.
It was advised that RES would be quoted on the ASX and assigned an ‘A-‘ credit rating by S&P. RES holders would be entitled to receive non-cumulative, franked, quarterly, floating-rate interest payments. The interest payments would be dependent on the performance of the underlying ‘AAAf’ S&P rated portfolio of high quality, short-dated, fixed-interest securities and subject to certain payment tests. The interest rate for RES would be set at a margin of 1.0-1.3% over the 90 day BBSW and adjusted for franking. RES would be held off-balance sheet for IAG Group reporting.
10 November 2004 IAG released results of Annual General Meeting
IAG confirmed that Ms Dominique Fisher and Ms Anne Keating retired as directors of IAG at the conclusion of the company’s AGM in line with the Group’s tenure policy for non-executive directors. It was also confirmed that Ms Yasmin Allen and Mr Brian Schwartz were elected as directors of IAG. Ms Allen took office immediately and Mr Schwartz’s appointment was effective 1 January 2005.
10 November 2004 IAG confirms business momentum and launches its first Sustainability Report at its AGM
IAG confirmed that during the first three months of the current financial year the Group’s policy growth was strong, customer retention and satisfaction remained high, and the Group remained on track to achieve key targets for the full year.
IAG launched the Group’s first Sustainability Report during the AGM. The Sustainability Report details the Group’s performance in relation to a number of indicators, including IAG’s efforts to reduce insurable risks most common to its customers and to reduce its environmental impact.
9 November 2004 Dividends payable on Reset Preference Shares The Board of IAG declared fully franked dividends in respect of IAGPA and IAGPB. The record date was 29 November 2004 and Payment date was 15 December 2004.
The IAGPA dividend rate per annum was 5.80%, with $2.9079 payable per $100 share.
The IAGPB dividend rate per annum was 4.51%, with $2.2612 payable per $100 share.
28 October 2004 IAG issues shares on exercise of employee performance share rights
IAG issued 63,700 ordinary shares on exercise of employee share rights.
6 October 2004 IAG denies merger proposal with QBE Insurance
IAG announced that there was no merger proposal between itself and QBE Insurance following speculation in the media.
Insurance Australia Group Limited - ABN 60 090 739 923 45
5 October 2004 Pricing of shares to be allocated under Dividend Reinvestment Plan (DRP) IAG advised that ordinary shares to be allocated under the company’s DRP would be priced at $5.2047 per share for the 2004 final dividend. Under the DRP, around 12.07 million ordinary shares were allocated to participating shareholders.
30 September 2004 2004 Annual Report and notice of Annual General Meeting released to the market
29 September 2004 IAG issues shares on exercise of employee performance share rights
IAG issued 65,000 ordinary shares on exercise of employee share rights.
31 August 2004 IAG issues shares on exercise of employee performance share rights
IAG issued 15,000 ordinary shares on exercise of employee share rights.
27 August 2004 IAG issues shares on exercise of employee performance share rights
IAG issued 610,140 ordinary shares on exercise of employee share rights.
19 August 2004 Announcement of annual results – 30 June 2004 and declaration of a fully franked final dividend of 14.0 cents per ordinary share payable on 18 October 2004.
27 July 2004 IAG issues shares on exercise of employee performance share rights IAG issued 1,080,000 ordinary shares on exercise of employee share rights.
20 July 2004 IAG re-organises Australian insurance business along customer lines IAG announced a new structure for its Australian insurance operations more closely aligned to its core products – personal insurance and commercial classes.
15 July 2004 IAG settles with US insurer following successful arbitration
IAG accepted a settlement that will involve the Group receiving payment of US$25m. The settlement approximates the amount carried in the Group's accounts and had no material impact on the Group's profit for the six months ended 30 June 2004.
8 July 2004 Variation to Dividend Reinvestment Plan With effect from 15 September 2004, the issue price of DRP shares will be calculated to 4 decimal places.
Insurance Australia Group Limited - ABN 60 090 739 923 46
8 July 2004 Closing Date for Receipt of Nominations for Election of
Directors at the 2004 Annual General Meeting IAG has been granted a waiver from Listing Rule 14.3. As such, the closing date for receipt of nominations for election as directors at the 2004 Annual General Meeting will be 6 September 2004.
8 July 2004 IAG confirms small acquisition in New Zealand IAG confirmed that one of its New Zealand subsidiaries has acquired a 50% stake in Mike Henry Travel Insurance Limited (‘MHTI’).
IAG noted its intention to take over the underwriting of travel insurance policies issued by MHTI with effect from the final quarter of the 2004 calendar year. This acquisition is not significant to the results or financial position of IAG.
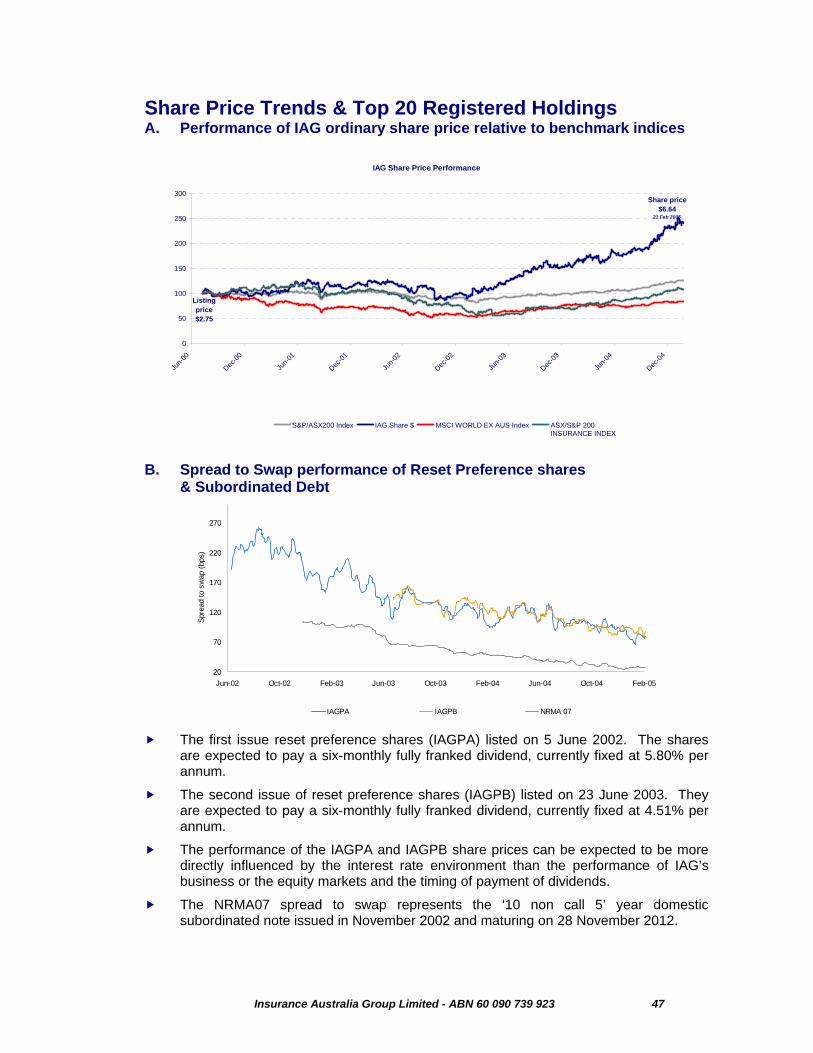
Insurance Australia Group Limited - ABN 60 090 739 923 47
Share Price Trends & Top 20 Registered Holdings A. Performance of IAG ordinary share price relative to benchmark indices
B. Spread to Swap performance of Reset Preference shares & Subordinated Debt
The first issue reset preference shares (IAGPA) listed on 5 June 2002. The shares are expected to pay a six-monthly fully franked dividend, currently fixed at 5.80% per annum.
The second issue of reset preference shares (IAGPB) listed on 23 June 2003. They are expected to pay a six-monthly fully franked dividend, currently fixed at 4.51% per annum.
The performance of the IAGPA and IAGPB share prices can be expected to be more directly influenced by the interest rate environment than the performance of IAG’s business or the equity markets and the timing of payment of dividends.
The NRMA07 spread to swap represents the ‘10 non call 5’ year domestic subordinated note issued in November 2002 and maturing on 28 November 2012.
20
70
120
170
220
270
Jun-02 Oct-02 Feb-03 Jun-03 Oct-03 Feb-04 Jun-04 Oct-04 Feb-05
Spre
ad to
sw
ap (b
ps)
IAGPA IAGPB NRMA 07
IAG Share Price Performance
0
50
100
150
200
250
300
Jun-0
0
Dec-00
Jun-0
1
Dec-01
Jun-0
2
Dec-02
Jun-0
3
Dec-03
Jun-0
4
Dec-04
S&P/ASX200 Index IAG Share $ MSCI WORLD EX AUS Index ASX/S&P 200 INSURANCE INDEX
Listing price $2.75
Share price $6.64
21 Feb 2005
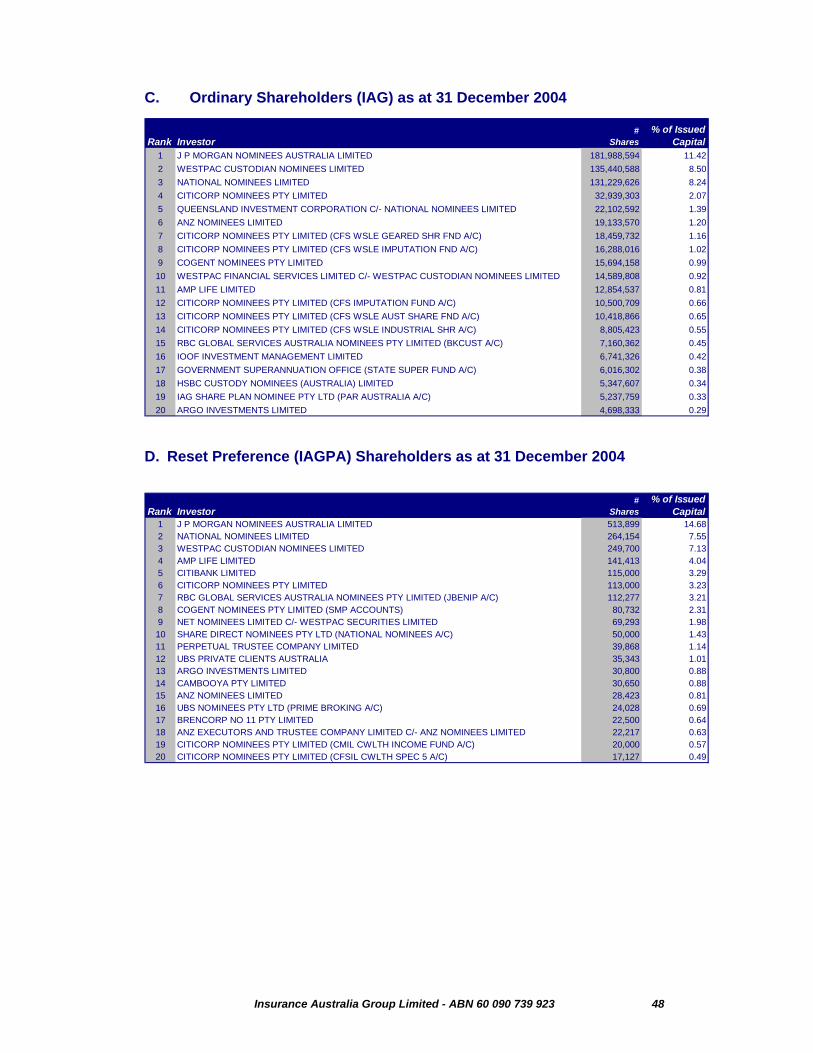
Insurance Australia Group Limited - ABN 60 090 739 923 48
C. Ordinary Shareholders (IAG) as at 31 December 2004
Rank Investor#
Shares% of Issued
Capital1 J P MORGAN NOMINEES AUSTRALIA LIMITED 181,988,594 11.422 WESTPAC CUSTODIAN NOMINEES LIMITED 135,440,588 8.503 NATIONAL NOMINEES LIMITED 131,229,626 8.244 CITICORP NOMINEES PTY LIMITED 32,939,303 2.075 QUEENSLAND INVESTMENT CORPORATION C/- NATIONAL NOMINEES LIMITED 22,102,592 1.396 ANZ NOMINEES LIMITED 19,133,570 1.207 CITICORP NOMINEES PTY LIMITED (CFS WSLE GEARED SHR FND A/C) 18,459,732 1.168 CITICORP NOMINEES PTY LIMITED (CFS WSLE IMPUTATION FND A/C) 16,288,016 1.029 COGENT NOMINEES PTY LIMITED 15,694,158 0.9910 WESTPAC FINANCIAL SERVICES LIMITED C/- WESTPAC CUSTODIAN NOMINEES LIMITED 14,589,808 0.9211 AMP LIFE LIMITED 12,854,537 0.8112 CITICORP NOMINEES PTY LIMITED (CFS IMPUTATION FUND A/C) 10,500,709 0.6613 CITICORP NOMINEES PTY LIMITED (CFS WSLE AUST SHARE FND A/C) 10,418,866 0.6514 CITICORP NOMINEES PTY LIMITED (CFS WSLE INDUSTRIAL SHR A/C) 8,805,423 0.5515 RBC GLOBAL SERVICES AUSTRALIA NOMINEES PTY LIMITED (BKCUST A/C) 7,160,362 0.4516 IOOF INVESTMENT MANAGEMENT LIMITED 6,741,326 0.4217 GOVERNMENT SUPERANNUATION OFFICE (STATE SUPER FUND A/C) 6,016,302 0.3818 HSBC CUSTODY NOMINEES (AUSTRALIA) LIMITED 5,347,607 0.3419 IAG SHARE PLAN NOMINEE PTY LTD (PAR AUSTRALIA A/C) 5,237,759 0.3320 ARGO INVESTMENTS LIMITED 4,698,333 0.29
D. Reset Preference (IAGPA) Shareholders as at 31 December 2004
Rank Investor#
Shares% of Issued
Capital1 J P MORGAN NOMINEES AUSTRALIA LIMITED 513,899 14.682 NATIONAL NOMINEES LIMITED 264,154 7.553 WESTPAC CUSTODIAN NOMINEES LIMITED 249,700 7.134 AMP LIFE LIMITED 141,413 4.045 CITIBANK LIMITED 115,000 3.296 CITICORP NOMINEES PTY LIMITED 113,000 3.237 RBC GLOBAL SERVICES AUSTRALIA NOMINEES PTY LIMITED (JBENIP A/C) 112,277 3.218 COGENT NOMINEES PTY LIMITED (SMP ACCOUNTS) 80,732 2.319 NET NOMINEES LIMITED C/- WESTPAC SECURITIES LIMITED 69,293 1.9810 SHARE DIRECT NOMINEES PTY LTD (NATIONAL NOMINEES A/C) 50,000 1.4311 PERPETUAL TRUSTEE COMPANY LIMITED 39,868 1.1412 UBS PRIVATE CLIENTS AUSTRALIA 35,343 1.0113 ARGO INVESTMENTS LIMITED 30,800 0.8814 CAMBOOYA PTY LIMITED 30,650 0.8815 ANZ NOMINEES LIMITED 28,423 0.8116 UBS NOMINEES PTY LTD (PRIME BROKING A/C) 24,028 0.6917 BRENCORP NO 11 PTY LIMITED 22,500 0.6418 ANZ EXECUTORS AND TRUSTEE COMPANY LIMITED C/- ANZ NOMINEES LIMITED 22,217 0.6319 CITICORP NOMINEES PTY LIMITED (CMIL CWLTH INCOME FUND A/C) 20,000 0.5720 CITICORP NOMINEES PTY LIMITED (CFSIL CWLTH SPEC 5 A/C) 17,127 0.49
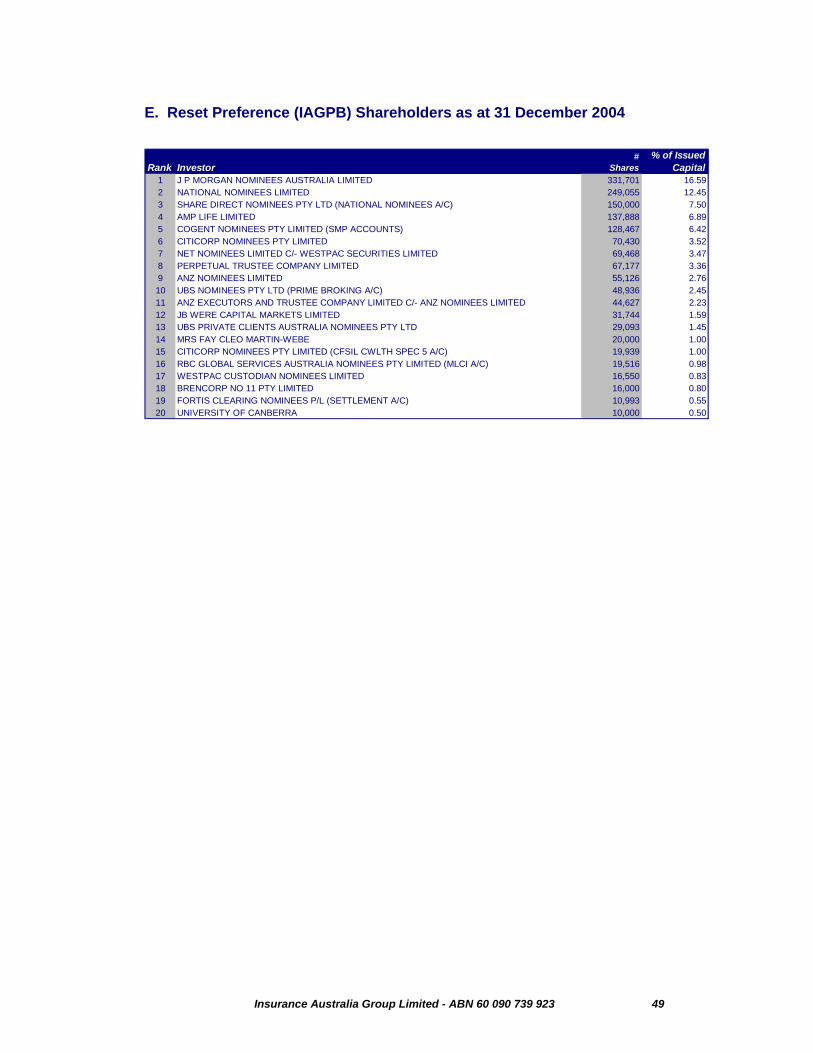
Insurance Australia Group Limited - ABN 60 090 739 923 49
E. Reset Preference (IAGPB) Shareholders as at 31 December 2004
Rank Investor#
Shares% of Issued
Capital1 J P MORGAN NOMINEES AUSTRALIA LIMITED 331,701 16.592 NATIONAL NOMINEES LIMITED 249,055 12.453 SHARE DIRECT NOMINEES PTY LTD (NATIONAL NOMINEES A/C) 150,000 7.504 AMP LIFE LIMITED 137,888 6.895 COGENT NOMINEES PTY LIMITED (SMP ACCOUNTS) 128,467 6.426 CITICORP NOMINEES PTY LIMITED 70,430 3.527 NET NOMINEES LIMITED C/- WESTPAC SECURITIES LIMITED 69,468 3.478 PERPETUAL TRUSTEE COMPANY LIMITED 67,177 3.369 ANZ NOMINEES LIMITED 55,126 2.7610 UBS NOMINEES PTY LTD (PRIME BROKING A/C) 48,936 2.4511 ANZ EXECUTORS AND TRUSTEE COMPANY LIMITED C/- ANZ NOMINEES LIMITED 44,627 2.2312 JB WERE CAPITAL MARKETS LIMITED 31,744 1.5913 UBS PRIVATE CLIENTS AUSTRALIA NOMINEES PTY LTD 29,093 1.4514 MRS FAY CLEO MARTIN-WEBE 20,000 1.0015 CITICORP NOMINEES PTY LIMITED (CFSIL CWLTH SPEC 5 A/C) 19,939 1.0016 RBC GLOBAL SERVICES AUSTRALIA NOMINEES PTY LIMITED (MLCI A/C) 19,516 0.9817 WESTPAC CUSTODIAN NOMINEES LIMITED 16,550 0.8318 BRENCORP NO 11 PTY LIMITED 16,000 0.8019 FORTIS CLEARING NOMINEES P/L (SETTLEMENT A/C) 10,993 0.5520 UNIVERSITY OF CANBERRA 10,000 0.50