Instytut Fizyki Doświadczalnej - Uniwersytet Gdański 16 Planck K.pdf · Instytut Fizyki...
5
Instytut Fizyki Doświadczalnej Wydział Matematyki, Fizyki i Informatyki UNIWERSYTET GDAŃSKI
Transcript of Instytut Fizyki Doświadczalnej - Uniwersytet Gdański 16 Planck K.pdf · Instytut Fizyki...

Instytut Fizyki Doświadczalnej Wydział Matematyki, Fizyki i Informatyki
UNIWERSYTET GDAŃSKI
Instytut Fizyki Doświadczalnej 1.
Experiment 16 : The photoelectric effect and the determination of Planck's constant
I. Background theory.
1. Wave – particle duality of light. 2. Origin of energy bands in solids. 3. Categorising solids into metals, semiconductors and insulators based on their band structure.
4. Einstein's photon hypothesis. 5. Work function of electrons in a metal. 6. Photoelectric effect. 7. Einstein's equation of photoelectric effect.
8. Determining the threshold frequency in Millikan’s experiment. 9. Construction and operation of photocells. Characteristics of photocells. 10. Construction of spectral lamps. 11. The optics and operating principles of prismatic monochromators.
12. Basic properties of monochromators. 13. Method of determining Planck's constant and electron work function from photocathode
decelerating voltage measurements.
II. Experimental tasks.
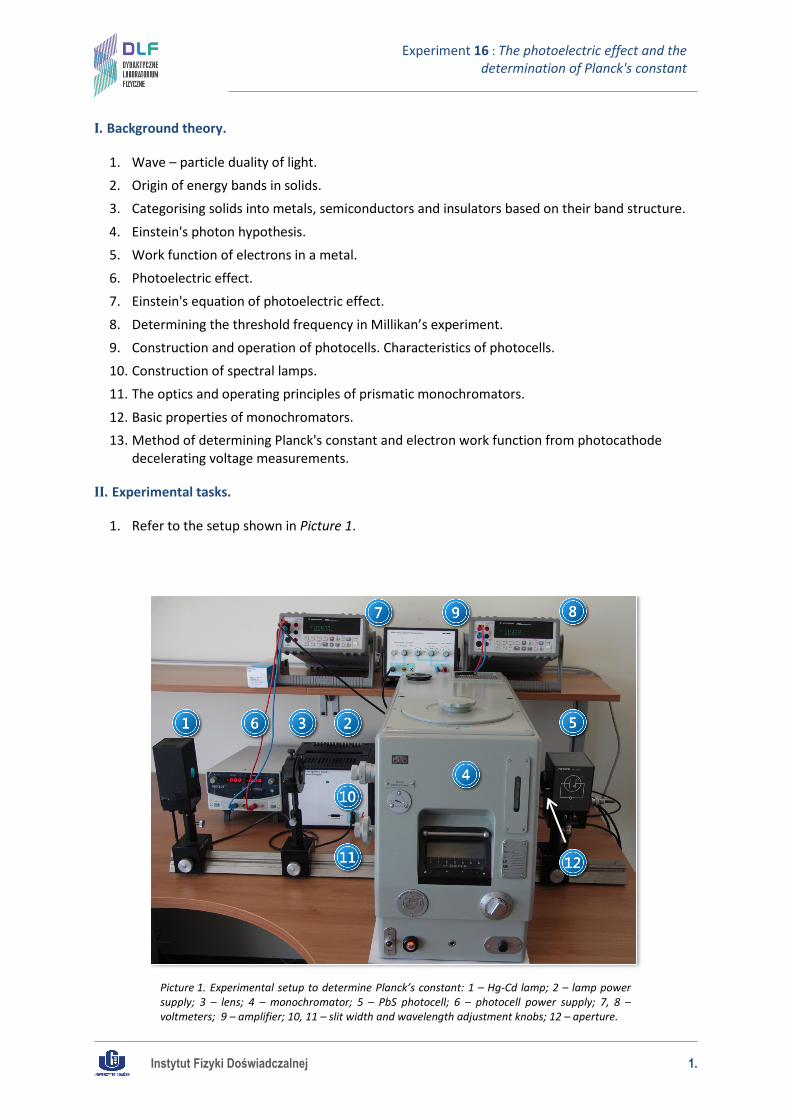
1. Refer to the setup shown in Picture 1.
Picture 1. Experimental setup to determine Planck’s constant: 1 – Hg-Cd lamp; 2 – lamp power supply; 3 – lens; 4 – monochromator; 5 – PbS photocell; 6 – photocell power supply; 7, 8 – voltmeters; 9 – amplifier; 10, 11 – slit width and wavelength adjustment knobs; 12 – aperture.

Instytut Fizyki Doświadczalnej 2.
Experiment 16 : The photoelectric effect and the determination of Planck's constant
2. Connect the system components as shown in Figure 2 and Picture 1, i.e., the spectral lamp at the left end of the optical bench, the lens at half the distance between the lamp and the monochromator and the photocell on the right-hand side of the monochromator.
3. Connect the photocell (with a BNC cable) to the (powered off) power supply 6, Picture 1 so that the photocell’s power polarisation is negative – in accordance with 2 in Figure 2. Before turning on the power, ask the supervisor to verify your circuit connections.
4. Before turning on the power, check that the monochromator slit 10, Picture 1 is closed or set to zero and that the photocell window is covered by the aperture 12, Picture 1.
5. Using Picture 3, prepare the amplifier 9, Picture 1 for measurements in the electrometer mode
with switch 2, while switch 4 is set to an amplification of 1 (100) and select a time constant of 0.
6. Turn on the power to each individual circuit element. The spectral lamp power (switch on the rear panel of the housing), monochromator scale illumination, photocell power (switch on the front panel power supply), the amplifier (switch on the rear of the chassis) and the multimeters (switch on the front panel).
Figure 2. Photocell connection diagram: 1 – positively polarised connection; 2 – negatively polarised connection.
Power supply voltage to the photocell should not exceed 70 V for the positive voltage and - 2,5 V for the negative voltage.
The spectral lamp becomes extremely hot while operating. Touching the lamp while it is on may cause serious burns!
Instytut Fizyki Doświadczalnej 3.
Experiment 16 : The photoelectric effect and the determination of Planck's constant
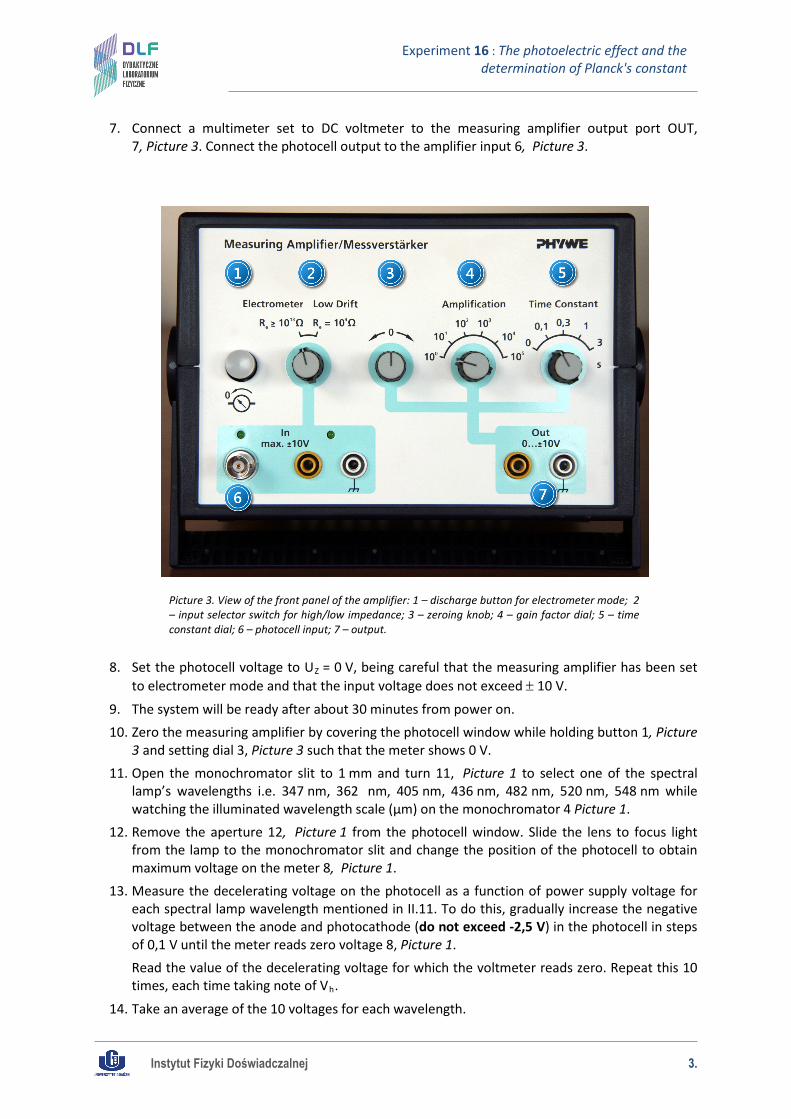
7. Connect a multimeter set to DC voltmeter to the measuring amplifier output port OUT, 7, Picture 3. Connect the photocell output to the amplifier input 6, Picture 3.
8. Set the photocell voltage to UZ = 0 V, being careful that the measuring amplifier has been set to electrometer mode and that the input voltage does not exceed ± 10 V.
9. The system will be ready after about 30 minutes from power on. 10. Zero the measuring amplifier by covering the photocell window while holding button 1, Picture
3 and setting dial 3, Picture 3 such that the meter shows 0 V. 11. Open the monochromator slit to 1 mm and turn 11, Picture 1 to select one of the spectral
lamp’s wavelengths i.e. 347 nm, 362 nm, 405 nm, 436 nm, 482 nm, 520 nm, 548 nm while watching the illuminated wavelength scale (μm) on the monochromator 4 Picture 1.
12. Remove the aperture 12, Picture 1 from the photocell window. Slide the lens to focus light from the lamp to the monochromator slit and change the position of the photocell to obtain maximum voltage on the meter 8, Picture 1.
13. Measure the decelerating voltage on the photocell as a function of power supply voltage for each spectral lamp wavelength mentioned in II.11. To do this, gradually increase the negative voltage between the anode and photocathode (do not exceed -2,5 V) in the photocell in steps of 0,1 V until the meter reads zero voltage 8, Picture 1. Read the value of the decelerating voltage for which the voltmeter reads zero. Repeat this 10 times, each time taking note of Vh.
14. Take an average of the 10 voltages for each wavelength.
Picture 3. View of the front panel of the amplifier: 1 – discharge button for electrometer mode; 2 – input selector switch for high/low impedance; 3 – zeroing knob; 4 – gain factor dial; 5 – time constant dial; 6 – photocell input; 7 – output.
Instytut Fizyki Doświadczalnej 4.
Experiment 16 : The photoelectric effect and the determination of Planck's constant
15. Plot a graph of the decelerating voltage Vh as a function of frequency of the incident light. Use linear regression to fit a straight line to the results.
Read off the coefficients related to the Planck constant and the work function. 16. Compare the resulting value of the constant h with that given in the theory. Present your
evaluation of this method for determining the Planck constant. 17. Connect the photocell (with a BNC cable) to the (powered off) power supply so that the
photocell’s power polarisation is positive - in accordance with 1 in Figure 2. Again, ask the supervisor to verify your circuit connections before turning on the power.
18. For two selected wavelengths of light, determine the photocell current - voltage characteristics. To do this, gradually increase the positive voltage between the anode and photocathode on the photoelectric cell, from 0 V to 2 V in steps of 0,1 V, and then every 1 V until reaching 70 V on the power supply. To calculate the photocell anode current IA, assume that the photocell has a resistivity of 5,6 MΩ ± 5%.
19. Plot a graph of the anode current IA as a function of the photocell power supply voltage.
20. Repeat the measurements from step II.18. reducing the monochromator slit to 0,5 mm.
III. Apparatus.
1. PbS photocell. 2. Photocell power supply. 3. SPM2 monochromator. 4. Lens. 5. Mercury – cadmium lamp. 6. Lamp power supply. 7. Measuring amplifier. 8. Two multimeters.
IV. Literature.
1. W. Demtröder – “Atoms, Molecules and Photons: an Introduction to Atomic-, Molecular-and Quantum-Physics”, Springer, Berlin 2006.
2. A. Reimann – “Physics”, Vol. III: “Modern Physics”, Harper & Row, Publishers Inc., 1973. 3. V. Acosta, C.L. Cowan, B.J. Graham – “Essentials of Modern Physics”, Harper & Row, Publishers,
New York 1973. 4. A.P. Arya – “Fundamentals of Atomic Physics”, Allyn & Bacon, Inc., Boston 1971. 5. R. Eisberg, R. Resnick – “Quantum Physics of Atoms, Molecules, Solids, Nuclei, and Particles”,
John Wiley & Sons, Inc., 1974. 6. C. Kittel – “Introduction to Solid State Physics”, Wiley, 2004.