
Instytut Fizyki Doświadczalnej - dlf.ug.edu.pl 14 F-H K.pdf · Instytut Fizyki Doświadczalnej 1....
14
Instytut Fizyki Doświadczalnej Wydział Matematyki, Fizyki i Informatyki UNIWERSYTET GDAŃSKI
Transcript of Instytut Fizyki Doświadczalnej - dlf.ug.edu.pl 14 F-H K.pdf · Instytut Fizyki Doświadczalnej 1....
Instytut Fizyki Doświadczalnej Wydział Matematyki, Fizyki i Informatyki
UNIWERSYTET GDAŃSKI
Instytut Fizyki Doświadczalnej 1.
Experiment 14 : Determining the excitation potential of Hg and Ne atoms in the Franck-Hertz experiment
I. Background theory.
1. Planck’s law. 2. Model of the atom and Bohr's quantum postulates. 3. The energy of an electron in the Coulomb field of the nucleus.
4. Electron configurations in atoms. 5. Term symbols. 6. Fine structure terms. 7. Electronic configuration and energy levels of mercury and neon.
8. Collisions of electrons with atoms:
a) elastic collisions; b) inelastic collisions; c) mean free path of electrons in a gas.
9. Franck-Hertz experiment in mercury vapour and a neon lamp.
II. Experimental tasks.
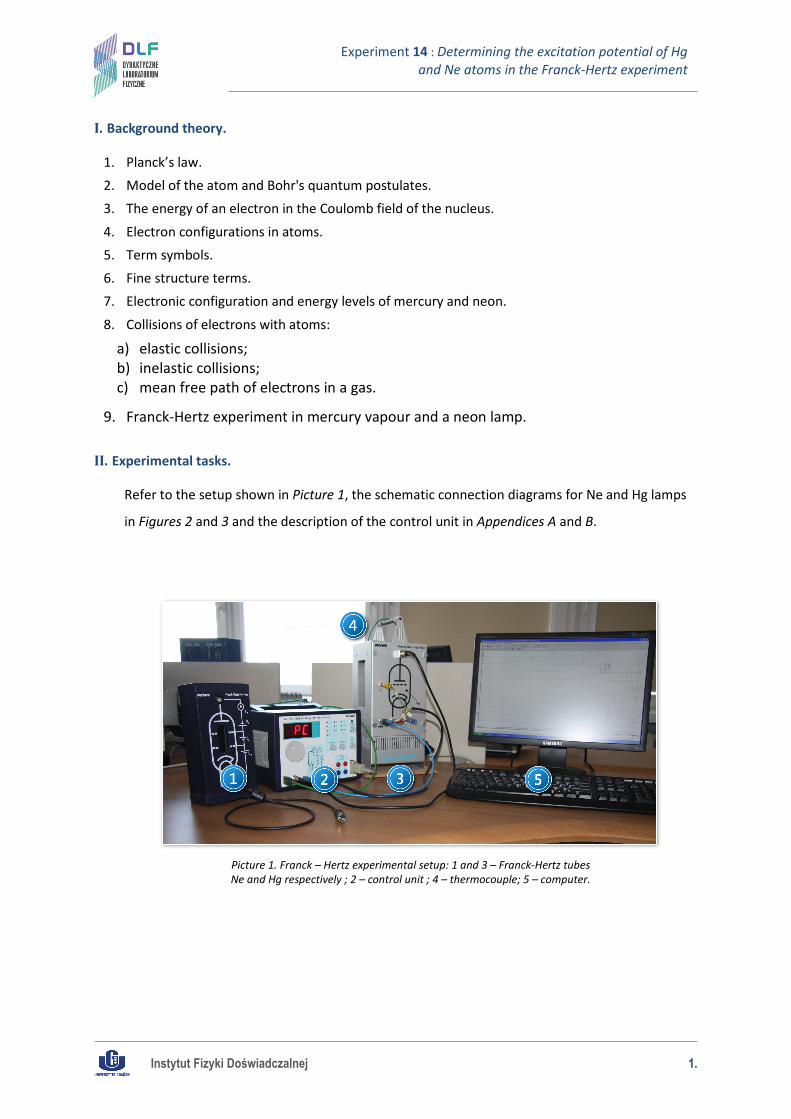
Refer to the setup shown in Picture 1, the schematic connection diagrams for Ne and Hg lamps
in Figures 2 and 3 and the description of the control unit in Appendices A and B.
Picture 1. Franck – Hertz experimental setup: 1 and 3 – Franck-Hertz tubes Ne and Hg respectively ; 2 – control unit ; 4 – thermocouple; 5 – computer.
Instytut Fizyki Doświadczalnej 2.
Experiment 14 : Determining the excitation potential of Hg and Ne atoms in the Franck-Hertz experiment
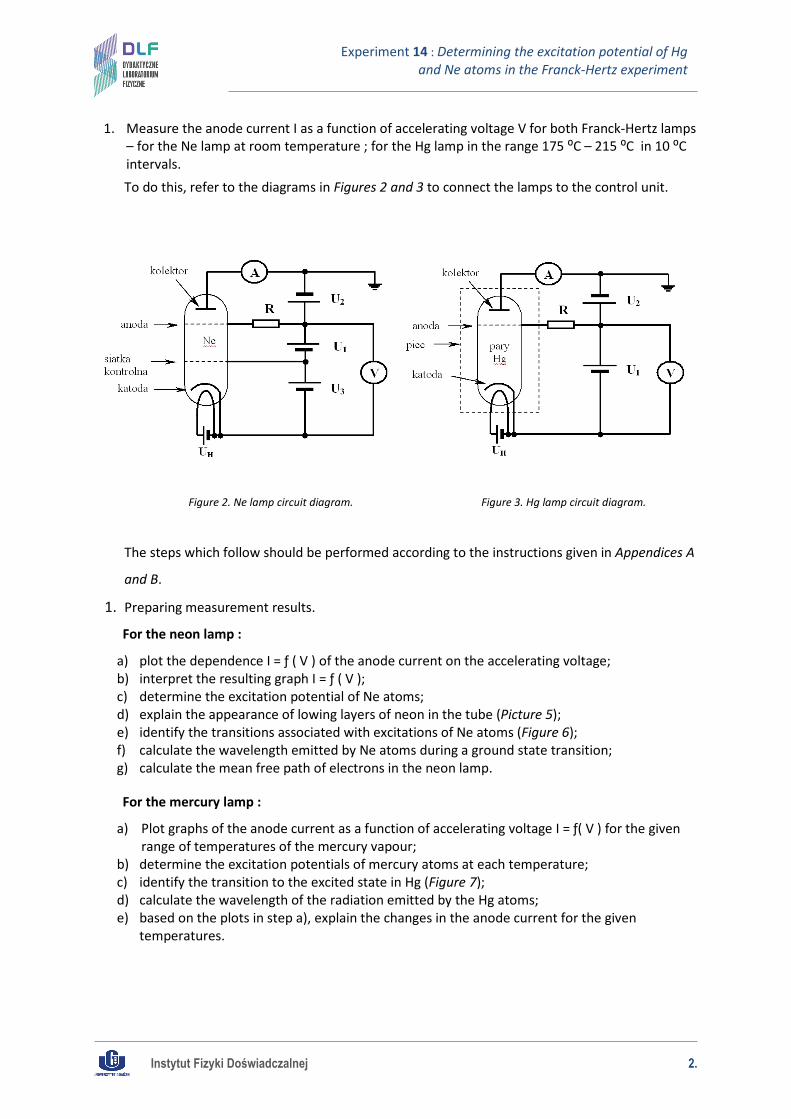
1. Measure the anode current I as a function of accelerating voltage V for both Franck-Hertz lamps – for the Ne lamp at room temperature ; for the Hg lamp in the range 175 ⁰C – 215 ⁰C in 10 ⁰C intervals. To do this, refer to the diagrams in Figures 2 and 3 to connect the lamps to the control unit.
Figure 2. Ne lamp circuit diagram. Figure 3. Hg lamp circuit diagram.
The steps which follow should be performed according to the instructions given in Appendices A
and B.
1. Preparing measurement results.
For the neon lamp :
a) plot the dependence I = ƒ ( V ) of the anode current on the accelerating voltage; b) interpret the resulting graph I = ƒ ( V ); c) determine the excitation potential of Ne atoms; d) explain the appearance of lowing layers of neon in the tube (Picture 5); e) identify the transitions associated with excitations of Ne atoms (Figure 6); f) calculate the wavelength emitted by Ne atoms during a ground state transition; g) calculate the mean free path of electrons in the neon lamp.
For the mercury lamp :
a) Plot graphs of the anode current as a function of accelerating voltage I = ƒ( V ) for the given range of temperatures of the mercury vapour;
b) determine the excitation potentials of mercury atoms at each temperature; c) identify the transition to the excited state in Hg (Figure 7); d) calculate the wavelength of the radiation emitted by the Hg atoms; e) based on the plots in step a), explain the changes in the anode current for the given
temperatures.
Instytut Fizyki Doświadczalnej 3.
Experiment 14 : Determining the excitation potential of Hg and Ne atoms in the Franck-Hertz experiment
III. Apparatus.
1. Franck-Hertz neon lamp. 2. Control unit. 3. Franck – Hertz lamp with heated mercury vapour.
4. Ni Cr-Ni thermocouple. 5. Computer.
IV. Literature.
1. M. M. Kash, G. C. Shilds – “Using the Franck-Hertz Experiment to Illustrate Quantization”, J. Chem. Educ. 71, 466, 1994.
2. H. Haken, H. Ch. Wolf – “The Physics of Atoms and Quanta”, Springer, 2000. 3. V. Acosta, C.L. Cowan, B.J. Graham – “Essentials of Modern Physics”, Harper & Row, Publishers,
New York 1973. 4. E. W. Mc Daniel – “Atomic Collisions – Electron & Photon Projectiles”, Wiley, N.Y. 1989. 5. A. P. Arya – “Fundamentals of Atomic Physics “, Allyn & Bacon Inc., Boston 1971. 6. H. A. Enge, M. R. Wehr, J. A. Richards – “Introduction to Atomic Physics”, Addison-Wesly,
Reading-Mass, 1981. 7. P. Meystre – “Atom Optics”, Springer, Berlin-Heidelberg, 2001.
Instytut Fizyki Doświadczalnej 4.
Experiment 14 : Determining the excitation potential of Hg and Ne atoms in the Franck-Hertz experiment
Appendix A Instructions for the Franck-Hertz neon lamp
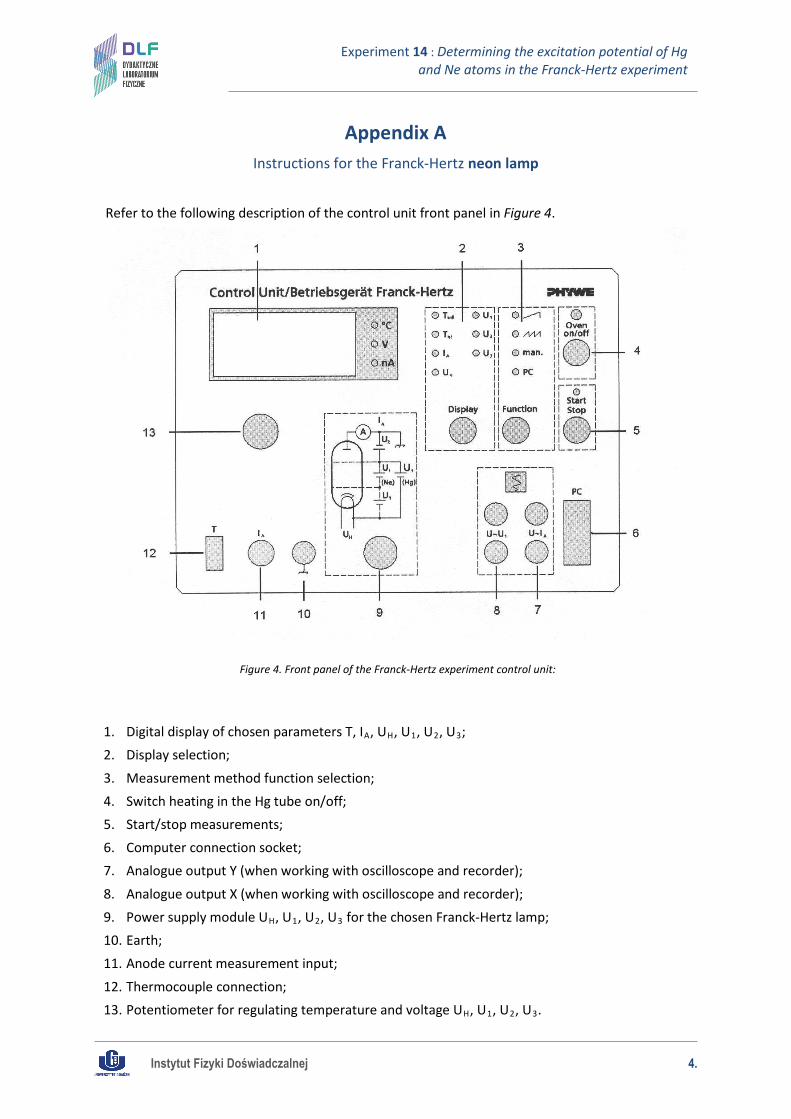
Refer to the following description of the control unit front panel in Figure 4.
1. Digital display of chosen parameters T, IA, UH, U1, U2, U3; 2. Display selection;
3. Measurement method function selection; 4. Switch heating in the Hg tube on/off; 5. Start/stop measurements; 6. Computer connection socket; 7. Analogue output Y (when working with oscilloscope and recorder);
8. Analogue output X (when working with oscilloscope and recorder); 9. Power supply module UH, U1, U2, U3 for the chosen Franck-Hertz lamp; 10. Earth; 11. Anode current measurement input;
12. Thermocouple connection; 13. Potentiometer for regulating temperature and voltage UH, U1, U2, U3.
Figure 4. Front panel of the Franck-Hertz experiment control unit:
Instytut Fizyki Doświadczalnej 5.
Experiment 14 : Determining the excitation potential of Hg and Ne atoms in the Franck-Hertz experiment
Observation of neon light (with manual operation).
1. Turn on the Franck-Hertz control unit.
2. Press “Function” and select the option “manual”.
3. Press “Display” and select the following settings for the potentiometer:
UH = 8,0 [V], U2 = 7,0 [V], U3 =2,2 [V], U1 = 0 [V].
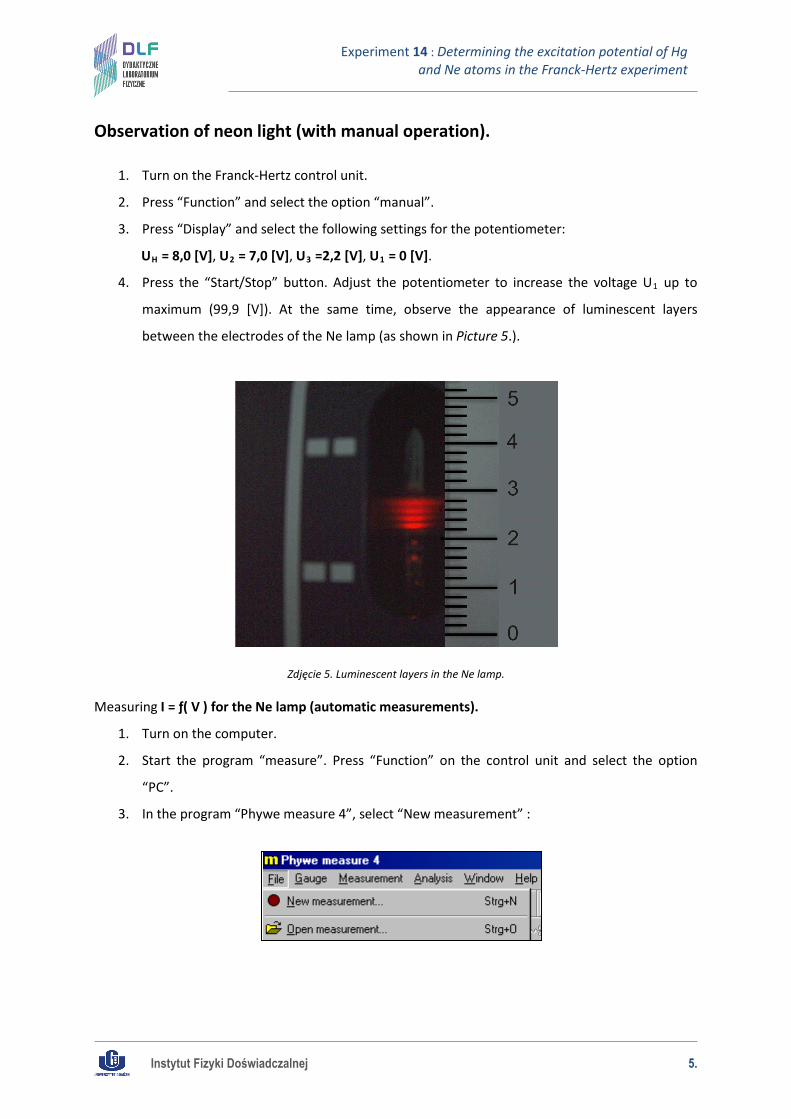
4. Press the “Start/Stop” button. Adjust the potentiometer to increase the voltage U1 up to
maximum (99,9 [V]). At the same time, observe the appearance of luminescent layers
between the electrodes of the Ne lamp (as shown in Picture 5.).
Measuring I = ƒ( V ) for the Ne lamp (automatic measurements).
1. Turn on the computer.
2. Start the program “measure”. Press “Function” on the control unit and select the option
“PC”.
3. In the program “Phywe measure 4”, select “New measurement” :
Zdjęcie 5. Luminescent layers in the Ne lamp.
Instytut Fizyki Doświadczalnej 6.
Experiment 14 : Determining the excitation potential of Hg and Ne atoms in the Franck-Hertz experiment
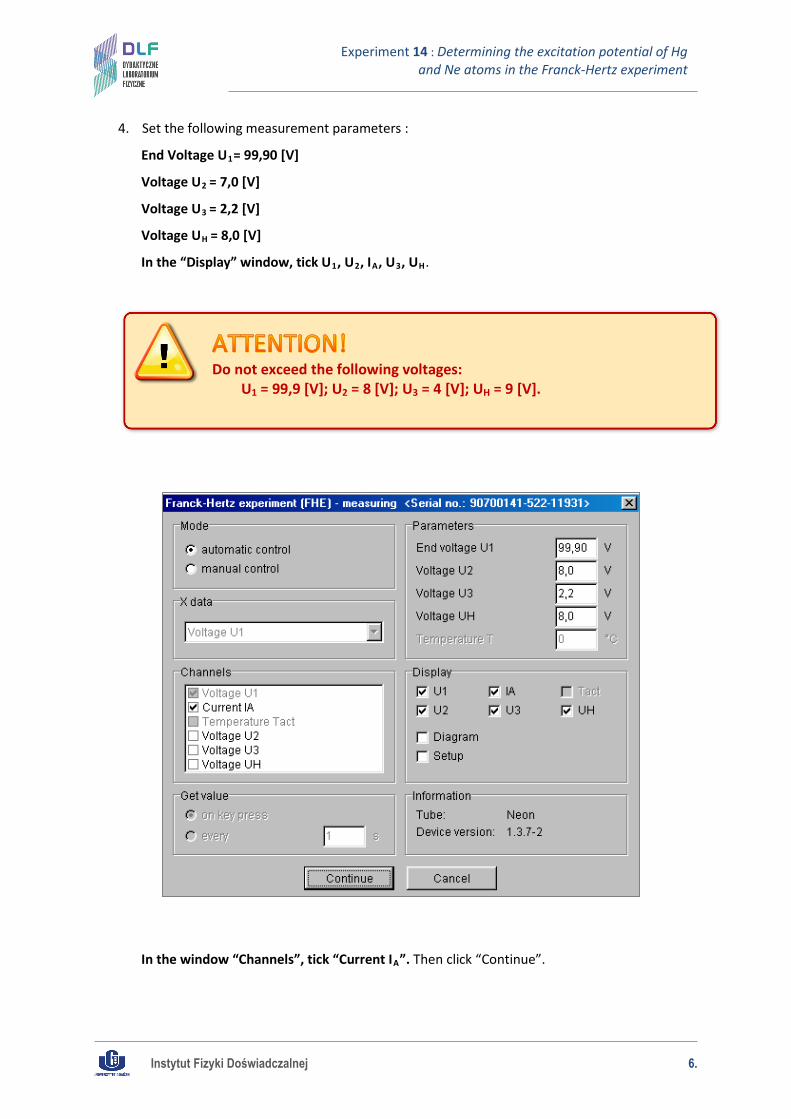
4. Set the following measurement parameters :
End Voltage U1= 99,90 [V]
Voltage U2 = 7,0 [V]
Voltage U3 = 2,2 [V]
Voltage UH = 8,0 [V]
In the “Display” window, tick U1, U2, IA, U3, UH.
In the window “Channels”, tick “Current IA”. Then click “Continue”.
Do not exceed the following voltages: U1 = 99,9 [V]; U2 = 8 [V]; U3 = 4 [V]; UH = 9 [V].
Instytut Fizyki Doświadczalnej 7.
Experiment 14 : Determining the excitation potential of Hg and Ne atoms in the Franck-Hertz experiment
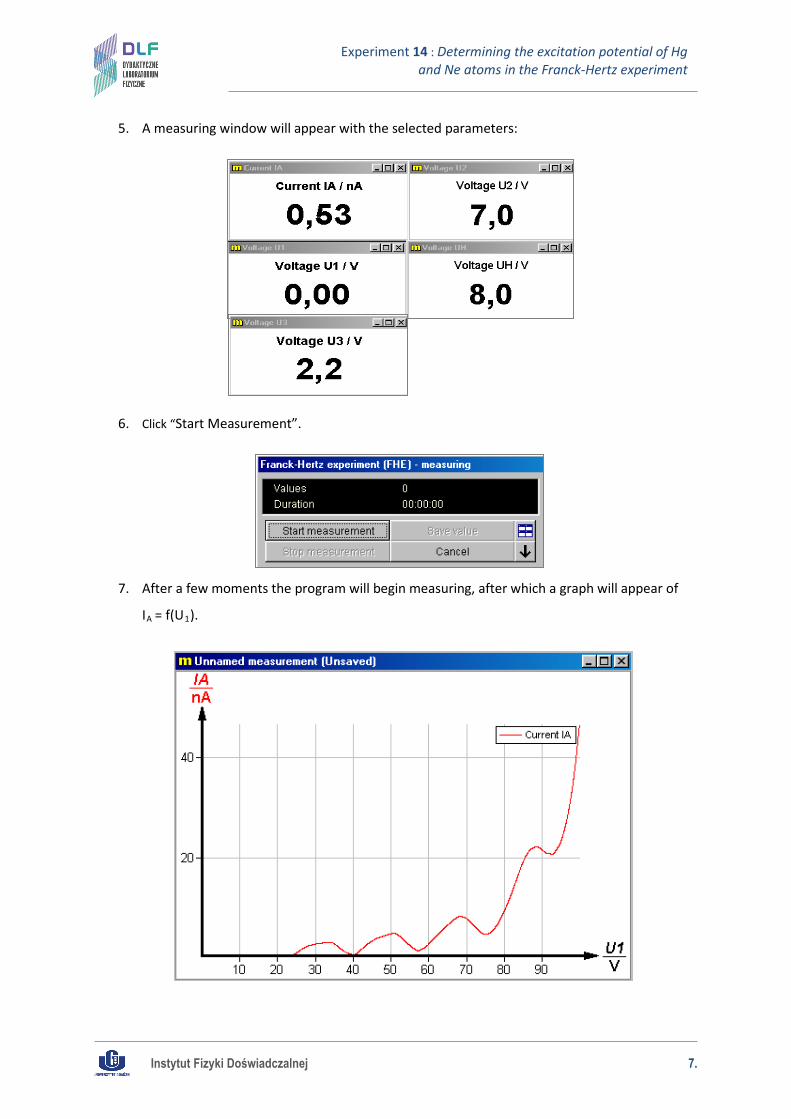
5. A measuring window will appear with the selected parameters:
6. Click “Start Measurement”.
7. After a few moments the program will begin measuring, after which a graph will appear of
IA = f(U1).
Instytut Fizyki Doświadczalnej 8.
Experiment 14 : Determining the excitation potential of Hg and Ne atoms in the Franck-Hertz experiment
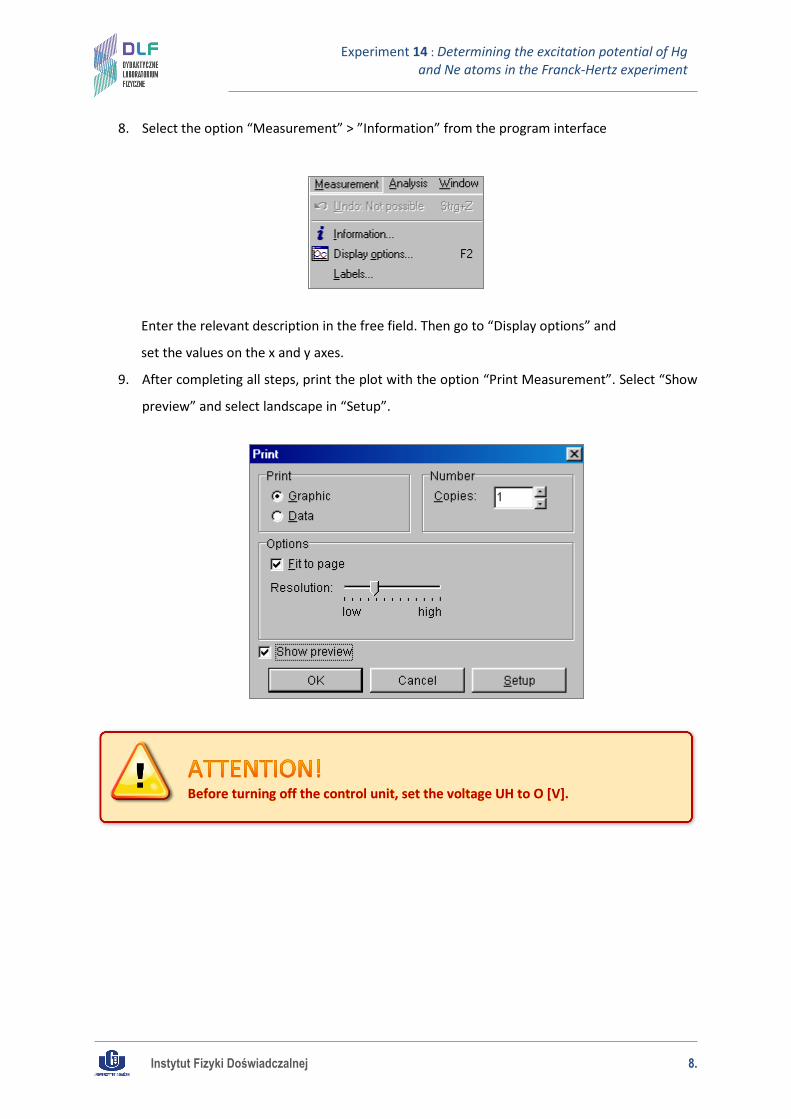
8. Select the option “Measurement” > ”Information” from the program interface
Enter the relevant description in the free field. Then go to “Display options” and
set the values on the x and y axes.
9. After completing all steps, print the plot with the option “Print Measurement”. Select “Show
preview” and select landscape in “Setup”.
Before turning off the control unit, set the voltage UH to O [V].
Instytut Fizyki Doświadczalnej 9.
Experiment 14 : Determining the excitation potential of Hg and Ne atoms in the Franck-Hertz experiment
Appendix B Instructions for the Franck-Hertz mercury lamp
Measuring I = ƒ( V ) for the Hg lamp (automatic measurements) at different temperatures.
1. Familiarise yourself with the control unit functions as shown in Figure 4.
2. Set the heating to position 10 (maximum heating).
3. Turn on the Franck-Hertz control unit.
4. Press “Display” and choose “Tnominal”. Using the potentiometer, set the temperature to
220°C. Press “Oven on/off”.
5. Use the “Display” button to select the reading “Tact” and wait until the heating oven
temperature reaches 220°C.
6. Press “Function” and select “PC”
7. Turn on the computer and start the “measure” program.
8. Select “New Measurement” from the measurement interface.
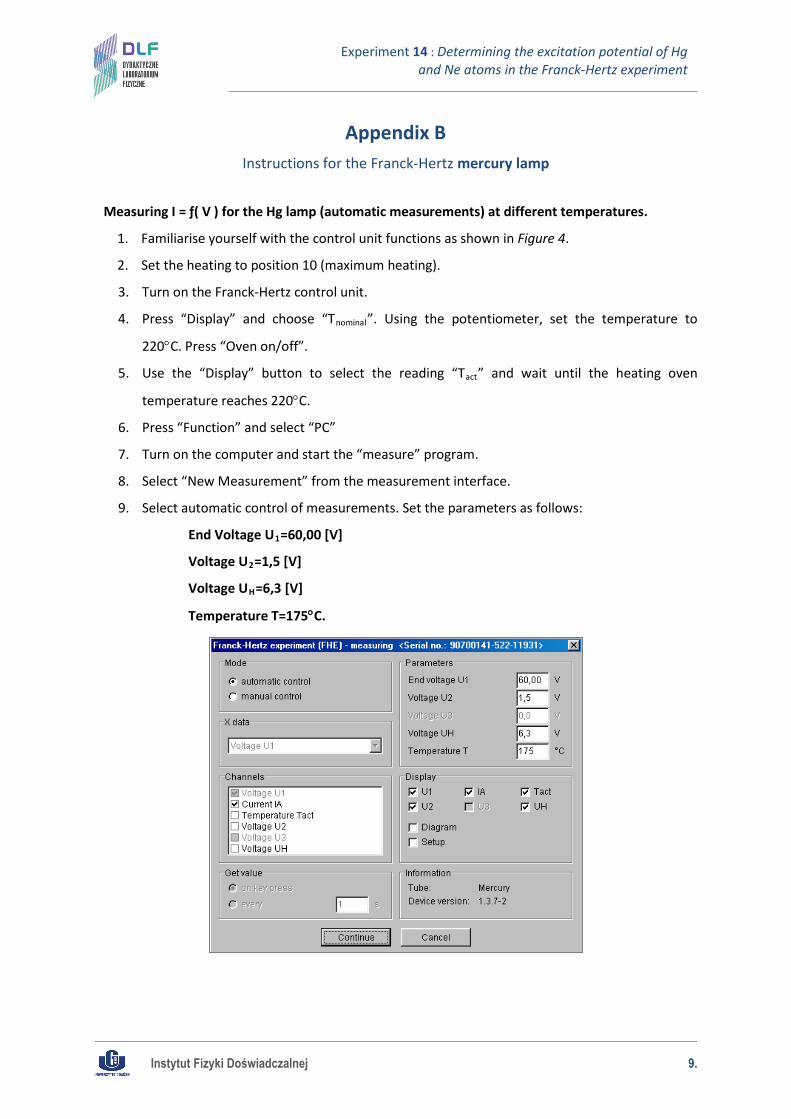
9. Select automatic control of measurements. Set the parameters as follows:
End Voltage U1=60,00 [V]
Voltage U2=1,5 [V]
Voltage UH=6,3 [V]
Temperature T=175°C.
Instytut Fizyki Doświadczalnej 10.
Experiment 14 : Determining the excitation potential of Hg and Ne atoms in the Franck-Hertz experiment
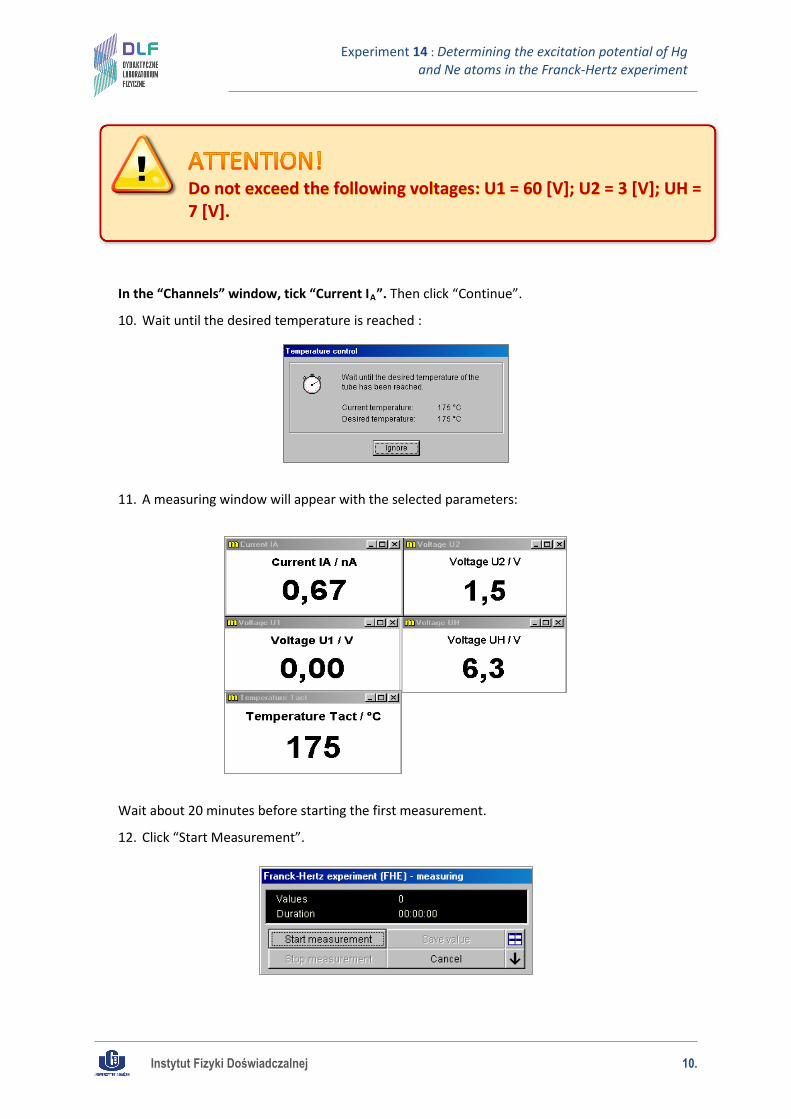
In the “Channels” window, tick “Current IA”. Then click “Continue”.
10. Wait until the desired temperature is reached :
11. A measuring window will appear with the selected parameters:
Wait about 20 minutes before starting the first measurement.
12. Click “Start Measurement”.
Do not exceed the following voltages: U1 = 60 [V]; U2 = 3 [V]; UH = 7 [V].
Instytut Fizyki Doświadczalnej 11.
Experiment 14 : Determining the excitation potential of Hg and Ne atoms in the Franck-Hertz experiment
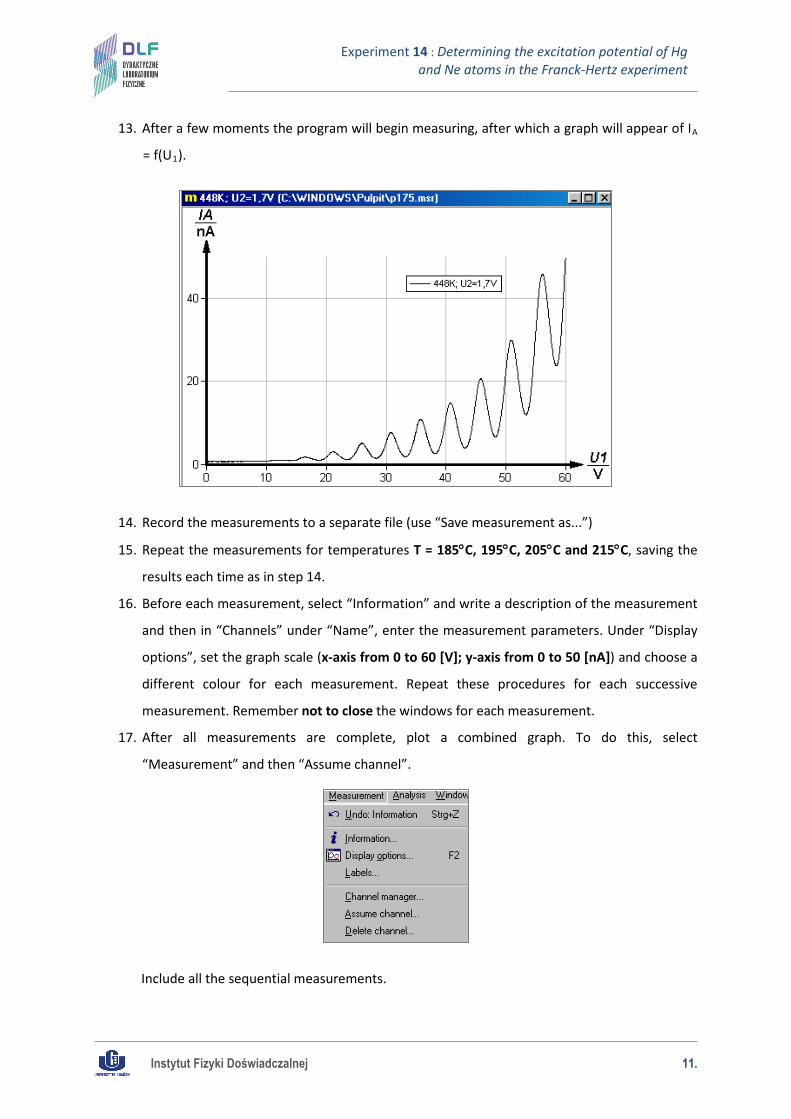
13. After a few moments the program will begin measuring, after which a graph will appear of IA
= f(U1).
14. Record the measurements to a separate file (use “Save measurement as...”)
15. Repeat the measurements for temperatures T = 185°C, 195°C, 205°C and 215°C, saving the
results each time as in step 14.
16. Before each measurement, select “Information” and write a description of the measurement
and then in “Channels” under “Name”, enter the measurement parameters. Under “Display
options”, set the graph scale (x-axis from 0 to 60 [V]; y-axis from 0 to 50 [nA]) and choose a
different colour for each measurement. Repeat these procedures for each successive
measurement. Remember not to close the windows for each measurement.
17. After all measurements are complete, plot a combined graph. To do this, select
“Measurement” and then “Assume channel”.
Include all the sequential measurements.
Instytut Fizyki Doświadczalnej 12.
Experiment 14 : Determining the excitation potential of Hg and Ne atoms in the Franck-Hertz experiment
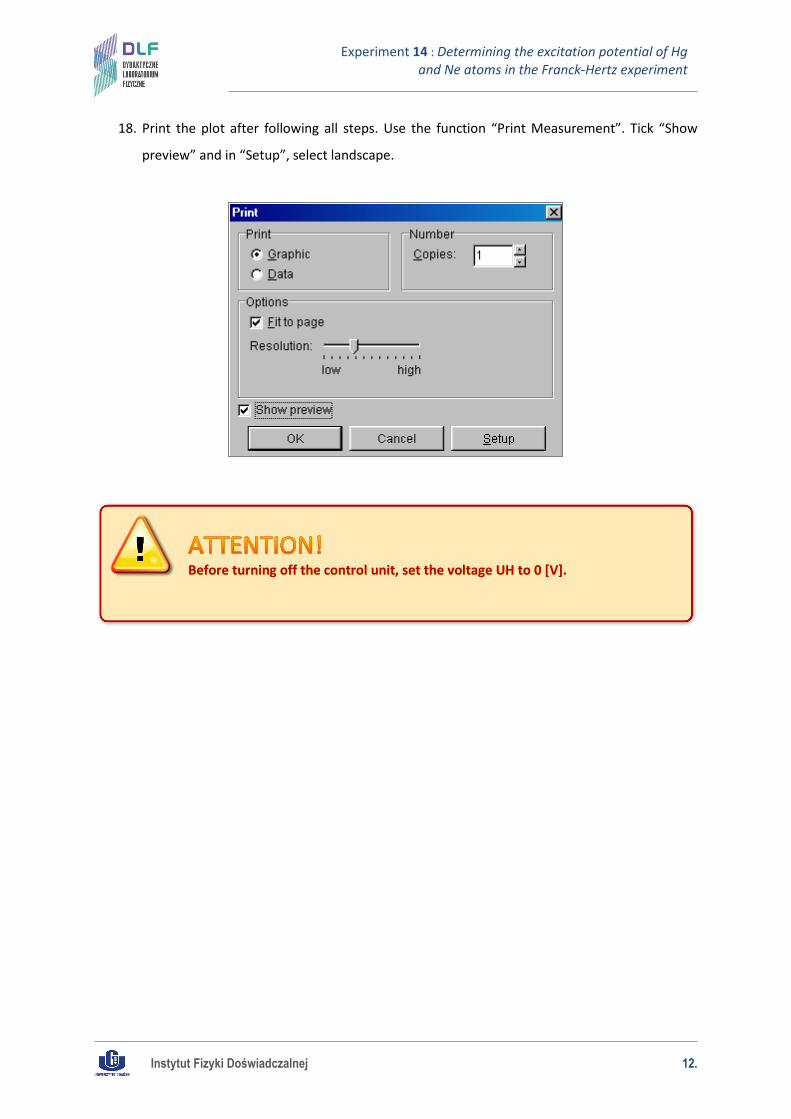
18. Print the plot after following all steps. Use the function “Print Measurement”. Tick “Show
preview” and in “Setup”, select landscape.
Before turning off the control unit, set the voltage UH to 0 [V].
Instytut Fizyki Doświadczalnej 13.
Experiment 14 : Determining the excitation potential of Hg and Ne atoms in the Franck-Hertz experiment
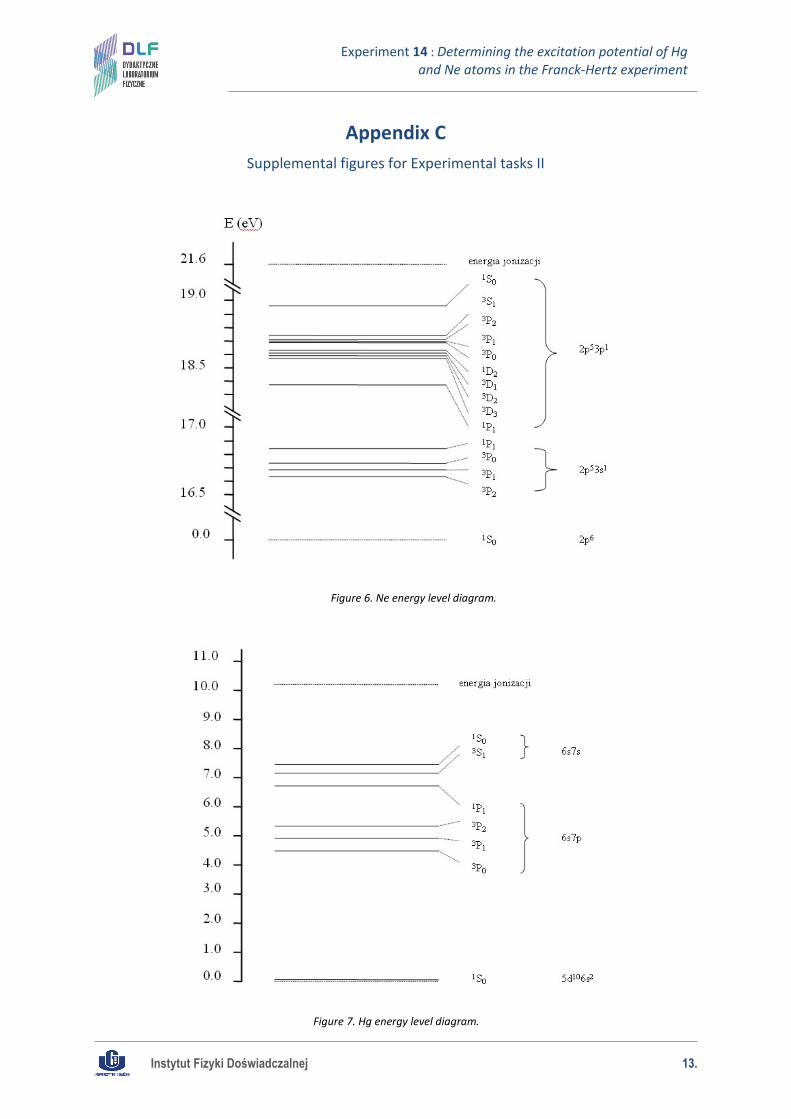
Appendix C
Supplemental figures for Experimental tasks II
Figure 6. Ne energy level diagram.
Figure 7. Hg energy level diagram.