GRAIN SIZE DETERMINATION AND ... - diagnostyka.net.pl size... · Głównym celem opracowanej metody...
8
Article citation info: Budzan S, Pawełczyk M. Grain size determination and classification using adaptive image segmentation with grain shape information for milling quality evaluation. Diagnostyka. 2018;19(1):41-48. http://doi.org/10.29354/diag/80974. 41 DIAGNOSTYKA, 2018, Vol. 19, No. 1 ISSN 1641-6414 e-ISSN 2449-5220 DOI: 10.29354/diag/80974 GRAIN SIZE DETERMINATION AND CLASSIFICATION USING ADAPTIVE IMAGE SEGMENTATION WITH GRAIN SHAPE INFORMATION FOR MILLING QUALITY EVALUATION Sebastian BUDZAN, Marek PAWEŁCZYK Silesian University of Technology, Institute of Automatic Control, Measurement and Control Systems Group, Akademicka 16, 44-100 Gliwice, Poland, e-mail: [email protected], [email protected] Abstract In this paper, authors described methods of material granularity evaluation and a novel method for grain size determination with inline electromagnetic mill device diagnostics. The milling process quality evaluation can be carried out with vibration measurements, analysis of the milling material images or well-known screening machines. The method proposed in this paper is developed to the online examination of the milled product during the milling process using real-time digital images. In this paper, authors concentrated their work on copper ore milling process. Determination of the total number of the grain, the size of each grain, also the classification of the grains are the main goal of the developed method. In the proposed method the vision camera with lightning mounted at two assumed angles has been used. The detection of the grains has been based on an adaptive segmentation algorithm, improved with distance transform to enhance grains detection. The information about particles shape and context is used to optimize the grain classification process in the next step. The final classification is based on the rule-based method with defined particle shape and size parameters. Keywords: grain classification, particle analysis, image segmentation, feature extraction OKREŚLENIE ROZMIARU ZIARNA I KLASYFIKACJA Z UŻYCIEM ADAPTACYJNEJ SEGMENTACJI OBRAZU I INFORMACJI O KSZTAŁCIE DLA OCENY JAKOŚCI MIELENIA Streszczenie W pracy autorzy opisali metody oceny uziarnienia materiału i nową metodę określania wielkości ziaren z jednoczesną diagnostyką pracy młyna elektromagnetycznego. Ocena jakości mielenia może być realizowana na kilka sposobów, tj. poprzez pomiar drgań, analizę obrazów materiału zmielonego, lub wykorzystanie matryc przesiewowych. Proces mielenia jest procesem obciążonym znacznym zużyciem energii, dlatego proces diagnostyki powinien być wykonywany z dużą efektywnością. Metoda zaproponowana w niniejszym artykule opiera się na badaniu mielonego produktu podczas procesu mielenia przy użyciu analizy obrazów cyfrowych w czasie rzeczywistym. Głównym celem opracowanej metody jest określenie całkowitej liczby ziaren, wielkości ziaren, jak i klasyfikacja ziaren. W zaproponowanej metodzie wykorzystano akwizycję obrazów z kamery przy oświetlaniu badanych próbek pod kątem, co pozwala zwiększyć liczbę wykrywanych ziaren. Detekcja ziaren bazuje na metodzie segmentacji adaptacyjnej rozszerzonej o analizę map odległościowych w celu poprawienia jakości i liczby wykrytych ziaren. Informacje na temat kształtu ziaren są wykorzystywane w celu optymalizacji procesu klasyfikacji ziaren. Ostateczna klasyfikacja opiera się na metodzie bazującej na regułach, w których określono zależności dla różnych parametrów kształtu i rozmiaru ziaren. Słowa kluczowe: klasyfikacja ziaren, analiza wielkości ziaren, segmentacja obrazów, ekstrakcja cech 1. INTRODUCTION The milling process is one of the most substantial parts of a wide range of industrial processes based on the disintegration of the material such as cement production, cereal preparation, coal and metal ore milling [1], production of sand and gravel, building materials, chip-pings, minerals, pellets, sinter, petrol coke, chemical products and salts and sugar and many others. Based on the application different type of the mill is used such as a ball, electromagnetic, rod, SAG, Buhrstone and many others. They are characterized by different construction, energy consumption [2], mass, and dimensions, take into account cost and effectiveness of the milling process. Most of the designed industrial mill obtain final grains with a diameter less than 1mm, especially for copper ore material. To reach high- quality process – assumed grain size, energy consumption should be carried out continuous control system which should control all the
Transcript of GRAIN SIZE DETERMINATION AND ... - diagnostyka.net.pl size... · Głównym celem opracowanej metody...

Article citation info:
Budzan S, Pawełczyk M. Grain size determination and classification using adaptive image segmentation with grain shape information for
milling quality evaluation. Diagnostyka. 2018;19(1):41-48. http://doi.org/10.29354/diag/80974.
41
DIAGNOSTYKA, 2018, Vol. 19, No. 1
ISSN 1641-6414 e-ISSN 2449-5220
DOI: 10.29354/diag/80974
GRAIN SIZE DETERMINATION AND CLASSIFICATION USING ADAPTIVE
IMAGE SEGMENTATION WITH GRAIN SHAPE INFORMATION
FOR MILLING QUALITY EVALUATION
Sebastian BUDZAN, Marek PAWEŁCZYK
Silesian University of Technology, Institute of Automatic Control, Measurement and Control
Systems Group, Akademicka 16, 44-100 Gliwice, Poland,
e-mail: [email protected], [email protected]
Abstract
In this paper, authors described methods of material granularity evaluation and a novel method for grain
size determination with inline electromagnetic mill device diagnostics. The milling process quality evaluation
can be carried out with vibration measurements, analysis of the milling material images or well-known
screening machines. The method proposed in this paper is developed to the online examination of the milled
product during the milling process using real-time digital images. In this paper, authors concentrated their
work on copper ore milling process. Determination of the total number of the grain, the size of each grain,
also the classification of the grains are the main goal of the developed method. In the proposed method the
vision camera with lightning mounted at two assumed angles has been used. The detection of the grains has
been based on an adaptive segmentation algorithm, improved with distance transform to enhance grains
detection. The information about particles shape and context is used to optimize the grain classification
process in the next step. The final classification is based on the rule-based method with defined particle shape
and size parameters.
Keywords: grain classification, particle analysis, image segmentation, feature extraction
OKREŚLENIE ROZMIARU ZIARNA I KLASYFIKACJA Z UŻYCIEM ADAPTACYJNEJ
SEGMENTACJI OBRAZU I INFORMACJI O KSZTAŁCIE DLA OCENY JAKOŚCI MIELENIA
Streszczenie
W pracy autorzy opisali metody oceny uziarnienia materiału i nową metodę określania wielkości ziaren z
jednoczesną diagnostyką pracy młyna elektromagnetycznego. Ocena jakości mielenia może być realizowana
na kilka sposobów, tj. poprzez pomiar drgań, analizę obrazów materiału zmielonego, lub wykorzystanie
matryc przesiewowych. Proces mielenia jest procesem obciążonym znacznym zużyciem energii, dlatego
proces diagnostyki powinien być wykonywany z dużą efektywnością. Metoda zaproponowana w niniejszym
artykule opiera się na badaniu mielonego produktu podczas procesu mielenia przy użyciu analizy obrazów
cyfrowych w czasie rzeczywistym. Głównym celem opracowanej metody jest określenie całkowitej liczby
ziaren, wielkości ziaren, jak i klasyfikacja ziaren. W zaproponowanej metodzie wykorzystano akwizycję
obrazów z kamery przy oświetlaniu badanych próbek pod kątem, co pozwala zwiększyć liczbę wykrywanych
ziaren. Detekcja ziaren bazuje na metodzie segmentacji adaptacyjnej rozszerzonej o analizę map
odległościowych w celu poprawienia jakości i liczby wykrytych ziaren. Informacje na temat kształtu ziaren są
wykorzystywane w celu optymalizacji procesu klasyfikacji ziaren. Ostateczna klasyfikacja opiera się na
metodzie bazującej na regułach, w których określono zależności dla różnych parametrów kształtu i rozmiaru
ziaren.
Słowa kluczowe: klasyfikacja ziaren, analiza wielkości ziaren, segmentacja obrazów, ekstrakcja cech
1. INTRODUCTION
The milling process is one of the most
substantial parts of a wide range of industrial
processes based on the disintegration of the
material such as cement production, cereal
preparation, coal and metal ore milling [1],
production of sand and gravel, building materials,
chip-pings, minerals, pellets, sinter, petrol coke,
chemical products and salts and sugar and many
others. Based on the application different type of
the mill is used such as a ball, electromagnetic, rod,
SAG, Buhrstone and many others. They are
characterized by different construction, energy
consumption [2], mass, and dimensions, take into
account cost and effectiveness of the milling
process. Most of the designed industrial mill obtain
final grains with a diameter less than 1mm,
especially for copper ore material. To reach high-
quality process – assumed grain size, energy
consumption should be carried out continuous
control system which should control all the
DIAGNOSTYKA, Vol. 19, No. 1 (2018)
Budzan S, Pawełczyk M.: Grain size determination and classification using adaptive image …
42
necessary process parameters. One of the main
parts of the control system should be diagnostics of
the milling or grinding. This can be evaluated by an
indirect method such as grain size recognition and
classification into some assumed classes of size e.g.
less than 100µm for copper ore. In consequence, the
grain size of the final product can be used as a
feedback to the mill control system and can be used
as a source of information about possible faults in
the process. In Figure 1, the scheme of the
electromagnetic mill used in the experiments has
been presented, including main elements such as:
material stream (1), working chamber (2), working
space (3), air stream and additional air stream (4),
final product (5), reverse stream (6), stream of the
not grinded material (7), winding inductor and
cooling medium (8), source of the air (9). The
proposed method of indirect quality evaluation is a
part of the main classification module (dotted line).
When the material will not pass the assumed
particle size will be reversed through (6) directly to
the working space (3).
Fig. 1. Scheme of the electromagnetic mill
The description of working principle and
methods of control can be found in [3]. The main
idea is based on the grinding of the material in
working chamber by the grinding medium, which is
moved in the chamber by generated a rotating
electromagnetic field and by a collision between
grinding medium and material, the grains are
grinded from their starting size – feed material has
variable size in range 0-2 mm into 50-100 µm final
product with constant size. In Figure 2 infrared
image of the working chamber with grinding
medium has been presented. In our investigation
has been used grinding medium as steel rods with
1–3 mm in diameter and 9–20 mm in length.
This paper is organized as follows. In Section 2,
the review of previous studies related to the grain
size measurement has been presented. In Section 3
the proposed method of grain size evaluation has
been described. The experimental results obtained
on acquired real samples of copper ore and sand
can be found in Section 4. Finally, the conclusions
are presented in Section 5.
Fig. 2. Infrared image of the working chamber
2. RELATED WORKS
A well-known method of grain size evaluation
is based on the usage of granulometer which
produces most accurate results, but the process
must be performed off-line in the laboratory. In the
recent literature, numerous methods of grain
parameters measurement can be found. They are
described by a different time consumption, grain
size range which can be recognized, method of
sample preparation, also, of course, some of them
are quite expensive. All the semi or full automatic
grain parameters evaluation methods are divided
into a few separated groups, such as vibration
screening technology, vibration measurements,
acoustics and flow measurements and machine
vision.
One of the most popular methods used in the
industry to classify grains are screening machines,
called also sieves machines [4]. Generally, it is
based on the screening material through screens
with different hole size using vibrations which
make material falling through next screening panels
with different mesh size. Some disadvantages, such
as especially clogging, are resolved using smart
solution in which machines are self-clogging by
some excitations. The screening result depends on
the correct assessment of the original material, the
choice of the screening plate mesh and the
adjustment of the machine, thus some of the
researchers concentrate their work on the vibrating
screens with reconfigurable or adjustable screen
surface structures [5] which already are in
production and used by the industry.
An interesting solution for grains classification
is indirect measurement based on vibration sensing
[6]. Authors adopted vibration measurements –
used in recent literature to mill diagnostics [7] or
generally machine diagnostics [8]; to the falling
material examination on the laboratory set-up with
prepared six classes of granularity material.
Generally, the measured vibrations of the loose
material in the pipelines are used to evaluate
granularity and flow rate. This method is based on
the assumption that the processed material at
different mass transported through the pipelines
from the mill will produce different vibrations

DIAGNOSTYKA, Vol. 19, No. 1 (2018)
Budzan S, Pawełczyk M.: Grain size determination and classification using adaptive image …
43
which can be measured with small, not expensive
and non-invasive vibration sensors. Issues related to
the calibration of the sensors must be taken into
account [9]. Obtained results of measurement
should include information about their quality in
the form of uncertainty [10].
One of the most rapidly growing technique in
the machine diagnostics is the machine vision.
Depending on application there exists numerous
possibilities to detect, recognize and classify
objects, colours, shapes, boundaries, texture, as
well as more detailed features such as physical,
statistical as dynamic changes in some parameters
values. Furthermore, a variety of the instruments,
such as image analysis in different colour space and
image processing in time or frequency domain, can
be used. The grain recognition based on the 2D
images have the wide range of application such as
river-bed grain size determination based on neural
fuzzy network [11], segmentation of petrographic
thin section images [12], the monitoring of an
industrial flotation cell in an iron flotation plant
[13] to the particle size distribution of ball-and
gyro-milled lignite and hard coal [14]. Most of the
recent publications on grains recognition are based
on the two ways: edge-based methods such as
boundaries between grains detected and analysed
[15], the second one is region-based such as region
growing segmentation [16]. First group of methods
are based on simple thresholding technique of the
gradient images with some post-processing such as
thickening and skeleton for reliable grain detection.
The second one is based particularly on region
growing segmentation with some manual merging
and/or splitting detected regions. Obara proposed
grain segmentation of the rocks with image colour
space transformation from RGB to CIElab, in
consequence, the efficiency of the segmentation has
increased [17]. Another segmentation technique
based on the constrained automated seeded region
growing has been developed in [18].
3. PROPOSED METHOD
Many authors of the papers similar to the one
presented in this work, ignore part of the sample
preparation in real time, by using complex
microscopes or other expensive off-line devices.
The off-line method requires some time for taking
the sample from a technological line, preparation of
the sample and analysis by the application. Another
well-known objective is a time consumption what is
the result of complex image processing algorithms.
Most of the already developed methods are based
on one of two classic ways mentioned in the
previous section and are focused only on the one
type of the structure or one type of the feature, such
as colour, size, or shape. The novelty of the
proposed solution focuses on the higher granularity
range recognition in real-time, which can be
recognized by the algorithm thanks to the usage of
the different angle lighting, procedure of the sample
quality checking and combined classification of the
detected grains.
Some of the issues identified during our
experiments should be taken into consideration.
First, the character of the process – the raw sample
of the material directly after milling with constant
frequency still on the rig can be taken.
a)
b)
c)
Fig. 3. Sample images of the copper ore
acquired under different lightning direction –
centre (a), right (b), left (c)
Next, the structure of the grains sample in most
cases is not homogeneous and flat. In the Figure 3
images taken under the different direction of the
lightning have been presented. In the Fig.3a taken
under perpendicular to the observed material angle
non-uniformity of the surface is not visible, but in
Fig.3b and especially Fig.3c regions with black
colour can be found. Images have been taken under
45° angle from the camera at the right and left side
respectively. In consequence, we have important
information about the quality of the samples,
because all the faults, such as valleys and hills in

DIAGNOSTYKA, Vol. 19, No. 1 (2018)
Budzan S, Pawełczyk M.: Grain size determination and classification using adaptive image …
44
the sample will affect results of particle size
classification.
Furthermore, the method should be not limited
to any fixed grain size, of course with some wide
predefined grain range. The grain classification,
grain distribution, shape of the grains and other
extracted features can be used to indirect mill
diagnostics to complement other methods of
diagnostics such as history of mill operations,
visual inspections and process measurements of the
mill elements - separator, mill chamber, grinding
media distribution in the rig.
Based on the above-identified issues authors
developed a method which is based on the online
examination of the product during the milling
process. Determination of the total number of the
grain, the size of each grain, also the classification
of the grains are the main goal of proposed method.
In the proposed method the camera with white
lightning mounted at an assumed angle has been
used, in order to increase significantly a number of
the extracted features and detection of the fault
samples.
Fig. 4. Block diagram of the proposed method
Next, the quality of the image is increased using
histogram equalization to extract some of the non-
visible grains (Fig.5). Histogram equalization is a
fully automatic and fast contrast improvement
technique. In the recent literature can be found
numerous methods of contrast enhancing such as
based on the bi-histogram equalization median
plateau limit [19], exposure based sub-image
histogram equalization [20], edge preserving local
histogram equalization [21] and many others. In
this paper authors used classic histogram
equalization with global information. For milled
material images, the algorithm improves the
contrast to the required one for proper analysis. In
the next step, images are extracted in order to
remove borders of the images.
After above pre-processing steps, the sample
must be checked in quality sample step. Authors
decided to divide each image into four segments
with the same area. For each segment, we calculate
average intensity and standard deviation. Next,
these parameters are compared with nominal
parameters calculated for a set of nominal samples.
If they are less than 80% of nominal parameters the
sample should be rejected and a new sample should
be taken, in other case samples can be processed
through the algorithm.
a)
b)
c)
Fig. 5. Original image (a), after logarithmic
operation (b), after histogram equalization (c)
The detection of the particles is performed by an
adaptive segmentation based on the inter-class
variance. This method utilizes discriminant analysis
to find the maximum separability of classes, in
order to the rules: find the threshold that minimizes
the weighted with-in-class variance for each
possible threshold value. In consequence, the means
of two classes can be separated as far as possible
and the variances in both classes will be as minimal
as possible. Generally, the segmentation is based on
the method called in the literature as Otsu method
[22] with improvements for better segmentation of

DIAGNOSTYKA, Vol. 19, No. 1 (2018)
Budzan S, Pawełczyk M.: Grain size determination and classification using adaptive image …
45
complex images. The method computes histogram
and probabilities values for each intensity level of
the image. Next, the class means and class
probabilities must be calculated for each possible
threshold. The morphological refining is the set of
fast morphology operations which improve the
quality of the segmented particles and are based on
the hole filling and small particles removing, in
order to the mean value of the particles area. Taking
into account that the particles are classified basing
mostly on the particle size, proposed Otsu
segmentation and refining methods produce in most
cases connected particles, which can be treated by
the classification procedure as one large particle.
Thus authors propose method of particles
separation, which is based on the calculation of the
Euclidean distance transform. Based on the centres
of the distance map, grains are divided into
separated ones exactly in a half way between
centres. It is important that not for all particles the
distance transform has been calculated, only those
for which aspect ratio value is low. In Figure 6 has
been presented results of segmentation and distance
transform for all the detected particles. In the red
rectangle connected particles has been checked and
distance transform, which in this case indicates that
the particle detected as one contains two separate
grains. During our experiments distance transform
changes the number of the particles 10-15% in
relation to the nominal number of the particles
calculated manually - depending on the granularity
class. a)
b)
Fig. 6. Segmented image (a), distance
transform (b)
At the final stage, all recognized grains are
described by a set of parameters such as the centre
of mass, perimeter, area, percent of area/image,
compactness factor and Heywood factor. The
perimeter and area values are used to classify
grains, percent of area/image is used to obtain
information about overall segmentation quality:
value less than 70% means that 30% of the image
area does not contain any of the grain.
4. EXPERIMENTS AND DISCUSSION
The proposed solution has been tested on the
dedicated machine vision set-up equipped with a
1624x1234 resolution colour CCD camera, 16 mm
lens with two spacer rings, the source of the white
light with flexible mounting and PC computer with
software in static laboratory stand. With the use of
laboratory sieves, sand grains were partitioned into
six sizes: of 0.2-0.25 mm, 0.25-0.3 mm, 0.3-0.385
mm, 0.385-0.43 mm, 0.43-0.49 mm and 0.49-0.75
mm diameter, also in our experiments we used
copper ore partitioned into five sizes: of 0.045-
0.071 mm, 0.071-0.1 mm, 0.1-0.2 mm, 0.2-05 mm
and 0.5-1 mm. Each time images have been taken
with the same camera position, but different light
source direction: left with an 45º angle, centre and
right with an 45º angle.
Proposed method uses an adaptive segmentation
based on inter-class in-variance which is most
suited to the shape of the grains. Of course, the
algorithm has been adapted to the sand and copper
ore grains. Images taken during experiments in
most cases are non-uniformity, thus only adaptive
segmentation can deal with this limitation. Local
analysis of the particle regions produces too
detailed results, where one particle is divided into a
few ones. During our experiments, a few well-
known methods of segmentations have been tested
(see Fig.7). Segmentation based on the entropy
function produces thinned grains and only larger
ones can be detected, other will be removed from
the resulting image. The clustering method
produces many larger grains. The inter-class
invariance thresholding method produces most
suitable results.
In Figure 8 results of the proposed algorithms
steps have been presented. Most of the grains have
been correctly segmented, but some of them include
some holes as an effect of grain texture
segmentation, some other are too small and must be
removed. The final result has been presented on the
Fig.8e with labelled one in Fig.8f. Taking into
account the main goal of the proposed method
which is grain size detection and the overall
classification of the sample, the most interesting are
larger grains, because their greater participation in a
total number of grains carries information about
milling quality, also the distribution of the different
classes of the particle should be uniform.

DIAGNOSTYKA, Vol. 19, No. 1 (2018)
Budzan S, Pawełczyk M.: Grain size determination and classification using adaptive image …
46
(a) (b) (c)
Fig. 7. Results of image segmentation using proposed method (a), entropy (b), clustering (c)
(a) (b) (c)
(d) (e) (f)
Fig. 8. Original image (a), after histogram equalization (b), after extraction (c), after segmentation (d), after
refining (e), final result (f)
Table 1. Sample of diagnostic parameters values determined in course of experiments
Parameter/Particle no 1 2 3 4 5 6 7 8 9
Centre of Mass X 140,89 349,13 500,95 862,15 526,73 931,78 748,30 437,44 235,22
Centre of Mass Y 70,03 16,72 3,83 9,27 50,73 106,71 174,45 81,65 149,33
Perimeter 870,81 181,14 68,52 99,99 200,02 793,16 798,72 148,59 714,71
Max Feret Diameter 253,21 75,27 29,15 41,59 78,10 211,69 232,82 57,14 226,15
Waddel Disk Diameter 163,63 50,16 17,15 27,27 59,87 144,79 197,15 44,06 139,10
Area 21028,00 1976,00 231,00 584,00 2815,00 16466,00 30528,00 1525,00 15196,00
Orientation 29,18 162,83 175,10 20,38 42,79 128,64 111,55 163,95 32,51
Elongation Factor 2,52 2,87 3,68 2,96 2,17 1,94 1,58 2,14 2,53
Compactness Factor 0,57 0,68 0,72 0,73 0,70 0,48 0,65 0,64 0,44
Heywood Factor 1,69 1,15 1,27 1,17 1,06 1,74 1,29 1,07 1,64
Type factor 0,75 0,91 0,92 0,89 0,92 0,60 0,89 0,95 0,59
For each localized grain, the algorithm produces
a set of parameters. A sample set of parameters for
selected particles in the image has been presented in
Table 1. All the parameters have been selected
regarding to the assumption that they should
describe geometric features in the particle, also they
are sensitivity for changes in the shape of the
particle. In consequence, some of them as Heywood
factor, compactness factor, and particle area is used
in classification procedure.
The proposed algorithm can be used in a few
scenarios. First, as tracking algorithm of assumed

DIAGNOSTYKA, Vol. 19, No. 1 (2018)
Budzan S, Pawełczyk M.: Grain size determination and classification using adaptive image …
47
one granularity – particle size. In this case, the
algorithm should be able to acquire images with
constant frequency and as result of processing each
time, it produces percent of particles in the sample
with assumed granularity. Second, as a typical
distribution of the particle sizes classes for one
taken sample. In this case, we are interested in
changes in time between next distributions.
Generally, the participation of the larger particles in
a total number of particles should decrease through
the time during milling. If not, there can be a
probable problem with milling medium. Third,
based on the assumption that quality of the final
milling product specify quality of the milling in
general, method will recognize e.g. problem with
milling media – it’s reduction; by observing the
Heywood factor value and area, problem with
extraction of the milled material unit by observing
total Area value.
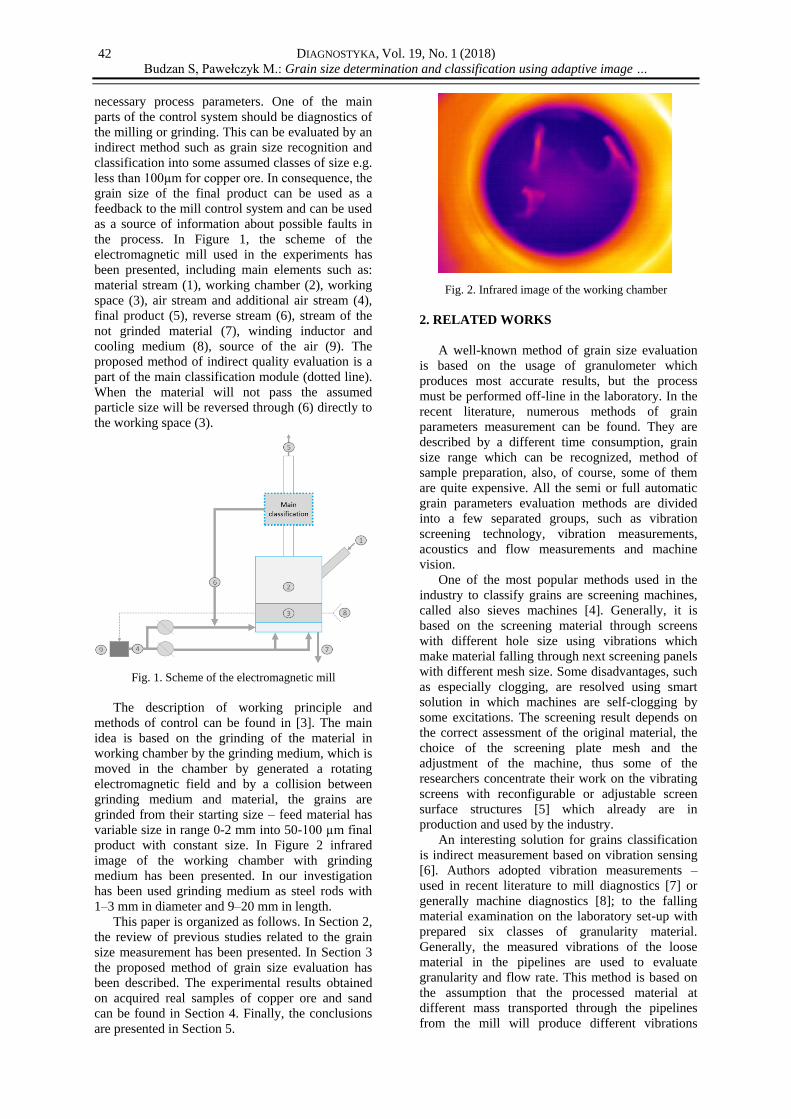
Fig. 9. Results of the different grain class distribution
In Figure 9 has been presented mentioned
distribution as a result of proposed method for a
correctly prepared sample with uniform well-
known granularity. Detected other classes of the
grain sizes are the result of some regions, where
grain are placed in front of narrow surface, also as
result of the segmentation process.
Fig. 10. Compactness and Heywood
circularity factor for sand grains samples
In Figure 10 compactness and Heywood factor
for different classes has been presented. Calculated
values for nominal samples can be used during
diagnostics because for smallest grains both
parameters values should be closest to 1. Other
hand, for larger granularity, both parameters should
be characterized by the opposite trend in order to 1.
Compactness factor is associated directly with a
density of the grain, whereas information about the
circularity of the grain is represented by the
Heywood factor.
The classification procedure is based on the
simple rule-based system in order to the procedure:
define all required grain classes, calculate necessary
parameters in each defined class for nominal
samples, which must be created with e.g. sieves and
proposed method, take the image from the rig,
classify particles. In Figure 11 final results of
detection and classification have been presented.
Proposed method produce results most similar to
the manual selection, but it must be taken into
account that manual selection also includes some
imperfections, especially for a large number of the
smaller particles.
Fig. 11. Efficiency of the detection methods
5. CONCLUSIONS
In this paper, the method of grain detection and
particle classification has been presented, based on
improved adaptive segmentation. The research has
been focused on the different type of the material
with a predefined granularity classes. The obtained
results show the relationship between measured
parameters and overall quality of the milling
process. Furthermore, authors had discussed
different scenario of proposed method utilization.
Using INTEL i5 2.60GHz PC computer our
algorithm takes overall about 400ms. Our future
work will be concentrated on the optimization of
the segmentation method for real-time applications
and developing a new contrast image enhancing
method.
SOURCE OF FUNDING
The research reported in this paper was co-
financed by the National Centre for Research and
Development, Poland, under Applied Research
Programme, project no. PBS3/B3/28/2015.
REFERENCES
1. Kurzydlo M, Pawelczyk M. Vibration measurement
for copper ore milling and classification process
optimization. Vibroeng. Procedia 2015; 6: 18–23.
2. Atmaca A, Kanoglu M. Reducing energy
consumption of a raw mill in cement industry.
Energy 2012; 42: 261–269.
https://doi.org/10.1016/j.energy.2012.03.060
3. Ogonowski S, Ogonowski Z, Pawelczyk M. Model
of the air stream ratio for an electromagnetic mill

DIAGNOSTYKA, Vol. 19, No. 1 (2018)
Budzan S, Pawełczyk M.: Grain size determination and classification using adaptive image …
48
control system. 21st International Conference on
Methods and Models in Automation and Robotics,
MMAR 2016.
https://doi.org/10.1109/MMAR.2016.7575257.
4. Makinde OA, Ramatsetse BI, Mpofu K. Review of
vibrating screen development trends: Linking the
past and the future in mining machinery industries.
International Journal of Mineral Processing 2015;
145: 17-22.
https://doi/org/10.1016/j.minpro.2015.11.001.
5. Ramatsetse B, Matsebe O, Mpofu K, Desai DA.
Conceptual design framework for developing a
reconfigurable vibrating screen for small and
medium mining enter-prises. SAIIE25 proceedings
2013; 595: 1-10.
6. Krauze O, Pawelczyk M. Estimating parameters of
loose material stream using vibration measurements.
17th International Carpathian Control Conference
(ICCC) Proceedings 2016; 378 – 383.
http://doi/org/10.1109/CarpathianCC.2016.7501127.
7. Agrawal V, Panigrahi BK, Subbarao PMV. Review
of control and fault diagnosis methods applied to
coal mills. Journal of Process Control 2015; 32:
138–153
https://doi/org/10.1016/j.jprocont.2015.04.006.
8. Jardine AKS, Lin D, Banjevic D. A review on
machinery diagnostics and prognostics
implementing condition-based maintenance.
Mechanical Systems and Signal Processing 2006;
20: 1483–1510.
doi: https://doi.org/10.1016/j.ymssp.2005.09.012.
9. Buchczik D, Ilewicz W. Evaluation of calibration
results using the least median of squares method in
the case of linear multivariate models. 21st
International Conference on Methods and Models in
Automation and Robotics (MMAR) 2016; 800-805.
https://doi.org/10.1109/MMAR.2016.7575239.
10. Wiora J, Wrona S, Pawelczyk M. Evaluation of
measurement value and uncertainty of sound
pressure level difference obtained by active device
noise reduction. Measurement 2016; 96: 67–75.
https://doi.org/10.1016/j.measurement.2016.10.050.
11. Chung CH, Chang FJ. A refined automated grain
sizing method for estimating river-bed grain size
distribution of digital images. Journal of Hydrology
2013; 486: 224–233.
https://doi.org/10.1016/j.jhydrol.2013.01.026.
12. Asmussen P, Conrad O, Günther A, Kirsch M, Riller
U. Semi-automatic segmentation of petrographic
thin section images using a “seeded-region growing
algorithm” with an application to characterize
wheathered subarkose sandstone. Computers &
Geosciences 2015; 83: 89–99.
https://doi.org/10.1016/j.cageo.2015.05.001. 13. Mehrabi A, Mehrshad N, Massinaei M. Machine
vision based monitoring of an industrial flotation
cell in an iron flotation plant. International Journal
of Mineral Processing 2014; 133: 60–66.
https://doi.org/10.1016/j.minpro.2014.09.018.
14. Igathinathane C, Ulusoy U. Machine vision methods
based particle size distribution of ball-and gyro-
milled lignite and hard coal. Powder Technology
2016; 297: 71–80.
https://doi.org/10.1016/j.powtec.2016.03.032.
15. Heilbronner R. Automatic grain boundary detection
and grain size analysis using polarization
micrographs or orientation images. Journal of
Structural Geology 2000; 22: 969–981.
https://doi.org/10.1016/S0191-8141(00)00014-6 16. Yesiloglu-Gultekin N, Keceli A, Sezer E, Can A,
Gokceoglu C, Bayhan H. A computer program
(tsecsoft) to determine mineral percentages using
photographs obtained from thin sections. Computers
& Geosciences 2012; 46: 310–316.
https://doi.org/10.1016/j.cageo.2012.01.001. 17. Obara B. A new algorithm using image colour
system transformation for rock grain segmentation.
Mineralogy and Petrology 2007; 91: 271–285.
https://doi.org/10.1007/s00710-007-0200-x.
18. Choudhury KR, Meere PA, Mulchrone KF.
Automated grain boundary detection by CASRG.
Journal of Structural Geology 2006; 28: 363–375.
https://doi.org/10.1016/j.jsg.2005.12.010.
19. Ooi CH, Isa NAM. Adaptive contrast enhancement
methods with brightness preserving IEEE Trans.
Consum. Electron 2010; 56 (4) 2543-2551.
https://doi.org/10.1109/TCE.2010.5681139. 20. Singh K, Kapoor R. Image enhancement using
exposure based sub image histogram equalization
Pattern Recogn. Lett. 2014; 36 10-14.
https://doi.org/10.1016/j.patrec.2013.08.024. 21. Lai YR, Tsai PC, Yao CY, Ruan SJ. Improved local
histogram equalization with gradient-based
weighting process for edge preservation. Multimedia
Tools Appl. 2015; 1-29.
https://doi.org/10.1007/s11042-015-3147-7
22. Otsu N. A threshold selection method from gray-
level histograms. IEEE Trans. Sys., Man., Cyber.
1979; 9 (1): 62–66.
Received 2017-07-31
Accepted 2017-12-04
Available online 2017-12-18
Sebastian BUDZAN, Ph. D.,
He obtained his M.Sc. in 2002,
Ph.D. in 2008. He is currently
an assistant professor at
Department of Automatic
Control at the Silesian
University of Technology. He
is a member of the Association
for Image Processing
authorities. His research
interests focus on feature
extraction and description, 2D/3D computer vision
systems, fusion of images, thermal images processing,
machine vision applications in industry.
Marek PAWEŁCZYK, Prof,
DSc. He obtained his M.Sc. in
1995, Ph.D. in 1999, D.Sc.
(habilitation) in 2005, and the
scientific title of professor in
2014. He is currently a Full
Titular Professor at the Silesian
University of Technology. He
is the Vice Rector (Vice
President) for Science and
Development of this university
for the term 2016-2020. His
main research interests focus on active noise-vibration
control, digital signal processing, adaptive control and
process identification.