Theoretical Analysis of the Motorcycle Front Brake Heating ...
1
Barbara NAMYSŁOWSKA – WILCZYNSKA1, M 7 Bożena SKORUPSKA2, Andrzej WIENIEWSKI3 1Professor Barbara Namysłowska-Wilczyńska, Institute of Geotechnics and Hydrotechnics, University of Technology, Wrocław, Poland
2 Bożena Skorupska Ph.D., E. Eng., Institute of Non-Ferrous Metals, Gliwice, Poland 3 Andrzej Wieniewski Ph.D., E. Eng., Institute of Non-Ferrous Metals, Gliwice, Poland
GEOSTATISTICAL ANALYSIS OF VARIATION IN TECHNOLOGICAL PARAMETERS OF ASH-SLAGS
Introduction
The aim of the spatial analysis was to develop a 3D geostatistical model of the variation in the parameters characterizing a power industry ash slags heap (comprising reservoirs A and B) in Świecie (near Toruń) in the Kujawy-Pomerania Province (Poland). The various applications of geostatistical (estimation and simulation) methods in many disciplines and research fields, often to solve interdisciplinary problems, are widely described in the literature [ 1, 2, 5, 12]. One should mention here earth sciences (mainly geological sciences and mining) [5, 6, 8, 9, 10, 12], environmental protection [3, 4, 5], climatology [7, 12], geophysics, agricultural sci-ences [12], geochemistry, oceanology, epidemiology, meteorology, forestry, materials science and even power engineering [5, 11]. The wide capabilities of the tools of geostatistics, ena-bling one to model regionalized variables, estimate averages Z* and predict simulated values ZS of the analyzed parameters characterizing various phenomena, as well as the universality of the methodological approach encourage researchers to try out these techniques in new re-search areas. A major advantage of the geostatistical methods is that when estimating aver-ages Z* and ZS one can obtain minimum estimation variance σ2
k or simulation variance σ2, and many other parameters describing the effectiveness and quality of the estimations. Geostatistical studies of four technological parameters of the ash slags were carried out by the author1 as part of her collaboration with the Institute of Nonferrous Metals in Gliwice within the framework of the IT I (KB/140/12504/IT1-B/U/08) project entitled “Development of technology of waste dump ash slag utilization through carbon separation by froth flotation” run by the Mineral Raw Materials Processing and Wastes Utilization Department of INM [13, 14]. Because of the paper's space confines only selected results of the 3D analyses of the variation in the ash slags heap's technological parameters (for reservoir A) are presented. These are the results of the modelling of moisture content W and ash content AO, using the directional variogram function and estimating averages Z* by means of ordinary (block) kriging. Refer-ence is made to the main statistics concerning organic carbon content Corg.. and beneficiation ca‐pacity e’ of the ash slags as well as to the investigation of the interdependence between the values of the technological parameters1 for reservoir A [9‐10].
1 Namysłowska-Wilczyńska B., “Geostatistical analysis of the variation in the technological parameters of ash
slags for a selected waste heap”. Report of the Institute of Geotechnics and Hydrotechnics at Wrocław Univer-sity of Technology [in Polish], series SPR, No. 8, Wrocław 2008, p. 115.
2
Range of studies
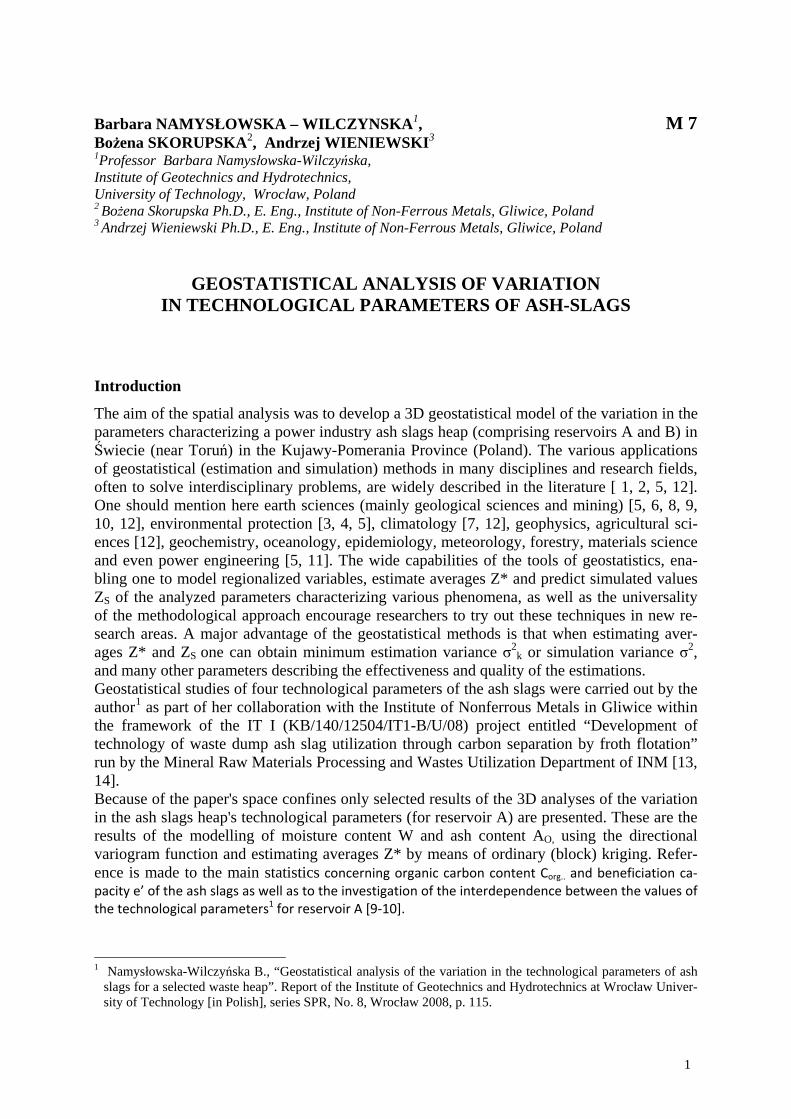
The statistical and geostatistical studies2 covered 150 m x 400 m x 10 m reservoir A within the ash-slag heap area (fig. 1). The specific gravity of the material in this reservoir was 1.948 g/cm3. Samples for the studies were taken from twelve 1-10 m deep exploratory bore-holes made within the reservoir area boundaries (fig. 1). The statistical sample size was n = 120.
Fig. 1. Map showing locations of 12 boreholes within boundaries of ash slags heap (reservoir A) near Świecie (Toruń).
The ash slags' ash content AO, moisture content W and beneficiation capacity e’ were deter-mined by the Laboratory of the Mineral Raw Materials Processing and Wastes Utilization Department of INM in Gliwice while its organic carbon content Corg.. was determined by the Analytical Chemistry Laboratory of INM. Beneficiation capacity e’ is defined as the amount of carbon recovered from 1 t of ash slags. Parameter e’ is calculated as the product of the carbon yield and the carbon content in a given sample. An input database (in 3D) concerning the technological parameters was developed. It contains the values of coordinates X, Y, Z (depth) specifying the sample taking locations, and the val-ues of the four investigated regionalized variables. The content of this database was the basis for spatial analyses. The object of the analyses was the variation in the values of two parameters characterizing the ash slags heap, i.e. moisture content W and ash content AO. The main statistics and distribu-tion histograms concerning the parameters were estimated and the spatial correlation between their values was studied.
2 The statistical and geostatistical analyses were carried out using selected computer programs in-
cluded in the ISATIS software package version 2011.2 (Geovariances & Ecole Des Mines de Paris in Avon Cedex, France) (Isatis 2001).
3
Estimation of main statistics of technological parameters
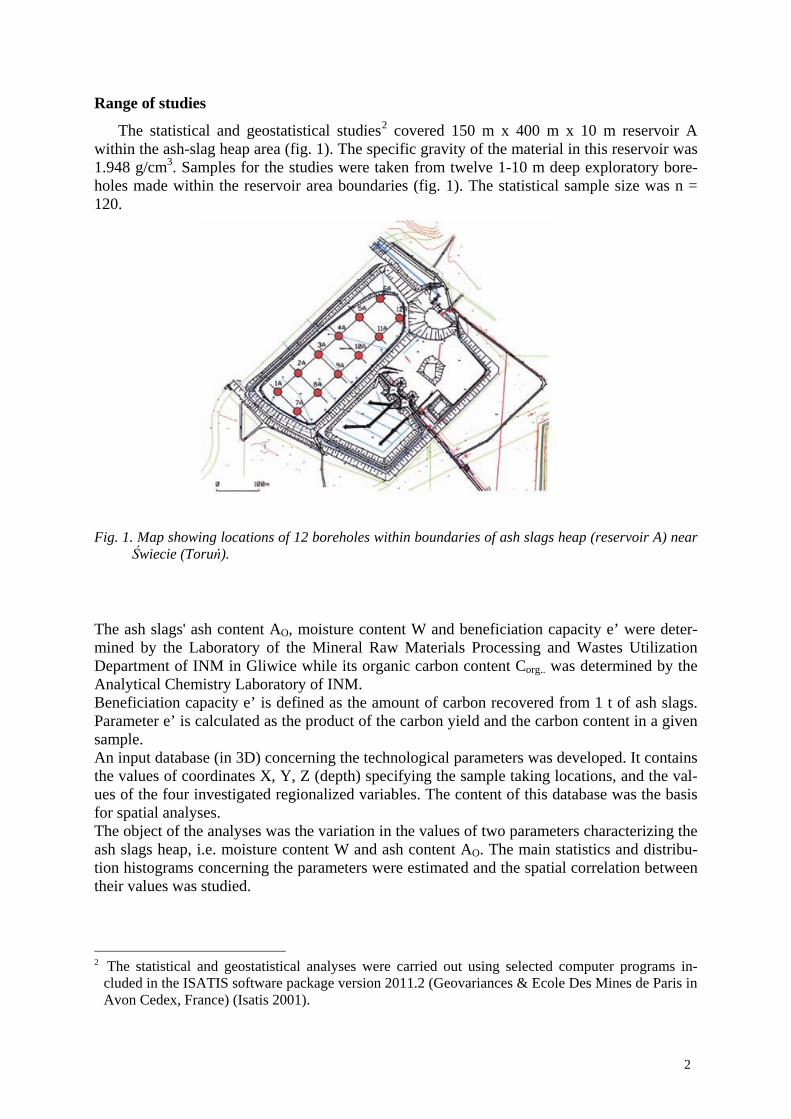
The technological parameters of the ash slags vary markedly within the boundaries of the heap (reservoir A). The evaluations of the main statistics, based on original data, indicate their different behaviour depending on the kind of parameter (tab. 1). Ash content Ao and moisture content W show respectively small (variation coefficient V=8%) and average variation (V=25%). Whereas organic carbon content Corg. and beneficiation capacity e’ were found to vary greatly (V=53-59%). Table 1 Main statistics of technological parameters of ash slags in waste heap.
Analyzed parameter
Sample size n
Minimum value Xmin [%]
Maximum value Xmax [%]
Average value
X [%]
Standard de-viation
S [%]
Variation coefficient
V [%]
Ash content AO
120 65.14 95.78 84.02 6.49 8
Moisture con-tent W
120 8.84 36.43 23.64 6.01 25
The histogram of ash content AO shows left-side asymmetry. A similar (but weaker) distribu-tion trend with noticeable negative skewness is visible in the moisture content W histogram. Skewness coefficients g1 of the histograms are in a range of 0.28 (W) ÷ - 0.53 (AO). The his-tograms of organic carbon content Corg. And beneficiation capacity e’ show right-side asym-metry, with positive skewness coefficients g1 ranging from 0.88 (Corg.) to 0.94 (e’). Flattening (kurtosis) coefficients g2 of the histograms amount to 2.40 - 3.49.
Study of correlation between technological parameters
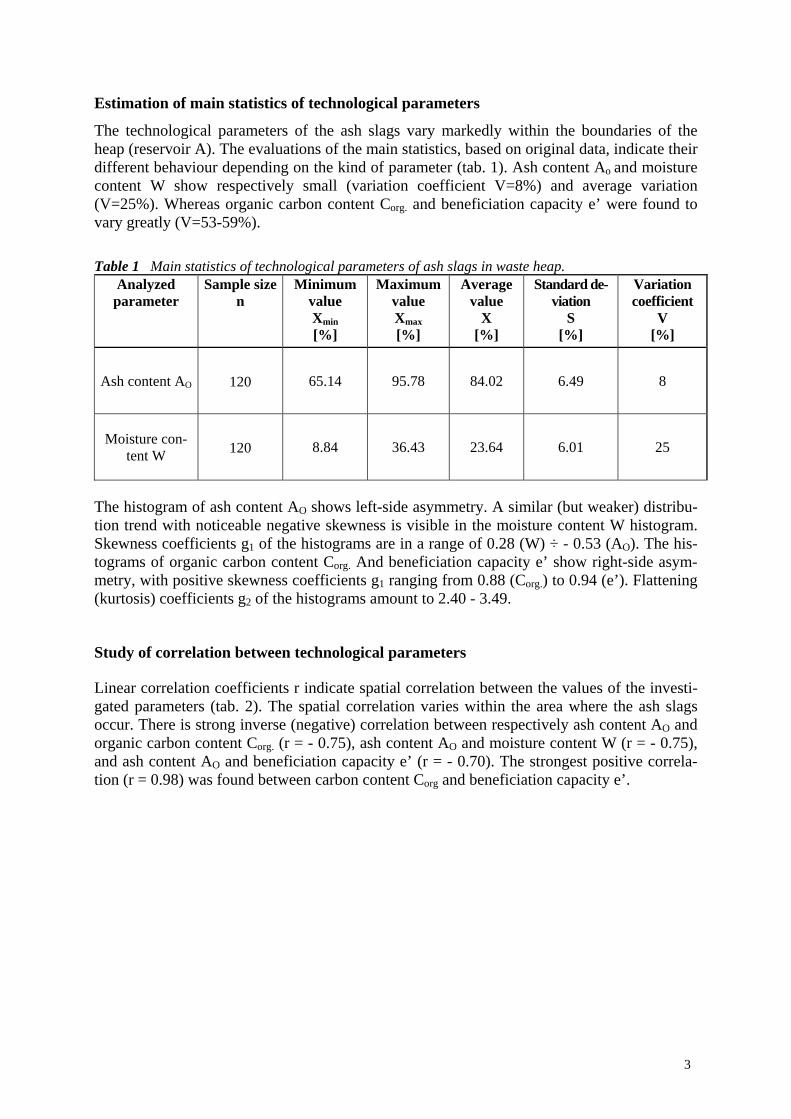
Linear correlation coefficients r indicate spatial correlation between the values of the investi-gated parameters (tab. 2). The spatial correlation varies within the area where the ash slags occur. There is strong inverse (negative) correlation between respectively ash content AO and organic carbon content Corg. (r = - 0.75), ash content AO and moisture content W (r = - 0.75), and ash content AO and beneficiation capacity e’ (r = - 0.70). The strongest positive correla-tion (r = 0.98) was found between carbon content Corg and beneficiation capacity e’.
4
Table 2 Linear correlation coefficients r of technological parameters of waste heap ash slags
Analyzed parameter
Sample size n Ash content
AO [%]
Organic carbon
content Corg. [%]
Moisture content
W
[%]
Beneficiation capacity
e’
[kg/tmat.]
Ash content AO [%]
120
1.00
-0.75
-0.75
-0.70
Organic car-bon content
Corg. [%]
120
-0.75
1.00
0.67
0.98
Moisture content
W [%]
120
-0.75
0.67
1.00
0.67
Beneficiation capacity e’
[kg/tmat.]
120
-0.70
0.98
0.67
1.00
Structural analysis of variation in technological parameters
The structure of the spatial variation in the technological parameters was studied through a structural (variographic) analysis using variogram function γ(h). A clear rising trend of function γ(h) is observed in the directional variograms calculated de-pending on the sample taking depth. The strongest rising trend of γ(h) is observed in the variograms of organic carbon content Corg and beneficiation capacity e’ [9-10]. The variograms were approximated with a spherical model (e’) or a spherical model and a linear model (Corg. ) or with the two models combined with nugget effect CO (ash content AO and moisture content W) (tabs 3-4). The correlation distance, i.e. the variogram range (a = 76.89 m, a = 95.54 m), was found to be much longer for Corg. than for beneficiation capacity e’ (a = 13.22 m), moisture content W (a = 14.42 m) and ash content AO (a = 13.47 m, a = 11.26 m) (tabs 3-4). Nugget effect CO was found in the variograms of ash content AO and moisture con-tent W (tabs 3-4), being more pronounced in the AO variogram. No CO effect occurred in the variograms of Corg.. and e’, which indicates the abscence of abrupt changes in function γ(h).

5
Fig. 2. Directional variogram of moisture content W [%]2 in heap ash slags, with fitted theoretical model
Fig. 3. Directional empirical variogram of ash content AO [%]2 in heap ash slags, with fitted theoreti-cal model.
Table 3 Geostatistical parameters of models of directional (along axis Z) variograms of heap ash slags technological parameters.
Analyzed parameters
Nugget ef-fect C0
[%]2
Variance
component C’
[%]2
Sill variance C
[%]2
Range
of influence a
[m]
Main model structures
Moisture content
W 4.5 34.20
3.61 42.31 14.42 14.42
spherical, linear
D-90
360
180
W
0 20 40 60 80 100 120 140
Odleglosc [m]
0
10
20
30
40
50
60
Variogram : Wilgotnosc W [%]2
Isatis
D-90
360
180
Ao
0 20 40 60 80 100 120 140
Odleglosc [m]
-10
0
10
20
30
40
50
60
70
Variogram: zawartosc popiolu Ao [%]2
Isatis
6
Table 4 Geostatistical parameters of models of directional (along axis Z) variograms of heap ash slags technological parameters.
Analyzed parameter
Nugget effect C0
[%]2
Variance
componentC’
[%]2
Sill variance C
[%]2
Range
of influence a
[m]
Main model structures
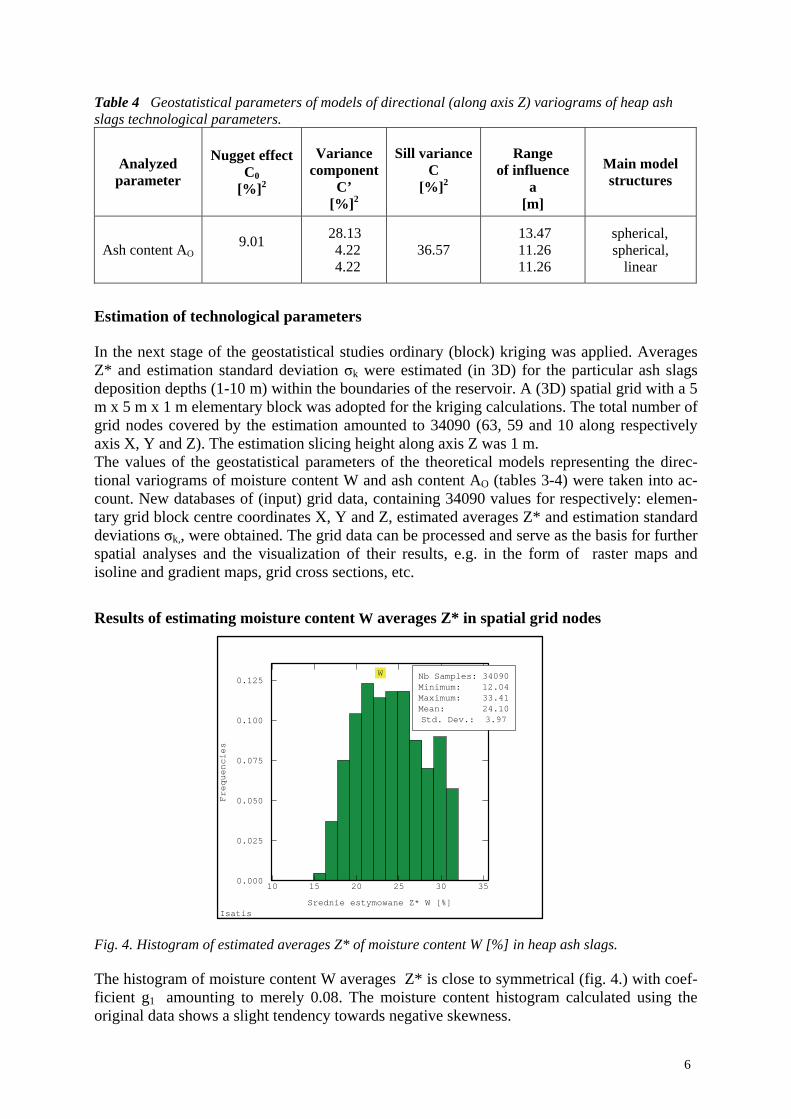
Ash content AO 9.01
28.13 4.22 4.22
36.57 13.47
11.26 11.26
spherical, spherical,
linear
Estimation of technological parameters
In the next stage of the geostatistical studies ordinary (block) kriging was applied. Averages Z* and estimation standard deviation σk were estimated (in 3D) for the particular ash slags deposition depths (1-10 m) within the boundaries of the reservoir. A (3D) spatial grid with a 5 m x 5 m x 1 m elementary block was adopted for the kriging calculations. The total number of grid nodes covered by the estimation amounted to 34090 (63, 59 and 10 along respectively axis X, Y and Z). The estimation slicing height along axis Z was 1 m. The values of the geostatistical parameters of the theoretical models representing the direc-tional variograms of moisture content W and ash content AO (tables 3-4) were taken into ac-count. New databases of (input) grid data, containing 34090 values for respectively: elemen-tary grid block centre coordinates X, Y and Z, estimated averages Z* and estimation standard deviations σk,, were obtained. The grid data can be processed and serve as the basis for further spatial analyses and the visualization of their results, e.g. in the form of raster maps and isoline and gradient maps, grid cross sections, etc.
Results of estimating moisture content W averages Z* in spatial grid nodes
Fig. 4. Histogram of estimated averages Z* of moisture content W [%] in heap ash slags. The histogram of moisture content W averages Z* is close to symmetrical (fig. 4.) with coef-ficient g1 amounting to merely 0.08. The moisture content histogram calculated using the original data shows a slight tendency towards negative skewness.
W
10 15 20 25 30 35
Srednie estymowane Z* W [%]
0.000
0.025
0.050
0.075
0.100
0.125
Frequencies
Nb Samples: 34090Minimum: 12.04Maximum: 33.41Mean: 24.10Std. Dev.: 3.97
Isatis
7
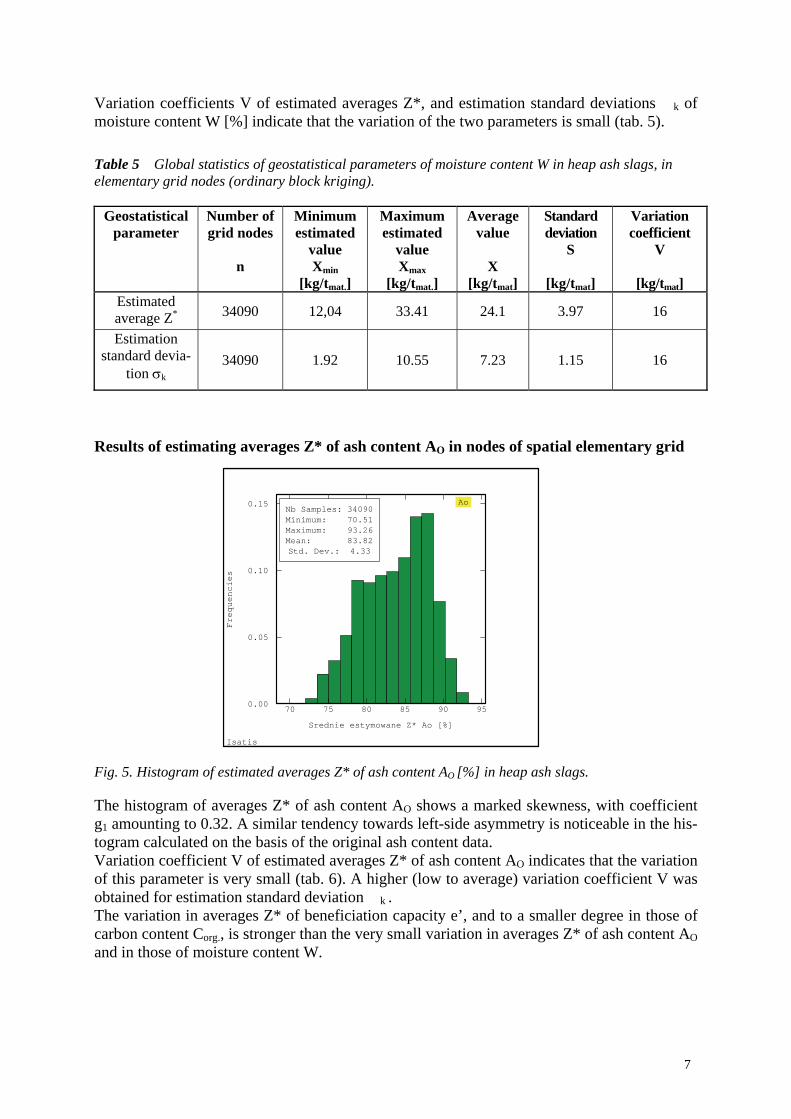
Variation coefficients V of estimated averages Z*, and estimation standard deviations �k of moisture content W [%] indicate that the variation of the two parameters is small (tab. 5).
Table 5 Global statistics of geostatistical parameters of moisture content W in heap ash slags, in elementary grid nodes (ordinary block kriging).
Geostatistical parameter
Number of grid nodes
n
Minimum estimated
value Xmin
[kg/tmat.]
Maximum estimated
value Xmax
[kg/tmat.]
Average value
X
[kg/tmat]
Standard deviation
S
[kg/tmat]
Variation coefficient
V
[kg/tmat] Estimated average Z* 34090 12,04 33.41 24.1 3.97 16
Estimation standard devia-
tion σk
34090 1.92 10.55 7.23 1.15 16
Results of estimating averages Z* of ash content AO in nodes of spatial elementary grid
Fig. 5. Histogram of estimated averages Z* of ash content AO [%] in heap ash slags.
The histogram of averages Z* of ash content AO shows a marked skewness, with coefficient g1 amounting to 0.32. A similar tendency towards left-side asymmetry is noticeable in the his-togram calculated on the basis of the original ash content data. Variation coefficient V of estimated averages Z* of ash content AO indicates that the variation of this parameter is very small (tab. 6). A higher (low to average) variation coefficient V was obtained for estimation standard deviation �k . The variation in averages Z* of beneficiation capacity e’, and to a smaller degree in those of carbon content Corg., is stronger than the very small variation in averages Z* of ash content AO and in those of moisture content W.
Ao
70 75 80 85 90 95
Srednie estymowane Z* Ao [%]
0.00
0.05
0.10
0.15
Frequencies
Nb Samples: 34090Minimum: 70.51Maximum: 93.26Mean: 83.82Std. Dev.: 4.33
Isatis
8
Table 6 Global statistics of geostatistical parameters of ash content AO in heap ash slags, in elemen-tary spatial grid nodes (block kriging).
Geostatistical parameter
Number of grid nodes
n
Minimum estimated
value Xmin [%]
Maximumestimated
value Xmax [%]
Average value
X
[%]
Standard deviation
S
[%]
Variation coefficient
V
[%] Estimated average Z* 34090 70.51 93.26 83.82 4.33 5
Estimation standard
deviation σk
34090 2.26 11.78 7.67 7.41 19
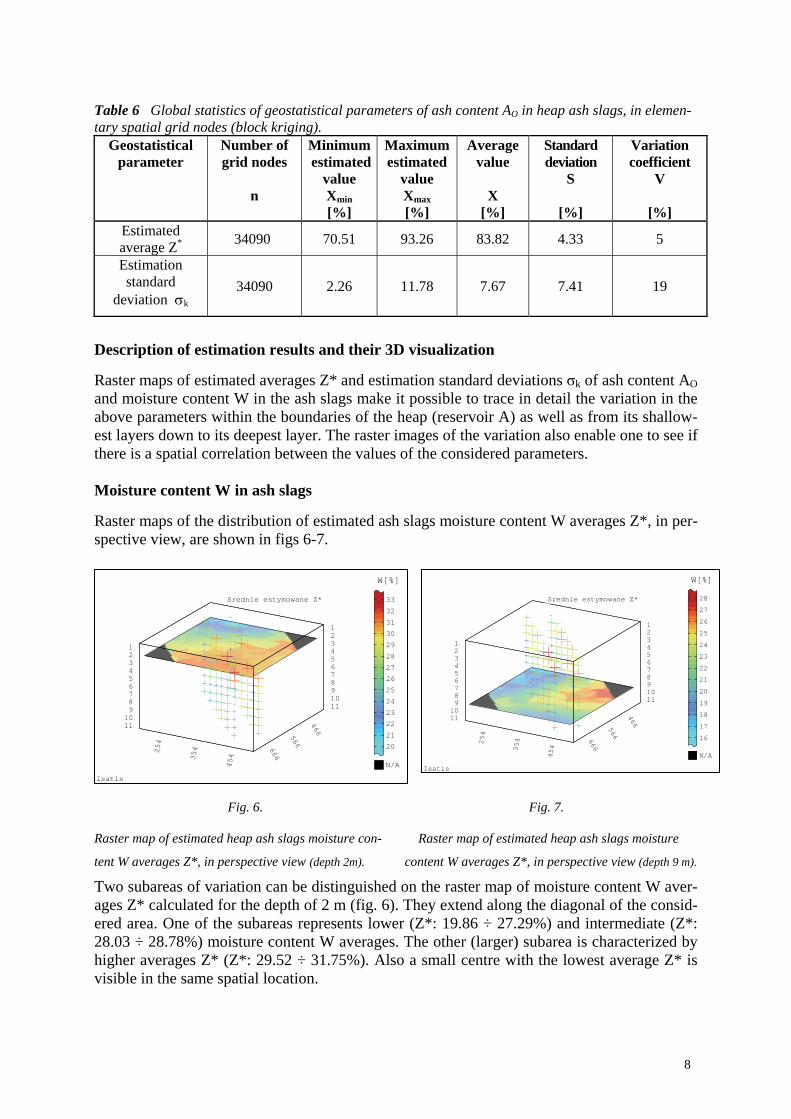
Description of estimation results and their 3D visualization Raster maps of estimated averages Z* and estimation standard deviations σk of ash content AO and moisture content W in the ash slags make it possible to trace in detail the variation in the above parameters within the boundaries of the heap (reservoir A) as well as from its shallow-est layers down to its deepest layer. The raster images of the variation also enable one to see if there is a spatial correlation between the values of the considered parameters. Moisture content W in ash slags Raster maps of the distribution of estimated ash slags moisture content W averages Z*, in per-spective view, are shown in figs 6-7.
Fig. 6. Fig. 7.
Raster map of estimated heap ash slags moisture con- Raster map of estimated heap ash slags moisture
tent W averages Z*, in perspective view (depth 2m). content W averages Z*, in perspective view (depth 9 m).
Two subareas of variation can be distinguished on the raster map of moisture content W aver-ages Z* calculated for the depth of 2 m (fig. 6). They extend along the diagonal of the consid-ered area. One of the subareas represents lower (Z*: 19.86 ÷ 27.29%) and intermediate (Z*: 28.03 ÷ 28.78%) moisture content W averages. The other (larger) subarea is characterized by higher averages Z* (Z*: 29.52 ÷ 31.75%). Also a small centre with the lowest average Z* is visible in the same spatial location.
W[%]
N/A
33
32
31
30
29
28
27
26
25
24
23
22
21
20
1 2 3 4 5 6 7 8 9
10 11
1 2 3 4 5 6 7 8 9 10 11
466 566 666 254
354
454
Srednie estymowane Z*
Isatis
W[%]
N/A
28
27
26
25
24
23
22
21
20
19
18
17
16
1 2 3 4 5 6 7 8 9
10 11
1 2 3 4 5 6 7 8 9 10 11
466 566 666 254
354
454
Srednie estymowane Z*
Isatis
9
In the raster map for the depth of 9 m (fig. 7) a large uniform subarea with the highest average Z* is clearly distinct. The highest averages Z* are in the range Z*: 25.04 ÷27.16% (fig. 7). Lower averages Z* are in intervals: 15.89 ÷ 20.12% and 20.12 ÷ 22.93%. The spatial location of small centres of elevated carbon content Corg.. coincides with the extent of the zones of low ash content AO while subareas of lower carbon content Corg.. occur in con-junction with subareas characterized by higher ash content AO.
Maximum estimated Minimum estimated moisture content W averages Z* moisture content W averages Z*
1 m 29.94 ÷ 32.87 [%] 17.21 ÷ 20.15 [%] 2 m 29.52 ÷ 31.75 [%] 19.86 ÷ 22.09 [%] 3 m 29.53 ÷ 31.52 [%] 20.94 ÷ 22.92 [%] 4 m 28.50 ÷ 30.45 [%] 20.06 ÷ 22.01 [%] 5 m 27.85 ÷ 31.20 [%] 13.32 ÷ 16.67 [%] 6 m 27.54 ÷ 31.20 [%] 11.69 ÷ 15.35 [%] 7 m 26.13 ÷ 29.38 [%] 12.04 ÷ 15.29 [%] 8 m 24.81 ÷ 27.34 [%] 13.86 ÷ 16.39 [%] 9 m 25.04 ÷ 27.16 [%] 15.89 ÷ 18.00 [%]
10 m 25.25 ÷ 27.30 [%] 16.39 ÷ 18.44 [%]
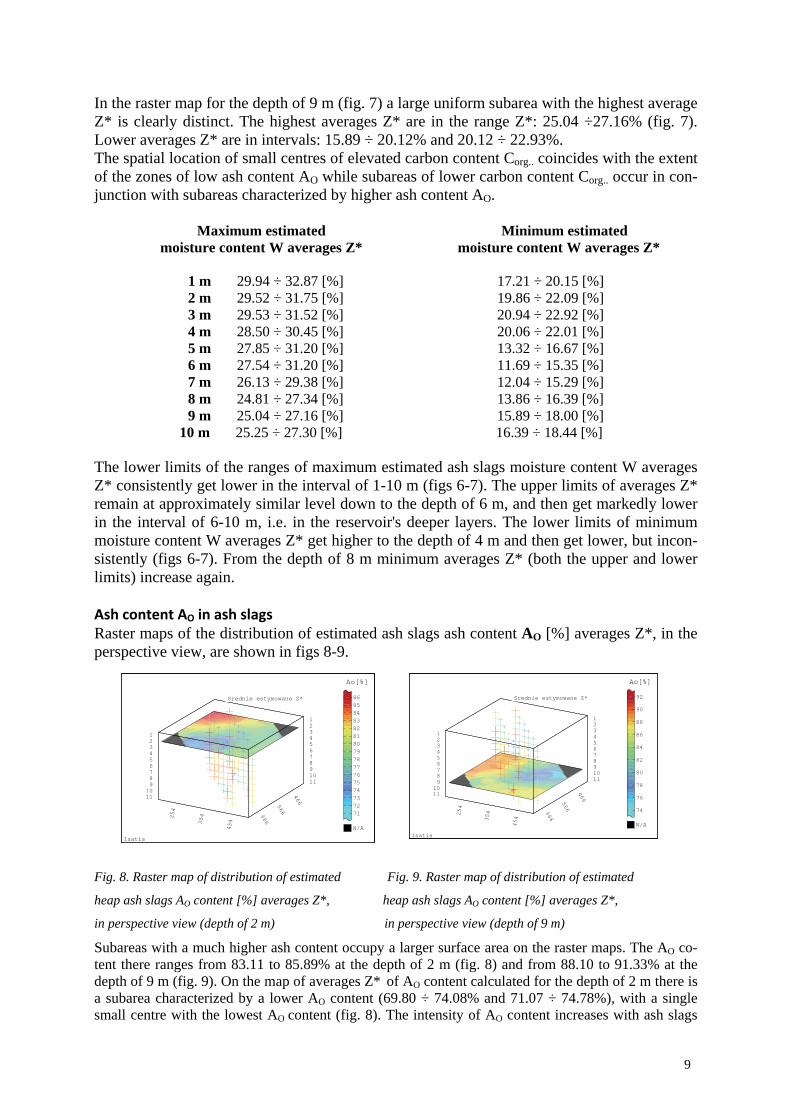
The lower limits of the ranges of maximum estimated ash slags moisture content W averages Z* consistently get lower in the interval of 1-10 m (figs 6-7). The upper limits of averages Z* remain at approximately similar level down to the depth of 6 m, and then get markedly lower in the interval of 6-10 m, i.e. in the reservoir's deeper layers. The lower limits of minimum moisture content W averages Z* get higher to the depth of 4 m and then get lower, but incon-sistently (figs 6-7). From the depth of 8 m minimum averages Z* (both the upper and lower limits) increase again. Ash content AO in ash slags Raster maps of the distribution of estimated ash slags ash content AO [%] averages Z*, in the perspective view, are shown in figs 8-9.
Fig. 8. Raster map of distribution of estimated Fig. 9. Raster map of distribution of estimated
heap ash slags AO content [%] averages Z*, heap ash slags AO content [%] averages Z*,
in perspective view (depth of 2 m) in perspective view (depth of 9 m)
Subareas with a much higher ash content occupy a larger surface area on the raster maps. The AO co-tent there ranges from 83.11 to 85.89% at the depth of 2 m (fig. 8) and from 88.10 to 91.33% at the depth of 9 m (fig. 9). On the map of averages Z* of AO content calculated for the depth of 2 m there is a subarea characterized by a lower AO content (69.80 ÷ 74.08% and 71.07 ÷ 74.78%), with a single small centre with the lowest AO content (fig. 8). The intensity of AO content increases with ash slags
Ao[%]
N/A
86858483828180797877767574737271
1 2 3 4 5 6 7 8 9
10 11
1 2 3 4 5 6 7 8 9 10 11
466 566 666 254
354
454
Srednie estymowane Z*
Isatis
Ao[%]
N/A
92
90
88
86
84
82
80
78
76
74
1 2 3 4 5 6 7 8 9
10 11
1 2 3 4 5 6 7 8 9 10 11
466 566 666 254
354
454
Srednie estymowane Z*
Isatis
1
heap depth. A distinct centre with higher AO content (88.10 ÷ 91.33%) is observed, e.g., at a depth of 9 m (fig. 9).
Centres with lower and higher ash content AO correspond to zones with higher organic carbon content Corg. and elevated beneficiation capacity e’, and vice versa. Higher moisture content W in the ash slags is found in places characterized by higher carbon content Corg. and higher beneficiation capacity e’.
Maximum estimated Minimum estimated ash content AO averages Z* ash content AO averages Z*
1 m 83.71 ÷ 86.92 [%] 69.80 ÷ 73.01 [%] 2 m 83.11 ÷ 85.89 [%] 71.07 ÷ 73.85 [%] 3 m 86.03 ÷ 88.73 [%] 74.32 ÷ 77.02 [%] 4 m 87.72 ÷ 90.49 [%] 75.70 ÷ 78.48 [%] 5 m 89.99 ÷ 93.13 [%] 76.37 ÷ 79.52 [%] 6 m 89.79 ÷ 92.77 [%] 76.86 ÷ 79.84 [%] 7 m 90.47 ÷ 93.41 [%] 77.71 ÷ 80.65 [%] 8 m 89.51 ÷ 91.97 [%] 78.82 ÷ 81.28 [%] 9 m 88.10 ÷ 91.33 [%] 74.10 ÷ 77.33 [%]
10 m 87.75 ÷ 91.09 [%] 73.30 ÷ 76.64 [%]
The ranges of maximum ash content AO averages Z* clearly increase with depth from 1 to 10 m (figs 8-9). Maximum averages Z* reach higher values at deeper levels, being slightly lower at the depth of 8 m and stabilizing at the depth of 10 m. This observation also applies to the ranges of minimum averages Z* (figs 8-9). Ash content AO reaches markedly lower values at the depth of 9-10 m. The variation of the three studied parameters, i.e. organic carbon content Corg., moisture con-tent W and beneficiation capacity e’, shows a certain regularity. Maximum averages Z* and on the whole minimum averages Z*, especially their upper limits, consistently decrease with depth. Whereas the ranges of maximum ash content averages Z* consistently increase, reach-ing higher values of Z* in the deeper layers of the ash slags. The highest averages Z* of carbon content Corg. and beneficiation capacity e' characterize the surface (1-2 m) and near-surface (3-4 m) layers of the investigated ash slags heap. Markedly smaller averages Z* were obtained for the deeper layers situated at a depth of 5-8 m. The lowest carbon content Corg. and beneficiation capacity e' were found to characterize the deep-est layers situated at a depth of 9-10 m. The low and very low variation coefficients V of averages Z* of moisture content W (V=16%) and ash content AO (V=5%) indicate slightly varied behaviour of the parameters. Such estimations of averages Z* are accompanied by relatively low coefficients V of estima-tion standard deviation σk, ranging from 16 to 19%, which is indicative of the reliability of the obtained kriging estimates. It should be noted that the layers of ash slags in reservoir A, showing the highest beneficiation capacity e’, are utilizable and so can be of interest to some sectors of economy (mining, envi-ronmental protection, the power industry). Conclusion
A 3D geostatistical model of the variation in the technological parameters of the ash slags in a power industry waste heap was developed. The model was based on the directional variogram function and ordinary (block) kriging. Thanks to the use of the above methods the analyzed parameters were estimated both along the heap's horizontal extent and its depth. On this basis full graphic documentation of the identified variation, in the form of raster maps, isoline maps
1
and block diagrams of estimated averages Z*, estimation standard deviation σk and other pa-rameters characterizing the effectiveness of the estimations, was created. Owing to the use of the geostatistical methods to describe the variation in the technological parameters of the ash slags (considered as an anthropogenic deposit) a collection of data valu-able from research, methodological and practical point of view was acquired. The data can be very useful for a project aimed at utilizing the deposited ash slags. The presented research methodology is universal and can be applied to solve various prob-lems in such fields as geology and mining, the power industry, environmental protection (to estimate the heavy metals, toxic substances and deleterious substances content in soils and underground waters), the spatial characterization of lands to be revitalized, contaminated land remediation and climatology (to forecast the values of climatic and environmental parameters, such as the amount of rainfall and the amount of chemical compounds present in rain, as de-termined by the natural environment conditions).
References
[1] Armstrong M.: Basic Linear Geostatistics. Springer, Berlin 1998.
[2] Isaaks E. H. Srivastava R. M.: An Introduction to Applied Geostatistics. OUP, New York 1989.
[3] Namysłowska-Wilczyńska B., Rusak K.: Geostatistics description of heavy metal content variation in soil
of Olkusz region against a background of geological structure by GIS method. Mathematische Geologie,
Volume 7. Mathematical Methods Applied to Geology and Mining. Mathematische Methoden in Geolo-
gie und Bergbau. CPress Verlag. Band 7, Dresden 2003.
[4] Namysłowska-Wilczyńska B., Pyra J.: Analiza przestrzenna zawartości miedzi w środowisku gruntowo-
wodnym Legnicko-Głogowskiego Okręgu Miedziowego. Roczniki Geomatyki (Annals of Geomatics),
Tom III, Zeszyt 4, Polskie Towarzystwo Informacji Przestrzennej, Warszawa 2005.
[5] Namysłowska-Wilczyńska B.: Geostatystyka - Teoria i Zastosowania. Oficyna Wydawnicza Politechniki
Wrocławskiej, Wrocław 2006.
[6] Namysłowska-Wilczyńska B.: Analizy przestrzenne z zastosowaniem metod geostatystycznych.
Modelowanie 3D porfirowego złoża miedzi Rio Blanco w Peru. Roczniki Geomatyki (Annals of
Geomatics), Polskie Towarzystwo Informacji Przestrzennej, Tom V, Zeszyt 1, Warszawa 2007.
[7] Namysłowska-Wilczyńska B.(ed.): Modelowanie i prognozowanie (3D) wysokości opadu
atmosferycznego i zawartości siarczanów w opadzie dla obszaru dorzecza środkowej Odry z
zastosowaniem geostatystyki. Praca zbiorowa - Modelowanie Procesów Hydrologicznych, Oficyna
Wydawnicza Politechniki Wrocławskiej. Wrocław 2008.
[8] Namysłowska-Wilczyńska B.: 3D geostatistical modelling of parameters of Rio Blanco porphyritic cop-
per deposit in Peru. Proceedings - Primer Seminario Internacional de Geologia para la Industria Minera,
Editors: Irene Aracena, Carmen Holmgren & Romke Kuyvenhoven, GEOMIN 2009, GECAMIN, 10 – 12
June 2009, Antofagasta, Chile, CAPITULO 05, Geoestadistica, 2009, pp. 301 – 325.
[9] Namysłowska-Wilczyńska B., Skorupska B., Wieniewski A., Application of geostatistical methods to de-
scribe variation in technological parameters of ash-slags. PROCEEDINGS OF LINNAEUS ECO-TECH
'10 22 - 24 November, 2010 KALMAR, SWEDEN, Edited by: Fabio Kaczala, Sandrine Arzur, Ida
Tjader, William Hogland, pp. 607 – 618; 7 th International Conference on Natural Sciences and Tech-
nologies for Waste and Wastewater Treatment, Remediation, Emissions Related to Climate, Environ-
1
mental and Economic Effects - ECO-TECH’ 10, University w Kalmar; Session Waste to Energy,
23.11.2010. Book of Abstracts, p. 147.
[10] Namysłowska-Wilczyńska B., Skorupska B., Wieniewski A., Analiza przestrzenna wzbogacalności
popiołożużli z wykorzystaniem metod geostatystycznych. Górnictwo i Geoinżynieria Rok 35 Zeszyt 2
2011, ss. 451 – 470.
[11] Namysłowska - Wilczyńska B., Wilczyński A.: 3D electrical power demand forecasting as tool for plan-
ning electrical power firm’s activity by means of geostatistical methods. Zeszyt Prac Naukowych
Uniwersytetu Ekonomicznego (UE), No. 91, ‘Ekonometria 28. Forecasting”, Wrocław 2010.
[12] Wackernagel H.: Multivariate Geostatistics, An Introduction with Applications. 2 nd edition, Springer –
Verlag Berlin, Heidelberg, New York 1998.
[13] Wieniewski A, Skorupska B. i inni: Opracowanie technologii utylizacji popiołożuzli ze składowisk
poprzez wydzielenie węgla metodą flotacji pianowej; Projekt Inicjatywa Technologiczna I, Sprawozdanie
IMN 6656/1-12/09, Gliwice 2009.
[14] Wieniewski A. , Skorupska B., Mazurek D.: Technologia utylizacji popiołożuzli ze składowisk poprzez
wydzielenie węgla metodą flotacji pianowej. XVII Międzynarodowa Konferencja „Popioły w
energetyce”, Zakopane 2009.