Electrochemically Active Nitrogen-Enriched Nanocarbons with Well-Defined Morphology Synthesized by...
12
Electrochemically Active Nitrogen-Enriched Nanocarbons with Well- Defined Morphology Synthesized by Pyrolysis of Self-Assembled Block Copolymer Mingjiang Zhong, ‡,† Eun Kyung Kim, △,†,‡ John P. McGann, † Sang-Eun Chun, § Jay F. Whitacre, §,∥ Mietek Jaroniec, # Krzysztof Matyjaszewski, † and Tomasz Kowalewski* ,† † Department of Chemistry, Carnegie Mellon University, 4400 Fifth Avenue, Pittsburgh, Pennsylvania 15213, United States § Department of Material Science and Engineering, Carnegie Mellon University, 5000 Forbes Avenue, Pittsburgh, Pennsylvania 15213, United States ∥ Department of Engineering and Public Policy, Carnegie Mellon University, 5000 Forbes Avenue, Pittsburgh, Pennsylvania 15213, United States # Department of Chemistry, Kent State University, Kent, Ohio 44242, United States * S Supporting Information ABSTRACT: Novel nanoporous nitrogen-enriched carbon materials were prepared through a simple carbonization procedure of well-defined block copolymer precursors containing the source of carbon, i.e., polyacrylonitrile (PAN), and a sacri ficial block, i.e., poly(n-butyl acrylate) (PBA). The preparation of nitrogen-enriched nanocarbons with hierarchical pore structure was enabled by the high fidelity preservation of the initial phase-separated nanostructure between two polymer blocks upon carbonization. Supercapacitors fabricated from the prepared carbons exhibited unusually high capacitance per unit surface area (>30 μF/cm 2 ) which was attributed to the pseudocapacitance resulting from the high nitrogen content originating from the PAN precursor. Electrochemical availability of the nitrogen species was also evident from the results of oxygen reduction experiments. The hierarchical pore structure and the high nitrogen content in such materials make them particularly promising for use in supercapacitor and electrocatalyst applications. ■ INTRODUCTION Over the past few decades, significant effort has been devoted to the development of new nanostructured materials with novel physical, chemical, and biological properties. 1 Carbon materials have occupied a special place in these developments due to the discovery and synthesis of new nanostructured carbon allotropes, such as fullerenes, nanotubes, and more recently graphene. 2 Another widely studied class of nanostructured carbons includes nanoporous carbons, which have a wide utility in a number of applications including filters, catalysts, and energy storage/conversion devices such as hydrogen reservoirs for fuel cells and supercapacitor or lithium-ion battery electrodes. 3 In conjunction with the emergence of these new forms of nanostructured carbons there has been a resurgence of interest in the introduction of heteroatoms into carbon frameworks, primarily with the goal of introducing new functionalities to modify properties. The introduction of nitrogen has been particularly widely pursued in this regard, 4 with motivation ranging from modification of electronic properties, 5 artificial photosynthesis in water splitting 6 and CO 2 activation, 7 achieving electrocatalytic activity for oxygen reduction reaction (ORR), 3c,8 CO 2 capture, 9 or improvement of electrode performance in supercapacitors. 10 In the latter two instances, it is clear that such purposefully introduced heteroatoms need to be highly accessible to the “outside world”, i.e. they need to be well presented on the external or internal (for porous systems) accessible surface of the material. Herein we demonstrate a convenient generic synthetic pathway for preparation of such nitrogen-enriched nanoporous carbons which assures simultaneous control of nanoporosity and electrochemical accessibility of the nitrogen heteroatoms. This approach is predominately based on our earlier work on the design of carbon nanostructures through the use of well- defined block copolymers containing polyacrylonitrile (PAN) as a precursor for nitrogen-enriched carbon and a sacrificial block, i.e., poly(n-butyl acrylate) (PBA), serving as a source of mesoporosity. 11 Two promising aspects of such copolymer- templated nitrogen-enriched porous carbons (CTNC) include the potential to tune the morphology and porosity by varying the lengths and ratios of PAN and PBA blocks, and the straightforward mechanism for the incorporation of nitrogen atoms into a carbon framework. At first glance, copolymer templating appears to have a major (and potentially fatal) weakness, given concerns that the nanostructure resulting from Received: May 4, 2012 Published: August 15, 2012 Article pubs.acs.org/JACS © 2012 American Chemical Society 14846 dx.doi.org/10.1021/ja304352n | J. Am. Chem. Soc. 2012, 134, 14846−14857
Transcript of Electrochemically Active Nitrogen-Enriched Nanocarbons with Well-Defined Morphology Synthesized by...

Electrochemically Active Nitrogen-Enriched Nanocarbons with Well-Defined Morphology Synthesized by Pyrolysis of Self-AssembledBlock CopolymerMingjiang Zhong,‡,† Eun Kyung Kim,△,†,‡ John P. McGann,† Sang-Eun Chun,§ Jay F. Whitacre,§,∥
Mietek Jaroniec,# Krzysztof Matyjaszewski,† and Tomasz Kowalewski*,†
†Department of Chemistry, Carnegie Mellon University, 4400 Fifth Avenue, Pittsburgh, Pennsylvania 15213, United States§Department of Material Science and Engineering, Carnegie Mellon University, 5000 Forbes Avenue, Pittsburgh, Pennsylvania 15213,United States∥Department of Engineering and Public Policy, Carnegie Mellon University, 5000 Forbes Avenue, Pittsburgh, Pennsylvania 15213,United States#Department of Chemistry, Kent State University, Kent, Ohio 44242, United States
*S Supporting Information
ABSTRACT: Novel nanoporous nitrogen-enriched carbonmaterials were prepared through a simple carbonizationprocedure of well-defined block copolymer precursors containingthe source of carbon, i.e., polyacrylonitrile (PAN), and asacrificial block, i.e., poly(n-butyl acrylate) (PBA). Thepreparation of nitrogen-enriched nanocarbons with hierarchicalpore structure was enabled by the high fidelity preservation of the initial phase-separated nanostructure between two polymerblocks upon carbonization. Supercapacitors fabricated from the prepared carbons exhibited unusually high capacitance per unitsurface area (>30 μF/cm2) which was attributed to the pseudocapacitance resulting from the high nitrogen content originatingfrom the PAN precursor. Electrochemical availability of the nitrogen species was also evident from the results of oxygenreduction experiments. The hierarchical pore structure and the high nitrogen content in such materials make them particularlypromising for use in supercapacitor and electrocatalyst applications.
■ INTRODUCTION
Over the past few decades, significant effort has been devotedto the development of new nanostructured materials with novelphysical, chemical, and biological properties.1 Carbon materialshave occupied a special place in these developments due to thediscovery and synthesis of new nanostructured carbonallotropes, such as fullerenes, nanotubes, and more recentlygraphene.2 Another widely studied class of nanostructuredcarbons includes nanoporous carbons, which have a wide utilityin a number of applications including filters, catalysts, andenergy storage/conversion devices such as hydrogen reservoirsfor fuel cells and supercapacitor or lithium-ion batteryelectrodes.3
In conjunction with the emergence of these new forms ofnanostructured carbons there has been a resurgence of interestin the introduction of heteroatoms into carbon frameworks,primarily with the goal of introducing new functionalities tomodify properties. The introduction of nitrogen has beenparticularly widely pursued in this regard,4 with motivationranging from modification of electronic properties,5 artificialphotosynthesis in water splitting6 and CO2 activation,7
achieving electrocatalytic activity for oxygen reduction reaction(ORR),3c,8 CO2 capture,9 or improvement of electrodeperformance in supercapacitors.10 In the latter two instances,
it is clear that such purposefully introduced heteroatoms needto be highly accessible to the “outside world”, i.e. they need tobe well presented on the external or internal (for poroussystems) accessible surface of the material.Herein we demonstrate a convenient generic synthetic
pathway for preparation of such nitrogen-enriched nanoporouscarbons which assures simultaneous control of nanoporosityand electrochemical accessibility of the nitrogen heteroatoms.This approach is predominately based on our earlier work onthe design of carbon nanostructures through the use of well-defined block copolymers containing polyacrylonitrile (PAN)as a precursor for nitrogen-enriched carbon and a sacrificialblock, i.e., poly(n-butyl acrylate) (PBA), serving as a source ofmesoporosity.11 Two promising aspects of such copolymer-templated nitrogen-enriched porous carbons (CTNC) includethe potential to tune the morphology and porosity by varyingthe lengths and ratios of PAN and PBA blocks, and thestraightforward mechanism for the incorporation of nitrogenatoms into a carbon framework. At first glance, copolymertemplating appears to have a major (and potentially fatal)weakness, given concerns that the nanostructure resulting from
Received: May 4, 2012Published: August 15, 2012
Article
pubs.acs.org/JACS
© 2012 American Chemical Society 14846 dx.doi.org/10.1021/ja304352n | J. Am. Chem. Soc. 2012, 134, 14846−14857

phase separation between the blocks may not survive after hightemperature treatment necessary for carbonization. However,we previously demonstrated that this difficulty may beovercome through the use of a thermal stabilization step,11a
comprising heating the copolymer in the presence of air, whicheffectively fixes the nanostructure through cross-linkingreactions accompanied by partial dehydrogenation andcyclization of PAN (Scheme 1, and Scheme S1 in SupportingInformation).12 The retention of a high level of fidelity in thepreservation of the nanostructure upon conversion fromcopolymer to carbon was particularly evident in ultrathinfilms with long-range ordered lamellar structures,11b,13 althoughone should keep in mind that templating fidelity could havebeen facilitated by the presence of film substrate, preventingcollapse of the nanostructure. Applicability of copolymertemplating to bulk materials would require similar preservationof the nanostructure in the bulk, under conditions when thestarting material is a block copolymer in a highly dispersedpowder form. While this appears more challenging, wedemonstrate below that it can be accomplished through thechoice of the copolymer with PAN content high enough to leadto the formation of a continuous carbon framework, notsusceptible to collapse upon pyrolysis.After the high fidelity of nanostructure templating was
established, the next focus of the research was the nitrogendoping aspect, establishing the chemical identity of nitrogenatoms incorporated into the carbon framework, and demon-strating their electrochemical availability, which is shown toenhance the performance of supercapacitors with electrodesfabricated from CTNCs. Additional evidence of electrochemicalactivity of nitrogen dopants comes from experiments in whichCTNCs exhibit capability to electrochemically catalyze ORR.
■ EXPERIMENTAL SECTIONMaterials. Acrylonitrile (AN), n-butyl acrylate (BA), methyl 2-
bromopropionate (MBP), N,N,N′,N″,N″-pentamethyldiethylenetri-
amine (PMDETA), 2,2′-bipyridyl (bpy), CuBr, CuCl, CuBr2, anisole,dimethylformamide (DMF), dimethyl sulfoxide (DMSO), tetrahy-drofuran (THF), N-methyl-2-pyrrolidone (NMP), ethanol, methanol,and Nafion117 solution (5 wt %) were all obtained from Sigma-Aldrich. CuCl and CuBr were purified by stirring in glacial acetic acidfollowed by washing with ether and dried overnight under vacuum.Monomers were passed through a basic alumina column prior to use.All other chemicals were used as received.
Preparation of PBA Macroinitiator. Thirty milliliters of BA(2.10 × 10⁻¹ mol), 2.24 × 10⁻¹ mL of PMDETA (1.07 × 10⁻³ mol),1.99 × 10−1 mL of MBP (1.79 × 10⁻³ mol), 2.0 mg of CuBr2 (9 ×10⁻³ mmol), and 15 mL of anisole were mixed in a 50 mL Schlenkflask equipped with a magnetic stirring bar. The flask was subjected tofive freeze−pump−thaw (FPT) cycles. Then, 1.28 × 10⁻¹ g of CuBr(8.93 × 10⁻⁴ mol) was added to the flask while the contents were at asolid state and deoxygenated by vacuum followed by backfilling withnitrogen three times. The flask was placed in an oil bath set at 70 °Cfor 5.5 h. The reaction was terminated by the addition of aerated THFand passing through a column of alumina to remove the catalystfollowed by evaporation. The solid products were dried in a vacuumoven.
Preparation of PBA-b-PAN Copolymers. A 1.11 g amount ofthe above PBA macroinitiator (1.23 × 10⁻⁴ mol; Mn (GPC) = 9000and Mw/Mn = 1.10), 2.57 mL of AN (3.96 × 10⁻² mol), and 4.0 mL ofDMSO were mixed in a 10 mL Schlenk flask equipped with a magneticstirring bar. The flask was subjected to five FPT cycles. Then, 1.22 ×10⁻² g of CuCl (1.23 × 10⁻⁴ mol) and 3.85 × 10⁻² g of bpy (2.46 ×10⁻⁴ mol) were added to the flask, as above, and purged by backfillingwith nitrogen. The flask was then placed in an oil bath set at 65 °C for7 h. At the end of this time, the reaction mixture was dissolved inDMF, and the polymer was precipitated by adding the solution to 50%aqueous methanol. The solid product was dried under vacuum.
Preparation of CTNC. The polymer sample was stabilized at 280°C for 2 h under air flow (150 mL/min) with a heating rate of 20 °C/min, purged with nitrogen gas for 1 h during cooling, and thenpyrolyzed at 700 °C for 0.5 h under nitrogen gas flow (150 mL/min)with a heating rate of 10 °C/min.
CO2 Activation of CTNC. The nanoporous carbon sample washeated at a rate of 20 °C/min under nitrogen gas flow (150 mL/min)
Scheme 1. Preparation of CTNC
Journal of the American Chemical Society Article
dx.doi.org/10.1021/ja304352n | J. Am. Chem. Soc. 2012, 134, 14846−1485714847

to 900 °C and kept at that temperature under CO2 flow (150 mL/min) for 1 h. Then, the sample was cooled under nitrogen gas flow.KOH Activation of CTNC. Deionized water was added to the
mixture of KOH and carbon at a mass ratio of 4/1 and stirred for 30min. The slurry was dried at 110 °C for 12 h, heated to 800 °C with arate of 5 °C/min, and maintained at that temperature for 2 h under Arflow. The resultant activated carbon was rinsed with 0.5 M HCl andrepeatedly washed with hot deionized water. The final activated carbonwas dried under vacuum at 90 °C for 2 days.Characterization of CTNC. The mass change during the
carbonization was monitored by thermogravimetric analysis (TGA:SDT 2960, TA Instruments). The nanoporous morphology of CNTCwas analyzed by transmission electron microscopy (TEM: H-7100,Hitachi). Nitrogen adsorption−desorption isotherms were obtainedwith a NOVA 2000 (Quantachrome Instruments) at −196 °C. Thesample was degassed at 300 °C for 2 h before measurement. Elementalanalysis was conducted by Midwest Microlab (Indianapolis, IN) with acombustion method analyzer (CE-440, Exter Analytical Inc.) and withX-ray photoelectron spectroscopy (XPS, Kratos Axis Ultra spectrom-eter). Small angle X-ray scattering (SAXS) experiments was carried outat D1 station of Cornell High Energy Synchrotron Source (CHESS).A wide bandpass (1.7%) double-bounce multilayer monochromatorsupplied an intense beam of 10 keV photons. The SAXS scatteringintensities were recorded with an area detector (Medoptics) with aresolution of 50 μm per pixel and a total area of about 50 mm by 50mm. The scattering data was collected at a distance of 1888 mm and562 mm from the sample to the detector.Fabrication of Supercapacitor Devices. After carbonization, the
nanoporous carbon was ground with a mortar and pestle. Electrodeswere prepared by drop-casting a 50 mg/mL carbon dispersion in NMPonto a stainless steel mesh (400 mesh, Small Parts Inc.) with adiameter of 13 mm. Before the casting, the dispersion was stirred for∼20 min and sonicated ∼10 min. The solid in the dispersion consistedof 85 wt % of CTNC, 5 wt % of acetylene black as a conductiveadditive, and 10 wt % of poly(vinylidene fluoride) as a binder. Thedrop-casted samples were dried on a 70 °C hot stage for 2 h andfurther dried in a 100 °C vacuum oven overnight. The mass of thedried electrodes was in the range of 2−4 mg. Two-electrode cells usingTeflon Swagelok were built and tested. Paper filters were used asseparators.Electrochemical Characterization. The electrochemical proper-
ties were determined using a multichannel potentiostat/galvanostat(VMP, Biologic) in 1 M aqueous H2SO4 and 6 M aqueous KOHelectrolyte. The cyclic voltammetry (CV) curves were obtained atvarious scan rates from 1 to 100 mV/s in the range of 0 to 1 V.Galvanostatic charge−discharge (CD) curves were obtained at variouscurrent densities from 0.1 A/g to 10 A/g. The mass-normalizedcapacitance of a single electrode (Cg) was calculated from thegalvanostatic discharging curve according to, 1/C = 1/CA + 1/CB = 1/(CgmA) + 1/(CgmB) = 1/Cg(1/mA + 1/mB), thus
=Δ Δ
+⎛⎝⎜
⎞⎠⎟C
IV t t m m( )/
1 1g
A B (1)
where mA and mB are the active carbon masses of the two electrodes,and I, ΔV(t), and Δt are the loading current, full discharging voltagewindow (1 V) including all IR drop regions, and discharging time,respectively. The current density was defined as I × (1/mA + 1/mB).Electrochemical impedance spectroscopy (EIS) measurements wereperformed in the frequency range of 105 Hz to 10−3 Hz at the opencircuit potential with an AC perturbation of 5 mV.ORR Characterization. A glassy carbon (GC) electrode (3 mm,
from Gamry) was carefully polished with 3 μm, 1 μm, and 0.25 μmdiamond successively to obtain a mirror-like surface. Then theelectrode was washed with double-distilled water and acetone andfinally dried in air. One milligram of carbon was dissolved in 1 mL ofsolvent mixture of Nafion (5%) and ethanol (v/v = 1/9) by sonication.Twenty microliters of the solution was dropcasted on the GCelectrode surface and dried in air. All of the voltammograms wererecorded at 25 °C with a Gamry Reference 600 potentiostat.
Measurements were carried out at a scan rate of 10 mV/s or 100mV/s using the as-prepared GC working electrode and a platinum diskcounter electrode in N2-saturated or O2-saturated 0.1 M KOHaqueous solution. Potentials were recorded versus a saturated calomelelectrode (SCE) reference electrode.
■ RESULTS AND DISCUSSIONFidelity of Nanostructure Templating in CTNC.
Preparation of CNTCs from phase-separated block copolymerscontaining a carbon source (PAN) and sacrificial block (PBA)is illustrated in Scheme 1. The copolymers were synthesizedusing methods assuring a high level of control over the blocklength and composition in order to maintain control ofnanoscale morphology arising from phase separation betweenthe blocks. In the current study this was achieved through theuse of atom transfer radical polymerization (ATRP).14 Severalblock copolymers with different block ratios were prepared andtested, but herein we focus on the system with the nanoscalephase-separated morphology which provided the best preser-vation of nanostructure after pyrolysis: PBA-b-PAN diblockcopolymer with the average composition (BA)70-(AN)99 andmolecular weight distribution Mw/Mn = 1.25, where Mw andMnare, respectively, the weight and number average molecularweights. The as-obtained polymer in the form of a precipitatedpowder was heated at 20 °C/min to 280 °C, held at thattemperature for 2 h under air flow, undergoing a process ofstabilization, prior to pyrolysis at 700 °C for 30 min under flowof nitrogen gas.The weight loss associated with this thermal treatment was
studied by TGA (Figure 1), which revealed the presence of
three distinct stages: (1) stabilization of PAN, which wasaccompanied by ∼10% weight loss due to partial dehydrogen-ation and cross-linking; (2) decomposition of PBA with a totalweight loss of ∼50% between 350 and 410 °C; (3)carbonization of PAN with further dehydrogenation and partialdenitrogenation.The XRD pattern of such prepared CTNC revealed the
presence of broad Bragg peaks indicative of the presence ofnanographitic structures commonly observed in pyrolyticcarbons (Figure 2).15 A crude estimate of the lateral size ofpartially graphitic domains based on the width of the (100)
Figure 1. TGA and differential thermogravimetry (DTG) showingweight changes during thermal stabilization and pyrolysis of PAN-b-PBA copolymer. The thermal stabilization step involved heating thecopolymer in air at 20 °C/min to 280 °C and holding at thistemperature and atmosphere for 2 h (vertical drop in weight). Weightloss at temperatures above 280 °C occurred during the pyrolysis stepwhich involved heating the stabilized sample at 10 °C/min undernitrogen flow to 700 °C and holding it there for 0.5 h.
Journal of the American Chemical Society Article
dx.doi.org/10.1021/ja304352n | J. Am. Chem. Soc. 2012, 134, 14846−1485714848

peak indicated that they did not exceed 2−3 nm. Likewise,based on the width of the (002) peak, nanographitic domainswere composed of no more than two to three π-stackednanographene sheets.The evolution of the nanoscale phase-separated morphology
from PBA-b-PAN block copolymer precursor to carbon wascharacterized by transmission SAXS and is presented in Figure3a and 3b, in the form of overlaid double logarithmic plots ofazimuthally averaged, invariant normalized scattering patterns.In Figure 3a the scattering patterns were shifted vertically forclarity. The scattering pattern of the as-precipitated block
copolymer powder, black line in Figure 3a, showed uniform q−4
decay for q extending up to ∼2 nm−1, most likely indicating thepresence of scale-invariant, self-similar aggregates of precipi-tated powder. It was devoid of other distinct features, pointingto the absence of well-defined nanoscale morphology. Localordering due to phase separation became evident only afterannealing at 100 °C through the appearance of a broad Braggpeak at 0.27 nm−1 (spacing ∼23 nm), which became morepronounced upon further annealing at 200 °C (magenta andred traces Figure 3a). After stabilization, the position of theBragg peak shifted downward by about 0.05 nm−1 to lower qafter stabilization (green trace in Figure 3a) only to return to itsprevious position after carbonization (blue trace in Figure 3aand Figure 3b). All these observations provide a strongindication that the overall nanoscale morphology of blockcopolymer template was retained after decomposition of thesacrificial block and carbonization of PAN. A modest shift ofthe Bragg position between stabilized and carbonized sample isnot unexpected and can be explained as a consequence of acombination of nonisotropic contraction/expansion of thePAN framework upon cross-linking followed by isotropiccontraction upon carbonization. One other interesting featureof the double logarithmic plot of the scattering patternobserved both for the stabilized and carbonized material isthe pronounced decrease of the slope in the low-q range incomparison with the copolymer precursor, down to ∼−2 forcarbonized sample in comparison with ∼−4 for a copolymer.This behavior indicates that upon carbonization, aggregates ofpolymer particles present in the powder underwent fusion togenerate more monolithic structures. Of critical importancehere is the fact that despite this fusion, the nanoscale porosityof material was fully retained, as evident from the overallpreservation of position and intensity of the Bragg peak andfrom more detailed analysis of SAXS patterns presented below.The uniform, nonfractal, nanoporous structure of CTNC was
also evident in TEM images (Figure 4). The characteristiclength of the features observed in the TEM images, inferredfrom the kink in the power spectrum of the 2-D Fouriertransform (inset in Figure 4), was in good agreement with the
Figure 2. XRD profiles of CTNC: The (002) diffraction peak centeredat a 2θ ∼ 25° corresponds to π-stacking of nanographitic platelets, andthe width of the (100) peak centered at a 2θ ∼44° can be used toassess their lateral size La.
Figure 3. SAXS characterization of nanoscale morphology. (a) SAXSprofiles of block copolymer and resulting carbon after subsequentthermal treatment stages. The curves have been shifted vertically forclarity. (b) Overlay of SAXS profiles of block copolymer withnanoscale morphology fully developed by annealing and of resultingnanocarbon. The profiles shown here were normalized by the Porodinvariant Q and overlaid without any vertical shifting.
Figure 4. TEM image of CTNC. Inset: power spectrum of the Fouriertransform of the image.
Journal of the American Chemical Society Article
dx.doi.org/10.1021/ja304352n | J. Am. Chem. Soc. 2012, 134, 14846−1485714849
position of the Bragg peak observed in SAXS patterns.Moreover, just as with the SAXS pattern, the low-q region inthe double logarithmic plot of the TEM power spectrum wasnearly flat, reflecting the absence of complex aggregation on thescale from ∼10 to 1000 nm.The most common use of SAXS in the studies of block
copolymers and other nanomaterials involves identification oftypes of three-dimensional morphologies based on the positionand intensities of Bragg peaks arising from long-rangeperiodicities. In fact, the high degree of perfection of thelong-range order in templated nanomaterials is widely soughtand equated with the high quality of the material. Importantly,its presence greatly simplifies the task of assessing the fidelity oftemplating, which can be inferred from the extent to which theSAXS patterns change upon material transformations. Fromthis perspective, our system might appear rather unremarkable,given the fact that its SAXS patterns reveal only the first order,diffuse Bragg feature. At this point it should be emphasized,however, that while long-range order may be highly aestheti-cally appealing, the key figure of merit in nanoporous materialsis their specific surface area, typically ascertained throughadsorption isotherm measurements. In copolymer templatingof the kind employed here, with porosity originating from theremoval of the sacrificial phase, the specific surface area shouldsomehow correspond to the specific interfacial area betweencopolymer phases. One well-established SAXS techniquecapable of directly characterizing the specific interfacial areain isotropic two-phase materials is so-called Porod analysis,which is based on the analysis of the characteristic decay rate ofnormalized scattering patterns.16 With proper normalization,application of this analysis to selected length scale yields thespecific interfacial area originating from the density fluctuationswithin a given length range. Thus, seemingly uninterestingSAXS patterns can still be a rich source of information aboutthe key figures of merit for high-surface systems. According tothis well-known law, for an isotropic two-phase material with asharp interface between the phases, the normalized scatteringintensity varies as
π=I qQ l q( ) 8 1
P4
(2)
where Q is a normalized factor referred to as an invariant and lPdenotes the length of inhomogeneity, defined as the geometricaverage of cord lengths cut through phases 1 and 2: 1/⟨lP⟩ = 1/⟨l1⟩ + 1/⟨l2⟩, where indices refer to phases 1 and 2 and ⟨ ⟩brackets indicate orientational and positional averaging (seeSupporting Information for details). As evident in Figure 3b,the high-q portions of invariant-normalized scattering patternsof a copolymer template and carbon nearly overlap and closelyfollow the q−4 scaling, with minor deviations for a copolymercaused by the presence of a weak higher order Bragg peak andhigh-q electron density fluctuations. The calculations of lP werecarried out from fits to eq 2 as described in SupportingInformation, over the scattering vector range qmin = 0.4 nm−1
(i.e., just above the Bragg peak) and qmax = 1.8 nm−1. The upperlimit, which corresponds to ∼3.5 nm in real space, was chosento minimize the contribution from high-q electron densityfluctuations. Such obtained lengths of inhomogeneity for acopolymer template and carbon were equal to lP,template = 7.4nm and lP,carbon = 7.6 nm, respectively, providing furtherevidence for the preservation of template morphology uponcarbonization.
Of particular usefulness in the analysis of porous materials isthe relationship between the length of inhomogeneity and theinterfacial area to volume ratio SV = (4ϕ1ϕ2)/lP, where ϕ1, ϕ2are volume fractions of phases 1 and 2 (ϕ1 + ϕ2 = 1). Thecopolymer template volume fractions of PAN and PBA werecalculated by taking the mass fractions, known from well-defined copolymer composition obtained from nuclearmagnetic resonance (NMR) spectra, and converting them tovolume fractions, assuming that the densities of PBA and PANphases were equal to the densities of respective homopolymersand yielding ultimately the interfacial area to volume ratioSV,template = 123 m2/cm3 (see Supporting Information fordetails). Volume fractions of carbon matrix and pores necessaryfor the analogous calculation for the porous carbon wereobtained using the total pore volume per gram (Vtot) calculatedfrom nitrogen adsorption analysis and the density of the carbonmatrix. It is remarkable that the value obtained for theinterfacial area to volume ratio SV,carbon = 131 m2/cm3 was closeto the value obtained for the copolymer template, providingfurther indication of the high fidelity retention of thenanostructure throughout the templating process.Direct information about the porosity of CTNC was
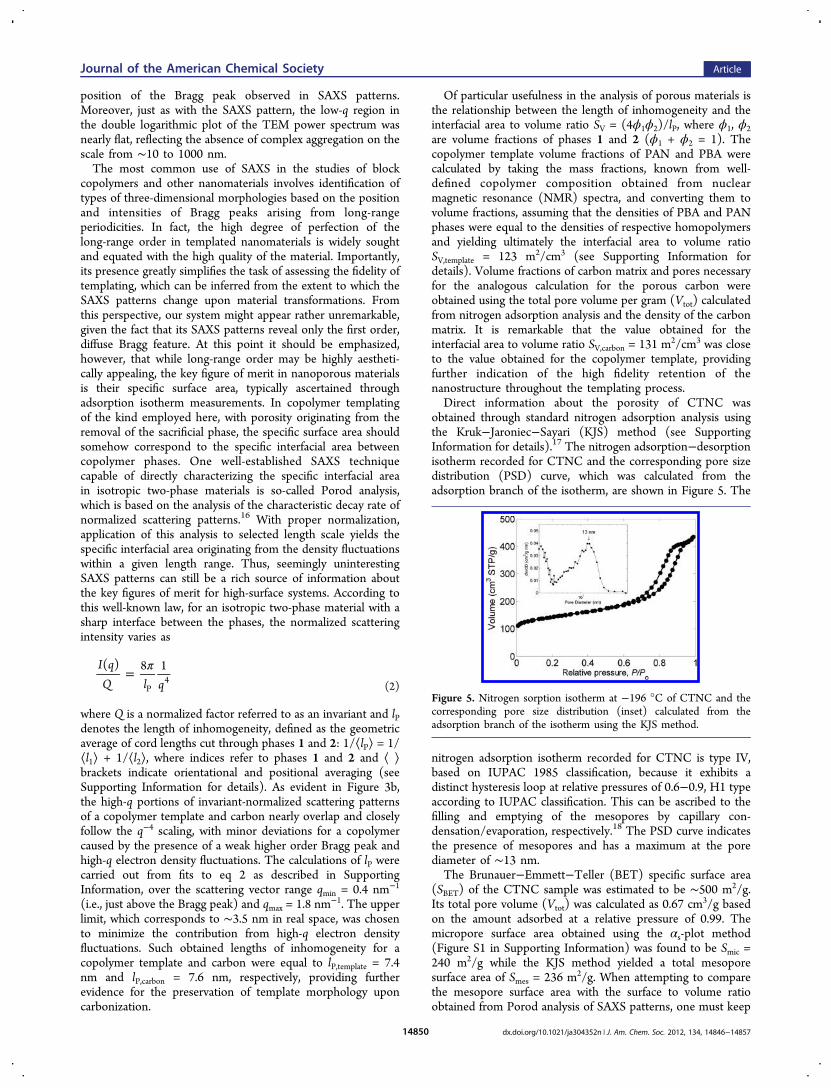
obtained through standard nitrogen adsorption analysis usingthe Kruk−Jaroniec−Sayari (KJS) method (see SupportingInformation for details).17 The nitrogen adsorption−desorptionisotherm recorded for CTNC and the corresponding pore sizedistribution (PSD) curve, which was calculated from theadsorption branch of the isotherm, are shown in Figure 5. The
nitrogen adsorption isotherm recorded for CTNC is type IV,based on IUPAC 1985 classification, because it exhibits adistinct hysteresis loop at relative pressures of 0.6−0.9, H1 typeaccording to IUPAC classification. This can be ascribed to thefilling and emptying of the mesopores by capillary con-densation/evaporation, respectively.18 The PSD curve indicatesthe presence of mesopores and has a maximum at the porediameter of ∼13 nm.The Brunauer−Emmett−Teller (BET) specific surface area
(SBET) of the CTNC sample was estimated to be ∼500 m2/g.Its total pore volume (Vtot) was calculated as 0.67 cm3/g basedon the amount adsorbed at a relative pressure of 0.99. Themicropore surface area obtained using the αs-plot method(Figure S1 in Supporting Information) was found to be Smic =240 m2/g while the KJS method yielded a total mesoporesurface area of Smes = 236 m2/g. When attempting to comparethe mesopore surface area with the surface to volume ratioobtained from Porod analysis of SAXS patterns, one must keep
Figure 5. Nitrogen sorption isotherm at −196 °C of CTNC and thecorresponding pore size distribution (inset) calculated from theadsorption branch of the isotherm using the KJS method.
Journal of the American Chemical Society Article
dx.doi.org/10.1021/ja304352n | J. Am. Chem. Soc. 2012, 134, 14846−1485714850

in mind that the latter was restricted to the real space size rangedown to 3.5 nm. Integration of the pore size distributionobtained from nitrogen adsorption analysis using the samelower limit gives a value of 180 m2/g, which after conversion tothe surface per volume ratio, SV (see Supporting Information),translates to 147 m2/cm3. The latter value is in good agreementwith the interface to volume ratio obtained from SAXS analysis(SV,carbon = 131 m2/cm3), providing further evidence that themesopores were the direct result of copolymer templating.Moreover, such agreement provides a strong indication of goodaccessibility for all mesopores. In addition to templatedmesopores, in similarity with other templated porous carbons,CTNC contained a considerable amount of micropores, whichare usually traced to structural imperfections of the carbonprecursor and partial local destruction of the evolvingcarbonizing matrix.These results demonstrate remarkable resistance of phase-
separated (BA)70-(AN)99 copolymer against structural collapseduring pyrolysis to form the carbon framework and can serve asa proof of concept for a one-step, single-component templatingof porous carbons using block copolymers with carefully chosencomposition.Identifying Nitrogen Atoms Incorporated into the
Carbon Framework. Elemental analysis (combustion meth-od), shown in Table 1, revealed a high nitrogen content inCTNC pyrolyzed at 700 °C, with N/C atomic ratio equal to0.18, indicating that at least 50% of nitrogen atoms originallypresent in the PAN precursor remained incorporated within thecarbon framework. The fine structure of the N 1s peak in XPS(Figure 6a) points to the presence of three major species ofnitrogen differentiated by their binding energies (BE): (i)pyridinic (N−P, BE ≈ 398.5 eV), (ii) mixture of pyridonic (N−X, BE ≈ 400.6 eV) and pyrrolic (BE ≈ 400.3 eV), and (iii)pyridine oxide (N−O, BE ≈ 403−405 eV).19 The chemicalenvironments of these nitrogen atoms revealed by XPS, 35%pyridinic, 43% pyridonic + pyrrolic, and 20% pyridine oxide,appear to be consistent with their location along the outeredges of nanographitic domains, which would explain theirelectrochemical availability, as described later. It is also worthnoting that the full width at the half-maximum (fwhm) of theN−P peak observed here was almost one-half of the widthreported in literature for the pyridinic nitrogen in pyrolyticcarbons derived from PAN, ∼1.3 eV vs ∼2 eV,19 pointing to theunusual degree of uniformity in the chemical environment ofthis species in our material. Such uniformity can be interpretedas another indication of preferential location of pyridinicnitrogen atoms in CTNC on the exposed surfaces of pore walls,i.e., in the environment where they do not come into closecontact with other neighbors. It should be pointed out that ofall nitrogen species, the pyridinic ones, with the lone pairresiding on the sp2 orbital which is not a part of the aromaticsystem, can be expected to be most electrochemically active.20
A relatively low fraction (2%) of quaternary nitrogen species(N−Q, BE = 401.4 eV) was also observed. On the basis of thecarbonization mechanism of PAN, this fraction can be ascribedto graphitic nitrogens in CTNC.Structural and Chemical Changes of CNTC Caused by
Activation Treatment. Pyrolytic carbons are commonlysubjected to an “activation” treatment, which typically involveshigh temperatures, between 700 °C and 1000 °C, and exposureof the material to CO2, steam, or KOH and results in asignificant increase of surface area, primarily due to theformation of micropores.10b,21 In order to study the impact of
this kind of a treatment on the nanostructure and chemicalcomposition of nitrogen-enriched carbons with well-definednanostructure such as CTNC described in the present study,material previously carbonized for 30 min at 700 °C wassubjected to CO2 activation and KOH activation.As is commonly observed in other pyrolytic carbons,
activation in all cases led to marked increase of the specificsurface area of CTNC. Figure 7 shows nitrogen adsorption−desorption isotherms and the corresponding PSDs of CTNC,CO2-activated CTNC (CO2-A), and KOH-activated CTNC(KOH-A). The impact of processing conditions on the otherphysicochemical properties of materials is summarized in Table1 and Table S1. Both activation methods resulted in significantincreases of the specific surface area, more than 2-fold to SBET =1140 m2/g for CO2-A and 5-fold to SBET = 2570 m2/g, forKOH-A. A comparison of PSDs of activated materials withuntreated CTNC, Figure 7b, indicates that CO2 activation leftthe fraction of mesopores previously attributed to copolymer
Table 1. Physicochemical Properties and SpecificCapacitance Values of CTNC, CO2-Activated CTNC (CO2-A), and KOH-Activated CTNC (KOH-A)
CTNC CO2-A KOH-A
surface area, SBET (m2/g) 500 1140 2570
Chemical Compositiona
elemental analysis
H/C (%) 20.1 7.4 9.9
O/C (%) 3.6 4.7 5.7
N/C (%) 18.0 4.8 0.9
XPS
O/C (%) 7.3 ± 0.4 5.4 ± 0.4 8.3 ± 0.4
N/C (%) 13.5 ±0.8
4.1 ± 0.5 1.4 ± 0.5
N−PBE (eV) 398.5 398.5
N−P/C (%) 4.8 0.5
fwhm 1.3 1.0
N−XBE (eV) 400.6 400.6 400.6
N−X/C (%) 5.8 1.9 1.0
fwhm 2.2 3.8 2.6
N−QBE (eV) 401.3 401.4
N−Q/C (%) 0.2 0.7
fwhm 1.3 1.1
N−OBE (eV) 403.5 403.5 404.6
N−O/C (%) 2.7 1.1 0.4
fwhm 6.2 5.8 5.1
Crystallinity
La (nm) 1.9 ± 0.3 4.3 ± 0.5 2.8 ± 0.2
Capacitance
1 M H2SO4
Cg (F/g) 166 ± 5 164 ± 4 176 ± 9
Csa (μF/cm2) 33.2 14.3 6.8
6 M KOH
Cg (F/g) 124 ± 3 151 ± 9 173 ± 7
Csa (μF/cm2) 24.8 13.2 6.7
aPercent of atomic ratio.
Journal of the American Chemical Society Article
dx.doi.org/10.1021/ja304352n | J. Am. Chem. Soc. 2012, 134, 14846−1485714851

templating almost intact. For KOH activation, however, theshape of PSD changed dramatically, with small pores, about 3nm in dimension, becoming the dominant feature.Preservation of the mesoporous structure in CO2-activated
material and its collapse upon KOH activation was also evidentin the SAXS patterns (Figure S2 in Supporting Information). Inaddition, KOH activation also had a very pronounced effect onwide angle XRD patterns, Figure 8, causing the (002), π-stacking peak to broaden beyond recognition. At the same time,the basal (100) peak remained relatively unchanged, indicatingthat KOH virtually exfoliated the nanographitic π-stacks. Asimilar mechanism for KOH activation has been described byother authors for conventional activated carbons.22 Thisdecrease in π-stacking order with preservation of the basalpeak was also evident in the CO2-activated system but was notnearly as prominent as with KOH activation. Additionally,analysis of basal plane crystallite sizes (La) calculated from thewidth of (100) peak XRD patterns using the Scherrerequation23 provided evidence of ring fusion of nanographiticdomains during the activation treatment. Specifically, the valueof La changed from 1.9 nm in the pristine CTNC to 4.3 nmafter CO2 activation and to 2.8 nm after KOH treatment, Table1. The more pronounced increase of La after CO2 activationcan be attributed to the higher temperature used in this processin comparison with KOH activation, 900 °C vs 800 °C.The most noticeable chemical effect of activation was the
sharp drop in nitrogen content: 4-fold for CO2 activation and∼20-fold for KOH process, Table 1. This drop could bepartially attributed to a temperature treatment higher than thatused for normal pyrolysis conditions, i.e., 900 °C for CO2
activation and 800 °C for KOH activation vs 700 °C for normalpyrolysis. Activation also had a pronounced and partially
selective effect on the chemical nature of the remainingnitrogen species. For example, following CO2 activation, thepyridinic nitrogen atoms (N−P) exhibited a 10-fold decreasewhile the concentration of pyridonic + pyrrolic (N−X) andpyridine oxide (N−O) groups only decreased by a factor of 3,Table 1 and Figure 6a,b. Another marked effect of CO2
activation was the emergence of quaternary nitrogen peak(N−Q) as a dominant feature (Figure 6b). The latter effectappears to indicate that one of the side effects of CO2 activationwas fusion of nanographitic domains in which edge nitrogenatoms became entrapped within a carbon lattice, in agreementwith the currently accepted mechanism of PAN pyrolysis,Figure S3 in Supporting Information,19 and the increased basalplane crystallite size (La) after activation in XRD, Figure 8.Remarkably, no pyridinic or quartenary nitrogen atoms werediscernible in the XPS spectra of KOH-activated material,Figure 6c and Table 1, which showed only trace amounts ofN−X and N−O species. Such behavior points to a highlydestructive effect from KOH treatment on the carbonframework, which, as discussed above, was also evident inXRD patterns, Figure 8.
CTNC and Activated CTNCs as Electrode Materials forSupercapacitors. One of the purposes of experiments withCTNCs as electrode materials for supercapacitors was toestablish if their high nitrogen content offers any electro-chemical advantage, such as giving rise to Faradaic processes(pseudocapacitance),10 which could enhance the energy storagecapabilities.In supercapacitors, porous carbons serve as high surface area
electrodes, capable of storing energy in electrical double layers(EDLs) when placed in contact with an electrolyte. The highsurface area of porous electrodes boosts the overall stored
Figure 6. N 1s peaks in XPS of pristine and activated CTNCs: (a) pristine CTNC; (b) CO2-activated CTNC (CO2-A); (c) KOH-activated CTNC(KOH-A).
Journal of the American Chemical Society Article
dx.doi.org/10.1021/ja304352n | J. Am. Chem. Soc. 2012, 134, 14846−1485714852

energy density, while the EDL charge storage mechanismassures a high power density. Supercapacitors are particularlypromising in such applications as hybrid electric vehicles, digitalcommunication devices, and backup energy storage.24 How-ever, the energy storage density of supercapacitors is stillinferior in comparison with batteries. A common approach toovercoming this limitation is through the introduction of anadditional charge storage mechanism, i.e. pseudocapacitance,involving fast and reversible redox reactions. One of the widelyused ways to accomplish this is through the incorporation of
electrochemically active phases such as metal oxides andconducting polymers.25 Another particularly promising ap-proach, related to work described herein, involves covalentincorporation of heteroatoms such as nitrogen or oxygen withinthe carbon framework.10b,c,26
To date, most of the applications and studies using carbonsfor supercapacitors have focused on activated carbons, whichcan be easily produced from a wide range of natural precursorsand, following activation, can exhibit surface areas in excess of2000 m2/g.10a While the performance of supercapacitors ismost directly affected by the total surface area, the porestructure and the shape of PSD are other key features that needto be optimized. The presence of mesopores, 2−50 nm indiameter, is desirable because they can ensure efficientpropagation of ions throughout the bulk of the electrodematerial, whereas micropores, less than 2 nm in diameter, havean optimum pore size for the formation of EDLs.10a,c,27 Tosome extent, this limits the suitability of activated carbons assupercapacitor electrode materials, because conventionalactivation methods do not ensure the desirable control ofpore structure and PSD. This limitation has sparked researchinto new nanoporous carbon materials as electrodes, includingcarbon aerogels,28 carbide-derived carbons,3b,29 carbon nano-tubes (CNTs),30 graphenes,1d,3d,31 and templated orderedmesoporous carbons (OMCs) from silica templates.32
Performance of CTNC materials synthesized in this study assupercapacitor electrodes was evaluated by employing two-electrode devices fabricated using common procedures, asdescribed in Supporting Information. One molar aqueousH2SO4 and 6 M aqueous KOH were tested as electrolytes.Major electrochemical measurements included cyclic voltam-metry (CV), Figure 9a, galvanostatic charge/discharge (CD),Figure 9b, and electrochemical impedance spectroscopy (EIS),Figure 9d. The CV curves (Figure 9a) and CD (Figure 9b)curves in 1 M H2SO4 have nearly rectangular and triangularshapes, respectively, indicating that the behavior approachesthat of an ideal capacitor. Even at a high scan rate of 100 mV/s,the CV curve maintained this shape with only a slight loss ofcapacitance, implying fast electrolyte movement within theelectrodes. The specific capacitance (Cg) was found to be 166F/g at 0.1 A/g and retained 77% of this value (127 F/g) at ahigh loading current density of 10 A/g of, Figure 9c. This ratecapability indicates that the interconnected micro/mesoporestructure provides an efficient pathway for electrolyte ionmovement through the carbon matrix.33 Importantly, studieddevices exhibited good cyclability, which is especially desirablein supercapacitors, by maintaining 85% of capacitance after14000 charge/discharge cycles at 2 A/g, Figure 10. In addition,the EIS results pointed to a relatively low contribution from theresistive component to the device impedance, with theequivalent series and parallel resistances equal to 0.2 Ω and0.8 Ω, respectively, Figure 9d. These low resistance values canexplain the good rate capabilities of the cell. Accordingly, Cgmeasured at low frequency (10−3 Hz) calculated from the EISdata using equation, C = −1/(2πf Z′′) where f is the frequency,was very close to the value obtained from the CD curve at 0.1A/g (164 F/g vs 166 F/g). Also, the low-frequency segment ofthe EIS spectrum was nearly vertical, indicative of purecapacitor behavior unimpeded by resistance.Altogether, the observed values of capacitance are within the
range of capacitances typically reported for carbon-basedsupercapacitors (50−200 F/g).34 What is of particular interest,however, is that they were achieved with an overall surface area
Figure 7. Pore characterization results for activated CTNCs: (a)nitrogen sorption isotherms at −196 °C for the CTNC, CO2-activatedCTNC (CO2-A), and KOH-activated CTNC (KOH-A) samples and(b) the corresponding PSDs calculated by the KJS method usingadsorption branches of the isotherms (inset: a magnified figureshowing only PSDs for the CTNC and CO2-A samples).
Figure 8. XRD profiles of CTNC, CO2-activated CTNC (CO2-A),and KOH-activated CTNC (KOH-A). The curves were shiftedvertically for a clear comparison.
Journal of the American Chemical Society Article
dx.doi.org/10.1021/ja304352n | J. Am. Chem. Soc. 2012, 134, 14846−1485714853

at least twice as low as the typical surface area of carbon-basedelectrodes (∼500 m2/g vs 1000−2000 m2/g). This difference isbest captured by comparing the surface area-normalizedcapacitances, Csa,: ∼33 μF/cm2 for CTNC vs less than 10μF/cm2 for commercial activated carbons.35 Such unusuallyhigh value of surface area-normalized capacitance in CTNCappears to confirm our expectation that the abundance ofnitrogen heteroatoms should be a source of pseudocapacitance.This assertion is further supported upon the closer inspectionof the shape of CV curves of CTNC acquired at different scanrates in 1 M H2SO4 and 6 M KOH and their comparison withthe respective curves acquired for devices with electrodescomposed of a commercial activated carbon (YP-50F, KurarayChemical Co.), Figure S4a,b and S4c,d, respectively, Support-ing Information. Specifically, CV curves recorded for CTNC in1 M H2SO4 (Figure S4a) exhibited marked deviations from thenearly rectangular shape expected for an ideal EDL capacitor
and observed for the activated carbon YP-50F. Interestingly,such deviations were not observed for CTNC in 6 M KOHelectrolyte (Figure S4b). One of the possible explanations ofsuch dependence of pseudocapacitive behavior on the type ofelectrolyte could be that it involves protonation/deprotonationof nitrogen atoms exposing the electron lone pair to solution,e.g., pyridinic species.10a It should be pointed out that innitrogen-enriched materials, the pseudocapacitance originatingfrom nitrogen is commonly ascribed to the ill-defined, broadredox features manifested as deviations of CV curves from theideal rectangular shape.10b,c,25b
The most compelling evidence of the critical importance ofnitrogen heteroatoms for supercapacitor performance camefrom the observation that even though both activation methodsmore than doubled the surface area of CTNC, they had onlyminor effect on mass-normalized capacitances (Table 1). As aresult, the capacitance per unit surface area (Csa) of CTNCexhibited a 2-fold to 5-fold decrease from its unusually highvalue of 33 μF/cm2, thereby falling into the range commonlyobserved for activated carbons.Analysis of the shapes of CV curves of CO2- and KOH-
activated CTC acquired with 1 M H2SO4 and 6 M KOHelectrolyte (Figure S4e−h in Supporting Information) showsbehavior consistent with loss of pseudocapacitance resultingfrom the loss of nitrogen atoms. It was particularly clear withKOH-activated material, for which the shape of CV curves nowbecame much closer to rectangular, Figure S4g and S4h,indicating nearly ideal EDL behavior. Deviations fromrectangular shape were still evident in CO2-activated material,especially in 1 M H2SO4 electrolyte, Figure S4e, which is notsurprising given the fact that after this activation method, thematerial still had appreciable nitrogen content (Table 1 andFigure 6b).
Figure 9. Characterization of supercapacitors built with CTNC electrodes: (a) cyclic voltammetry curves; (b) galvanostatic charge−discharge curves;(c) relationship between Cg and current density; (d) Nyquist plot using a sinusoidal signal of 5 mV over the frequency range from 105 Hz to 10−3 Hzat open circuit potential. The equivalent series resistance (ESR) corresponds to the x-intercept and a parallel resistance value is the diameter of thesemicircle in the high frequency region. Plots a, b, and d show results obtained by using 1 M H2SO4 as an electrolyte. Mass of the electrodes: 2.8/3.0mg for 1 M H2SO4, and 3.1/3.3 mg for 6 M KOH.
Figure 10. The cycling performance of the supercapacitor cellfabricated from CTNC at 2 A/g with 1 M H2SO4 electrolyte.
Journal of the American Chemical Society Article
dx.doi.org/10.1021/ja304352n | J. Am. Chem. Soc. 2012, 134, 14846−1485714854
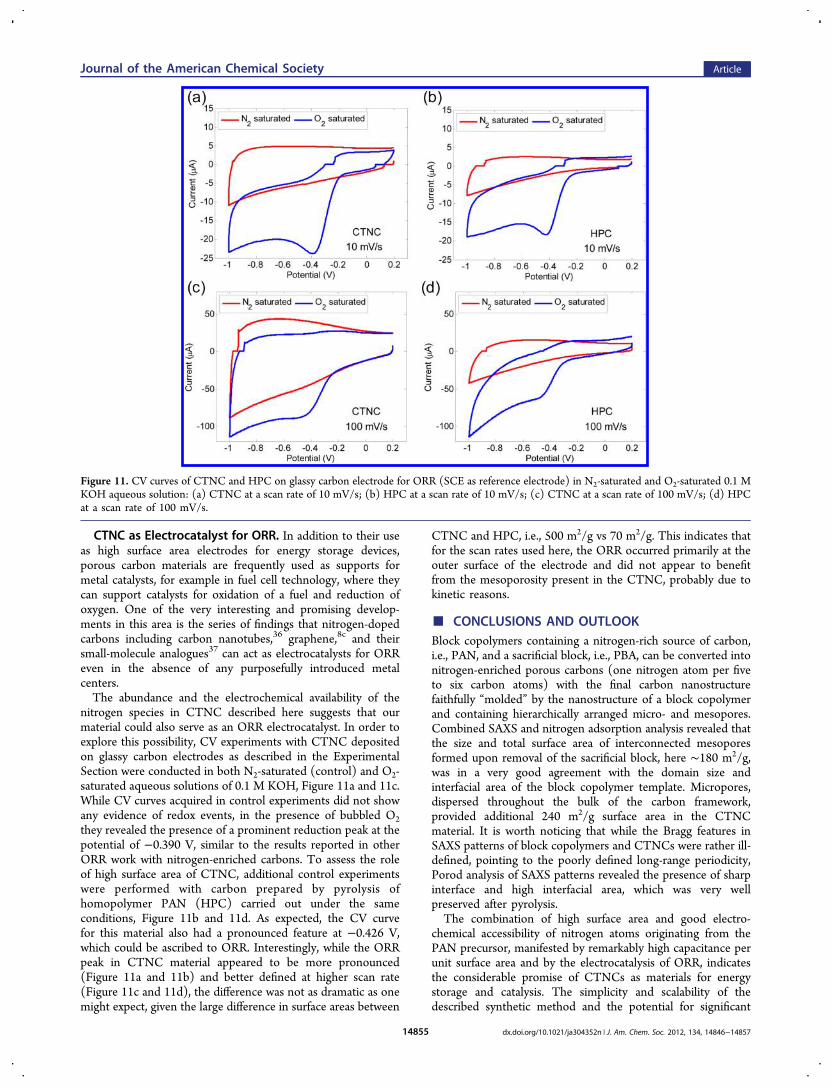
CTNC as Electrocatalyst for ORR. In addition to their useas high surface area electrodes for energy storage devices,porous carbon materials are frequently used as supports formetal catalysts, for example in fuel cell technology, where theycan support catalysts for oxidation of a fuel and reduction ofoxygen. One of the very interesting and promising develop-ments in this area is the series of findings that nitrogen-dopedcarbons including carbon nanotubes,36 graphene,8c and theirsmall-molecule analogues37 can act as electrocatalysts for ORReven in the absence of any purposefully introduced metalcenters.The abundance and the electrochemical availability of the
nitrogen species in CTNC described here suggests that ourmaterial could also serve as an ORR electrocatalyst. In order toexplore this possibility, CV experiments with CTNC depositedon glassy carbon electrodes as described in the ExperimentalSection were conducted in both N2-saturated (control) and O2-saturated aqueous solutions of 0.1 M KOH, Figure 11a and 11c.While CV curves acquired in control experiments did not showany evidence of redox events, in the presence of bubbled O2they revealed the presence of a prominent reduction peak at thepotential of −0.390 V, similar to the results reported in otherORR work with nitrogen-enriched carbons. To assess the roleof high surface area of CTNC, additional control experimentswere performed with carbon prepared by pyrolysis ofhomopolymer PAN (HPC) carried out under the sameconditions, Figure 11b and 11d. As expected, the CV curvefor this material also had a pronounced feature at −0.426 V,which could be ascribed to ORR. Interestingly, while the ORRpeak in CTNC material appeared to be more pronounced(Figure 11a and 11b) and better defined at higher scan rate(Figure 11c and 11d), the difference was not as dramatic as onemight expect, given the large difference in surface areas between
CTNC and HPC, i.e., 500 m2/g vs 70 m2/g. This indicates thatfor the scan rates used here, the ORR occurred primarily at theouter surface of the electrode and did not appear to benefitfrom the mesoporosity present in the CTNC, probably due tokinetic reasons.
■ CONCLUSIONS AND OUTLOOKBlock copolymers containing a nitrogen-rich source of carbon,i.e., PAN, and a sacrificial block, i.e., PBA, can be converted intonitrogen-enriched porous carbons (one nitrogen atom per fiveto six carbon atoms) with the final carbon nanostructurefaithfully “molded” by the nanostructure of a block copolymerand containing hierarchically arranged micro- and mesopores.Combined SAXS and nitrogen adsorption analysis revealed thatthe size and total surface area of interconnected mesoporesformed upon removal of the sacrificial block, here ∼180 m2/g,was in a very good agreement with the domain size andinterfacial area of the block copolymer template. Micropores,dispersed throughout the bulk of the carbon framework,provided additional 240 m2/g surface area in the CTNCmaterial. It is worth noticing that while the Bragg features inSAXS patterns of block copolymers and CTNCs were rather ill-defined, pointing to the poorly defined long-range periodicity,Porod analysis of SAXS patterns revealed the presence of sharpinterface and high interfacial area, which was very wellpreserved after pyrolysis.The combination of high surface area and good electro-
chemical accessibility of nitrogen atoms originating from thePAN precursor, manifested by remarkably high capacitance perunit surface area and by the electrocatalysis of ORR, indicatesthe considerable promise of CTNCs as materials for energystorage and catalysis. The simplicity and scalability of thedescribed synthetic method and the potential for significant
Figure 11. CV curves of CTNC and HPC on glassy carbon electrode for ORR (SCE as reference electrode) in N2-saturated and O2-saturated 0.1 MKOH aqueous solution: (a) CTNC at a scan rate of 10 mV/s; (b) HPC at a scan rate of 10 mV/s; (c) CTNC at a scan rate of 100 mV/s; (d) HPCat a scan rate of 100 mV/s.
Journal of the American Chemical Society Article
dx.doi.org/10.1021/ja304352n | J. Am. Chem. Soc. 2012, 134, 14846−1485714855

enhancement of already good performance of CTNCs throughstraightforward means, such as the increase of fraction ofpyridinic nitrogen sites (e.g., through the use of milderstabilization conditions) or the increase of surface area (e.g.,by decreasing the length of PAN and PBA blocks), further addto this promise. One considerable challenge associated with theproposed lower molecular weight systems may be in strikingthe balance between order−disorder transition and thermalstabilization.
■ ASSOCIATED CONTENT*S Supporting InformationDetails of experimental methods, a scheme of the PANcarbonization mechanism, αs-plot of CTNC, and SAXS profilesof the activated CTNC. This material is available free of chargevia the Internet at http://pubs.acs.org.
■ AUTHOR INFORMATIONCorresponding [email protected] Address△Battery R&D, AMD PJT, LG Chem Research Park, LGChem, 104-1, Moonji-dong, Yuseong-gu, Daejeon, 305-738,Korea.Author Contributions‡These authors contributed equally to this work.NotesThe authors declare no competing financial interest.
■ ACKNOWLEDGMENTSFinancial support was provided by the National ScienceFoundation (DMR-0304508 and DMR 09-69301), the AirForce Office of Scientific Research, and Carnegie MellonUniversity. A portion of this work was carried out at theCornell High Energy Synchrotron Source (CHESS), CornellUniversity, which is partially supported by the National ScienceFoundation (DMR-0936384).
■ REFERENCES(1) (a) Moriarty, P. Rep. Prog. Phys. 2001, 64, 297−381. (b) Wang, Z.L.; Song, J. Science 2006, 312, 242−246. (c) Cayrol, B.; Nogues, C.;Dawid, A.; Sagi, I.; Silberzan, P.; Isambert, H. J. Am. Chem. Soc. 2009,131, 17270−17276. (d) Deng, Y.; Cai, Y.; Sun, Z.; Liu, J.; Liu, C.; Wei,J.; Li, W.; Liu, C.; Wang, Y.; Zhao, D. J. Am. Chem. Soc. 2010, 132,8466−8473. (e) Endo, M.; Katsuda, Y.; Hidaka, K.; Sugiyama, H. J.Am. Chem. Soc. 2010, 132, 1592−1597. (f) Morin, S. A.; Bierman, M.J.; Tong, J.; Jin, S. Science 2010, 328, 476−480. (g) Tisdale, W. A.;Williams, K. J.; Timp, B. A.; Norris, D. J.; Aydil, E. S.; Zhu, X.-Y.Science 2010, 328, 1543−1547.(2) Pierson, H. O. Handbook of carbon, graphite, diamond, andfullerenes: properties, processing, and applications; Noyes Publications:Park Ridge, NJ., 1993.(3) (a) Lee, J.; Kim, J.; Hyeon, T. Adv. Mater. 2006, 18, 2073−2094.(b) Simon, P.; Gogotsi, Y. Nat. Mater. 2008, 7, 845−854. (c) Gong,K.; Du, F.; Xia, Z.; Durstock, M.; Dai, L. Science 2009, 323, 760−764.(d) Liu, C. G.; Yu, Z. N.; Neff, D.; Zhamu, A.; Jang, B. Z. Nano Lett.2010, 10, 4863−4868. (e) Zhu, Y.; Murali, S.; Stoller, M. D.; Ganesh,K. J.; Cai, W.; Ferreira, P. J.; Pirkle, A.; Wallace, R. M.; Cychosz, K. A.;Thommes, M.; Su, D.; Stach, E. A.; Ruoff, R. S. Science 2011, 332,1537−1541. (f) Guo, B. K.; Wang, X. Q.; Fulvio, P. F.; Chi, M. F.;Mahurin, S. M.; Sun, X. G.; Dai, S. Adv. Mater. 2011, 23, 4661−4666.(g) Wu, D.; Dong, H.; Pietrasik, J.; Kim, E. K.; Hui, C. M.; Zhong, M.;Jaroniec, M.; Kowalewski, T.; Matyjaszewski, K. Chem. Mater. 2011,23, 2024−2026. (h) Wu, D.; Hui, C. M.; Dong, H.; Pietrasik, J.; Ryu,
H. J.; Li, Z.; Zhong, M.; He, H.; Kim, E. K.; Jaroniec, M.; Kowalewski,T.; Matyjaszewski, K. Macromolecules 2011, 44, 5846−5849.(4) (a) Vinu, A.; Ariga, K.; Mori, T.; Nakanishi, T.; Hishita, S.;Golberg, D.; Bando, Y. Adv. Mater. 2005, 17, 1648−1652.(b) Groenewolt, M.; Antonietti, M. Adv. Mater. 2005, 17, 1789−1792. (c) McGann, J. P.; Zhong, M.; Kim, E. K.; Natesakhawat, S.;Jaroniec, M.; Whitacre, J. F.; Matyjaszewski, K.; Kowalewski, T.Macromol. Chem. Phys. 2012, 213, 1078−1090.(5) (a) Wang, X.; Li, X.; Zhang, L.; Yoon, Y.; Weber, P. K.; Wang,H.; Guo, J.; Dai, H. Science 2009, 324, 768−771. (b) Yan, Q.; Huang,B.; Yu, J.; Zheng, F.; Zang, J.; Wu, J.; Gu, B.-L.; Liu, F.; Duan, W. NanoLett. 2007, 7, 1469−1473.(6) Wang, X.; Maeda, K.; Thomas, A.; Takanabe, K.; Xin, G.;Carlsson, J. M.; Domen, K.; Antonietti, M. Nat. Mater. 2009, 8, 76−80.(7) Goettmann, F.; Thomas, A.; Antonietti, M. Angew. Chem., Int. Ed.2007, 46, 2717−2720.(8) (a) Jin, X.; Balasubramanian, V. V.; Selvan, S. T.; Sawant, D. P.;Chari, M. A.; Lu, G. Q.; Vinu, A. Angew. Chem., Int. Ed. 2009, 48,7884−7887. (b) Tang, Y.; Allen, B. L.; Kauffman, D. R.; Star, A. J. Am.Chem. Soc. 2009, 131, 13200−13201. (c) Liu, Y.; Qu, L. T.; Baek, J. B.;Dai, L. M. ACS Nano 2010, 4, 1321−1326. (d) Yang, S. B.; Feng, X.L.; Wang, X. C.; Mullen, K. Angew. Chem., Int. Ed. 2011, 50, 5339−5343.(9) (a) Hao, G.-P.; Li, W.-C.; Qian, D.; Lu, A.-H. Adv. Mater. 2010,22, 853−857. (b) Li, Q.; Yang, J.; Feng, D.; Wu, Z.; Wu, Q.; Park, S.;Ha, C.-S.; Zhao, D. Nano Res. 2010, 3, 632−642.(10) (a) Frackowiak, E. Phys. Chem. Chem. Phys. 2007, 9, 1774−1785. (b) Ra, E. J.; Raymundo-Pinero, E.; Lee, Y. H.; Beguin, F.Carbon 2009, 47, 2984−2992. (c) Yang, X.; Wu, D.; Chen, X.; Fu, R. J.Phys. Chem. C 2010, 114, 8581−8586.(11) (a) Kowalewski, T.; Tsarevsky, N. V.; Matyjaszewski, K. J. Am.Chem. Soc. 2002, 124, 10632−10633. (b) Tang, C. B.; Tracz, A.; Kruk,M.; Zhang, R.; Smilgies, D. M.; Matyjaszewski, K.; Kowalewski, T. J.Am. Chem. Soc. 2005, 127, 6918−6919.(12) Fitzer, E. Carbon 1989, 27, 621−645.(13) Tang, C.; Wu, W.; Smilgies, D.-M.; Matyjaszewski, K.;Kowalewski, T. J. Am. Chem. Soc. 2011, 133, 11802−11809.(14) (a) Tang, C. B.; Kowalewski, T.; Matyjaszewski, K. Macro-molecules 2003, 36, 1465−1473. (b) Tang, C. B.; Qi, K.; Wooley, K. L.;Matyjaszewski, K.; Kowalewski, T. Angew. Chem., Int. Ed. 2004, 43,2783−2787. (c) Tang, C.; Dufour, B.; Kowalewski, T.; Matyjaszewski,K. Macromolecules 2007, 40, 6199−6205.(15) Bonino, F.; Brutti, S.; Reale, P.; Scrosati, B.; Gherghel, L.; Wu,J.; Mullen, K. Adv. Mater. 2005, 17, 743−746.(16) Roe, R. J. Methods of X-ray and neutron scattering in polymerscience; Oxford University Press: New York, 2000.(17) (a) Kruk, M.; Jaroniec, M.; Sayari, A. Langmuir 1997, 13, 6267−6273. (b) Choma, J.; Jaroniec, M.; Kloske, M. Adsorpt. Sci. Technol.2002, 20, 307−315.(18) Rouquerol, F.; Rouquerol, J.; Sing, K. S. W. Adsorption bypowders & porous solids: principles, methodology and applications;Academic Press: San Diego, CA, 1999.(19) Pels, J. R.; Kapteijn, F.; Moulijn, J. A.; Zhu, Q.; Thomas, K. M.Carbon 1995, 33, 1641−1653.(20) (a) Yang, S. B.; Feng, X. L.; Wang, X. C.; Mullen, K. Angew.Chem., Int. Ed. 2011, 50, 5339−5343. (b) Liu, R.; Wu, D.; Feng, X.;Mullen, K. Angew. Chem., Int. Ed. 2010, 49, 2565−2569. (c) Yu, D.;Zhang, Q.; Dai, L. J. Am. Chem. Soc. 2010, 132, 15127−15129.(21) Kierzek, K.; Frackowiak, E.; Lota, G.; Gryglewicz, G.;Machnikowski, J. Electrochim. Acta 2004, 49, 515−523.(22) (a) Yamashita, Y.; Ouchi, K. Carbon 1982, 20, 41−45. (b) Lu,C. L.; Xu, S. P.; Gan, Y. X.; Liu, S. Q.; Liu, C. H. Carbon 2005, 43,2295−2301.(23) Kinoshita, K. Carbon: electrochemical and physicochemicalproperties; Wiley: New York, 1988.(24) (a) Conway, B. E. Electrochemical supercapacitors: scientificfundamentals and technological applications; Plenum Press: New York,1999. (b) Miller, J. R.; Simon, P. Science 2008, 321, 651−652.
Journal of the American Chemical Society Article
dx.doi.org/10.1021/ja304352n | J. Am. Chem. Soc. 2012, 134, 14846−1485714856
(25) (a) Conway, B. E.; Pell, W. G. J. Solid State Electrochem. 2003, 7,637−644. (b) Liang, Y.; Schwab, M. G.; Zhi, L.; Mugnaioli, E.; Kolb,U.; Feng, X.; Mullen, K. J. Am. Chem. Soc. 2010, 132, 15030−15037.(c) Patel, M. N.; Wang, X.; Slanac, D. A.; Ferrer, D. A.; Dai, S.;Johnston, K. P.; Stevenson, K. J. J. Mater. Chem. 2012, 22, 3160−3169.(d) Arbizzani, C.; Mastragostino, M.; Meneghello, L.; Paraventi, R.Adv. Mater. 1996, 8, 331−334.(26) (a) Lota, G.; Grzyb, B.; Machnikowska, H.; Machnikowski, J.;Frackowiak, E. Chem. Phys. Lett. 2005, 404, 53−58. (b) Hulicova-Jurcakova, D.; Kodama, M.; Shiraishi, S.; Hatori, H.; Zhu, Z. H.; Lu, G.Q. Adv. Funct. Mater. 2009, 19, 1800−1809. (c) Frackowiak, E.; Lota,G.; Machnikowski, J.; Vix-Guterl, C.; Beguin, F. Electrochim. Acta2006, 51, 2209−2214. (d) Beguin, F.; Szostak, K.; Lota, G.;Frackowiak, E. Adv. Mater. 2005, 17, 2380−2384. (e) Kim, C.;Ngoc, B. T. N.; Yang, K. S.; Kojima, M.; Kim, Y. A.; Kim, Y. J.; Endo,M.; Yang, S. C. Adv. Mater. 2007, 19, 2341−2346.(27) Xu, F.; Cai, R.; Zeng, Q.; Zou, C.; Wu, D.; Li, F.; Lu, X.; Liang,Y.; Fu, R. J. Mater. Chem. 2011, 21, 1970−1976.(28) (a) Wei, T. Y.; Chen, C. H.; Chien, H. C.; Lu, S. Y.; Hu, C. C.Adv. Mater. 2010, 22, 347−351. (b) Zeng, X.; Wu, D.; Fu, R.; Lai, H.;Fu, J. Electrochim. Acta 2008, 53, 5711−5715. (c) Wang, J.; Yang, X.;Wu, D.; Fu, R.; Dresselhaus, M. S.; Dresselhaus, G. J. Power Sources2008, 185, 589−594. (d) Zeng, X.; Wu, D.; Fu, R.; Lai, H. Mater.Chem. Phys. 2008, 112, 1074−1077.(29) Chmiola, J.; Yushin, G.; Gogotsi, Y.; Portet, C.; Simon, P.;Taberna, P. L. Science 2006, 313, 1760−1763.(30) (a) Kaempgen, M.; Chan, C. K.; Ma, J.; Cui, Y.; Gruner, G.Nano Lett. 2009, 9, 1872−1876. (b) Izadi-Najafabadi, A.; Yasuda, S.;Kobashi, K.; Yamada, T.; Futaba, D. N.; Hatori, H.; Yumura, M.;Iijima, S.; Hata, K. Adv. Mater. 2010, 22, E235−E241.(31) Miller, J. R.; Outlaw, R. A.; Holloway, B. C. Science 2010, 329,1637−1639.(32) (a) Joo, S. H.; Choi, S. J.; Oh, I.; Kwak, J.; Liu, Z.; Terasaki, O.;Ryoo, R. Nature 2001, 412, 169−172. (b) Ryoo, R.; Joo, S. H.; Kruk,M.; Jaroniec, M. Adv. Mater. 2001, 13, 677−681. (c) Wu, D.; Chen, X.;Lu, S.; Liang, Y.; Xu, F.; Fu, R. Microporous Mesorporous Mater. 2010,131, 261−264.(33) Liang, Y.; Wu, D.; Fu, R. Langmuir 2009, 25, 7783−7785.(34) Liu, C.; Li, F.; Ma, L. P.; Cheng, H. M. Adv. Mater. 2010, 22,E28−E62.(35) Zhang, L. L.; Zhao, X. S. Chem. Soc. Rev. 2009, 38, 2520−2531.(36) (a) Dai, L. M.; Gong, K. P.; Du, F.; Xia, Z. H.; Durstock, M.Science 2009, 323, 760−764. (b) Star, A.; Tang, Y. F.; Allen, B. L.;Kauffman, D. R. J. Am. Chem. Soc. 2009, 131, 13200−13201.(37) Baumgarten, M.; Liu, R. L.; von Malotki, C.; Arnold, L.;Koshino, N.; Higashimura, H.; Mullen, K. J. Am. Chem. Soc. 2011, 133,10372−10375.
Journal of the American Chemical Society Article
dx.doi.org/10.1021/ja304352n | J. Am. Chem. Soc. 2012, 134, 14846−1485714857