CODEN (USA): IAJPBB ISSN: 2349-7750 INDDOO ...
13
IAJPS 2016, 3 (11), 1424-1436 A.Yasodha et al ISSN 2349-7750 www.iajps.com Page 1424 CODEN (USA): IAJPBB ISSN: 2349-7750 INDO AMERICAN JOURNAL OF PHARMACEUTICAL SCIENCES http://doi.org/10.5281/zenodo.208205 Available online at: http://www.iajps.com Research Article FORMULATION AND DEVELOPMENT OF ORAL DISSOLVING FILMS OF BUMETANIDE Dr.A.Yasodha* 1 , Humera naaz 1 , Srilatha 1 , G. Venkataih 1 , A.Sivakumar 2 1 Dhanvanthri College of Pharmaceutical Sciences, Mahabubnagar- 509002, Telangana, India. 2 AurobindoPharma Limited, Unit –VII, Jadcherla, Hyderabad. Abstract: Objective: Formulation and Development of oral dissolving Films of Bumetanide. Materials and methods: BUMETANIDE, HPMC E-50, HPMC E-5, HPMC E-3, PE, 4000 (Flakes) and Aspartame. Citric Acid could be formulated with low viscosity film formers viz. HPMC E50 in combination with HPMC E5, E15. Bumetanide could be successfully incorporated in FDFs with of the above polymers and polyethylene glycol 4000 is used as a plasticizer. PEG 4000 itself has a solubulizing affect and result in faster dissolution. Hence, there is no need of superdisintegrants. Use of low viscosity grade HPMC polymers resulted in giving films with transparent and smooth texture. Conclusion: Among all the developed formulations, F9 formulation formulated with HPMC E15 and HPMC E50 in the ratio of 1:1 showed good in vitro disintegration time and dissolution profile. Key words: Bumetanide, PEG, HPMC Corresponding author: Dr. A. Yasodha, Dhanvanthri College of Pharmaceutical Sciences, Mahabubnagar- 509002,, Telangana, India. Email: [email protected] Please cite this article in press as A. Yasodha et al, Formulation and Development of Oral Dissolving Films of Bumetanide, Indo Am. J. P. Sci, 2016; 3(11). QR code
Transcript of CODEN (USA): IAJPBB ISSN: 2349-7750 INDDOO ...
IAJPS 2016, 3 (11), 1424-1436 A.Yasodha et al ISSN 2349-7750
w w w . i a j p s . c o m
Page 1424
CODEN (USA): IAJPBB ISSN: 2349-7750
IINNDDOO AAMMEERRIICCAANN JJOOUURRNNAALL OOFF
PPHHAARRMMAACCEEUUTTIICCAALL SSCCIIEENNCCEESS
http://doi.org/10.5281/zenodo.208205
Available online at: http://www.iajps.com Research Article
FORMULATION AND DEVELOPMENT OF ORAL
DISSOLVING FILMS OF BUMETANIDE Dr.A.Yasodha*
1, Humera naaz
1, Srilatha
1, G. Venkataih
1, A.Sivakumar
2
1Dhanvanthri College of Pharmaceutical Sciences, Mahabubnagar- 509002, Telangana, India.
2AurobindoPharma Limited, Unit –VII, Jadcherla, Hyderabad.
Abstract:
Objective: Formulation and Development of oral dissolving Films of Bumetanide.
Materials and methods: BUMETANIDE, HPMC E-50, HPMC E-5, HPMC E-3, PE, 4000 (Flakes) and Aspartame.
Citric Acid could be formulated with low viscosity film formers viz. HPMC E50 in combination with HPMC E5, E15.
Bumetanide could be successfully incorporated in FDFs with of the above polymers and polyethylene glycol 4000 is
used as a plasticizer. PEG 4000 itself has a solubulizing affect and result in faster dissolution. Hence, there is no
need of superdisintegrants. Use of low viscosity grade HPMC polymers resulted in giving films with transparent and
smooth texture.
Conclusion: Among all the developed formulations, F9 formulation formulated with HPMC E15 and HPMC E50 in
the ratio of 1:1 showed good in vitro disintegration time and dissolution profile.
Key words: Bumetanide, PEG, HPMC
Corresponding author:
Dr. A. Yasodha,
Dhanvanthri College of Pharmaceutical Sciences,
Mahabubnagar- 509002,,
Telangana, India.
Email: [email protected]
Please cite this article in press as A. Yasodha et al, Formulation and Development of Oral Dissolving Films of
Bumetanide, Indo Am. J. P. Sci, 2016; 3(11).
QR code

IAJPS 2016, 3 (11), 1424-1436 A.Yasodha et al ISSN 2349-7750
w w w . i a j p s . c o m
Page 1425
INTRODUCTION:
Fast dissolving oral films are most advanced forms of
solid dosage form due to more flexibility and
comfort. It improves the efficacy of API dissolving
within minute in oral cavity after the contact with less
saliva as compared to fast dissolving tablet without
chewing and no need of water for administration. It
gives quick absorption and instant bioavailability of
drug due to high load flow and permeability of oral
mucosa which is 4-1000 times greater than that of
skin. Some drugs are absorbed from the mouth,
pharynx and esophagus as the saliva passes down
into the stomach. In such cases, bioavailability of
drug is significantly greater than those observed from
conventional tablet dosage form. Fast dissolving oral
films are useful in patients such as pediatric,
geriatric, bedridden, emetic patients, diarrhea, sudden
episode of allergic attacks, or coughing for those who
have an active life style. It is also useful whether
local action desired such as local anesthetic for
toothaches, oral ulcers, cold sores or teething.
The aim of the study is to design and develop a novel
fast dissolving oral films of Bumetanide with the
disintegration time less than 20 seconds, so as to
disintegrate the film rapidly and to achieve rapid drug
release [1-3].
MATERIALS AND METHODS:
Table 1: List of Materials and sources
S.
No. Materials Sources
1. BUMETANIDE Killicks Pharma, Mumbai,
India.
2. HPMC E-50 SD Fine Chem. Ltd., Mumbai,
India.
3. HPMC E-5 SD Fine Chem. Ltd., Mumbai,
India.
4. HPMC E-3 SD Fine Chem. Ltd., Mumbai,
India.
6. PEG 4000
(Flakes)
Central Drug House (P) Ltd.,
New Delhi, India.
7. Aspartame SD Fine Chem. Ltd., Mumbai,
India.
8. Citric Acid SD Fine Chem. Ltd., Mumbai,
India.
Preparation of calibration curve of Bumetanide:
Standard plot of Bumetanide was prepared using pH
phosphate buffer. 100 mg of Bumetanide was
weighed and transferred into volumetric flask. To this
add small quantity of pH 6.8 phosphate buffer to
dissolve the drug and then the solution was made
upto 100 ml using pH phosphate buffer. This is stock
solution (A).
From stock solution (A), 1 ml was transferred into
100 ml volumetric flask and made up to the mark.
This is stock solution (B).
From stock solution (B), appropriate dilutions 2, 4,
6, 8, 10 were made and absorbance was measured by
using UV-Spectrophotometer at 254 nm.
FTIR interaction studies:
Fourier Transform Infrared (FTIR) Spectroscopy
Drug-excipients compatibility study was performed
by Fourier transform infrared (FTIR) Spectroscopy.
A small quantity of sample is grind with specially
purified salt bromide and the mixture is heated to 100
°C for 1 hr to remove moisture and is pressed in a
mechanical press to form a pellet through which beam
of spectrophotometer light was passed.
The peaks of samples were obtained using
spectrophotometer (FTIR 8400S Shimadzu, Japan).
Pure Drug (BUMETANIDE), individual polymers
(HPMC E50, E5 and E15) and physical mixtures of
optimized formulation were subjected to FTIR studies
[3-6].
Formulation Development:
Method of Preparation of Fast Dissolving Oral
Films of Bumetanide
Fast dissolving oral films of Bumetanide were
prepared by solvent casting method. Initially
solution (A) was prepared by dissolving polymer and
plasticizer, polyethylene glycol 4000 in 9 ml of water
and kept for stirring for 1 hr and solution (B) was
prepared by dissolving drug, citric acid, Aspartame
in 1 ml of water as per formulation in appropriate
quantities, add solution (B) to solution (A) and kept
for stirring for 2 hrs. Care was taken as air bubble
entrapment occurs during stirring. After uniform
mixing of two solutions, degassing is done to
remove air bubbles and finally the solution was
casted into pre-fabricated glass mould of size 4X4
cm2 size and dried overnight and the dried film was
cut into appropriate sizes for further evaluation [7-
9]. Compositions of fast dissolving oral films of
Bumetanide were shown in Table 2.
IAJPS 2016, 3 (11), 1424-1436 A.Yasodha et al ISSN 2349-7750
w w w . i a j p s . c o m
Page 1426
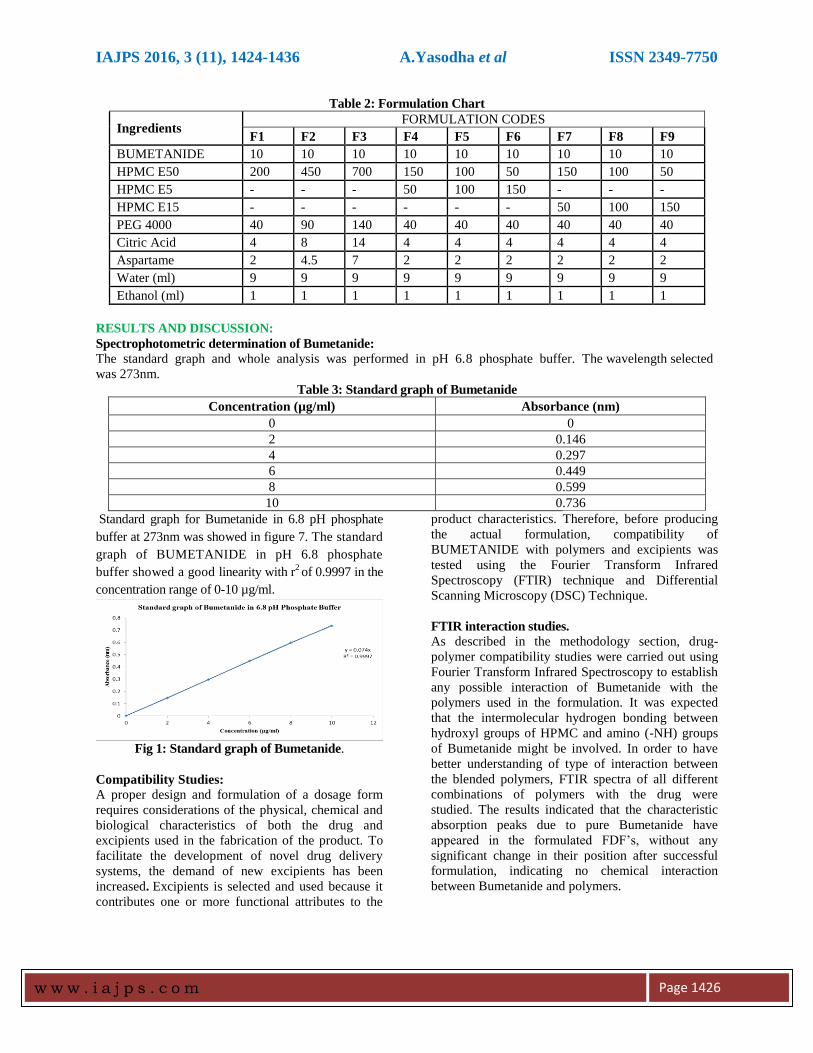
Table 2: Formulation Chart
Ingredients FORMULATION CODES
F1 F2 F3 F4 F5 F6 F7 F8 F9
BUMETANIDE 10 10 10 10 10 10 10 10 10
HPMC E50 200 450 700 150 100 50 150 100 50
HPMC E5 - - - 50 100 150 - - -
HPMC E15 - - - - - - 50 100 150
PEG 4000 40 90 140 40 40 40 40 40 40
Citric Acid 4 8 14 4 4 4 4 4 4
Aspartame 2 4.5 7 2 2 2 2 2 2
Water (ml) 9 9 9 9 9 9 9 9 9
Ethanol (ml) 1 1 1 1 1 1 1 1 1
RESULTS AND DISCUSSION:
Spectrophotometric determination of Bumetanide:
The standard graph and whole analysis was performed in pH 6.8 phosphate buffer. The wavelength selected
was 273nm.
Table 3: Standard graph of Bumetanide
Concentration (µg/ml) Absorbance (nm)
0 0
2 0.146
4 0.297
6 0.449
8 0.599
10 0.736
Standard graph for Bumetanide in 6.8 pH phosphate
buffer at 273nm was showed in figure 7. The standard
graph of BUMETANIDE in pH 6.8 phosphate
buffer showed a good linearity with r2 of 0.9997 in the
concentration range of 0-10 µg/ml.
Fig 1: Standard graph of Bumetanide.
Compatibility Studies:
A proper design and formulation of a dosage form
requires considerations of the physical, chemical and
biological characteristics of both the drug and
excipients used in the fabrication of the product. To
facilitate the development of novel drug delivery
systems, the demand of new excipients has been
increased. Excipients is selected and used because it
contributes one or more functional attributes to the
product characteristics. Therefore, before producing
the actual formulation, compatibility of
BUMETANIDE with polymers and excipients was
tested using the Fourier Transform Infrared
Spectroscopy (FTIR) technique and Differential
Scanning Microscopy (DSC) Technique.
FTIR interaction studies.
As described in the methodology section, drug-
polymer compatibility studies were carried out using
Fourier Transform Infrared Spectroscopy to establish
any possible interaction of Bumetanide with the
polymers used in the formulation. It was expected
that the intermolecular hydrogen bonding between
hydroxyl groups of HPMC and amino (-NH) groups
of Bumetanide might be involved. In order to have
better understanding of type of interaction between
the blended polymers, FTIR spectra of all different
combinations of polymers with the drug were
studied. The results indicated that the characteristic
absorption peaks due to pure Bumetanide have
appeared in the formulated FDF’s, without any
significant change in their position after successful
formulation, indicating no chemical interaction
between Bumetanide and polymers.
IAJPS 2016, 3 (11), 1424-1436 A.Yasodha et al ISSN 2349-7750
w w w . i a j p s . c o m
Page 1427
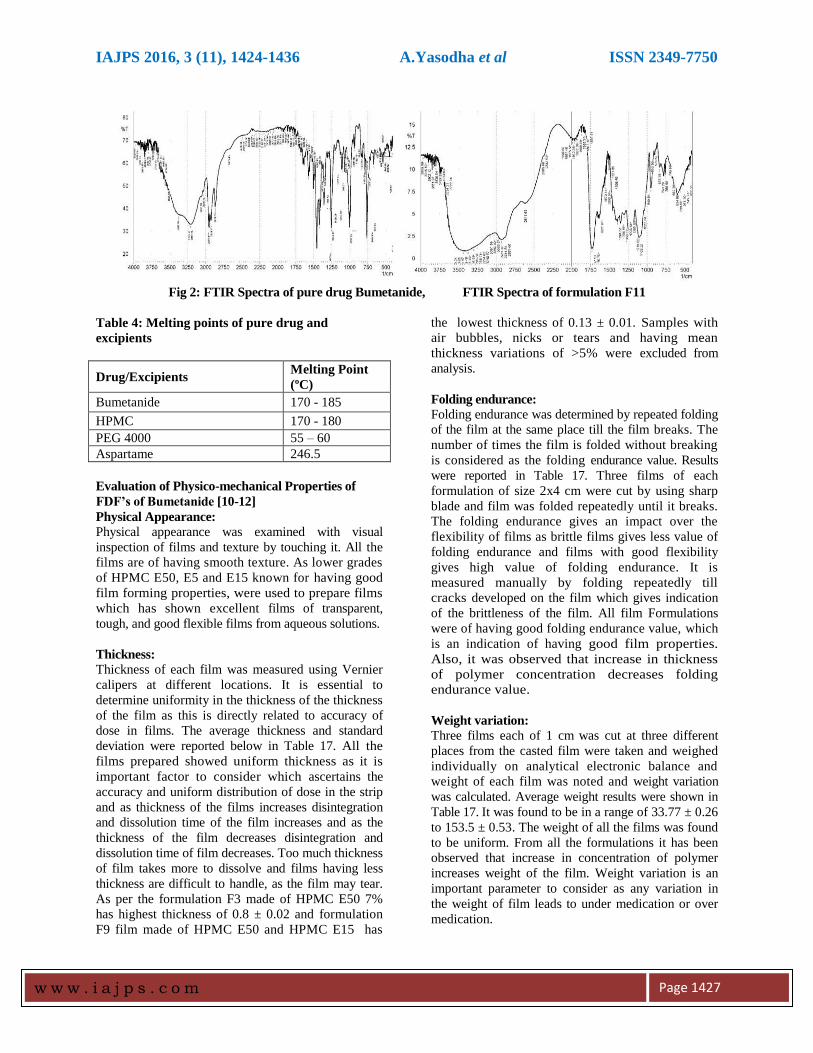
Fig 2: FTIR Spectra of pure drug Bumetanide, FTIR Spectra of formulation F11
Table 4: Melting points of pure drug and
excipients
Drug/Excipients Melting Point
(ºC)
Bumetanide 170 - 185
HPMC 170 - 180
PEG 4000 55 – 60
Aspartame 246.5
Evaluation of Physico-mechanical Properties of
FDF’s of Bumetanide [10-12]
Physical Appearance: Physical appearance was examined with visual
inspection of films and texture by touching it. All the
films are of having smooth texture. As lower grades
of HPMC E50, E5 and E15 known for having good
film forming properties, were used to prepare films
which has shown excellent films of transparent,
tough, and good flexible films from aqueous solutions.
Thickness:
Thickness of each film was measured using Vernier
calipers at different locations. It is essential to
determine uniformity in the thickness of the thickness
of the film as this is directly related to accuracy of
dose in films. The average thickness and standard
deviation were reported below in Table 17. All the
films prepared showed uniform thickness as it is
important factor to consider which ascertains the
accuracy and uniform distribution of dose in the strip
and as thickness of the films increases disintegration
and dissolution time of the film increases and as the
thickness of the film decreases disintegration and
dissolution time of film decreases. Too much thickness
of film takes more to dissolve and films having less
thickness are difficult to handle, as the film may tear.
As per the formulation F3 made of HPMC E50 7%
has highest thickness of 0.8 ± 0.02 and formulation
F9 film made of HPMC E50 and HPMC E15 has
the lowest thickness of 0.13 ± 0.01. Samples with
air bubbles, nicks or tears and having mean
thickness variations of >5% were excluded from
analysis.
Folding endurance:
Folding endurance was determined by repeated folding
of the film at the same place till the film breaks. The
number of times the film is folded without breaking
is considered as the folding endurance value. Results
were reported in Table 17. Three films of each
formulation of size 2x4 cm were cut by using sharp
blade and film was folded repeatedly until it breaks.
The folding endurance gives an impact over the
flexibility of films as brittle films gives less value of
folding endurance and films with good flexibility
gives high value of folding endurance. It is
measured manually by folding repeatedly till
cracks developed on the film which gives indication
of the brittleness of the film. All film Formulations
were of having good folding endurance value, which
is an indication of having good film properties.
Also, it was observed that increase in thickness
of polymer concentration decreases folding
endurance value.
Weight variation:
Three films each of 1 cm was cut at three different
places from the casted film were taken and weighed
individually on analytical electronic balance and
weight of each film was noted and weight variation
was calculated. Average weight results were shown in
Table 17. It was found to be in a range of 33.77 ± 0.26
to 153.5 ± 0.53. The weight of all the films was found
to be uniform. From all the formulations it has been
observed that increase in concentration of polymer
increases weight of the film. Weight variation is an
important parameter to consider as any variation in
the weight of film leads to under medication or over
medication.
IAJPS 2016, 3 (11), 1424-1436 A.Yasodha et al ISSN 2349-7750
w w w . i a j p s . c o m
Page 1428
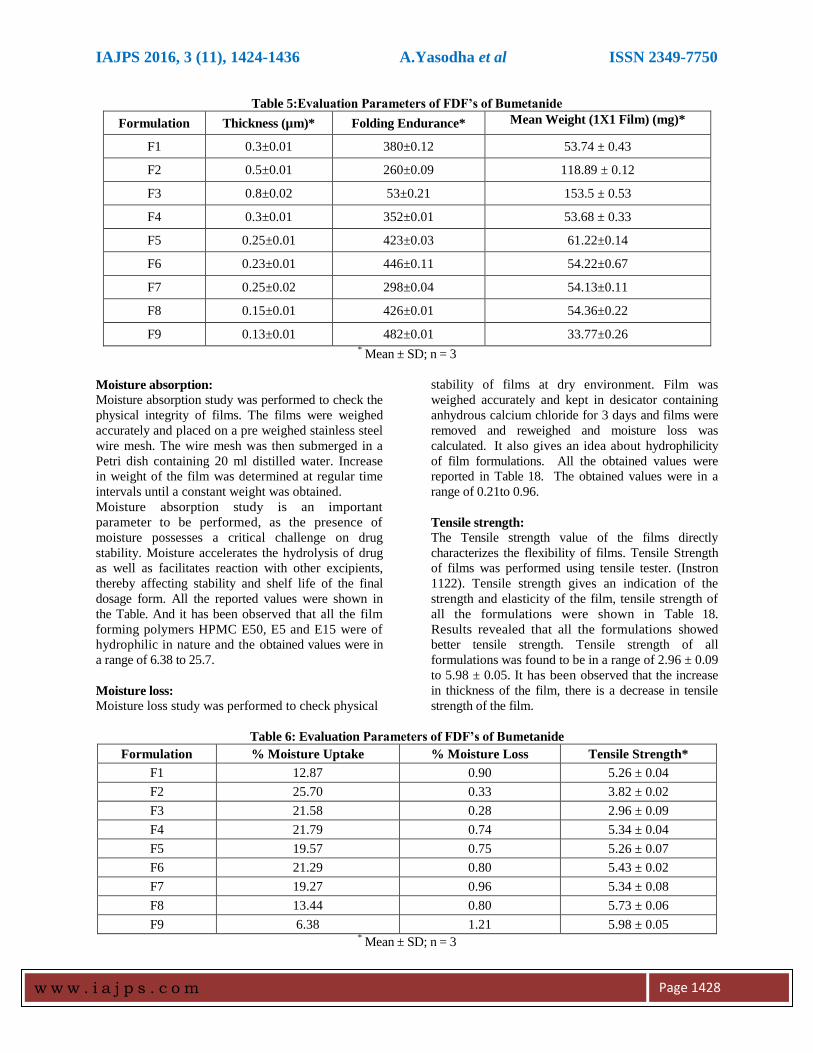
Table 5:Evaluation Parameters of FDF’s of Bumetanide
Formulation Thickness (µm)* Folding Endurance* Mean Weight (1X1 Film) (mg)*
F1 0.3±0.01 380±0.12 53.74 ± 0.43
F2 0.5±0.01 260±0.09 118.89 ± 0.12
F3 0.8±0.02 53±0.21 153.5 ± 0.53
F4 0.3±0.01 352±0.01 53.68 ± 0.33
F5 0.25±0.01 423±0.03 61.22±0.14
F6 0.23±0.01 446±0.11 54.22±0.67
F7 0.25±0.02 298±0.04 54.13±0.11
F8 0.15±0.01 426±0.01 54.36±0.22
F9 0.13±0.01 482±0.01 33.77±0.26 * Mean ± SD; n = 3
Moisture absorption:
Moisture absorption study was performed to check the
physical integrity of films. The films were weighed
accurately and placed on a pre weighed stainless steel
wire mesh. The wire mesh was then submerged in a
Petri dish containing 20 ml distilled water. Increase
in weight of the film was determined at regular time
intervals until a constant weight was obtained.
Moisture absorption study is an important
parameter to be performed, as the presence of
moisture possesses a critical challenge on drug
stability. Moisture accelerates the hydrolysis of drug
as well as facilitates reaction with other excipients,
thereby affecting stability and shelf life of the final
dosage form. All the reported values were shown in
the Table. And it has been observed that all the film
forming polymers HPMC E50, E5 and E15 were of
hydrophilic in nature and the obtained values were in
a range of 6.38 to 25.7.
Moisture loss:
Moisture loss study was performed to check physical
stability of films at dry environment. Film was
weighed accurately and kept in desicator containing
anhydrous calcium chloride for 3 days and films were
removed and reweighed and moisture loss was
calculated. It also gives an idea about hydrophilicity
of film formulations. All the obtained values were
reported in Table 18. The obtained values were in a
range of 0.21to 0.96.
Tensile strength:
The Tensile strength value of the films directly
characterizes the flexibility of films. Tensile Strength
of films was performed using tensile tester. (Instron
1122). Tensile strength gives an indication of the
strength and elasticity of the film, tensile strength of
all the formulations were shown in Table 18.
Results revealed that all the formulations showed
better tensile strength. Tensile strength of all
formulations was found to be in a range of 2.96 ± 0.09
to 5.98 ± 0.05. It has been observed that the increase
in thickness of the film, there is a decrease in tensile
strength of the film.
Table 6: Evaluation Parameters of FDF’s of Bumetanide
Formulation % Moisture Uptake % Moisture Loss Tensile Strength*
F1 12.87 0.90 5.26 ± 0.04
F2 25.70 0.33 3.82 ± 0.02
F3 21.58 0.28 2.96 ± 0.09
F4 21.79 0.74 5.34 ± 0.04
F5 19.57 0.75 5.26 ± 0.07
F6 21.29 0.80 5.43 ± 0.02
F7 19.27 0.96 5.34 ± 0.08
F8 13.44 0.80 5.73 ± 0.06
F9 6.38 1.21 5.98 ± 0.05 * Mean ± SD; n = 3
IAJPS 2016, 3 (11), 1424-1436 A.Yasodha et al ISSN 2349-7750
w w w . i a j p s . c o m
Page 1429
Drug content estimation:
Film was dissolved in pH 6.8 phosphate buffer and
continuously stirred for 1 hr and the solution was
filtered and suitable dilutions were made and
absorbance was measured using UV
Spectrophotometer at 273 nm. The limit for drug
content estimation is 85-115%. The drug content
estimation was performed to ensure the accurate
distribution of drug. The test was performed for all
the formulations in triplicate. Each formulation was
analyzed spectrophotometrically and the mean
value and standard deviation of all the
formulations were calculated. The drug content or
percentage of drug content is varied in between 95.61
% to 97.19 %.
In vitro disintegration test:
Disintegration test of the film was performed by
dissolving the film in a glass beaker containing 25 ml
of water with occasional gentle swirling and shaking
for every 10 sec. The disintegration time is the time
when the film starts to break or disintegrate and time
was noted.
Results of disintegration time of all the formulations
were tabulated in Table. The disintegration time of
all the formulations were in a range of 16 ± 2.6 sec to
615 ± 1.9 sec. Also it has been observed as the
concentration of polymer increases thickness of
film increases and thereby times taken for the film to
disintegrate increases, results were shown in table 7.
In vitro dissolution study:
Dissolution test of the film was performed using USP
Type II dissolution apparatus in 300 ml pH 6.8
phosphate buffer at 100 rpm. 5 ml of sample was
withdrawn in a time intervals of 5, 10, 15, 30, 45,
60, 90 min and 5 ml buffer was replaced to
maintain sink conditions. Withdrawn samples were
diluted and absorbance was measured using UV-
Spectrophotometer at 273nm report shown in table 8.
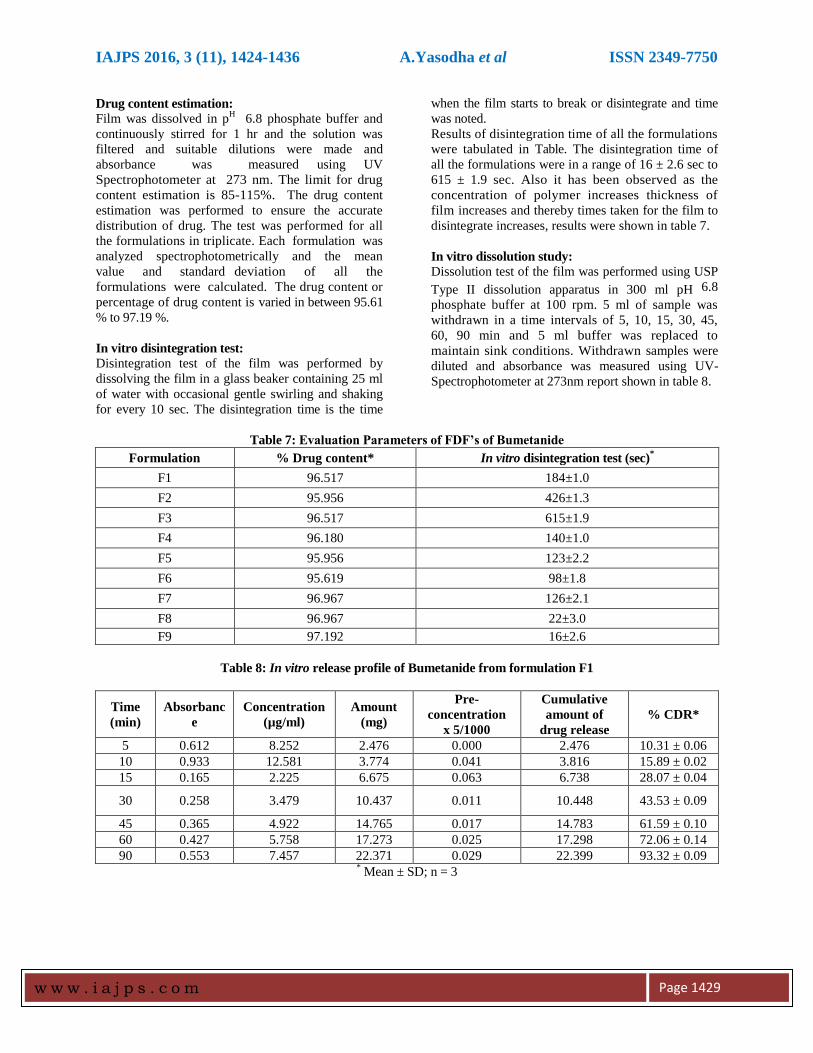
Table 7: Evaluation Parameters of FDF’s of Bumetanide
Formulation % Drug content* In vitro disintegration test (sec)*
F1 96.517 184±1.0
F2 95.956 426±1.3
F3 96.517 615±1.9
F4 96.180 140±1.0
F5 95.956 123±2.2
F6 95.619 98±1.8
F7 96.967 126±2.1
F8 96.967 22±3.0
F9 97.192 16±2.6
Table 8: In vitro release profile of Bumetanide from formulation F1
Time
(min)
Absorbanc
e
Concentration
(µg/ml)
Amount
(mg)
Pre-
concentration
x 5/1000
Cumulative
amount of
drug release
% CDR*
5 0.612 8.252 2.476 0.000 2.476 10.31 ± 0.06
10 0.933 12.581 3.774 0.041 3.816 15.89 ± 0.02
15 0.165 2.225 6.675 0.063 6.738 28.07 ± 0.04
30 0.258 3.479 10.437 0.011 10.448 43.53 ± 0.09
45 0.365 4.922 14.765 0.017 14.783 61.59 ± 0.10
60 0.427 5.758 17.273 0.025 17.298 72.06 ± 0.14
90 0.553 7.457 22.371 0.029 22.399 93.32 ± 0.09 * Mean ± SD; n = 3
IAJPS 2016, 3 (11), 1424-1436 A.Yasodha et al ISSN 2349-7750
w w w . i a j p s . c o m
Page 1430
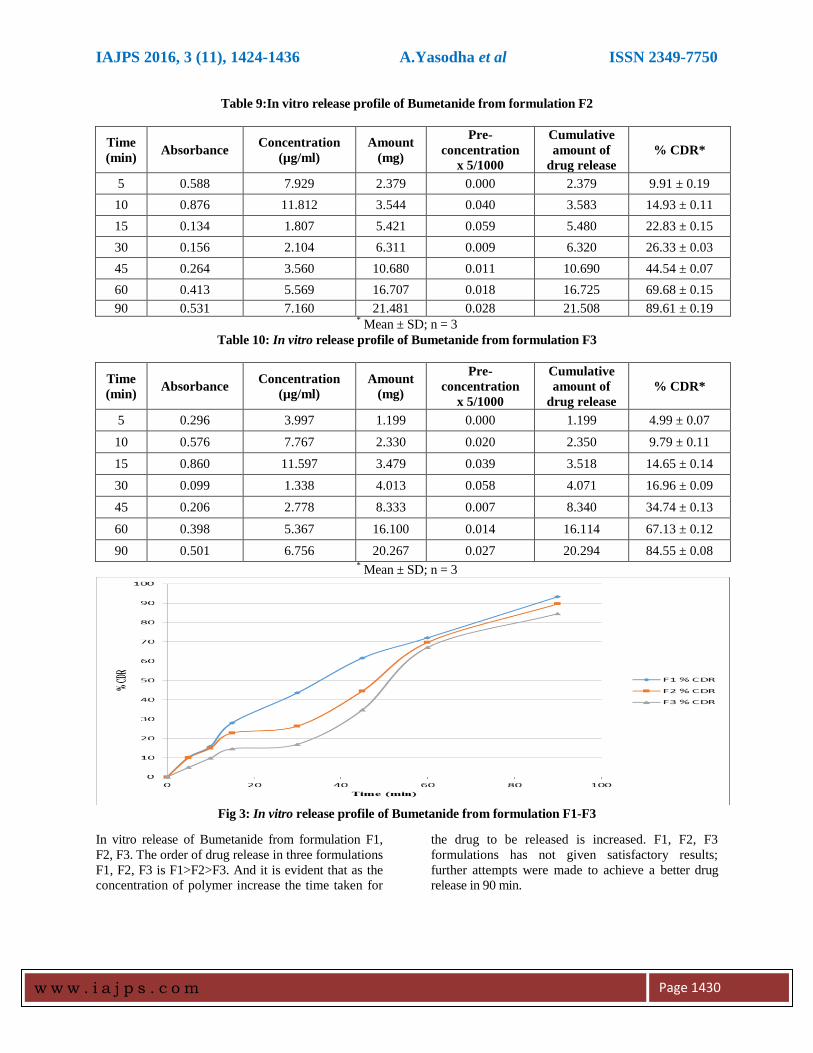
Table 9:In vitro release profile of Bumetanide from formulation F2
Time
(min) Absorbance
Concentration
(µg/ml)
Amount
(mg)
Pre-
concentration
x 5/1000
Cumulative
amount of
drug release
% CDR*
5 0.588 7.929 2.379 0.000 2.379 9.91 ± 0.19
10 0.876 11.812 3.544 0.040 3.583 14.93 ± 0.11
15 0.134 1.807 5.421 0.059 5.480 22.83 ± 0.15
30 0.156 2.104 6.311 0.009 6.320 26.33 ± 0.03
45 0.264 3.560 10.680 0.011 10.690 44.54 ± 0.07
60 0.413 5.569 16.707 0.018 16.725 69.68 ± 0.15
90 0.531 7.160 21.481 0.028 21.508 89.61 ± 0.19 * Mean ± SD; n = 3
Table 10: In vitro release profile of Bumetanide from formulation F3
Time
(min) Absorbance
Concentration
(µg/ml)
Amount
(mg)
Pre-
concentration
x 5/1000
Cumulative
amount of
drug release
% CDR*
5 0.296 3.997 1.199 0.000 1.199 4.99 ± 0.07
10 0.576 7.767 2.330 0.020 2.350 9.79 ± 0.11
15 0.860 11.597 3.479 0.039 3.518 14.65 ± 0.14
30 0.099 1.338 4.013 0.058 4.071 16.96 ± 0.09
45 0.206 2.778 8.333 0.007 8.340 34.74 ± 0.13
60 0.398 5.367 16.100 0.014 16.114 67.13 ± 0.12
90 0.501 6.756 20.267 0.027 20.294 84.55 ± 0.08 * Mean ± SD; n = 3
Fig 3: In vitro release profile of Bumetanide from formulation F1-F3
In vitro release of Bumetanide from formulation F1,
F2, F3. The order of drug release in three formulations
F1, F2, F3 is F1>F2>F3. And it is evident that as the
concentration of polymer increase the time taken for
the drug to be released is increased. F1, F2, F3
formulations has not given satisfactory results;
further attempts were made to achieve a better drug
release in 90 min.
IAJPS 2016, 3 (11), 1424-1436 A.Yasodha et al ISSN 2349-7750
w w w . i a j p s . c o m
Page 1431
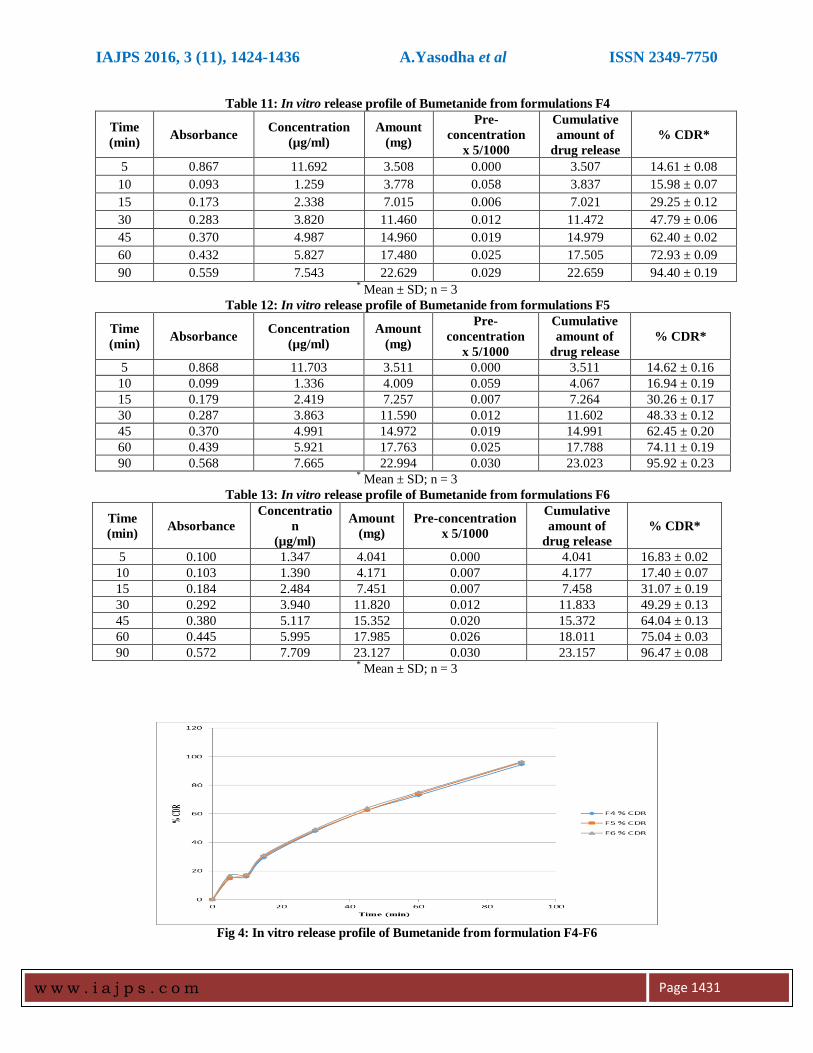
Table 11: In vitro release profile of Bumetanide from formulations F4
Time
(min) Absorbance
Concentration
(µg/ml)
Amount
(mg)
Pre-
concentration
x 5/1000
Cumulative
amount of
drug release
% CDR*
5 0.867 11.692 3.508 0.000 3.507 14.61 ± 0.08
10 0.093 1.259 3.778 0.058 3.837 15.98 ± 0.07
15 0.173 2.338 7.015 0.006 7.021 29.25 ± 0.12
30 0.283 3.820 11.460 0.012 11.472 47.79 ± 0.06
45 0.370 4.987 14.960 0.019 14.979 62.40 ± 0.02
60 0.432 5.827 17.480 0.025 17.505 72.93 ± 0.09
90 0.559 7.543 22.629 0.029 22.659 94.40 ± 0.19 * Mean ± SD; n = 3
Table 12: In vitro release profile of Bumetanide from formulations F5
Time
(min) Absorbance
Concentration
(µg/ml)
Amount
(mg)
Pre-
concentration
x 5/1000
Cumulative
amount of
drug release
% CDR*
5 0.868 11.703 3.511 0.000 3.511 14.62 ± 0.16
10 0.099 1.336 4.009 0.059 4.067 16.94 ± 0.19
15 0.179 2.419 7.257 0.007 7.264 30.26 ± 0.17
30 0.287 3.863 11.590 0.012 11.602 48.33 ± 0.12
45 0.370 4.991 14.972 0.019 14.991 62.45 ± 0.20
60 0.439 5.921 17.763 0.025 17.788 74.11 ± 0.19
90 0.568 7.665 22.994 0.030 23.023 95.92 ± 0.23 * Mean ± SD; n = 3
Table 13: In vitro release profile of Bumetanide from formulations F6
Time
(min) Absorbance
Concentratio
n
(µg/ml)
Amount
(mg)
Pre-concentration
x 5/1000
Cumulative
amount of
drug release
% CDR*
5 0.100 1.347 4.041 0.000 4.041 16.83 ± 0.02
10 0.103 1.390 4.171 0.007 4.177 17.40 ± 0.07
15 0.184 2.484 7.451 0.007 7.458 31.07 ± 0.19
30 0.292 3.940 11.820 0.012 11.833 49.29 ± 0.13
45 0.380 5.117 15.352 0.020 15.372 64.04 ± 0.13
60 0.445 5.995 17.985 0.026 18.011 75.04 ± 0.03
90 0.572 7.709 23.127 0.030 23.157 96.47 ± 0.08 * Mean ± SD; n = 3
Fig 4: In vitro release profile of Bumetanide from formulation F4-F6

IAJPS 2016, 3 (11), 1424-1436 A.Yasodha et al ISSN 2349-7750
w w w . i a j p s . c o m
Page 1432
The order of drug release in three formulations F4, F5,
F6 is F4<F5< F6. And it is evident that as the
concentration of polymer HPMC E50 increase the
time taken for the drug to be released is increased.
F4, F5, F6 formulations has not given satisfactory
results; further attempts were made to achieve a better
drug release in 90 min.
Table 14:In vitro release profile of Bumetanide from formulations F7
Time
(min) Absorbance
Concentration
(µg/ml)
Amount
(mg)
Pre-
concentration
x 5/1000
Cumulative
amount of
drug release
% CDR*
5 0.088 1.180 3.540 0.000 3.540 14.74 ± 0.03
10 0.100 1.343 4.029 0.006 4.035 16.81 ± 0.09
15 0.179 2.419 7.257 0.007 7.264 30.26 ± 0.05
30 0.287 3.863 11.590 0.012 11.602 48.33 ± 0.05
45 0.370 4.991 14.972 0.019 14.991 62.45 ± 0.09
60 0.439 5.921 17.763 0.025 17.788 74.11 ± 0.04
90 0.568 7.665 22.994 0.030 23.023 95.92 ± 0.04 * Mean ± SD; n = 3
Table 15: In vitro release profile of Bumetanide from formulations F8
Time
(min) Absorbance
Concentration
(µg/ml)
Amount
(mg)
Pre-
concentration
x 5/1000
Cumulative
amount of
drug release
% CDR*
5 0.222 2.998 8.993 0.000 6.521 27.16 ± 0.10
10 0.267 3.604 10.813 0.015 10.828 45.11 ± 0.09
15 0.300 4.039 12.116 0.018 12.134 50.55 ± 0.07
30 0.392 5.283 15.850 0.020 15.870 66.11 ± 0.08
45 0.495 6.675 20.024 0.026 20.051 83.53 ± 0.09
60 0.537 7.241 21.723 0.033 21.757 90.64 ± 0.12
90 0.583 7.861 23.584 0.036 23.620 98.41 ± 0.10 * Mean ± SD; n = 3
Table 16: In vitro release profile of Bumetanide from formulations F9
Time
(min) Absorbance
Concentration
(µg/ml)
Amount
(mg)
Pre-
concentration
x 5/1000
Cumulative
amount of
drug release
% CDR*
5 0.242 3.267 9.802 0.000 9.802 40.83 ± 0.12
10 0.287 3.874 11.622 0.016 11.639 48.49 ± 0.09
15 0.336 4.524 13.572 0.019 13.591 56.62 ± 0.05
30 0.392 5.283 15.850 0.023 15.872 66.12 ± 0.06
45 0.495 6.675 20.024 0.026 20.051 83.53 ± 0.09
60 0.567 7.646 22.937 0.033 22.970 95.70 ± 0.03
90 0.585 7.894 23.681 0.038 23.719 98.82 ± 0.05 * Mean ± SD; n = 3
IAJPS 2016, 3 (11), 1424-1436 A.Yasodha et al ISSN 2349-7750
w w w . i a j p s . c o m
Page 1433
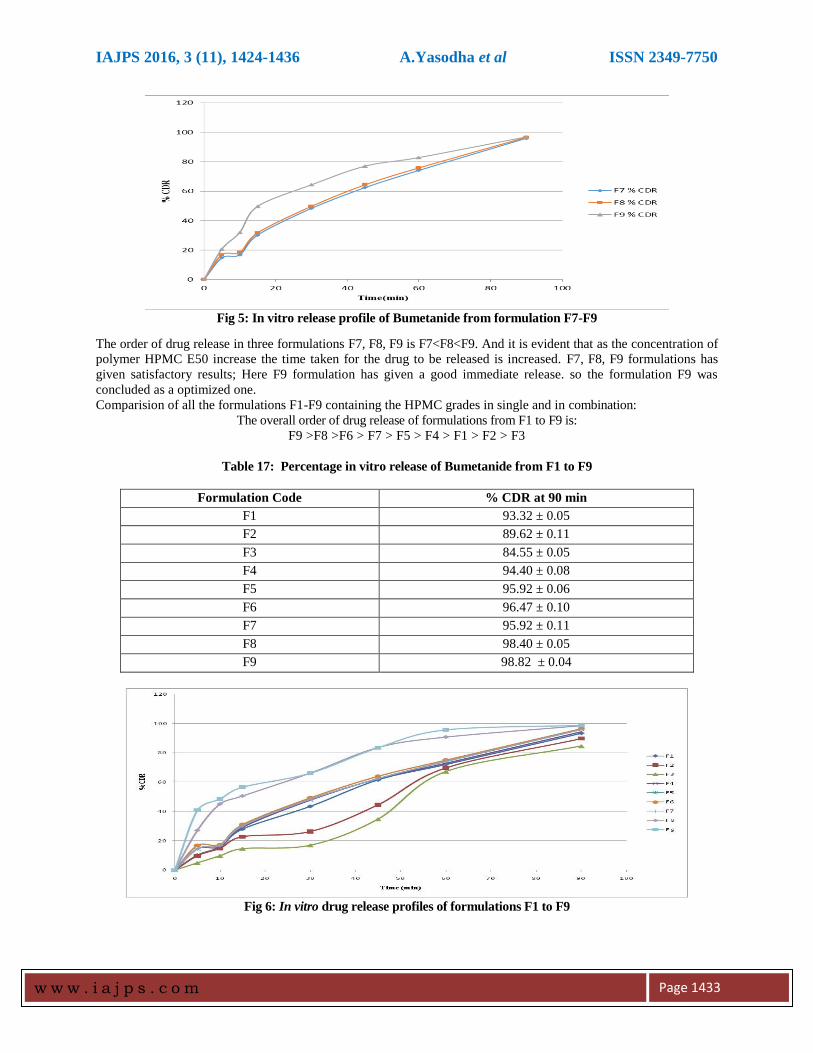
Fig 5: In vitro release profile of Bumetanide from formulation F7-F9
The order of drug release in three formulations F7, F8, F9 is F7<F8<F9. And it is evident that as the concentration of
polymer HPMC E50 increase the time taken for the drug to be released is increased. F7, F8, F9 formulations has
given satisfactory results; Here F9 formulation has given a good immediate release. so the formulation F9 was
concluded as a optimized one.
Comparision of all the formulations F1-F9 containing the HPMC grades in single and in combination:
The overall order of drug release of formulations from F1 to F9 is:
F9 >F8 >F6 > F7 > F5 > F4 > F1 > F2 > F3
Table 17: Percentage in vitro release of Bumetanide from F1 to F9
Formulation Code % CDR at 90 min
F1 93.32 ± 0.05
F2 89.62 ± 0.11
F3 84.55 ± 0.05
F4 94.40 ± 0.08
F5 95.92 ± 0.06
F6 96.47 ± 0.10
F7 95.92 ± 0.11
F8 98.40 ± 0.05
F9 98.82 ± 0.04
Fig 6: In vitro drug release profiles of formulations F1 to F9
IAJPS 2016, 3 (11), 1424-1436 A.Yasodha et al ISSN 2349-7750
w w w . i a j p s . c o m
Page 1434
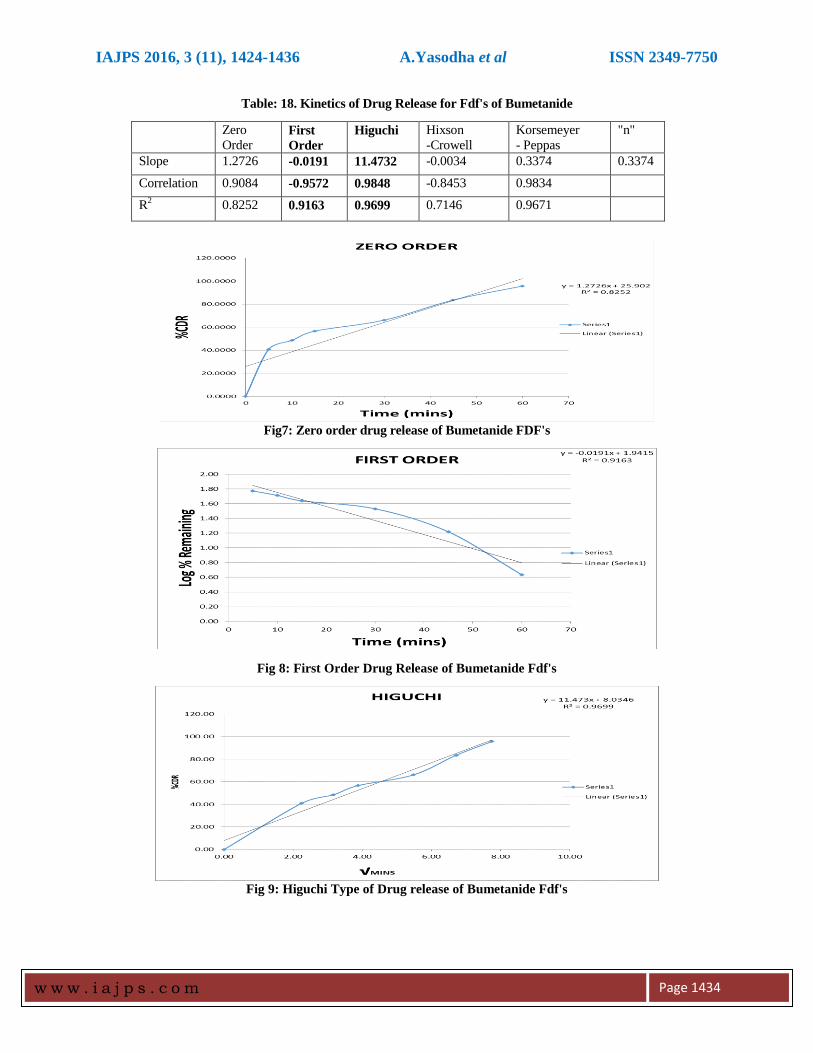
Table: 18. Kinetics of Drug Release for Fdf's of Bumetanide
Zero
Order First
Order
Higuchi Hixson
-Crowell
Korsemeyer
- Peppas
"n"
Slope 1.2726 -0.0191 11.4732 -0.0034 0.3374 0.3374
Correlation 0.9084 -0.9572 0.9848 -0.8453 0.9834
R2 0.8252 0.9163 0.9699 0.7146 0.9671
Fig7: Zero order drug release of Bumetanide FDF's
Fig 8: First Order Drug Release of Bumetanide Fdf's
Fig 9: Higuchi Type of Drug release of Bumetanide Fdf's
IAJPS 2016, 3 (11), 1424-1436 A.Yasodha et al ISSN 2349-7750
w w w . i a j p s . c o m
Page 1435
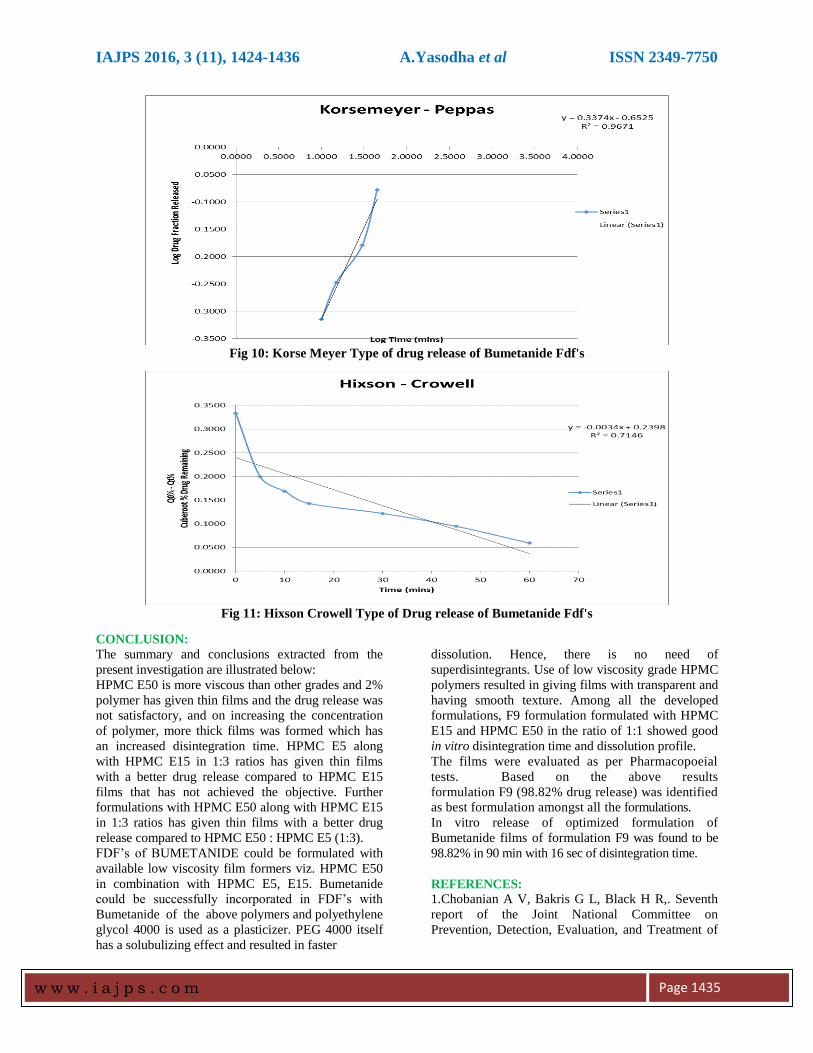
Fig 10: Korse Meyer Type of drug release of Bumetanide Fdf's
Fig 11: Hixson Crowell Type of Drug release of Bumetanide Fdf's
CONCLUSION:
The summary and conclusions extracted from the
present investigation are illustrated below:
HPMC E50 is more viscous than other grades and 2%
polymer has given thin films and the drug release was
not satisfactory, and on increasing the concentration
of polymer, more thick films was formed which has
an increased disintegration time. HPMC E5 along
with HPMC E15 in 1:3 ratios has given thin films
with a better drug release compared to HPMC E15
films that has not achieved the objective. Further
formulations with HPMC E50 along with HPMC E15
in 1:3 ratios has given thin films with a better drug
release compared to HPMC E50 : HPMC E5 (1:3).
FDF’s of BUMETANIDE could be formulated with
available low viscosity film formers viz. HPMC E50
in combination with HPMC E5, E15. Bumetanide
could be successfully incorporated in FDF’s with
Bumetanide of the above polymers and polyethylene
glycol 4000 is used as a plasticizer. PEG 4000 itself
has a solubulizing effect and resulted in faster
dissolution. Hence, there is no need of
superdisintegrants. Use of low viscosity grade HPMC
polymers resulted in giving films with transparent and
having smooth texture. Among all the developed
formulations, F9 formulation formulated with HPMC
E15 and HPMC E50 in the ratio of 1:1 showed good
in vitro disintegration time and dissolution profile.
The films were evaluated as per Pharmacopoeial
tests. Based on the above results
formulation F9 (98.82% drug release) was identified
as best formulation amongst all the formulations.
In vitro release of optimized formulation of
Bumetanide films of formulation F9 was found to be
98.82% in 90 min with 16 sec of disintegration time.
REFERENCES:
1.Chobanian A V, Bakris G L, Black H R,. Seventh
report of the Joint National Committee on
Prevention, Detection, Evaluation, and Treatment of
IAJPS 2016, 3 (11), 1424-1436 A.Yasodha et al ISSN 2349-7750
w w w . i a j p s . c o m
Page 1436
High Blood Pressure. Hypertension. 2003; 42 (6):
1206–52.
2.Fisher N D, Williams G H, Kasper D L, Braunwald
E, Fauci A S, Hypertensive vascular disease.
Harrison's Principles of Internal Medicine (16th ed.).
New York, N Y: McGraw-Hill. 2005; 1463–81.
3.Pradeep H. K., (2010); Design and In vitro
Evaluation of Mouth Dissolving Tablets of
Venlafaxine Hydrochloride; Mpharm Thesis; Rajiv
Gandhi university of health sciences at Bangalore.
4.Subhashre Sahoo, Chandra Kanti Chakraborti,
Pradipta Kumar Behera, Subash Chandra Mishra.
Characterization of Mucoadhesive Ciprofloxacin
Suspensions by Fourier Transform Infrared
Spectroscopy. International Journal of Pharmaceutical
Sciences Review and Research. 11(2): 122-128 (2011).
5.Subashree Sahoo, Chandra Kanti Chakraborti,
Subash Chandra Mishra, Sharmistha Naik. Analytical
Characterization of a Gelling Biodegradable Polymer.
Drug Invention Today. 3(6): 78-82.
6.K Srinivasa Rao, Jadhav Sunita, Patil Prakash B.V.
Dattatraya. Development and Evaluation of
Sustained Release Formulations of Venlafaxine
Hydrochloride. International Journal of Research in
Ayurveda and Pharmacy. 2(3):948-96 (2011).
7.Sharma R, Parikh RK, Gohel MC, Soniwala MM.
Development of taste masked film of valdecoxib for
oral use. Ind J Pharm Sci. 2007:320-23
8.Yoo J, Dharmala K, Lee CH. The Physiodynamic
properties of mucoadhesive polymeric films
developed as female controlled drug delivery system.
Int J Pharm. 2006; 309:139-45.
9.Tanwar YS, Chauhan CS, Sharma A. Development
and evaluation of carvedilol transdermal patches.
Acta Pharm. 2007; 57:151-59.
10.Dhere P. M. Patwekar S. L. Review on Preparation
and Evaluation of Oral Disintegrating Films.
International Journal of Pharmacy and Technology.
1572-1582. (2011).
11.Pradeep H. K., (2010); Design and In vitro
Evaluation of Mouth Dissolving Tablets of
Venlafaxine Hydrochloride; Mpharm Thesis; Rajiv
Gandhi university of health sciences at Bangalore.
12.Subhashre Sahoo, Chandra Kanti Chakraborti,
Pradipta Kumar Behera, Subash Chandra Mishra.
Characterization of Mucoadhesive Ciprofloxacin
Suspensions by Fourier Transform Infrared
Spectroscopy. International Journal of Pharmaceutical
Sciences Review and Research. 11(2): 122-128 (2011).
![CODEN [USA]: IAJPBB ISSN: 2349-7750 INNDDOO AAMMEER ...](https://static.fdocuments.pl/doc/165x107/619847d4ba8d4e373f7d46ec/coden-usa-iajpbb-issn-2349-7750-innddoo-aammeer-.jpg)

![v v - RIDwater.rid.go.th/hydhome/ma/60/7750.pdf · -l!l - (m.l!l .ID) mru~'\.J.fl11~1 f1C] (Jltt~'J tL~hJ~L~ EJ\l'lJ fl\l ~ C'l 1'\.JYW 'l'U 'lfl'lJtJ\lVl'l'l 'i'l'l!n'l'i~'U~'lV](https://static.fdocuments.pl/doc/165x107/5f06925a7e708231d418a6e3/v-v-ll-mll-id-mrujfl111-f1c-jlttj-tlhjl-ejllj-fll-cl.jpg)