
BIS Repo Paper
17
Peter Hördahl +41 61 280 8434 [email protected] Michael R King +41 61 280 8252 [email protected] Developments in repo markets during the financial turmoil 1 As the financial crisis deepened and unsecured interbank markets effectively shut down, repo market activity became increasingly concentrated in the very shortest maturities and against the highest-quality collateral. Repo rates for US Treasury collateral fell relative to overnight index swap rates, while comparable sovereign repo rates in the euro area and the United Kingdom rose. The different dynamics across markets reflected, among other things, differences in the intensity of market disruptions and the extent of the scarcity of sovereign collateral. JEL classification: E43, E58, G12. Repo markets are a vital source of secured financing for banks and financial institutions, and a key tool for the implementation of monetary policy. A repo, or sale and repurchase agreement, is a sale of a security coupled with an agreement to repurchase the same security at a specified price at the end of the contract. 2 Repo markets have doubled in size since 2002, with gross amounts outstanding at year-end 2007 of roughly $10 trillion in each of the US and euro repo markets, and another $1 trillion in the UK repo market. This article reviews recent developments in this critical component of the global financial system, with particular focus on the period since the start of the financial turmoil in mid-2007. Despite the presence of collateral, repo markets were quickly affected by the turmoil. Concerns about the creditworthiness of counterparties and the ability to realise the value of the collateral in a sale meant that repo transactions were increasingly restricted to short maturities and against only the highest-quality securities. As financing in unsecured markets became more 1 The views expressed in this article are those of the authors and do not necessarily reflect those of the BIS. The authors would like to thank Claudio Borio, Stephen Cecchetti, Robert McCauley, François-Louis Michaud, Frank Packer, Eli Remolona and Roland Sehmke of the BIS as well as Joseph Abate, Martin Daines, Godfried de Vidts, Romain Dumas, Michael Fleming, Ralph Lehnis, Paul Mercier, Andrew Moorhouse, Larry Servidio and Markus Sunitsch for very useful comments and discussions. We also wish to thank the ECB, the European Repo Council, Eurex Repo, ICAP and the Federal Reserve Bank of New York for providing data. Gert Schnabel and Garry Tang provided excellent research assistance. 2 A repo seen from the point of view of the cash lender is called a reverse repo. The difference between the sale price and the repurchase price is the interest rate, known as the repo rate. BIS Quarterly Review, December 2008 37
-
Upload
srbaberdeen -
Category
Documents
-
view
233 -
download
0
Transcript of BIS Repo Paper

8/7/2019 BIS Repo Paper
http://slidepdf.com/reader/full/bis-repo-paper 1/17
Peter Hördahl
+41 61 280 8434 [email protected]
Michael R King
+41 61 280 8252 [email protected]
Developments in repo markets during the financialturmoil1
As the financial crisis deepened and unsecured interbank markets effectively shut
down, repo market activity became increasingly concentrated in the very shortest
maturities and against the highest-quality collateral. Repo rates for US Treasury
collateral fell relative to overnight index swap rates, while comparable sovereign repo
rates in the euro area and the United Kingdom rose. The different dynamics across
markets reflected, among other things, differences in the intensity of market disruptions
and the extent of the scarcity of sovereign collateral.
JEL classification: E43, E58, G12.
Repo markets are a vital source of secured financing for banks and financial
institutions, and a key tool for the implementation of monetary policy. A repo, or
sale and repurchase agreement, is a sale of a security coupled with anagreement to repurchase the same security at a specified price at the end of
the contract.2
Repo markets have doubled in size since 2002, with gross
amounts outstanding at year-end 2007 of roughly $10 trillion in each of the US
and euro repo markets, and another $1 trillion in the UK repo market. This
article reviews recent developments in this critical component of the global
financial system, with particular focus on the period since the start of the
financial turmoil in mid-2007.
Despite the presence of collateral, repo markets were quickly affected by
the turmoil. Concerns about the creditworthiness of counterparties and the
ability to realise the value of the collateral in a sale meant that repotransactions were increasingly restricted to short maturities and against only
the highest-quality securities. As financing in unsecured markets became more
1The views expressed in this article are those of the authors and do not necessarily reflect
those of the BIS. The authors would like to thank Claudio Borio, Stephen Cecchetti, Robert
McCauley, François-Louis Michaud, Frank Packer, Eli Remolona and Roland Sehmke of the
BIS as well as Joseph Abate, Martin Daines, Godfried de Vidts, Romain Dumas, Michael
Fleming, Ralph Lehnis, Paul Mercier, Andrew Moorhouse, Larry Servidio and Markus Sunitsch
for very useful comments and discussions. We also wish to thank the ECB, the European
Repo Council, Eurex Repo, ICAP and the Federal Reserve Bank of New York for providing
data. Gert Schnabel and Garry Tang provided excellent research assistance.
2A repo seen from the point of view of the cash lender is called a reverse repo. The difference
between the sale price and the repurchase price is the interest rate, known as the repo rate.
BIS Quarterly Review, December 2008 37

8/7/2019 BIS Repo Paper
http://slidepdf.com/reader/full/bis-repo-paper 2/17
expensive or unavailable, financial institutions with funding requirements bid
more aggressively in repo markets to secure financing.3
Meanwhile, traditional
repo investors that lend cash pulled back from the market, reducing the
quantity of financing available. At the same time, the flight to government
securities and the hoarding of US Treasuries by investors led to a generalscarcity of top-quality collateral, with repo rates for US Treasury securities
falling to levels close to zero. Overall, the US repo market experienced
significantly more disruptions than either the euro area or the UK repo market.
This article proceeds as follows. The first section describes key features of
the US, euro area and UK repo markets. The second section discusses various
risks in repo transactions. The third section briefly describes conditions in repo
markets as the crisis progressed, while the fourth highlights key differences in
US and European repo markets during the crisis. The fifth section describes
central bank actions relevant for repo markets and their impact on market
dynamics. The final section discusses some longer-term implications from thecrisis.
Key features of the US, euro area and UK repo markets
Conceptually, a repo can be viewed as a form of collateralised loan, where a
security lender posts a security as collateral with a cash provider. A typical
repo therefore leads to an outflow of collateral and an inflow of cash, while a
reverse repo leads to an inflow of collateral and an outflow of cash.4
Repos
are either cash-driven or securities-driven. A cash-driven repo is motivated by
the desire to raise short-term funding, from overnight up to one year inmaturity. When a repo is driven by the desire to borrow a specific security, the
repo is known as a “special”.
Bond repo markets developed at different points in time in the G10
countries – in the 1920s in the United States, the 1970s in continental Europe
and the 1990s in the United Kingdom. In most cases, their use was promoted
by monetary authorities, which used them as a monetary policy tool and a
means to increase the depth, liquidity and price efficiency of markets (BIS
(1999)). Repo markets are used actively by a variety of actors. Banks and
dealers use repos to finance inventories, to cover short positions, to create
leverage and to hedge or speculate on interest rate movements. Investors suchas mutual funds, pension funds, insurance companies and corporate treasurers
use repo markets to invest surplus cash, to earn incremental returns on their
portfolios or to raise cash for investment.
Like other over-the-counter markets, repo markets are large but relatively
opaque. In the United States, regulatory reports provide an indication of gross
amounts outstanding, but little to no data are available on maturities,
Repos can be
seen as a form of
collateralised loan
Repo markets are
large but opaque
3Financial institutions also turned to foreign markets to raise unsecured funds via foreign
exchange swaps and cross-currency swaps (Baba et al (2008)).
4Central banks, by contrast, view such transactions from the point of view of their bank/dealer
counterparties, with repos temporarily adding reserve balances to the banking system while
reverse repos temporarily drain balances from the system.
38 BIS Quarterly Review, December 2008

8/7/2019 BIS Repo Paper
http://slidepdf.com/reader/full/bis-repo-paper 3/17
composition of collateral or turnover. Data reported by 19 primary dealers5
and
around 1,000 bank holding companies suggest that by mid-2008 the gross
market capitalisation of the US repo market exceeded $10 trillion (including
double-counting of repos and reverse repos), corresponding to around 70% of
US GDP (Graph 1).
6
The primary dealers are the most active participants, anduse repos to finance much of the growth of their balance sheets, creating
procyclical leverage and an exposure to refinancing risk (Adrian and Shin
(2008)). In particular, the (former) top US investment banks funded roughly half
of their assets using repo markets, with additional exposure due to off-balance
sheet financing of their customers. While the US repo market is dominated by
trading in US Treasuries, there are also active markets in bonds issued by US
government-sponsored agencies (agencies), agency mortgage-backed
securities (MBS) and corporate bonds. Market participants suggest that, prior
to the crisis, non-government collateral contributed significantly to the rapid
growth of the US repo market.
Repo markets have
grown rapidly in the
United States …
A more complete picture is available for the euro area repo market based
on data collected by the ECB and the European Repo Council. The euro area
repo market has also grown sharply, more than doubling in size over the past
six years to reach €6 trillion outstanding (or around 65% of euro area GDP).
Two thirds of the collateral is central government bonds from euro area
countries, 16% from other euro area entities and 12% from other OECD
countries. In terms of country of issuance, German collateral makes up one
quarter of the market, followed by Italian at 13%, French at 11% and other euro
area at 15%. Whereas there are more than 7,500 banking participants, activity
5Primary dealers are banks and broker-dealers that may trade in US government securities
directly with the Federal Reserve Bank of New York.
6
This market capitalisation amount (as well as those mentioned for the euro area and theUnited Kingdom below) includes a large degree of double-counting, as repos between
reporting institutions are included in the totals for repos and for reverse repos. As a result, the
figures are likely to overstate the true repo volumes by roughly a factor of two.
Repo markets, amount outstandingIn billions of national currency units
United States1 Euro area United Kingdom
0
3,000
6,000
9,000
12,000
2002 2004 2006 2008
BHC repos
BHC reverse repos
PD repos
PD reverse repos
0
1,500
3,000
4,500
6,000
2002 2004 2006 2008
Repos
Reverserepos
0
150
300
450
600
2002 2004 2006 2008
Repos
Reverserepos
1 BHC = bank holding companies; PD = US primary dealers.
Sources: Bank of England; Federal Reserve Bank of New York; ICMA, European Repo Market Survey . Graph 1
… and in the euro
area as well
BIS Quarterly Review, December 2008 39
8/7/2019 BIS Repo Paper
http://slidepdf.com/reader/full/bis-repo-paper 4/17
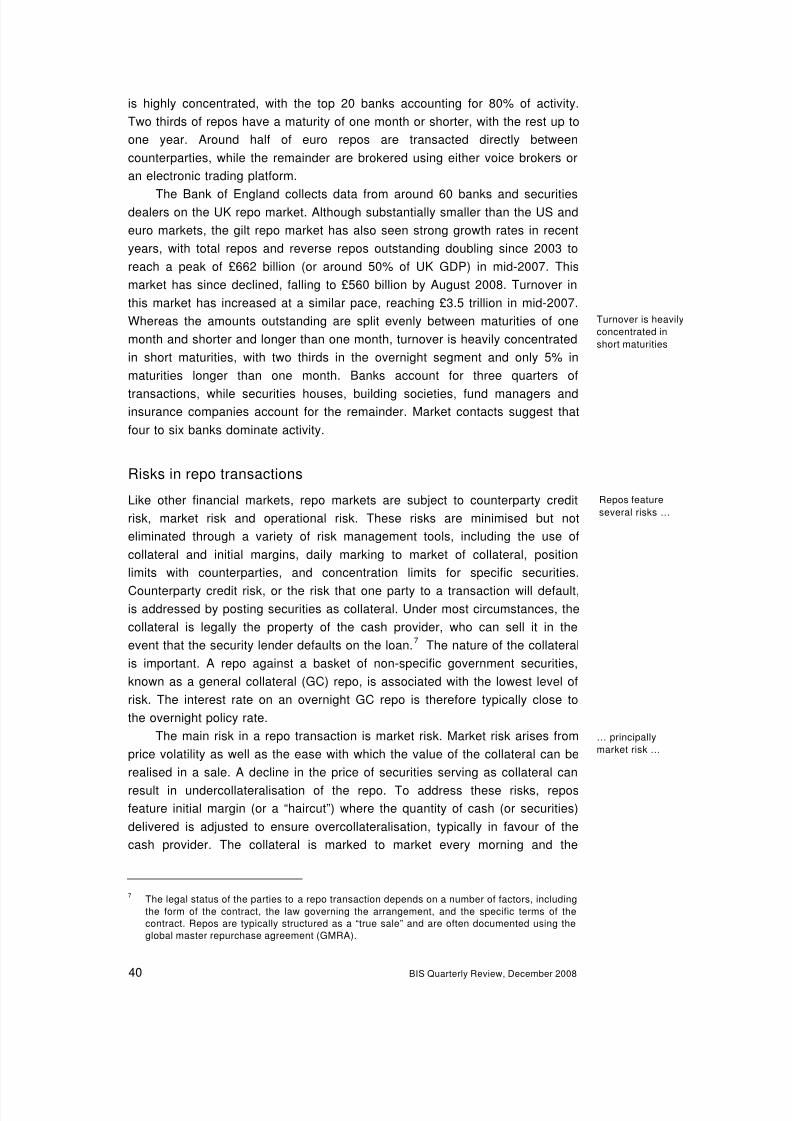
is highly concentrated, with the top 20 banks accounting for 80% of activity.
Two thirds of repos have a maturity of one month or shorter, with the rest up to
one year. Around half of euro repos are transacted directly between
counterparties, while the remainder are brokered using either voice brokers or
an electronic trading platform.The Bank of England collects data from around 60 banks and securities
dealers on the UK repo market. Although substantially smaller than the US and
euro markets, the gilt repo market has also seen strong growth rates in recent
years, with total repos and reverse repos outstanding doubling since 2003 to
reach a peak of £662 billion (or around 50% of UK GDP) in mid-2007. This
market has since declined, falling to £560 billion by August 2008. Turnover in
this market has increased at a similar pace, reaching £3.5 trillion in mid-2007.
Whereas the amounts outstanding are split evenly between maturities of one
month and shorter and longer than one month, turnover is heavily concentrated
in short maturities, with two thirds in the overnight segment and only 5% inmaturities longer than one month. Banks account for three quarters of
transactions, while securities houses, building societies, fund managers and
insurance companies account for the remainder. Market contacts suggest that
four to six banks dominate activity.
Turnover is heavily
concentrated in
short maturities
Risks in repo transactions
Like other financial markets, repo markets are subject to counterparty credit
risk, market risk and operational risk. These risks are minimised but not
eliminated through a variety of risk management tools, including the use ofcollateral and initial margins, daily marking to market of collateral, position
limits with counterparties, and concentration limits for specific securities.
Counterparty credit risk, or the risk that one party to a transaction will default,
is addressed by posting securities as collateral. Under most circumstances, the
collateral is legally the property of the cash provider, who can sell it in the
event that the security lender defaults on the loan.7
The nature of the collateral
is important. A repo against a basket of non-specific government securities,
known as a general collateral (GC) repo, is associated with the lowest level of
risk. The interest rate on an overnight GC repo is therefore typically close to
the overnight policy rate.
Repos feature
several risks …
The main risk in a repo transaction is market risk. Market risk arises from
price volatility as well as the ease with which the value of the collateral can be
realised in a sale. A decline in the price of securities serving as collateral can
result in undercollateralisation of the repo. To address these risks, repos
feature initial margin (or a “haircut”) where the quantity of cash (or securities)
delivered is adjusted to ensure overcollateralisation, typically in favour of the
cash provider. The collateral is marked to market every morning and the
… principally
market risk …
7
The legal status of the parties to a repo transaction depends on a number of factors, includingthe form of the contract, the law governing the arrangement, and the specific terms of the
contract. Repos are typically structured as a “true sale” and are often documented using the
global master repurchase agreement (GMRA).
40 BIS Quarterly Review, December 2008
8/7/2019 BIS Repo Paper
http://slidepdf.com/reader/full/bis-repo-paper 5/17
margin updated based on the closing price from the night before. The size of
the haircut reflects the market risk of the collateral, with longer-maturity bonds
and lower-rated securities requiring higher margin due to their higher price
volatility.8
Repo markets feature operational risks related to the transfer andmanagement of the collateral. Settlement is typically delivery versus payment
(DVP), where cash is delivered against receipt of the collateral. Either party to
a repo may fail to deliver. A “fail” to deliver a security is a situation in which a
trade involving a security does not settle on schedule. Such a fail is not treated
as a contractual default in the repo market (Fleming and Garbade (2005)).
Instead, the failing security provider can make delivery the next day at the
unchanged invoice price. The security provider is exposed to movements in the
price of the securities, and loses the interest they could have earned by
investing the cash overnight.
… and operationalrisks
Another operational risk relates to who holds the collateral. There arethree types of repo, each with different benefits and costs that are reflected in
the repo rate and the haircut: bilateral repo, triparty repo and hold-in-custody
repo. In a bilateral repo, the collateral is held on the balance sheet of the cash
provider, granting immediate access in the event of default on the loan. In a
triparty repo, an agent stands between the security lender and cash provider
and physically controls the securities offered as collateral. The original
counterparties remain as principals to the transaction, but the agent – typically
a custodial bank – manages the collateral, making substitutions when
necessary, monitoring risk and collecting payments. Legal title to the collateral
remains with the cash provider in case of default.9
In a hold-in-custody repo,the security lender continues to hold the bond on their own balance sheet in a
segregated account, raising the risk to the cash provider.
The risks mentioned are reflected in the interest rate at which a repo
transaction is agreed. Repo transactions involving riskier types of collateral
typically offer higher repo rates than for GC collateral. There are other factors
that can significantly affect repo rates. In the special repo market, high demand
for a particular security can exert substantial downward pressure on repo rates
for transactions involving that security, as it becomes increasingly scarce. In
other words, cash providers will accept a lower return on their cash in cases
where they need to borrow a specific security, for example to be able to covera short position. In times of severe market turbulence, surging demand for safe
Risks affect repo
rates …
… as does scarcity
of collateral
8Under Basel II, the standard supervisory haircut for a repo transaction is 0.5% for sovereign
bonds with a residual maturity of less than one year, 2% for those with a residual maturity
from one to five years, and 4% for longer-maturity issues. The comparable haircuts for non-
sovereign bonds rated AA– or higher are 1%, 4% and 8%. For more complex instruments, a
market rule of thumb has been to set the haircut at one minus the price, ie a security valued at
70 cents would have a haircut of 30%.
9
A related form of repo involves a central counterparty (CCP), which is a type of clearing housethat sits in the middle of a trade and guarantees delivery. The CCP assumes the counterparty
risk if one side fails to deliver, and requires adequate margin from both sides at all times. The
CCP is supported by its own capital base and capital paid in by member institutions.
BIS Quarterly Review, December 2008 41

8/7/2019 BIS Repo Paper
http://slidepdf.com/reader/full/bis-repo-paper 6/17
government securities and a general unwillingness to repo them out can result
in similar downward pressure on rates for the GC repo market as a whole.
Conditions in repo markets during the crisis
This section briefly highlights developments in repo markets during the crisis,
while key changes and central bank actions are examined in subsequent
sections.10
To better understand how repo markets were affected by the crisis,
it is useful to take a look at conditions before the outbreak of the turmoil. We
focus on developments in GC repo rates relative to overnight index swap (OIS)
rates, which provide a near risk-free benchmark.11
Prior to mid-2007, GC repo
rates were on average 5–10 basis points below comparable OIS rates in the
United States, and only 1–2 basis points below them in the euro area and the
United Kingdom. The lower GC repo rate is due to the presence of collateral as
well as the larger market size and greater participation in repo transactionsrelative to OIS. Repos using lower-rated or less liquid collateral, such as US
agencies or MBS, typically required somewhat higher interest rates, around
1–2 basis points below OIS rates on average.
Mid-2007 to February 2008: the crisis unfolds
Starting in mid-2007, heightened concerns about counterparty credit risk and
surging demand for liquidity led to significant disruptions in credit and money
markets. Sharp swings in asset prices resulted in greater uncertainty about the
value of collateral, particularly hard-to-value and less liquid collateral. As a
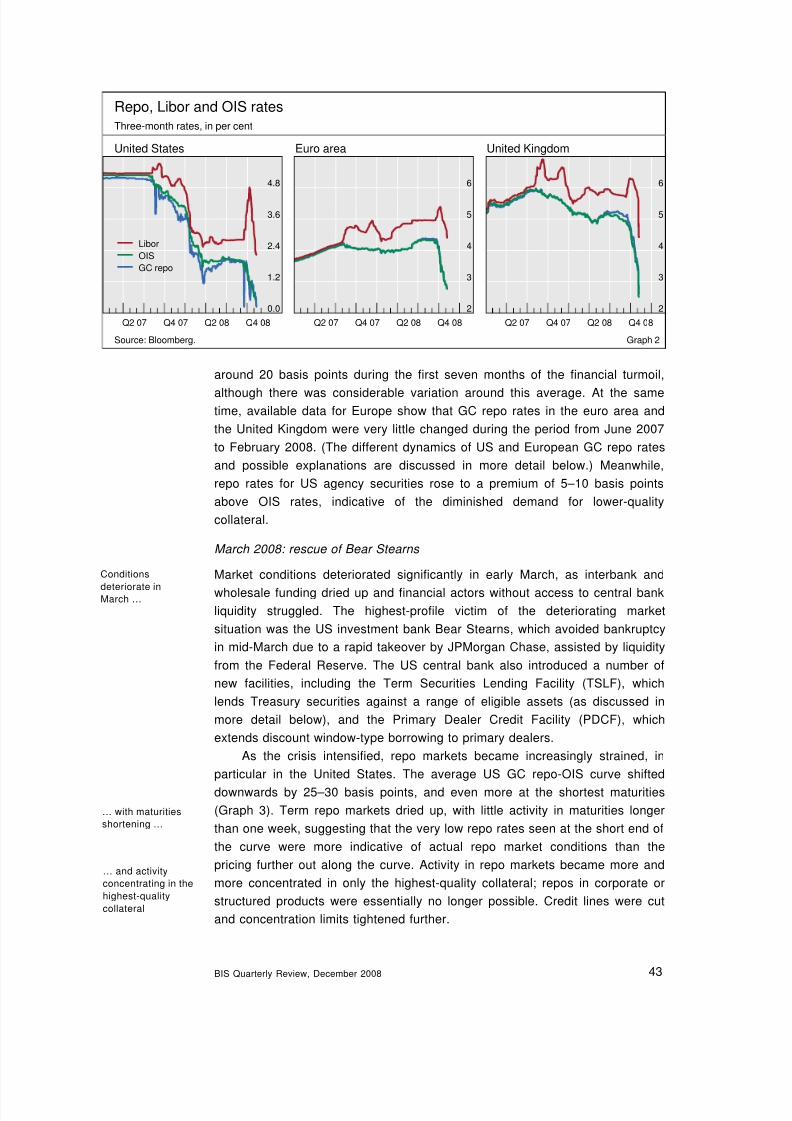
result, repo markets quickly began to show signs of stress, although the impacton repo rates was less pronounced than for unsecured Libor rates, which
widened significantly relative to OIS rates (Michaud and Upper (2008))
(Graph 2). The US repo market in particular appeared to be undergoing stress
over this period, while the pricing in euro area and UK markets signalled
calmer conditions. In the United States, repo rates became substantially more
volatile and it became problematic to obtain funds at maturities longer than one
month. Collateral profiles became more conservative and margin requirements
rose. GC repo rates began to fall vis-à-vis OIS rates of comparable maturity,
reflecting increased demand for safe government securities. By contrast, repo
rates for riskier types of collateral rose as the appetite for holding anything butthe highest-quality collateral dropped.
Like OIS, repo rates
reflect minimal
risks …
… but have been
affected by the
onset of theturmoil …
… with US GC repo
rates falling relative
to OIS
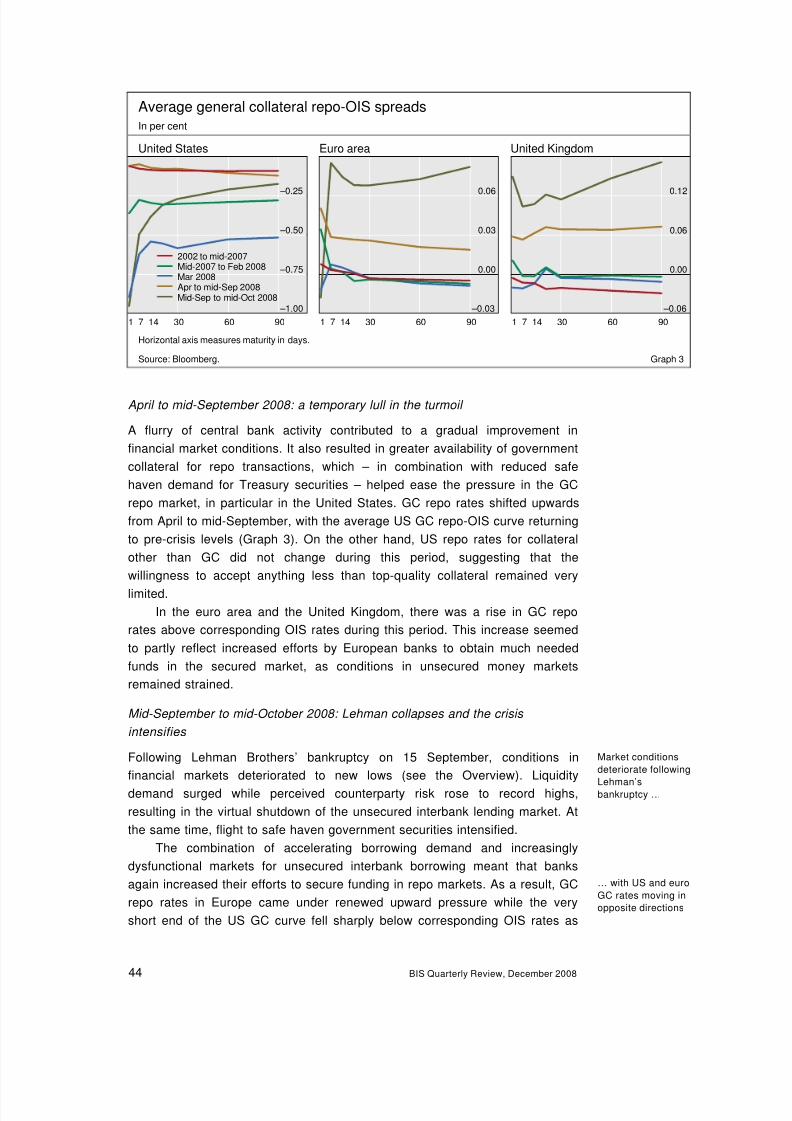
Average repo-OIS spreads over this period paint a similar picture across a
spectrum of maturities (Graph 3). US GC repo rates, which had been
5–10 basis points below OIS rates before mid-2007, shifted downwards by
10This section has benefited from the study by Bearing Point (2008).
11In an OIS, a fixed short-term interest rate is exchanged for the average overnight interest rate
during the maturity of the swap. OIS contracts provide a useful benchmark because, in
contrast to unsecured interbank rates, they are considered nearly free of credit risk and havebeen little affected by the surge in counterparty credit risk and liquidity demand seen since the
outbreak of the turmoil. This is due to the fact that OIS contracts require no payment upfront,
but are settled on a net basis at maturity.
42 BIS Quarterly Review, December 2008
8/7/2019 BIS Repo Paper
http://slidepdf.com/reader/full/bis-repo-paper 7/17
Repo, Libor and OIS ratesThree-month rates, in per cent
United States Euro area United Kingdom
2
3
4
5
6
Q2 07 Q4 07 Q2 08 Q4 08
4.8
2
3
4
5
6
3.6
Libor
OIS
GC repo
2.4
1.2
0.0
Q2 07 Q4 07 Q2 08 Q4 08 Q2 07 Q4 07 Q2 08 Q4 08
Source: Bloomberg. Graph 2
around 20 basis points during the first seven months of the financial turmoil,
although there was considerable variation around this average. At the same
time, available data for Europe show that GC repo rates in the euro area and
the United Kingdom were very little changed during the period from June 2007
to February 2008. (The different dynamics of US and European GC repo rates
and possible explanations are discussed in more detail below.) Meanwhile,
repo rates for US agency securities rose to a premium of 5–10 basis points
above OIS rates, indicative of the diminished demand for lower-quality
collateral.
March 2008: rescue of Bear Stearns
Market conditions deteriorated significantly in early March, as interbank and
wholesale funding dried up and financial actors without access to central bank
liquidity struggled. The highest-profile victim of the deteriorating market
situation was the US investment bank Bear Stearns, which avoided bankruptcy
in mid-March due to a rapid takeover by JPMorgan Chase, assisted by liquidity
from the Federal Reserve. The US central bank also introduced a number of
new facilities, including the Term Securities Lending Facility (TSLF), which
lends Treasury securities against a range of eligible assets (as discussed in
more detail below), and the Primary Dealer Credit Facility (PDCF), whichextends discount window-type borrowing to primary dealers.
As the crisis intensified, repo markets became increasingly strained, in
particular in the United States. The average US GC repo-OIS curve shifted
downwards by 25–30 basis points, and even more at the shortest maturities
(Graph 3). Term repo markets dried up, with little activity in maturities longer
than one week, suggesting that the very low repo rates seen at the short end of
the curve were more indicative of actual repo market conditions than the
pricing further out along the curve. Activity in repo markets became more and
more concentrated in only the highest-quality collateral; repos in corporate or
structured products were essentially no longer possible. Credit lines were cutand concentration limits tightened further.
Conditions
deteriorate in
March …
… with maturities
shortening …
… and activity
concentrating in the
highest-quality
collateral
BIS Quarterly Review, December 2008 43
8/7/2019 BIS Repo Paper
http://slidepdf.com/reader/full/bis-repo-paper 8/17
Average general collateral repo-OIS spreads
In per cent
United States Euro area United Kingdom
–0.03
0.00
0.03
0.06
1 7 14 30 60 90
–1.00
–0.75
–0.50
–0.25 0.1
0.06
April to mid-September 2008: a temporary lull in the turmoil
A flurry of central bank activity contributed to a gradual improvement in
financial market conditions. It also resulted in greater availability of government
collateral for repo transactions, which – in combination with reduced safe
haven demand for Treasury securities – helped ease the pressure in the GC
repo market, in particular in the United States. GC repo rates shifted upwards
from April to mid-September, with the average US GC repo-OIS curve returning
to pre-crisis levels (Graph 3). On the other hand, US repo rates for collateralother than GC did not change during this period, suggesting that the
willingness to accept anything less than top-quality collateral remained very
limited.
In the euro area and the United Kingdom, there was a rise in GC repo
rates above corresponding OIS rates during this period. This increase seemed
to partly reflect increased efforts by European banks to obtain much needed
funds in the secured market, as conditions in unsecured money markets
remained strained.
Mid-September to mid-October 2008: Lehman collapses and the crisis
intensifies
Following Lehman Brothers’ bankruptcy on 15 September, conditions in
financial markets deteriorated to new lows (see the Overview). Liquidity
demand surged while perceived counterparty risk rose to record highs,
resulting in the virtual shutdown of the unsecured interbank lending market. At
the same time, flight to safe haven government securities intensified.
The combination of accelerating borrowing demand and increasingly
dysfunctional markets for unsecured interbank borrowing meant that banks
again increased their efforts to secure funding in repo markets. As a result, GC
repo rates in Europe came under renewed upward pressure while the veryshort end of the US GC curve fell sharply below corresponding OIS rates as
1 7 14 30 60 90
2002 to mid-2007Mid-2007 to Feb 2008Mar 2008Apr to mid-Sep 2008Mid-Sep to mid-Oct 2008
0.00
–0.06
2
1 7 14 30 60 90 Horizontal axis measures maturity in days.
Source: Bloomberg. Graph 3
Market conditions
deteriorate following
Lehman’s
bankruptcy …
… with US and euro
GC rates moving in
opposite directions
44 BIS Quarterly Review, December 2008

8/7/2019 BIS Repo Paper
http://slidepdf.com/reader/full/bis-repo-paper 9/17
investors piled into Treasuries and became extremely unwilling to repo them
out (Graph 3).
Mid-October 2008 onwards: tensions ease as governments step in
With increased liquidity provision by central banks and government interventionto recapitalise banks in the United States and Europe, strains in money
markets began to ease. Repo markets also saw improving conditions, with
longer terms becoming available and turnover rising. Repo rates for sovereign
collateral began to normalise, and traditional cash providers slowly returned to
the market.
Market tensionsease in October
Key differences between US and European repo markets during
the crisis
A key feature during the financial crisis has been the very different patternsseen in US repo markets relative to those in Europe. As described above,
spreads between GC repo and OIS rates were initially very little affected in the
euro area and the United Kingdom, and subsequently moved in the opposite
direction to US spreads as the crisis progressed. By September, the entire US
GC repo market was trading at rates associated with special collateral, while
GC repo rates in Europe had risen above OIS. This divergence is highlighted in
Graph 4, which shows daily movements in GC repo-OIS spreads at the
three-month term for the three markets. Another difference, also seen in
Graph 4, is the substantially higher volatility of US repo spreads. The different
dynamics in Europe compared to the United States may be due to acombination of factors, including: differences in the type of participants;
differing central bank actions and operating procedures; the relative availability
of sovereign collateral; and the way that available euro area GC rates are
calculated. These factors are discussed in this section.
Movements in repo rates and commentary from market participants
suggest that the disruptions to the US repo market were significantly more
severe than in Europe. A key factor behind this seems to have been the
Repo spreads
Three-month maturity, in percentage points
GC repo-OIS GC repo-OIS Spreads to US GC
–1.5
–1.0
–0.5
0.0
Q2 07 Q4 07 Q2 08 Q4 08
United States
–0.30
–0.15
0.00
0.15
Q2 07 Q4 07 Q2 08 Q4 08
Euro area
United Kingdom
–0.75
0.00
0.75
1.50
Q2 07 Q4 07 Q2 08 Q4 08
Agency
MBS
Source: Bloomberg. Graph 4
Particularly strained
conditions in the US
repo market …
BIS Quarterly Review, December 2008 45

8/7/2019 BIS Repo Paper
http://slidepdf.com/reader/full/bis-repo-paper 10/17
dominance in the US repo market of investment banks, whose business model
included taking highly leveraged positions that, to a large extent, were financed
in repo markets. Before the outbreak of the turmoil, the United States featured
an active repo market for structured securities, such as private label MBS and
collateralised debt obligations, as well as lower-rated collateral, such as high-yield bonds. As a result, investment banks with large portfolios of structured
products are reported to have financed up to half their total assets in the repo
market, particularly the triparty repo market.
The triparty repo market facilitated the financing of these securities in
three principal ways. First, it facilitated the pledging of collateral by matching
cash lenders with security providers. Second, it increased participation in the
US repo markets, providing a cost-effective means for non-specialist
institutions that lacked the necessary infrastructure to engage in repo markets.
A number of smaller players joined the US repo markets from 2006 onwards,
but these marginal players quickly exited the market as the turmoil increasedtowards the end of 2007. Third, triparty repo reduced counterparty risk, by
requiring both parties to a repo transaction to post and maintain adequate
margin with the triparty agent.
… seem to be due
to the leveraged
activity of US
investment
banks …
By March 2008, however, the financial turmoil reached a point where
heightened risk aversion coupled with uncertainty over valuations of particularly
risky products led participants in the repo market to abruptly stop accepting
anything other than Treasury and agency collateral. As a result, investment
banks such as Bear Stearns suddenly found themselves short of funding, as a
large part of their collateral pool was no longer accepted by the US repo
market. This change led to a sharp increase in the demand for governmentsecurities for repo transactions, which was compounded by significantly higher
safe haven demand for US Treasuries and the increased unwillingness to lend
such securities in repo transactions. As the crisis unfolded, this combination
resulted in US government collateral becoming extremely scarce. As the
available supply of Treasury collateral dropped, those market participants
willing to lend out Treasuries were able to borrow cash at increasingly cheap
rates. At times, this effect pushed US GC repo rates down to levels only a few
basis points above zero.12
… which are
suddenly able to
use only GC for
funding …
… contributing to
the extreme scarcity
of US government
securities …
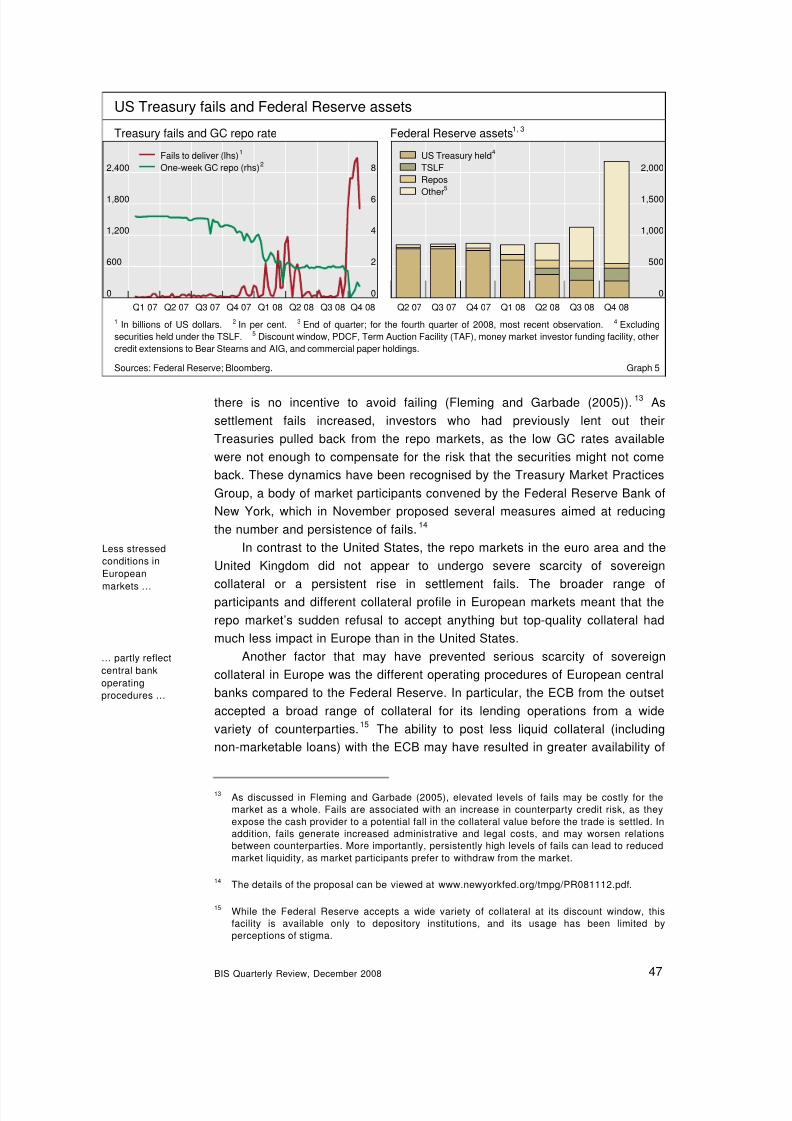
The scarcity of US Treasuries for repo transactions also manifested itself
in a sharp increase in the number of Treasury settlement fails. Whereas fails todeliver Treasuries had averaged around $90 billion per week during the two
years preceding the crisis, they rose to above $1 trillion during the Bear
Stearns episode and then soared to record highs of almost $2.7 trillion
following the Lehman default (Graph 5). The extraordinarily low GC repo rates
during this period exacerbated the problem by reducing the cost of failing.
Normally, the failing party would borrow the necessary security through a
reverse repo to avoid failing. But when repo rates are close to zero, the interest
rate earned overnight is below the cost to borrow the required securities, so
… and soaringTreasury fails
12The low GC repo rates have not responded to the reopening of key benchmark maturities in
recent Treasury auctions, the potential for greater supply in the future, or the decision to allow
the Federal Reserve to pay interest on deposits.
46 BIS Quarterly Review, December 2008
8/7/2019 BIS Repo Paper
http://slidepdf.com/reader/full/bis-repo-paper 11/17
US Treasury fails and Federal Reserve assets
Federal Reserve assets1, 3 Treasury fails and GC repo rate
there is no incentive to avoid failing (Fleming and Garbade (2005)).13
As
settlement fails increased, investors who had previously lent out their
Treasuries pulled back from the repo markets, as the low GC rates available
were not enough to compensate for the risk that the securities might not come
back. These dynamics have been recognised by the Treasury Market Practices
Group, a body of market participants convened by the Federal Reserve Bank of
New York, which in November proposed several measures aimed at reducing
the number and persistence of fails.14
In contrast to the United States, the repo markets in the euro area and the
United Kingdom did not appear to undergo severe scarcity of sovereign
collateral or a persistent rise in settlement fails. The broader range of
participants and different collateral profile in European markets meant that the
repo market’s sudden refusal to accept anything but top-quality collateral had
much less impact in Europe than in the United States.
Another factor that may have prevented serious scarcity of sovereign
collateral in Europe was the different operating procedures of European central
banks compared to the Federal Reserve. In particular, the ECB from the outset
accepted a broad range of collateral for its lending operations from a wide
variety of counterparties.15 The ability to post less liquid collateral (including
non-marketable loans) with the ECB may have resulted in greater availability of
13As discussed in Fleming and Garbade (2005), elevated levels of fails may be costly for the
market as a whole. Fails are associated with an increase in counterparty credit risk, as they
expose the cash provider to a potential fall in the collateral value before the trade is settled. In
addition, fails generate increased administrative and legal costs, and may worsen relations
between counterparties. More importantly, persistently high levels of fails can lead to reduced
market liquidity, as market participants prefer to withdraw from the market.
14The details of the proposal can be viewed at www.newyorkfed.org/tmpg/PR081112.pdf.
15While the Federal Reserve accepts a wide variety of collateral at its discount window, this
facility is available only to depository institutions, and its usage has been limited by
perceptions of stigma.
0
600
1,200
1,800
2,400
0
2
4
6
8
Q1 07 Q2 07 Q3 07 Q4 07 Q1 08 Q2 08 Q3 08 Q4 08
Fails to deliver (lhs)1
One-week GC repo (rhs)2
US Treasury held4
TSLF
ReposOther
5
2,000
1,500
1,000
500
0
Q2 07 Q3 07 Q4 07 Q1 08 Q2 08 Q3 08 Q4 08
1 In billions of US dollars. 2 In per cent. 3 End of quarter; for the fourth quarter of 2008, most recent observation. 4 Excluding
securities held under the TSLF. 5 Discount window, PDCF, Term Auction Facility (TAF), money market investor funding facility, other
credit extensions to Bear Stearns and AIG, and commercial paper holdings.
Sources: Federal Reserve; Bloomberg. Graph 5
Less stressed
conditions in
European
markets …
… partly reflect
central bank
operating
procedures …
BIS Quarterly Review, December 2008 47
8/7/2019 BIS Repo Paper
http://slidepdf.com/reader/full/bis-repo-paper 12/17
government securities for repo transactions among banks in the euro area
relative to the United States.16
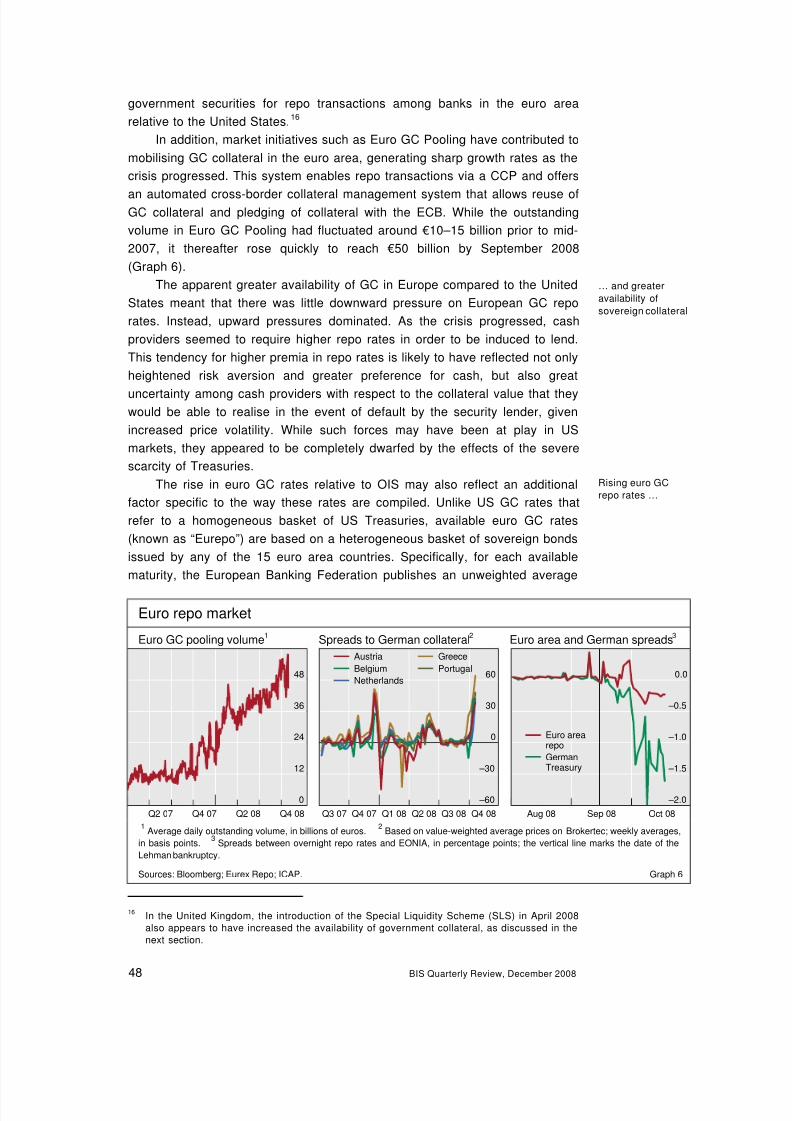
In addition, market initiatives such as Euro GC Pooling have contributed to
mobilising GC collateral in the euro area, generating sharp growth rates as the
crisis progressed. This system enables repo transactions via a CCP and offersan automated cross-border collateral management system that allows reuse of
GC collateral and pledging of collateral with the ECB. While the outstanding
volume in Euro GC Pooling had fluctuated around €10–15 billion prior to mid-
2007, it thereafter rose quickly to reach €50 billion by September 2008
(Graph 6).
The apparent greater availability of GC in Europe compared to the United
States meant that there was little downward pressure on European GC repo
rates. Instead, upward pressures dominated. As the crisis progressed, cash
providers seemed to require higher repo rates in order to be induced to lend.
This tendency for higher premia in repo rates is likely to have reflected not onlyheightened risk aversion and greater preference for cash, but also great
uncertainty among cash providers with respect to the collateral value that they
would be able to realise in the event of default by the security lender, given
increased price volatility. While such forces may have been at play in US
markets, they appeared to be completely dwarfed by the effects of the severe
scarcity of Treasuries.
… and greater
availability of
sovereign collateral
The rise in euro GC rates relative to OIS may also reflect an additional
factor specific to the way these rates are compiled. Unlike US GC rates that
refer to a homogeneous basket of US Treasuries, available euro GC rates
(known as “Eurepo”) are based on a heterogeneous basket of sovereign bondsissued by any of the 15 euro area countries. Specifically, for each available
maturity, the European Banking Federation publishes an unweighted average
16In the United Kingdom, the introduction of the Special Liquidity Scheme (SLS) in April 2008
also appears to have increased the availability of government collateral, as discussed in the
next section.
Euro repo market
Euro GC pooling volume1
Spreads to German collateral2
Euro area and German spreads3
0
12
24
36
48
Q2 07 Q4 07 Q2 08 Q4 08
–60
–30
0
30
60
Q3 07 Q4 07 Q1 08 Q2 08 Q3 08 Q4 08
Austria
Belgium
Netherlands
Greece
Portugal
–2.0
–1.5
–1.0
–0.5
0.0
Aug 08 Sep 08 Oct 08
Euro arearepo
GermanTreasury
1
Average daily outstanding volume, in billions of euros.2
Based on value-weighted average prices on Brokertec; weekly averages,
in basis points.3
Spreads between overnight repo rates and EONIA, in percentage points; the vertical line marks the date of the
Lehman bankruptcy.
Sources: Bloomberg; Eurex Repo; ICAP. Graph 6
Rising euro GC
repo rates …
48 BIS Quarterly Review, December 2008
8/7/2019 BIS Repo Paper
http://slidepdf.com/reader/full/bis-repo-paper 13/17
of indicative GC repo quotes contributed by a panel of 37 banks (excluding the
highest and lowest 15%).17
These quotes can refer to repo transactions based
on any of the eligible euro sovereign bonds and bills.
This feature seems to have affected the level of the reported Eurepo rates
during the financial turmoil, as market participants began increasingly todiscriminate between collateral from different countries. Specifically, market
participants expressed a clear preference for German and French government
bonds over other euro area sovereigns as the crisis intensified. Data on
overnight repos for 10-year sovereign collateral show that the spread between
single-A rated Greek and AAA-rated German repo rates widened from around
zero basis points prior to the Lehman bankruptcy to more than 60 basis points
by the end of September. Spreads for a number of other countries also
widened substantially during this period (Graph 6). In addition, with
segmentation and differentiation among banks based on their size and
creditworthiness becoming increasingly prevalent as the crisis deepened,quotes reported by banks may also have become more dispersed. The marked
rise in euro GC rates from September onwards therefore seems to have partly
reflected the greater dispersion of repo quotes, both across collateral and
across banks. Graph 6 clearly displays the widening that has taken place
between euro GC rates, as reflected by Eurepo, and German-only collateral
rates.
… partly due to
greater dispersion
of euro sovereign
collateral rates
Central bank response and impact on repo markets
Central banks have responded to turmoil in money markets with actionsdesigned to address funding shortages at various maturities.
18Such
responses have also, to varying degrees, reduced strains in GC repo markets.
We focus on the central bank actions that have most affected repo markets,
namely: (i) the creation of faci lities to exchange illiquid collateral for liquid
government bonds; and (ii) the broadening of collateral schedules for central
bank operations. Overall, the increased supply of government securities
available for GC repos has eased some of the downward pressure on GC repo
rates relative to OIS, particularly in the United Kingdom. The broadening of
collateral schedules has addressed the overhang of illiquid assets on banks’
balance sheets and made it easier for banks to raise funds via central bankfacilities.
Central banks’actions reduce
strains in repo
markets …
… creating facilities
to upgrade
collateral …To address the increased demand for government securities and the
unwillingness of cash providers to accept other forms of collateral, the Federal
Reserve and the Bank of England created facilities that provided access to
17The GC repo rates that we have available for the United Kingdom, which are British Bankers’
Association (BBA) repo benchmark rates, are constructed in a similar way. Of the
contributions of 12 banks in the BBA panel, the middle two quartiles are averaged to produce
the benchmark rates.
18
For an overview of central bank actions, see BIS (2008) and Borio and Nelson (2008). Forstudies of the US market, see Armantier et al (2008), Cecchetti (2008) and Fleming et al
(2008). For the euro area, see Cassola et al (2008). For the UK market, see recent issues of
the Bank of England Quarterly Bulletin .
BIS Quarterly Review, December 2008 49
8/7/2019 BIS Repo Paper
http://slidepdf.com/reader/full/bis-repo-paper 14/17
government securities that could be pledged more easily to raise funds.19
The
Federal Reserve introduced the Term Securities Lending Facility (TSLF) in
March 2008, while the Bank of England introduced the Special Liquidity
Scheme (SLS) in April 2008. The TSLF and SLS allow qualifying institutions to
upgrade their collateral through an asset swap, where highly rated but lessliquid securities can be exchanged for government securities. Users pay a fee
for this service and retain the risk of losses on the posted collateral, which is
subject to a haircut and marked to market daily.
Despite their common objective, the TSLF and SLS differ in the form of
the facility, the breadth of counterparties, the maturity of the asset swap and
the eligible collateral. The TSLF is an auction facility that is available only to
the Federal Reserve’s 19 primary dealers, who bid weekly to borrow US
Treasuries for a 28-day term. The eligible collateral alternates between
auctions against a narrow list of eligible collateral (Schedule 1), including
agency debt and MBS, and a broader list (Schedule 2), including non-agencyMBS, asset-backed securities (ABS), investment grade corporate bonds and
municipal securities. The SLS, by contrast, is a standing facility that is open to
a large number of banks and building societies. The asset swaps are for an
initial period of one year, and may be renewed for up to three years. The SLS
accepts only AAA-rated residential mortgage-backed securities (RMBS) and
credit card ABS that existed at the end of 2007.
The TSLF and SLS have been modified in the light of market conditions.
The amount outstanding under the TSLF was increased twice to reach
$200 billion, the frequency of Schedule 2 auctions was raised, and the auctions
were extended over year-end to address funding concerns.20
Bid/cover ratioshave fluctuated based on the type of collateral accepted, with notable
increases around periods of market stress. Fleming et al (2008) suggest that
the TSLF has promoted liquidity while easing stress in US repo markets, as
evidenced by the fall in spreads between agency (and agency MBS) repo rates
relative to GC (Graph 4).
… that are
increased in size
and extended over
year-end
The SLS does not have a specific size limit. While initial estimates
suggested the use would be £50 billion, the SLS reportedly grew to around
£200 billion by September. In the light of the severe disruptions around
Lehman’s bankruptcy, the initial drawdown was extended from October to
January 2009. Analysis by the Bank of England suggests that the SLS hasbeen successful in increasing the supply of gilt collateral, as seen in the
cheapening of UK GC repo rates relative to OIS.
Central banks have also expanded the list of collateral that counterparties
can pledge when borrowing from standing or auction facilities at the central
bank. In general, central banks lowered the minimum credit rating and
increased the quantity of lending through these facilities. The Federal Reserve,
Central banks
broaden collateral
schedules …
19Given the relatively large quantity of euro sovereign debt outstanding and the increased
supply in auctions, the euro repo market did not experience this sovereign collateral shortage.
20Auctions of TSLF options were introduced in July 2008, where the option allows for additional
draws from the TSLF around key dates such as year-end.
50 BIS Quarterly Review, December 2008
8/7/2019 BIS Repo Paper
http://slidepdf.com/reader/full/bis-repo-paper 15/17
for example, expanded its collateral list for repo operations on three occasions
in response to severe market dislocations – in March, May and September
2008.21
By the end of this period, the eligible collateral closely matched
securities that can be pledged in triparty repo systems, including investment
grade corporate bonds and equities. The ECB, by contrast, headed into thecrisis with the broadest list of eligible collateral among its peers, including non-
marketable securities and commercial loans. As a result, the ECB made no
changes until mid-October 2008, when it expanded the eligible collateral
significantly and lowered the minimum credit rating from A– to BBB–. Finally,
the Bank of England’s approach has been to accept a wider pool of collateral at
special sterling long-term repos, held infrequently until late September and
weekly thereafter. The standard collateral for Bank of England operations was
extended in December 2007 to include AAA-rated ABS, RMBS and covered
bonds. The list was then expanded three times in October 2008 to accept a
much broader set of securities, as well as lowering the minimum rating onMBS, ABS and covered bonds to single A– and higher.
One consequence of these central bank actions has been the increased
size of balance sheets at the Federal Reserve, ECB and Bank of England, and
a decrease in overall asset quality. Central bank assets rose significantly from
mid-September onwards, with the Federal Reserve’s (Graph 5) and Bank of
England’s total assets more than doubling in a matter of weeks while the ECB’s
assets increased by more than 30% (see Box 4 on pages 18–19 in the
Overview for further details).
… and expand their
balance sheets
Longer-term implications for repo markets
The financial crisis that has disrupted unsecured interbank and money markets
has also had significant effects on repo markets, despite the presence of
collateral. Funding conditions became more restrictive and funding increasingly
concentrated in government securities and at very short maturities. Looking
forward, what are the implications for repo markets and how are these markets
likely to evolve?
A first set of implications relate to the use of repo markets. First, repo
financing is likely to remain an important source of capital for banks and
financial institutions. The current turmoil has demonstrated that even large andwell established counterparties may fall victim to illiquidity or insolvency. Under
these circumstances, the importance of collateral will probably grow. Second,
the ability and/or willingness to generate leverage using repos may be curtailed
in the future. Investment banks and leveraged investors used repos extensively
to grow their balance sheets, exposing them to greater funding risk. The
decline of this business model is likely to result in lower repo turnover,
particularly in the United States. The net effect of these offsetting forces on
outstanding repo volumes is unclear. Third, financial institutions will probably
Collateral likely to
be more important
when raising funds
21By contrast, for discount window lending, the Federal Reserve has consistently accepted a
very wide range of collateral, allowing “any assets that meet regulatory standards for sound
asset quality”.
BIS Quarterly Review, December 2008 51
8/7/2019 BIS Repo Paper
http://slidepdf.com/reader/full/bis-repo-paper 16/17
make efforts to manage collateral more effectively, and to mobilise it to
business areas more quickly – particularly across borders and currencies.
Collateral management within financial institutions may therefore grow in
importance.
A second set of implications relates to the risk management practicesaround repos. First, repo market activity has become more concentrated on
government securities, with cash providers showing a preference for high-
quality collateral that is liquid and widely accepted. It seems likely that the repo
markets for structured products or lower-rated collateral may not recover to
their previous levels. Second, within the euro repo market, the tiering of
sovereign GC collateral reflects different market risk, which in turn is due to
perceptions of credit risks and the ease with which the collateral can be sold.
This tiering reduces market liquidity and limits the growth of the euro repo
market. Third, counterparty credit risk management will probably remain a
central concern and suggests that more repo market participants may turn tofinancial intermediaries such as CCPs to reduce counterparty risk. Fourth,
haircuts and initial margin have risen from arguably unsustainably low levels.
Higher haircuts are likely to persist, particularly for less liquid collateral types.
The higher costs may further contribute to the concentration of activity in GC
repos. Market participants may also begin to focus more on daylight exposures,
with the potential for marking to market intraday.
Greater focus on
top-quality
collateral …
… and on
counterparty risk
management
A final set of points relates to the operational risks in repo markets. First,
US repo markets exhibit a rise in settlement fails during periods of low interest
rates, which disrupts the operation of this vital market. The incentives to fail
should be addressed by increasing the cost of failing, as seen in the recentproposals from the Treasury Market Practices Group. A second point concerns
the triparty repo market, which has grown throughout the crisis, concentrating
activity and hence exposures on the balance sheets of a limited number of
custodial banks. This concentration needs to be monitored closely. Third,
leading central banks have become more active in these markets, expanding
the eligible collateral in lending operations, and providing more of a market
intermediary role. The extent to which these new operating procedures become
permanent or are phased out remains an important question for the future.
Treasury fails to be
addressed …
… while
concentration of
the triparty repo
market remains a
concern
References
Adrian, T and H Shin (2008): “Liquidity, monetary policy, and financial cycles”,
FRBNY Current Issues in Economics and Finance , 14(1), January/February.
Armantier, O, S Krieger and J McAndrews (2008): “The Federal Reserve’s
Term Auction Facility”, FRBNY Current Issues in Economics and Finance ,
14(5), July.
Baba, N, F Packer and T Nagano (2008): “The spillover of money market
turbulence to FX swap and cross-currency swap markets”, BIS Quarterly
Review , March, pp 73–86.
Bank for International Settlements (1999): “Implications of repo markets for
central banks”, CGFS Papers , no 10, March.
52 BIS Quarterly Review, December 2008
8/7/2019 BIS Repo Paper
http://slidepdf.com/reader/full/bis-repo-paper 17/17
——— (2008): “Central bank operations in response to the financial turmoil”,
CGFS Papers , no 31, July.
Bearing Point (2008): “An analysis of the secured money market in the euro-
zone”, 4th extended edition.
Borio, C and W Nelson (2008): “Monetary operations and the financial turmoil”,
BIS Quarterly Review , March, pp 31–46.
Cassola, N, C Holthausen and F Würtz (2008): “Liquidity management under
market turmoil: the 2007/2008 experience of the European Central Bank”, ECB,
forthcoming.
Cecchetti, S (2008): “Crisis and responses: the Federal Reserve and the
financial crisis of 2007–2008”, NBER Working Papers , no 14134, June.
Fleming, M and K Garbade (2005): “Explaining settlement fails”, FRBNY
Current Issues in Economics and Finance , 11(9), September.
Fleming, M, W Hrung and F Keane (2008): “The Term Securities Lending
Facility: a reserve-neutral liquidity facility”, Federal Reserve Bank of New York,
forthcoming.
Michaud, F-L and C Upper (2008): “What drives interbank rates? Evidence
from the Libor panel”, BIS Quarterly Review , March, pp 47–58.
BIS Quarterly Review December 2008 53