, Douglas Adamoski , Rodolpho Ornitz Oliveira Souza ......2019/04/30 · Fábio Malta de Sá...
25
1 Dual inhibition of glutaminase and carnitine palmitoyltransferase decreases growth and migration of glutaminase inhibition–resistant triple-negative breast cancer cells Larissa Menezes dos Reis 1,2 †, Douglas Adamoski 1,2 †, Rodolpho Ornitz Oliveira Souza 3 , Carolline Fernanda Rodrigues Ascenção 1,2 , Krishina Ratna Sousa de Oliveira 1,2 , Felipe Corrêa-da-Silva 2,4 , Fábio Malta de Sá Patroni 1,2 , Marília Meira Dias 1 , Sílvio Roberto Consonni 5 , Pedro Manoel Mendes de Moraes-Vieira 4 , Ariel Mariano Silber 3 , Sandra Martha Gomes Dias 1* †These authors contributed equally to the work. From the 1 Brazilian Biosciences National Laboratory (LNBio), Center for Research in Energy and Materials (CNPEM), 13083-970, Campinas, São Paulo, Brazil. 2 Graduate Program in Genetics and Molecular Biology, Institute of Biology, University of Campinas- UNICAMP, Campinas, SP, Brazil. 3 Laboratory of Biochemistry of Tryps (LaBTryps), Department of Parasitology, Institute of Biomedical Science, University of São Paulo - USP, 05508-000, São Paulo, SP, Brazil. 4 Department of Genetics, Evolution, Microbiology and Immunology, Laboratory of Immunometabolism, Institute of Biology, University of Campinas-UNICAMP, 13083-970, Campinas, SP, Brazil. 5 Department of Biochemistry and Tissue Biology, Laboratory of Citochemistry and Immunocitochemistry, Institute of Biology, University of Campinas- UNICAMP, Campinas, SP, Brazil. Running Title: CPT1 compensates GLS inhibition in TN breast cancer *To whom correspondence should be addressed: Sandra MG Dias: Laboratório Nacional de Biociências – LNBio. Centro Nacional de Pesquisa em Energia e Materiais – CNPEM Rua Giuseppe Máximo Scolfaro, 10.000 Pólo II de Alta Tecnologia, Campinas, SP - 13083-100 – Brazil Phone: +55 19 3512 3503; Fax: +55 19 3512 1006 e-mail: [email protected]. Keywords: triple-negative breast cancer, glutaminase, beta-oxidation, cell metabolism, metabolic reprogramming, energy metabolism ABSTRACT Triple-negative breast cancers (TNBCs) lack progesterone and estrogen receptors and do not have amplified human epidermal growth factor receptor 2, the main therapeutic targets for managing breast cancer. TNBCs have an altered metabolism, including an increased Warburg effect and glutamine dependence, making the glutaminase inhibitor CB-839 therapeutically promising for this tumor type. Accordingly, CB- 839 is currently in phase I/II clinical trials. However, not all TNBCs respond to CB-839 treatment, with the tumor resistance mechanism not fully understood yet. Here, we classified cell lines as CB-839 sensitive or resistant according to their growth responses to CB-839. Compared with sensitive cells, resistant cells were less glutaminolytic and, upon CB-839 treatment, exhibited a smaller decrease in ATP content and less mitochondrial fragmentation, an indicator of poor mitochondrial health. Transcriptional analyses revealed that the expression levels of genes linked to lipid metabolism were altered between the sensitive and resistant cells and between breast cancer tissues (available from The Cancer Genome Atlas project) with low versus high glutaminase (GLS) gene expression. Of note, CB-839–resistant TNBC cells had increased carnitine palmitoyltransferase 2 (CPT2) protein and CPT1 activity levels. In agreement, CB-839– resistant TNBC cells mobilized more fatty acid into mitochondria for oxidation, which responded to AMP-activated protein kinase and acetyl-CoA carboxylase signaling. Moreover, chemical inhibition of both glutaminase and CPT1 decreased cell proliferation and migration of CB- 839–resistant cells compared with single inhibition of each enzyme. We propose that dual targeting of glutaminase and CPT1 activities may have therapeutic relevance for managing CB- 839–resistant tumors. Introduction TNBCs, which are characterized as ER- /PR-/HER2-tumors (1), do not respond to hormonal, monoclonal and tyrosine kinase inhibitors therapies targeted against the progesterone and estrogen receptors or to Her2 (or its downstream signaling pathway). TNBCs show a worse prognosis, higher recurrence rate and http://www.jbc.org/cgi/doi/10.1074/jbc.RA119.008180 The latest version is at JBC Papers in Press. Published on April 30, 2019 as Manuscript RA119.008180 by guest on June 8, 2020 http://www.jbc.org/ Downloaded from
Transcript of , Douglas Adamoski , Rodolpho Ornitz Oliveira Souza ......2019/04/30 · Fábio Malta de Sá...
1
Dual inhibition of glutaminase and carnitine palmitoyltransferase decreases growth and migration of
glutaminase inhibition–resistant triple-negative breast cancer cells
Larissa Menezes dos Reis1,2†, Douglas Adamoski1,2†, Rodolpho Ornitz Oliveira Souza3, Carolline
Fernanda Rodrigues Ascenção1,2, Krishina Ratna Sousa de Oliveira1,2, Felipe Corrêa-da-Silva2,4,
Fábio Malta de Sá Patroni1,2, Marília Meira Dias1, Sílvio Roberto Consonni5, Pedro Manoel
Mendes de Moraes-Vieira4, Ariel Mariano Silber3, Sandra Martha Gomes Dias1*
†These authors contributed equally to the work.
From the 1Brazilian Biosciences National Laboratory (LNBio), Center for Research in Energy and
Materials (CNPEM), 13083-970, Campinas, São Paulo, Brazil. 2Graduate Program in Genetics and
Molecular Biology, Institute of Biology, University of Campinas- UNICAMP, Campinas, SP, Brazil. 3Laboratory of Biochemistry of Tryps (LaBTryps), Department of Parasitology, Institute of Biomedical
Science, University of São Paulo - USP, 05508-000, São Paulo, SP, Brazil. 4Department of
Genetics, Evolution, Microbiology and Immunology, Laboratory of Immunometabolism, Institute of
Biology, University of Campinas-UNICAMP, 13083-970, Campinas, SP, Brazil. 5Department of
Biochemistry and Tissue Biology, Laboratory of Citochemistry and Immunocitochemistry, Institute of
Biology, University of Campinas- UNICAMP, Campinas, SP, Brazil.
Running Title: CPT1 compensates GLS inhibition in TN breast cancer
*To whom correspondence should be addressed: Sandra MG Dias: Laboratório Nacional de Biociências
– LNBio. Centro Nacional de Pesquisa em Energia e Materiais – CNPEM Rua Giuseppe Máximo
Scolfaro, 10.000 Pólo II de Alta Tecnologia, Campinas, SP - 13083-100 – Brazil Phone: +55 19 3512
3503; Fax: +55 19 3512 1006 e-mail: [email protected].
Keywords: triple-negative breast cancer, glutaminase, beta-oxidation, cell metabolism, metabolic
reprogramming, energy metabolism
ABSTRACT
Triple-negative breast cancers (TNBCs)
lack progesterone and estrogen receptors and do
not have amplified human epidermal growth
factor receptor 2, the main therapeutic targets for
managing breast cancer. TNBCs have an altered
metabolism, including an increased Warburg
effect and glutamine dependence, making the
glutaminase inhibitor CB-839 therapeutically
promising for this tumor type. Accordingly, CB-
839 is currently in phase I/II clinical trials.
However, not all TNBCs respond to CB-839
treatment, with the tumor resistance mechanism
not fully understood yet. Here, we classified cell
lines as CB-839 sensitive or resistant according to
their growth responses to CB-839. Compared
with sensitive cells, resistant cells were less
glutaminolytic and, upon CB-839 treatment,
exhibited a smaller decrease in ATP content and
less mitochondrial fragmentation, an indicator of
poor mitochondrial health. Transcriptional
analyses revealed that the expression levels of
genes linked to lipid metabolism were altered
between the sensitive and resistant cells and
between breast cancer tissues (available from The
Cancer Genome Atlas project) with low versus
high glutaminase (GLS) gene expression. Of
note, CB-839–resistant TNBC cells had increased
carnitine palmitoyltransferase 2 (CPT2) protein
and CPT1 activity levels. In agreement, CB-839–
resistant TNBC cells mobilized more fatty acid
into mitochondria for oxidation, which responded
to AMP-activated protein kinase and acetyl-CoA
carboxylase signaling. Moreover, chemical
inhibition of both glutaminase and CPT1
decreased cell proliferation and migration of CB-
839–resistant cells compared with single
inhibition of each enzyme. We propose that dual
targeting of glutaminase and CPT1 activities may
have therapeutic relevance for managing CB-
839–resistant tumors.
Introduction
TNBCs, which are characterized as ER-
/PR-/HER2-tumors (1), do not respond to
hormonal, monoclonal and tyrosine kinase
inhibitors therapies targeted against the
progesterone and estrogen receptors or to Her2 (or
its downstream signaling pathway). TNBCs show
a worse prognosis, higher recurrence rate and
http://www.jbc.org/cgi/doi/10.1074/jbc.RA119.008180The latest version is at JBC Papers in Press. Published on April 30, 2019 as Manuscript RA119.008180
by guest on June 8, 2020http://w
ww
.jbc.org/D
ownloaded from

CPT1 compensates GLS inhibition in TN breast cancer
2
greater aggressiveness compared to other breast
cancer subtypes (2, 3). Importantly, these tumors
have a heterogeneous molecular profile, which
hampers the discovery of biomarkers and more
efficient therapies (4).
Metabolic reprogramming followed by
increased glucose (and often glutamine
consumption) is a hallmark of cancer (5) born
from the tumor cells’ necessity of maintaining
high energy rates and biomass production.
Metabolic reprograming also affects the
migration and invasion processes (6). Recent
studies have shown a relationship between
TNBCs and altered metabolism (7–11),
suggesting that metabolic reprogramming may be
key to disease progression and a promising
feature in the development of new therapies (12,
13). Specifically, glutamine is an important
tricarboxylic acid cycle anaplerotic source for
many types of tumors, including TNBCs (14–16).
Glutamine catabolism affects tumor cell
proliferation (17, 18), redox balance (14, 19), the
biosynthesis of other non-essential amino acids
(20) and, importantly, the maintenance of cancer
stem cells (21); thus, it is highly linked to tumor
recidive (22).
The glutaminase (GLS) enzyme, which is
involved in the hydrolytic deamination of
glutamine to glutamate and ammonium, is a
limiting step in the glutamine catabolism process
(23). The GLS gene generates two isoforms by
alternative splicing, glutaminase C (GAC) and
kidney-type glutaminase (KGA) (24). GLS
inhibition has been explored as a therapeutic
approach for different types of tumors (25–27),
including TNBC (28). In fact, CB-839, a GLS
inhibitor, is in phase I-II clinical trials for this type
of breast cancer (29).
Structural lipids are synthesized de novo
in cells when there is an energy surplus16.
Conversely, when the energy stock is low, fatty
acids stored in triglycerides are released and
catabolized by the beta-oxidation process (30).
The balance between lipid synthesis and
catabolism is regulated by the energy sensor
AMP-activated protein kinase (AMPK), which
responds directly to intracellular AMP/ATP
levels. When energy is low (high AMP/ATP
levels), AMPK is activated and downregulates
fatty acid biosynthesis, with concurrent activation
of mitochondrial beta-oxidation (31).
Beta-oxidation has been described as an essential
energy source for TNBCs (32). It is also directly
linked to cell aggressiveness (as measured by its
impact on the migration and invasion processes)
(33–35). Park and colleagues demonstrated that
progression and metastasis in TNBCs are
dependent on beta-oxidation via c-Src activation
and concluded that beta-oxidation inhibition may
be promising for TNBC patients (33).
Although it has generally been shown that
TNBC depends on glutamine to survive, which is
correlated with high GLS levels, it is clear that
distinct cell lines (and tumors) respond differently
to the deprivation of this nutrient (14) and to GLS
inhibition (28), suggesting a mechanism for
resistance. We hypothesized that CB-839-
resistant TNBC cells rely on nutrients other than
glutamine to survive glutaminase inhibition. To
evaluate this hypothesis, we characterized
sensitive and resistant TNBC cell lines based on
their response to CB-839 for cell proliferation.
We then showed that resistant cell lines present
lower GLS levels and increased beta-oxidation
(with a further increase upon CB-839 inhibition
or GLS attenuation), a process that is linked to
AMPK and ACC signaling and CPT1 activity.
Breast tumors from a TCGA cohort with
decreased GLS expression levels have increased
CPT1A/B, CPT2 and carnitine O-
acetyltransferase (CRAT) levels. Importantly, we
showed that inhibiting both glutaminase and
CPT1 decreased cell proliferation and migration.
We propose that lower GLS levels combined with
higher CPT1, CPT2 and CRAT levels may be a
predictor of CB-839 resistance and that double
GLS-CPT1 inhibition may be a promissory
treatment for TNBC.
Results
TNBC cell lines respond heterogeneously to
glutamine withdrawal and glutaminase
inhibition. We evaluated 12 TNBC cell lines
according to their sensitivity to glutaminase
inhibition by CB-839 and glutamine dependence
for cell proliferation. CB-839 treatment induced
cell loss or decreased cell proliferation by more
than 50% in six cell lines (HCC1806, HCC1143,
HCC38, MDA-MB-436, MDA-MB-231 and
Hs578T), which were then called sensitive cell
lines; the other six cell lines (HCC1937, HCC70,
BT549, MDA-MB-157, MDA-MB-453 and
MDA-MB468) were either not affected or had
their cell proliferation affected by less than 50%
and were called resistant (Fig. 1A). CB-839
sensitivity was positively correlated with
glutamine dependency for growth (Pearson
correlation of 0.89) (Fig. 1B and Fig S1A). To
by guest on June 8, 2020http://w
ww
.jbc.org/D
ownloaded from
CPT1 compensates GLS inhibition in TN breast cancer
3
further characterize GLS inhibition dependence
for growth, we determined the dose-dependent
growth curve of bis-2-(5-phenylacetamide-1,3,4-
thiadiazol-2-yl) ethyl sulfide (BPTES), another
GLS inhibitor (25), for three sensitive cells lines
(MDA-MB-231, MDA-MB-436 and Hs578t) and
three resistant cell lines (BT549, MDA-MB-468,
and MDA-MB-453). While the IC50 of the
sensitive cell lines ranged from 4 to 16 µM, the
resistant cell lines displayed an IC50 between 36
and 74 µM (Fig. S1B).
Resistant cell lines depend less on glutamine
for mitochondrial function. Glutamine
addiction has been associated with high
glutaminolytic rates (15) and elevated levels of
the GLS protein, particularly the GAC isoform
(14, 28). We evaluated the glutamine
consumption, glutamate secretion, GAC protein
levels and glutaminase activity of the sensitive
and resistant cell lines. As expected, the sensitive
cell lines displayed increased glutamate secretion
(Fig 2A), a tendency of increased glutamine
consumption (Fig 2B), increased GAC levels (Fig
2C), and a tendency of increased glutaminase
activity (Fig 2D), compared to resistant cell lines.
We then evaluated the effect of CB-839
treatment on the mitochondria morphology of the
sensitive and resistant cell lines. Tubular
mitochondria are associated with network
formation by the fusion process, which is
indicative of healthy and functional organelles.
However, a more granular structure can be
associated with energy stress and the apoptotic
process (36). Mitochondria morphology was
determined by the SER Valley texture parameter
(37) using Mitotracker Deep Red staining. The
higher the texture index, the more tubular (and
more active) the mitochondria, whereas the
opposite indicates less active mitochondria.
Overall, upon CB-839 treatment, the sensitive cell
lines had a heterogeneous but on average
significant decrease in the texture index (Fig. 2E),
whereas the resistant cell lines failed to respond
to the treatment in a more homogenous manner
(Fig. 2F). In accordance, CB-839 treatment
(compared to DMSO) decreased the ATP levels
of the sensitive cell lines in 54%, while affected
the resistant cell lines in only 27%; the difference
between groups was significant (Fig. 2G). We
conclude that resistant cell lines are less
glutaminolytic (and less dependent on glutamine)
and, upon GLS inhibition, have increased
participation of metabolites other than glutamine
in the TCA cycle for ATP production.
Resistant cell lines and tumors with low GLS
levels present differential expression levels of
lipid metabolism genes. We have previously
performed an RNAseq analysis of TNBC cell
lines (38). By using this dataset, we separated the
cell lines into sensitive and resistant and
determined the differentially expressed (DE)
genes. Four hundred and seventeen genes were
DE beyond the established cut-off (padj < 0.05),
with 266 being upregulated (log2 Fold Change
(FC) ≥ +1) and 151 downregulated (log2 FC ≤ -1)
in the resistant cell lines (Fig. 3A). The DE genes
clearly distinguish two groups as determined by
an unsupervised Principal Component Analysis
(PCA) (Fig. 3B) and hierarchical clustering (Fig.
3C).
We then performed an enrichment
pathway analysis using the Gene Ontology (GO)
database and found that below the applied cut-off
of p < 0.05, 16 biological processes related to lipid
metabolism were enriched, among others (Fig.
3D, Table S1 and data not shown). These
pathways contained 56 DE genes with 44 genes
upregulated and 12 downregulated in the resistant
group (Table S2). Interestingly, 7 DE genes
related to beta-oxidation/lipid catabolism
processes were upregulated in resistant cell lines
(Table S2). Altogether, these data suggest that the
ability to metabolize lipids is associated with
increased resistance to glutaminase inhibition.
CPT1A and CPT1B, CRAT and CPT2
gene products are directly involved in the
transport of fatty acids into the mitochondria and
serve as the limiting steps for the beta-oxidation
process. In agreement with our hypothesis, we
found that resistant cell lines, in addition to
presenting lower GLS expression levels (Fig. 3E),
present increased CPT1B (but not CPT1A), CRAT
and CPT2 expression levels compared to sensitive
cell lines (Fig. 3F).
Subsequently, we analyzed RNA
expression data from 1097 breast tumors
(available from TCGA). Tumor tissues were
classified based on GLS expression, and the
12.5% of cases with the highest (137 tumors, with
GLS expression raging from log2 FPKM-UQ+1
of 17.97 to 21.71) and the 12.5% of cases with the
lowest (137 tumors, log2 FPKM-UQ+1 between
13.60 and 16.69) GLS mRNA levels were
classified as the “high” or “low” GLS groups,
respectively. Then, using 337 genes of the “fatty
acid metabolic process” (GO # 0006631), we
performed an unsupervised PCA and hierarchical
by guest on June 8, 2020http://w
ww
.jbc.org/D
ownloaded from
CPT1 compensates GLS inhibition in TN breast cancer
4
clustering analysis to determine whether the high
and low GLS groups differed from one another.
Indeed, most of the tumors within the high or low
GLS classifications were clustered together,
whereas the groups were generally separated from
one another (Fig 4A and 4B, respectively). We
found that 270 genes of the GO “fatty acid
metabolic process” were DE (padj < 0.05), of
which 162 were upregulated and 108 were
downregulated in low GLS; among those, 75
genes are related to “fatty acid oxidation process”
(intersection between GO #0006631 and
GO:0019395), with 52 genes (70% of them) being
upregulated in low GLS (Table S3). We also
observed that although CPT1A, CPT1B, CRAT,
and CPT2 expression levels did not change in the
normal adjacent breast tissues, they were
significantly more expressed in tumor tissues with
low GLS levels (Fig 4C). Moreover, there was a
negative Pearson correlation between CPT2 and
GLS expression levels in the evaluated cell lines
(-0.5136; Fig. 4D) and breast tumor tissues (-
0.3048; Fig. 4E). These results show that resistant
cell lines and tumor tissues with low GLS levels
present increased levels of genes related to fatty
acid catabolism.
Resistant cell lines present increased
mitochondrial beta-oxidation. CPT1B and
CPT2 expression levels were enhanced in the
resistant cell lines, but not CPT1A (although it
was enhanced in breast tumor tissues with low
GLS levels). CPT1A is a more ubiquitous isoform
of CPT1, so we evaluated both CPT1A and CPT2
protein levels in the resistante and sensitive cells.
CPT2 protein levels (but not CPT1A) were, on
average, increased in the resistant compared to the
sensitive cell lines (Fig. 5A-B). Moreover, there
was a negative correlation between GAC and
CPT2 protein levels (Pearson correlation of -
0.6505; Fig. 5C). Coherent with CPT2 protein
levels being related to CB-839 resistance, we
observed a positive Pearson correlation between
CPT2 protein levels and a decreased effect of CB-
839 on cell proliferation and survival (Pearson
correlation of 0.7131; Fig. 5D).
To evaluate FA entrance into the
mitochondria, a crucial step for the beta-oxidation
process, we measured the colocalization
(displayed as the Pearson correlation) of
fluorescence signals of the BODIPY 558/568 C12
(Red C12), and the Mitotracker Deep Red probes
(39). We verified that the resistant cell line
HCC1937 presented higher signal colocalization
of both probes than the sensitive cell line
HCC1806 (Fig. 6A). We then evaluated the
decrease of the RedC12 fluorescence signal in the
resistant and sensitive cell lines, which is related
to an increase in beta-oxidation (39). We
observed that resistant cell lines treated with
etomoxir (a CPT1 inhibitor (40)) presented
greater probe accumulation than sensitive cell
lines (Fig. 6B). This result is coherent with a
scenario wherein resistant cells mobilize to and
likely consume more fatty acids in the
mitochondria through beta-oxidation.
Next, we measured the effect of knocking
down GLS (Fig. S2A) (compared to control
shGFP) on beta-oxidation in both sensitive and
resistant cell lines. We verified that the
shGLS/shGFP ratio of the RedC12 fluorescence
intensity was, on average, 1.07 in the sensitive
cell lines (7% increase on probe accumulation
upon GLS knockdown), while in the resistante
cells, the ratio was, on average, 0.89 implying an
11% decrease in probe accumulation and
potential increase in beta-oxidation upon GLS
knockdown. Differences between groups are non-
significant (Fig. 6C).
To directly measure beta-oxidation, we
quantified 14CO2 released from the oxidation of
(14C)-palmitic acid and CPT1 activity in resistant
and sensitive cell lines. We verified that in
complete media supplemented with (14C)-palmitic
acid, the resistant cell line HCC1937 released
more 14CO2 than the sensitive cell line MDA-MB-
231, when control shGFP cells are compared (Fig.
6D). Similarly, CPT1 activity was higher in
DMSO-treated HCC1937 cells than in DMSO-
treated-MDA-MB-231 cells (Fig. 6E). We then
evaluated the effect of GLS attenuation on 14CO2
release and CPT1 activity in the resistant MDA-
MB-231 and sensitive HCC1937 cell lines.
Strikingly, GLS knockdown led to a significant
increase in the 14CO2 release of HCC1937
(compared to control shGFP) but not in MDA-
MB-231 (Fig 6D). In accordance, CB-839
treatment increased the CPT1 activity of
HCC1937 (compared to DMSO) but not of MDA-
MB-231 (Fig 6E). In addition, we verified that
CB-839 treatment increased the 14CO2 release of
resistant BT549 and HCC1937 cell lines
(compared to DMSO; Fig S2B) and the CPT1
activity of resistant HCC70 and BT549 cell lines
by guest on June 8, 2020http://w
ww
.jbc.org/D
ownloaded from

CPT1 compensates GLS inhibition in TN breast cancer
5
(Fig S2C). GLS knockdown in BT549 also
promoted an increase in CPT1 activity (compared
to shGFP; Fig. S2D). Next, we evaluated the
effect of the simultaneous knockdown of GLS and
CPT1 on the basal oxygen consumption rate
(OCR) of the resistant BT549. Although GLS
knockdown did not affect the basal OCR,
suggesting that alternative sources of carbon
(other than glutamine) were being used for
mitochondrial oxidation, CPT1 knockdown
significantly decreased OCR compared to shGFP
(Fig 6F). Knocking down both GLS and CPT1 led
to a further decrease in the OCR (compared to
shCPT1), revealing that GLS attenuation makes
cells more dependent on CPT1 for respiration (Fig
6F). Taken together, these data show that resistant
cells have increased mitochondrial beta-
oxidation, which is further stimulated by GLS
attenuation.
Resistant cell lines rely on CPT1 for growth
and migration. Coherent with resistant cell lines
having increased CPT1 activity (and beta-
oxidation), we evaluated their growth-
dependence on CPT1. We first verified that these
cells have a tendency of growing less in the
presence of etomoxir than the sensitive cells (non-
significant; Fig. 7A). Although the sensitive cell
line HCC1806 was affected by etomoxir
(compared to DMSO control, 57% growth
reduction), combined etomoxir + CB-839
treatment decreased the efficacy of CB-839 (by
decreasing cell death induced by CB-839; Fig.
7B). More strikingly, although treating the
resistant cell line HCC1937 with either CB-839 or
etomoxir only reduced proliferation (compared to
DMSO control, 43% and 95% decrease,
respectively), a combination of both drugs led to
cell death (20% cell loss; Fig. 7C).
Glutamine metabolism by glutaminase
and beta-oxidation was already linked to the cell
migration and invasion processes (41). We then
evaluated the effects of CB-839, etomoxir and the
combined treatment on the migration of the
HCC1806 and HCC1937 cell lines. In HCC1806,
CB-839 decreased cell migration by 70%
(compared to DMSO control) in 18 h whereas
etomoxir caused no pronounced effect alone (Fig.
7D). Etomoxir and CB-839 combination
promoted a small and non-significant further
decrease in cell migration in 18 h compared to
CB-839 treatment alone (Fig. 7D). Conversely,
HCC1937 responded similarly to either CB-839
or etomoxir (compared to DMSO, 24% and 18%
decrease, respectively, in 18 h); the combined
treatment led to a significant further decrease
compared to CB-839 alone, with a final 40%
decrease in migration compared to the DMSO
control (Fig. 7E). Similar results were observed in
the BT549 and HCC70 resistant cell lines (Fig.
S3A-B, respectively). In summary, we conclude
that CPT1 sustains the growth of resistant cell
lines treated with CB-839. In addition, cell
migration can be decreased in resistant cells upon
double glutaminase and CPT1 inhibition.
GLS inhibition caused increased CPT1 activity
and beta-oxidation via AMPK pathway
activation. AMPK is phosphorylated on Thr172
and activated when cells meet low energy levels.
In turn, AMPK phosphorylates ACC in Ser79,
deactivating this enzyme and leading to a
decrease in malonyl-CoA, a CPT1 inhibitor (42),
which makes the AMPK pathway an obvious
candidate for underling the process of fatty acid
catabolism linked to decreased glutaminase
activity in TNBC. Indeed, glutaminase inhibition
by CB-839 was shown to induce AMPK
activation in lung cancer cells (43).
Treating the resistant cell line BT549
with CB-839 decreased ATP (compared to
DMSO; Fig 8A) and increased AMPK Thr172 and
ACC Ser79 phosphorylation levels (Fig. 8B). To
further demonstrate AMPK involvement in CPT1
activation induced by GLS inhibition, we
knocked down the AMPK alpha subunit
(AMPKα) (Fig. 8C) and treated cells with CB-
839. In shGFP cells, the CB-839/DMSO 14CO2
release ratio from (14C)-palmitic acid was 2 (Fig
8D); in agreement, the CB-839/DMSO CPT1
activity ratio was 1.7 (Fig 8E). Conversely, in
shAMPKα cells, GLS inhibition affected 14CO2
release and CPT1 activity levels only marginally
compared to DMSO (CB-839/DMSO ratio of 0.9
and 1, respectively; Figs 8D and E, respectively).
Finally, we verified that AMPK inhibition by
compound C (44) decreased BT549 proliferation
by 65% (compared to DMSO; Fig 8F), an effect
that was further enhanced to 89% with CB-839
co-treatment (compared to DMSO; Fig 8F). Of
note, we verified that breast tumor tissues with
low GLS expression levels have increased total
(data not shown) and phosphorylated ACC Ser79
and phosphorylated AMPK Thr172 levels
compared to tissues with high expression of GLS
(Fig. 8G). In summary, the AMPK pathway is
by guest on June 8, 2020http://w
ww
.jbc.org/D
ownloaded from

CPT1 compensates GLS inhibition in TN breast cancer
6
important for the increase in CPT1 and beta-
oxidation triggered by GLS inhibition.
Discussion
In recent years, it has been shown that
TNBCs depend on glutamine for growth and
survival (14, 15, 45, 46). Glutamine and
glutaminase are also involved in the gain of
invasive traces in other tumor types (16, 47, 48).
However, it is also clear that glutamine
dependence varies within TN tumors, with some
cell lines being only marginally affected whereas
others stop growing or die via apoptosis after
glutamine withdrawal (14) or glutaminase
inhibition by CB-839 (28). Phase I and II clinical
trials are being conducted with CB-839 for
several solid (including TNBCs) and
hematological tumors. Although glutaminase
inhibition by CB-839 has advanced in the clinical
trials, many studies are now being conducted in
combination with other drugs. Indeed, enhanced
performance was obtained when CB-839 was
combined with β-lapachone, a compound that
generates reactive oxygen species in cells, for
treating pancreatic cancer (49); with a BCL-2
inhibitor to treat leukemia (50); and with
paclitaxel, a cytoskeletal drug that targets tubulin,
to treat TNBC (51). This fact can be explained by
differences between molecular profiles and tumor
microenvironments, which can generate context-
dependent sensitivity to glutaminase inhibition
(52). Metabolic plasticity is another factor that
can drive CB-839 resistance.
In this manuscript, we evaluated a set of
TNBC cell lines for their relative sensitivity to
CB-839 for growth. We defined resistant cell
lines as those in which CB-839 only promoted a
growth inhibition less than 50% (compared to a
vehicle); sensitive cell lines were defined as those
that either grew less than 50% or died upon
treatment. Although sensitive cells presented
heterogenous behavior regarding glutamine
metabolism, the evaluated resistant cell lines
more homogenously presented decreased
glutaminolysis and GLS levels. In addition, the
resistant cells were less responsive than the
sensitive cells to decreases in ATP when the cells
were treated with CB-839. These results led us to
speculate that nutrients other than glutamine were
being metabolized for energy production in these
cells upon glutaminase inhibition. By comparing
the transcriptome of resistant and sensitive cells,
we detected pathways linked to lipid metabolism
altered between these cells. Specifically, we
found that genes key to mitochondrial beta-
oxidation (CPT1B, CRAT and CPT2) have
increased expression in resistant cell lines;
strikingly, we also verified that tumor breast
tissues separated into the 12.5% with the highest
levels and the 12.5% with the lowest levels (called
high GLS and low GLS, respectively)
discriminated between groups as a role of the
expression of genes related to the fatty acid
metabolism GO process; low versus high GLS
levels tumor tissues presented also increased
phosphorylation levels of the energy sensor
AMPK (Thr 172) and its downstream target ACC
(Ser79). We concluded that GLS levels in breast
tumor tissues were potentially related to changes
in the lipid metabolism pathways. The
mechanistic link between the expression levels of
GLS and these genes deserves further
investigation.
Beta-oxidation has been connected to
proliferation, migration and invasion processes in
TNBCs (32, 33, 35). Moreover, this process is
related to metabolic adaptation under conditions
of nutrient and oxygen deprivation in diverse
tumor types (53, 54). More specifically, a study
showed that the withdrawal of glutamine from the
medium causes increases of proteins related to
beta-oxidation (55). Altogether, this information
led us to speculate that beta-oxidation was
increased in the resistant cell lines.
Indeed, we saw that resistant cells have
increased CPT2 levels, mobilized more of a FA
fluorescent probe (RedC12) to the mitochondria,
produced more 14CO2 from labeled palmitate, and
presented increased CPT1 activity levels
compared to sensitive cells. Resistant cells also
degraded more RedC12 when GLS was knocked
down (with sensitive cells, for some reason,
accumulating the probe in this situation) and
responded to CB-839 by increasing 14CO2
production and CPT1 activity.
Although we showed that resistant cell
lines have an enhanced capacity to mobilize fatty
acids for beta-oxidation, we verified that the
sensitive cell line MDA-MB-231 was also able,
upon GLS knockdown, to increase the uptake of
fatty acids from the medium (measured by the C1-
Bodipy C12 probe, Fig. S4A), to form more lipid
droplets (LDs; data not shown) and to mobilize
more neutral LDs (quantified with a neutral lipid-
specific dye) to lysosomes (Fig. S4B) than shGFP
control cells. Upon transmission electron
microscopy (TEM) analysis, we confirmed the
presence of cytoplasmic lipid droplets in these
cells and their fusion to membrane-coated
by guest on June 8, 2020http://w
ww
.jbc.org/D
ownloaded from

CPT1 compensates GLS inhibition in TN breast cancer
7
vesicles (Fig. S4C). However, unlike resistant
cells, MDA-MB-231 did not respond to GLS
knockdown by enhancing either 14CO2 or CPT1
activity levels (Fig 6D and 6E, respectively),
showing no increase in the mitochondrial beta-
oxidation process. In fact, it was recently
demonstrated that MDA-MB-231 cells respond to
GLS inhibition (by another glutaminase inhibitor
called C.968) by increasing autophagy, which
increased cell survival upon glutaminase
inhibition (56). Although the levels of metabolites
related to lipid catabolism were altered upon
treatment, the OCR induced by palmitate (the
only direct evidence of beta-oxidation in this
work) indicated that cells could oxidize FAs;
however, no data regarding the effect of GLS
inhibition on this parameter was shown (56). In
accordance, our data show that GLS attenuation
by a knockdown in this cell line is likely related
to increased lipophagy. However, we failed to
detect a direct increase in mitochondrial beta-
oxidation in this cell line induced by GLS
attenuation, indicating that MDA-MB-231,
although very responsive to CB-839 (and
classified by us as sensitive), still presents a
certain level of resistance in which lipid
catabolism by mitochondrial beta-oxidation may
not be a relevant mechanism.
In addition, although GLS knockdown led
to an increase in pAMPK Thr 172 and pACC
Ser79 in both MDA-MB-231 and the resistant cell
line BT549 (data not shown for MDA-MB-231),
only in the latter was that converted to increased
CPT1 activity levels. This capacity of increasing
CPT1 activity may be key to the metabolic
adaptation process described here, and
determining why resistant cells have an increased
ability to do that (compared to sensitive cells)
deserves further investigation.
Finally, we discovered that double
glutaminase and CPT1 inhibition of resistant cells
potentiates cell death and further decreased cell
migration compared to individual treatments.
Very importantly, in recent work, Yao and
colleagues (57) showed that CPT1 has important
metabolic roles related to cell proliferation that is
independent of fatty-acid oxidation. When
working with etomoxir doses as low as 10 µM,
they could measure a decrease in beta-oxidation;
however, this dose had no effect on proliferation
(57). At higher doses, they showed that etomoxir
presents an off-target effect and can inhibit cell
proliferation by mechanisms other than by
blocking beta-oxidation (57). In our work, we
used doses higher than 10 µM, and although we
also measured a decrease in CPT1 activity and in
beta-oxidation, we cannot affirm that beta-
oxidation is directly responsible for the measured
effects on proliferation and migration. In this
regard, it is still an open question how exactly
inhibiting CPT1 can corroborate with GLS
inhibition to further decrease proliferation (and
migration) of resistant TNBC cells.
Finally, we propose that lower GLS levels
associated with increased CPT1, CPT2 and CRAT
mRNA levels can be potential markers to identify
and select TNBCs that are poor CB-839-
responders. This type of tumor may, from a
clinical perspective, benefit from double
glutaminase and beta-oxidation inhibition.
However, the validation of these findings requires
further in vivo proof.
Experimental Procedures
Cell culture. HCC1806 (ATCC CRL-2335),
HCC1143 (ATCC CRL-2321), HCC38
(ATCC CRL-2314), MDAMB436 (ATCC HTB-
130), MDA-MB-231 (ATCC HTB-26), Hs578T
(ATCC HTB-126), HCC1937 (ATCC CRL-
2336), HCC70 (ATCC CRL-2315), BT549
(ATCC HTB-122), MDA-MB-157 (ATCC HTB-
24), MDA-MB-453 (ATCC HTB131) and MDA-
MB-468 (ATCC HTB-132) were maintained in
RPMI 1640 supplemented with 10% fetal bovine
serum (FBS) and incubated at 37 °C under 5%
CO2 in a humidified atmosphere. All cell lines
were obtained from the American Type Culture
Collection (ATCC).
Lentiviral shRNA cloning and sub-cell line
generation. pLKO.1 puro was a gift from Bob
Weinberg (Addgene plasmid # 8453) (58).
Lentiviral shRNAs targeting the genes of interest
were cloned in pLKO.1 within the AgeI/EcoRI
sites at the 3’ end of the human U6 promoter. The
targeted sequences were as follows: GFP: 5’-
CAAGCTGACCCTGAAGTTCAT-3’; GLS: 5’-
CAACTGGCCAAATTCAGTC-3’; CPT1: 5’-
CGATGTTACGACAGGTGGTTT-3’; AMPKα:
5’-ATGAGTCTACAGCTATACCAA-3’. The
cell lines were transduced with lentiviral particles
from the pLKO.puro shGLS, tet-pLKO.G418
shCPT1 or tet-pLKO.puro shAMPKα vectors.
The sub-cell lines were maintained with 1000
µg/mL G418 (Sigma-Aldrich) (shCPT1) or 1
µg/mL puromycin (Life Technologies) (shGLS
and shAMPKα). To induce knockdown in the
by guest on June 8, 2020http://w
ww
.jbc.org/D
ownloaded from
CPT1 compensates GLS inhibition in TN breast cancer
8
transduced cells with tet-pLKO vector, we
utilized 50 ng/mL doxycycline for seven days.
Proliferation assay. The cells were seeded at a
density of 62.5 cells/mm2 in 96-well plates in
complete media. For the glutamine deprivation
assay, after 24 h, the media was replaced by either
complete or glutamine-free RPMI, both
supplemented with 10% dialyzed FBS
(ThermoFisher). For the inhibition assays, the
cells were incubated with complete media added
of vehicle (0.1% v/v of DMSO), 1 µM CB-839
(Sigma-Aldrich), 50 µM etomoxir (Cayman) or 3
µM Compound C (Sigma-Aldrich). Double-
inhibition assays were performed with 1 µM CB-
839 and 200 µM etomoxir (individually or in
combination). The medium was replaced every
48 h, and the cells were fixed with 3.7%
formaldehyde and stained with 0.5 μg/mL DAPI
after 96 h of treatment (T1). A mirror plate was
set for every experiment, and the cells were fixed
24 h after seeding (T0). The number of stained
nuclei was quantified using the fluorescence
microscope Operetta (PerkinElmer) plate reader
and the software Columbus (Perkin Elmer). Cell
proliferation (when the number of cells in T1 >
the number of cells in T0) and cell loss (when the
number of cells in T1 < the number of cells in T0)
were calculated using the following equations:
Cell proliferation = {100*[(T1compound / T0compound)
/ (T1DMSO / T0DMSO)]}; Cell loss = {100*[1-
(T1compound / T0Compound)]}. The BPTES IC50 for
cell proliferation was determined after 48 h of
incubation. Sigmoidal curve and IC50 values
were calculated with GraphPad Prism 8.0.0
software.
Glutamine consumption and glutamate
secretion. The assay was performed using a
previously published method (59) with some
modifications. Briefly, the cells were seeded at a
density of 937.5 cells/mm2 in 96-well plates in 50
µL of RPMI complete medium and sat for 12 h.
Next, 10 µL of medium was combined with 190
µL of a 50 mM tris-acetate pH 8.6, 0.2 mM EDTA
pH 8.0, 2 mM NAD+, 50 mM dipotassium
phosphate and 0.3 U of L-glutamate
dehydrogenase (Sigma-Aldrich) solution; the
absorbance was measured at 340 nm using an
EnSpire Plate Reader (Perkin Elmer). Then, 60
nM of recombinant glutaminase C (purified as
described in (60)) was added to the same reaction
to obtain the total amount of glutamine. The
glutamate and glutamine concentrations were
estimated based on the slope of a standard curve.
Data were normalized by the number of cells,
which was calculated as described above.
GLS activity assay. This assay was performed
using a previously published method (61) with
some modifications. Cells seeded at a density of
2500 cells/mm2 in 60-mm dishes were lysed in
150 mM sodium chloride, 25 mM HEPES pH 8.0,
1 mM EDTA and 0.01% triton X-100 solution;
the cells were then added to 10 mM sodium
pyrophosphate, 20 mM sodium fluoride, 10 mM
sodium orthovanadate, 1 mM PMSF, 10 mM β-
glycerophosphate, 10 µM leupeptin, 1 µM
pepstatin, 2 µg/mL aprotinin and 4 mM
benzamidine, followed by 20 strokes through a
26-gauge needle. After that, the samples were
quantified by the Bradford method (62). Ten
micrograms of cell lysate were combined with 50
mM tris-acetate pH 8.6, 0.5 U of bovine L-
glutamate dehydrogenase, 2 mM NAD+, 20 mM
dipotassium phosphate and 3.5 mM L-glutamine
in a 96-well plate. The absorbance at 340 nm was
measured over time on an EnSpire Plate Reader
(Perkin Elmer), and the slope of the curve was
used to measure glutaminase activity.
Western blotting. Experiments were performed
as previously described (38). Antibodies anti-
GLS (Abcam, #ab156876), anti-AMPK (Cell
Signaling, #2532), anti-pAMPK Thr 172 (Cell
Signaling, #2535), anti-ACC (Cell Signaling,
#3662), anti-pACC Ser79 (Cell Signaling,
#3661), anti-vinculin (#ab18058) and anti-actin
(#ab3280), anti-CPT1A (Abcam, #ab128568)
were used. Anti-rabbit secondary antibody HRP-
linked of Cell Signaling (#7074) was used at a
1:1000 dilution, while another one from Sigma-
Aldrich (#A0545) was used at a 1:5000 dilution.
The anti-mouse secondary antibody of Sigma-
Aldrich (#A4416) was used at a 1:5000 dilution.
ATP measurement: The cells were treated with
1 µM CB-839 (or vehicle DMSO) for 48 h and
then seeded at a density of 62.5 cells/mm2 in a
384-well white plate. After 24 h, the assay was
performed with the CellTiter-Glo Luminescent
Cell Viability kit (Promega) according to the
manufacturer’s instructions.
Mitochondrial Texture Index. The cells were
treated with 1 µM CB-839 (or vehicle DMSO) for
48 h and then seeded at a density of 187.5
cells/mm2 in a 96-well plate. After 24 h, the cells
were incubated with 100 nM of MitoTracker
Deep Red (Thermo Fisher) and 2.5 µM
by guest on June 8, 2020http://w
ww
.jbc.org/D
ownloaded from
CPT1 compensates GLS inhibition in TN breast cancer
9
HOESCHT (Thermo Fisher) in RPMI without
phenol red and 1% FBS for 45 min. After that, the
cells were washed once and maintained in
complete medium supplemented with 1% FBS.
Images were then immediately taken using the
microscope Operetta (PerkinElmer). The analysis
was performed with the software Columbus
(Perkin Elmer). The SerValley Texture
Classification (1 pixel) from Saddles, Edges,
Ridges (SER) Features was used to evaluate
mitochondrial morphology. Higher index values
are related to a more complex and active
mitochondrial network.
Immunofluorescence microscopy. The cells
were seeded at a density of 187.5 cells/mm2 in a
96-well CellCarrier plate (PerkinElmer). After 24
h, the cells were fixed with 3.7%
paraformaldehyde for 20 min and permeabilized
with 0.2% triton X-100 for 5 min. The cells were
then incubated with blocking solution (5 mg/mL
sodium heparin 5000 UI/mL, 5 mg/mL dextran
sulfate, 0.1% Tween 20, 0.05% sodium azide) for
30 min, followed by incubation with
blocking/permeabilization solution (1% BSA,
0.1% triton X-100, 50 mM glycine, 10% goat
serum) for 1 h using a humidity chamber. Then,
the cells were washed three times with working
solution (diluted 5 times with
blocking/permeabilization solution) and
incubated overnight at 4ºC with primary
antibodies anti-CPT2 (1:100 – Abcam, #
ab181114), anti-CPT1A (1:500- Abcam, #
ab128568) or anti-GAC (1:300 – Rheabiotech)
diluted in work solution. Twelve hours later, the
cells were washed three times with working
solution and incubated for 2 h at room
temperature with the secondary antibodies Alexa
488 rabbit (1:200 – Invitrogen, #A11008), Alexa
488 mouse (1:400 - Invitrogen, #A11017) or
Alexa 633 rabbit (1:300 – Invitrogen, # A21070),
respectively, and diluted in work solution. The
cells were then washed three more times with
working solution and incubated with 1 µg/mL
DAPI for 10 min. Images were obtained using the
microscope Operetta (PerkinElmer). The analysis
was performed with the software Columbus
(Perkin Elmer).
Bioinformatic analysis of transcriptomic and
proteomic data. The RNAseq analysis of the
TNBC cell lines HCC1806, HCC1143, HCC38,
MDA-MB-436, MDA-MB-231, Hs578T,
HCC1937, HCC70, BT549, MDA-MB-157,
MDA-MB-468, and MDA-MB-453 was
performed as previously described (38) using
three data sources (38, 63, 64). The cells were
separated into CB-839 sensitive and resistant cells
and were analyzed in groups. Differential gene
expression among these groups was performed
using the DESeq2 package (R statistical software)
(65). Gene enrichment using Gene Ontology (66)
were performed using goseq (67). Patient RNA-
seq gene-expression data were downloaded from
GDC data portal (https://portal.gdc.cancer.gov/).
Invasive breast carcinoma cases (1097 samples)
were separated according to high and low GLS
levels as described in the results section. A
differential gene expression analysis between the
high and low GLS groups using raw transcript
counts was performed with DESeq2. Reverse
phase protein array data (RPPA) were
downloaded from The Cancer Proteome Atlas
portal (https://tcpaportal.org/tcpa/) as replicate-
based normalized values (68).
CPT1 activity assay. CPT1 activity was
measured according to a previously published
protocol (69) with modifications. Cells seeded at
a density of 2500 cells/mm2 in 60-mm dishes were
lysed in 100 mM tris-HCl, pH 8.0, 0.1% triton-
X100 solution containing 10 mM sodium
pyrophosphate, 20 mM sodium fluoride, 10 mM
sodium orthovanadate, 1 mM PMSF, 10 mM β-
glycerophosphate, 10 µM leupeptin, 1 µM
pepstatin, 2 µg/mL aprotinin and 4 mM
benzamidine, followed by three cycles of freezing
in dry ice and thawing in ice, followed by 20
strokes through a 26-gauge needle. The samples
were quantified by the Bradford method (62).
The lysates (25 µg) were combined with 2.25 mM
5,5’-dithiobis-(2-nitrobenzoic acid) (Sigma-
Aldrich) in a 384-well plate and incubated at 37ºC
for 30 min. After that, 100 µM of palmitoyl-CoA
(Sigma-Aldrich) and 5 µM of L-carnitine (Sigma-
Aldrich) was added to each well to reach a final
volume of 50 µL. Absorbance at 412 nm was
measured in an EnSpire Plate Reader (Perkin
Elmer), and the slope of the curve was used as the
protein activity measurement.
Measurement of 14CO2 release. Beta-oxidation
was measured according to a previously described
protocol (70) with modifications. The cells were
seeded at a density of 2000 cells/mm2 in 12.5-cm2
flasks without filter caps. After 24 h, the cells
were washed and maintained in 2.5 mL of RPMI
(without sodium bicarbonate, glutamine and
glucose) supplemented with 2.5 mM glucose, 1
mM glutamine, 1 mM carnitine, 25 mM HEPES,
by guest on June 8, 2020http://w
ww
.jbc.org/D
ownloaded from
CPT1 compensates GLS inhibition in TN breast cancer
10
1% FBS and 100 µM BSA-palmitate containing
0.1 µCi/mL of (14C)-palmitic acid uniformly
labeled (Amersham, GE; specific activity of 57
mCi/mmol). A Whatman filter paper soaked with
30 µL of 2 M potassium hydroxide was placed on
the flask cap. After incubation at 37ºC for 3 h, the
filters were placed in 1 mL of scintillation liquid,
and the signal was measured using Beckman
Coulter LS6500 Multipurpose Scintillation
Counter equipment (Beckman). To prepare 2.5
mM BSA-palmitate complexes, 7.5% BSA was
dissolved in water at 37ºC to complete dilution.
Seventy-six millimoles of sodium palmitate
(Sigma-Aldrich) was mixed in water and held at
70ºC to complete the dilution. After that, the
solutions were combined (162.5 µL sodium
palmitate and 4675 µL BSA) and stirred at 37ºC
until complete solubilization.
Measurement of basal OCR. The basal oxygen
consumption rate was measured using Seahorse
XFe24 Analyzer equipment according to the
manufacturer's recommendations. Briefly, we
seeded 937.5 cells/mm2 on the XF24
microplate with RPMI medium for 16 h. After,
we replaced the RPMI medium to medium
without FBS and sodium bicarbonate and
incubated the plate for 1 h while calibrating the
equipment. Thereon, the plate was placed in the
equipment and the reading was performed. The
number of cells was used to normalize the data.
Fluorescence microscopy. BODIPY 558/568 C12
(RedC12, Life Technologies) was employed to
measure beta-oxidation as previously published
(39). The cells were seeded at a density of 125
cells/mm2 in a 96-well CellCarrier plate
(PerkinElmer). After adhering, the cells were
maintained in RPMI medium supplemented with
5% FBS and 1 µM RedC12 for 16 h.
Subsequently, the RPMI was replaced by
complete medium containing 1% FBS and 50
µM etomoxir (or 0.1% DMSO) for 3 h.
Alternatively, shGFP and shGLS cells without
treatment were used. After that, mitochondria
were labeled with 100 nM Mitotracker
DeepRed (Life Technologies) and 2.5 µM
HOESCHT (Life Technologies, #H3570) for 30
min. Images were then taken using the
microscope Operetta (PerkinElmer). The analysis
was performed with the software Columbus
(Perkin Elmer). The fluorescence intensity was
reported as the mean value per cell. For
colocalization, we calculated the overlap
of Red C12 and Mitotracker Deep Red.
Images were captured in Nipkow spinning
disk confocal mode, and the analysis was
performed with the software ImageJ using
the plugin Coloc2. Approximately 150
cells of each well were used to calculate
Pearson’s correlation coefficient (71).
Migration assay. In the wound-healing
migration assays, 1875 cells/mm 2
(HCC1806 and HCC70) or 937.5 cells/mm 2
(BT549 and HCC1937) were seeded over
96-well plates previously coated for 1 h with
300 μg/mL collagen type I from rat tails in acetic
acid at 37°C. After cell attachment for 16 h
and serum starvation for 24 h, wounds
were created with pipette tips, and the
cells were immediately treated with 1 µM
CB-839 and 50 µM etomoxir individually
or in combination (DMSO-vehicle at 0.2%
v/v) in RPMI medium supplemented with
10% FBS. The cells were imaged for 18 h
using Operetta (Perkin-Elmer) in bright
field mode, at every hour, under a 5% CO2
atmosphere. The images were processed
with Fiji-ImageJ31, using a macro based
on previous work(72).
Lipid droplets and lysosomes staining. On a 96-
well plate, 156.25 cells/mm2 were grown for 48
h in complete RPMI media supplemented with
10% FBS. After media removal, the cells were
incubated with 500 nM LysoTracker Red DND-
99 (Life Technologies) for 1 h at 37˚C and 5%
CO2. The cells were rinsed with PBS and fixed
with 3.7% formaldehyde in PBS added to 2.5 µM
HOESCHT for nuclei staining. For lipid labeling,
the cells were incubated with 1:1000 LipidTOX
neutral lipid (Life Technologies), and the plate
was sealed with adherent film. Images were
immediately acquired with the fluorescent
microscope Operetta in Nipkow spinning disk
confocal mode (19 stacks of 1-µm increment per
field were collected). The intensity of lipid
droplet labeling inside the lysosome labeling-
ROIs (regions of interest) was quantified using
the software Harmony. Representative images
were obtained with the Biological Imaging
Facility of LNBio using a Leica TCS SP8
confocal mounted on a Leica DMI 6000 inverted
microscope.
Transmission electron microscopy. A cell
monolayer grown over a glass coverslip was fixed
with 2.5% glutaraldehyde and 3 mM CaCl2 in 0.1
M sodium cacodylate buffer for 5 min at room
by guest on June 8, 2020http://w
ww
.jbc.org/D
ownloaded from
CPT1 compensates GLS inhibition in TN breast cancer
11
temperature followed by 1 h of incubation on ice.
For lipids visualization using electron
microscopy, a imidazole-buffered osmium
tetroxide was used as a stain as previously
described (73). After fixation, the samples were
washed three times in 0.1 M sodium cacodylate
and 3 mM CaCl2 solution and post-fixed with 2%
osmium tetroxide in 0.1 M imidazole buffer for
30 min and en bloc stained in ice-cold 2% uranyl
acetate overnight. The cells were dehydrated in
ethanol on ice, ending with four changes of 100%
ethanol at room temperature. The dehydrated cells
were infiltrated in Epon resin. After four changes
of resin solution, a fifth resin change was
performed, and the dish was immediately placed
in a lab oven at 60°C to be polymerized for 72 h.
Ultrathin sections were cut with a Leica Ultracut
microtome, stained with 2% uranyl acetate and
Reynold’s lead citrate, and then examined in a
LEO 906-Zeiss transmission electron microscope
(at the Electron Microscopy Laboratory of
Institute of Biology, Campinas State University)
using an accelerating voltage of 60 kV.
Acknowledgments
We thank São Paulo Research Foundation (FAPESP) for fellowships to LMR (#2014/18061–9), DA
(#2014/17820–3), CFRA (#2013/23510–4), FCS (#2017/06225-5), KRSO (#2014/06512-6) and FMSP
(#2015/26059-7) research grant to SMGD (#2014/15968–3 and #2015/25832–4), AMS (#2016/06034-
2) and PMMMV (#2015/15626-8). We also thank LNBio for accessibility to core facilities as well as
for financial support. We are very grateful to Dr. Alessandra Girasole for expert technical support. We
also thank to TCGA Research Network.
Conflict of interest
The authors declare that they have no conflicts of interest with the contents of this article
Author contribuitions
LMR and SMGD designed the study, analyzed the data and wrote the manuscript. LMR conducted the
cell experiments, optimized protocols and contributed with bioinformatic analysis. DA conducted
bioinformatic analysis, elaborated scripts for analysis and contributed to protocols optimization. FMSP
conducted bioinformatic analysis. ROOS and AMS cooperated with measurement of 14CO2 release
assay. CFRA gave support in cell experiments. KRSO contributed to western blot experiments. FCS and
PMMMV contributed to seahorse experiments. MMD and SRC conducted transmission electron
microscopy experiment. All authors revised and approved the final manuscript
References
1. Prat, A., and Perou, C. M. (2011) Deconstructing the molecular portraits of breast cancer. Mol.
Oncol. 5, 5–23
2. Bernardi, R., and Gianni, L. (2014) Hallmarks of triple negative breast cancer emerging at last?
Cell Res. 24, 904–905
3. Kaplan, H. G., and Malmgren, J. A. (2008) Impact of triple negative phenotype on breast cancer
prognosis. Breast J. 14, 456–463
4. Turner, N. C., and Reis-Filho, J. S. (2013) Tackling the diversity of triple-negative breast cancer.
Clin. Cancer Res. 19, 6380–6388
5. Hanahan, D., and Weinberg, R. A. (2011) Hallmarks of cancer: The next generation. Cell. 144,
646–674
6. Pavlova, N. N., and Thompson, C. B. (2016) The emerging hallmarks of cancer metabolism. Cell
Metab. 23, 27–47
7. Lee, K.-H., Hsu, E.-C., Guh, J.-H., Yang, H.-C., Wang, D., Kulp, S. K., Shapiro, C. L., and Chen,
C.-S. (2011) Targeting energy metabolic and oncogenic signaling pathways in triple-negative
breast cancer by a novel adenosine monophosphate-activated protein kinase (AMPK) activator.
J. Biol. Chem. 286, 39247–39258
8. Noh, S., Kim, D. H., Jung, W. H., and Koo, J. S. (2014) Expression levels of serine/glycine
metabolism-related proteins in triple negative breast cancer tissues. Tumor Biol. 35, 4457–4468
9. Cao, M. D., Lamichhane, S., Lundgren, S., Bofin, A., Fjøsne, H., Giskeødegård, G. F., and
by guest on June 8, 2020http://w
ww
.jbc.org/D
ownloaded from

CPT1 compensates GLS inhibition in TN breast cancer
12
Bathen, T. F. (2014) Metabolic characterization of triple negative breast cancer. BMC Cancer.
14, 941
10. Lim, S.-O., Li, C.-W., Xia, W., Lee, H.-H., Chang, S.-S., Shen, J., Hsu, J. L., Raftery, D.,
Djukovic, D., Gu, H., Chang, W.-C., Wang, H.-L., Chen, M.-L., Huo, L., Chen, C.-H., Wu, Y.,
Sahin, A., Hanash, S. M., Hortobagyi, G. N., and Hung, M.-C. (2016) EGFR signaling enhances
aerobic glycolysis in triple-negative breast cancer cells to promote tumor growth and immune
escape. Cancer Res. 76, 1284–1296
11. Shen, L., O’Shea, J. M., Kaadige, M. R., Cunha, S., Wilde, B. R., Cohen, A. L., Welm, A. L.,
and Ayer, D. E. (2015) Metabolic reprogramming in triple-negative breast cancer through Myc
suppression of TXNIP. Proc. Natl. Acad. Sci. 112, 5425–5430
12. O’Toole, S. a, Beith, J. M., Millar, E. K., West, R., McLean, a, Cazet, a, Swarbrick, a, and
Oakes, S. R. (2013) Therapeutic targets in triple negative breast cancer. J Clin Pathol. 66, 530–
542
13. Farabegoli, F., Vettraino, M., Manerba, M., Fiume, L., Roberti, M., and Di Stefano, G. (2012)
Galloflavin, a new lactate dehydrogenase inhibitor, induces the death of human breast cancer
cells with different glycolytic attitude by affecting distinct signaling pathways. Eur. J. Pharm.
Sci. 47, 729–738
14. Timmerman, L. A., Holton, T., Yuneva, M., Louie, R. J., Padró, M., Daemen, A., Hu, M., Chan,
D. A., Ethier, S. P., van ‘t Veer, L. J., Polyak, K., McCormick, F., and Gray, J. W. (2013)
Glutamine sensitivity analysis identifies the xCT antiporter as a common triple-negative breast
tumor therapeutic target. Cancer Cell. 24, 450–465
15. van Geldermalsen, M., Wang, Q., Nagarajah, R., Marshall, A. D., Thoeng, A., Gao, D., Ritchie,
W., Feng, Y., Bailey, C. G., Deng, N., Harvey, K., Beith, J. M., Selinger, C. I., O’Toole, S. A.,
Rasko, J. E. J., and Holst, J. (2016) ASCT2/SLC1A5 controls glutamine uptake and tumour
growth in triple-negative basal-like breast cancer. Oncogene. 35, 3201–3208
16. Yang, L., Moss, T., Mangala, L. S., Marini, J., Zhao, H., Wahlig, S., Armaiz-Pena, G., Jiang, D.,
Achreja, A., Win, J., Roopaimoole, R., Rodriguez-Aguayo, C., Mercado-Uribe, I., Lopez-
Berestein, G., Liu, J., Tsukamoto, T., Sood, A. K., Ram, P. T., and Nagrath, D. (2014) Metabolic
shifts toward glutamine regulate tumor growth, invasion and bioenergetics in ovarian cancer.
Mol. Syst. Biol. 10, 728–728
17. Seltzer, M. J., Bennett, B. D., Joshi, A. D., Gao, P., Thomas, A. G., Ferraris, D. V, Tsukamoto,
T., Rojas, C. J., Slusher, B. S., Rabinowitz, J. D., Dang, C. V, and Riggins, G. J. (2010) Inhibition
of glutaminase preferentially slows growth of glioma cells with mutant IDH1. Cancer Res. 70,
8981–8987
18. Moncada, S., Higgs, E. A., and Colombo, S. L. (2012) Fulfilling the metabolic requirements for
cell proliferation. Biochem. J. 446, 1–7
19. Son, J., Lyssiotis, C. a, Ying, H., Wang, X., Hua, S., Ligorio, M., Perera, R. M., Ferrone, C. R.,
Mullarky, E., Shyh-Chang, N., Kang, Y., Fleming, J. B., Bardeesy, N., Asara, J. M., Haigis, M.
C., DePinho, R. a, Cantley, L. C., and Kimmelman, A. C. (2013) Glutamine supports pancreatic
cancer growth through a KRAS-regulated metabolic pathway. Nature. 496, 101–105
20. Dang, C. V. (2010) Glutaminolysis: Supplying carbon or nitrogen or both for cancer cells? Cell
Cycle. 9, 3884–3886
21. Ryu, J. M., Lee, S. H., Seong, J. K., and Han, H. J. (2015) Glutamine contributes to maintenance
of mouse embryonic stem cell self-renewal through PKC-dependent downregulation of HDAC1
and DNMT1/3a. Cell Cycle. 14, 3292–3305
22. Sun, H.-W., Yu, X.-J., Wu, W.-C., Chen, J., Shi, M., Zheng, L., and Xu, J. (2016) GLUT1 and
ASCT2 as predictors for prognosis of hepatocellular carcinoma. PLoS One. 11, e0168907
23. Márquez, J., López de la Oliva, A. R., Matés, J. M., Segura, J. a, and Alonso, F. J. (2006)
Glutaminase: A multifaceted protein not only involved in generating glutamate. Neurochem. Int.
48, 465–471
24. PÉREZ-GÓMEZ, C., MATÉS, J. M., GÓMEZ-FABRE, P. M., CASTILLO-OLIVARES, A. del,
ALONSO, F. J., and MÁRQUEZ, J. (2003) Genomic organization and transcriptional analysis
of the human l-glutaminase gene. Biochem. J. 370, 771–784
25. Robinson, M. M., Mcbryant, S. J., Tsukamoto, T., Rojas, C., Ferraris, D. V., Hamilton, S. K.,
Hansen, J. C., and Curthoys, N. P. (2007) Novel mechanism of inhibition of rat kidney-type
by guest on June 8, 2020http://w
ww
.jbc.org/D
ownloaded from
CPT1 compensates GLS inhibition in TN breast cancer
13
glutaminase by bis-2-(5-phenylacetamido-1,2,4-thiadiazol-2-yl)ethyl sulfide (BPTES).
Biochem. J. 406, 407–414
26. Huang, Q., Stalnecker, C., Zhang, C., McDermott, L. A., Iyer, P., O’Neill, J., Reimer, S.,
Cerione, R. A., and Katt, W. P. (2018) Characterization of the interactions of potent allosteric
inhibitors with glutaminase C, a key enzyme in cancer cell glutamine metabolism. J. Biol. Chem.
293, 3535–3545
27. Song, M., Kim, S.-H., Im, C. Y., and Hwang, H.-J. (2018) Recent development of small molecule
glutaminase inhibitors. Curr. Top. Med. Chem. 18, 432–443
28. Gross, M. I., Demo, S. D., Dennison, J. B., Chen, L., Chernov-Rogan, T., Goyal, B., Janes, J. R.,
Laidig, G. J., Lewis, E. R., Li, J., MacKinnon, A. L., Parlati, F., Rodriguez, M. L. M., Shwonek,
P. J., Sjogren, E. B., Stanton, T. F., Wang, T., Yang, J., Zhao, F., and Bennett, M. K. (2014)
Antitumor activity of the glutaminase inhibitor CB-839 in triple-negative breast cancer. Mol.
Cancer Ther. 13, 890–901
29. Garber, K. (2016) Cancer anabolic metabolism inhibitors move into clinic. Nat. Biotechnol. 34,
794–795
30. Liu, K., and Czaja, M. J. (2013) Regulation of lipid stores and metabolism by lipophagy. Cell
Death Differ. 20, 3–11
31. Park, S. H., Gammon, S. R., Knippers, J. D., Paulsen, S. R., Rubink, D. S., and Winder, W. W.
(2002) Phosphorylation-activity relationships of AMPK and acetyl-CoA carboxylase in muscle.
J. Appl. Physiol. 92, 2475–2482
32. Camarda, R., Zhou, A. Y., Kohnz, R. A., Balakrishnan, S., Mahieu, C., Anderton, B., Eyob, H.,
Kajimura, S., Tward, A., Krings, G., Nomura, D. K., and Goga, A. (2016) Inhibition of fatty acid
oxidation as a therapy for MYC-overexpressing triple-negative breast cancer. Nat. Med. 22, 427–
432
33. Park, J. H., Vithayathil, S., Kumar, S., Sung, P.-L., Dobrolecki, L. E., Putluri, V., Bhat, V. B.,
Bhowmik, S. K., Gupta, V., Arora, K., Wu, D., Tsouko, E., Zhang, Y., Maity, S., Donti, T. R.,
Graham, B. H., Frigo, D. E., Coarfa, C., Yotnda, P., Putluri, N., Sreekumar, A., Lewis, M. T.,
Creighton, C. J., Wong, L.-J. C., and Kaipparettu, B. A. (2016) Fatty acid oxidation-driven Src
links mitochondrial energy reprogramming and oncogenic properties in triple-negative breast
cancer. Cell Rep. 14, 2154–2165
34. Blomme, A., Costanza, B., de Tullio, P., Thiry, M., Van Simaeys, G., Boutry, S., Doumont, G.,
Di Valentin, E., Hirano, T., Yokobori, T., Gofflot, S., Peulen, O., Bellahcène, A., Sherer, F., Le
Goff, C., Cavalier, E., Mouithys-Mickalad, A., Jouret, F., Cusumano, P. G., Lifrange, E., Muller,
R. N., Goldman, S., Delvenne, P., De Pauw, E., Nishiyama, M., Castronovo, V., and Turtoi, A.
(2017) Myoferlin regulates cellular lipid metabolism and promotes metastases in triple-negative
breast cancer. Oncogene. 36, 2116–2130
35. Wright, H. J., Hou, J., Xu, B., Cortez, M., Potma, E. O., Tromberg, B. J., and Razorenova, O. V.
(2017) CDCP1 drives triple-negative breast cancer metastasis through reduction of lipid-droplet
abundance and stimulation of fatty acid oxidation. Proc. Natl. Acad. Sci. 114, E6556–E6565
36. van der Bliek, A. M., Shen, Q., and Kawajiri, S. (2013) Mechanisms of Mitochondrial Fission
and Fusion. Cold Spring Harb. Perspect. Biol. 5, a011072–a011072
37. Chris Bakal and Dr. Julia Sero (2012) High content image analysis phenotypic characterization
of mitochondria in breast cancer cells using morphology and texture properties
38. Quintero, M., Adamoski, D., dos Reis, L. M., Ascenção, C. F. R., de Oliveira, K. R. S.,
Gonçalves, K. de A., Dias, M. M., Carazzolle, M. F., and Dias, S. M. G. (2017) Guanylate-
binding protein-1 is a potential new therapeutic target for triple-negative breast cancer. BMC
Cancer. 17, 1–16
39. Rambold, A. S., Cohen, S., and Lippincott-Schwartz, J. (2015) Fatty acid trafficking in starved
cells: Regulation by lipid droplet lipolysis, autophagy, and mitochondrial fusion dynamics. Dev.
Cell. 32, 678–692
40. Lopaschuk, G., McNeil, G., and McVeigh, J. (1989) Glucose oxidation is stimulated in
reperfused ischemic hearts with the carnitine palmitoyltransferase 1 inhibitor, Etomoxir. Mol.
Cell. Biochem. 88, 175–179
41. Rodrigues, M. F., Obre, E., de Melo, F. H. M., Santos, G. C., Galina, A., Jasiulionis, M. G.,
Rossignol, R., Rumjanek, F. D., and Amoedo, N. D. (2016) Enhanced OXPHOS, glutaminolysis
by guest on June 8, 2020http://w
ww
.jbc.org/D
ownloaded from

CPT1 compensates GLS inhibition in TN breast cancer
14
and -oxidation constitute the metastatic phenotype of melanoma cells. Biochem. J. 473, 703–715
42. Merrill, G. F., Kurth, E. J., Hardie, D. G., and Winder, W. W. (1997) AICA riboside increases
AMP-activated protein kinase, fatty acid oxidation, and glucose uptake in rat muscle. Am. J.
Physiol. 273, E1107-12
43. Momcilovic, M., Bailey, S. T., Lee, J. T., Fishbein, M. C., Magyar, C., Braas, D., Graeber, T.,
Jackson, N. J., Czernin, J., Emberley, E., Gross, M., Janes, J., Mackinnon, A., Pan, A.,
Rodriguez, M., Works, M., Zhang, W., Parlati, F., Demo, S., Garon, E., Krysan, K., Walser, T.
C., Dubinett, S. M., Sadeghi, S., Christofk, H. R., and Shackelford, D. B. (2017) Targeted
Inhibition of EGFR and Glutaminase Induces Metabolic Crisis in EGFR Mutant Lung Cancer.
Cell Rep. 18, 601–610
44. Zhou, G., Myers, R., Li, Y., Chen, Y., Shen, X., Fenyk-Melody, J., Wu, M., Ventre, J., Doebber,
T., Fujii, N., Musi, N., Hirshman, M. F., Goodyear, L. J., and Moller, D. E. (2001) Role of AMP-
activated protein kinase in mechanism of metformin action. J. Clin. Invest. 108, 1167–1174
45. Lampa, M., Arlt, H., He, T., Ospina, B., Reeves, J., Zhang, B., Murtie, J., Deng, G., Barberis,
C., Hoffmann, D., Cheng, H., Pollard, J., Winter, C., Richon, V., Garcia-Escheverria, C., Adrian,
F., Wiederschain, D., and Srinivasan, L. (2017) Glutaminase is essential for the growth of triple-
negative breast cancer cells with a deregulated glutamine metabolism pathway and its
suppression synergizes with mTOR inhibition. PLoS One. 12, e0185092
46. Dornier, E., Rabas, N., Mitchell, L., Novo, D., Dhayade, S., Marco, S., Mackay, G., Sumpton,
D., Pallares, M., Nixon, C., Blyth, K., Macpherson, I. R., Rainero, E., and Norman, J. C. (2017)
Glutaminolysis drives membrane trafficking to promote invasiveness of breast cancer cells. Nat.
Commun. 8, 2255
47. Peyton, K. J., Liu, X., Yu, Y., Yates, B., Behnammanesh, G., and Durante, W. (2018)
Glutaminase-1 stimulates the proliferation, migration, and survival of human endothelial cells.
Biochem. Pharmacol. 156, 204–214
48. Ascenção, C. F. R., Nagampalli, R. S. K., Islam, Z., Pinheiro, M. P., Menezes dos Reis, L.,
Pauletti, B. A., de Guzzi Cassago, C. A., Granato, D. C., Paes Leme, A. F., and Dias, S. M. G.
(2018) N-terminal phosphorylation of glutaminase C decreases its enzymatic activity and cancer
cell migration. Biochimie. 154, 69–76
49. Chakrabarti, G., Moore, Z. R., Luo, X., Ilcheva, M., Ali, A., Padanad, M., Zhou, Y., Xie, Y.,
Burma, S., Scaglioni, P. P., Cantley, L. C., DeBerardinis, R. J., Kimmelman, A. C., Lyssiotis, C.
A., and Boothman, D. A. (2015) Targeting glutamine metabolism sensitizes pancreatic cancer to
PARP-driven metabolic catastrophe induced by ß-lapachone. Cancer Metab. 3, 12
50. Jacque, N., Ronchetti, A. M., Larrue, C., Meunier, G., Birsen, R., Willems, L., Saland, E.,
Decroocq, J., Maciel, T. T., Lambert, M., Poulain, L., Hospital, M. A., Sujobert, P., Joseph, L.,
Chapuis, N., Lacombe, C., Moura, I. C., Demo, S., Sarry, J. E., Recher, C., Mayeux, P.,
Tamburini, J., and Bouscary, D. (2015) Targeting glutaminolysis has antileukemic activity in
acute myeloid leukemia and synergizes with BCL-2 inhibition. Blood. 126, 1346–1356
51. Kalinsky, K., Harding, J., DeMichele, A., Infante, J., Gogineni, K., Owonikoko, T., Isakoff, S.,
Iliopoulos, O., Patel, M., Munster, P., Telli, M., Jenkins, Y., Fiji, G., Whiting, S., and Meric-
Bernstam, F. (2018) Abstract PD3-13: Phase 1 study of CB-839, a first-in-class oral inhibitor of
glutaminase, in combination with paclitaxel in patients with advanced triple negative breast
cancer. Cancer Res. 78, PD3-13-PD3-13
52. Cluntun, A. A., Lukey, M. J., Cerione, R. A., and Locasale, J. W. (2017) Glutamine Metabolism
in Cancer: Understanding the Heterogeneity. Trends in Cancer. 3, 169–180
53. Hermanova, I., Arruabarrena-Aristorena, A., Valis, K., Nuskova, H., Alberich-Jorda, M., Fiser,
K., Fernandez-Ruiz, S., Kavan, D., Pecinova, A., Niso-Santano, M., Zaliova, M., Novak, P.,
Houstek, J., Mracek, T., Kroemer, G., Carracedo, A., Trka, J., and Starkova, J. (2016)
Pharmacological inhibition of fatty-acid oxidation synergistically enhances the effect of l-
asparaginase in childhood ALL cells. Leukemia. 30, 209–18
54. Zaugg, K., Yao, Y., Reilly, P. T., Kannan, K., Kiarash, R., Mason, J. Huang, P., Sawyer, S. K.,
Fuerth, B., Faubert, B., Elia, A., Luo, X., Nadeem, V., Bungard, D., Yalavarthi, S., Growney, J.
D., Wakeham, A., Moolani, Y., Silvester, J., Ten, A. Y., Bakke, M. O. (2011) Carnitine
palmitoyltransferase 1C promotes cell survival and tumor growth under conditions of metabolic
stress. Genes Dev. 25, 1041–1051
by guest on June 8, 2020http://w
ww
.jbc.org/D
ownloaded from
CPT1 compensates GLS inhibition in TN breast cancer
15
55. Long, B., Muhamad, R., Yan, G., Yu, J., Fan, Q., Wang, Z., Li, X., Purnomoadi, A., Achmadi,
J., and Yan, X. (2016) Quantitative proteomics analysis reveals glutamine deprivation activates
fatty acid β-oxidation pathway in HepG2 cells. Amino Acids. 48, 1297–1307
56. Halama, A., Kulinski, M., Dib, S. S., Zaghlool, S. B., Siveen, K. S., Iskandarani, A., Zierer, J.,
Prabhu, K. S., Satheesh, N. J., Bhagwat, A. M., Uddin, S., Kastenmüller, G., Elemento, O., Gross,
S. S., and Suhre, K. (2018) Accelerated lipid catabolism and autophagy are cancer survival
mechanisms under inhibited glutaminolysis. Cancer Lett. 430, 133–147
57. Yao, C.-H., Liu, G.-Y., Wang, R., Moon, S. H., Gross, R. W., and Patti, G. J. (2018) Identifying
off-target effects of etomoxir reveals that carnitine palmitoyltransferase I is essential for cancer
cell proliferation independent of β-oxidation. PLoS Biol. 16, e2003782
58. STEWART, S. A. (2003) Lentivirus-delivered stable gene silencing by RNAi in primary cells.
RNA. 9, 493–501
59. Bernt, E., and Bergmeyer, H. U. (1974) l-Glutamate UV-Assay with Gutamate Dehydrogenase
and NAD. in Methods of Enzymatic Analysis, pp. 1704–1715, Elsevier, 10.1016/B978-0-12-
091304-6.50017-3
60. Cassago, A., Ferreira, A. P. S., Ferreira, I. M., Fornezari, C., Gomes, E. R. M., Greene, K. S.,
Pereira, H. M., Garratt, R. C., Dias, S. M. G., and Ambrosio, A. L. B. (2012) Mitochondrial
localization and structure-based phosphate activation mechanism of Glutaminase C with
implications for cancer metabolism. Proc. Natl. Acad. Sci. 109, 1092–1097
61. Kenny, J., Bao, Y., Hamm, B., Taylor, L., Toth, A., Wagers, B., and Curthoys, N. P. (2003)
Bacterial expression, purification, and characterization of rat kidney-type mitochondrial
glutaminase. Protein Expr. Purif. 31, 140–148
62. Bradford, M. M. (1976) A rapid and sensitive method for the quantitation of microgram
quantities of protein utilizing the principle of protein-dye binding. Anal. Biochem. 72, 248–254
63. Daemen, A., Griffith, O. L., Heiser, L. M., Wang, N. J., Enache, O. M., Sanborn, Z., Pepin, F.,
Durinck, S., Korkola, J. E., Griffith, M., Hur, J. S., Huh, N., Chung, J., Cope, L., Fackler, M. J.,
Umbricht, C., Sukumar, S., Seth, P., Sukhatme, V. P., Jakkula, L. R., Lu, Y., Mills, G. B., Cho,
R. J., Collisson, E. a, van’t Veer, L. J., Spellman, P. T., and Gray, J. W. (2013) Modeling
precision treatment of breast cancer. Genome Biol. 14, R110
64. Varley, K. E., Gertz, J., Roberts, B. S., Davis, N. S., Bowling, K. M., Kirby, M. K., Nesmith, A.
S., Oliver, P. G., Grizzle, W. E., Forero, A., Buchsbaum, D. J., LoBuglio, A. F., and Myers, R.
M. (2014) Recurrent read-through fusion transcripts in breast cancer. Breast Cancer Res. Treat.
146, 287–297
65. Love, M. I., Huber, W., and Anders, S. (2014) Moderated estimation of fold change and
dispersion for RNA-seq data with DESeq2. Genome Biol. 15, 550
66. Ashburner, M., Ball, C. A., Blake, J. A., Botstein, D., Butler, H., Cherry, J. M., Davis, A. P.,
Dolinski, K., Dwight, S. S., Eppig, J. T., Harris, M. A., Hill, D. P., Issel-Tarver, L., Kasarskis,
A., Lewis, S., Matese, J. C., Richardson, J. E., Ringwald, M., Rubin, G. M., and Sherlock, G.
(2000) Gene Ontology: tool for the unification of biology. Nat. Genet. 25, 25–29
67. Young, M. D., Wakefield, M. J., Smyth, G. K., and Oshlack, A. (2010) Gene ontology analysis
for RNA-seq: accounting for selection bias. Genome Biol. 11, R14
68. Li, J., Lu, Y., Akbani, R., Ju, Z., Roebuck, P. L., Liu, W., Yang, J.-Y., Broom, B. M., Verhaak,
R. G. W., Kane, D. W., Wakefield, C., Weinstein, J. N., Mills, G. B., and Liang, H. (2013) TCPA:
a resource for cancer functional proteomics data. Nat. Methods. 10, 1046–7
69. Karlic, H., Lohninger, S., Koeck, T., and Lohninger, A. (2002) Dietary l-carnitine stimulates
carnitine acyltransferases in the liver of aged rats. J. Histochem. Cytochem. 50, 205–212
70. Huynh, F. K., Green, M. F., Koves, T. R., and Hirschey, M. D. (2014) Measurement of Fatty
Acid Oxidation Rates in Animal Tissues and Cell Lines. in Methods in Enzymology, 1st Ed., pp.
391–405, Elsevier Inc., 542, 391–405
71. Adler, J., and Parmryd, I. (2010) Quantifying colocalization by correlation: The Pearson
correlation coefficient is superior to the Mander’s overlap coefficient. Cytom. Part A. 77A, 733–
742
72. Silva Nunes, J. P., and Martins Dias, A. A. (2017) ImageJ macros for the user-friendly analysis
of soft-agar and wound-healing assays. Biotechniques. 10.2144/000114535
73. Angermuller, S., and Fahimi, H. D. (1982) Imidazole-buffered osmium tetroxide: an excellent
by guest on June 8, 2020http://w
ww
.jbc.org/D
ownloaded from

CPT1 compensates GLS inhibition in TN breast cancer
16
stain for visualization of lipids in transmission electron microscopy. Histochem. J. 14, 823–835
Footnotes
Abbreviations: TNBC, Triple-negative breast cancer; PR, progesterone receptor; ER, estrogen receptor;
GLS glutaminase; CPT2, carnitine palmitoyltransferase 2; CPT1, carnitine palmitoyltransferase 1; FA,
fatty acid; AMPK, AMP-activated protein kinase; ACC, acetyl-CoA carboxylase; FAO, fatty acid
oxidation; CRAT, carnitine O-acetyltransferase, BPTES, bis-2-(5-phenylacetamido-1,3,4-thiadiazol-2-
yl) ethyl sulfide; DE, differentially expressed; FC, fold change; PCA, Principal Component Analysis;
GO, Gene Ontology; OCR, oxygen consumption rate.
by guest on June 8, 2020http://w
ww
.jbc.org/D
ownloaded from

CPT1 compensates GLS inhibition in TN breast cancer
17
Figure 1
Fig. 1. TNBC cell lines respond differently to glutaminase inhibition. A, Growth response of 12
TNBC cell lines treated with 1 µM CB-839 for 4 days. The cell lines were classified as resistant when
treatment affected growth in less than 50% (compared to the DMSO control) and sensitive when
treatment affected growth in more than 50% (compared to the DMSO control) or led to cell death (when
the number of cells at the endpoint was smaller than the number of seeded cells). B, Correlation between
the growth response after 4 days of CB-839 treatment or incubation in the glutamine-free medium of
the TNBC cells. Graphics in A and B represent the mean ± standard deviation (SD) of n = 4.
by guest on June 8, 2020http://w
ww
.jbc.org/D
ownloaded from

CPT1 compensates GLS inhibition in TN breast cancer
18
Figure 2
Fig. 2. Resistant cell lines are less glutaminolytic and use an alternative energy source. Glutamate
secretion (A) and glutamine consumption (B) of sensitive and resistant cell lines. C, Western blotting
displaying GLS (GAC and KGA bands indicated) protein levels. Densitometry of GAC to vinculin
bands intensity ratio. D, GLS activity of the whole cell lysate of sensitive and resistant cell lines (the
HCC1806 cell line was not evaluated). The SER Valley Texture Classification (1 pixel) from Saddles,
Edges, Ridges (SER) Features of MitoTracker Deep Red labeled mitochondria of sensitive (E) and
resistant cell lines (F) treated with CB-839 (or DMSO control). Representative images of the sensitive
HCC1806 (E) or resistant MDA-MB-468 cell lines (F); scale bar represents 50 µm. Hoescht staining
was performed for nuclei detection (in blue). G, relative ATP levels in CB-839-treated cells represented
as a percentage of vehicle treatment (DMSO). In the boxplots in A-B and D-G, each point represents the
mean of n = 4 of each cell line. The Student’s t-test was applied; p < 0.05 (*), p<0.01 (**), n.s., non-
significant.
by guest on June 8, 2020http://w
ww
.jbc.org/D
ownloaded from

CPT1 compensates GLS inhibition in TN breast cancer
19
Figure 3
Fig. 3. Resistant x sensitive TNBC cell lines present gene expression alterations in lipid metabolism
pathways. A, Volcano plot showing DE (green circles, downregulated, Log2FC ≤ −1; red circles,
upregulated, log2FC ≥ +1; FDR ≤ 0.05) genes between resistant and sensitive cell lines. Unsupervised
principal component analysis (B) and heatmap clustering (C) performed with the DE genes revealed a
clear separation between resistant and sensitive cell lines. D, Biological processes related to lipid
metabolism obtained from the pathway enrichment analysis (p ≤ 0.05). Boxplot presenting differences
in the expression levels of GLS (E), CPT1A, CPT1B, CRAT and CPT2 (F) between sensitive and
resistant cell lines. Twenty samples were used in this analysis with some of the cell lines presented as
replicates (obtained from our lab or from data banks, (38); we evaluated the resistant MDA-MB-453 (2
samples), HCC1937 (1 sample), MDA-MB-468 (2 samples), HCC70 (1 sample), MDA-MB-157 (2
samples), and BT549 (2 samples) cell lines and the sensitive HCC1143 (2 samples), HCC38 (2 samples),
MDA-MB-436 (1 sample), MDA-MB-231 (3 samples), Hs578 (1 sample) and HCC1806 (1 sample) cell
lines. The Student’s t-test was applied; p < 0.05 (*), n.s., non-significant.
by guest on June 8, 2020http://w
ww
.jbc.org/D
ownloaded from

CPT1 compensates GLS inhibition in TN breast cancer
20
Figure 4
Fig 4. Low x high GLS breast tumors present altered expression of lipid metabolism-related genes.
Unsupervised principal component analysis (A) and heatmap clustering (B) performed with the 337
genes related to “Fatty acid metabolism process” (GO:0006631) show a separation between breast
tumors classified as low or high GLS levels. (C) Boxplot presenting differences in the expression levels
of CPT1A/B, CRAT and CPT2 between low and high GLS levels in normal tissue and in breast tumors.
Correlation between CPT2 and GLS expression levels in cell lines (D) and breast tumors (E). In C, an
ANOVA and Tukey’s multiple comparisons were applied. In D, twenty samples were used in this
analysis with some of the cell lines presented as replicates (obtained from our lab or data banks, (38);
we evaluated the resistant MDA-MB-453 (2 samples), HCC1937 (1 sample), MDA-MB-468 (2
samples), HCC70 (1 sample), MDA-MB-157 (2 samples), and BT549 (2 samples) cell lines and the
sensitive HCC1143 (2 samples), HCC38 (2 samples), MDA-MB-436 (1 sample), MDA-MB-231 (3
samples), Hs578 (1 sample) and HCC1806 (1 sample) cell lines. In E, 1097 samples were used, light
gray are low GLS and black are high GLS samples.
by guest on June 8, 2020http://w
ww
.jbc.org/D
ownloaded from
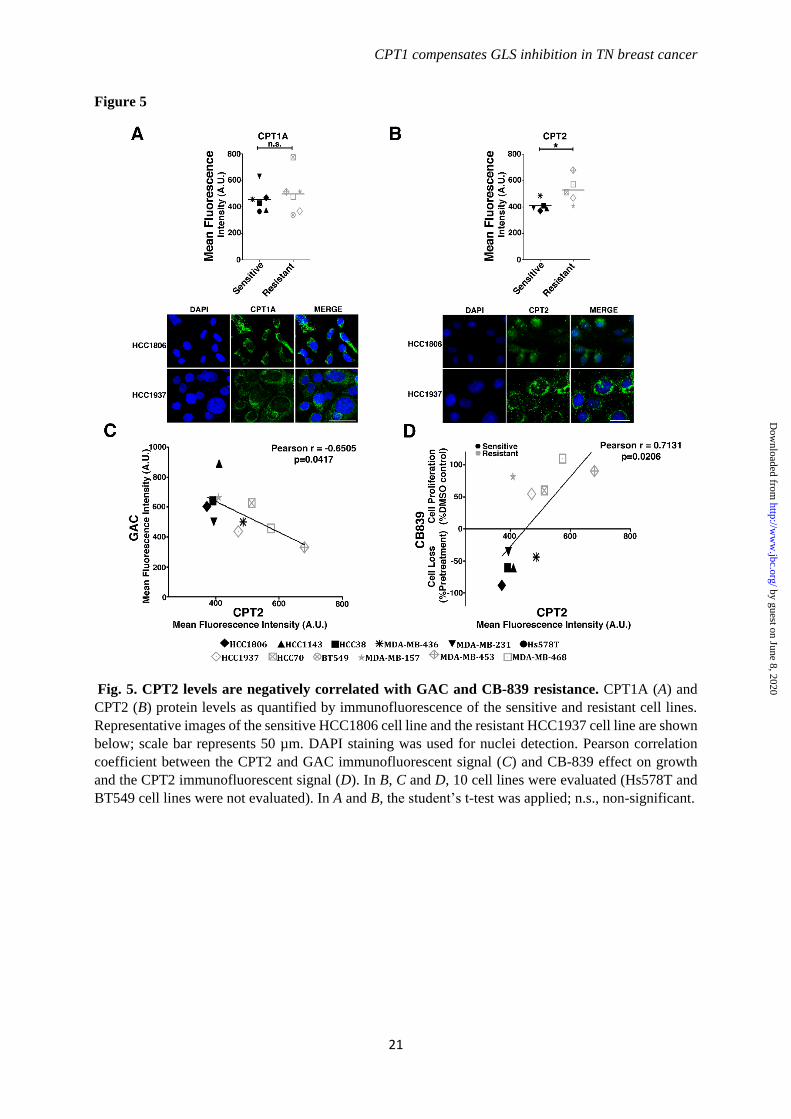
CPT1 compensates GLS inhibition in TN breast cancer
21
Figure 5
Fig. 5. CPT2 levels are negatively correlated with GAC and CB-839 resistance. CPT1A (A) and
CPT2 (B) protein levels as quantified by immunofluorescence of the sensitive and resistant cell lines.
Representative images of the sensitive HCC1806 cell line and the resistant HCC1937 cell line are shown
below; scale bar represents 50 µm. DAPI staining was used for nuclei detection. Pearson correlation
coefficient between the CPT2 and GAC immunofluorescent signal (C) and CB-839 effect on growth
and the CPT2 immunofluorescent signal (D). In B, C and D, 10 cell lines were evaluated (Hs578T and
BT549 cell lines were not evaluated). In A and B, the student’s t-test was applied; n.s., non-significant.
by guest on June 8, 2020http://w
ww
.jbc.org/D
ownloaded from

CPT1 compensates GLS inhibition in TN breast cancer
22
Figure 6
Fig 6. Resistant TNBC cell lines have increased mitochondrial beta-oxidation, which is further
increased by GLS attenuation. A, Pearson correlation coefficient between Bodipy 558/568 C12
(RedC12) and MitoTracker DeepRed in the sensitive HCC1806 cell line and resistant HCC1937 cell
line. Representative images of the cell lines are shown on the right. Hoechst staining was performed for
nuclei detection. Higher correlation implies increased co-localization between the FA probe and
mitochondria; scale bar represents 50 µm. B, Bodipy accumulation caused by etomoxir treatment in the
sensitive and resistant cells lines. C, Four (BT549, MDA-MB-157, MDA-MB-453 and MDA-MB-468)
of the 6 resistant cell lines and only two (HCC38 and MDA-MB-436) of the 6 sensitive cell lines
responded to GLS knockdown by decreasing the RedC12 fluorescent signal compared to the shGFP
control, implying increased beta-oxidation in these cells when GLS is attenuated. D, beta-oxidation was
directly measured by quantifying 14CO2 released from uniformly labelled (14C)-palmitic acid. The
resistant HCC1937 cell line released more 14CO2 than the sensitive cell line MDA-MB-231, which was
further increased by GLS knockdown only in the resistant cell line. E, CPT1 activity was higher in the
resistant HCC1937 cell line compared to the sensitive cell line MDA-MB-231, which was further
increased by GLS knockdown only in the resistant cell line. F, Western blotting on the right shows the
GLS and CPT1A knockdown efficiency. On the left, the basal OCR of the resistant BT549 cell line after
individual or combined knockdown of GLS and CPT1A. In B and C, each point represents the mean of
n = 4 of each cell line. In D-F, each bar represents the mean ± SD of n = 3. The Student’s t-test was
applied; p < 0.05 (*), p < 0.01 (**), p < 0.001 (***), n.s., non-significant.
by guest on June 8, 2020http://w
ww
.jbc.org/D
ownloaded from

CPT1 compensates GLS inhibition in TN breast cancer
23
Figure 7
Fig. 7. CB-839 treatment and CPT1 inhibition have a combined effect on the proliferation and
migration of resistant cell lines. A, Growth response of sensitive and resistant cell lines treated with
etomoxir for 4 days. Both sensitive HCC1806 (B) and resistant HCC1937 (C) cell lines responded to
etomoxir treatment by decreasing cell growth, which was more pronounced in the resistant cell line.
Combined CB-839 + etomoxir treatment led to cell death in the resistant cell line, and, curiously,
attenuated the effect of CB-839 in the sensitive cell line. Combined CB-839 + etomoxir treatment did
not further increase the effect of CB-839 treatment in the sensitive cell line HCC1806 (D) but had an
additional effect on decreasing cell migration in the resistant cell line HCC1937 (E). In A, each point
represents the mean of n = 4 of each cell line. Graphics in D-E, each bar represents the mean ± SD of n
= 4. The Student’s t-test was applied; p < 0.05 (*), p < 0.001 (***), n.s., non-significant. Whenever not
indicated, the comparison was made against DMSO control.
by guest on June 8, 2020http://w
ww
.jbc.org/D
ownloaded from

CPT1 compensates GLS inhibition in TN breast cancer
24
Figure 8
Fig. 8. GLS inhibition increases AMPK pThr172 and ACC pSer79 phosphorylation levels, with a
direct impact on beta-oxidation. A, Relative ATP levels in DMSO and CB-839-treated BT549 resistant
cell lines showing a 27% decrease with treatment. B, CB-839 treatment increases AMPK pThr172 and
ACC pSer79 phosphorylation levels in BT549 related to total vinculin and ACC levels, respectively. C,
Western blotting showing the AMPKα knockdown in BT549. In BT549, CB-839 treatment increases 14CO2 released from (14C)-palmitic acid (D) and CPT1 activity (E) (compared to DMSO) in shGFP
control cells but not in shAMPKα cells. F, Proliferation of BT549 after CB-839 and compound C (an
AMPK inhibitor) individual or combined treatments showing that the resistant cell line relies on AMPK
signaling for growth after glutaminase inhibition. G, breast tumor tissues with low GLS expression levels
have increased AMPK pThr172 and ACC pSer79 phosphorylation levels compared to tissues with high
GLS levels. The graphics in A, D-F represent the mean ± SD of n = 3. The graphics in B represent the
mean ± SD of n = 4 (pAMPK) and n = 2 (pACC) independent western blots. Box-plot in G represents
111 tumors with high and 111 with low GLS gene expression obtained from Reverse Phase Protein
Array (RPPA); these samples overlap with the breast tumor samples obtained from the TCGA
previously presented in the transcriptomic analysis. The Student’s t-test was applied; p < 0.05 (*), p<
0.001 (**) p < 0.001 (***).
by guest on June 8, 2020http://w
ww
.jbc.org/D
ownloaded from

Martha Gomes DiasConsonni, Pedro Manoel Mendes de Moraes-Vieira, Ariel Mariano Silber and Sandra
Corrêa-da-Silva, Fábio Malta de Sá Patroni, Marília Meira Dias, Sílvio RobertoCarolline Fernanda Rodrigues Ascenção, Krishina Ratna Sousa de Oliveira, Felipe Larissa Menezes dos Reis, Douglas Adamoski, Rodolpho Ornitz Oliveira Souza,
cancer cellsresistant triple-negative breast−growth and migration of glutaminase inhibition
Dual inhibition of glutaminase and carnitine palmitoyltransferase decreases
published online April 30, 2019J. Biol. Chem.
10.1074/jbc.RA119.008180Access the most updated version of this article at doi:
Alerts:
When a correction for this article is posted•
When this article is cited•
to choose from all of JBC's e-mail alertsClick here
by guest on June 8, 2020http://w
ww
.jbc.org/D
ownloaded from